Detection of the TiO2 Concentration in the Protective Coatings for the Cultural Heritage by Means of Hyperspectral Data

 ,
,  , and
, and
Abstract
: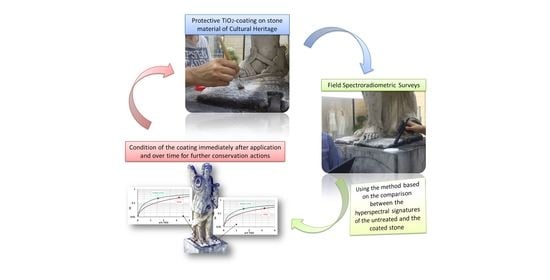
1. Introduction
2. Materials and Methods
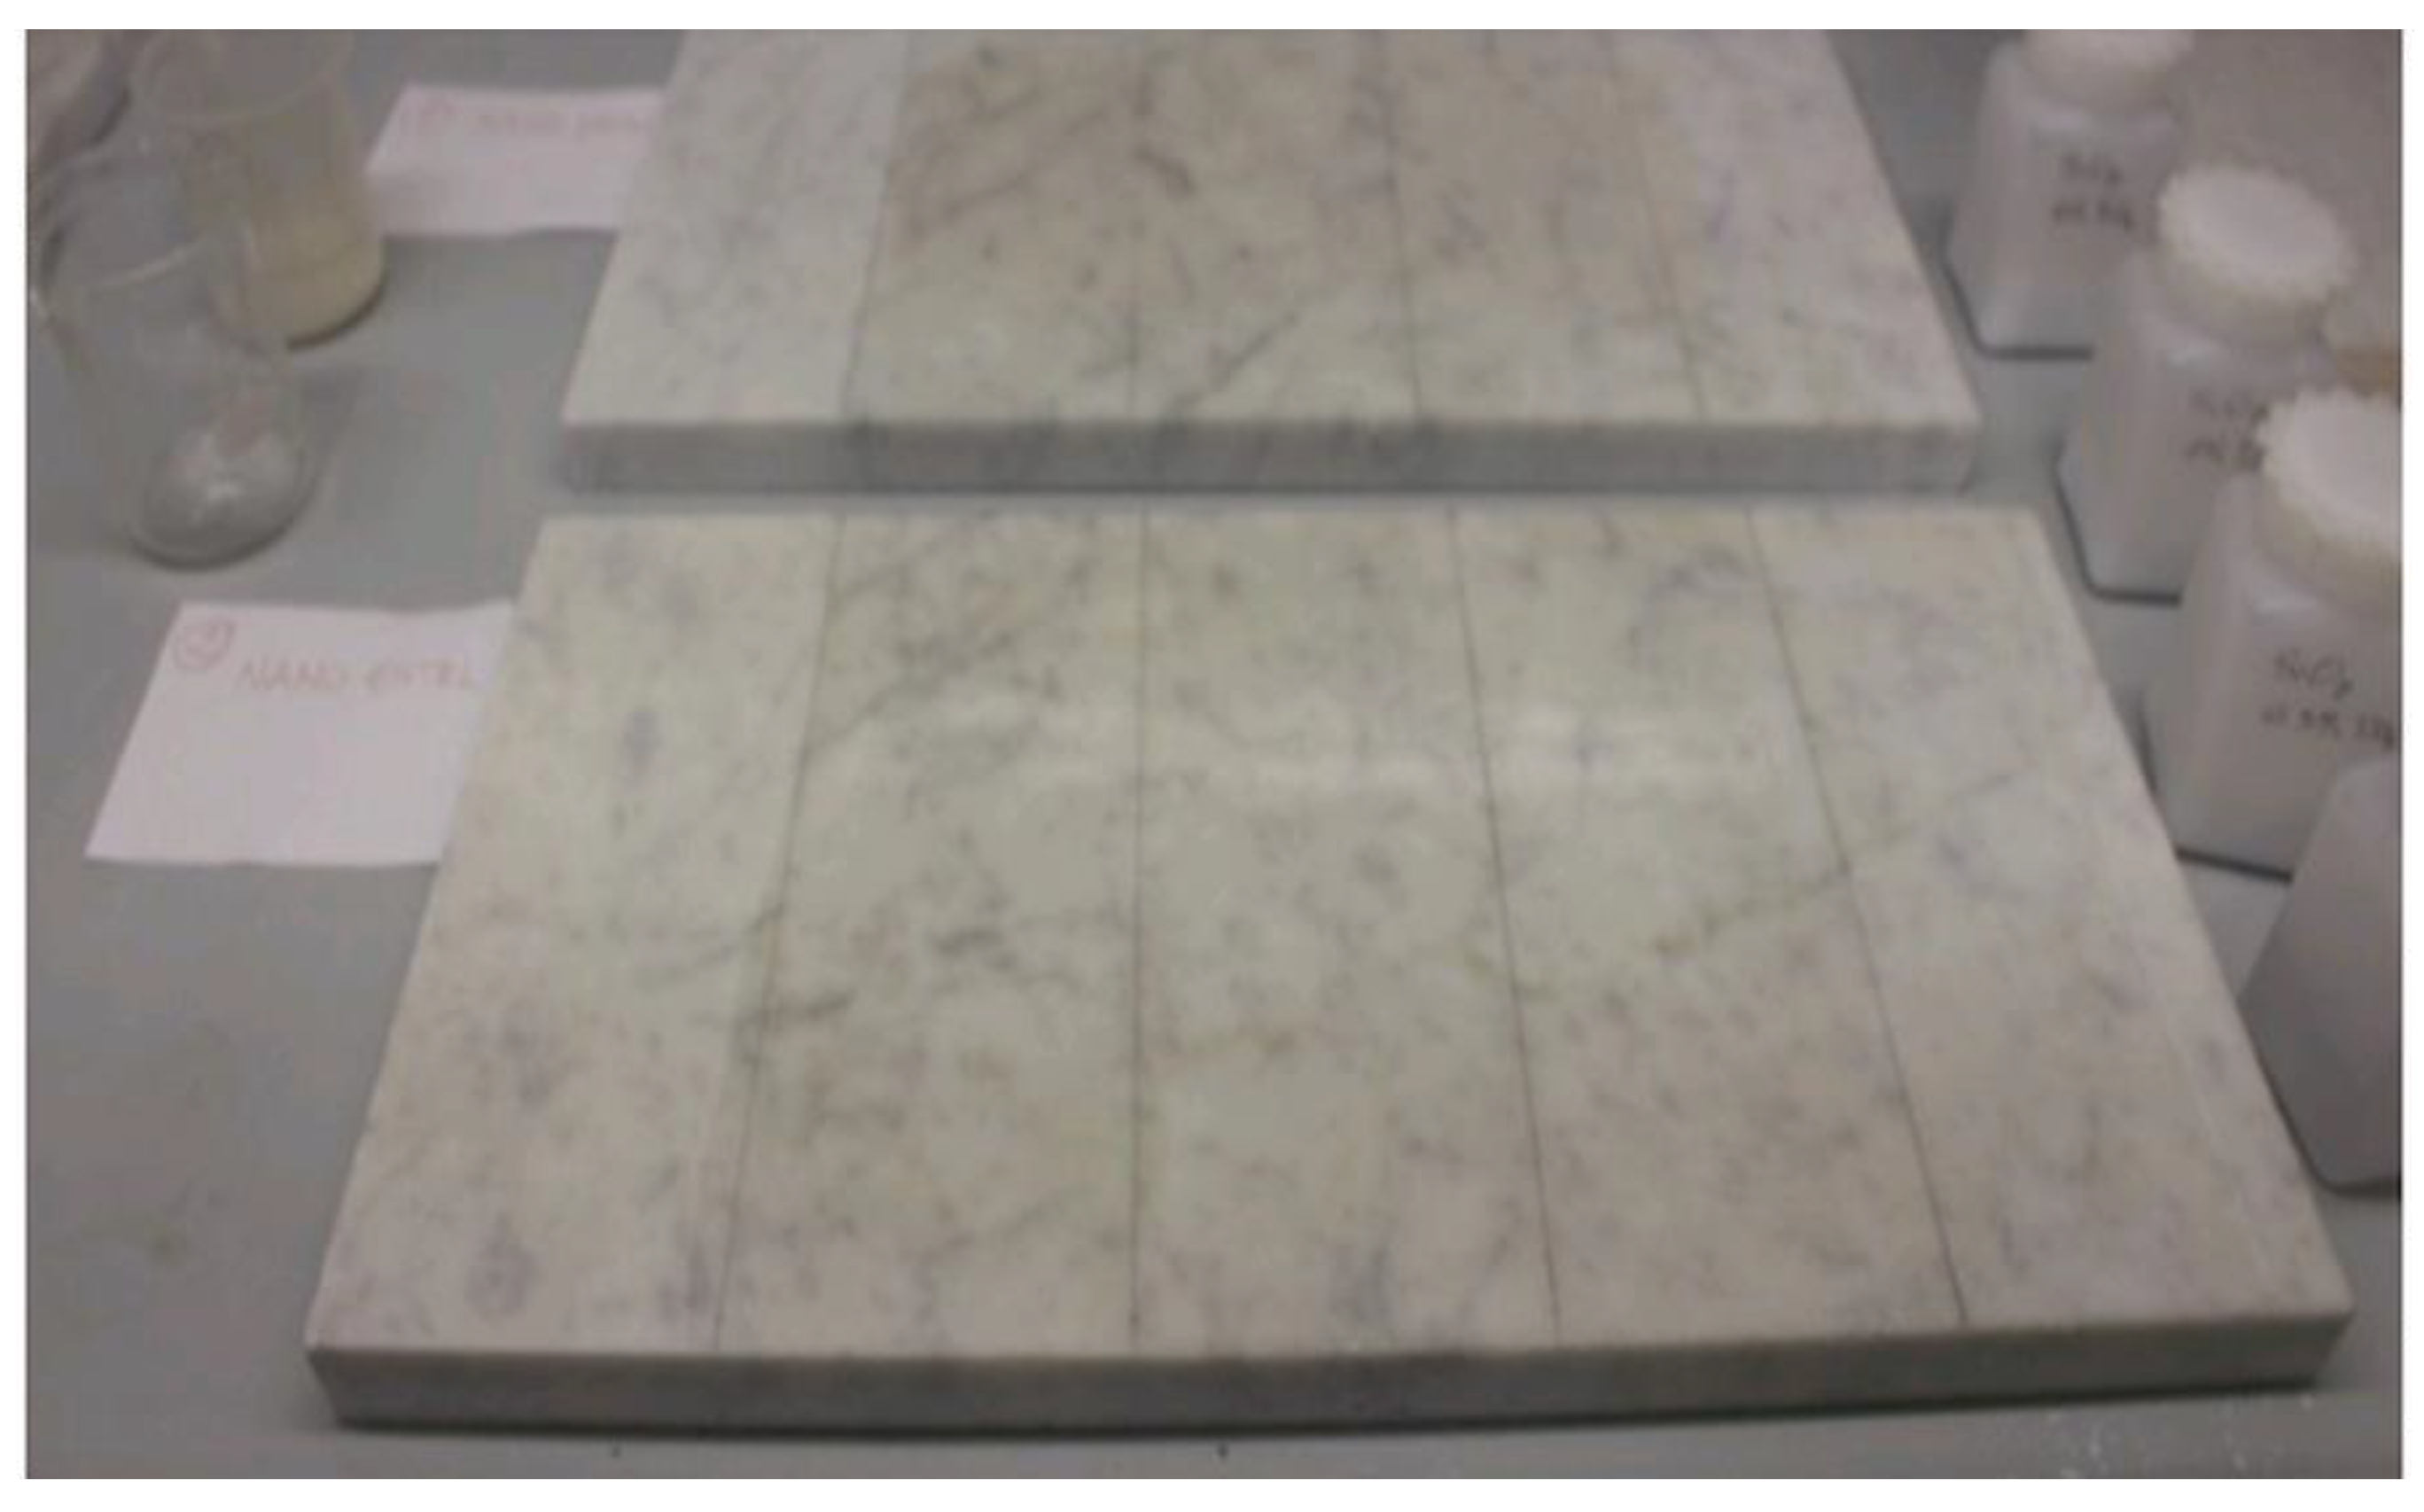
2.1. Sample Preparation in Laboratory
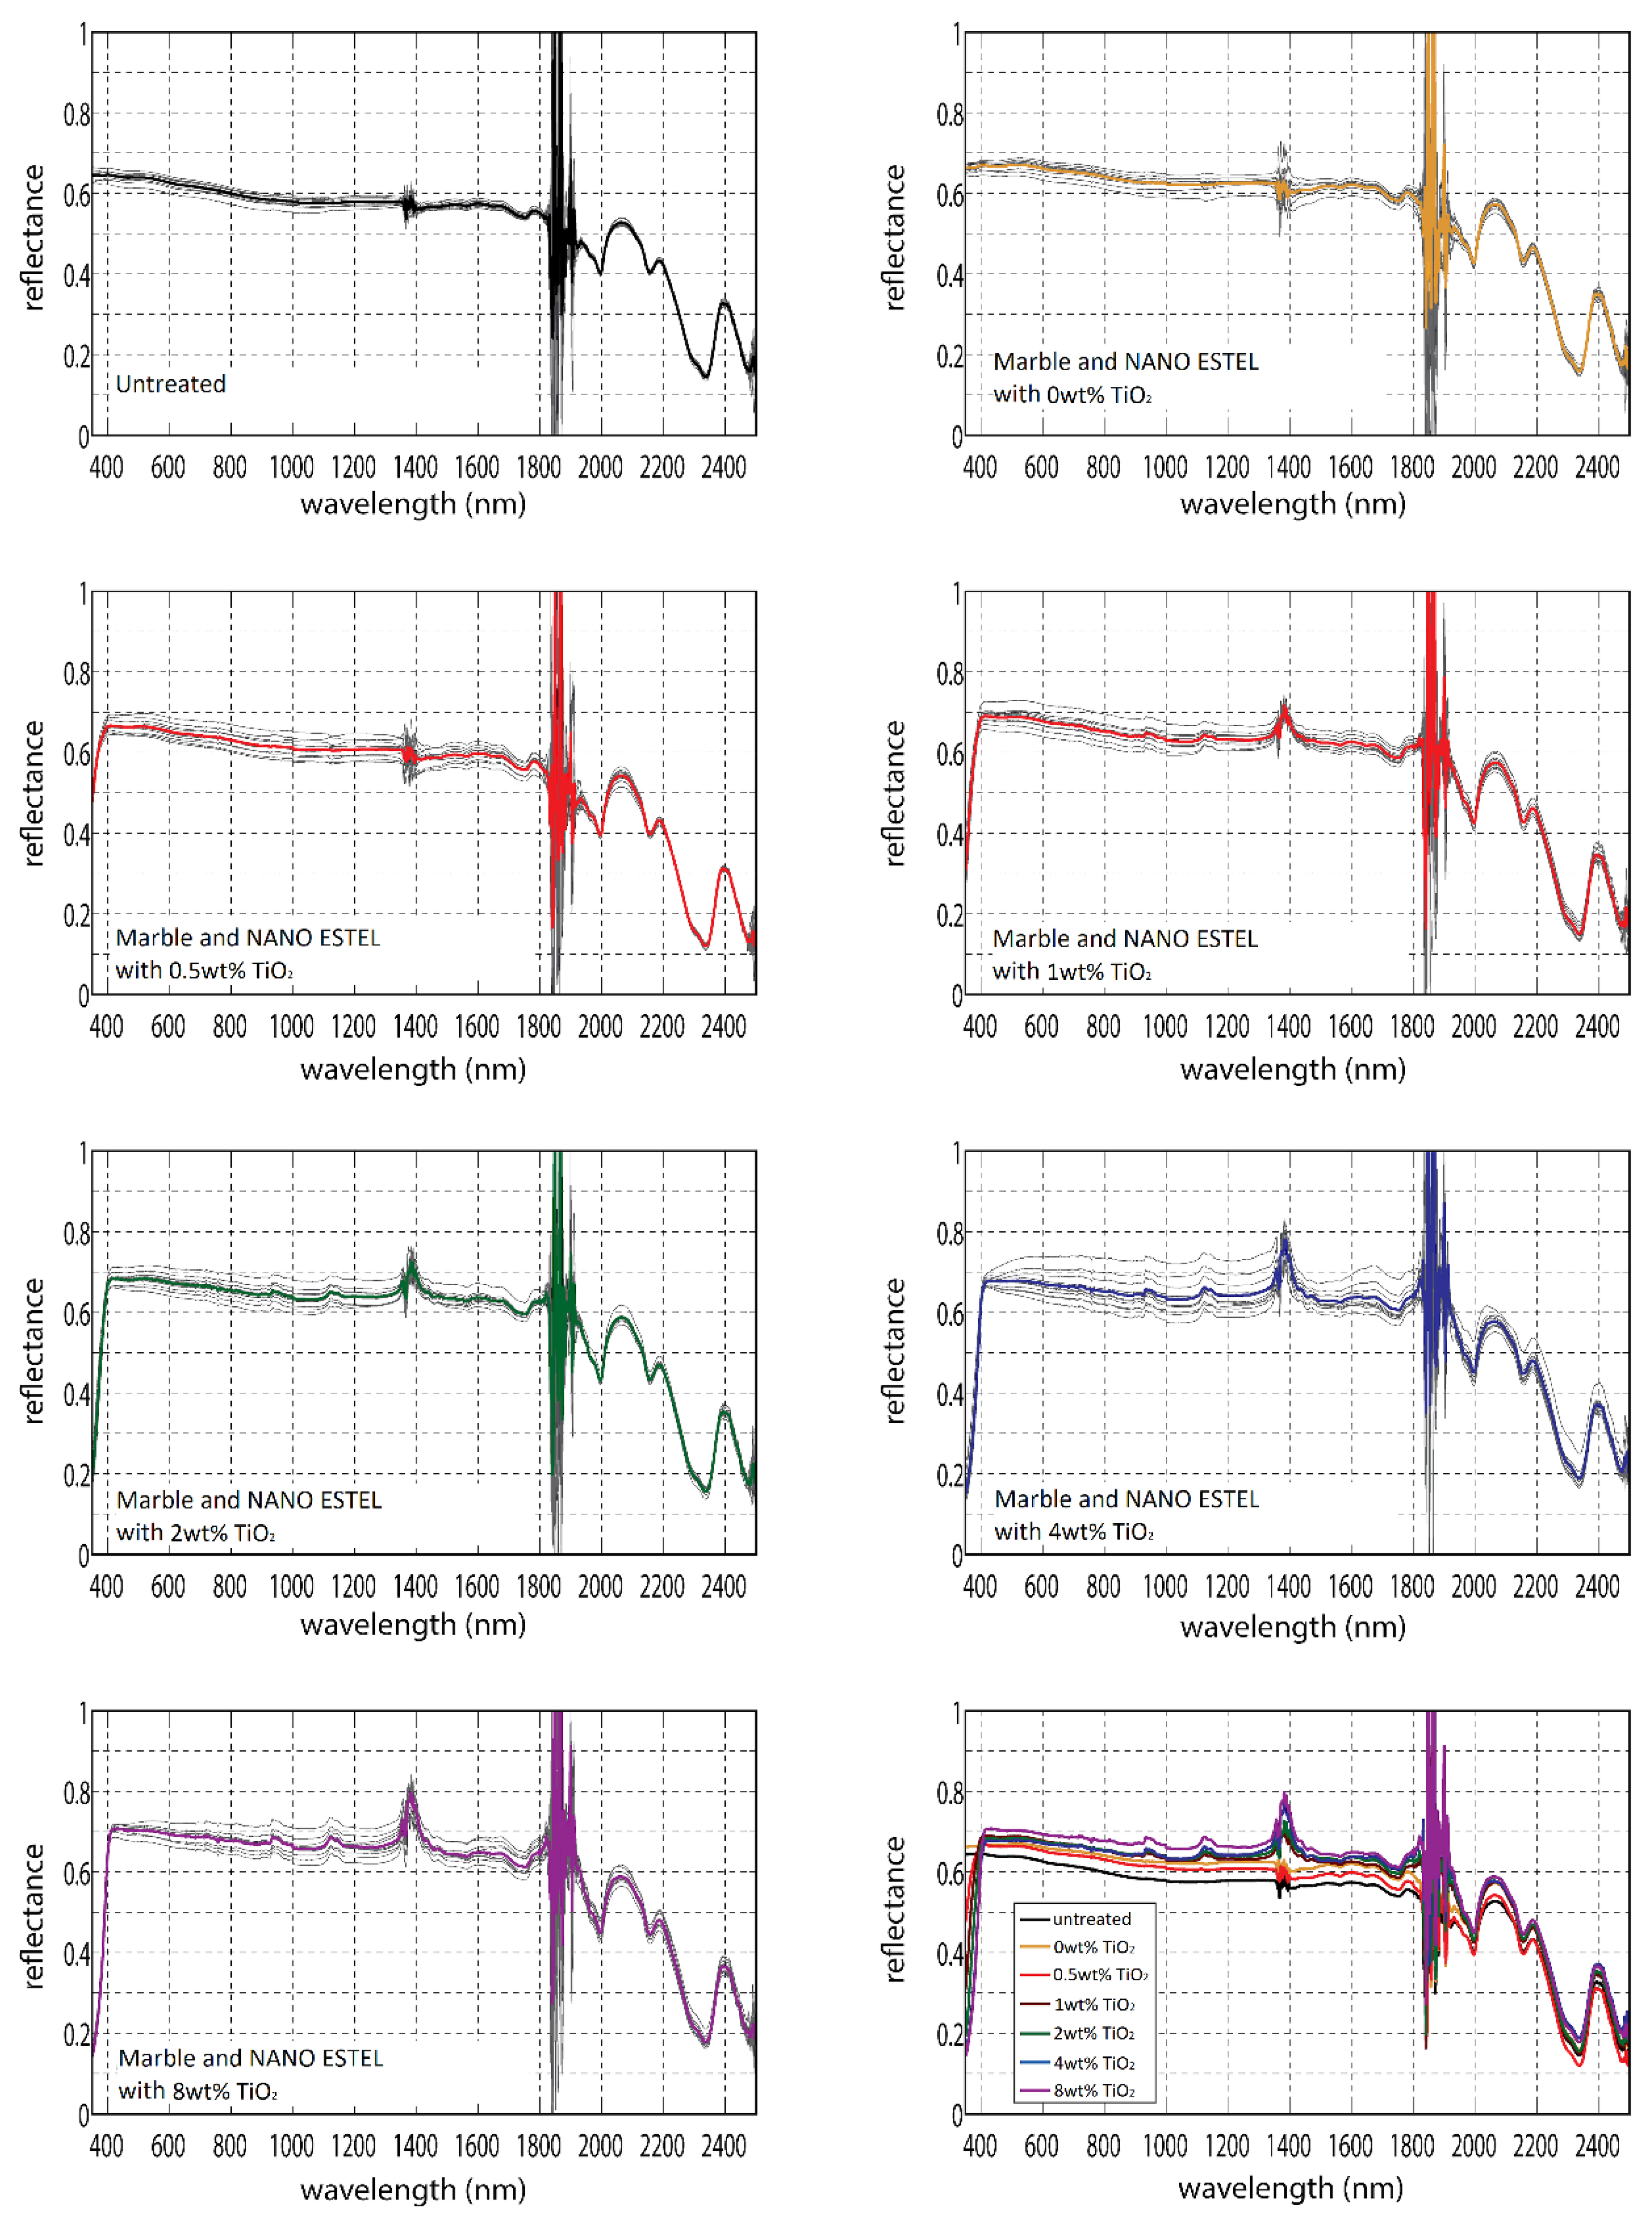
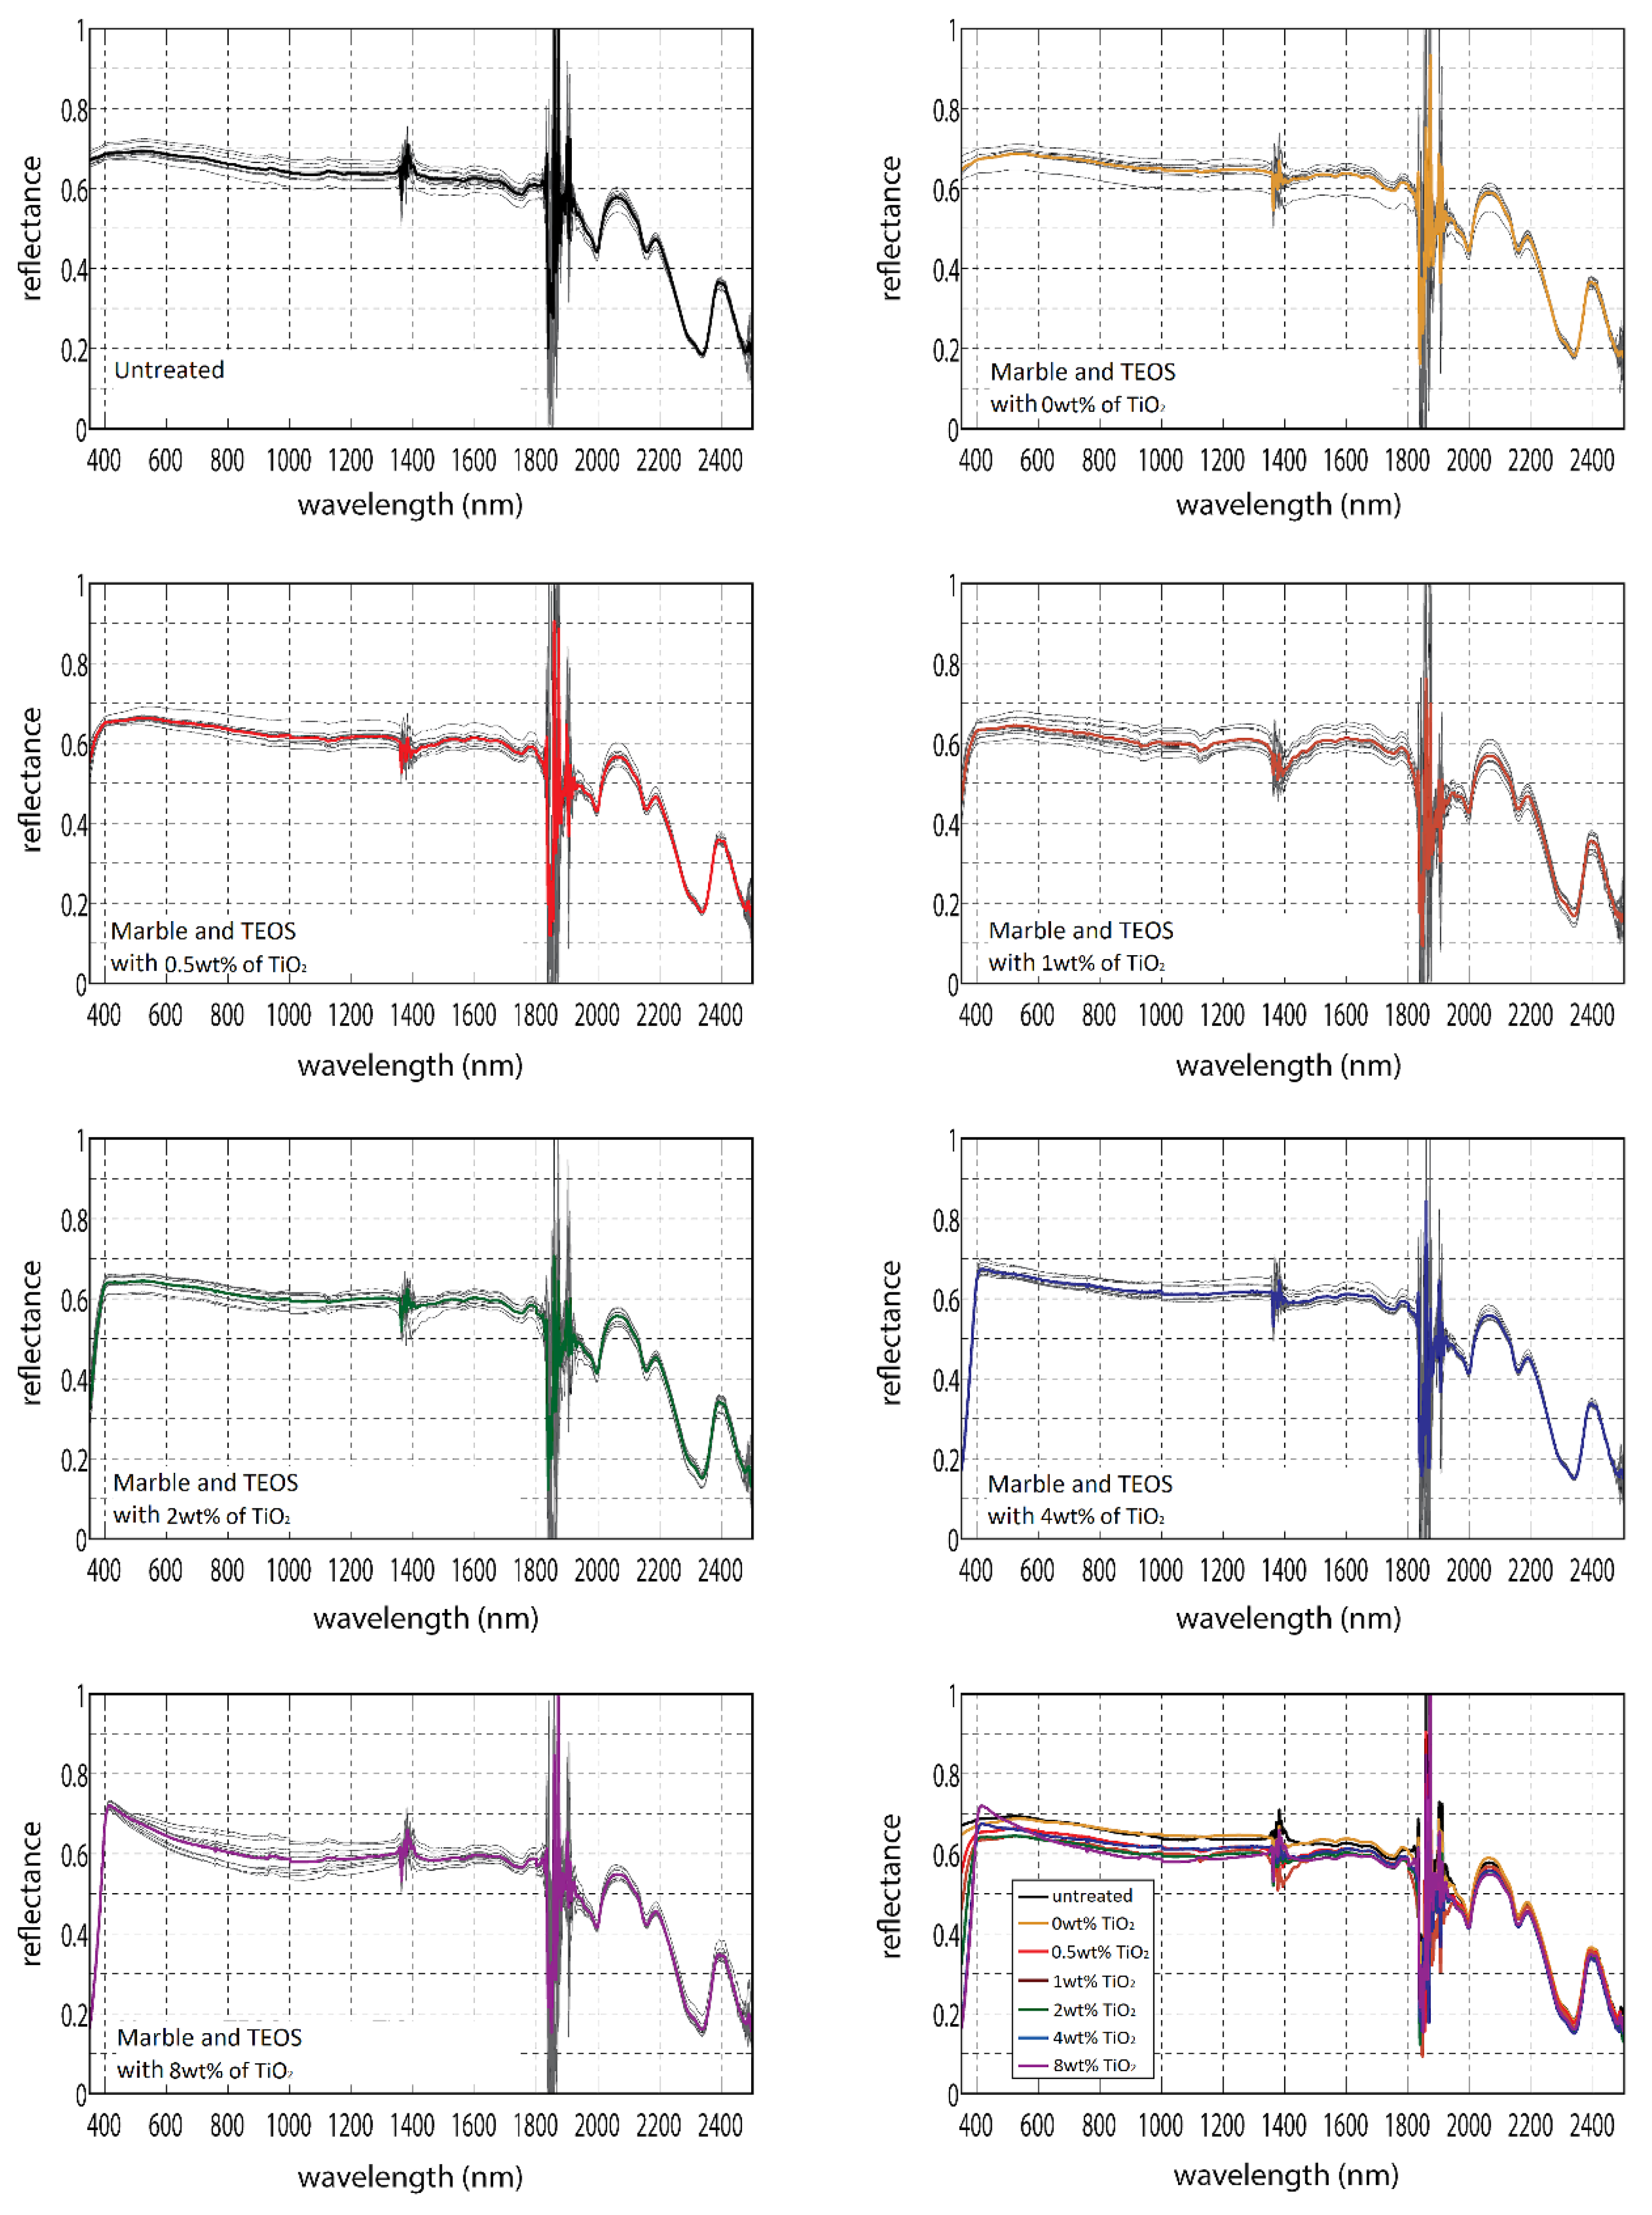
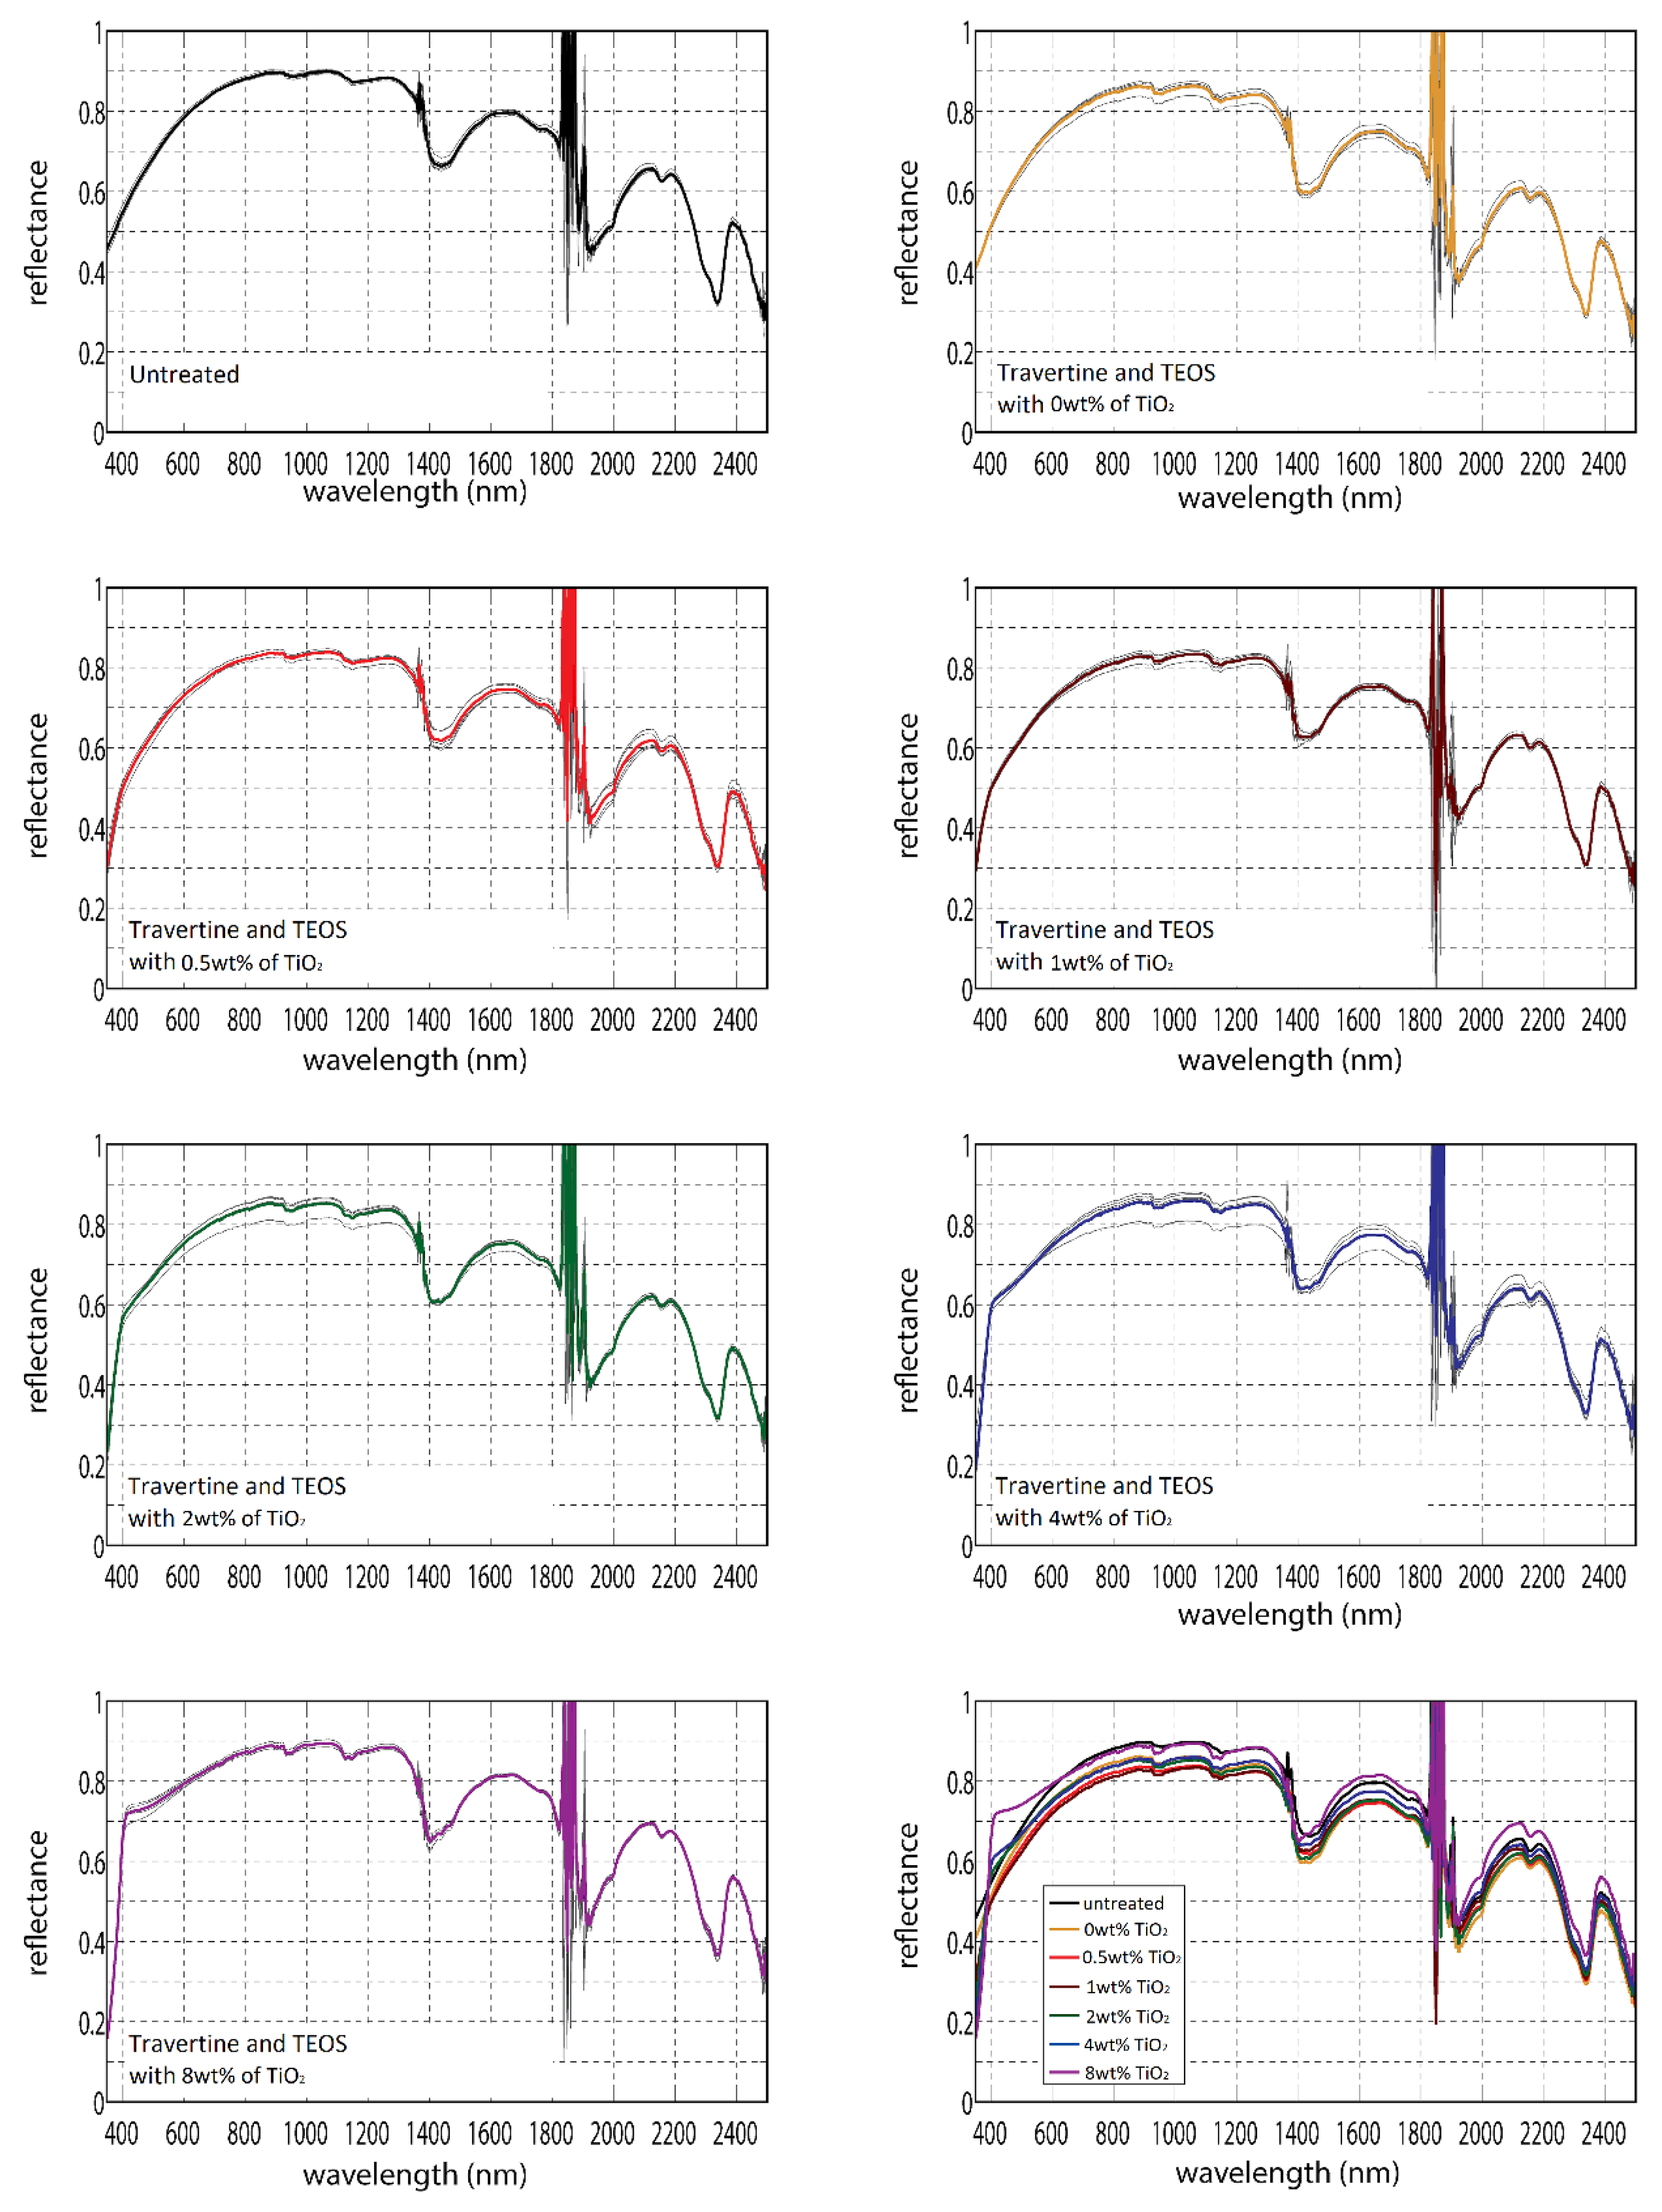
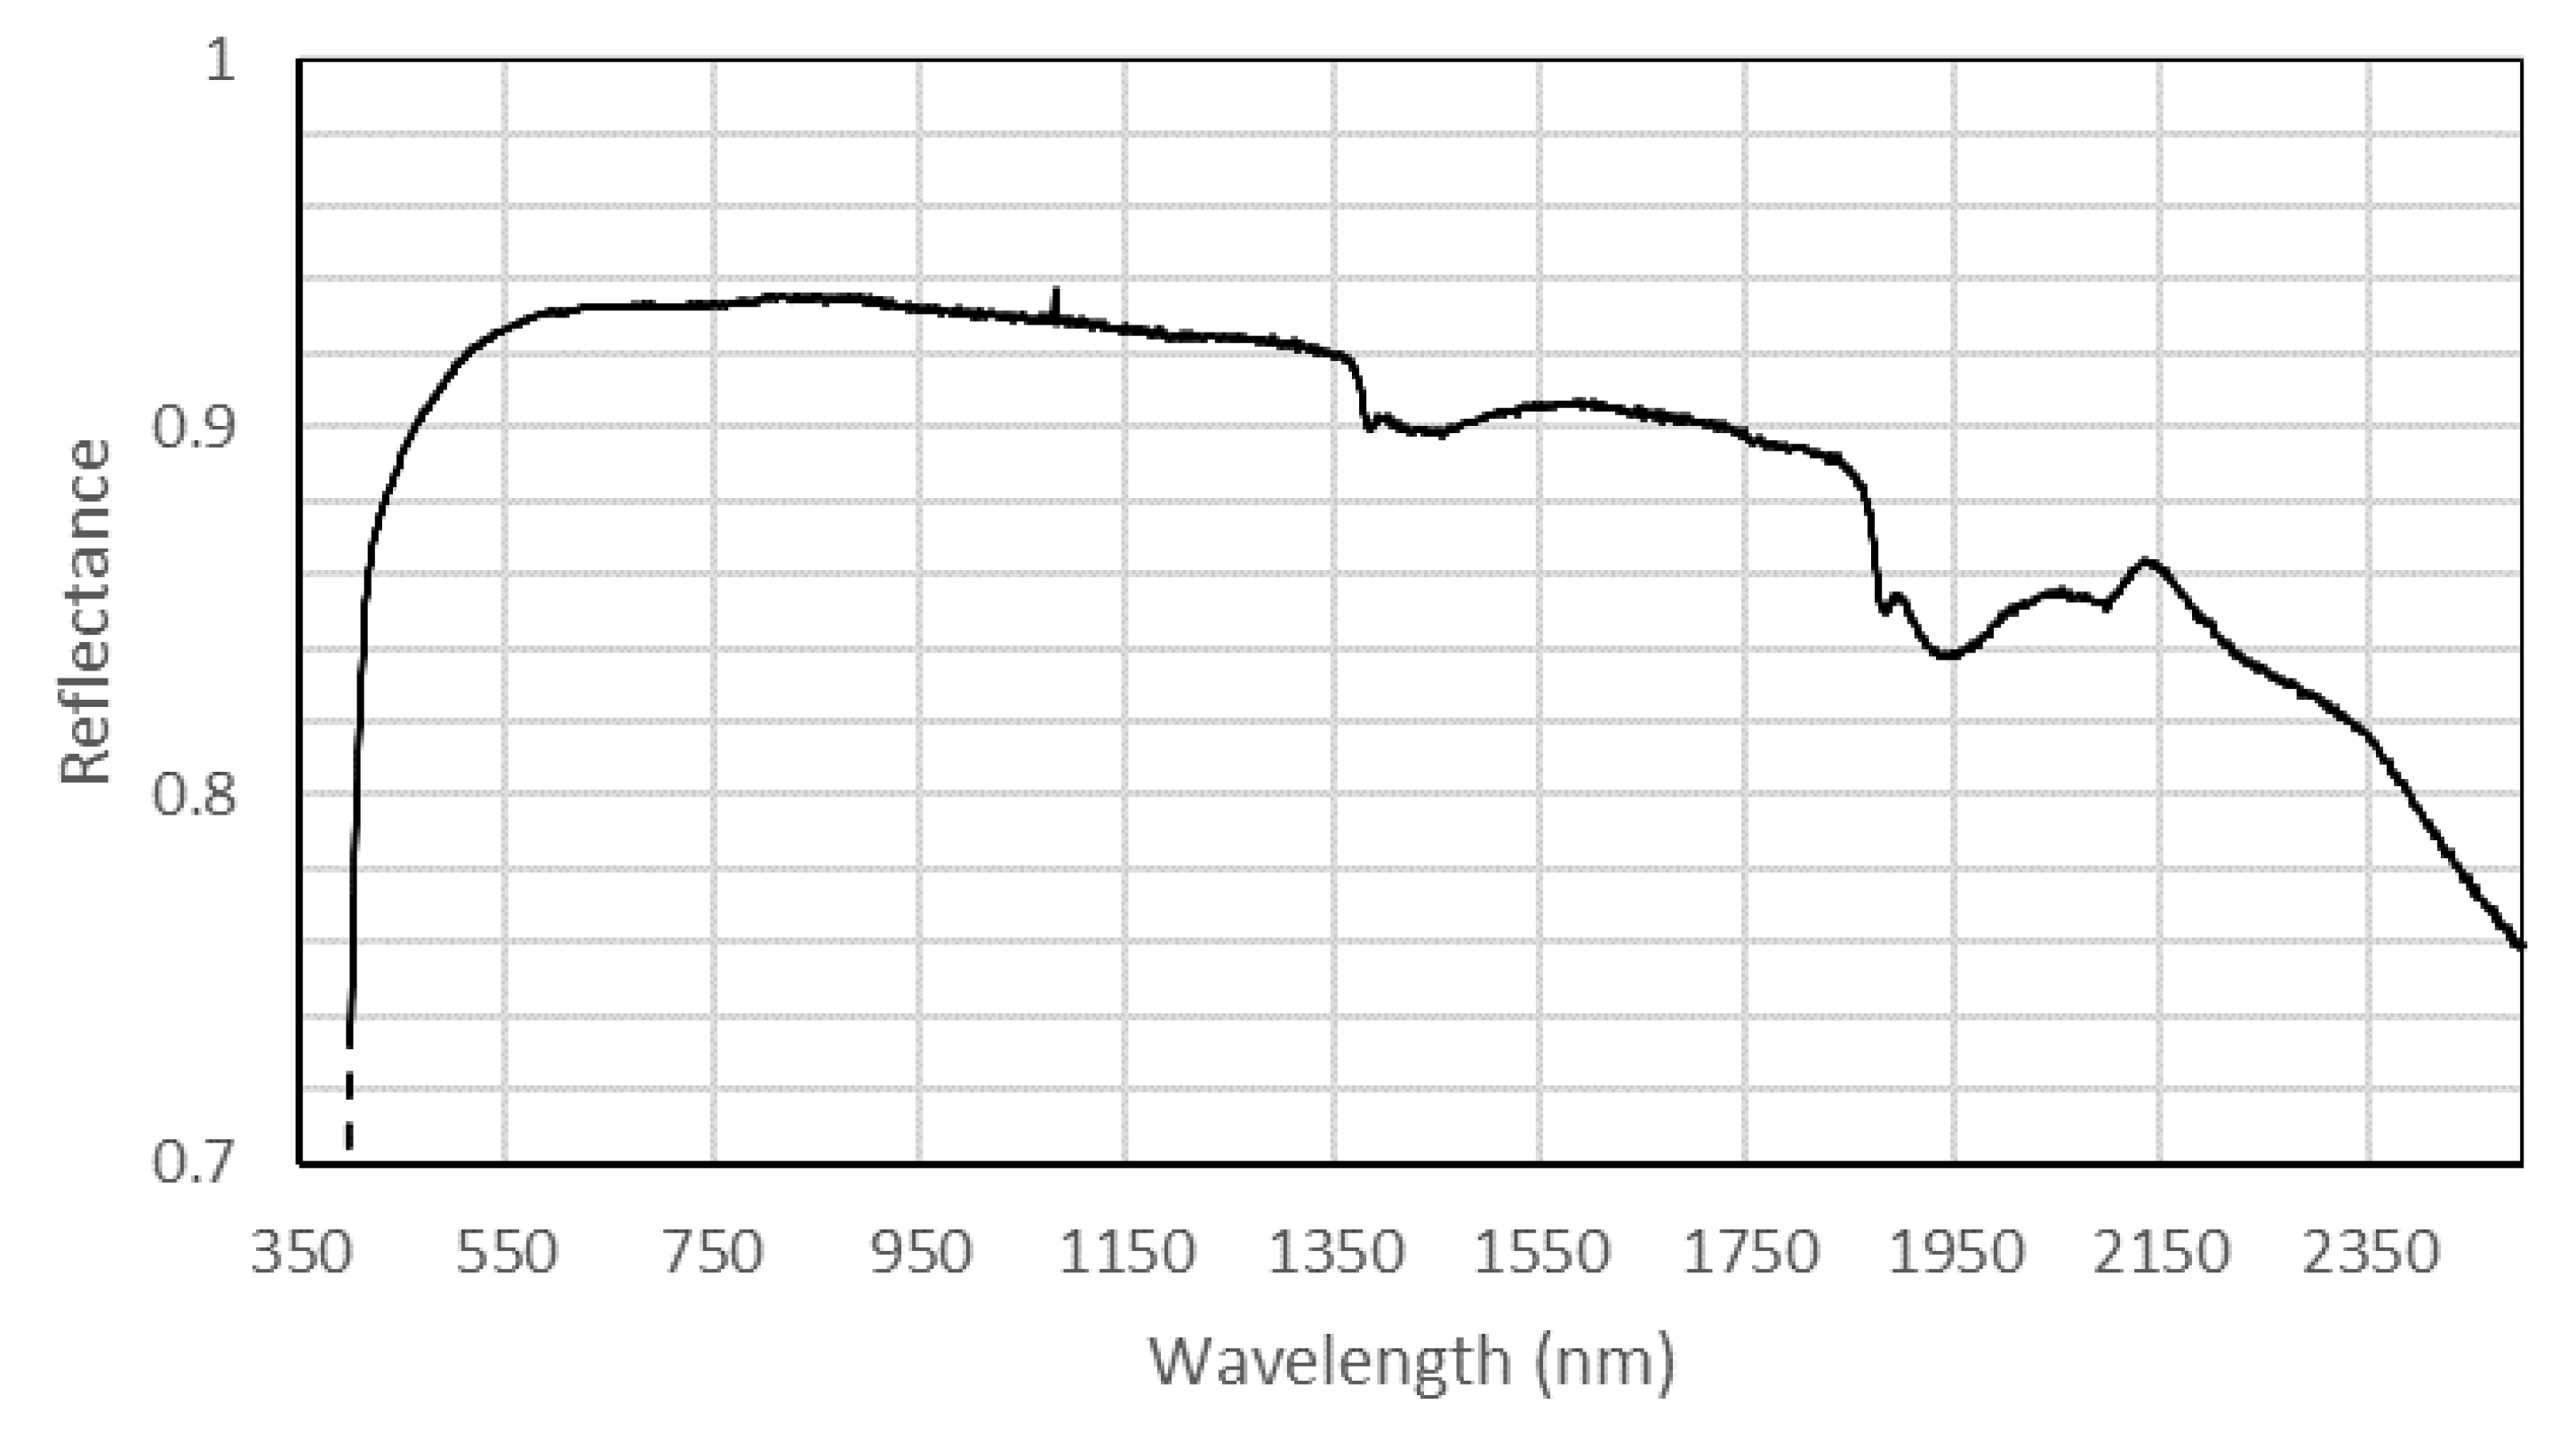
2.2. Spectroradiometric Surveys
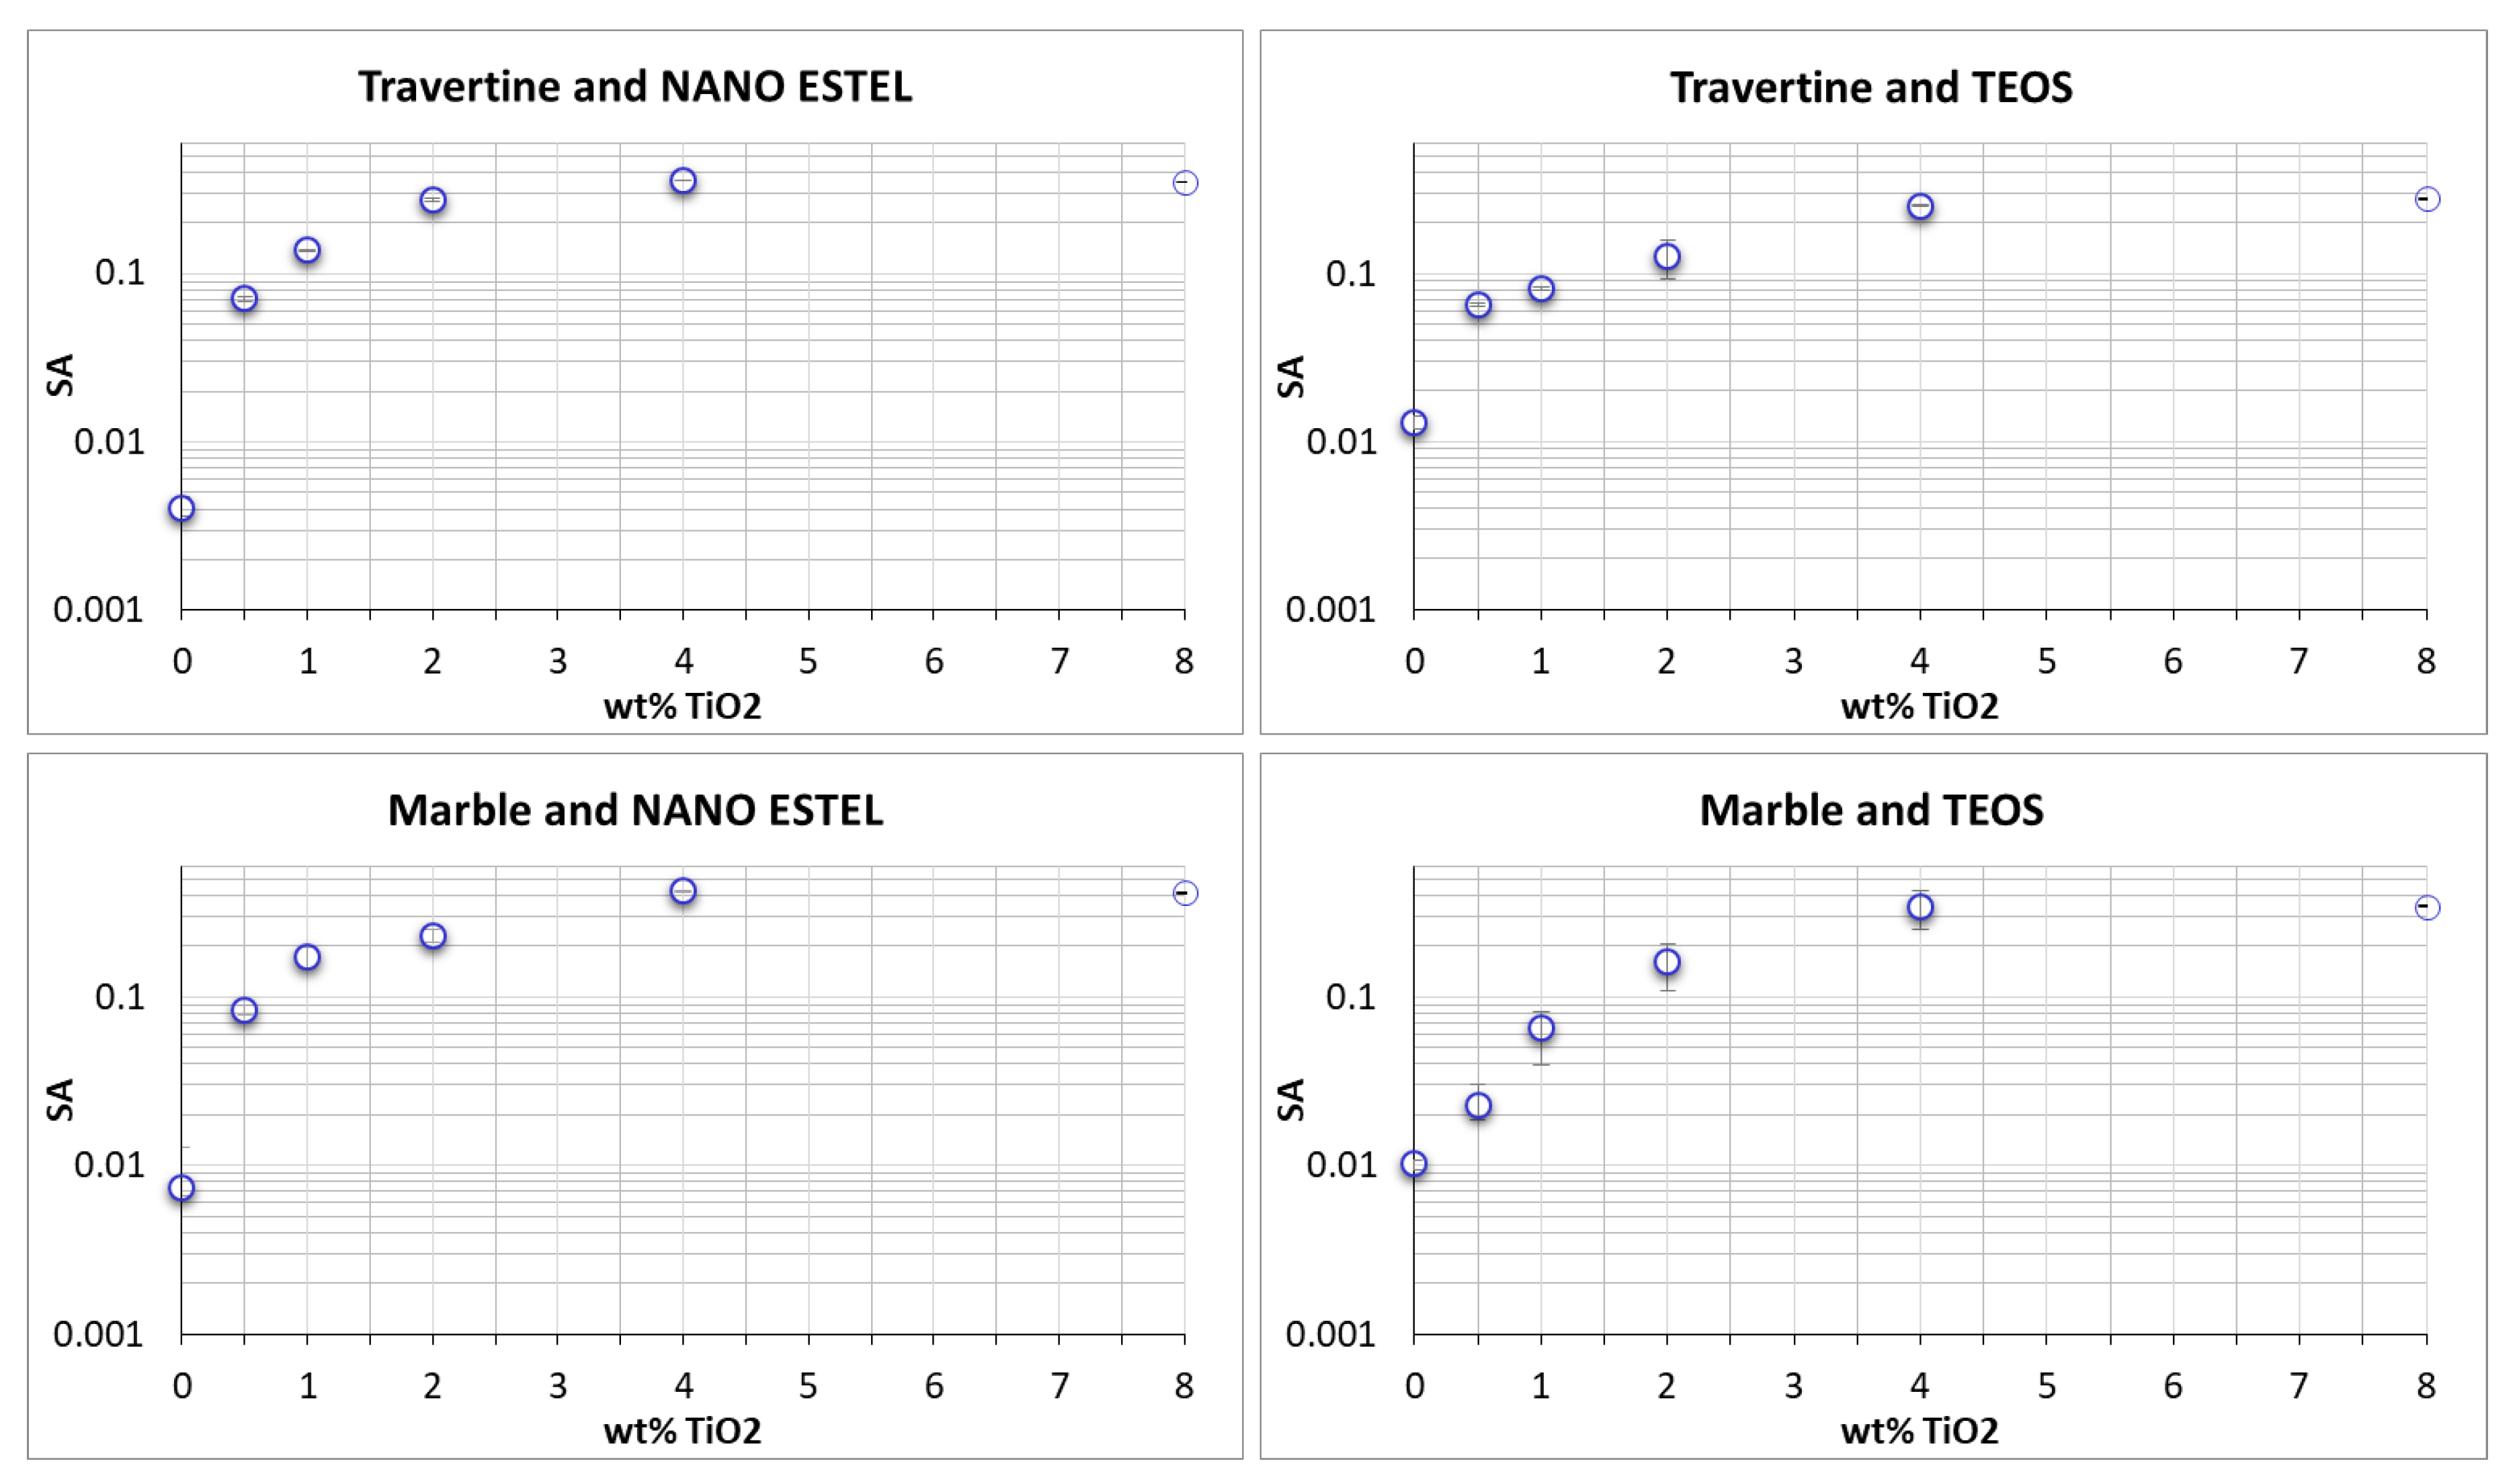
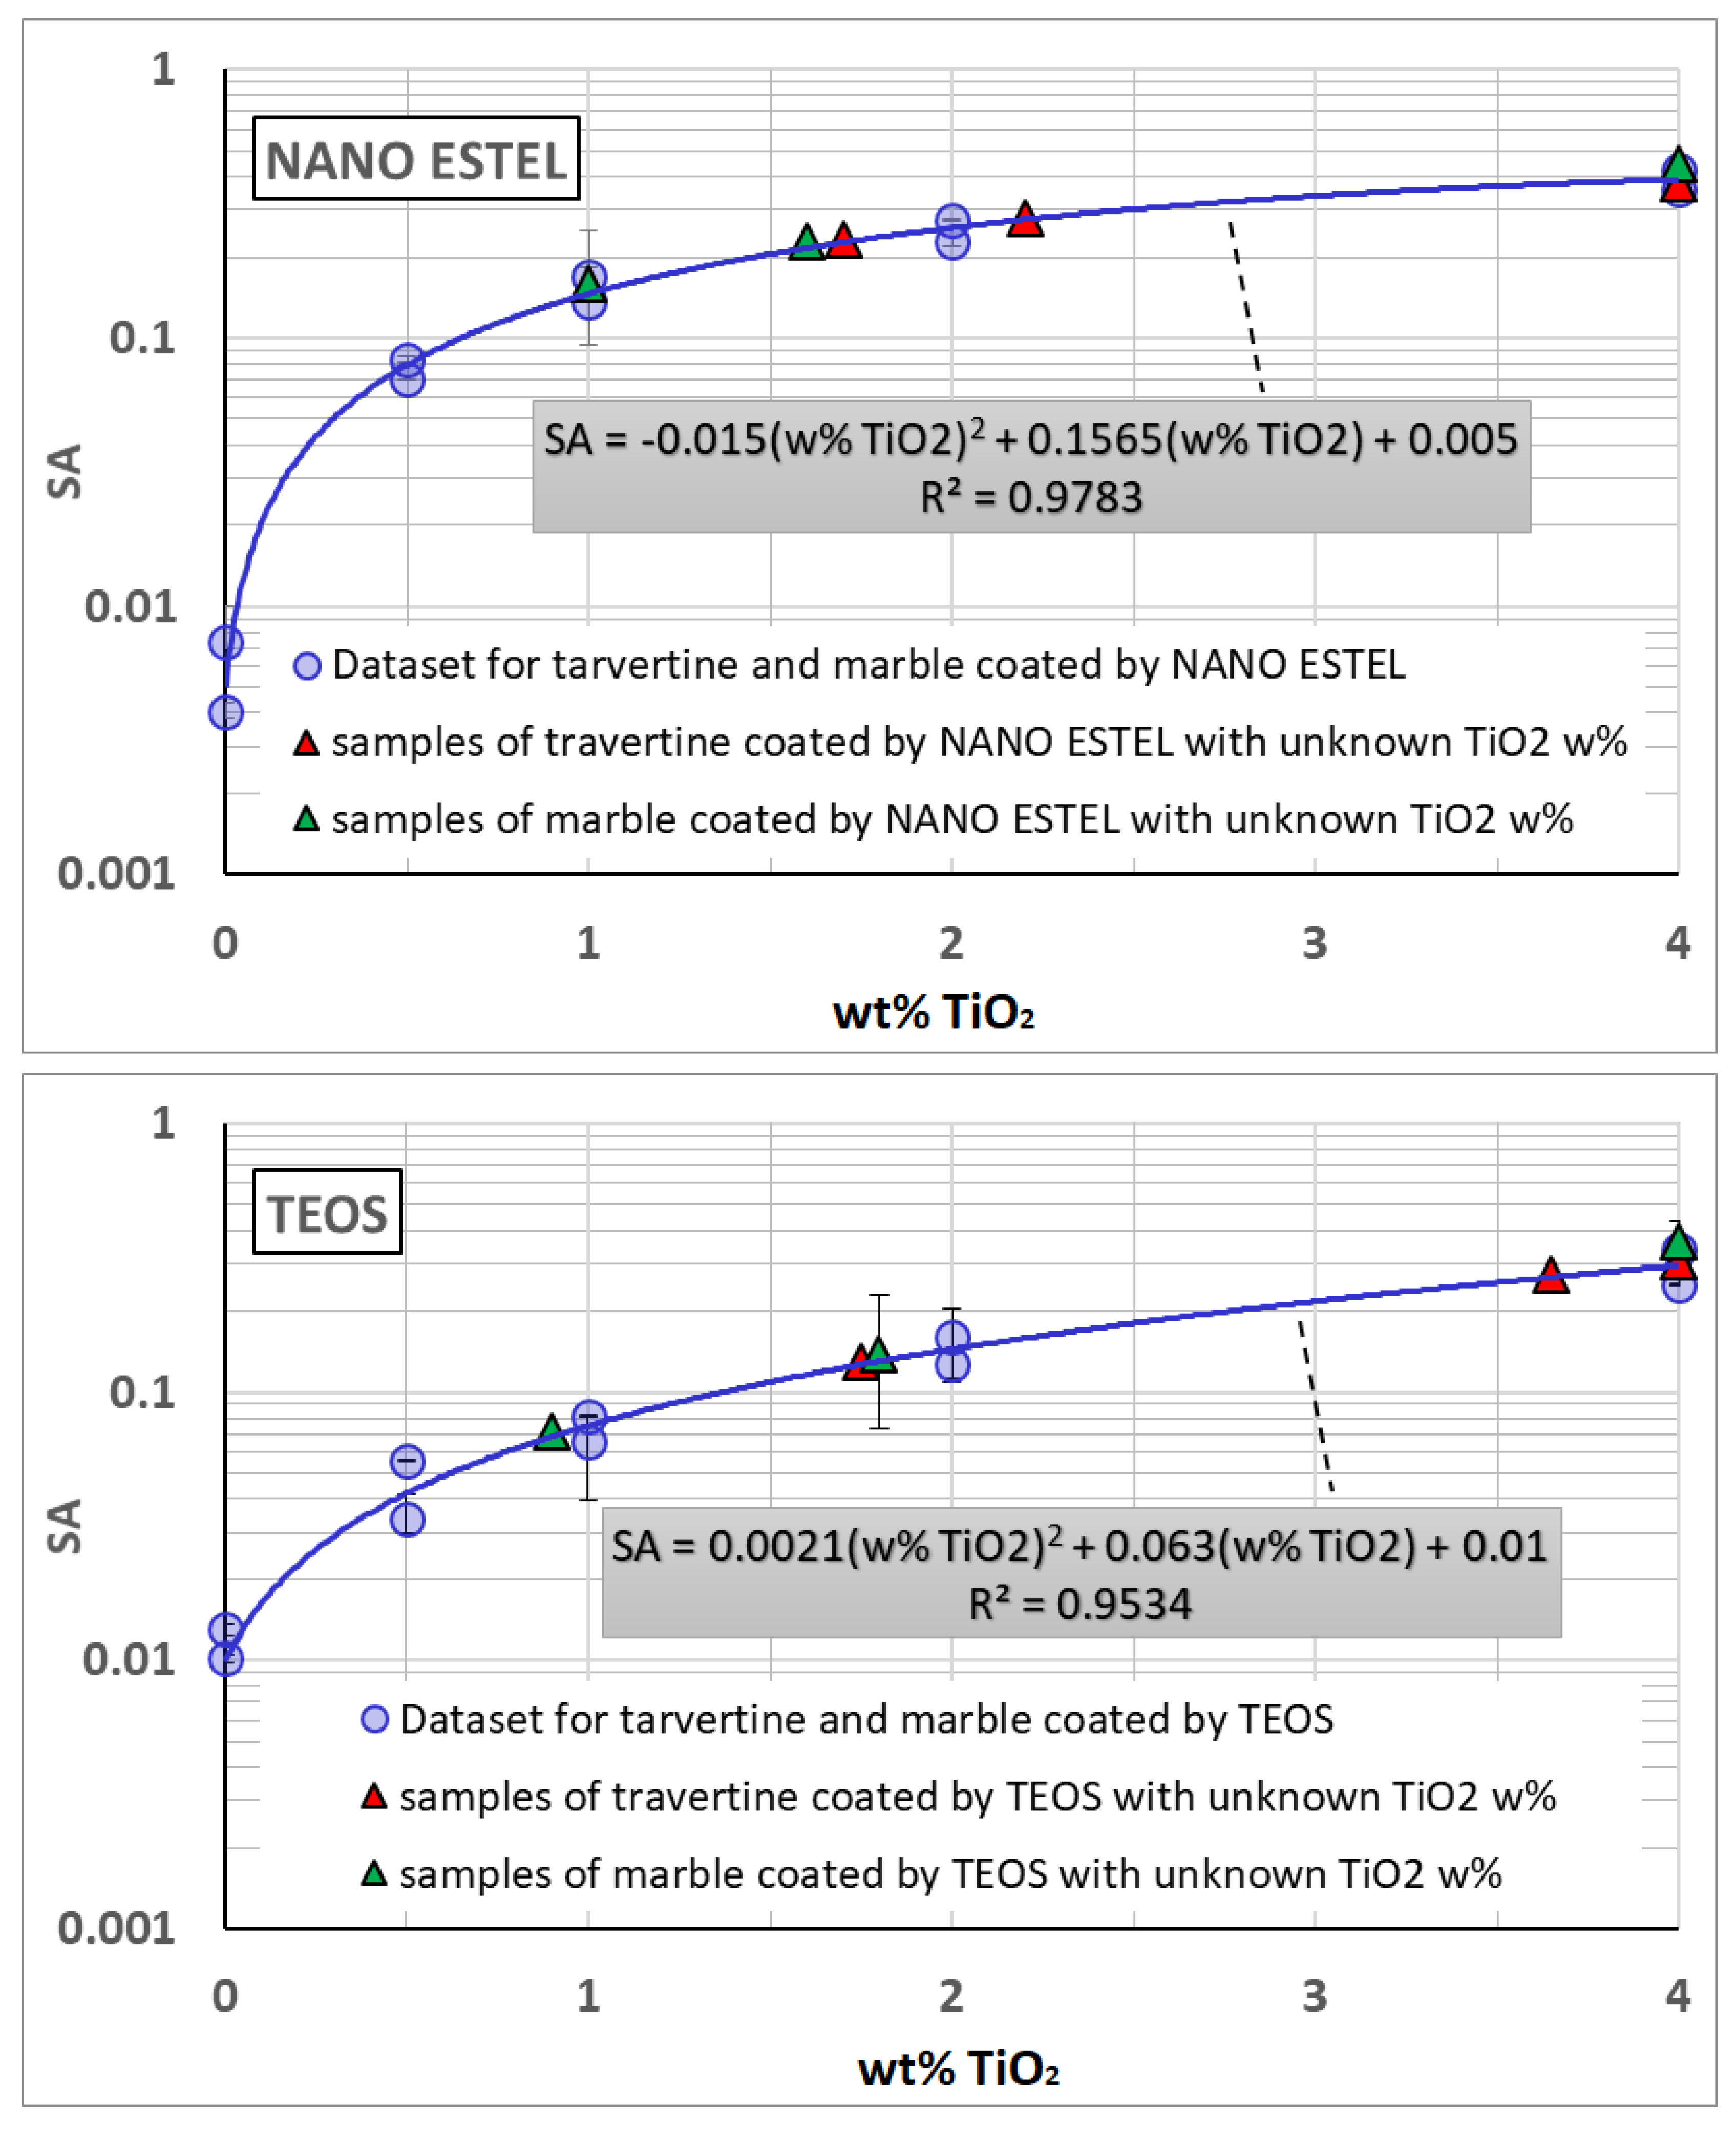
3. Results and Discussion
4. Conclusions
Author Contributions
Funding
Institutional Review Board Statement
Informed Consent Statement
Data Availability Statement
Acknowledgments
Conflicts of Interest
References
- Bazazzadeh, H.; Nadolny, A.; Attarian, K.; Najar, B.S.A.; Safaei, S.S.H. Promoting Sustainable Development of Cultural Assets by Improving Users’ Perception through Space Configuration; Case Study: The Industrial Heritage Site. Sustainability 2020, 12, 5109. [Google Scholar] [CrossRef]
- Jackson, M.D.; Marra, F.; Hay, R.L.; Cawood, C.; Winkler, E.M. The judicious selection and preservation of tuff and travertine building stone in ancient Rome. Archaeometry 2005, 47, 485–510. [Google Scholar] [CrossRef]
- Bourges, A.; Fehr, K.T.; Simon, S.; Snethlage, R. Correlation between the micro-structure and the macroscopic behaviour of sandstones. Restor. Build. Monum. 2008, 14, 157–166. [Google Scholar] [CrossRef]
- Ruggiero, L.; Fidanza, M.R.; Iorio, M.; Tortora, L.; Caneva, G.; Ricci, M.A.; Sodo, A. Synthesis and Characterization of TEOS Coating Added with Innovative Antifouling Silica Nanocontainers and TiO2 Nanoparticle. Front. Mater. 2020, 7, 185. [Google Scholar] [CrossRef]
- La Russa, M.F.; Rovella, N.; de Buergo, M.A.; Belfiore, C.M.; Pezzino, A.; Crisci, G.M.; Ruffolo, S.A. Nano-TiO2 coatings for cultural heritage protection: The role of the binder on hydrophobic and self-cleaning efficacy. Prog. Org. Coat. 2016, 91, 1–8. [Google Scholar] [CrossRef]
- Del Monte, M.; Sabbioni, C.; Vittori, O. Airborne carbon particles and marble deterioration. Atmos. Environ. 1981, 15, 645–665. [Google Scholar] [CrossRef]
- Amoroso, G.G.; Fassina, V. Stone Decay and Conservation: Atmospheric Pollution, Cleaning Consolidation and Protection; Elsevier: Amsterdam, The Netherlands, 1983. [Google Scholar]
- Diakumaku, E.; Gorbushina, A.A.; Krumbein, W.E.; Panina, L.; Soukharjevski, S. Black fungi in marble and limestones—An aesthetical, chemical and physical problem for the conservation of monuments. Sci. Total Environ. 1995, 167, 295–304. [Google Scholar] [CrossRef]
- Primerano, P.; Marino, G.; Di Pasquale, S.; Mavilia, L.; Corigliano, F. Possible alteration of monuments caused by particles emitted into the atmosphere carrying strong primary acidity. Atmos. Environ. 2000, 34, 3889–3896. [Google Scholar] [CrossRef]
- Ruffolo, S.A.; La Russa, M.F.; Ricca, M.; Belfiore, C.M.; Macchia, A.; Comite, V.; Pezzino, A.; Crisci, G.M. New insights on the consolidation of salt weathered limestone: The case study of Modica stone. Bull. Eng. Geol. Environ. 2017, 76, 11–20. [Google Scholar] [CrossRef]
- Cardell, C.; Delalieux, F.; Roumpopoulos, K.; Moropoulou, A.; Auger, F.; Van Grieken, R. Salt-induced decay in calcareous stone monuments and buildings in a marine environment in SW France. Constr. Build. Mater. 2003, 17, 165–179. [Google Scholar] [CrossRef]
- McNamara, C.J.; Mitchell, R. Microbial deterioration of historic stone. Front. Ecol. Environ. 2005, 3, 445–451. [Google Scholar] [CrossRef]
- Scheerer, S.; Ortega-Morales, O.; Gaylarde, C. Microbial deterioration of stone monuments—An updated overview. Adv. Appl. Microbiol. 2009, 66, 97–139. [Google Scholar] [CrossRef] [PubMed]
- La Russa, M.F.; Ruffolo, S.A.; Rovella, N.; Belfiore, C.M.; Palermo, A.M.; Guzzi, M.T.; Crisci, G.M. Multifunctional TiO2 coatings for Cultural Heritage. Prog. Org. Coat. 2012, 74, 186–191. [Google Scholar] [CrossRef]
- Ruffolo, S.A.; De Leo, F.; Ricca, M.; Arcudi, A.; Silvestri, C.; Bruno, L.; Urzì, C.; La Russa, M.F. Medium-term in situ experiment by using organic biocides and titanium dioxide for the mitigation of microbial colonization on stone surfaces. Int. Biodeterior. Biodegrad. 2017, 123, 17–26. [Google Scholar] [CrossRef]
- Munafò, P.; Goffredo, G.B.; Quagliarini, E. TiO2-based nanocoatings for preserving architectural stone surfaces: An overview. Constr. Build. Mater. 2015, 84, 201–218. [Google Scholar] [CrossRef]
- La Russa, M.F.; Barone, G.; Belfiore, C.M.; Mazzoleni, P.; Pezzino, A. Application of protective products to “Noto” calcarenite (south-eastern Sicily): A case study for the conservation of stone materials. Environ. Earth Sci. 2011, 62, 1263–1272. [Google Scholar] [CrossRef]
- Shu, H.; Yang, M.; Liu, Q.; Luo, M. Study of TiO2-Modified Sol Coating Material in the Protection of Stone-Built Cultural Heritage. Coatings 2020, 10, 179. [Google Scholar] [CrossRef] [Green Version]
- Quagliarini, E.; Bondioli, F.; Goffredo, G.B.; Cordoni, C.; Munafò, P. Self-cleaning and de-polluting stone surfaces: TiO2 nanoparticles for limestone. Constr. Build. Mater. 2012, 37, 51–57. [Google Scholar] [CrossRef]
- Petronella, F.; Pagliarulo, A.; Truppi, A.; Lettieri, M.; Masieri, M.; Calia, A.; Curri, M.L.; Comparelli, R. TiO2 Nanocrystal Based Coatings for the Protection of Architectural Stone: The Effect of Solvents in the Spray-Coating Application for a Self-Cleaning Surfaces. Coatings 2018, 8, 356. [Google Scholar] [CrossRef] [Green Version]
- Roveri, M.; Goidanich, S.; Toniolo, L. Artificial Ageing of Photocatalytic Nanocomposites for the Protection of Natural Stones. Coatings 2020, 10, 729. [Google Scholar] [CrossRef]
- CTS SRL. NANOESTEL®. Available online: http://www.ctseurope.com/en/scheda-prodotto.php?id=229 (accessed on 8 November 2020).
- Kim, E.K.; Won, J.; Do, J.-Y.; Kim, S.D.; Kang, Y.S. Effects of silica nanoparticle and GPTMS addition on TEOS-based stone consolidants. J. Cult. Herit. 2009, 10, 214–221. [Google Scholar] [CrossRef]
- Zárraga, R.; Cervantes, J.; Salazar-Hernandez, C.; Wheeler, G. Effect of the addition of hydroxyl-terminated polydimethylsiloxane to TEOS-based stone consolidants. J. Cult. Herit. 2010, 11, 138–144. [Google Scholar] [CrossRef]
- EVONIK’s AEROXIDE® TiO2 P25. Available online: https://www.aerosil.com/lpaproductfinder/page/productsbytext/detail.html?pid=1822 (accessed on 8 November 2020).
- ASD Inc. FieldSpec 4 Standard-Res Spectroradiometer. Available online: https://www.malvernpanalytical.com/en/products/product-range/asd-range/fieldspec-range (accessed on 8 November 2020).
- Costanzo, A.; Ebolese, D.; Falcone, S.; Piana, C.L.; Ruffolo, S.A.; Russa, M.F.L.; Musacchio, M. Hyperspectral Survey Method to Detect the Titanium Dioxide Percentage in the Coatings Applied to the Cultural Heritage. Proceedings 2017, 2, 120. [Google Scholar] [CrossRef] [Green Version]
- Baldridge, A.M.; Hook, S.J.; Grove, C.I.; Rivera, G. The ASTER spectral library version 2.0. Remote Sens. Environ. 2009, 113, 711–715. [Google Scholar] [CrossRef]
- Yuhas, R.H.; Goetz, A.F.H.; Boardman, J.W. Discrimination among Semi-Arid Landscape Endmembers Using the Spectral Angle Mapper (SAM) Algorithm. In AVIRIS Workshop, Proceedings of the Summaries of the 3rd Annual JPL Airborne Geoscience Workshop, Washington, DC, USA, 1–15 June 1992; JPL Publication: Washington, DC, USA, 1992; Volume I, pp. 147–149. [Google Scholar]
- Sorrenti, M.T. L’Angelo Tutelare di Reggio Calabria: Lettura Critica e Restauro [The Angelo Tutelare of Reggio Calabria: Critical Reading and Restoration]; Valtieri, S., Ed.; Quaderni del Dipartimento Patrimonio Architettonico e Urbanistico: Rome, Italy, 1999; pp. 16–18. [Google Scholar]


| Stone | Coating | TiO2 wt% by Laboratory | TiO2 wt% by Hyperspectral Survey | Difference of TiO2 wt% | |
|---|---|---|---|---|---|
| 1 | Travertine | Nano Estel | 10 | ≥4 | - |
| 2 | Travertine | Nano Estel | 2 | 1.7 | 0.3 |
| 3 | Travertine | Nano Estel | 4 | 2.2 | 1.8 |
| 4 | Travertine | TEOS | 10 | ≥4 | - |
| 5 | Travertine | TEOS | 2 | 1.8 | 0.2 |
| 6 | Travertine | TEOS | 4 | 3.7 | 0.3 |
| 7 | Marble | Nano Estel | 10 | ≥4 | - |
| 8 | Marble | Nano Estel | 0.5 | 1.0 | −0.5 |
| 9 | Marble | Nano Estel | 2 | 1.6 | 0.4 |
| 10 | Marble | TEOS | 10 | ≥4 | - |
| 11 | Marble | TEOS | 0.5 | 0.9 | −0.4 |
| 12 | Marble | TEOS | 2 | 1.8 | 0.2 |
Publisher’s Note: MDPI stays neutral with regard to jurisdictional claims in published maps and institutional affiliations. |
© 2020 by the authors. Licensee MDPI, Basel, Switzerland. This article is an open access article distributed under the terms and conditions of the Creative Commons Attribution (CC BY) license (http://creativecommons.org/licenses/by/4.0/).
Share and Cite
Costanzo, A.; Ebolese, D.; Ruffolo, S.A.; Falcone, S.; la Piana, C.; La Russa, M.F.; Musacchio, M.; Buongiorno, M.F. Detection of the TiO2 Concentration in the Protective Coatings for the Cultural Heritage by Means of Hyperspectral Data. Sustainability 2021, 13, 92. https://0-doi-org.brum.beds.ac.uk/10.3390/su13010092
Costanzo A, Ebolese D, Ruffolo SA, Falcone S, la Piana C, La Russa MF, Musacchio M, Buongiorno MF. Detection of the TiO2 Concentration in the Protective Coatings for the Cultural Heritage by Means of Hyperspectral Data. Sustainability. 2021; 13(1):92. https://0-doi-org.brum.beds.ac.uk/10.3390/su13010092
Chicago/Turabian StyleCostanzo, Antonio, Donatella Ebolese, Silvestro Antonio Ruffolo, Sergio Falcone, Carmelo la Piana, Mauro Francesco La Russa, Massimo Musacchio, and Maria Fabrizia Buongiorno. 2021. "Detection of the TiO2 Concentration in the Protective Coatings for the Cultural Heritage by Means of Hyperspectral Data" Sustainability 13, no. 1: 92. https://0-doi-org.brum.beds.ac.uk/10.3390/su13010092