Article

Healthy Diet Assistance for the Most Deprived in Post-Crisis Greece: An Evaluation of the State Food Provision Program

Department of Food Science & Human Nutrition, Agricultural University of Athens, 118 55 Athens, Greece
*
Author to whom correspondence should be addressed.
Submission received: 17 November 2020 / Revised: 18 December 2020 / Accepted: 19 December 2020 / Published: 24 December 2020

Abstract

:
In 2016, the European Union set up the Fund for European Aid to the Most Deprived (FEAD) as its first structured food provision program to combat food insecurity. Computational analysis and a cross-sectional survey took place from January 2016 to June 2018 to calculate FEAD’s contribution to its beneficiaries’ diets and to collect beneficiary satisfaction data. Dairy, fresh meat, legumes, sugar, olive oil, and tomato concentrate were the most commonly procured items. The program’s contribution to vegetable, dairy, and grains intake was 3.4%, 6.1%, and 6.0%, respectively, as opposed to discretionary calories (12.2%) and fats/oils (24.5%). The program’s algorithm greatly favors (almost 3-fold) single-person applications, compared with applications with four or more people. Beneficiaries valued each food provision at 21.23 ± 23.4 euros, which, for 64.4% of them, translated to a high positive impact on the household budget. FEAD had a highly positive impact on feelings of anxiety and security, for 50.7% and 41.6% of its beneficiaries. Satisfaction with the foods provided was also high for ~70% of the beneficiaries. The program is met with high beneficiary satisfaction and is perceived as a substantial assistance. Increases in the amounts and variety of foods delivered, with a focus on fruit, vegetables, and fish, should be considered to further improve the program’s dietary impact.

1. Introduction

Food insecurity—the inability to ensure access to sufficient, safe, and nutritious food to meet one’s dietary needs and preferences for an active and healthy life— has traditionally been considered an issue for low/middle-income countries [1]. After decades of downward trends, the 2008 economic crisis resulted in increases in the prevalence of food insecurity globally [2,3,4], as well as in Europe [5,6,7]. In 2016, 26.4% of European were at risk of mild to moderate food insecurity [6,8,9], indicating an issue of national concern [10].
Food insecurity as a phenomenon often coexists with material deprivation, dependency on social benefits, and is commonly found among those less privileged [11]. Alongside the surge in food insecurity, 23.5% of the European population (118.0 million people) was living in households at risk of poverty or social exclusion in 2016 [12]. At that time, poverty rates were 1.5 times higher than the European average in Greece, and unemployment was as high as 23.6% [5,13,14]. In Greece, the humanitarian cost of the recession was an increase in the burden of disease [15], while the impact on malnutrition remains unclear [16,17,18,19].
During the 2014–2020 programming period, the “Fund for European Aid to the Most Deprived” (FEAD) was created with an aim of eliminating poverty and social exclusion [5,20]. FEAD, through the provision of material assistance including food provisions, was the main EU policy against food insecurity [5,20]. FEAD’s design followed the example of previous programs running abroad since 1964 [5,21,22], and was the main policy against food insecurity in the region. Under FEAD, food security is defined as the ability to achieve a balanced diet through adequate access to food [23].
Each EU country has the liberty to implement FEAD according to local needs and infrastructures [5]. In Greece, FEAD has been implemented since January 2016. The local implementation was based on the creation of a Central Managing Authority and a network of 57 local Social Partnerships (SPs), split among each of the 13 geographical administrative units based on population density (1–9 SPs per administrative unit) [21].
In this structure, there are two channels for food provisions procurement [21]. Firstly, there are Centralized Suppliers (CSs), which are managed by the Central Managing Authority. Centralized Suppliers procure base items for all 57 SPs, and they are then distributed based on the volume of FEAD recipients by the SPs. The second food provision procurement channel is called Decentralized Suppliers (DSs), and they are managed independently by each SP. The aim of DSs is to procure additional food items, different from the ones provided by the CSs, in order to add variety and allow for tailoring of the food provisions to local needs and food availability [21].
FEAD is the first state intervention against food security in Europe and Greece and to our knowledge, there is limited literature on its evaluation. Prior to FEAD, all food assistance actions were managed by NGOs and charitable organizations, making this the first government-led food assistance program in Greece [24]. The current study aimed to perform an evaluation of FEAD’s capacity to have an impact on its beneficiaries’ diets and their quality of life (perceived impact on financial and psychological aspects) after its first year of implementation.

2. Methodology

The evaluation of the program took place between January 2016 and December 2018. Firstly, operational data were analyzed in order to calculate the amount, quality, and variety of the foods provided to each household. Following that, a cross-sectional evaluation of the program by its beneficiaries through the collection of feedback data using a structured questionnaire took place.

2.1. Calculation of FEAD Food Provisions Delivered to Beneficiaries

2.1.1. Data Collection

For the computational analysis of FEAD food provisions, operational data from January 2016 to December 2017 (as provided by the local FEAD authorities) were analyzed. The overall aim of this analysis was to calculate the contribution of the foods provided by FEAD toward the achievement of a healthy diet as described by the WHO guidelines [25]. All analyses were conducted at a beneficiary level, and diet quality was assessed as achieving the recommended intake of specific food groups as mentioned in the WHO guidelines.

2.1.2. Mapping of the Food Items Provided

Data for CSs and DSs were analyzed separately as they are two independent procurement channels. Operational data from each were used to identify unique food items procured. All foods were categorized into seven food groups (fruits, vegetables, grains, meat and legumes, dairy, fats and oils, and discretionary calories) according to the WHO guidelines [25]. Fruits included fresh and dried fruit and fruit juices; vegetables included all fresh and cooked vegetables; grains included all cereal-based foods; meat and legumes included meat, poultry, fish, seafood, legumes, and soya-based products; dairy included only animal-based dairy products; and fats and oils included any fats and oils from all origins. Discretionary calories included all sweets, desserts, and sweetened beverages. Then, data from the SPs were used to calculate how much of each food item was included in their food provision. To map differences in the utilization of the different supply routes by the SPs, the number of SPs that procured each item by either the CSs or the DSs was calculated.

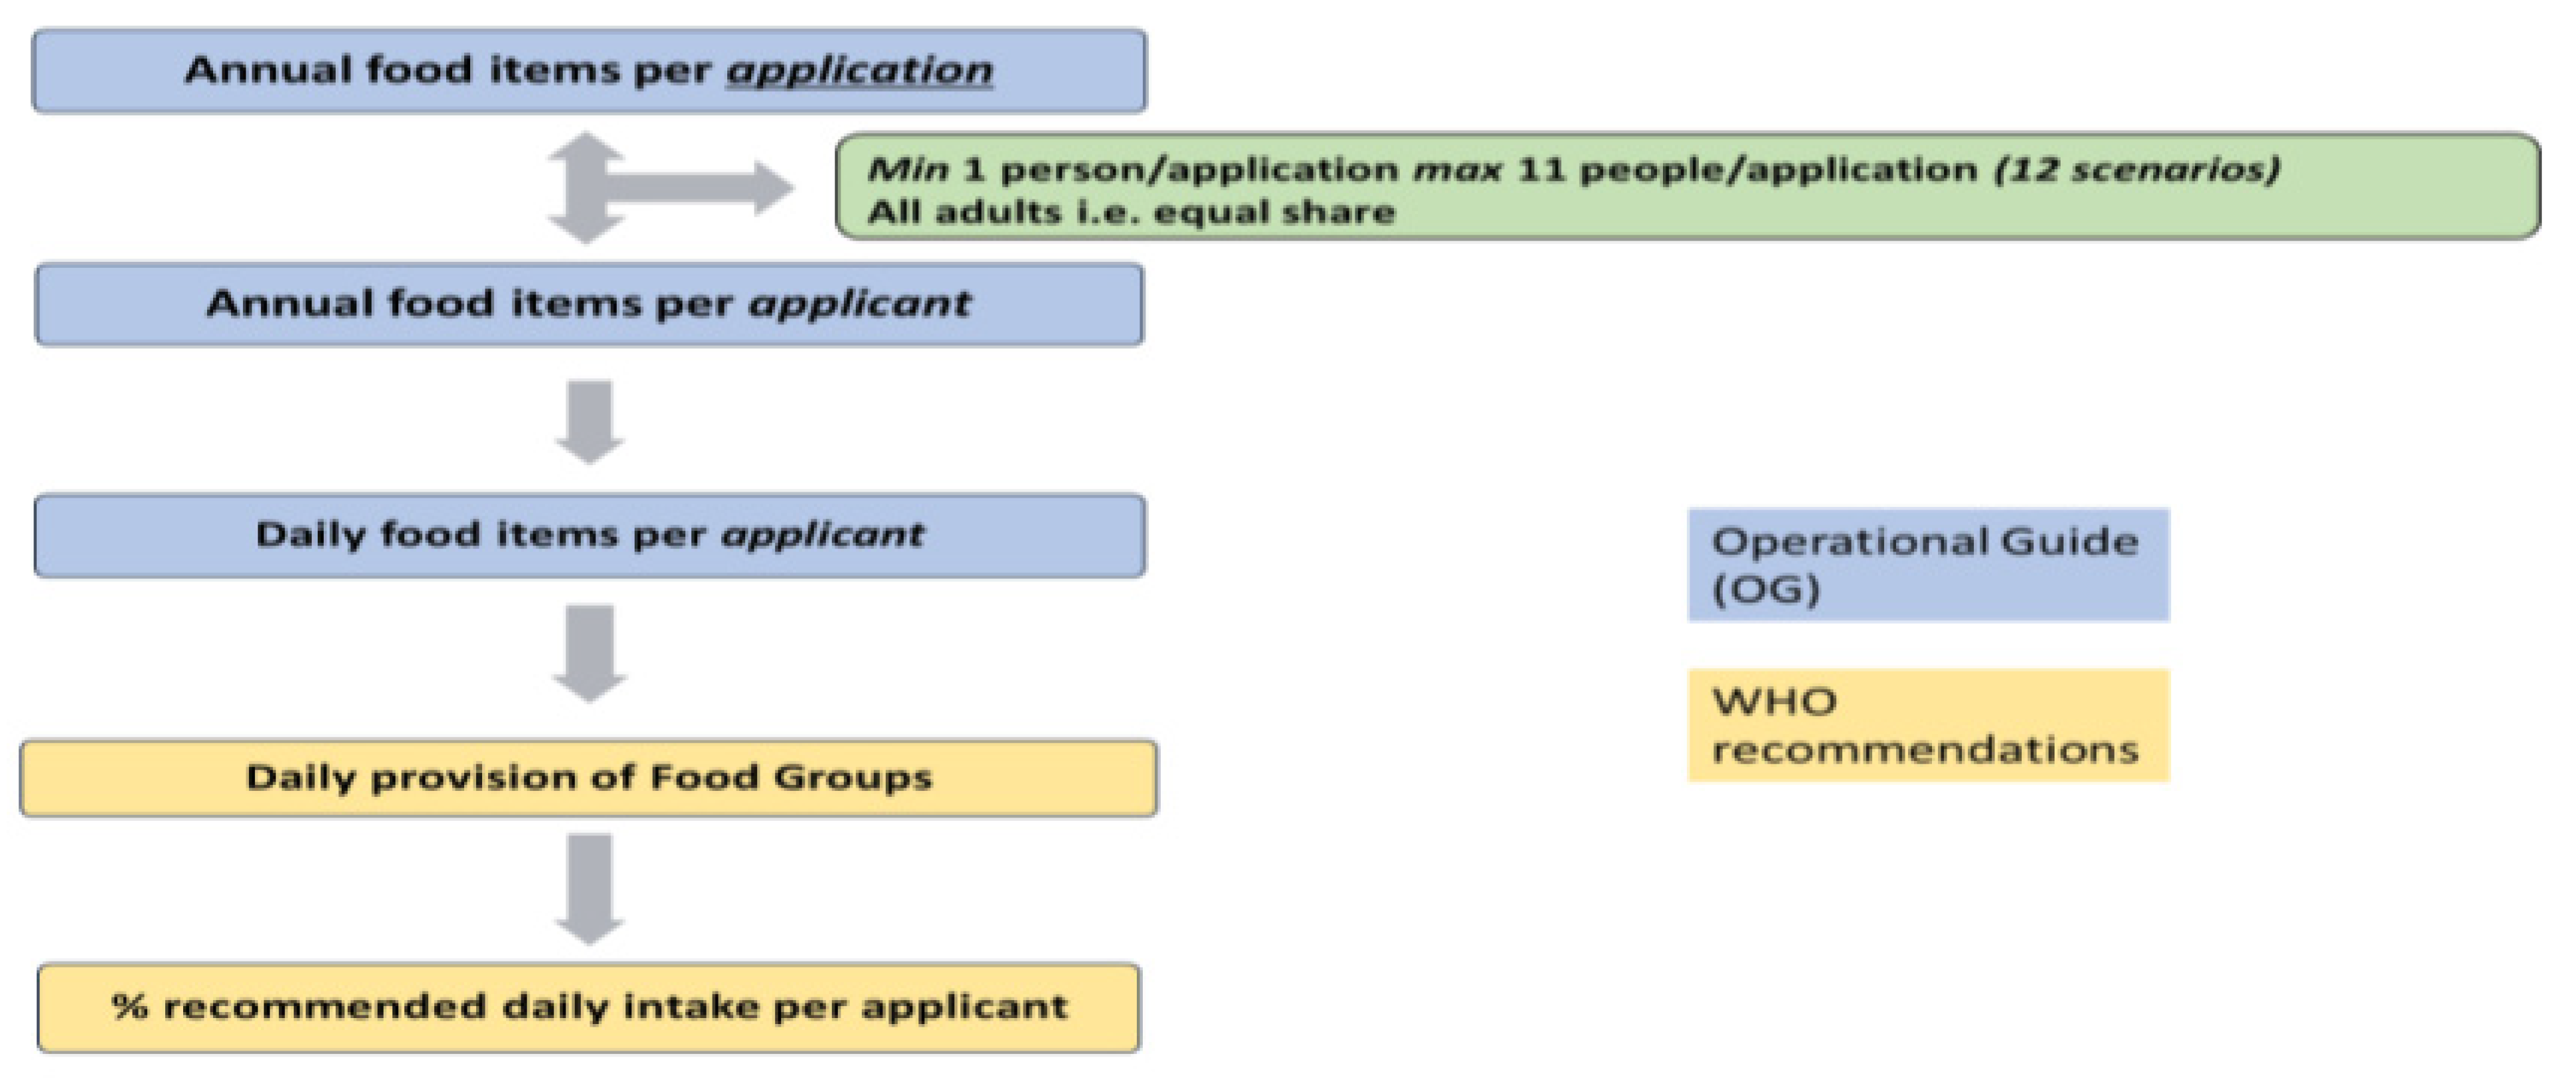
2.1.3. Calculation of FEAD’s Contribution toward the Achievement of a Healthy Diet

In order to calculate FEAD’s contribution toward a healthy diet, a 5-step algorithm was created (Figure 1). FEAD’s operational data track food provisions per application per annum. FEAD’s Operational Guide, designed by the Central Managing Authority, describes an algorithm that calculates the annual food entitlement per application, taking into account that each application represents one household. Based on FEAD data, twelve different household sizes (1–11 people per application/household) are included in the algorithm.
For our analysis, we calculated annual food provision entitlement for each of the 12 household scenarios. This was then translated to food provision entitlement per annum per applicant. For this conversion, it was assumed that households include only adults without any special dietary needs. No provision was made for children, pregnant/lactating women, and so forth, due to a lack of the relevant data and the computational nature of the analysis. The annual food provision per applicant was then translated to daily food provision in g/day. Food provisions were then analyzed as portions of foods in each of the five WHO-recommended food groups (e.g., a daily provision of milk and a daily provision of cheese were combined for the daily provision of dairy) and the relative contribution of FEAD toward achieving the recommended intake of each food group was calculated [25]. For each food group, the FEAD contribution toward the recommended food group portion intake was calculated for each of the 12 potential household sizes separately and presented using box plots, showing the range and the differences among each scenario.
As CSs and DSs are independent of each other, data for the contribution of FEAD toward achieving a WHO-recommended diet were calculated separately for CSs and DSs. FEAD’s total contribution to the diet (CSs and DSs combined) was then calculated using the sum of means approach.

2.2. Beneficiaries’ Evaluation of the FEAD Program

Data Collection and Research Design

A cross-sectional direct evaluation of the program from its beneficiaries took place from December 2017 to June 2018. The Ethics Committee of the Agricultural University of Athens approved the design, the procedures, and the aim of the study. A consent form was given to the participants (>18 years old) informing them about the content of the survey, the anonymity of the questionnaires, and the safeguarding of personal data based on the General Data Protection Regulation (GDPR) standards.
A total of 3420 questionnaires were mailed to all 57 SPs (60 questionnaires per SP) and were then distributed to the beneficiaries by the SP’s staff at the time of food provision delivery within three months. The voluntary and anonymous nature of the study participation and the fact that it was not linked to the access to food provisions were clarified to all beneficiaries invited to participate. SPs then distributed the questionnaires among their beneficiaries and returned them to the Agricultural University of Athens.
An additional 500 questionnaires were collected by independent researchers from the Agricultural University of Athens during on-site visits to 5 SPs at the time of food provision delivery as part of a larger survey on the dietary habits of FEAD beneficiaries. The 5 SPs selected for this additional sampling represented 72 municipalities from the following peripheries: Attica, West Macedonia, Central Macedonia, Crete, and Peloponnese, covering 66% of the total Greek population. Only beneficiaries that had not previously completed the self-reported FEAD evaluation questionnaire were invited to participate in this researcher-assisted arm of the study. All questionnaires were analyzed by the Agricultural University of Athens without the involvement of FEAD.
Two types of questionnaires were created: a short and a long version. The short version included 32 questions and collected sociodemographic characteristics, self-reported anthropometry (weight and height), and questions directly aimed at evaluating the perceived beneficiary satisfaction for various aspects of the FEAD program (taste, quality, variety of foods provided) to be evaluated in a three-point scale (low, average, or high satisfaction). The short version was used as a self-reported questionnaire and was distributed directly to the SPs (n = 3420).
The long version, which was used as a researcher-assisted questionnaire (n = 500), included additional questions aiming to quantify the monetary value of the food provision as perceived by the beneficiaries, and its contribution to the household budget. Namely, these questions were: How much would you spend for each food provision, in euros, if you were to purchase those items independently? How much would you spend for each provision of personal hygiene items, in euros, if you were to purchase those items independently? Toward which household expense will you allocate that money now (electricity bills, more food items, etc.)? It also included questions about the perceived impact of FEAD on quality of life. Such question communicated the perceived capacity of parents to provide their children with better foods, their perceived capacity to provide their children with a better diet overall, their improvement in feelings of anxiety and security since FEAD enrollment, and the perceived impact of FEAD enrollment on the household budget, to be evaluated in a three-point scale (low, average, or high impact).
Both questionnaires were pilot-tested for clarity and their use as a self-reported or a researcher-assisted tool by a convenience sample (n = 10) prior to data collection.
The socio-demographic variables recorded were gender, age, educational level measured by years of school, number of children, number of people living in the household, occupational status (in the following categories: employed, unemployed, retired, or homemaker). Marital status was categorized as single, married, divorced, or widowed. Bodyweight (in kilograms) and height (in meters) were recorded as self-reported values. Body mass index was then calculated as kg/m2. Overweight and obesity were defined as a body mass index of ≥25–<30 kg/m2 and ≥30 kg/m2, respectively.

3. Statistical Analysis

Descriptive statistics were used due to the nature of the study and the small sample size. All data are presented using mean values ± standard deviation (mean ± SD) for continuous variables and relative frequencies for categorical variables. A Chi-squared test was used to test for differences in Body Mass Index (BMI) category distribution among genders. Statistical significance was set at α = 5%. The IBM SPSS Statistics 23.0 statistical software package was used for all statistical analyses.

4. Results

4.1. Calculation of FEAD Food Provisions Delivered to Beneficiaries

4.1.1. Mapping of Food Items Delivered by Each FEAD Supply Chain

Overall, FEAD procured just 14 unique food items through the CSs—usually two food items per food group for fruits, vegetables, and dairy, with the exception of cereals and grains, which was populated solely by spaghetti, free sugars with just granulated sugar, and meats that included all three types of the most commonly consumed meats in Greece (beef, chicken, and pork) (Table 1). A slightly larger number of food items were procured through the DSs (n = 21).
As seen in Table 1, no overlap of food items was documented between the CSs and DSs, as was expected from the Operation Guide. However, SPs distributed foods mainly from the CSs and rarely utilized the option of procuring additional items through the DSs, as only 3–40% of the active SPs delivered items procured through that route, as opposed to 17–83% delivering foods procured through the CSs route. Similar findings were seen for the utilization of the option to deliver fresh food items as opposed to those with long shelf-lives. Only 3–43% of the SPs delivered fresh fruit and vegetables, with a preference toward fresh fruit, compared with 30–56% of SPs, who delivered canned fruit and vegetables or marmalade. The most commonly procured and delivered fresh food item was meat (43–78% of SPs; except turkey).
The top 10 most commonly delivered food items were, in declining order, spaghetti, beef, feta cheese, condensed milk, pork, beans, lentils, concentrated tomato juice, sugar, and olive oil, all procured through the CSs. The only food items procured from the CSs that were less commonly delivered to beneficiaries compared with foods procured through the DSs were fresh fruit and vegetables.

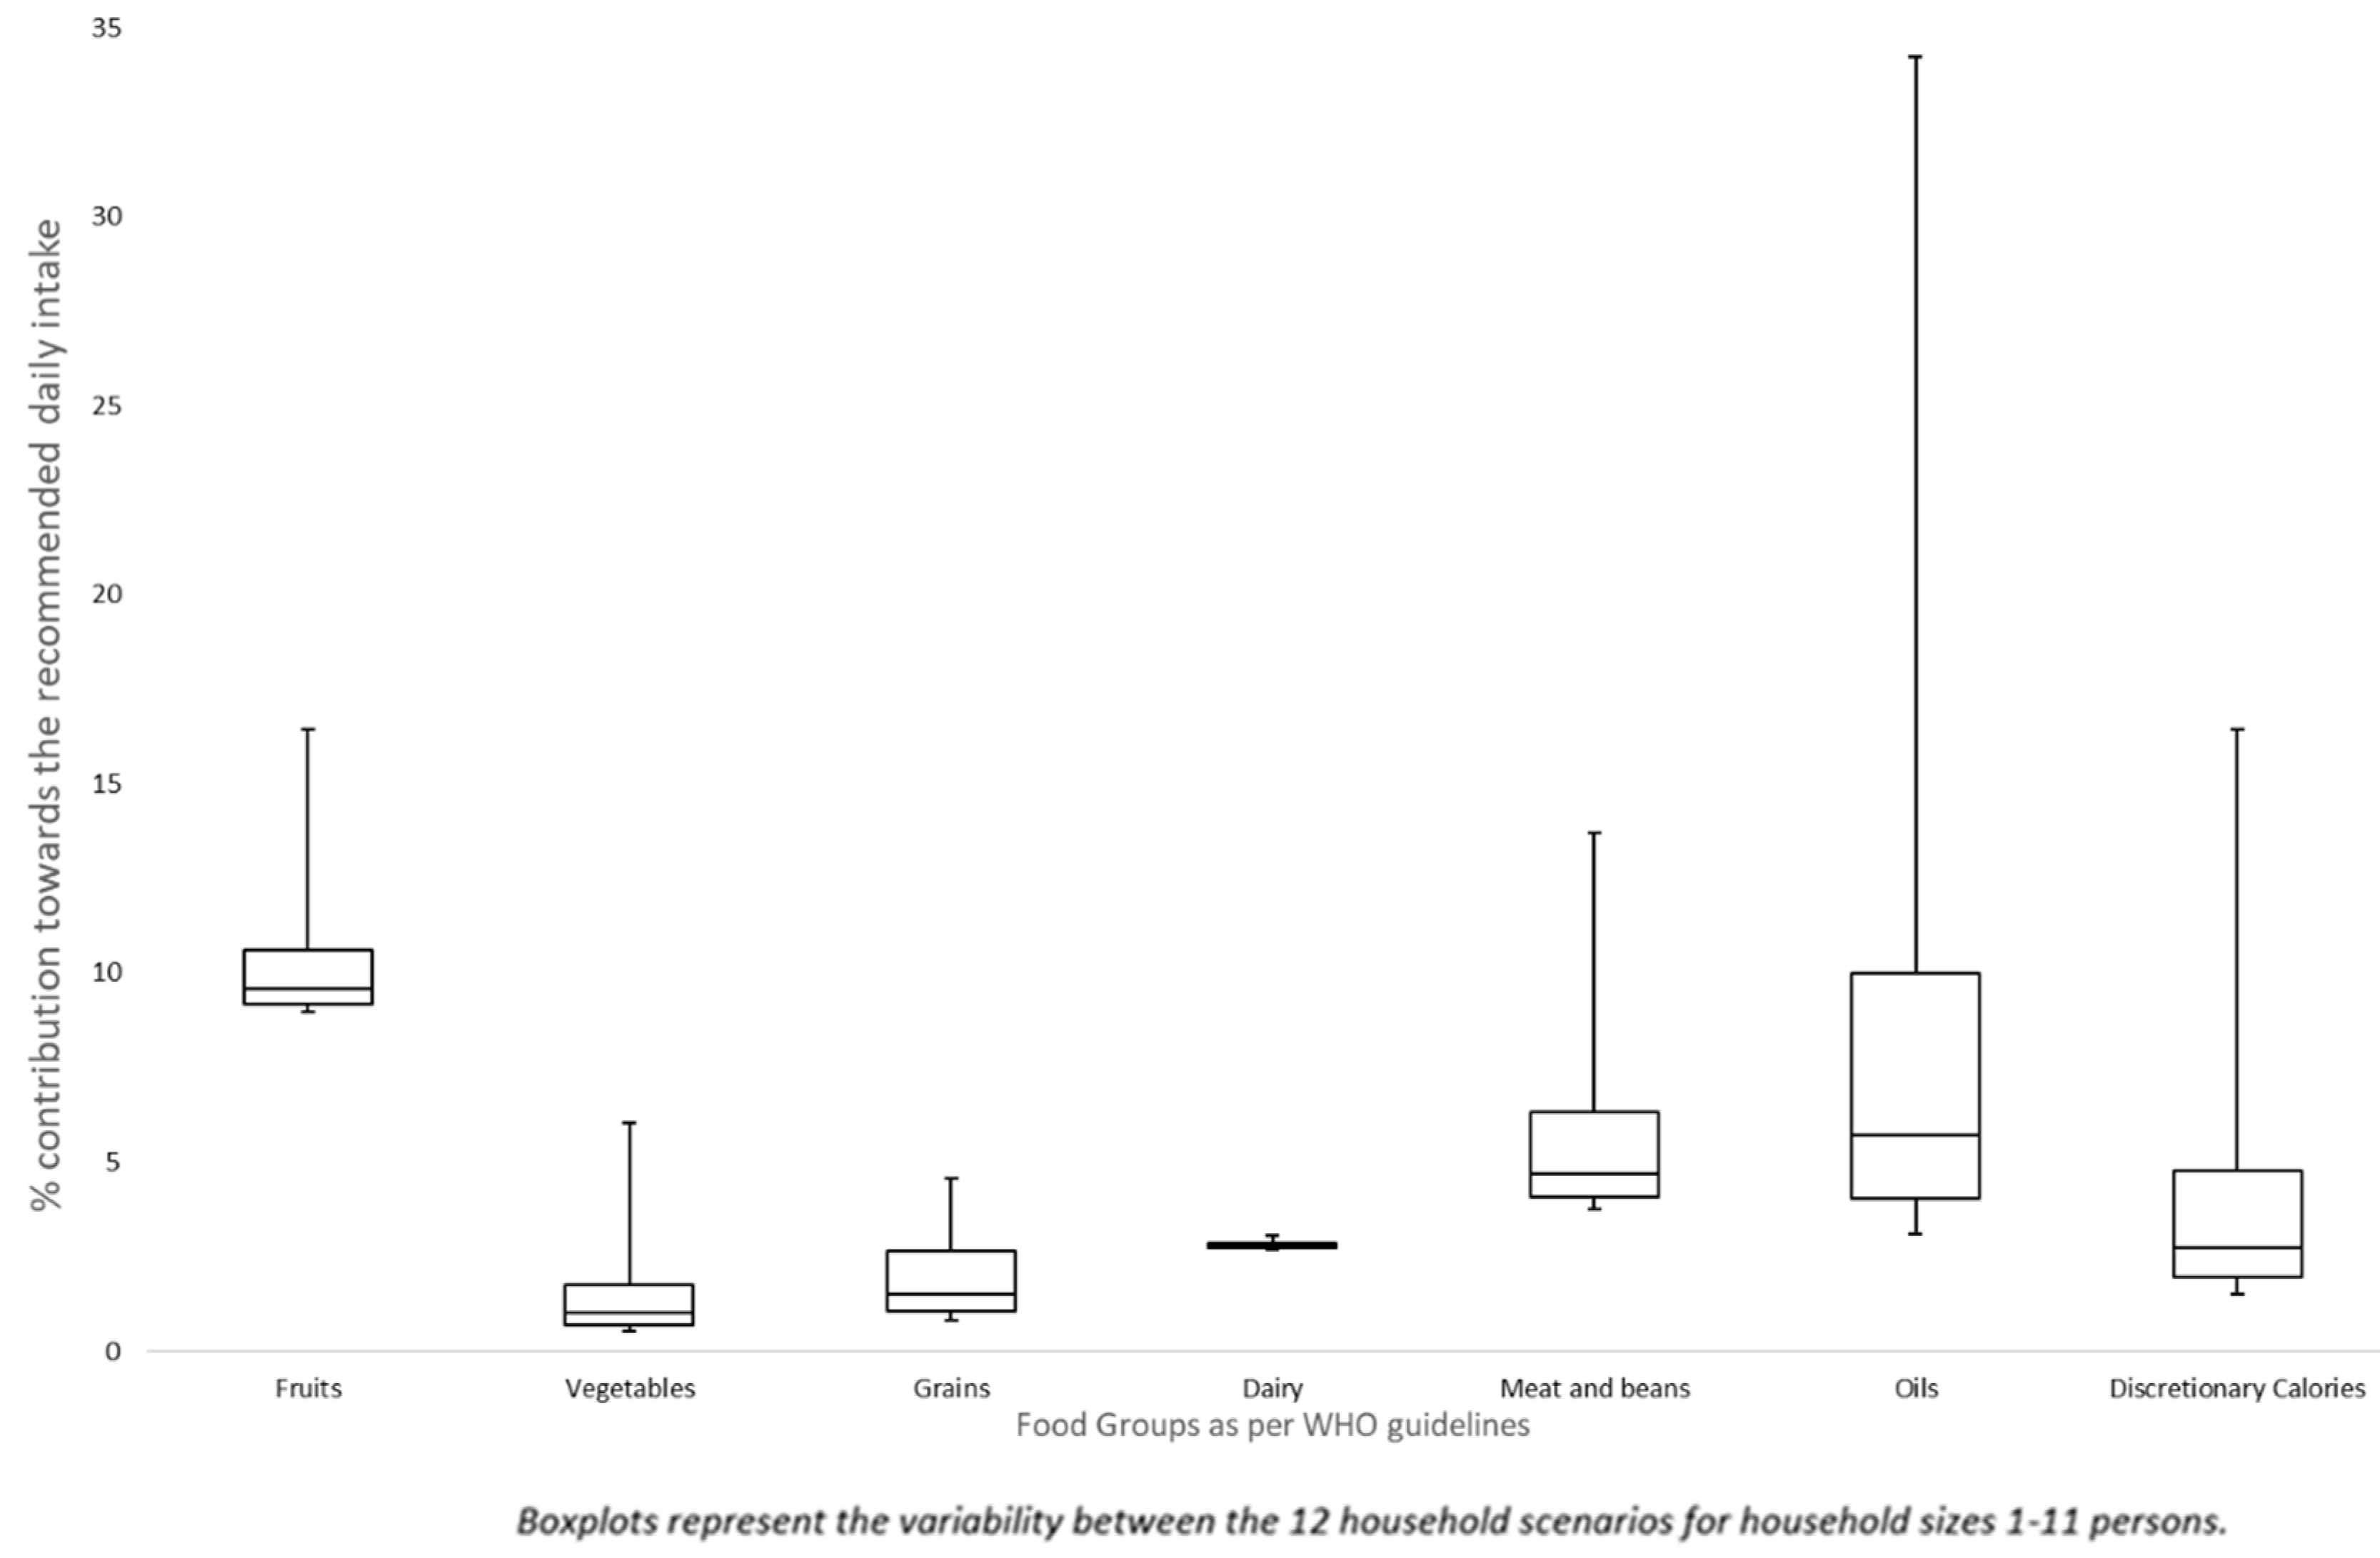
4.1.2. Contribution of Centralized Suppliers to Recommended Dietary Intake

The food items delivered through the CSs show the capacity to cover, on average, less than 13% of the recommended daily intake for all food groups (the mean value for all 12 household size scenarios) (Figure 2 and Appendix A Table A1). The analysis of the 12 different household size scenarios (1–11 household members) indicated great variability for the percent of the daily recommended intake covered per person according to the household size. The Operation Guide’s algorithm seems to favor applications for single adults, especially in the calculation of the oils provision. This favorable outcome is seen up to household sizes of four people, and then the algorithm calculates the same amount of food provision for all the rest of the household sizes (Figure 2). For example, the CSs contribution toward the recommended daily intake for vegetables ranged from 0.55% to 6.03%, for cereal from 0.83% to 4.57%, and for fruit from 8.97% to 16.44% (an 11-person household vs. a single-person household, respectively). The largest variability was observed in Oils and Free Sugars, with an 11-fold difference between the minimum and maximum contribution.

4.1.3. Contribution of Decentralized Suppliers to Recommended Dietary Intake

At the time of the analysis (the first year of FEAD implementation in Greece), only 23 of the 57 SPs opted to utilize the DSs (40% of all SPs). The most commonly procured food items were meats and dairy products procured through the DSs by all 23 active SPs, followed by oils and free sugars procured through the DSs by 16 SPs (69.56% of all active SPs for both). The degree of utilization of the DSs was variable even among the 23 active SPs, ranging from procurement of only meat and/or dairy products (n = 3) to those procuring food items that cover all seven food groups from the DSs (n = 10) (Appendix A Figure A1).
The variability in the utilization of the DSs as a supply chain is depicted in the DSs’ contribution toward the recommended intake of the seven food groups, as shown in Figure 3. The greatest variability was observed for fruits (a 42.46-fold difference between min and max contribution), followed by meat and cereal products with 19.25-fold and 15.67-fold differences between the min and max contributions. The smallest variability was seen in oils and vegetables, with 6.6-fold and 7.58-fold differences between the min and max contributions (Figure 3). Overall, the DSs showed a lower capacity to contribute toward achieving a recommended intake for all food groups, except for oils, compared with the CSs. The variability of the DSs (Figure 3) is explained as a net effect of the variability introduced by the FEAD algorithm (Figure 2), and the different degree of utilization of the DS route on a local level, as shown in Appendix A Figure A1.

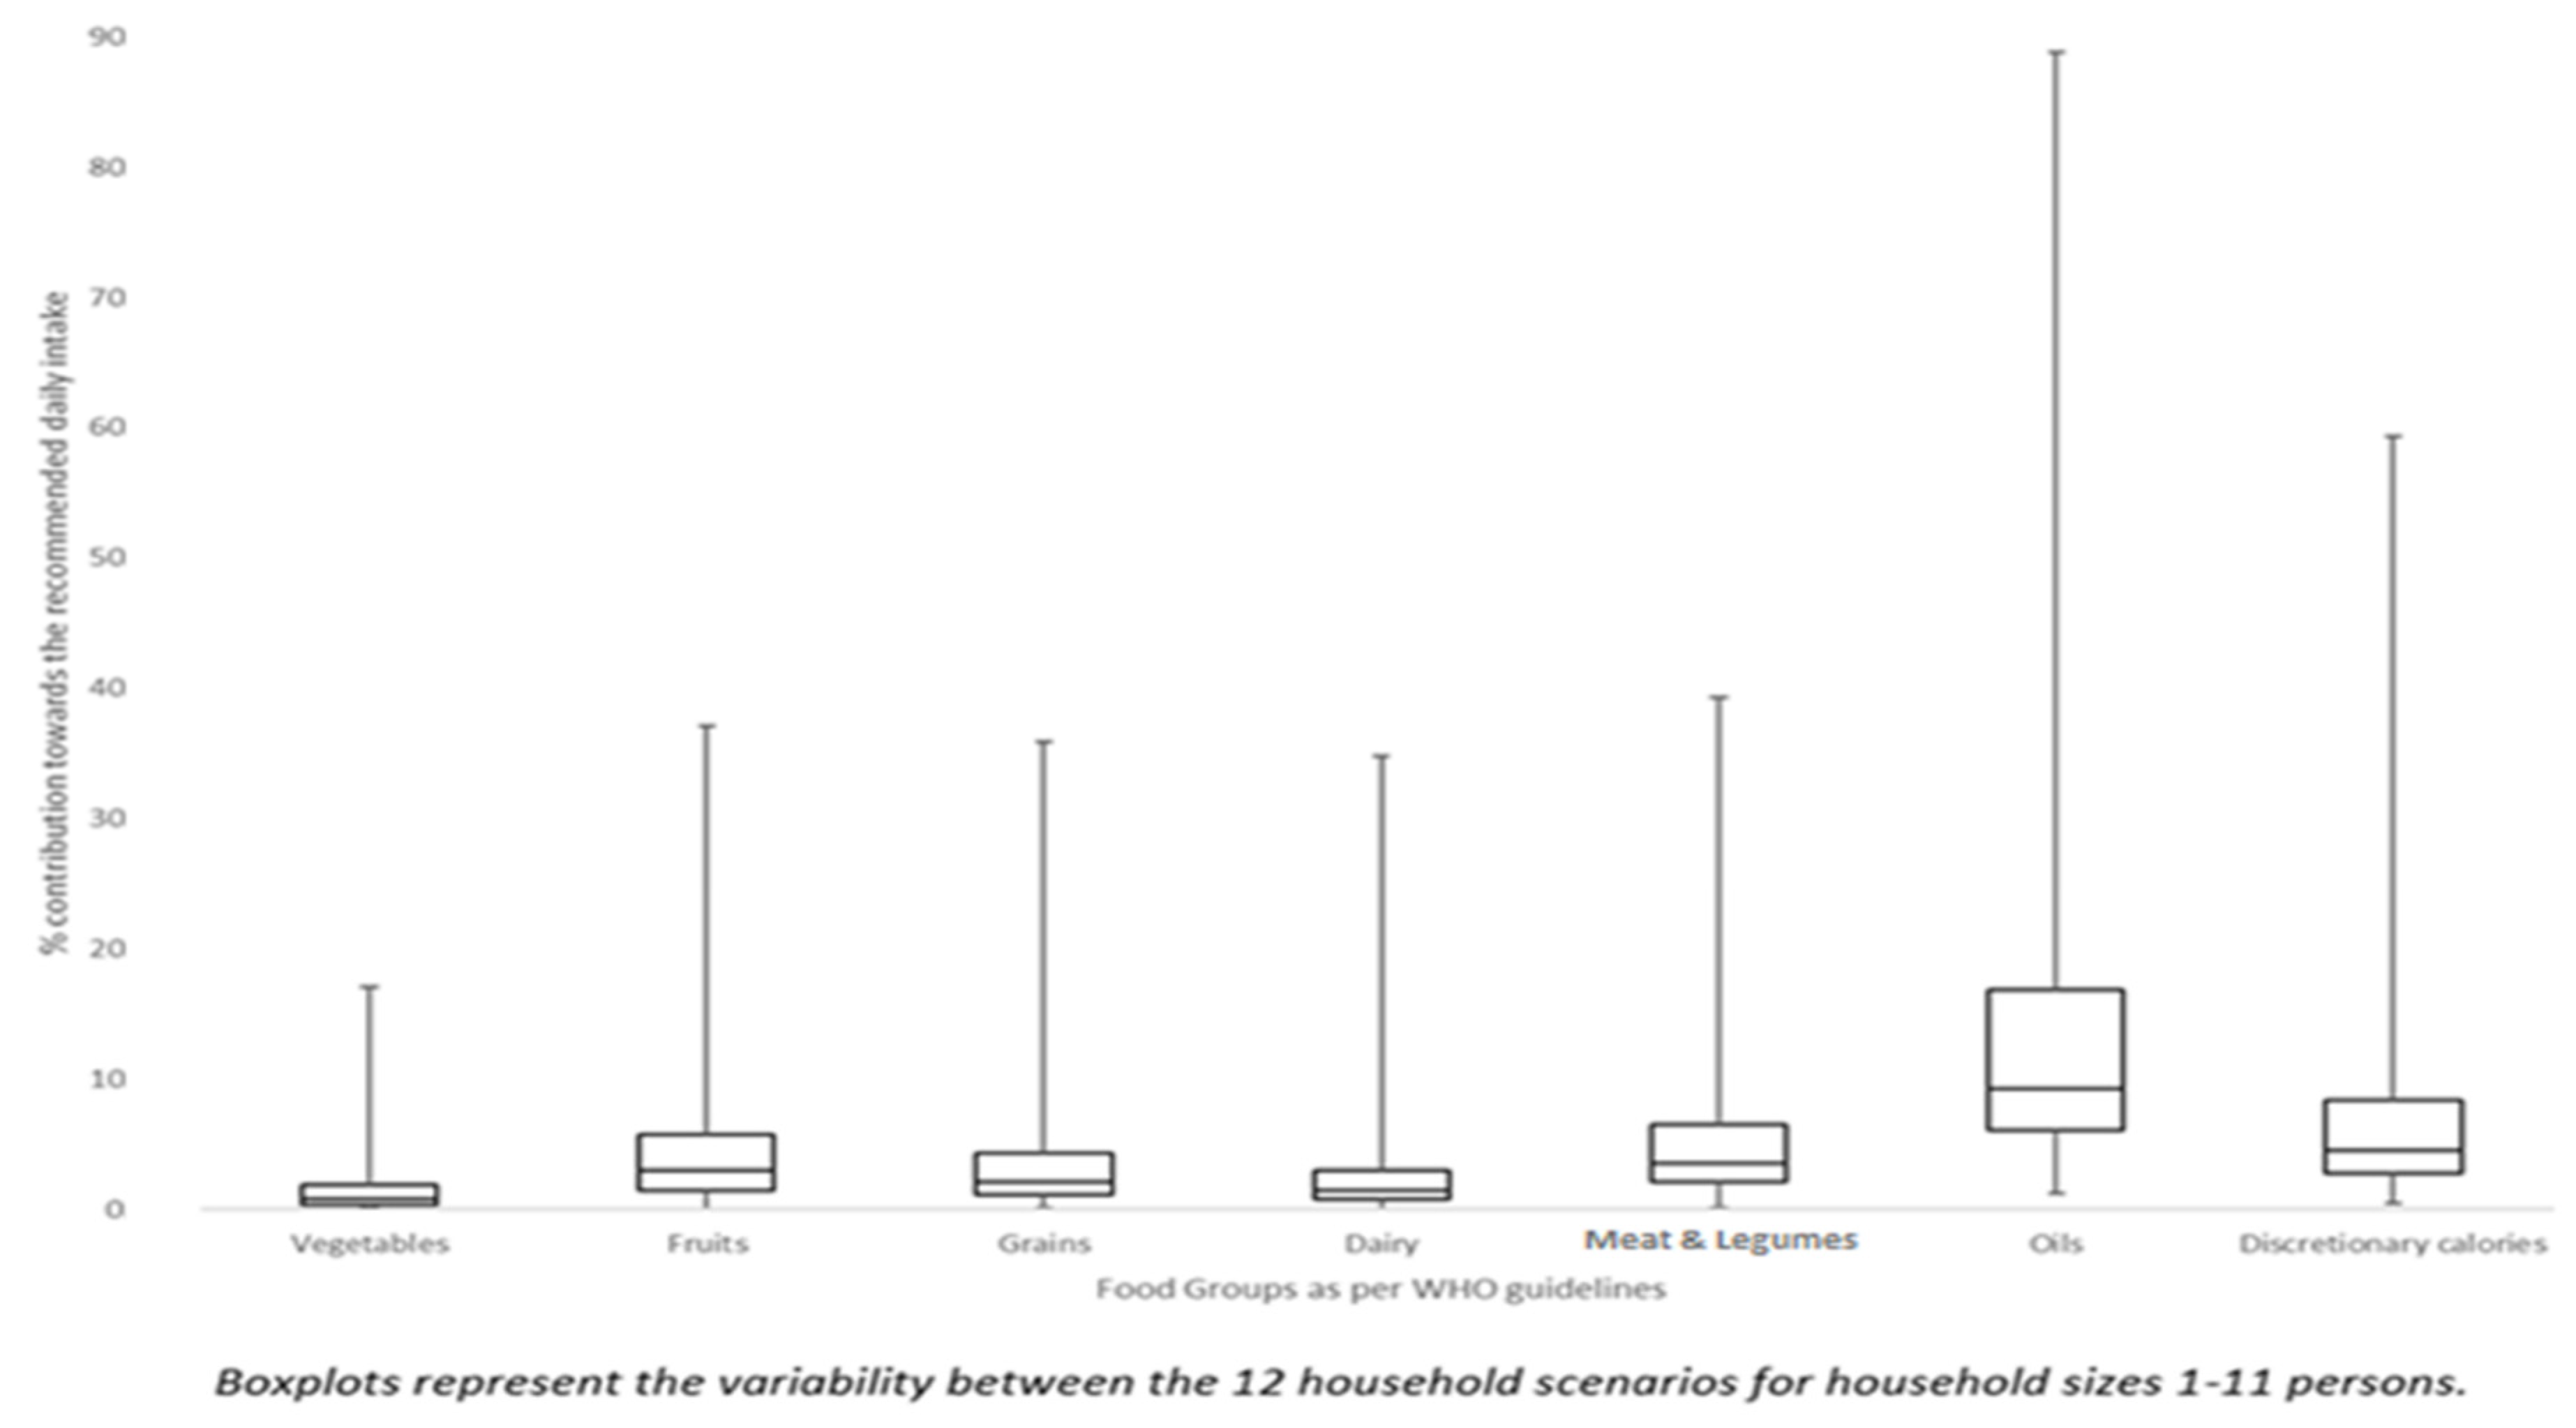
4.1.4. Total Contribution

The total nutritional contribution of the food provision provided by FEAD by both the CSs and DSs was calculated as the sum of the means for each Supply. The highest potential contribution toward the daily recommended intake was seen for oils (24.55%), fruits (15.37%), and free sugars (12.17%). A similar contribution to the daily needs for meats and substitutes was calculated (11.79%), while cereals, dairy, and vegetables all had calculated contributions below 10% of the daily needs, even below 5% for vegetables (data not shown).

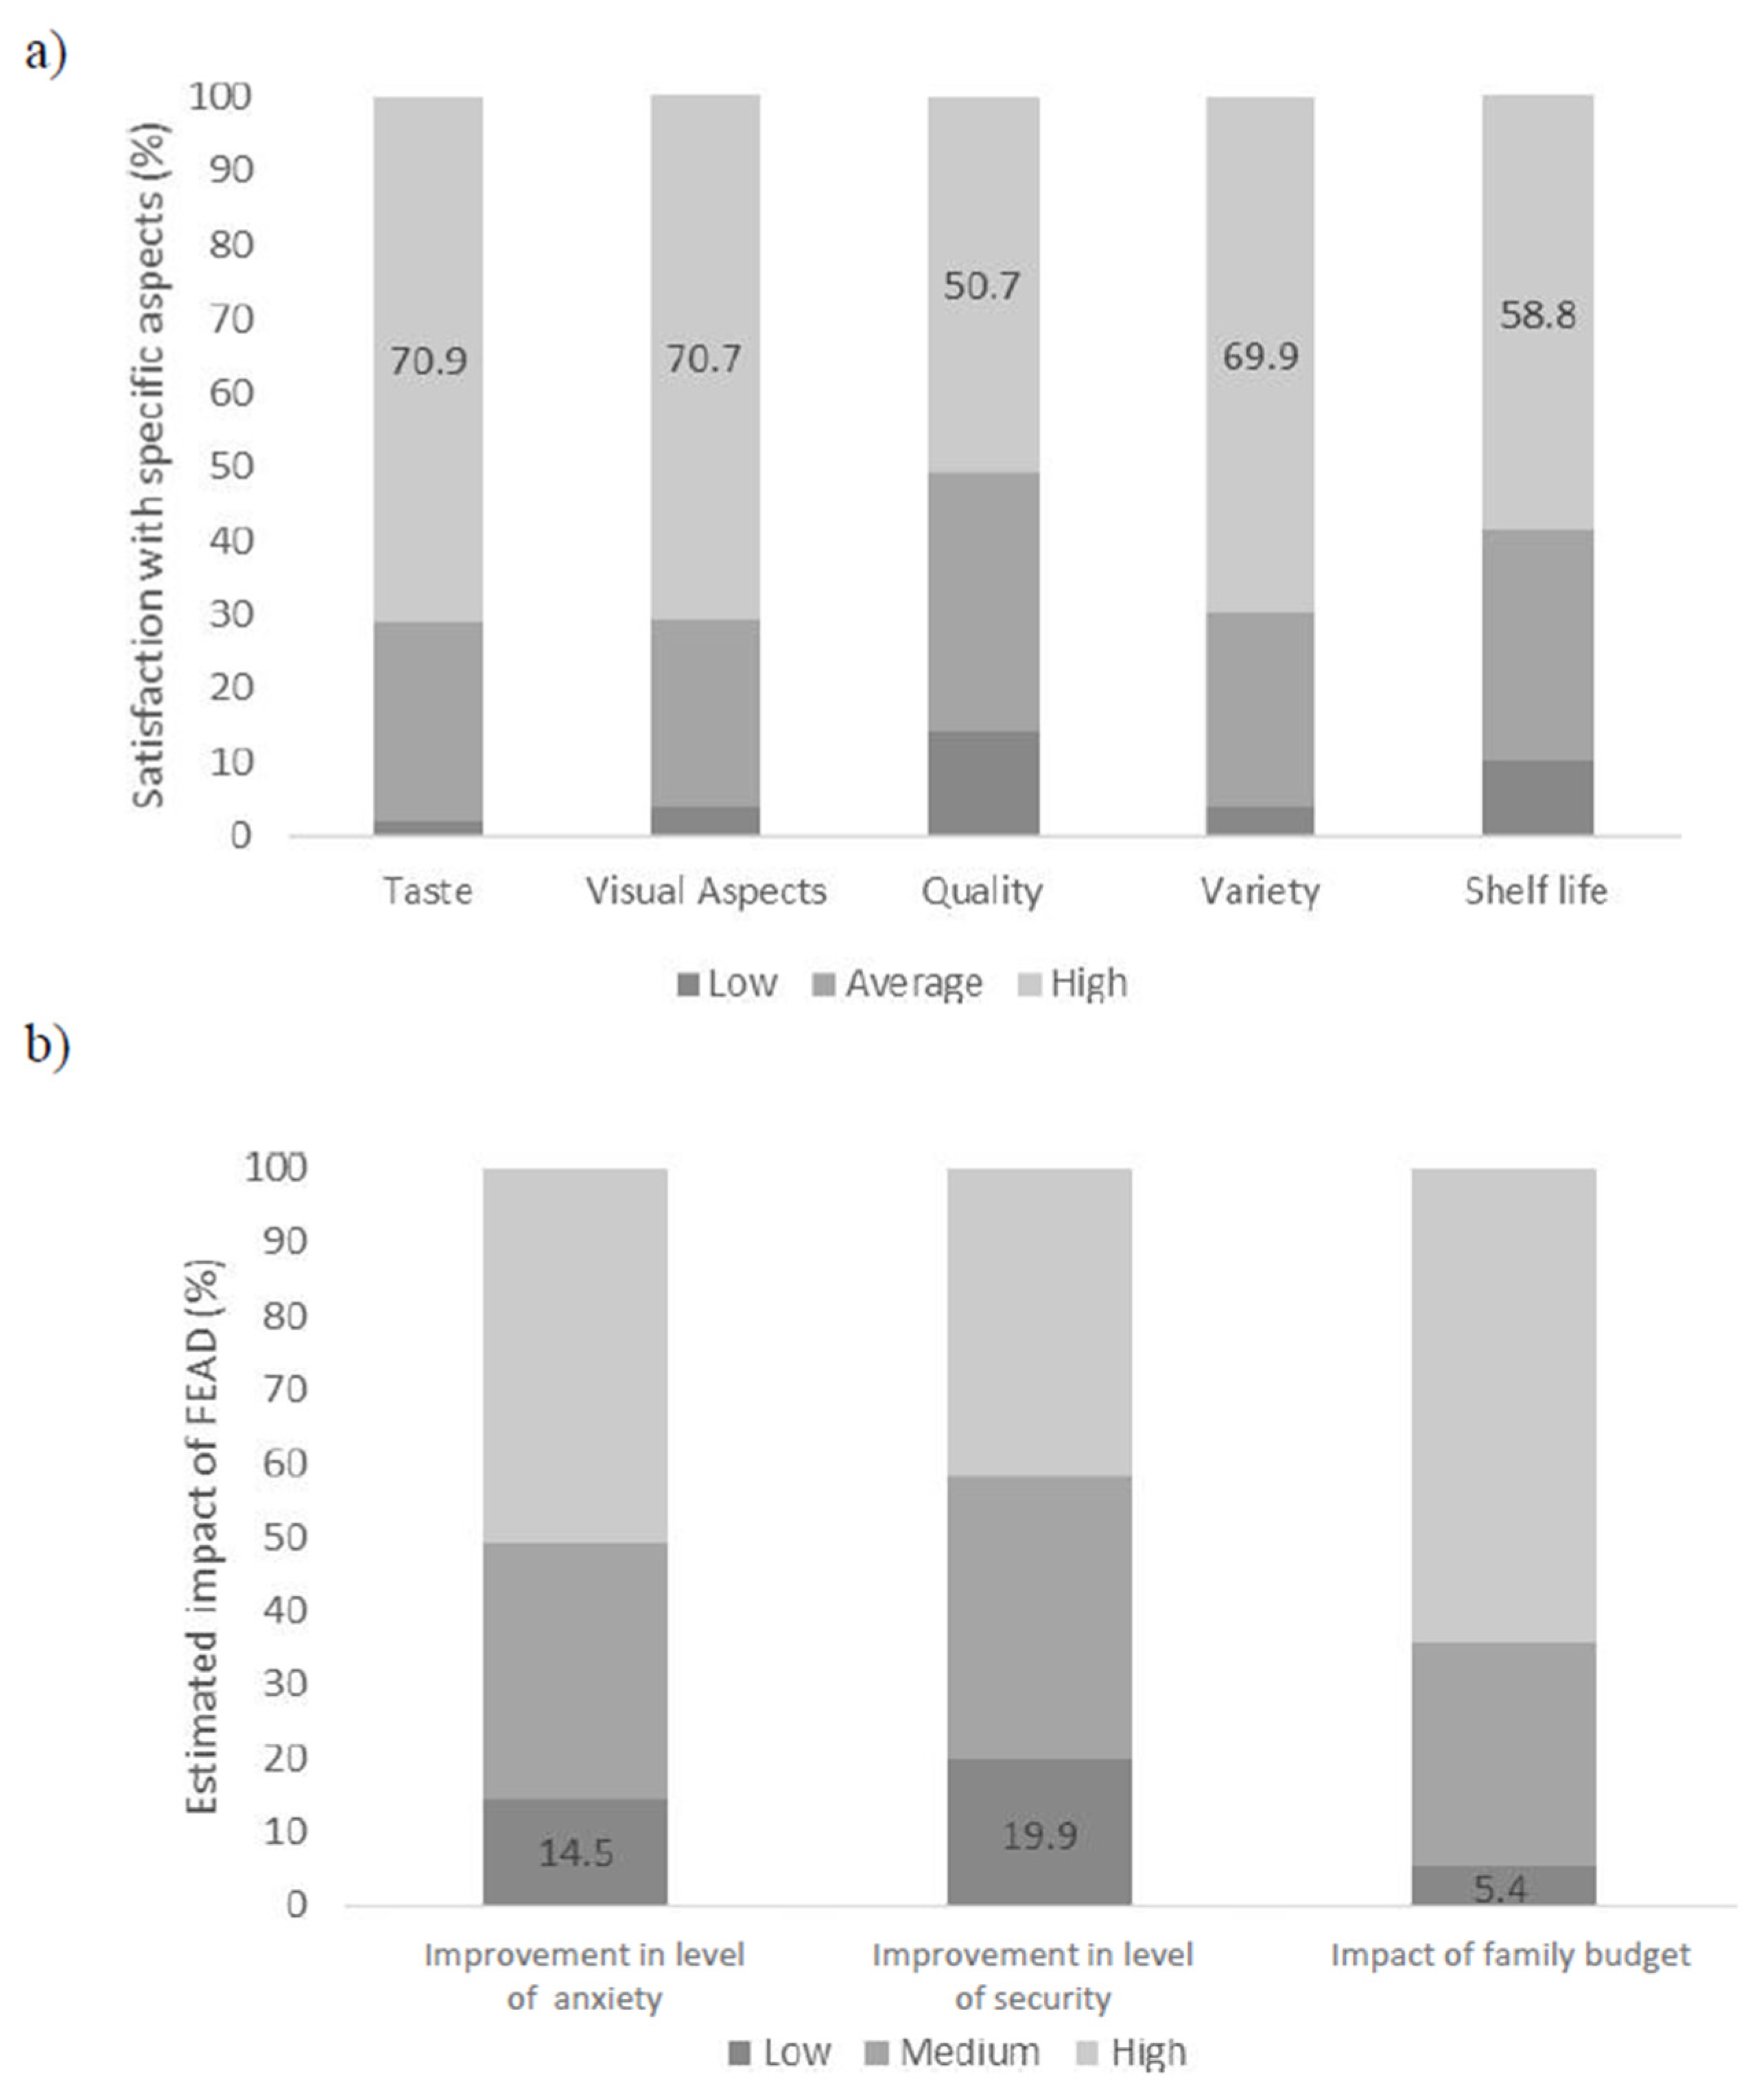
4.2. Beneficiaries’ Evaluation of the FEAD Program

From the 3420 questionnaires sent to the 57 SPs, 1518 were completed and returned (44.4% participation rate) while two SPs did not return any questionnaires. The participation rate is relative to the activity of the SPs and the intensity of their food provisions. The two SPs that did not provide any data were not active at the time of the study (they did not deliver any food provisions during the three months of the study). These questionnaires were analyzed together with the 500 questionnaires collected directly by researchers on site. The basic anthropometric, socio-demographic, and lifestyle characteristics of the FEAD recipients are presented in Table 2. Only 32.8% of the participants declared having received a delivery of personal hygiene items and for those, the average declared such deliveries 2.30 ± 9.6 times throughout their enrollment. As far as anthropometry is concerned, the prevalence of underweight participants was 2%, while the prevalence of overweight and obese participants were 40.7% and 18.6%, respectively. Men were more likely to have a BMI higher than 25 or 30, compared with women (p < 0.001 and p < 0.045 respectively), and vice versa for a BMI < 18.5 (p < 0.001; data not shown).
As shown in Figure 4a, the majority of FEAD participants, when asked to score the food provisions for taste, variety, and visual aspects, declared high satisfaction (~70%). Fewer participants indicated high satisfaction with the shelf life and quality of the foods provided (59% and 50.6%, respectively). Only 19.9% of the study participants declared that being enrolled in the FEAD program did not improve their feeling of security, and 14.5% declared no help with feeling less stressed (Figure 4b). Just 15% of the participants felt that FEAD did not help them provide their children with better quality food. Only 1.5% of the study participants felt that FEAD should be discontinued, but 20.3% would like for the program to continue with improvements.
Finally, in terms of the financial aspects of the FEAD program, 55.6 % of the participants felt that the program highly supported the family budget (Figure 4b), and when asked to estimate the cost of the items received by FEAD at each delivery, they estimated the average cost for food items to be 21.23 ± 23.4 euros, and 11.9 ± 12.2 euros for the personal hygiene items. The estimated cost of each food delivery per person was negatively associated with the number of people per application (Pearson r = −0.39, p < 0.001). A total of 44.6% of the participants said that the money saved from the FEAD deliveries would be spent toward utility bills, 25.1% would spend it toward rent, and 19.0% would invest it in further food purchases.

5. Discussion

The Fund for European Aid to the Most Deprived (FEAD) is a policy that has now entered its fourth year of implementation in Greece with the main purpose of providing material assistance to people living in the brick of poverty. This is the first attempt to assess the program’s potential to help its beneficiaries achieve a healthy diet and to report on their evaluation of the program.
Our analysis identified 35 individual food items, representing all seven recommended food groups as the items included in FEAD’s food provisions. As per the program’s set up, the CSs had a smaller variety of food items, representing staple foods items, and were the main supply chain used for all the SPs. On the other hand, the DSs procured a larger variety of items, especially for fruits, vegetables, and cereals but were less commonly used as a supply chain option.
From the food items analysis, it became evident that protein sources like meats, dairy, and legumes were the most commonly procured items, second only to pasta, and followed by the oils. Unfortunately, food items from the free sugar food groups were also commonly procured. The analysis of both the CSs and DSs showed that each supply separately contributes, on average, less than 10% of the recommended daily intake for each food. However, when accounted for together, the total contribution of FEAD can reach almost 25% of the needs for oils, 15% of the needs for fruit, and just above 10% for meats/substitutes and free sugars. The contribution toward food groups like vegetables, cereal, and dairy is particularly low at less than 10%, and even less than 5% for vegetables, which is a common finding in all analyses (total CSs and DSs). In order to bring these results into context, it is important to remember that, in its conception, FEAD was designed as a program to work alongside existing initiatives (school lunch programs, soup kitchens, etc.) in order to combat food insecurity, and not in isolation [5].
The evaluation of the FEAD program directly by its beneficiaries highlighted that despite the program’s relatively small contribution toward a healthy diet, the beneficiaries evaluate the program positively both in terms of the food items provided and its contribution toward the household budget. Based on the data collected, the beneficiaries estimated the financial support received by FEAD to be approximately 20 euros per delivery, which would account for roughly 120 euros per year based on the frequency of FEAD deliveries at the time of the study. Being entitled to FEAD is linked to the average monthly income of the household, which should be approximately <200 euros/month (a range of 125–200 euros/month according to household size) [21]; hence, FEAD contributes ~10% of the monthly income. FEAD participants showed high levels of satisfaction with the taste, variety, shelf life, and visual aspects of the foods provided and were less satisfied with the quality.
The results of this analysis are in line with previous reports identifying cereal, pasta, free sugars, and other non-perishable food items as the most common foods delivered from food banks, food pantries, and similar initiatives [26,27,28,29]. Data from the United States indicate that when given the choice, food bank users would show a preference toward such food items [28], while in other countries in Southeast Asia, there would be a mix of staples, long shelf-life items, and cooked food [30,31]. Previous reports on the nutritional quality of the foods provided by food pantries across the world showed that low provision of fruits, vegetables, and milk products, and a higher provision of meats and alternatives are common findings among food provision programs, and could be linked with the perishable nature of some of these products [32,33]. In the case of FEAD Greece, the perishable nature of meats was not an issue, as all meats (beef, pork, poultry, and lamb) were provided fresh; the same was not true for fish, which was not provided in any form (fresh or canned). This effect is also seen in previous reports analyzing the nutritional intake of food bank users, who are reported to largely fail to meet the recommended intake for fruits, vegetables, and dairy products [34,35,36,37]. An analysis of US food pantries highlighted that the low dietary quality of food pantries’ food provisions could be linked to their high reliance on charitable donations and food banks, as high nutritional-quality foods are provided mainly through the governmental Emergency Food Assistance Program (similar to FEAD) but which accounts only for 25% of the foods available in food pantries’ inventories [38]. Relative to similar programs in the United States (food pantries), with an estimated contribution of 25% in the beneficiaries’ monthly dietary intake, FEAD’s contribution could be evaluated as low, although direct comparisons are difficult due to methodological issues (estimation of monthly vs. daily dietary intakes) [39].
Quality issues have been previously reported as the main point of dissatisfaction among food bank users, however, FEAD participants were not as concerned about quality as much as food bank users, according to the literature [26,29,40]. A potential explanation for that could be that FEAD, unlike food banks, does not rely on charitable industry donations for its food procurement. This reliance on industry donation, despite promoting sustainability and reducing food waste, has been highlighted as a major drawback of food banks, especially when it is linked to enriching food donations with high-quality foods and fresh produce [29,41].
Although FEAD beneficiaries did not rate the nutritional quality of the food provisions negatively, the computational analysis showed that there is a need for improvement. FEAD could follow the example of existing food bank initiatives in the United States and adopt a number of policies that would improve the nutritional quality of the foods delivered [42,43]. The nutritional impact of FEAD would also be maximized by taking into account previous data highlighting that FEAD recipients in Greece still experience low energy and protein intake, and fail to meet the recommended intake for a number of food groups—especially fruits, vegetables, and fish [18]. In the case of fish, since it is not supplied by FEAD, all reported intakes would have been secured through different sources.
Alongside the high satisfaction on the food level, most participants responded positively when asked whether FEAD should be continued, with some requesting improvements, and the majority of the participants felt that the program did have an impact on improving their perceived sense of security, anxiety, and their concerns about providing their children with nutritious food. Additionally, despite assigning a relatively small monetary value to the foods provided by FEAD, the majority of the beneficiaries felt that it did have an impact on the household budget. This finding is common among similar initiatives and highlights the emotional value that having access to a structured food provision program has for this population [27,31]. All these findings, however, refer to the beneficiaries’ perceived impact of the FEAD program on their livelihood, dietary quality, and quality of life and do not assess “real” changes.
Despite the useful insights, this study is not free of limitations. The main limitations can be linked to the simulation analysis used to convert FEAD’s annual food provision entitlement to the food provision per beneficiary. The lack of real data for both the CSs and DSs per application linked to the application size and the true household size hinders the capacity to accurately estimate FEAD’s contribution to the diet of its beneficiaries, especially the lack of data for true household composition data on the number of children, older adults, pregnant or lactating women, people with disabilities, or, in general, any individual with special dietary requirements, reduces the accuracy of the estimation of FEAD’s contribution to the daily diet. However, this is a limitation mainly linked to foods provided by the DSs, and at the time of the study, this supply route was still underutilized. Moreover, although simulation analyses have been shown to be useful in estimating the potential of a proposed intervention/policy and to compare between policies and scenarios, the evaluation of a program’s effectiveness in lifting food insecurity would require direct population sampling before and after the intervention [44,45]. At the same time, it is important to highlight that, as FEAD is an ongoing program, it is important to treat these data as a reflection of the program at the time of the study. More longitudinal data on FEAD would greatly improve the capacity to evaluate the program’s implementation over time, and monitor potential changes through beneficiary feedback or improvements made by the FEAD managing authority and their impact on the beneficiary evaluation. Overall, the study highlights important short-term steps required to improve the program’s implementation and maximize its impact, but nonetheless, greater initiatives addressing the underlying causes of food insecurity should also be put in place in order to decrease dependency on governmental aid and promote societal prosperity [46].

6. Conclusions

FEAD is an example of the relatively new food policies in Europe aiming to address food insecurity, and this study is the first to highlight areas of improvement but also identify strong points in the program. In summary, the program seems to be well received by its beneficiaries to the extent that it scores better than existing food bank programs in the literature. A strong point for FEAD is its capacity to procure fresh foods instead of relying solely on food donations of non-perishable or low market value foods. However, the variety of the foods procured could be improved with a larger focus on fruits and vegetables. This could be achieved by greater utilization of the DSs and a better linkage with the school lunches program, which are both government-led initiatives. Another area of improvement would be an update of the Operational Guide with a focus on decreasing inequalities and providing a more linear relationship between household sizes, household needs (composition in vulnerable groups—children, pregnant/lactating women, etc.), and the amount of foods provided (currently the guide favors smaller households).

Author Contributions

A.V. and K.F. wrote the first draft of the manuscript. A.V. and K.F. collected and analyzed data. A.P., O.M., and D.X. designed the research protocol and methods. M.K. secured funding and supervised the team. All authors reviewed and commented on subsequent drafts of the manuscript. All authors have read and agreed to the published version of the manuscript.

Funding

This work was funded by the Ministry of Employment, Social Security, and Social Solidarity. The funding body had no involve-ment in the analysis and interpretation of the data.

Acknowledgments

In this section, you can acknowledge any support given which is not covered by the author contribution or funding sections. This may include administrative and technical support, or donations in kind (e.g., materials used for experiments).

Conflicts of Interest

The authors declare that they have no conflicts of interest.

Appendix A

Table A1. Percentage of the daily coverage per food group and person, depending on the number of members in an application (Centralized Supplies).
Percentage of the Daily Recommended Intake Covered per Food Group per Person
Number of Members per ApplicationFruits (%)Vegetables (%)Grains (%)Dairy (%)Meat and Legumes (%)Oils (%)Discretionary Calories (%)
116.446.034.573.0413.7034.2516.44
212.333.014.573.048.9917.128.22
310.962.013.042.916.8511.425.48
410.271.512.282.845.788.564.11
59.861.211.832.805.146.853.29
69.591.001.522.774.715.712.74
79.390.861.302.754.404.892.35
89.250.751.142.734.174.282.05
99.130.671.012.724.003.811.83
109.040.600.912.713.853.421.64
118.970.550.832.713.743.111.49
Figure A1. Average percentage of the daily contribution toward achieving the recommended intake per food group for each of the social partnerships.
Sustainability 13 00099 g0a1

References

  1. Food and Agriculture Organization of the United Nations. Declaration of the World Summit on Food Security. World Food Summit. 2009. Available online: www.fao.org (accessed on 22 December 2020).
  2. Vilar-Compte, M.; Sandoval-Olascoaga, S.; Bernal-Stuart, A.; Shimoga, S.; Vargas-Bustamante, A. The impact of the 2008 financial crisis on food security and food expenditures in Mexico: A disproportionate effect on the vulnerable. Public Health Nutr. 2015, 18, 2934. [Google Scholar] [CrossRef] [Green Version]
  3. Von Braun, J. Food and Financial Crises: Implications for Agriculture and the Poor; International Food Policy Research Institute: Washington, DC, USA, 2008. [Google Scholar]
  4. Nawrotzki, R.J.; Robson, K.; Gutilla, M.J.; Hunter, L.M.; Twine, W.; Norlund, P. Exploring the impact of the 2008 global food crisis on food security among vulnerable households in rural South Africa. Food Secur. 2014, 6, 283–297. [Google Scholar] [CrossRef] [Green Version]
  5. Metis, G. FEAD Mid-Term Evaluation, Interim Report; European Commision, Directorate General for Employment, Social Affairs and Inclusion: Brussels, Belgium, 2018. [Google Scholar]
  6. Loopstra, R.; Reeves, A.; Stuckler, D. Rising food insecurity in Europe. Lancet 2015, 385, 2041. [Google Scholar] [CrossRef]
  7. Swinnen, J.; van Herck, K. Food Security: Challenges and Opportunities for Eastern Europe and Central Asia. Asian J. Agric. Dev. 2012, 9, 1–16. [Google Scholar]
  8. Food and Agriculture Organization of the United Nations; International Fund for Agricultural Development; UNICEF; World Food Program; World Health Organization. The State of Food Security and Nutrition in the World 2018; FAO: Rome, Italy, 2018. [Google Scholar]
  9. Food and Agriculture Organization of the United Nations; International Fund for Agricultural Development; UNICEF; World Food Program; World Health Organization. The State of Food Security and Nutrition in the World 2019; Safeguarding against Economic Slowdowns and Downturns; FAO: Rome, Italy, 2019. [Google Scholar]
  10. Gundersen, C. Food Insecurity Is an Ongoing National Concern. Adv Nutr. 2013, 4, 36–41. [Google Scholar] [CrossRef] [Green Version]
  11. Garratt, E. Food insecurity in Europe: Who is at risk, and how successful are social benefits in protecting against food insecurity? J. Soc. Policy 2019, 49, 1–25. [Google Scholar] [CrossRef] [Green Version]
  12. World Health Organization. Healthy Diet. Media Cent [Internet]. 2015, pp. 1–6. Available online: http://www.who.int/mediacentre/factsheets/fs394/en/ (accessed on 22 December 2020).
  13. Karanikolos, M.; Mladovsky, P.; Cylus, J.; Thomson, S.; Basu, S.; Stuckler, D.; MacKenbach, J.P.; McKee, M. Financial crisis, austerity, and health in Europe. Lancet 2013, 381, 1323–1331. [Google Scholar] [CrossRef]
  14. Eurostat. Regional Yearbook 2017 Edition; Eurostat: Luxembourg, 2017. [Google Scholar]
  15. Tyrovolas, S.; Kassebaum, N.J.; Stergachis, A.; Abraha, H.N.; Alla, F.; Androudi, S.; Car, M.; Chrepa, V.; Fullman, N.; Fürst, T.; et al. The burden of disease in Greece, health loss, risk factors, and health financing, 2000–2016: An analysis of the Global Burden of Disease Study 2016. Lancet Public Health 2018, 3, e395–e406. [Google Scholar] [CrossRef] [Green Version]
  16. Kleanthous, K.; Dermitzaki, E.; Papadimitriou, D.T.; Papaevangelou, V.; Papadimitriou, A. Overweight and obesity decreased in Greek schoolchildren from 2009 to 2012 during the early phase of the economic crisis. Acta Paediatr. 2016, 105, 200–205. [Google Scholar] [CrossRef]
  17. Tambalis, K.D.; Panagiotakos, D.B.; Psarra, G.; Sidossis, L.S. Current data in Greek children indicate decreasing trends of obesity in the transition from childhood to adolescence; Results from the National Action for Children’s Health (EYZHN) program. J. Prev. Med. Hyg. 2018, 59, E36–E47. [Google Scholar]
  18. Chatzivagia, E.; Pepa, A.; Vlassopoulos, A.; Kapsokefalou, M.; Malisova, O.; Filippou, K. Nutrition transition in the post-economic crisis of Greece: Assessing the nutritional gap of food-insecure individuals. A cross-sectional study. Nutrients 2019, 11, 2914. [Google Scholar] [CrossRef] [Green Version]
  19. Theodoridis, X.; Grammatikopoulou, M.G.; Gkiouras, K.; Papadopoulou, S.E.; Agorastou, T.; Gkika, I.; Maraki, M.; Dardavessis, T.; Chourdakis, M. Food insecurity and Mediterranean diet adherence among Greek university students. Nutr. Metab. Cardiovasc. Dis. 2018, 28, 477–485. [Google Scholar] [CrossRef]
  20. United Nations General Assembly. Transforming Our World: The 2030 Agenda for Sustainable Development. 2015, pp. 1–5. Available online: https://sustainabledevelopment.un.org/content/documents/7891Transforming (accessed on 22 December 2020).
  21. FEAD Greece Managing Authority. Implementation Guide for the Operational Programme I Food and Basic Material Assistance from FEAD, 2nd ed.; FEAD Greece Managing Authority, 2015; Available online: http://teba.eiead.gr/?lang=en (accessed on 9 December 2020).
  22. WHO Regional Office for Europe. Better Food and Nutrition in Europe: Progress Report. 2018. Available online: http://www.euro.who.int/en/health-topics/disease-prevention/nutrition/publications/2018/better-food-and-nutrition-in-europe-progress-report-2018 (accessed on 22 December 2020).
  23. European Commission. Regulation (EU) No 223/2014 of the European Parliament and of the Council of 11 March 2014 on the Fund for European Aid to the Most Deprived. Off. J. Eur. Union. 2012, 57, 10. [Google Scholar]
  24. Lawson, L.; Quick, V.; Taylor, M.; Kapsokefalou, M.; Kotsiow, P.; Rao, S.; Schoolman, E. Food Aid and the Emergency Food System in Greece. June 2017. Available online: http://agriurban.rutgers.edu/Documents/Greek_report.pdf (accessed on 3 April 2020).
  25. World Health Organisation. Promoting a healthy diet for the WHO Eastern Mediterranean Region: User-friendly guide; World Health Organisation: Geneva, Switzerland, 2012; 41p. [Google Scholar]
  26. Cotugna, N.; Vickery, C.E.; Glick, M. An outcome evaluation of a food bank program. J. Am. Diet. Assoc. 1994, 94, 888–890. [Google Scholar] [CrossRef]
  27. Wang, K.Y.-T.; Lyu, L.-C. The emergence of food bank/voucher programs in Taiwan: A new measure for combating poverty and food insecurity? Asia Pac. J. Soc. Work Dev. 2013, 23, 48–58. [Google Scholar] [CrossRef]
  28. Whiteman, E.D.; Chrisinger, B.W.; Hillier, A. Diet Quality Over the Monthly Supplemental Nutrition Assistance Program Cycle. Am. J. Prev. Med. 2018, 55, 205–212. [Google Scholar] [CrossRef]
  29. Teron, A.C.; Tarasuk, V.S. Charitable Food Assistance: What are Food Bank Users Receiving? Can. J. Public Health 1999, 90, 382–384. Available online: http://0-www-jstor-org.brum.beds.ac.uk/stable/41994160 (accessed on 22 December 2020). [CrossRef]
  30. Kang, S.; Hong, M.; Yang, I.; Jo, M.; Kim, C. Analysis on the Characteristics of Government-dominant and Non-governmental Food Bank Programs from the Users’ Perspective. Korean J. Community Nutr. 2005, 10, 224–233. [Google Scholar]
  31. Kang, S.; Yang, I.; Lee, Y. Investigation of the Conditions and Evaluation of the Benefits of the Foodbank Program from the Recipients’ Perspective. Korean J. Community Nutr. 2003, 8, 231–239. [Google Scholar]
  32. Simmet, A.; Depa, J.; Tinnemann, P.; Stroebele-Benschop, N. The Dietary Quality of Food Pantry Users: A Systematic Review of Existing Literature. J. Acad. Nutr. Diet. 2017, 117, 563–576. [Google Scholar] [CrossRef]
  33. Bazerghi, C.; McKay, F.H.; Dunn, M. The Role of Food Banks in Addressing Food Insecurity: A Systematic Review. J. Community Health 2016, 41, 732–740. [Google Scholar] [CrossRef]
  34. Castetbon, K.; Méjean, C.; Deschamps, V.; Bellin-Lestienne, C.; Oleko, A.; Darmon, N.; Hercberg, S. Dietary behaviour and nutritional status in underprivileged people using food aid (ABENA study, 2004–2005). J. Hum. Nutr. Diet. 2011, 24, 560–571. [Google Scholar] [CrossRef]
  35. Robaina, K.A.; Martin, K.S. Food Insecurity, Poor Diet Quality, and Obesity among Food Pantry Participants in Hartford, CT. J. Nutr. Educ. Behav. 2013, 45, 159–164. [Google Scholar] [CrossRef]
  36. Depa, J.; Hilzendegen, C.; Tinnemann, P.; Stroebele-Benschop, N. An explorative cross-sectional study examining self-reported health and nutritional status of disadvantaged people using food banks in Germany. Int. J. Equity Health 2015, 14, 141. [Google Scholar] [CrossRef] [Green Version]
  37. Neter, J.E.; Dijkstra, S.C.; Visser, M.; Brouwer, I.A. Dutch food bank parcels do not meet nutritional guidelines for a healthy diet. Br. J. Nutr. 2016, 116, 526–533. [Google Scholar] [CrossRef] [Green Version]
  38. Zimmerman, T.; Sun, B.; Dixit-Joshi, S. Nutrient and Food Group Analysis of USDA Foods in Five of Its Food and Nutrition Programs—2014; USDA-FNS: Washington, DC, USA, 2016. [Google Scholar]
  39. Verpy, H.; Smith, C.; Riecks, M. Attitudes and behaviors of food donors and perceived needs and wants of food shelf clients. J. Nutr. Educ. Behav. 2003, 35, 6–15. [Google Scholar] [CrossRef]
  40. Azurdia, A.X.; Lecompte, E.; Sibbald, E. Bon Appétit! A Process Evaluation of a Campus-Based Food Bank. J. Hunger. Environ. Nutr. 2011, 6, 324–342. Available online: http://0-www-tandfonline-com.brum.beds.ac.uk/doi/abs/10.1080/19320248.2011.597834 (accessed on 1 March 2020). [CrossRef]
  41. Tarasuk, V.; Eakin, J.M. Food assistance through “surplus” food: Insights from an ethnographic study of food bank work. Agric. Hum. Values 2005, 22, 177–186. [Google Scholar] [CrossRef]
  42. Seidel, M.; Laquatra, I.; Woods, M.; Sharrard, J. Applying a Nutrient-Rich Foods Index Algorithm to Address Nutrient Content of Food Bank Food. J. Acad. Nutr. Diet. 2015, 115, 695–700. [Google Scholar] [CrossRef]
  43. Campbell, E.C.; Ross, M.; Webb, K.L. Improving the Nutritional Quality of Emergency Food: A Study of Food Bank Organizational Culture, Capacity, and Practices. J. Hunger. Environ. Nutr. 2013, 8, 261–280. Available online: http://0-www-tandfonline-com.brum.beds.ac.uk/doi/abs/10.1080/19320248.2013.816991 (accessed on 1 March 2020). [CrossRef]
  44. Grieger, J.A.; Johnson, B.J.; Wycherley, T.P.; Golley, R.K. Evaluation of Simulation Models that Estimate the Effect of Dietary Strategies on Nutritional Intake: A Systematic Review. J. Nutr. 2017, 147, 908–931. [Google Scholar] [CrossRef] [Green Version]
  45. Pearson-Stuttard, J.; Bandosz, P.; Rehm, C.D.; Penalvo, J.; Whitsel, L.; Gaziano, T.; Conrad, Z.; Wilde, P.; Micha, R.; Lloyd-Williams, F.; et al. Reducing US cardiovascular disease burden and disparities through national and targeted dietary policies: A modelling study. PLoS Med. 2017, 14, e1002311. [Google Scholar] [CrossRef]
  46. Ibok, O.W.; Osbahr, H.; Srinivasan, C. Advancing a new index for measuring household vulnerability to food insecurity. Food Policy 2019, 84, 10–20. [Google Scholar] [CrossRef]
Figure 1. Schematic illustration of the methodology used to calculate the contribution of foods distributed from Centralized Suppliers in the diet (% of recommended intake).
Sustainability 13 00099 g001
Figure 2. Contribution of FEAD’s Centralized Suppliers toward achieving the recommended daily intake for the seven WHO food groups.
Sustainability 13 00099 g002
Figure 3. Contribution of FEAD’s Decentralized Suppliers toward achieving the recommended daily intake for the seven WHO food groups.
Sustainability 13 00099 g003
Figure 4. (a) Participant-declared satisfaction by the taste, quality, shelf life, variety, and other visual aspects of the FEAD provided food items, (b) Participant-declared impact of FEAD on improvement in the feeling of anxiety and security, and impact on household income after FEAD enrollment.
Sustainability 13 00099 g004
Table 1. List of Foods procured by the Centralized and Decentralized Suppliers of FEAD and the proportion of the Social Partnerships who included those foods available in their food provisions.
Foods Procured by the Centralized SuppliersSocial Partnerships That Distributed These Foods (%)Foods Procured by the Decentralized Suppliers Social Partnerships That Distributed These Foods (%)
FruitsOranges35%Kiwi4%
Peach4%
Apples39%Canned Fruit30%
Marmalade30%
VegetablesCabbage17%Carrot4%
Zucchini9%
Tomato Juice Concentrate56%Tomato4%
Eggplant4%
Onion4%
Cereals & StarchSpaghetti83%Rice39%
Flour40%
Cornflakes26%
Potato17%
Melba Toast4%
DairyFeta Cheese70%Hard Cheese39%
Condensed Milk70%
Meat & LegumesFresh Chicken43%Fresh Turkey4%
Fresh Boneless Pork70%Chicken Soup26%
Fresh Boneless Beef78%
White Dry Beans70%
Lentils65%
Fats & OilsOlive Oil48%Margarine4%
Sunflower Oil26%
Olives26%
Free SugarsSugar52%Honey30%
Table 2. Descriptive statistics of the study population.
Total
(n = 1891)
Female (%)52.2
Age (years)48.1 ± 12.7
Education (years)9.90 ± 6.0
Children (#)2.02 ± 1.9
Household size (# people)2.87 ± 1.6
Currently married (%)47.7
Currently employed (%)13.4
Duration of FEAD enrollment (months)12.74 ± 8.4
Beneficiaries per application (#)2.55 ± 1.6
Food deliveries received (#)3.54 ± 4.3
Personal hygiene item deliveries received (#)2.30 ± 9.6
Publisher’s Note: MDPI stays neutral with regard to jurisdictional claims in published maps and institutional affiliations.

