
Source Apportionment of Inorganic Solutes in Surface Waters of Lake Baikal Watershed

1
Limnological Institute of Siberian Branch of Russian Academy of Sciences, Ulan-Batorskaya St. 3, 664033 Irkutsk, Russia
2
V.B. Sochava Institute of Geography of Siberian Branch of Russian Academy of Sciences, Ulan-Batorskaya St. 1, 664033 Irkutsk, Russia
3
Department of Chemistry and Food Technology, Institute of High Technologies, Irkutsk National Research Technical University, Lermontov St. 83, 664074 Irkutsk, Russia
*
Author to whom correspondence should be addressed.
Sustainability 2021, 13(10), 5389; https://0-doi-org.brum.beds.ac.uk/10.3390/su13105389
Submission received: 3 April 2021
/
Revised: 2 May 2021
/
Accepted: 8 May 2021
/
Published: 12 May 2021
(This article belongs to the Special Issue Water Quality: Current State and Future Trends)
Abstract
:The aim of this study was to obtain a detailed picture of the origin of the anthropogenic and natural inorganic solutes in the surface waters of the Lake Baikal watershed using limited data on solute sources. To reveal the origin of solutes, the chemical composition of water was considered as a mixture of solutes from different sources such as rocks and anthropogenic wastes. The end-member mixing approach (EMMA), based on the observation that the element ratios in water uncorrelated with one another are those that exhibit differences in values across the different types of rocks and anthropogenic wastes, was used for source apportionment. According to the results of correlation analysis, two tracers of sources of most abundant ions present in riverine waters were selected. The first tracer was the ratio of combined concentration of calcium and magnesium ions to concentration of potassium ion ((Ca2+ + Mg2+)/K+), and the second tracer was the ratio of sulfate and bicarbonate ion concentrations (SO42−/HCO3−). Using these tracers, three sources of main ions in water, such as sulfide-bearing silicate rocks, non-sulfide silicate rocks and carbonate rocks, were apportioned. The results of cluster analysis showed the possibility of using the ratios of strontium, iron, manganese, molybdenum, nickel, and vanadium concentrations (Sr/Fe, Sr/Mn, Ni/V, Mo/V) as tracers of the trace element sources. The use of these tracers and the obtained data on sources of main ions showed the possibility of identifying the natural trace element sources and distinguishing between natural and anthropogenic trace element sources.
1. Introduction
The problem of determining the origin of solutes in surface waters is the lack of data on its possible sources. In particular, the problem of pollutant sources identification is the lack or absence of emission composition data [1] called source profiles. Without data on source profiles, the source identification is impossible, because the essence of identification is to compare the ratios of pollutant concentrations in the source emission called source tracers with those in water. The lack of the data on source profiles is particularly important for Lake Baikal area. The only tracers ever used for source apportionment of solutes in the surface waters of the Lake Baikal watershed were polycyclic aromatic hydrocarbons (PAHs). The choice of PAHs as source tracers was solely conditioned by availability of data on PAH profiles of local sources [2,3]. Due to a wide range of anthropogenic source types and uniqueness of PAH source profiles, the multicomponent end-member mixing analysis (EMMA) was used for source apportionment in that study [4,5]. Unfortunately, in the other studies concerned with identification of water pollution sources in Lake Baikal watershed, the comparison of chemical composition between the water and source emissions was not made. The high concentrations of pollutants such as PAHs [6,7,8], trace elements [9,10,11,12,13,14,15], dissolved organic carbon, inorganic nitrogen, and phosphorus [16,17,18,19,20,21,22] and even 30Si isotope [23,24] in water were used as pollution indicators. Despite the fact that the most pollutants, like PAHs, nitrogen, and sulfur oxides, etc., may come from remote sources, the industrial or municipal facility closest to water sampling point, located upwind or upstream of it, was usually assumed to be the primary contributor of pollutants to the surface water [2].
The problem of identification of natural solute sources, such as rocks and soils, is the similarity of their chemical compositions (source profiles), which makes it difficult to select chemical elements or ions that can be used as the source tracers. The scarcity of source tracers causes the generality of the source identification procedure and the inability to evaluate source contributions: in most studies, only one predominant source (which is actually a combination of several sources) was identified [1]. The identification of natural solute sources and the classification of waters according to their chemical composition are both based on the dominance of one group of solutes over another group of solutes [25,26,27,28]. These solutes are mostly the anions. For example, the dominance of sulfate over the bicarbonate ion in water indicates the presence of gypsum [29,30] or sulfides [31,32] in watershed. The low bicarbonate-to-sum-of-ions ratio indicates the significant contribution of atmospheric deposition to the chemical composition of surface water [33]. The high percentage of chloride in the anionic composition of riverine water in coastal areas may be due to seawater intrusion into groundwater [34] or due to high contribution of rainwater to stream flow [35]. In noncoastal areas, the high chloride levels in surface waters may be due to road-salt applications in watershed [36]. The presence of carbonate ions in water indicates the predominance of carbonate rocks over silicate rocks in watershed, whereas the predominance of bicarbonate ion over the other anions indicates the predominance of silicate rocks over the other types of rocks [37]. The ratio between the carbonate and silicate rocks in watershed is reflected in water mineralization value: the higher the mineralization, the higher the contribution of carbonate rocks (and the lower the contribution of silicate rocks) to water chemistry [38,39]. From this point of view, the predominant source of solutes in surface waters of the Lake Baikal watershed is silicate rocks, because all waters are low-mineralized and characterized by the predominance of bicarbonate ion [40,41]. Unfortunately, this conclusion is not scientifically sound, taking into account the variety of minerals composing silicate rocks and the variety of silicate rocks in Lake Baikal watershed.
The data on the cationic composition of waters do not help much to understand better the origin of solutes. According to Alekin [42], the predominance of calcium and magnesium ions over bicarbonate ions, along with predominance of bicarbonate and sulfate ions over calcium and magnesium ions (HCO3− < Ca2+ + Mg2+ < HCO3− + SO42−), indicates the presence of igneous and sedimentary rocks in the Lake Baikal watershed. Taking into account the variety of chemical and mineralogical compositions of igneous and sedimentary rocks in the Lake Baikal watershed, this conclusion also seems to be too general and imprecise.
The studies concerned with the identification of natural solute sources using trace metals as tracers are not numerous. The results of source apportionment using strontium isotopes (87Sr/86Sr) as tracers showed that the solutes in water of small Lake Baikal tributaries are originated from dissolution of silicate rocks [43,44], whereas solutes in water of main tributaries (rivers Verkhnyaya Angara, Bargusin, and Selenga) are originated from the dissolution of silicate and carbonate rocks [45,46]. The different origin of dissolved solids in small and big rivers is explained by the higher diversity of geological conditions in large watersheds. Unfortunately, the precise evaluation of contributions of silicate and carbonate rocks to water chemistry is hardly possible using strontium isotopes because 87Sr/86Sr ratio values depend mostly on the age of rocks rather than on their chemical composition [47].
The one aim of this study was to select ionic or element concentration ratios that can be used as tracers specific enough to distinguish between contributions of different igneous and sedimentary rocks to water chemistry. Another aim was to identify anthropogenic sources using the differences in values of selected tracers between pristine rivers and urban/industrial rivers. The results of this study may be used by environmental scientists, decision makers, and conservationists as the basis for the creation of local chemistry-based classifications of streams.
2. Materials and Methods
2.1. Study Area and Sample Collection Sites
The study was conducted in the summers of 2019 and 2020 on the western shore of Lake Baikal (Figure 1) and in the watershed of the Selenga river—the main Lake Baikal tributary (Figure 2). The study area is a mountainous region characterized by a boreal climate and coniferous vegetation. The study area is characterized by long, cold winters lasting 4–5 months (November–March) and short hot summers (June–August). Winter air temperatures reach −37 °C, and the summer air temperatures are about 25 to 30 °C. Spatial variation in precipitation is high across the watershed, with the western coast receiving about 400 mm of precipitation annually, while as much as 600 to 800 mm are deposited on the southeastern coast. Extremely high precipitation (up to 1200 mm/year) is observed on the northern slopes of Khamar-Daban Ridge, located on the southeastern coast of Lake Baikal. Most of the precipitation falls in the summer.
Water was sampled during the base flow conditions. Two water samples were collected at each site: one collected in 2019 and the other in 2020. The differences in concentrations of respective ions measured in 2019 and 2020 were within the range of 15–33% and the differences in concentrations of respective trace elements were in the range of 30–40%. All the figures and tables in this paper represent two-year average solute concentrations. The Selenga River was selected as an urban river because its watershed is densely populated. There were 11 sampling stations established on the Selenga River and the distance between sampling stations was approximately 30 km.
The western tributaries were selected as pristine rivers because the western coast of Baikal is the wilderness area. The total number of sampled rivers on the western coast was 75; water was sampled from river mouths. The choice of western rivers as study objects was also caused by the great geological diversity of the western coast as well as by insufficient knowledge about chemical composition of riverine waters. Until now, attention was narrowly focused on Lake Baikal, rivers, and streams of the Khamar-Daban ridge [48,49] located on the southeastern coast of the lake as well as on main Baikal tributaries [50,51] (the rivers Selenga, Barguzin, and Upper Angara) flowing into Baikal on the eastern coast to the north of the Khamar-Daban ridge.
The water in Lake Baikal and its tributaries is low-mineralized, Ca-HCO3 type water. The highest values of water mineralization (up to 200 mg/L) and alkalinity are observed in some rivers of the western coast. The lowest values of water mineralization (up to 50 mg/L) are observed in the small rivers of the Khamar-Daban ridge. The low mineralization of water of the Khamar-Daban rivers is due to extremely high precipitation (up to 1200 mm/year). The intermediate mineralization values (50–120 mg/L) are typical of main tributaries.
A comparison of the chemical properties of the waters in different locations within the western coast of Lake Baikal was made upon averaging their composition for the areas (Figure 1) delineated by analyzing and interpreting cartographic material on the basis of landscape and hydrochemical criteria. The areas were named in accordance with their most recognizable toponyms. Some of the missing data on Selenga water composition were derived from the literature [10].
2.2. Chemical Determinations
The concentrations of main cations (Ca2+, Mg2+, K+, Na+), anions (HCO3−, SO42−, Cl−), and trace metals (Sr, Zn, Cu, Sn, Mo, V, Ti, Ni, Fe, Mn, Al) in the water samples were measured. All dissolved components were measured in filtered water. Trace metals were measured using Agilent 7500ce mass spectrometer. The ICP-MS was calibrated at six concentration levels (0.5, 1, 2, 5, 10, and 20 µg/L) to determine the linearity of the responses before sample analysis. The linearity of the calibration curve provides accurate estimates of metal concentrations below 0.5 µg/L and above 20 µg/L. For the calibration of the mass spectrometer, the multi-element standard solutions ICP-MS68A-A and ICP-MS-68A-B (High-purity standards, Charleston, SC, USA) were used. To control the analysis quality, all samples were spiked with internal surrogate standards. Since there was no sample manipulation performed before measurement, the recovery of metal analytes was not assessed. Detection limits for trace metals varied from 0.01 µg/L (for Ti) to 0.027 µg/L (for Al). The accuracy (closeness of a measured value to a standard one) and precision (closeness of repeat analysis values) expressed as standard deviation was either excellent (<3%) or good (3–7%). The concentration of bicarbonate ion was measured by means of potentiometric titration of riverine water samples with 0.02 M hydrochloric acid (HCl). Main cations were measured using Optima 5300DV inductively coupled plasma optical emission spectrometer (ICP-OES). The concentration of anions were measured using a Dionex ICS-3000 ion chromatograph (IC). The calibration of ICP-OES and IC were performed in a way similar to that of ICP-MS calibration. To check the accuracy of ICP-MS measurements, the multi-element standard solutions ICP-MS68A-A and ICP-MS-68A-B (High-purity standards, Charleston, SC, USA) were used. To check the accuracy of ICP-OES, the PerkinElmer single-element standards were used. To check the accuracy of IC measurements, the Sigma-Aldrich inorganic anion standards were used.
2.3. Data Processing
To classify the riverine and stream waters on the basis of ionic composition and to demonstrate the relationships among the ions, the Piper diagram was used. To understand the relationships among the trace elements and factors controlling their distribution in surface waters, the hierarchical cluster analysis was performed.
2.3.1. Identification of Tracers and Sources
Natural and anthropogenic solute sources were identified using the end-member mixing approach [4]. The identification procedure was based on plotting the water samples with potential end-member sources on the same mixing diagram using the ratios of ion or element concentrations (tracers) as co-ordinates. The criterion applied for selection of X and Y tracer ratios was the absence of correlation or, at least, the absence of strong positive correlation between their values. Strong positive correlation exists because one variable influences the other; thus, positively correlated tracers have a common source. The number of distinguishable sources was assumed to be one more than the number of available tracers [4]. Water samples located in the mixing diagrams away from the array of data points in directions of the largest spread of data were considered as possible solute sources [5,52,53]. It was assumed that, under pristine conditions, the chemical composition of such samples was conditioned by dissolution of predominantly one type of rock. Under urban conditions, the chemical composition of outlier samples was assumed to originate either from one type of rock or from one type of wastewater. Possible sources were identified by comparing the tracer ratio values between the products of dissolution of rocks (or wastewaters) present in the watershed of the respective river and water samples. The rule used to select the real solute sources from among the possible ones was to determine whether most samples could be tightly bound by a polygon whose vertices were solute sources. When a point was inside a polygon, all the sources contributed to chemical composition of the water sample, whereas, when a point was outside a polygon, only two neighboring sources (vertices) contributed to water chemistry. The closer the sample point to source point, the higher the source contribution to chemical composition of water sample.
2.3.2. Evaluation of Source Contributions
The source contributions were calculated using simultaneous equations:
where T is a tracer and f is the contribution of a specified source. Superscripts denote the tracer number, subscripts denote the source number, and the subscript mix denotes mixture or riverine water.
The solutions for samples lying outside the polygon have negative fractions for some sources, which is not realistic. To solve this problem, fractions for outliers were resolved by a geometric approach [54]. The idea underlying this approach is that the distance between the perpendicular dropped from an outlier to the side of the polygon and either of the two adjacent vertices is inversely proportional to the contribution of the corresponding source. The contribution of the third source (the vertex opposite to this side of the polygon) was set equal to zero.
3. Results
3.1. Ionic Composition of Waters and Its Relation to Watershed Geology
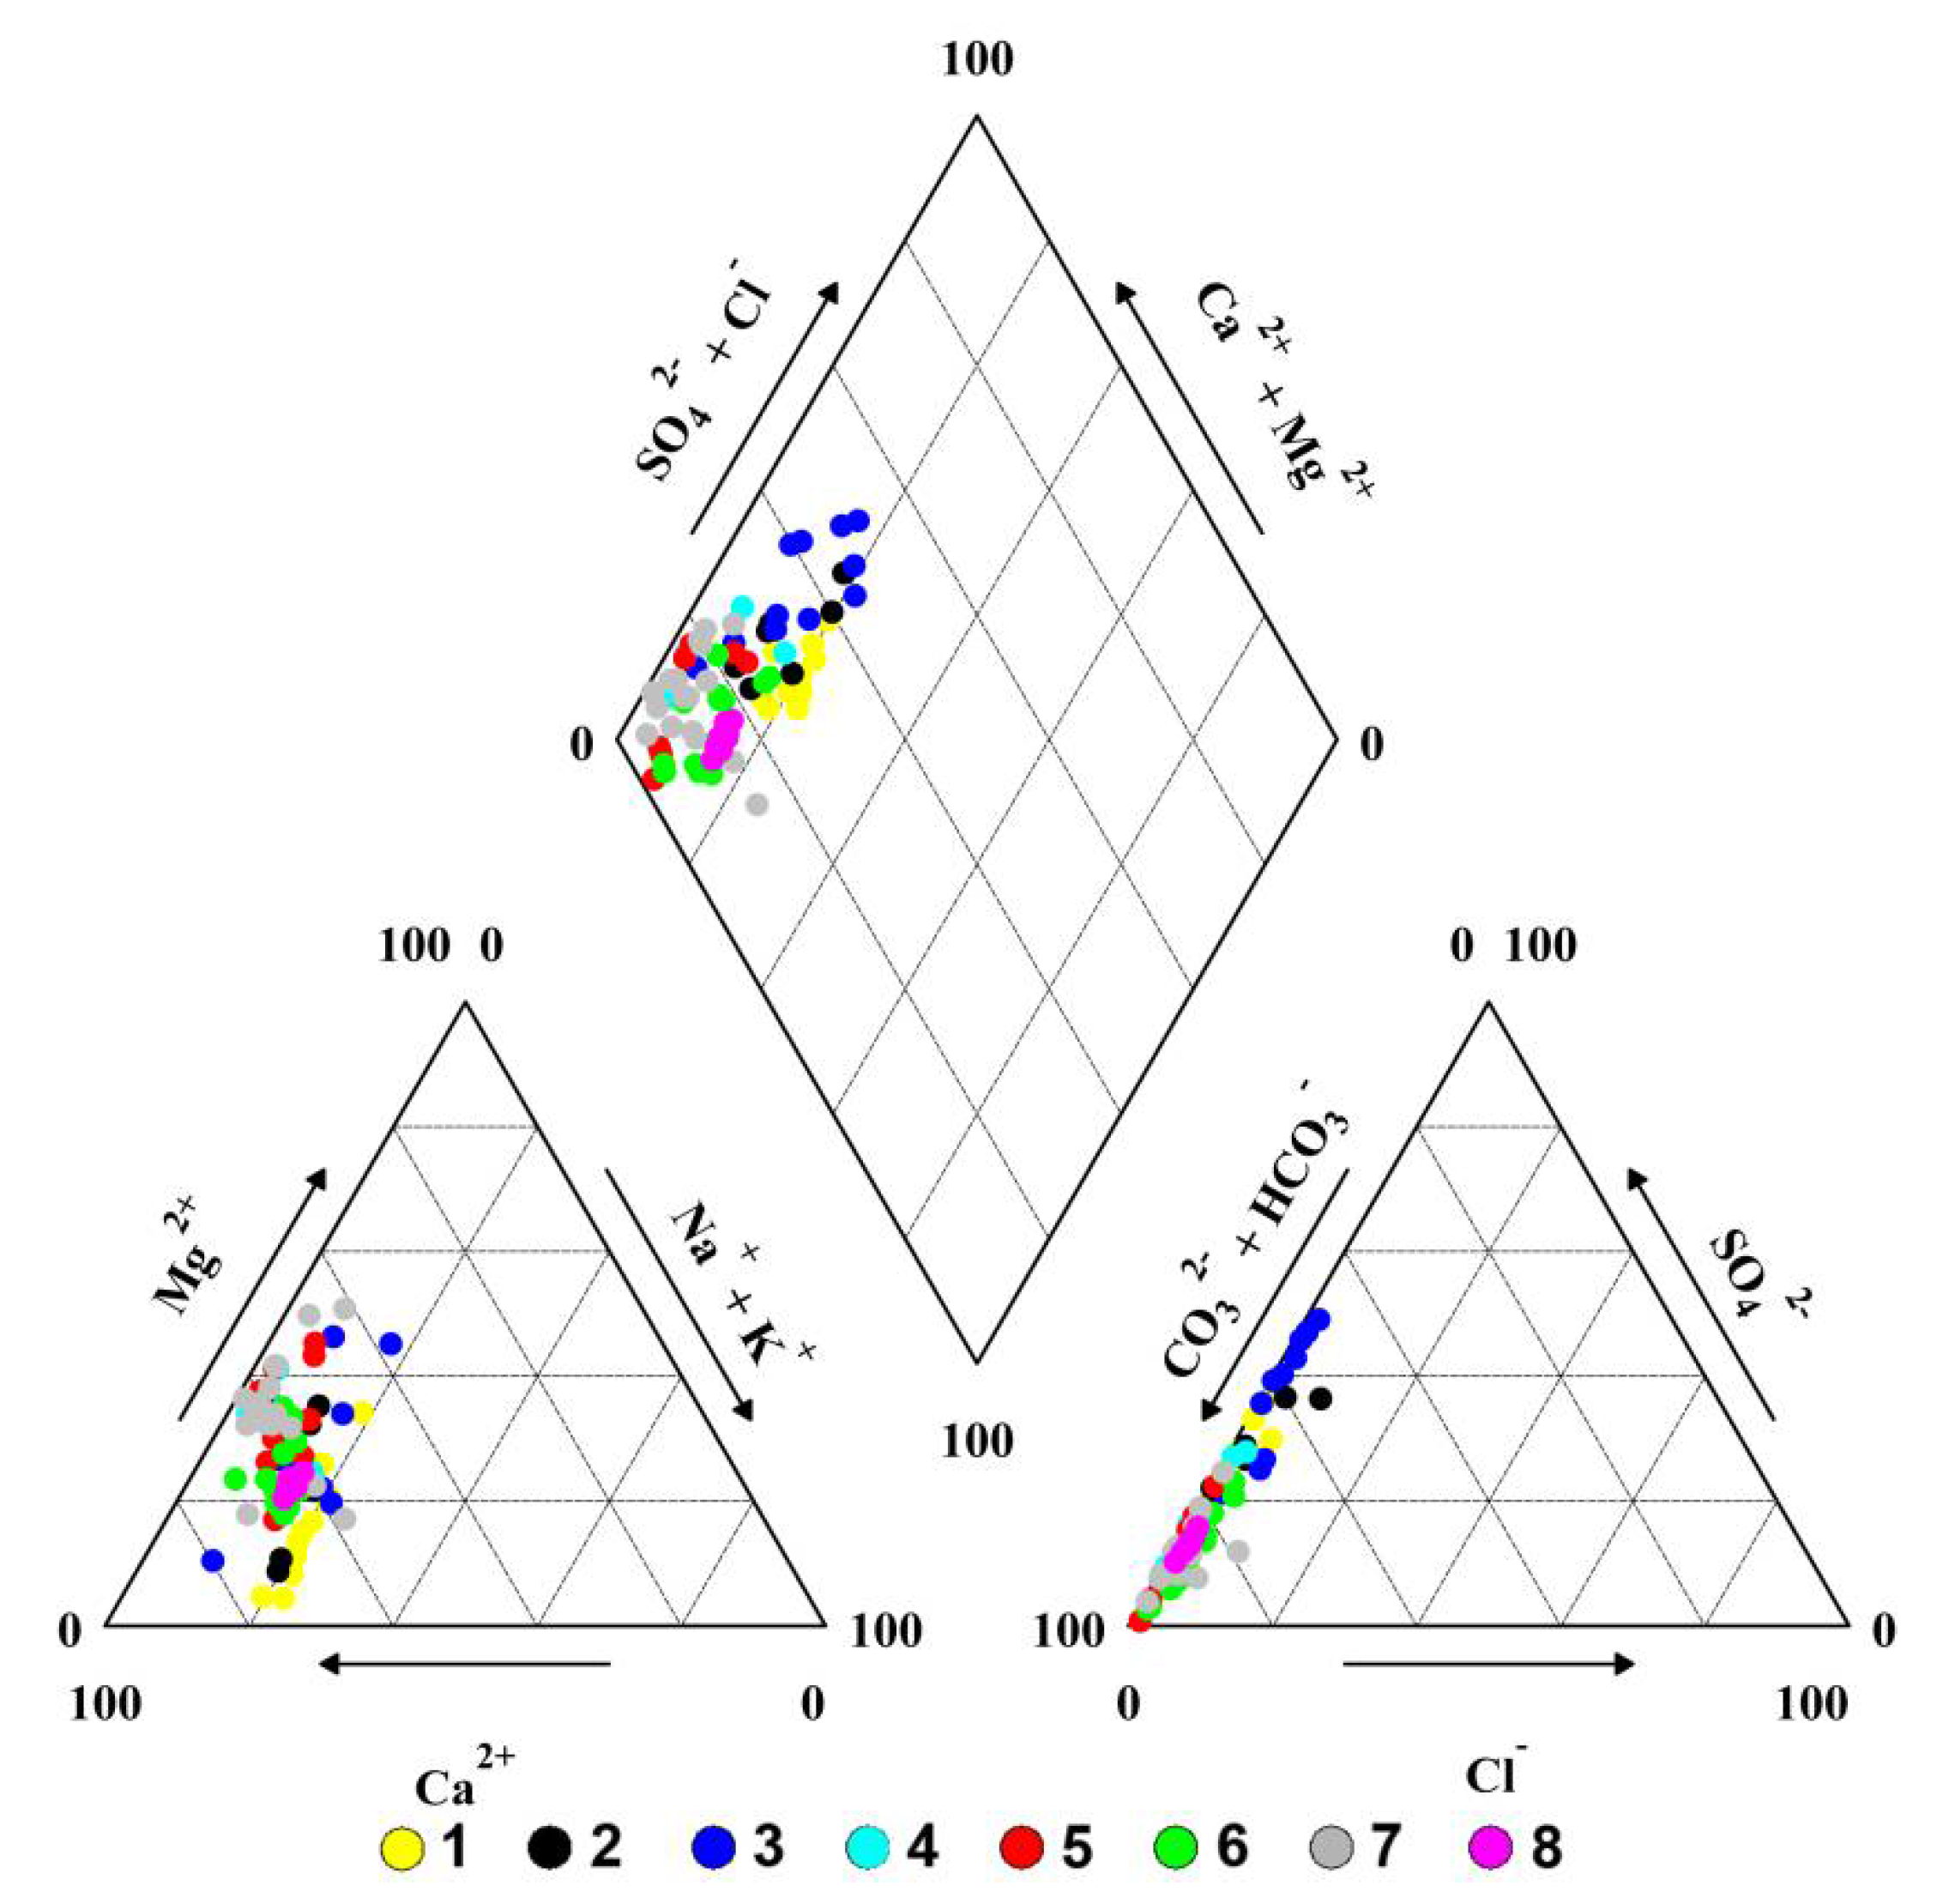
The surface waters in the study area are low-mineralized (Table 1 and Table 2, Table S1 in Supplementary Materials), Ca-HCO3-type waters (Figure 3). Nevertheless, the differences in the quantitative chemical composition of water among the rivers are well pronounced. First and foremost, this relates to the total dissolved solids (TDS). It must be noted that in this study, TDS for simplicity was calculated as the sum of ions because the concentration of organic matter (2–7 mg/L) was negligible with respect to the sum of ions (50–240 mg/L). The highest TDS content (>190 mg/L) was observed for the Buguldeisky and Ongurensky areas, whereas the lowest TDS content was observed for the Marituisky and Elantsinsky areas (50–80 mg/L). The intermediate TDS content was typical for the Listvyansky and Goloustnensky areas (80–140 mg/L). The differences in the spatial distribution of TDS content in riverine waters are conditioned by the chemical composition of rocks in drained watersheds. The metamorphic rocks rich in alkali and alkaline-earth metals, such as plagiogneisses, amphibolite shists, amphibolites, marbles, etc. [55], that condition high TDS content in water are more widespread in the northern and central parts of the western coast of Lake Baikal than in the southern Cisbaikalia or in the lower reaches of the Selenga River [56].
The differences in water chemistry among the rivers were also clearly visible in anionic composition of water. Despite the fact that the HCO3− is the predominant anion that contributes from 52 to 96% (expressed in equivalents) to the sum of anions (HCO3− + SO42− + Cl−), the content of SO42− in water of the half of studied rivers was also high enough (20–49% of the sum of anions).
The sources of bicarbonate in all the waters are the dissolution of CO2 and carbonate minerals. Sulfates were certainly from the dissolution of sulfur-bearing minerals such as sulfides and sulfates. The rivers characterized by the highest contributions of sulfates to anionic composition of water were located in the Marituisky and Lisvyansky areas. The contribution of Cl− to anionic composition of water was negligible (0.3–9%).
The differences in cationic composition of the water among the rivers were less clear because Ca, Mg, K, and Na are the most abundant alkali and alkaline-earth metals in Earth’s crust and, consequently, in most of the rock-forming minerals. The most abundant cation contributing about 60% to the sum of Ca2+, Mg2+, K+, and Na+ in the water of the studied rivers was Ca2+. The second most abundant cation was Mg2+ (17–30% of the sum of cations). The least common cations were Na+ (3–14%) and K+ (1–4%).
3.2. Trace Elements Composition of Waters and its Relation to Watershed Geology
The differences in trace element composition of water among the rivers of the studied territories were less pronounced than the differences in ionic composition. The only way to figure out somehow the origin of those elements was to try to derive their paragenetic associations linked to paragenetic associations of minerals that are related by specific chemical processes [57]. Element associations were derived using cluster analysis. According to the results of cluster analysis, all the trace elements were divided into four clusters (Figure S1 in Supplementary Materials). The first three clusters contained single elements: Sr, Al, and Fe. The fourth cluster contained eight elements (Ti, V, Mn, Ni, Cr, Mo, Cu, and Zn) at once.
The strontium absolutely prevailed over the other measured elements in the water of the Selenga River (Table 3) and in water of most parts of the western Baikal tributaries (Table 4, Table S2 in Supplementary Materials). Concentration of Sr varied from 20 to 360 µg/L, accounting for 119 µg/L, on average. Being the geochemical analogue of calcium, Sr isomorphically substitutes Ca in most minerals, especially in carbonates. This explains the high Sr concentrations in the waters of the Buguldeisky and Goloustnensky areas that drain metamorphic (amphibolites, marbles) and silica-undersaturated igneous rocks (leucites, nepheline syenites) rich in alkaline-earth metals. Low concentrations of strontium in the waters of the other areas are conditioned by low content of Ca-bearing minerals, like amphiboles and plagioclases, in silica-oversaturated (granites) igneous rocks widely spread in those areas.
The ranges of Al and Fe concentrations (4–350 µg/L and 12–214 µg/L, respectively) in studied waters were close to that of Sr; however, their average values were twice lower than the average Sr concentration (71 µg/L and 55 µg/L, respectively). Al and Fe are the third and the fourth most abundant elements in the earth’s crust, respectively (after the O and Si). Thus, taking into account that the more than 90 percent of the earth’s crust is composed of silicate rocks, they are undoubtedly the source of Al and Fe in riverine waters. The high concentrations of Al and Fe in waters often coincide with the low concentration of Sr that probably means that these two elements are associated with silica-oversaturated (acid) rocks like granites. Igneous rocks are the only source of Al because Al ores like bauxites are absent in the region of study. Unlike Al, sources of Fe are variable. Fe is widely distributed in ore minerals such as hematite, magnetite, limonite, etc., that occur as inclusions within silicate rocks. Moreover, Fe also tends to accumulate in products of primary aluminosilicates’ weathering, such as clays, oxides and hydroxides, which may also be the sources of Fe in surface waters.
The elements that belong to the fourth cluster were characterized by lowest concentrations among all the measured elements. Their concentration values varied in the range from 12 µg/L (Ti) to 0.3 µg/L (Cr). The origin of Ti, V, Ni, Cr, Mo, Cu, and Zn in water was unclear since these elements are associated with various accessory minerals [58] belonging to different mineral classes, such as silicates, sulfides, sulfates, borates, arsenates, carbonates, oxides, etc. In contrast to those seven elements, the origin of Mn is more readily understandable: Mn is the 12th most abundant of the Earth crust’s elements, and it is often found in minerals in combination with Fe.
3.3. Identification of Main Ion Sources
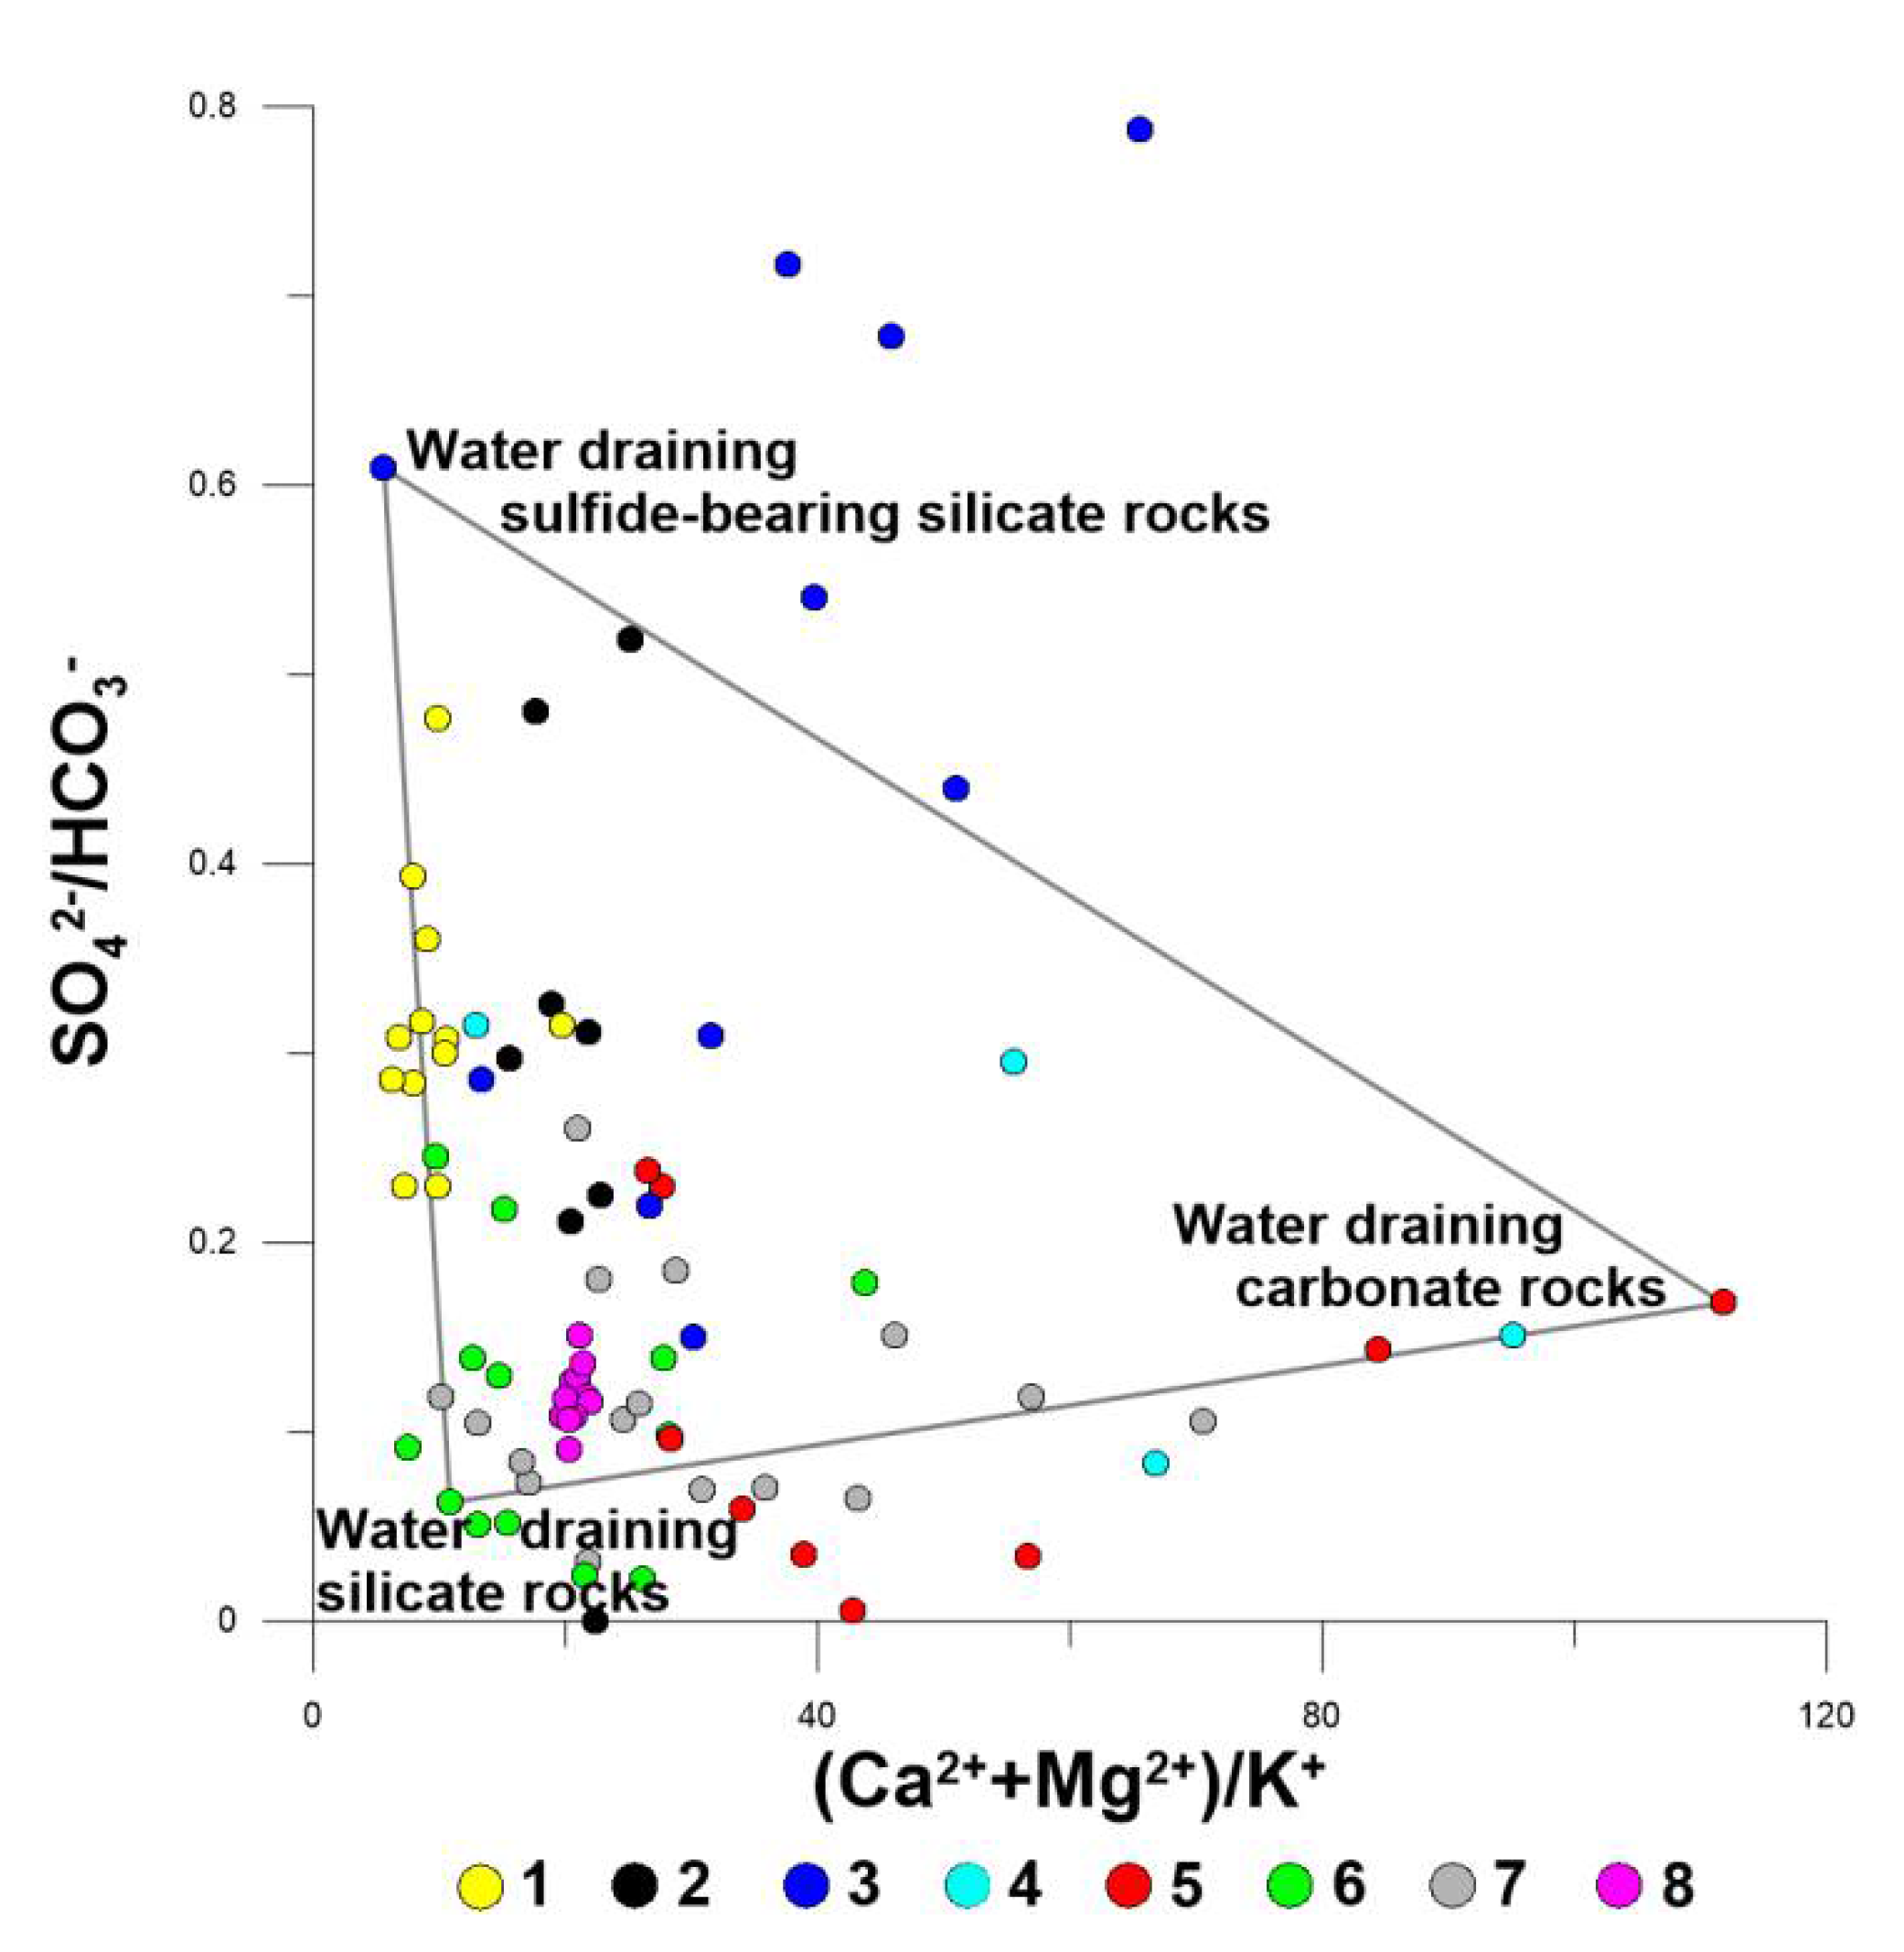
To identify solute sources and their tracers, all possible biplots for all combinations of main ion concentrations normalized to each other were generated. The SO42−/HCO3− and (Ca2+ + Mg2+)/K+ ratios were finally chosen as tracers because they were uncorrelated with one another (Figure 4). It means that the large part of K+ and SO42− ions in one hand and the large part of Ca2+, Mg2+, and HCO3− ions in the other hand were originated from different sources [4,5]. Moreover, these tracers allow the longest distances possible between any two neighboring points and, consequently, the largest possible differences between the ionic compositions of water samples. As it was mentioned above, the existence of two tracers implies the presence of three solute sources that form a mixing triangle that should bound the maximum-possible number of datapoints on the mixing diagram [4]. Since the chemical composition of end-member waters containing products of dissolution of particular kinds of rocks were unknown, the three water samples characterized by distinctly different SO42−/HCO3− and (Ca2+ + Mg2+)/K+ ratio values should have been chosen as source waters. From this point of view, two of the three vertices of the triangle should have been the outliers located away from the data cloud and the third vertex should have been the point located near the origin of coordinates.
The chemical composition of water samples characterized by high (Ca2+ + Mg2+)/K+ ratio values (>30) and low SO42−/HCO3− ratio values (<0.2) was probably originated from the dissolution of carbonates (Figure 4) like calcite or marble (CaCO3) and dolomite (CaMg(CO3)2):
CaMg(CO3)2 + 2H2O + 2CO2 → Ca2+ + Mg2+ + 4HCO3−
CaCO3 + H2O + CO2 → Ca2+ + 2HCO3−
Thus, the lower right vertex of the mixing triangle was assumed to represent dissolution products of carbonate rocks.
The chemical composition of water samples characterized by low (Ca2+ + Mg2+)/K+ ratio values (<30) and high SO42−/HCO3− ratio values (>0.2) was probably originated from the oxidation of sulfides like pyrite (FeS2) and dissolution of orthoclase (KAlSi3O8) and, to a lesser extent, the dissolution of plagioclase (CaAl2Si2O8) under the influence of sulfuric acid (H2SO4) produced due to pyrite oxidation:
4FeS2 + 15O2 + 14H2O → 4Fe(OH)3 + 8H2SO4
2KAlSi3O8 + H2SO4 + 9H2O → Al2Si2O5(OH)4 + 4H4SiO4+ 2K+ + SO42−
CaAl2Si2O8 + H2SO4 + H2O → Al2Si2O5(OH)4 + Ca2+ + SO42−
Thus, the upper vertex of the mixing triangle was assumed to represent dissolution products of sulfide-bearing silicate rocks.
However, the waters of some rivers were characterized by the high values of both (Ca2+ + Mg2+)/K+ and SO42−/HCO3− ratios. This probably means that the dissolved solids in those rivers originated from the dissolution of sulfates like gypsum (CaSO4):
CaSO4·2H2O → Ca2+ + SO42− + 2H2O
Finally, the chemical composition of water samples characterized by both low (Ca2+ + Mg2+)/K+ and SO42−/HCO3− ratio values (<30 and <0.2, correspondingly) was probably originated from the dissolution of orthoclase (KAlSi3O8) and, to a lesser extent, the dissolution of plagioclase (CaAl2Si2O8) under the influence of carbonic acid:
2KAlSi3O8 + 2H2CO3 + 9H2O → Al2Si2O5(OH)4 + 4H4SiO4 + 2K+ + 2HCO3
CaAl2Si2O8 + 2H2CO3 + H2O → Al2Si2O5(OH)4 + Ca2+ + 2HCO3−
Thus, the lower left vertex of the mixing triangle was assumed to represent the dissolution products of acid and intermediate silicate rocks most typical for the Lake Baikal watershed.
3.4. Identification of Trace Element Sources
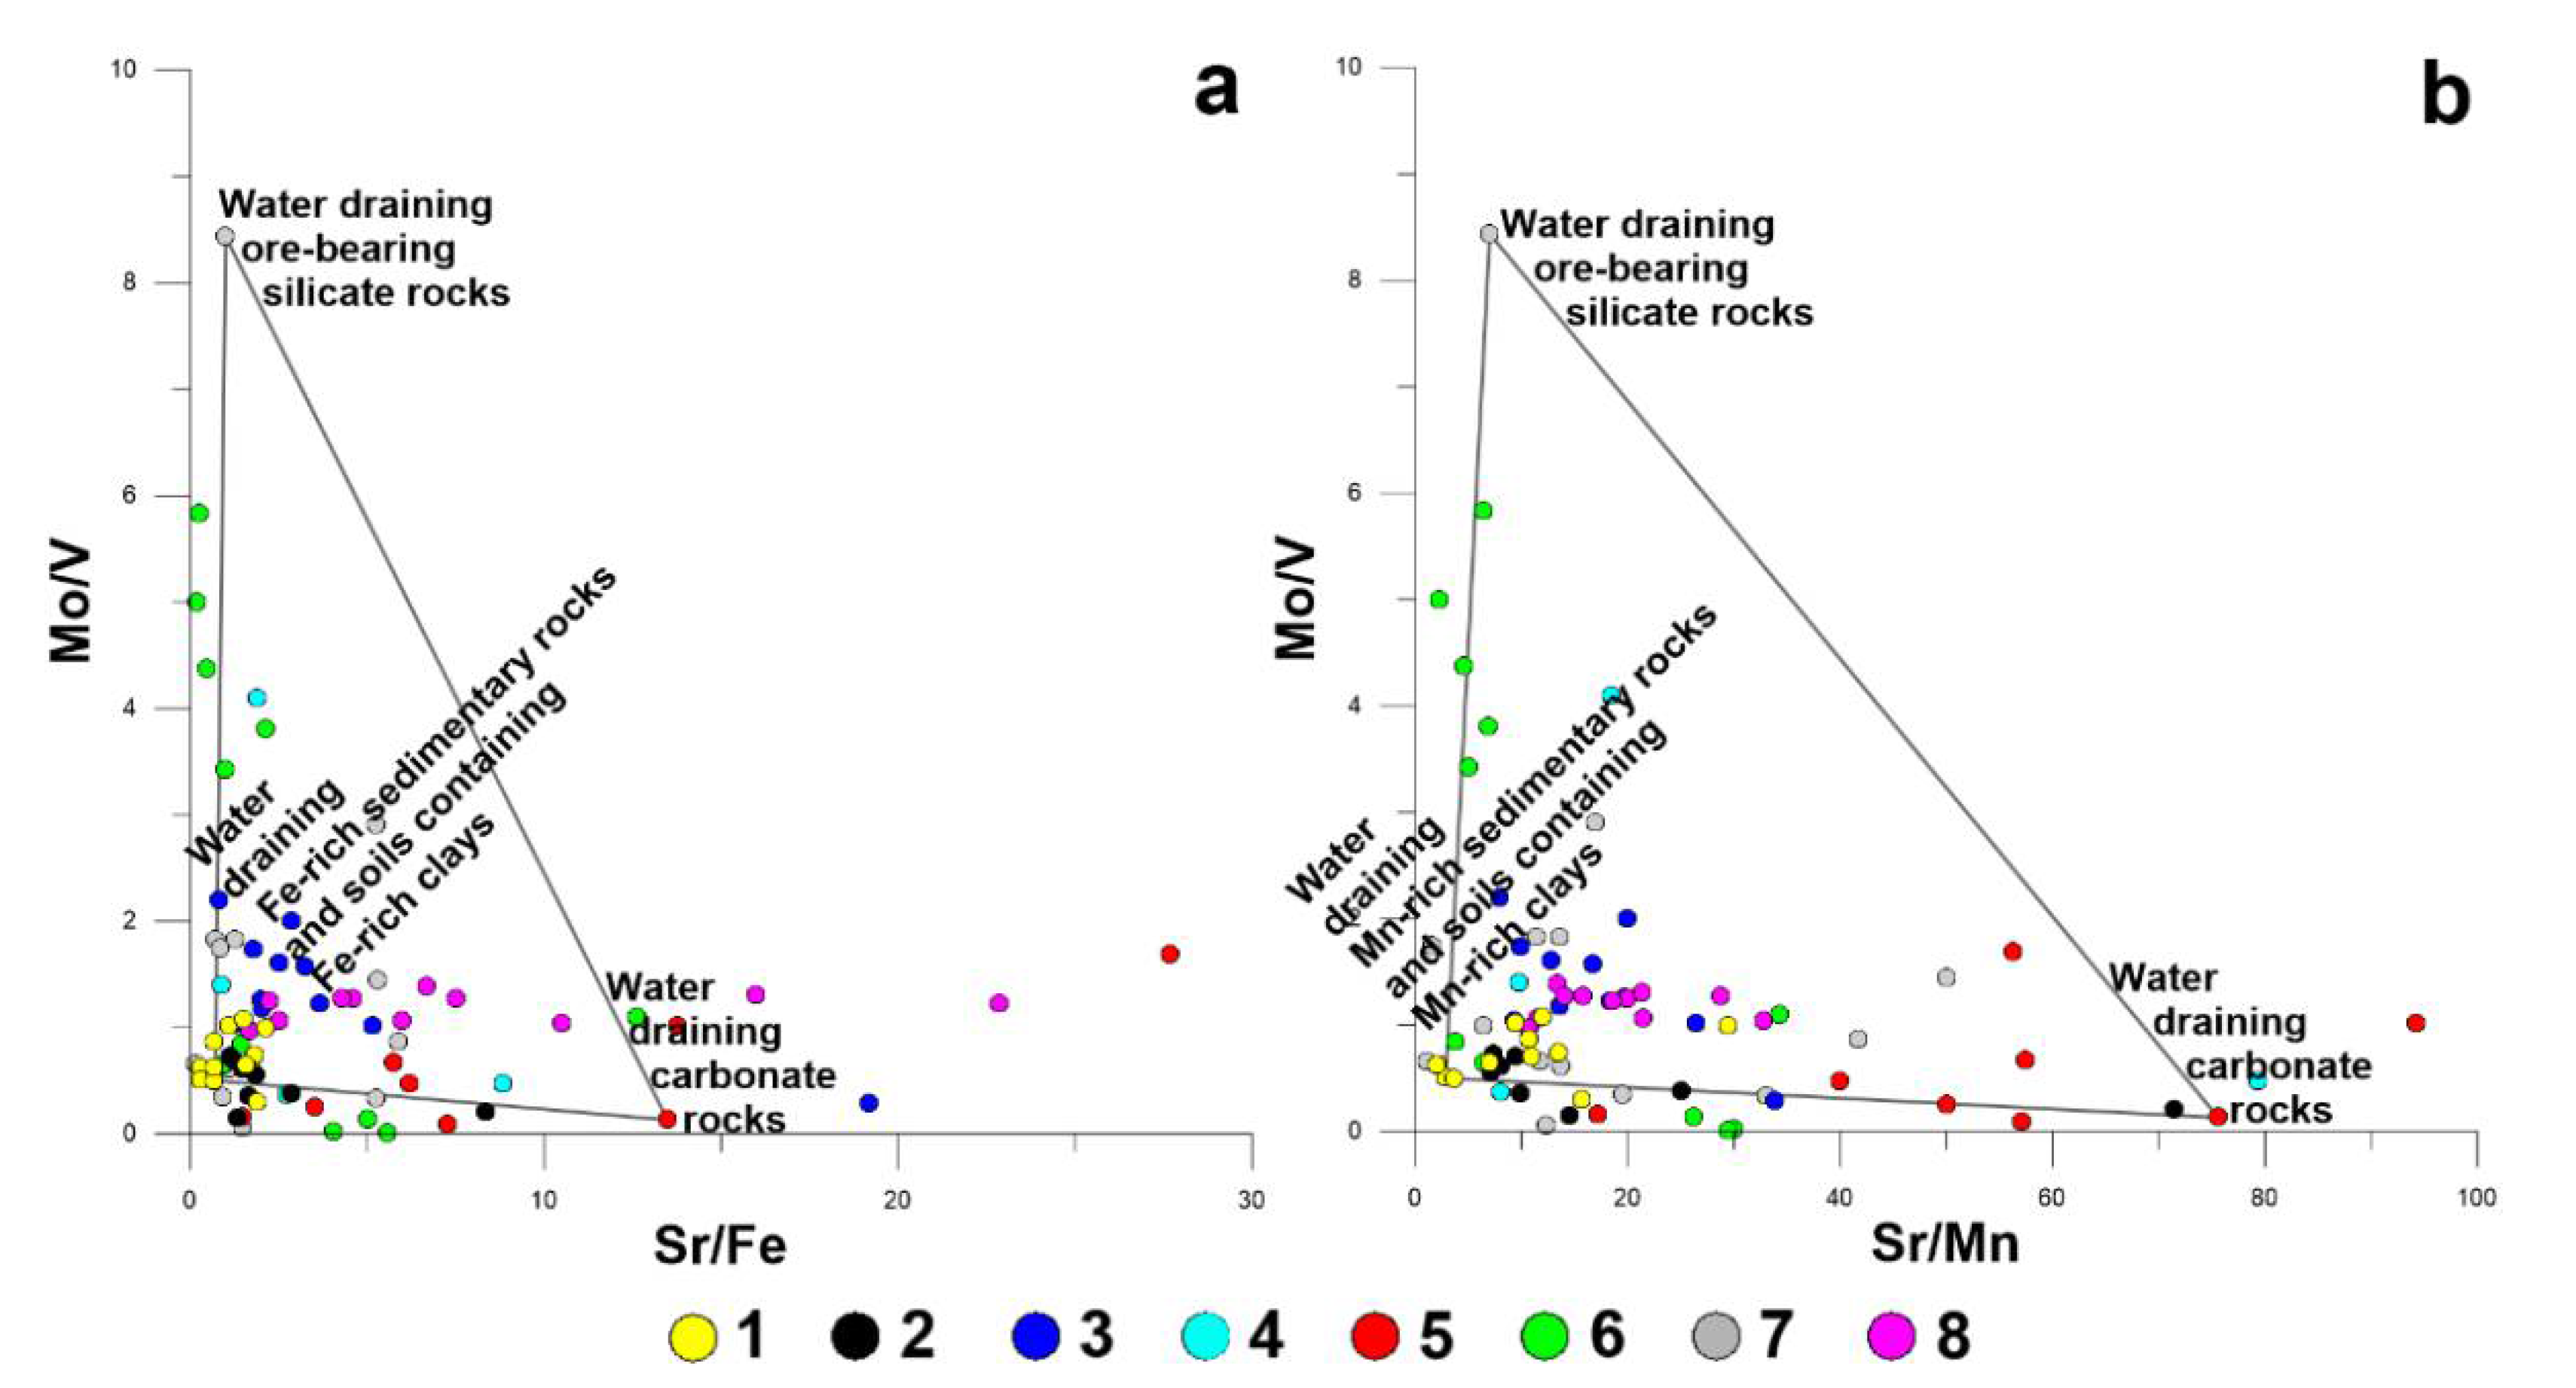
In this section, the shortened version of discussion is presented. The detailed discussion is presented in the Supplementary Materials. To identify trace element sources and their tracers, all possible biplots for all combinations of trace element concentrations normalized to each other were generated. The two uncorrelated pairs of element ratios, such as Sr/Fe and Sr/Mn on the one hand and Ni/V and Mo/V on the other hand, were finally chosen as tracers (Figure 5 and Figure 6).
The chemical composition of water samples characterized by high Sr/Fe and Sr/Mn ratio values (>5 and >20, respectively) was probably originated from the dissolution of carbonate rocks, because Sr substitutes Ca in CaCO3.
The chemical composition of waters characterized by low Sr/Fe and Sr/Mn ratio values (<5 and <20, respectively) was assumed to represent products of the dissolution of Fe-Mn-rich sedimentary rocks and clays. The particular sources of Fe and Mn are probably Fe-Mn bog ores [59,60,61], weathering crusts of metamorphic silicate rocks like ferruginous quartzites (gespillites) containing hematite (Fe2O3) and magnetite (FeO·Fe2O3) or soils containing Fe-rich and Mn-rich clays [62].
The chemical composition of water samples characterized by high (>1) Ni/V ratio values was probably originated from the dissolution of sulfide-bearing silicate rocks (Figure 5a,b). The particular Ni sources are probably Ni-bearing sulfides [63], such as Ni-bearing pyrite (FeNiS2) and petlandite ((Ni, Fe)9S8) [64].
The chemical composition of water samples characterized by high (>1) Mo/V ratio values could have originated from the dissolution of ore-bearing silicate rocks (Figure 6a,b). The particular Mo sources are probably Mo-bearing ferruginous quartzites as well as weathering crusts of quartzites [65].
The Fe bands in such ores are of hematite (Fe2O3) and magnetite (FeO·Fe2O3) whereas the major Fe minerals in the weathered crusts of quartzites are hoethite (FeOOH) and hydrohoetite (FeOOH·nH2O). To date, the existence of waters characterized by high Mo/V ratio values in the western coast (near the Bolshoy Cheremshaniy cape) have already been reported [66].
The enrichment of the water of the Selenga River with Mo could be due to the dissolution of primary Mo minerals like molybdenite (MoS2), ferrimolybdite (Fe2(MoO4)3·8H2O), and povellite (CaMoO4) contained in porphyry molybdenum deposits [67].
3.5. Source Apportionment of Main Ions
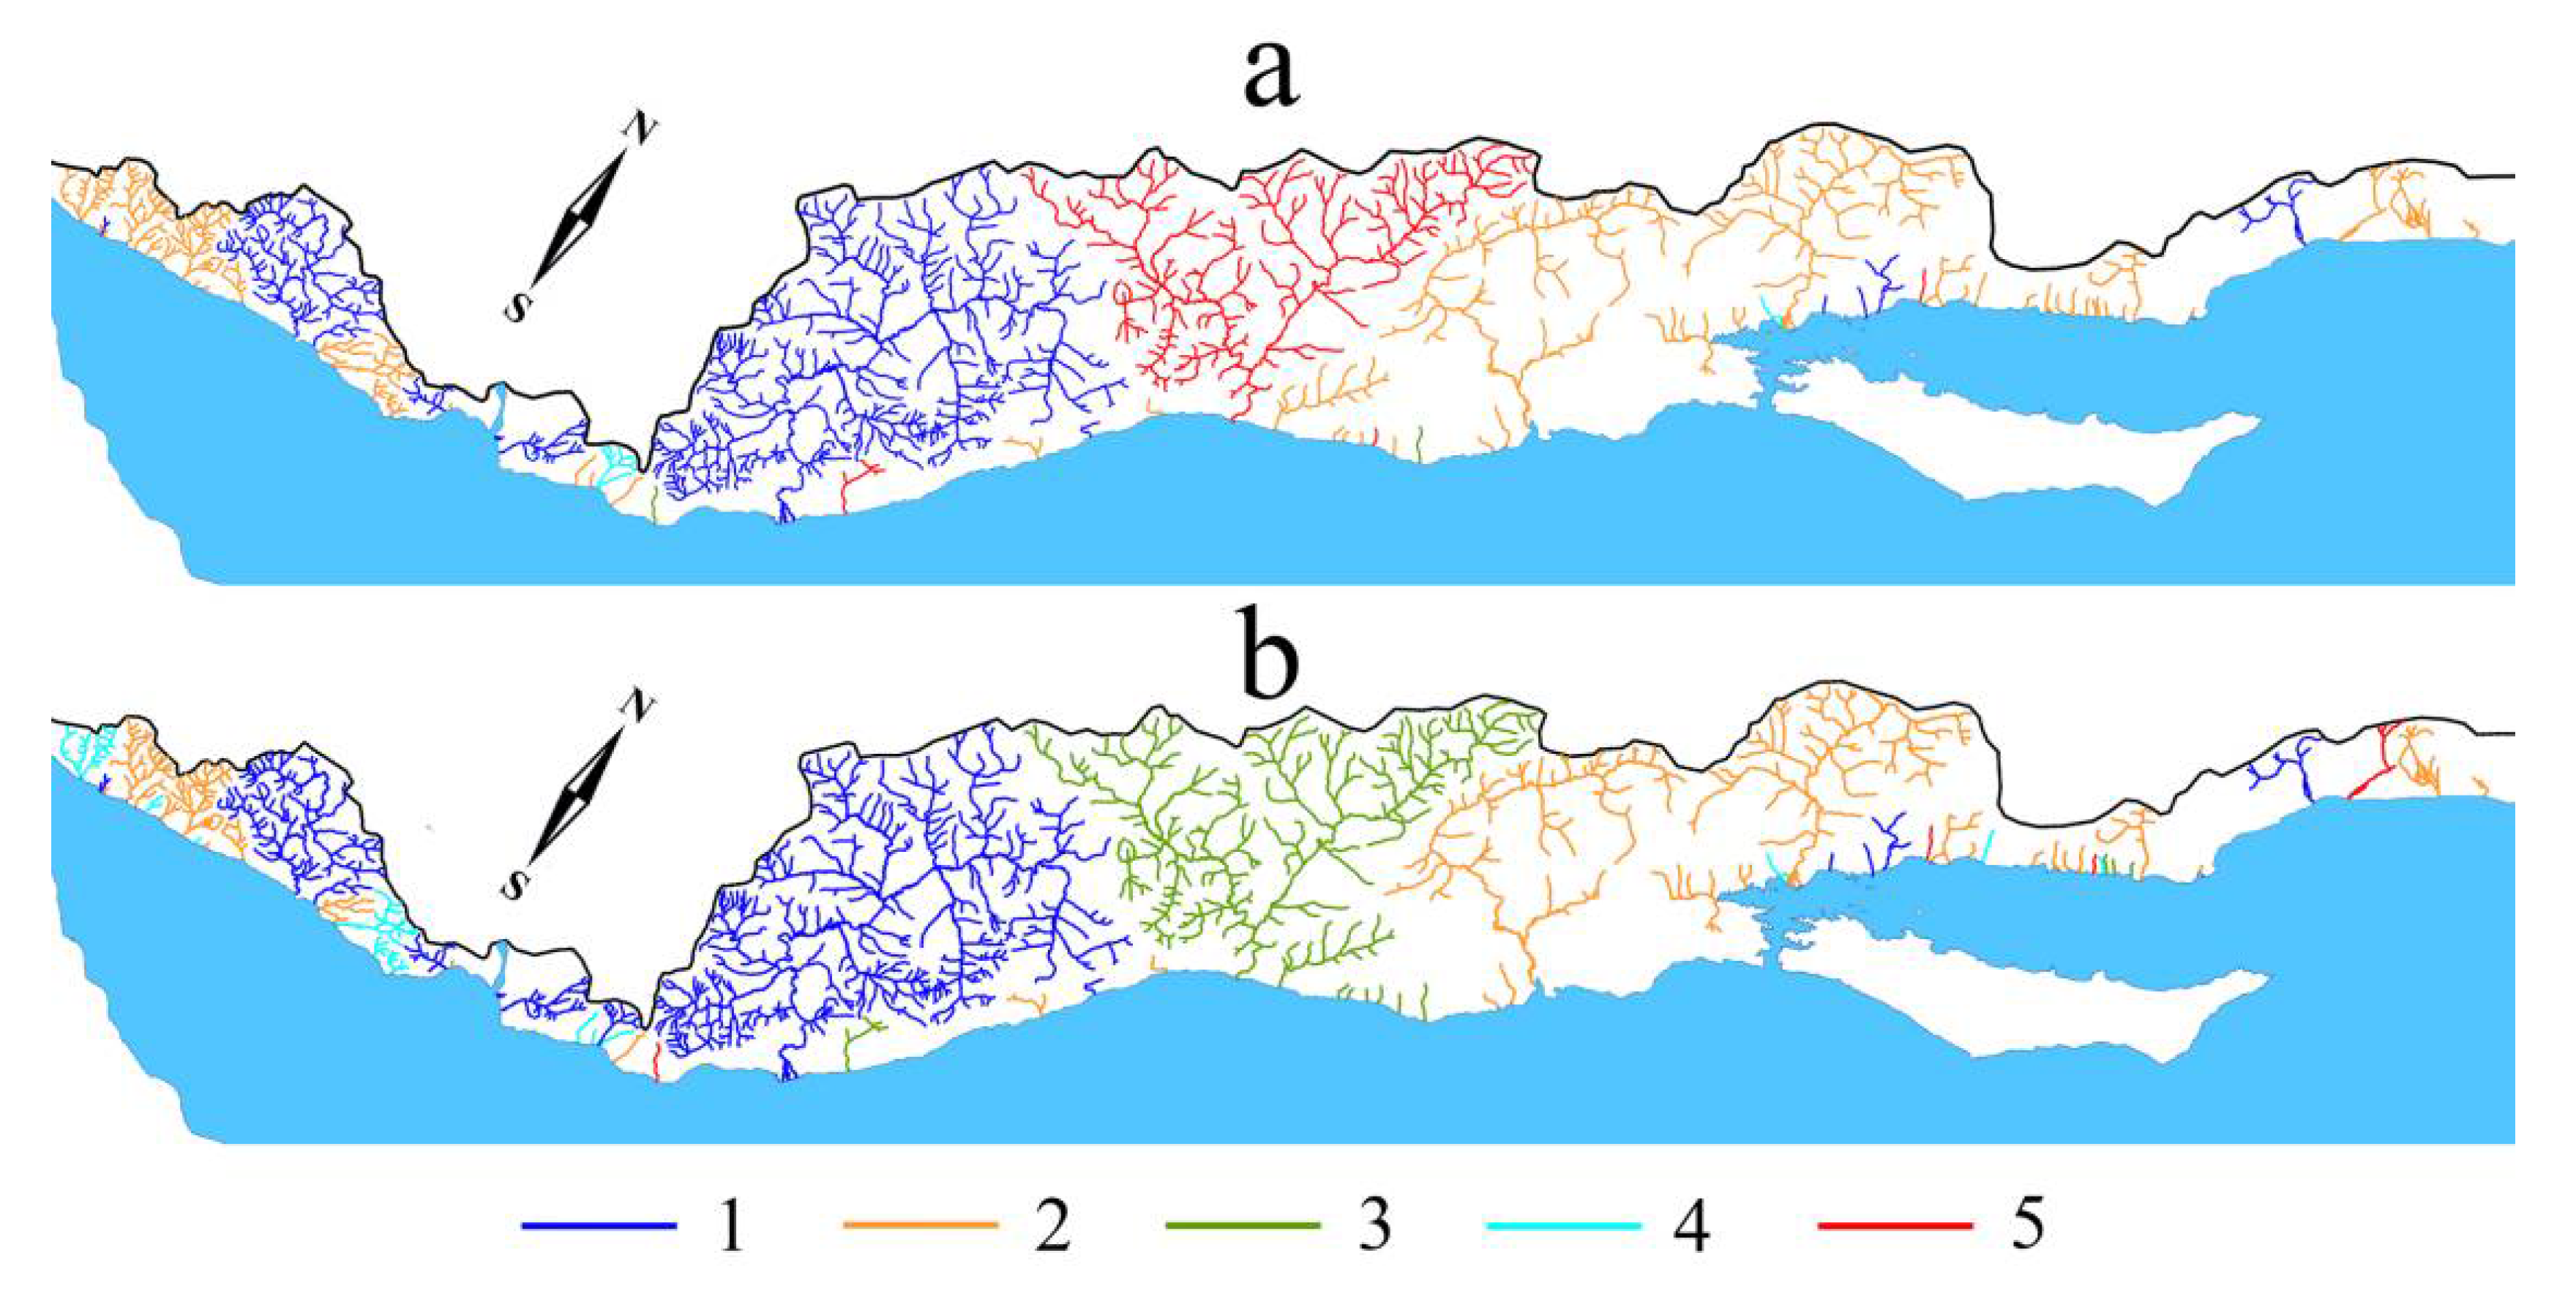
The results of the source apportionment of main ions showed that the ionic composition of waters in the Ongurionsky and Elantsinsky areas (Figure 7) as well as of water of the Selenga River was conditioned mostly by the dissolution of acid and intermediate silicate rocks (Table 5).
The water chemistry in the Buguldeisky and Goloustnensky areas was mostly conditioned by the weathering of carbonates. The highest contribution of sulfide-bearing silicate rocks to ionic composition of water was observed in the Marituisky, Baikalsky and Listviansky areas. However, in the Marituisky and Baikalsky areas, the second most important solute source was non-sulfide silicates whereas in the Listvyansky area, the contributions of non-sulfide silicates and carbonates were equal to each other. Another feature of the waters of the Listvyansky area was the high values of (Ca2+ + Mg2+)/K+ and SO42−/HCO3− ratios typical of gypsum dissolution products. Since gypsum was never found in this area, the high values of tracer ratios were probably due to influence of regional flow on the chemical composition of riverine waters [5]. Thus, the obtained data on solute source contributions to ionic composition of surface waters is in accordance with the data on water chemistry and watershed geology described in the previous section. It means that the values of source contributions may serve as the basis for local water classifications based on solutes origin.
3.6. Source Apportionment of Trace Elements
The results of the source apportionment of trace elements on the basis of Sr/Fe-Ni/V (Figure 5a) and Sr/Mn-Ni/V (Figure 5b) diagrams showed that the trace element composition of surface waters in the Marituisky, Baikalsky, Ongurionsky, and Elantsinsky areas as well in the Selenga River was conditioned mostly by the dissolution of Fe-rich and Mn-rich sedimentary rocks and soils containing Fe-rich and Mn-rich clays (Figure 8, Table S3 in Supplementary Materials). The value of their contribution varied from 50% to 70%.
In the Elantsinsky and Ongurensky areas, the sources of Fe, Mn, and V in waters are probably represented by weathering crusts of Fe-Mn-rich metamorphosed sediments like ferruginous quartzites [68]. In the Selenga watershed, most sources of Fe, Mn, and V in water are Fe-Mn-bearing silicate minerals, including clays and Fe ore minerals of weathering crusts of both silicate and carbonate rocks [69]. In the Marituisky and Baikalsky areas, the most probable Fe, Mn, and V sources are lacustrine deposits of Mezozoic age containing Fe- and Mn-rich clays and Fe-Mn nodules [70]. The predominant sources of trace elements in the waters of the Listvyansky area are sulfide-bearing silicates (58%).
The average contributions of carbonate rocks calculated for the Buguldeisky and Goloustnensky areas using the Sr/Mn-Ni/V diagram were equal to 69% and 26%, respectively, whereas the contributions obtained for those areas using the Sr/Fe-Ni/V diagram were much lower: 35% and 9%, respectively. That was due to different sample points used as carbonate end-members on those diagrams because the selection of end-member points was performed according to the rule stating that the most samples should be tightly bound by a polygon whose vertices are solute sources.
The contributions of carbonate rocks calculated using the Sr/Fe-Mo/V (Figure 6a) and Sr/Mn-Mo/V (Figure 6b) mixing diagrams were similar in respective areas despite the different sample points used as carbonate end-members on those diagrams. This probably means that the Mo/V ratio is the more suitable tracer for distinguishing between those two sources than Ni/V ratio. The highest contributions of carbonate rocks were observed for the Buguldeisky (58–69%), Goloustnensky (24–33%), and Listvyansky (19–24%) areas.
In all the areas except the Buguldeisky, the predominant solute sources were Fe-Mn-bearing sedimentary rocks and clays (Figure 9). According to Mo/V diagrams their contributions to trace element composition of surface waters varied in the range 53–92%. The contributions of ore-bearing silicate rocks to water chemistry were quite low (10% on average) in all the areas.
3.7. Source Identification and Apportionment of Anthropogenic Trace Elements
The trace element composition of the water of Selenga River and its sources is of special interest because unlike the western coast, the Selenga watershed is characterized by a high density of municipal and industrial facilities like oil- and coal-fired boilers, wastewater treatment plants, polymetallic mines, engineering enterprises, wagon repair plants, paper mills, etc. [2,71]. Thus, the influence of at least one anthropogenic solute source on water chemistry is quite probable.
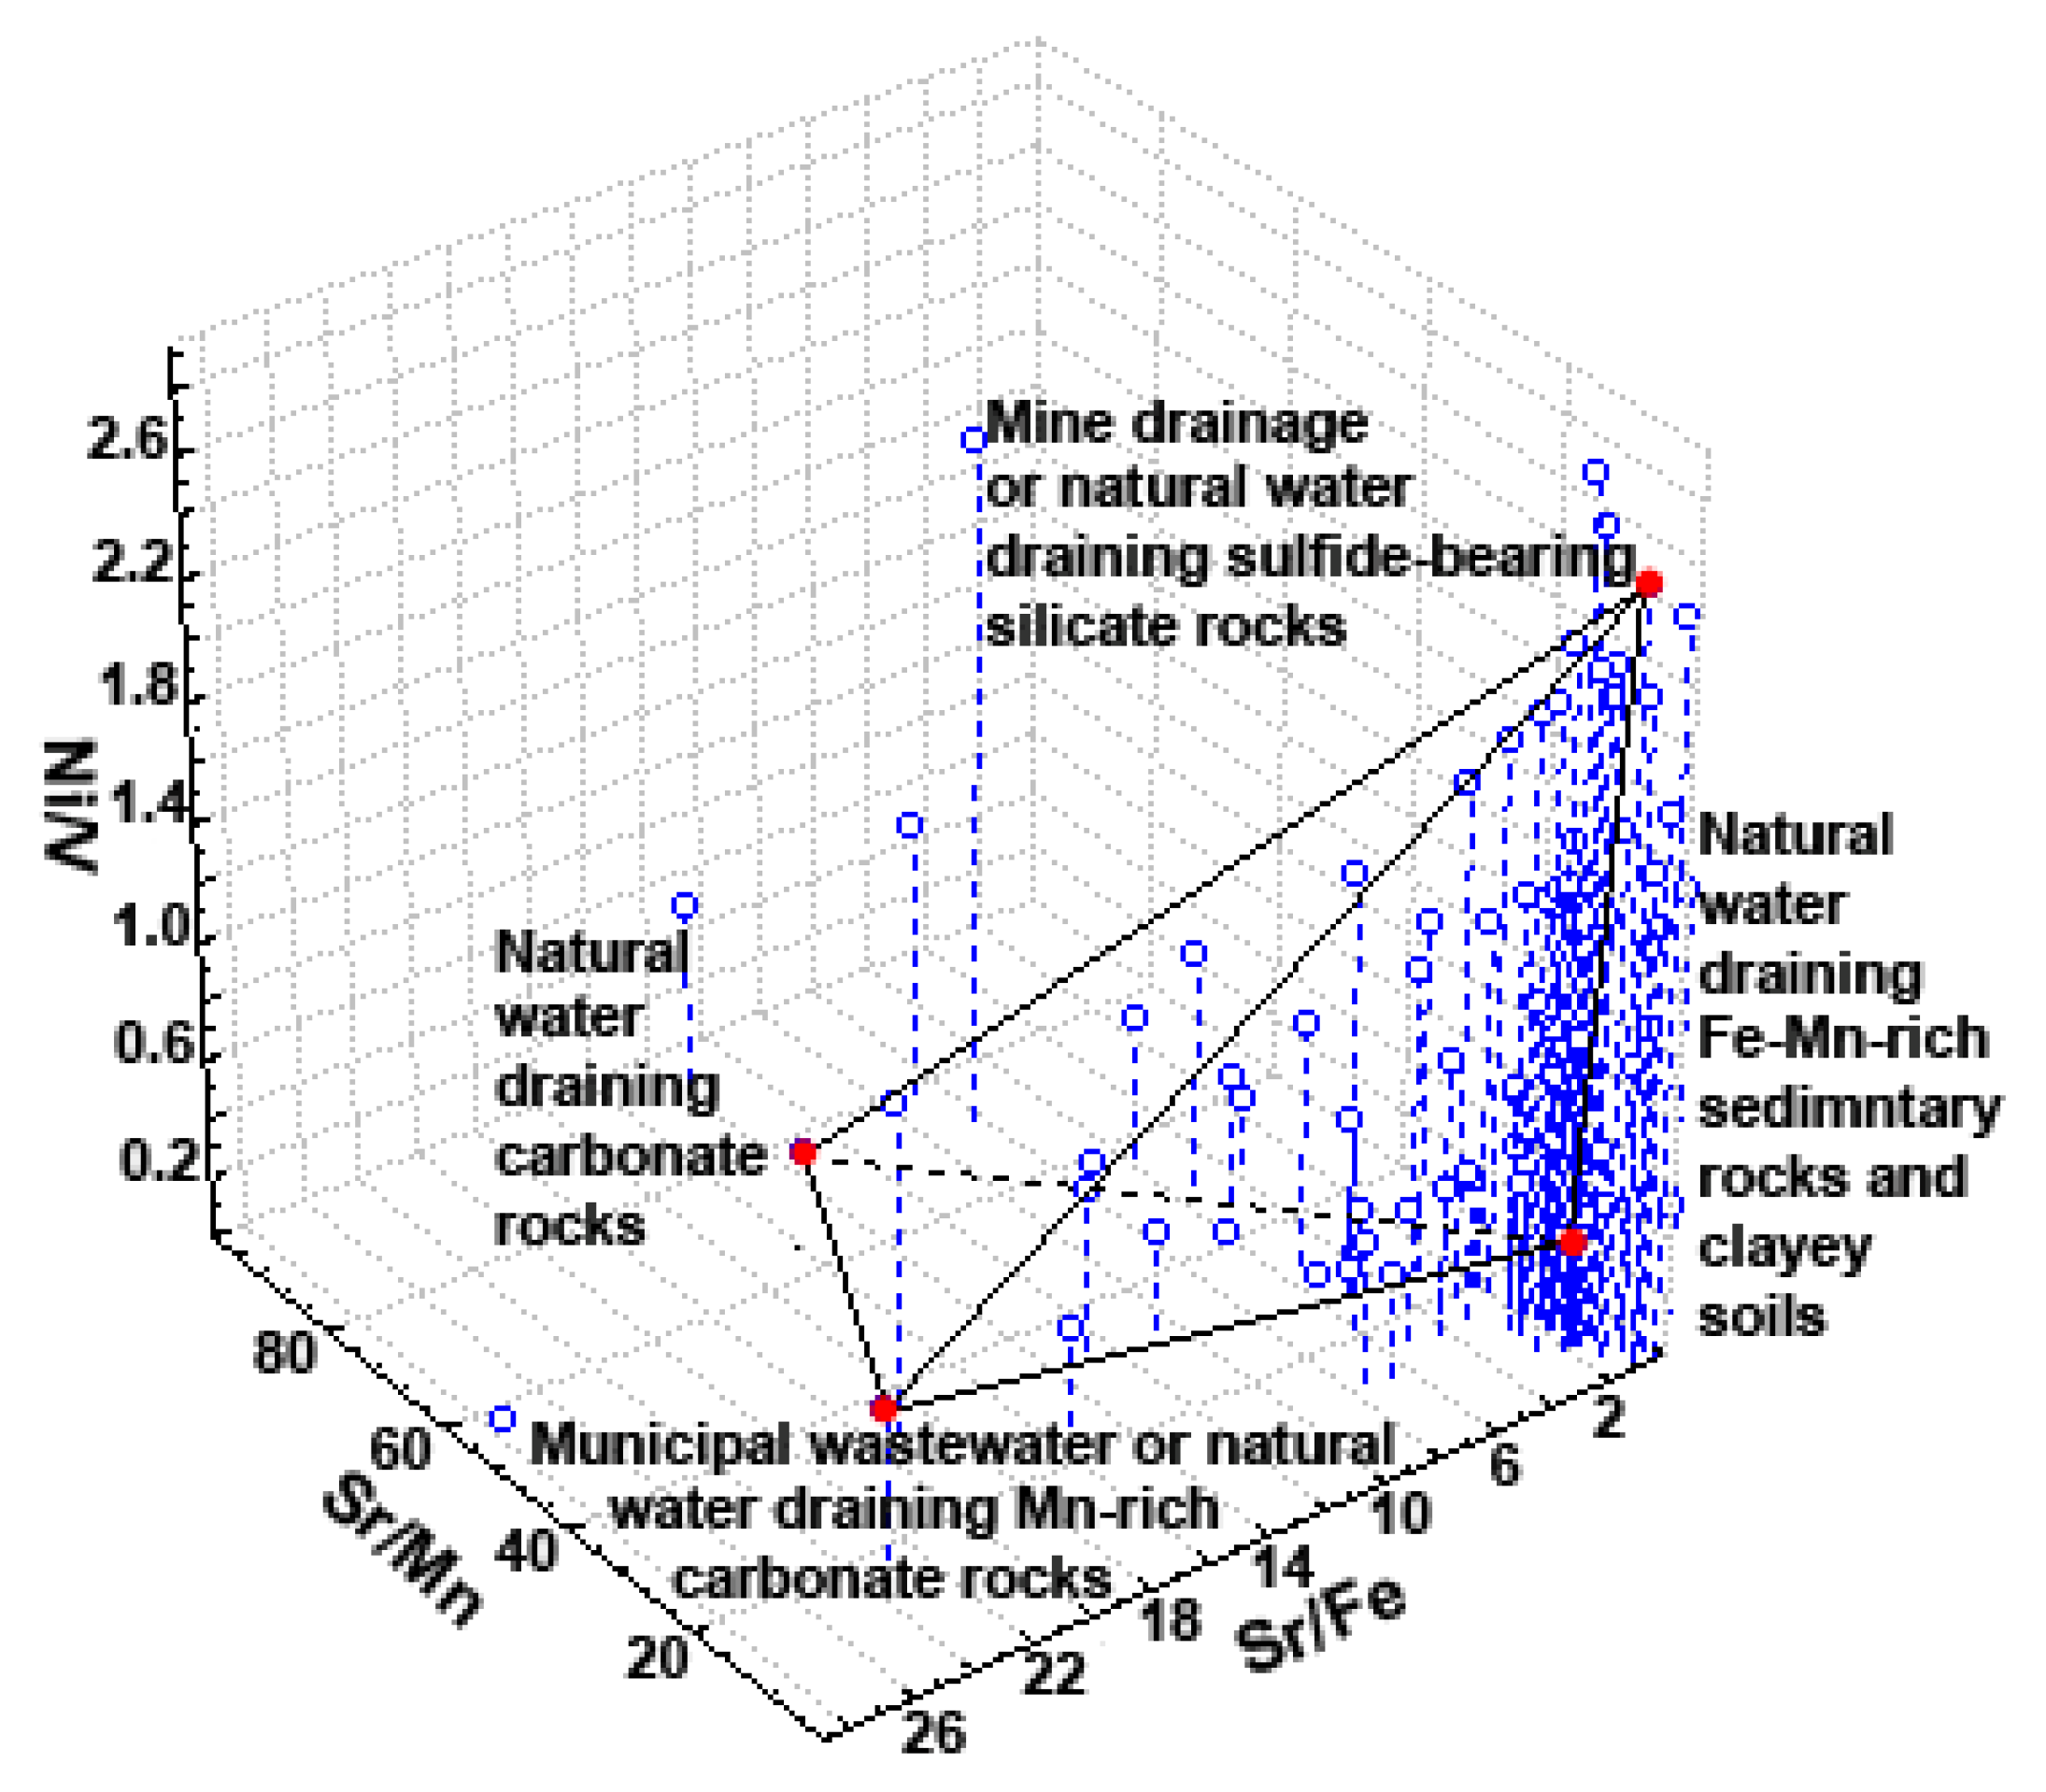
To identify possible anthropogenic trace element sources, all possible pseudo-3D diagrams for all combinations of Sr/Fe, Sr/Mn, Ni/V, and Mo/V ratios were generated. The Sr/Fe, Sr/Mn, and Ni/V ratios were finally chosen as tracers of four sources (Figure 10): two natural ones and two sources that can be either natural or anthropogenic. Two natural sources used previously in Figure 5 and Figure 6 were carbonate rocks and Fe-Mn-bearing sedimentary rocks. The water of the Selenga River sampled downstream from the Ulan-Ude city (station 7 in Figure 2 and Table 4) could represent the municipal wastewater because it was characterized by trace element composition distinctly different from that of waters sampled at the other Selenga stations. However, chemical composition of Selenga water in this river section could be affected by natural groundwater draining Mn-rich carbonate rocks.
The products of the dissolution of sulfide-bearing silicate rocks characterized by increased acidity similar to that of polymetallic mine drainage [72,73] were selected as the one more source that can be either natural or anthropogenic. The choice of mine drainage as the possible solute source was not occasional. The enrichment of the water of the upper Selenga reaches with products of dissolution of polymetallic ores and mining wastes is quite probable because of W and Mo ore deposits and mines located in the upper Selenga basin [67]. The pollution of water of the lower Selenga reaches could be due to waters percolating from old mine workings and tailing dumps that contain residual wastes remained after the extraction of metals at the Dzhida W-Mo plant located in the basin of the Modonkul River—the right tributary of the Dzhida River which is, in turn, the left tributary of the Selenga River [11,15,72,73]. The Dzhida molybdenum plant has not been in operation since 1997; however, its tailing dumps are still full of wastes, so pollutants can still reach the Selenga water via groundwater. It was surprising that despite the present and old Mo mining activities in the Selenga basin, no evidence was found to suggest that the Mo/V concentration ratio can be used as a tracer of any mining operations.
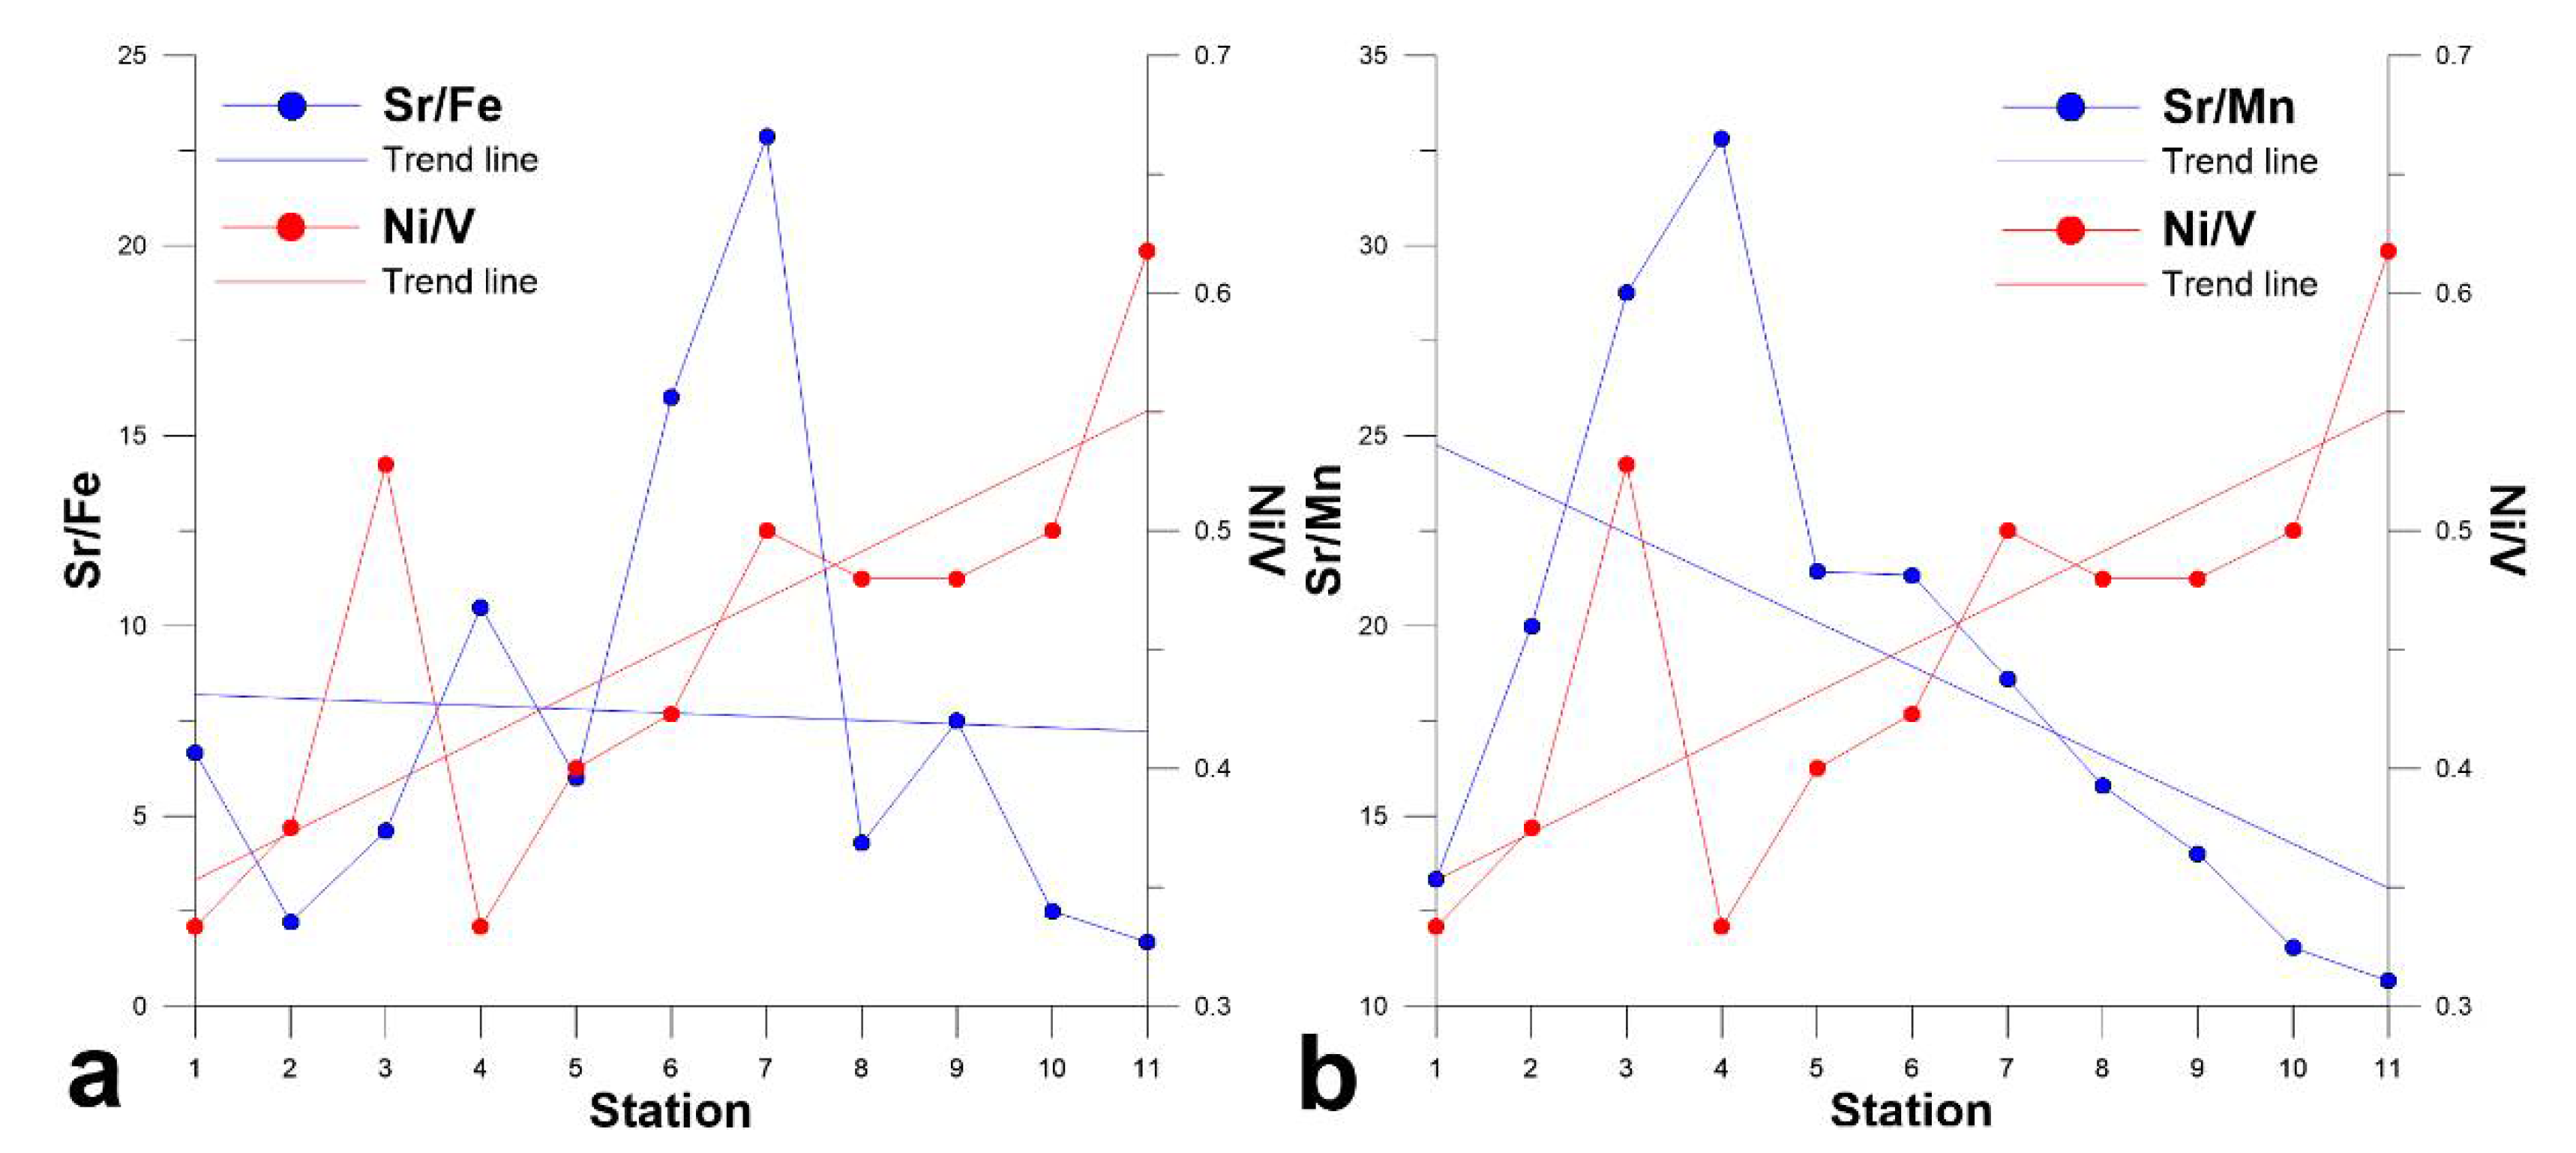
To provide the more complete assessment of the applicability of Sr/Fe, Sr/Mn, Ni/V, and Mo/V ratios as tracers of natural and anthropogenic solute sources, the distribution of those tracer values along the Russian part of the Selenga River was assessed. It was found that the Ni/V ratio increases in the direction from the Mongolian border to Lake Baikal (Figure 11), whereas the Sr/Fe, Sr/Mn, and Mo/V ratios decrease.
Since the most V source in the Selenga basin are silicate rocks [10,74], the increase of the Ni/V ratio in the downstream direction was probably due to the decrease in abundance of V-bearing minerals in rocks. Another reason of the Ni/V ratio increase could be the increase in population density and, consequently, the increase of pollution of the Selenga water with municipal Ni-bearing wastes [75] including faecal matter [76,77]. This point of view is supported by the peaks of the Ni/V ratio that correspond to stations 3, 7, and 11, located downstream the settlements (stations 3 and 11) and cities (station 7).
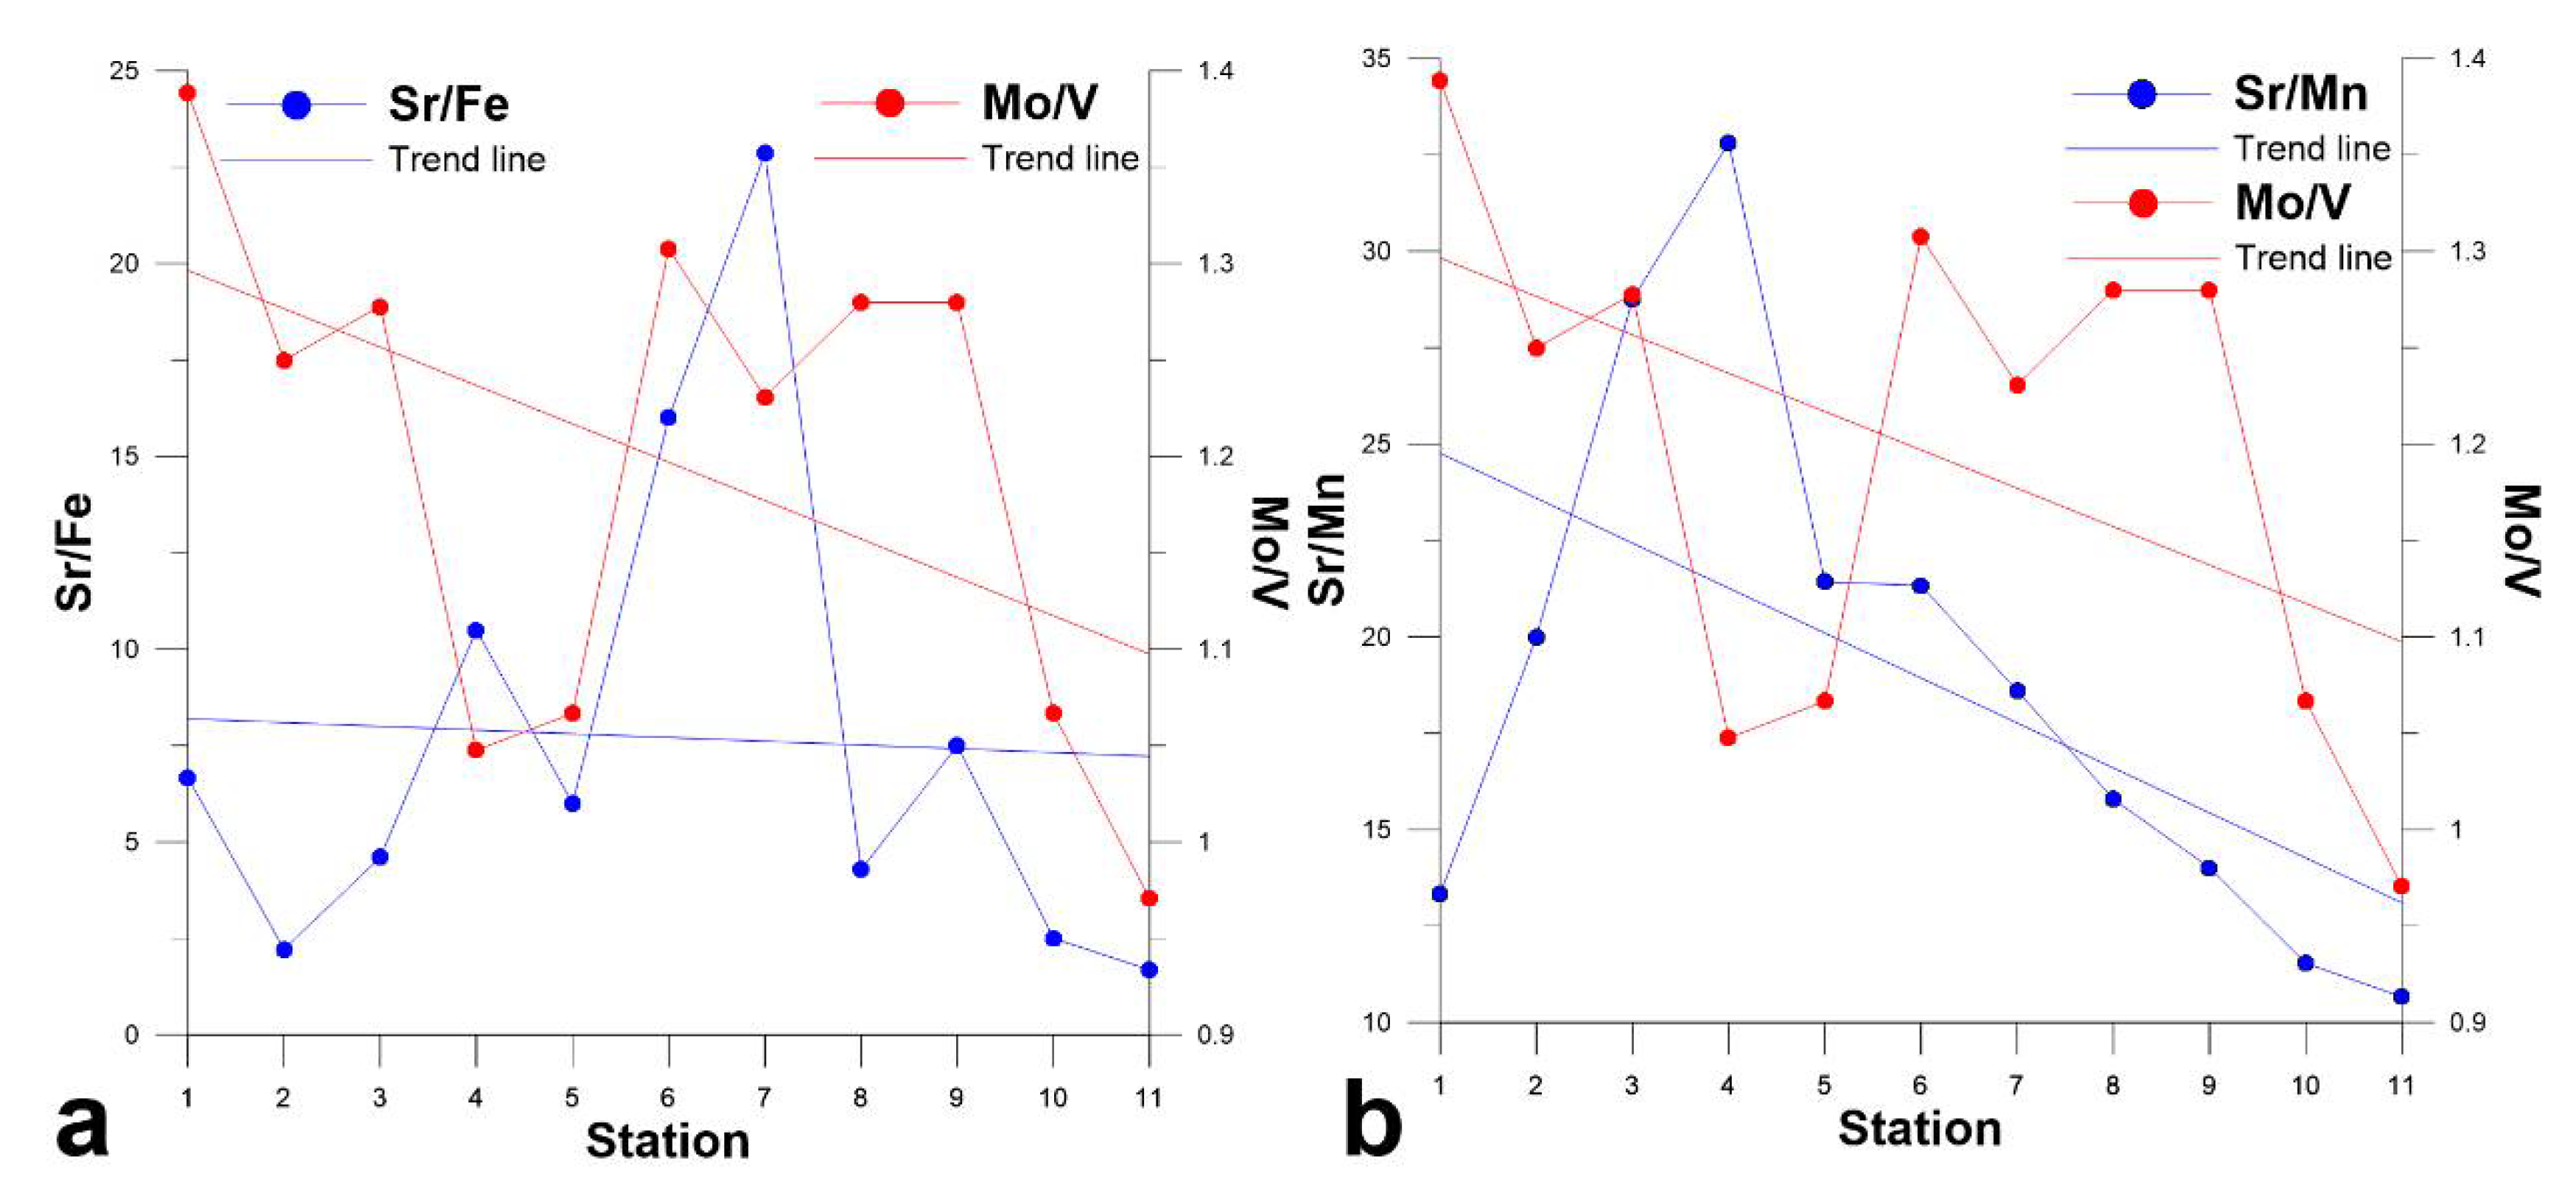
The decrease in Sr/Fe and Sr/Mn ratio values in downstream direction was probably due to decrease in the occurrence of carbonate rocks containing Sr as well as due to increase in mobility of Fe and Mn. The increase in mobility of Fe and Mn was, in turn, due to increase in the concentration of dissolved organic carbon (DOC) and decrease in concentration of dissolved oxygen (DO) in downstream direction [10,12,18]. The peaks of Sr/Fe and Sr/Mn ratios at station 4 can be explained by the discharge of Ca-Sr-rich effluent from the ash dump of the Gusinoozerskaya electric power plant to the Temnik River—the left Selenga tributary. The presence of Sr/Fe peak at station 7, located downstream the Ulan-Ude city, could also be due to discharge of Sr-rich effluent from ash dump of the Ulan-Ude electric power station, whereas the absence of a Sr/Mn peak at that station was probably due to the increased mobility of Mn conditioned by decreased pH in the lower reaches of the Selenga river [10].
According to Mochizuki et al. [69], the highest Mo/V ratio values were observed in the Orkhon River—the right Selenga tributary, polluted with the wastewater from the Erdenet mine (Erdenet city, Mongolia). From the place of confluence of the Orkhon and Selenga rivers to Lake Baikal, the Mo/V ratio values in the Selenga water were gradually decreased (Figure 12) due to dilution of waters unpolluted with Mo except some river sections. According to the present study, the river section characterized by elevated Mo/V ratios was the section between stations 5 and 9. The elevated Mo/V ratio in this section was probably due to pollution of the Selenga water with stormwater runoff from impervious surfaces of the Ulan-Ude city and surrounding areas. The city’s stormwater contains the products of dissolution of V-bearing coal ash [74,78] emitted by coal-fired boilers and thermal power stations. Most of this ash was emitted during the winter and accumulated in snowpack; after, the snowmelt ash particles were accumulated in soil. Another V source in urban environment could be the exhaust of diesel engines [79].
4. Conclusions
The main conclusions reached in this study are as follows:
- Uniform ionic composition of surface waters in the Lake Baikal watershed indicated the existence of only two tracers of main ion sources, such as (Ca2+ + Mg2+)/K+ and SO42−/HCO3−. The use of these tracers allowed identification of the three sources of main ions, such as silicate rocks, sulfide-bearing silicate rocks, and carbonate rocks, and evaluation of their contributions to ionic composition of surface waters.
- The variety of trace element compositions of surface waters in the Lake Baikal watershed indicated the existence of multiple tracers of trace element sources, four of which, namely Sr/Fe, Sr/Mn, Ni/V, and Mo/V, were identified. The use of these tracers and the obtained data on sources of main ions showed the possibility of identifying natural trace element sources and distinguishing between natural and anthropogenic trace element sources.
- The proposed approach allows classification of inland surface waters according to the chemical composition of natural and anthropogenic solute sources and, thus, creation of local water chemistry-based classifications of streams. The classified data on contributions of solute sources to water chemistry are necessary to support and improve water quality.
Supplementary Materials
The following are available online at https://0-www-mdpi-com.brum.beds.ac.uk/article/10.3390/su13105389/s1, Table S1: Ionic composition of riverine waters sampled on the western coast of Lake Baikal, mg/L; Table S2: Trace element composition of riverine waters sampled on the western coast of Lake Baikal, µg/L; Table S3: Average contributions of solute sources to trace element composition of water of western tributaries of Lake Baikal and Selenga River, %; Figure S1: Hierarchical dendrogram for 11 trace metals in water of western tributaries of Lake Baikal and Selenga River, the detailed version of Section 3.4: Identification of trace element sources.
Author Contributions
Research design, M.Y.S.; data analysis M.Y.S. and Y.M.S.; map drawings, A.V.S.; chemical analyses, L.A.B. All authors have read and agreed to the published version of the manuscript.
Funding
This work was supported by the Russian Academy of Sciences, Government contracts Nos. 0279-2021-0014, 121032300199-9 (data analysis) and Nos. 0281-2021-0008, 121012190059-5 (fieldwork), by the Russian Foundation for Basic Research (RFBR) and the Government of the Irkutsk Region, project number 20-45-380013 (chemical analyses and mapping).
Institutional Review Board Statement
Not applicable.
Informed Consent Statement
Not applicable.
Data Availability Statement
Not applicable.
Conflicts of Interest
The authors declare no conflict of interest.
References
- Semenov, M.Y.; Marinaite, I.I. Multi-source apportionment of polycyclic aromatic hydrocarbons using end-member mixing approach. Environ. Earth Sci. 2015, 73, 1769–1777. [Google Scholar] [CrossRef]
- Semenov, M.Y.; Marinaite, I.I.; Golobokova, L.P.; Khuriganova, O.I.; Khodzher, T.V.; Semenov, Y.M. Source apportionment of polycyclic aromatic hydrocarbons in Lake Baikal water and adjacent air layer. Chem. Ecol. 2017, 33, 977–990. [Google Scholar] [CrossRef]
- Semenov, M.; Marinaite, I.; Zhuchenko, N.; Silaev, A.; Vershinin, K.; Semenov, Y. Revealing the factors affecting occurrence and distribution of polycyclic aromatic hydrocarbons in water and sediments of Lake Baikal and its tributaries. Chem. Ecol. 2018, 34, 901–916. [Google Scholar] [CrossRef]
- Christophersen, N.; Neal, C.; Hooper, R.P.; Vogt, R.D.; Andersen, S. Modelling stream water chemistry as a mixture of soilwater end members—A step toward second-generation of acidification models. J. Hydrol. 1990, 116, 307–320. [Google Scholar] [CrossRef]
- Semenov, M.Y.; Zimnik, E.A. A three component hydrograph separation based on relationship between organic and inorganic component concentrations: A case study in Eastern Siberia, Russia. Environ. Earth Sci. 2015, 73, 611–620. [Google Scholar] [CrossRef]
- Kirso, U.; Irha, N.; Paalme, L.; Reznikov, S.; Matveev, A. Levels and origin of PAHs in some big lakes. Polycycl. Aromat. Compd. 2001, 22, 715–728. [Google Scholar] [CrossRef]
- Nikanorov, A.M.; Reznikov, S.A.; Matveev, A.A.; Arakelyan, V.S. Monitoring of polycyclic aromatic hydrocarbons in the Lake Baikal basin in the areas of intensive anthropogenic impact. Russ. Meteorol. Hydrol. 2012, 37, 477–484. [Google Scholar] [CrossRef]
- Reznikov, S.A.; Adzhiev, R.A. Persistent organic pollutants in bottom sediments in the north of Lake Baikal in the area of the Baikal-Amur Mainline impact. Russ. Meteorol. Hydrol. 2015, 40, 207–2014. [Google Scholar] [CrossRef]
- Meuleman, C.; Leermakers, M.; Baeyens, W. Mercury speciation in Lake Baikal. Water Air Soil Pollut. 1995, 80, 539–551. [Google Scholar] [CrossRef]
- Chebykin, E.P.; Sorokovikova, L.M.; Tomberg, I.V.; Rasskazov, S.V.; Khodzher, T.V.; Grachev, M.A. Current state of the Selenga River waters in the Russian territory concerning major components and trace elements. Chem. Sustain. Dev. 2012, 20, 561–580. Available online: https://www.sibran.ru/upload/iblock/d5e/current_state_of_the_selenga_river_waters_in_the_russian_territory_concerning_major_components_and_t.pdf (accessed on 22 February 2021).
- Lychagin, M.; Chalov, S.; Kasimov, N.; Shinkareva, G.; Jarsjo, J.; Thorslund, J. Surface water pathways and fluxes of metals under changing environmental conditions and human interventions in the Selenga River system. Environ. Earth Sci. 2017, 76, 1. [Google Scholar] [CrossRef]
- Semenov, M.Y.; Semenov, Y.M.; Silaev, A.V.; Begunova, L.A. Assessing the Self-Purification Capacity of Surface Waters in Lake Baikal Watershed. Water 2019, 11, 1505. [Google Scholar] [CrossRef] [Green Version]
- Kasimov, N.; Shinkareva, G.; Lychagin, M.; Kosheleva, N.; Chalov, S.; Pashkina, M.; Thorslund, J.; Jarsjö, J. River Water Quality of the Selenga-Baikal Basin: Part I—Spatio-Temporal Patterns of Dissolved and Suspended Metals. Water 2020, 12, 2137. [Google Scholar] [CrossRef]
- Chalov, S.; Thorslund, J.; Kasimov, N.; Aybullatov, D.; Ilyicheva, E.; Karthe, D.; Kositsky, A.; Lychagin, M.; Nittrouer, J.; Pavlov, M.; et al. The Selenga River delta: A geochemical barrier protecting Lake Baikal waters. Reg. Environ. Chang. 2017, 17, 2039–2053. [Google Scholar] [CrossRef]
- Chebykin, E.P.; Goldberg, E.L.; Kulikova, N.S. Elemental composition of suspended particles from the surface waters of Lake Baikal in the zone affected by the Selenga River. Russ. Geol. Geophys. 2010, 51, 1126–1132. [Google Scholar] [CrossRef]
- Yoshioka, T.; Mostofa, K.M.G.; Konohira, E.; Tanoue, E.; Hayakawa, K.; Takahashi, M.; Ueda, S.; Katsuyama, M.; Khodzher, T.; Bashenkhaeva, N.; et al. Distribution and characteristics of molecular size fractions of freshwater dissolved organic matter in watershed environments: Its implicationto degradation. Limnology 2007, 8, 29–44. [Google Scholar] [CrossRef]
- Khazheeva, Z.I.; Plyusnin, A.M. Discharge of biogenic substances with river runoff in Selenga basin. Water Resour. 2012, 39, 420–431. [Google Scholar] [CrossRef]
- Khazheeva, Z.I.; Plyusnin, A.M. The regime of dissolved gases and organic matter in Selenga basin rivers. Water Resour. 2013, 40, 61–73. [Google Scholar] [CrossRef]
- Khodzher, T.V.; Domysheva, V.M.; Sorokovikova, L.M.; Sakirko, M.V.; Tomberg, I.V. Current chemical composition of Lake Baikal water. Inland Waters 2017, 7, 250–258. [Google Scholar] [CrossRef]
- Timoshkin, O.A.; Moore, M.V.; Kulikova, N.N.; Tomberg, I.V.; Malnik, V.V.; Shimaraev, M.N.; Troitskaya, E.S.; Shirokaya, A.A.; Sinyukovich, V.N.; Zaitseva, E.P.; et al. Groundwater contamination by sewage causes benthic algal outbreaks in the littoral zone of Lake Baikal (East Siberia). J. Great Lakes Res. 2018, 44, 230–244. [Google Scholar] [CrossRef]
- Kozhowa, O.M.; Silow, E. The current problems of Lake Baikal ecosystem conservation. Lakes Reserv. Res. Manag. 1998, 3, 19–33. [Google Scholar] [CrossRef]
- Tomberg, I.V.; Sorokovikova, L.M.; Popovskaya, G.I.; Bashenkhaeva, N.V.; Sinyukovich, V.N.; Ivanov, V.G. Concentration dynamics of biogenic elements and phytoplankton at Selenga, R. Mouth and in Selenga shallows (Lake Baikal). Water Resour. 2014, 41, 687–695. [Google Scholar] [CrossRef]
- Panizzo, V.N.; Swann, G.E.A.; Mackay, A.W.; Vologina, E.; Alleman, L.; André, L.; Pashley, V.; Horstwood, M.S.A. Constraining modern-day silicon cycling in Lake Baikal. Glob. Biogeochem. Cycles 2017, 31, 556–574. [Google Scholar] [CrossRef] [Green Version]
- Panizzo, V.N.; Roberts, S.; Swann, G.E.A.; McGowan, S.; Mackay, A.W.; Vologina, E.; Pashley, V.; Horstwood, M.S.A. Spatial differences in dissolved silicon utilization in Lake Baikal, Siberia: Examining the impact of high diatom biomass events and eutrophication. Limnol. Oceanogr. 2018, 63, 1562–1578. [Google Scholar] [CrossRef] [Green Version]
- Kemp, P.H. Chemistry of Natural Waters. Part VI. Classification of Waters. Water Res. 1971, 5, 943–956. [Google Scholar] [CrossRef]
- Stuyfzand, P.J. A New Hydrochemical Classification of Water Types; IAHS-AISH Publication: Wallingford, CT, USA, 1990; Volume 182, pp. 89–98. [Google Scholar]
- Guler, C.; Thyne, G.D.; McCray, J.E.; Turner, A.K. Evaluation of graphical and multivariate statistical method for classification of water chemistry data. Hydrogeol. J. 2002, 10, 455–474. [Google Scholar] [CrossRef]
- Merovich, G.T.; Stiles, J.M.; Petty, J.T.; Ziemkiewicz, P.F.; Fulton, J.B. Water chemistry-based classification of streams and implications for restoring mined watersheds. Environ. Toxicol. Chem. 2007, 26, 1361–1369. [Google Scholar] [CrossRef]
- Strauch, G.; Schreck, P.; Nardin, G.; Gehre, M. Origin and distribution of sulphate in surface waters of the Mansfeld mining district (Central Germany)—A sulphur isotope study. Isot. Environ. Health Stud. 2001, 37, 101–112. [Google Scholar] [CrossRef]
- Porowski, A.; Porowska, D.; Halas, S. Identification of Sulfate Sources and Biogeochemical Processes in an Aquifer Affected by Peatland: Insights from Monitoring the Isotopic Composition of Groundwater Sulfate in Kampinos National Park, Poland. Water 2019, 11, 1388. [Google Scholar] [CrossRef] [Green Version]
- Mayer, B.; Shanley, J.B.; Bailey, S.W.; Mitchell, M.J. Identifying sources of stream water sulfate after a summer drought in the Sleepers River watershed (Vermont, USA) using hydrological, chemical, and isotopic techniques. Appl. Geochem. 2010, 25, 747–754. [Google Scholar] [CrossRef]
- Borzenko, S.V.; Shvartsev, S.L. Chemical composition of salt lakes in East Transbaikalia (Russia). Appl. Geochem. 2019, 103, 72–84. [Google Scholar] [CrossRef]
- Hounslow, A.W. Water Quality Data: Analysis and Interpretation; CRC Press; Lewis Publishers: Boca Raton, FL, USA, 1995; p. 416. [Google Scholar]
- Alfarrah, N.; Walraevens, K. Groundwater Overexploitation and Seawater Intrusion in Coastal Areas of Arid and Semi-Arid Regions. Water 2018, 10, 143. [Google Scholar] [CrossRef] [Green Version]
- Kirchner, J.W. A double paradox in catchment hydrology and geochemistry. Hydrol. Process. 2003, 17, 871–874. [Google Scholar] [CrossRef]
- Sun, H.; Alexander, J.; Gove, B.; Pezzi, E.; Chakowski, N.; Husch, J. Mineralogical and anthropogenic controls of stream water chemistry in salted watersheds. Appl. Geochem. 2014, 48, 141–154. [Google Scholar] [CrossRef]
- Gaillardet, J.; Dupré, B.; Louvat, P.; Allegre, C.J. Global silicate weathering and CO2 consumption rates deduced from the chemistry of large rivers. Chem. Geol. 1999, 159, 3–30. [Google Scholar] [CrossRef]
- Bucher, K.; Zhou, W.; Stober, I. Rocks control the chemical composition of surface water from the high Alpine Zermatt area (Swiss Alps). Swiss J. Geosci. 2017, 110, 811–831. [Google Scholar] [CrossRef]
- Walter, J.; Chesnaux, R.; Cloutier, V.; Gaboury, D. The influence of water/rock-water/clay interactions and mixing in the salinization processes of groundwater. J. Hydrol. Reg. Stud. 2017, 13, 168–188. [Google Scholar] [CrossRef]
- Votintsev, K.K. Hydrochemistry of Lake Baikal; AN SSSR: Moscow, Russia, 1961. (In Russian) [Google Scholar]
- Domysheva, V.M.; Sorokovikova, L.M.; Sinyukovich, V.N.; Onishchuk, N.A.; Sakirko, M.V.; Tomberg, I.V.; Zhuchenko, N.A.; Golobokova, L.P.; Khodzher, T.V. Ionic Composition of Water in Lake Baikal, Its Tributaries, and the Angara River Source during the Modern Period. Russ. Meteorol. Hydrol. 2019, 44, 687–694. [Google Scholar] [CrossRef]
- Alekin, O.A. Osnovy Gidrokhimii (Fundamental of Hydrochemistry); Gidrometeoizdat: Leningrad, Russia, 1966. [Google Scholar]
- Semenov, M.Y.; Sandimirova, G.P.; Korovyakova, I.V.; Troitskaya, E.S.; Khramtsova, T.I.; Donskaya, T.V. Comparative assessment of soil weathering rates in the landscapes of the northern slope of the Khamar-Daban ridge. Russ. Geol. Geophys. 2005, 46, 50–59. [Google Scholar]
- Semenov, M.Y.; Van Grieken, R. Base cation fluxes in mountain landscapes of Lake Baikal southern shore. Commun. Soil Sci. Plant Anal. 2007, 38, 2635–2646. [Google Scholar] [CrossRef]
- Falkner, K.K.; Measures, C.I.; Herbelin, S.E.; Edmond, J.M.; Weiss, R.F. The major and minor element geochemistry of Lake Baikal. Limnol. Oceanogr. 1991, 36, 413–423. [Google Scholar] [CrossRef] [Green Version]
- Falkner, K.K.; Church, M.; Measures, C.I.; LeBaron, G.; Thouron, D.; Jeandel, C.; Stordal, M.C.; Gill, G.A.; Mortlock, R.; Froelich, P.; et al. Minor and trace element chemistry of Lake Baikal, its tributaries, and surrounding hot springs. Limnol. Oceanogr. 1997, 42, 329–345. [Google Scholar] [CrossRef]
- Kuzmin, M.I.; Drill, S.I.; Sandimirov, I.V.; Sandimirova, G.P.; Geletii, V.F.; Chukanov, V.S.; Kalmychkov, G.V.; Bychinskii, V.A. Strontium isotope variations in the sedimentary sequence of Lake Baikal. Dokl. Earth Sci. 2007, 412, 131–135. [Google Scholar] [CrossRef]
- Pavlov, V.E.; Sorokovikova, L.M.; Tomberg, I.V.; Khvostov, I.V. Fifty-year variations in water ionic composition in small tributaries of the Southern Baikal. Water Resour. 2014, 41, 553–555. [Google Scholar] [CrossRef]
- Sorokovikova, L.M.; Sinyukovich, V.N.; Netsvetaeva, O.G.; Tomberg, I.V.; Sez’ko, N.P.; Lopatina, I.N. Chemical composition of snow water and river water on the southeastern shore of Lake Baikal. Russ. Meteorol. Hydrol. 2015, 40, 334–342. [Google Scholar] [CrossRef]
- Sinyukovich, V.N. Relationships between water flow and dissolved solids discharge in the major tributaries of Lake Baikal. Water Resour. 2003, 30, 186–190. [Google Scholar] [CrossRef]
- Sorokovikova, L.M.; Sinyukovich, V.N.; Netsvetayeva, O.G.; Tomberg, I.V.; Sezko, N.P. The entry of sulfates and nitrogen into Lake Baikal with the waters of its influent rivers. Geogr. Nat. Resour. 2009, 30, 35–39. [Google Scholar] [CrossRef]
- Li, T.; Sun, G.; Ma, S.; Liang, K.; Yang, C.; Li, B.; Liang, K.; Yang, C.; Li, B.; Luo, W. Inferring sources of polycyclic aromatic hydrocarbons (PAHs) in sediments from the western Taiwan Strait through end-member mixing analysis. Mar. Pollut. Bull. 2016, 112, 166–176. [Google Scholar] [CrossRef]
- Liu, Y.; Yamanaka, T. Tracing groundwater recharge sources in a mountain–plain transitional area using stable isotopes and hydrochemistry. J. Hydrol. 2012, 464–465, 116–126. [Google Scholar] [CrossRef] [Green Version]
- Liu, F.; Williams, M.; Caine, N. Source waters and flow paths in a seasonally snow-covered catchment, Colorado Front Range, USA. Water Resour. Res. 2004, 40. [Google Scholar] [CrossRef] [Green Version]
- Kuz’min, M.I.; Bychinskii, V.A.; Kerber, E.V.; Oshchepkova, A.V.; Goreglyad, A.V.; Ivanov, E.V. Chemical composition of sediments in Baikal deep-water boreholes as a basis for reconstructions of climatic and environmental changes. Russ. Geol. Geophys. 2014, 55, 1–17. [Google Scholar] [CrossRef]
- Geological Map of Central Asia and Adjacent Areas. Atlas of Geological Maps of Central Asia and Adjacent Areas. Scale 1:2,500,000; Geological Publishing House: Beijing, China, 2008; p. 5. Available online: http://neotec.ginras.ru/neomaps/M025_Asia-C_2008_Geology.jpg (accessed on 22 February 2021).
- Vernadskij, V.I. Problemy Biogeohimii [Biogeochemistry Issues]; M. Nauka: Moscow, Russia, 1980; p. 320. (In Russian) [Google Scholar]
- Hoskin, P.W.O.; Kinny, P.D.; Wyborn, D.; Chappell, B.W. Identifying Accessory Mineral Saturation during Differentiation in Granitoid Magmas: An Integrated Approach. J. Petrol. 2000, 41, 1365–1396. [Google Scholar] [CrossRef]
- Zhang, Z.; Xiao, C.; Adeyeye, O.; Yang, W.; Liang, X. Source and Mobilization Mechanism of Iron, Manganese and Arsenic in Groundwater of Shuangliao City, Northeast China. Water 2020, 12, 534. [Google Scholar] [CrossRef] [Green Version]
- Lovley, D.R.; Phillips, E.J. Novel mode of microbial energy metabolism: Organic carbon oxidation coupled to dissimilatory reduction of iron or manganese. Appl. Environ. Microbiol. 1988, 54, 1472–1480. [Google Scholar] [CrossRef] [Green Version]
- Schaefer, M.V.; Handler, R.M.; Scherer, M.M. Fe(II) reduction of pyrolusite (β-MnO2) and secondary mineral evolution. Geochem. Trans. 2017, 18, 7. [Google Scholar] [CrossRef] [Green Version]
- Lowson, R.T.; Comarmond, M.-C.J.; Rajaratnam, G.; Brown, P.L. The kinetics of the dissolution of chlorite as a function of pH and at 25 °C. Geochim. Cosmochim. Acta 2005, 69, 1687–1699. [Google Scholar] [CrossRef]
- Nekrasov, I.J.; Besmen, N.I. Pyrite-pyrrhotite geothermometer. Distribution of cobalt, nickel and tin. Phys. Chem. Earth 1979, 11, 767–771. [Google Scholar] [CrossRef]
- Torma, A.E. Microbiological oxidation of synthetic cobalt, nickel and zinc sulfides by Thiobacillus ferrooxidans. Rev. Can. Biol. 1971, 3, 209–216. [Google Scholar]
- Matasova, G.G.; Kazansky, A.Y.; Kozhevnikov, N.O.; Snopkov, S.V.; Kharinsky, A.V. A rock magnetic quest for possible ore sources for the ancient iron smelting industry in the Olkhon region (Lake Baikal, Siberia). Archaeometry 2017, 59, 511–527. [Google Scholar] [CrossRef]
- Sklyarov, E.V.; Sklyarova, O.A.; Lavrenchuk, A.V.; Menshagin, Y.V. Natural pollutants of Northern Lake Baikal. Environ. Earth Sci. 2015, 74, 2143–2155. [Google Scholar] [CrossRef]
- Solongo, T.; Fukushi, K.; Altansukh, O.; Takahashi, Y.; Akehi, A.; Baasansuren, G.; Ariuntungalag, Y.; Enkhjin, O.; Davaajargal, B.; Davaadorj, D.; et al. Distribution and Chemical Speciation of Molybdenum in River and Pond Sediments Affected by Mining Activity in Erdenet City, Mongolia. Minerals 2018, 8, 288. [Google Scholar] [CrossRef] [Green Version]
- Sklyarov, E.V.; Lavrenchuk, A.V.; Starikova, A.E.; Fedorovsky, V.S.; Khromova, E.A. Genesis of Manganese Ore Occurrences of the Olkhon Terrane the Western Baikal Region. Petrology 2019, 27, 79–94. [Google Scholar] [CrossRef]
- Mochizuki, A.; Murata, T.; Hosoda, K.; Katano, T.; Tanaka, Y.; Mimura, T.; Mitamura, O.; Nakano, S.; Okazaki, Y.; Sugiyama, Y.; et al. Distributions and geochemical behaviors of oxyanion-forming trace elements and uranium in the Hovsgol–Baikal–Yenisei water system of Mongolia and Russia. J. Geochem. Explor. 2018, 188, 123–136. [Google Scholar] [CrossRef]
- Granina, L.Z.; Mats, V.D.; Fedorin, M.A. Iron-manganese formations in the Baikal region. Russ. Geol. Geophys. 2010, 51, 649–659. [Google Scholar] [CrossRef]
- Semenov, M.Y.; Silaev, A.V.; Semenov, Y.M.; Begunova, L.A. Using Si, Al and Fe as Tracers for Source Apportionment of Air Pollutants in Lake Baikal Snowpack. Sustainability 2020, 12, 3392. [Google Scholar] [CrossRef] [Green Version]
- Plyusnin, A.; Smirnova, O.; Robinson, P. Storage and processing of acid waste waters of mining enterprises. E3S Web Conf. 2019, 98, 01041. [Google Scholar] [CrossRef]
- Khazheeva, Z.I.; Plyusnin, A.M.; Smirnova, O.K.; Peryazeva, E.G.; Zhambalova, D.I.; Doroshkevich, S.G.; Dabaeva, V.V. Mining Activities and the Chemical Composition of R.; Modonkul, Transbaikalia. Water 2020, 12, 979. [Google Scholar] [CrossRef] [Green Version]
- Kasimov, N.; Kosheleva, N.; Gunin, P.; Korlyakov, I.; Sorokina, O.; Timofeev, I. State of the environment of urban and mining areas in the Selenga Transboundary River Basin (Mongolia Russia). Environ. Earth Sci. 2016, 75, 1283. [Google Scholar] [CrossRef]
- Drozdova, J.; Raclavska, H.; Raclavsky, K.; Skrobankova, H. Heavy metals in domestic wastewater with respect to urban population in Ostrava, Czech Republic. Water Environ. J. 2019, 33, 77–85. [Google Scholar] [CrossRef] [Green Version]
- Horak, E.; Sunderman, F.W. Fecal Nickel Excretion by Healthy Adults. Clin. Chem. 1973, 19, 429–430. [Google Scholar] [CrossRef]
- Svane, S.; Karring, H.; Cholkar, K. A comparison of the transition metal concentrations in the faeces, urine, and manure slurry from different livestock animals related to environmentally relevant microbial processes. Cogent Chem. 2019, 5. [Google Scholar] [CrossRef]
- Font, O.; Querol, X.; Juan, R.; Casado, R.; Ruiz, C.R.; López-Soler, A.; Coca, P.; García Peña, F. Recovery of gallium and vanadium from gasification fly ash. J. Hazard Mater. 2007, 139, 413–423. [Google Scholar] [CrossRef] [PubMed]
- Shafer, M.M.; Toner, B.M.; Overdier, J.T.; Schauer, J.J.; Fakra, S.C.; Hu, S.; Herner, J.D.; Ayala, A. Chemical speciation of vanadium in particulate matter emitted from diesel vehicles and urban atmospheric aerosols. Environ. Sci. Technol. 2012, 46, 189–195. [Google Scholar] [CrossRef] [PubMed]
Figure 1.
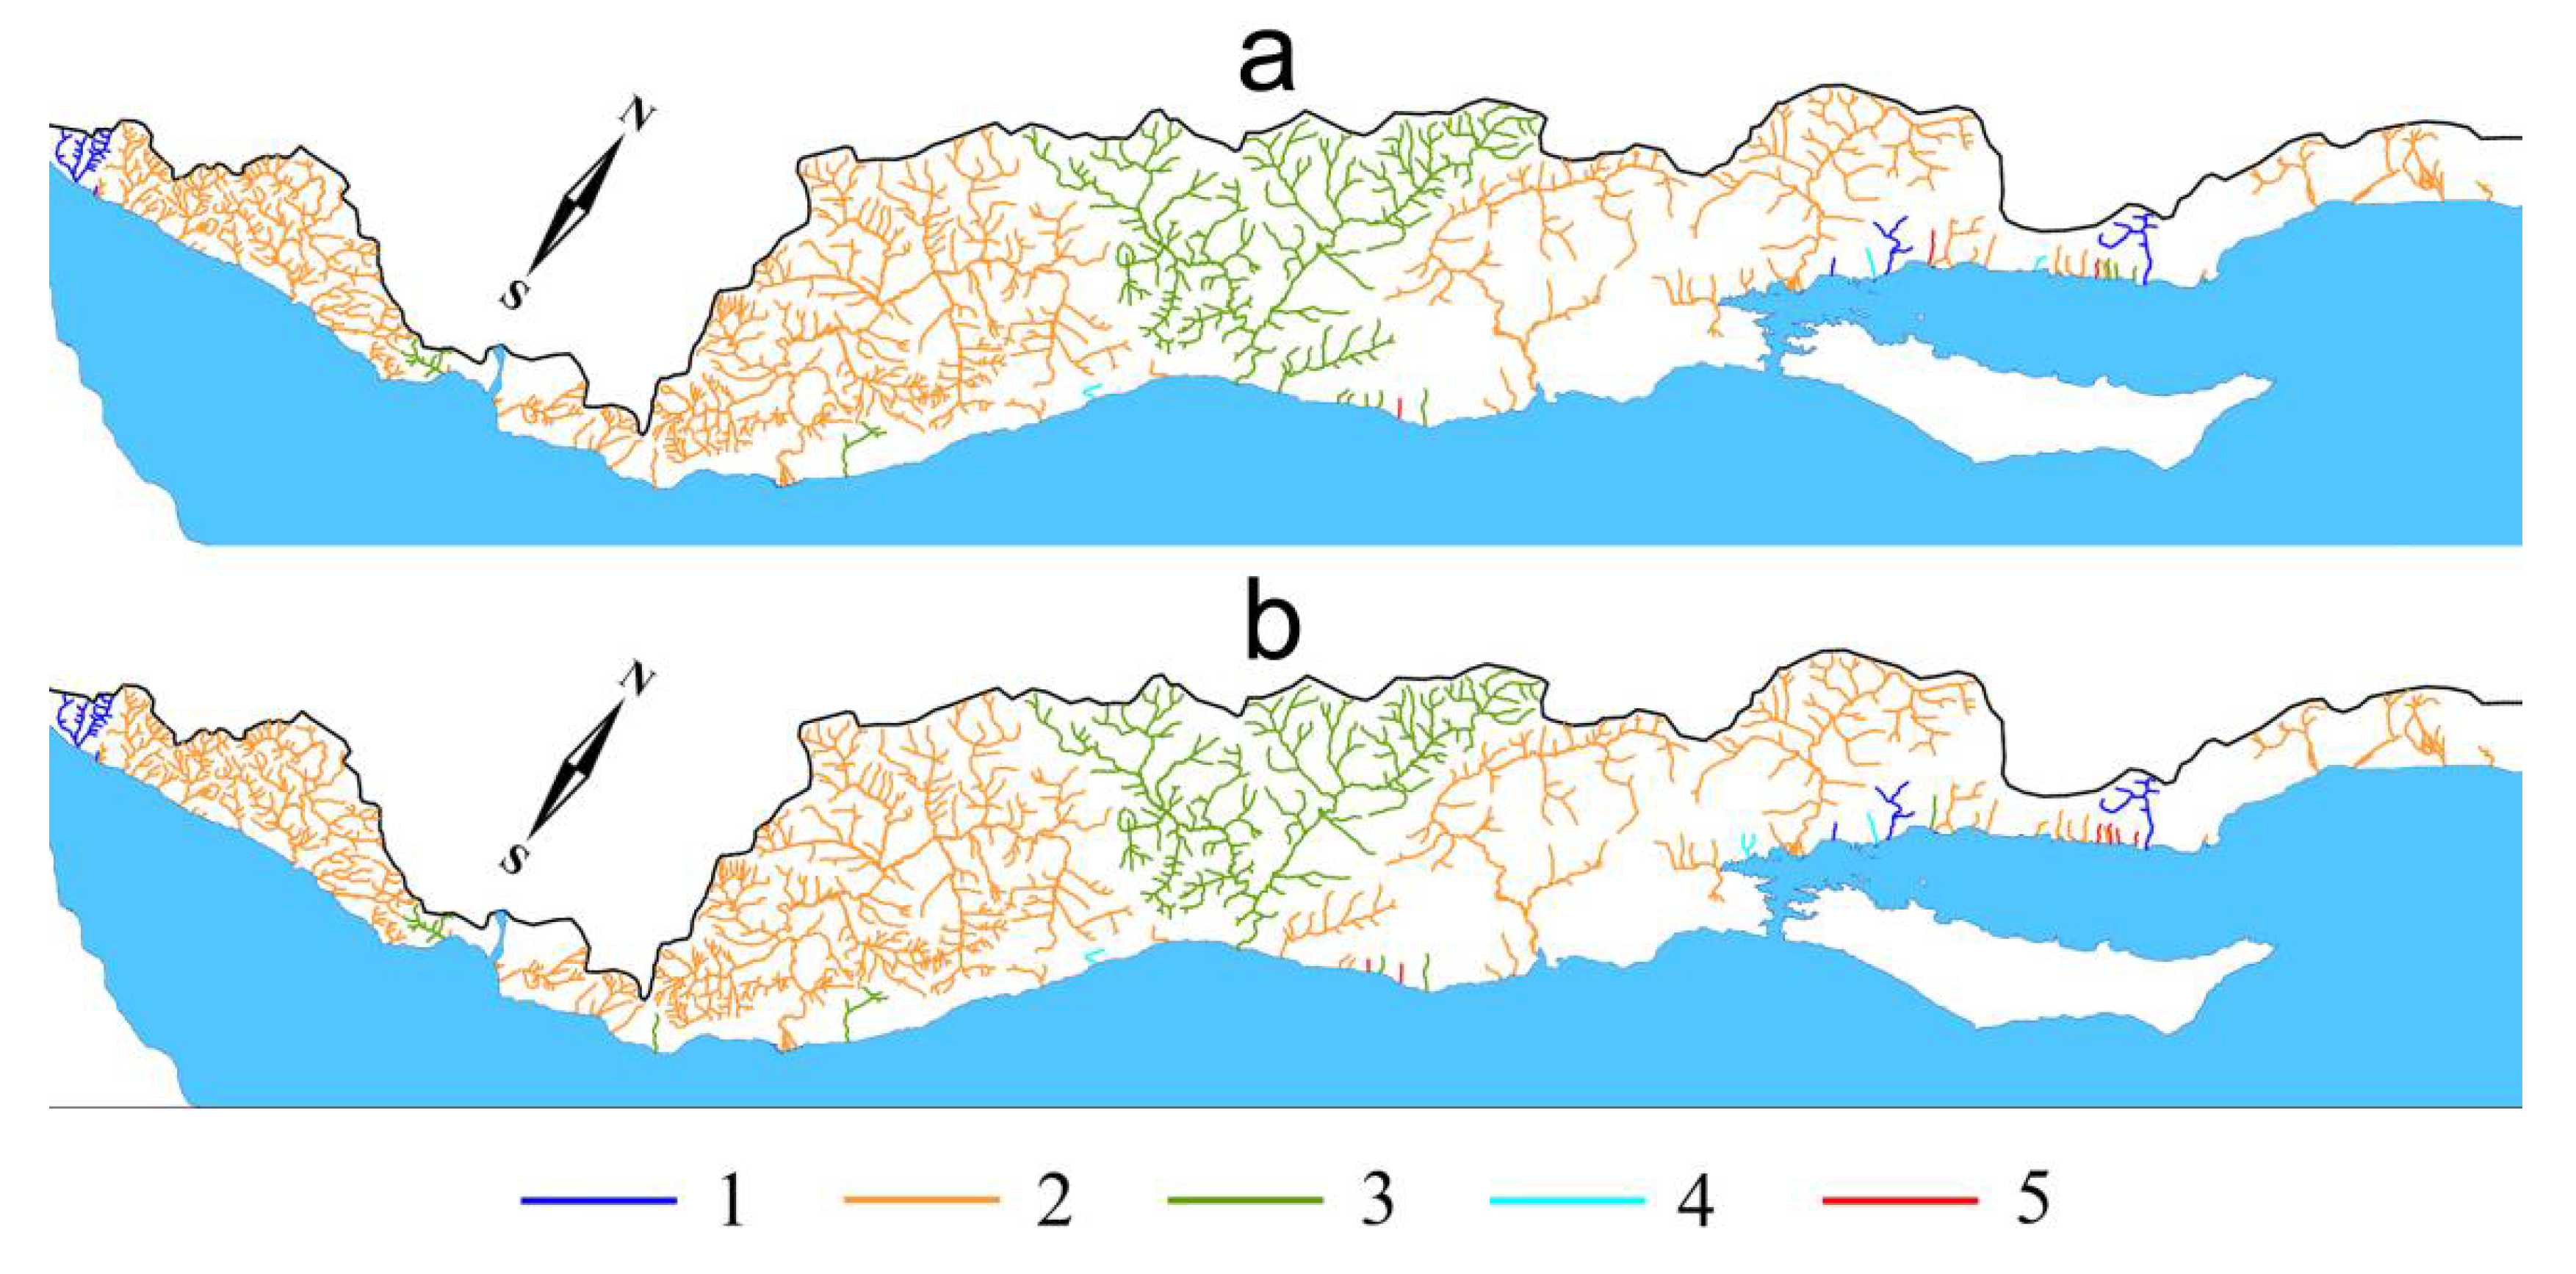
The studied northern (a) and southern (b) parts of southwestern coast of Lake Baikal: (1) Boundaries of areas delineated on the basis of water chemistry data; (2) upper boundary of river watersheds; (3) stream numbers (the same as in Tables S1 and S2); and (4) numbers of delineated areas: I, Marituisky; II, Baikalsky; III, Listvyansky; IV, Goloustnensky; V, Buguldeisky; VI, Elantsinsky; VII, Ongurensky.
Figure 1.
The studied northern (a) and southern (b) parts of southwestern coast of Lake Baikal: (1) Boundaries of areas delineated on the basis of water chemistry data; (2) upper boundary of river watersheds; (3) stream numbers (the same as in Tables S1 and S2); and (4) numbers of delineated areas: I, Marituisky; II, Baikalsky; III, Listvyansky; IV, Goloustnensky; V, Buguldeisky; VI, Elantsinsky; VII, Ongurensky.

Figure 2.
The location of water sampling stations in the studied part of the Selenga River; digits are station numbers (the same as in all tables and figures containing data on Selenga water chemistry).
Figure 2.
The location of water sampling stations in the studied part of the Selenga River; digits are station numbers (the same as in all tables and figures containing data on Selenga water chemistry).

Figure 3.
Piper diagram for the water samples from the western tributaries of Lake Baikal and the Selenga River; colored circles are samples from: (1) Marituisky area, (2) Baikalsky area, (3) Listvyansky area, (4) Goloustnensky area, (5) Buguldeisky area, (6) Elantsinsky, (7) Ongurensky area, and (8) Selenga River.

Figure 4.
Ionic composition of waters of the western Baikal tributaries and Selenga River as the mixture of dissolution products of three rock types: sulfide-bearing silicate rocks, silicate rocks, and carbonate rocks; colored circles are samples from: (1) Marituisky area, (2) Baikalsky area, (3) Listvyansky area, (4) Goloustnensky area, (5) Buguldeisky area, (6) Elantsinsky, (7) Ongurensky area, and (8) Selenga River.

Figure 5.
Trace element composition of waters of the western Baikal tributaries and Selenga River as the mixture of dissolution products of sulfide-bearing silicate rocks, carbonate rocks, and Fe-Mn-rich sedimentary rocks and clays in coordinates of Sr/Fe-Ni/V (a) and Sr/Mn-Ni/V (b) ratios; colored circles are samples from: (1) Marituisky area, (2) Baikalsky area, (3) Listvyansky area, (4) Goloustnensky area, (5) Buguldeisky area, (6) Elantsinsky, (7) Ongurensky area, and (8) Selenga River.

Figure 6.
Trace element composition of waters of the western Baikal tributaries and Selenga River as the mixture of dissolution products of ore-bearing silicate rocks, carbonate rocks, and Fe-Mn-rich sedimentary rocks and clays in coordinates of Sr/Fe-Mo/V (a) and Sr/Mn-Mo/V (b) ratios; colored circles are samples from: (1) Marituisky area, (2) Baikalsky area, (3) Listvyansky area, (4) Goloustnensky area, (5) Buguldeisky area, (6) Elantsinsky, (7) Ongurensky area, and (8) Selenga River.

Figure 7.
Spatial distribution of western Baikal tributaries characterized by different sources of main ions in water, identified using (Ca2+ + Mg2+)/K+ and SO42−/HCO3− tracers; sources: (1) sulfide-bearing silicate rocks, (2) silicate rocks, (3) carbonate rocks, (4) sulfide-bearing silicate rocks + silicate rocks, and (5) silicate rocks + carbonate rocks.

Figure 8.
Spatial distribution of western Baikal tributaries characterized by different sources of trace elements in water, identified using Sr/Fe-Ni/V (a) and Sr/Mn-Ni/V (b) tracer pairs; sources: (1) sulfide-bearing silicate rocks, (2) Fe-Mn-rich sedimentary rocks and clays, (3) carbonate rocks, (4) sulfide-bearing silicate rocks + Fe-Mn-rich sedimentary rocks and clays, and (5) Fe-Mn-rich sedimentary rocks and clays + carbonate rocks.

Figure 9.
Spatial distribution of western Baikal tributaries characterized by different sources of trace elements in water, identified using Sr/Fe-Mo/V (a) and Sr/Mn-Mo/V (b) tracer pairs; sources: (1) ore-bearing silicate rocks, (2) Fe-Mn-rich sedimentary rocks and clays, (3) carbonate rocks, (4) ore-bearing silicate rocks + Fe-Mn-rich sedimentary rocks and clays, and (5) Fe-Mn-rich sedimentary rocks and clays + carbonate rocks.

Figure 10.
Trace element composition of waters of the western Baikal tributaries and Selenga River as the mixture of dissolution products of four natural and anthropogenic solute sources; red circles are sources, empty circles are water samples.
Figure 10.
Trace element composition of waters of the western Baikal tributaries and Selenga River as the mixture of dissolution products of four natural and anthropogenic solute sources; red circles are sources, empty circles are water samples.

Figure 11.
The change in Ni/V ratio with respect to Sr/Fe (a) and Sr/Mn (b) ratios downstream the Selenga River.
Figure 11.
The change in Ni/V ratio with respect to Sr/Fe (a) and Sr/Mn (b) ratios downstream the Selenga River.

Figure 12.
The change in Mo/V ratio with respect to Sr/Fe (a) and Sr/Mn (b) ratios downstream the Selenga River.
Figure 12.
The change in Mo/V ratio with respect to Sr/Fe (a) and Sr/Mn (b) ratios downstream the Selenga River.


Table 1.
Ionic composition of riverine waters sampled on the western coast of Lake Baikal, mg/L.
| Area | K+ | Na+ | Mg2+ | Ca2+ | Cl− | SO42− | HCO3− |
|---|---|---|---|---|---|---|---|
| Two-year average ionic composition of riverine water from 7 areas selected on the western coast | |||||||
| Marituisky (n = 13) * | 1.16 | 2.38 | 1.38 | 8.57 | 0.41 | 9.05 | 28.4 |
| Baikalsky (n = 8) | 0.78 | 2.79 | 3.30 | 12.9 | 0.71 | 11.2 | 49.1 |
| Listvyansky (n = 11) | 0.94 | 3.93 | 6.37 | 18.7 | 1.26 | 26.1 | 66.0 |
| Goloustnensky (n = 4) | 0.56 | 1.83 | 8.03 | 22.3 | 0.44 | 15.7 | 93.8 |
| Buguldeyisky (n = 9) | 1.66 | 7.46 | 17.6 | 48.7 | 1.69 | 22.4 | 229 |
| Yelantsinsky (n = 13) | 0.99 | 2.14 | 3.73 | 14.0 | 0.91 | 4.88 | 61.1 |
| Onguryonsky (n = 17) | 1.22 | 2.13 | 11.3 | 28.6 | 1.09 | 14.7 | 131 |
| Basic statistical parameters of ionic composition of water from 75 western tributaries | |||||||
| Average | 1.10 | 3.14 | 7.27 | 21.5 | 0.96 | 14.3 | 92.7 |
| Minimum | 0.20 | 0.80 | 0.36 | 5.20 | 0.17 | 2.10 | 17.3 |
| Maximum | 3.10 | 13.1 | 41.9 | 92.0 | 6.16 | 60.3 | 446 |
| RSD ** | 0.61 | 2.24 | 7.55 | 17.2 | 9.41 | 12.4 | 85.8 |
* Number of sampled streams; ** Relative standard deviation.
Table 2.
Ionic composition of water of the Selenga River sampled at different stations and its basic statistical parameters, mg/L.
Table 2.
Ionic composition of water of the Selenga River sampled at different stations and its basic statistical parameters, mg/L.
| Station | K+ | Na+ | Mg2+ | Ca2+ | Cl− | SO42− | HCO3− |
|---|---|---|---|---|---|---|---|
| 1 | 1.66 | 6.91 | 6.23 | 28.0 | 1.53 | 15.1 | 118 |
| 2 | 1.68 | 7.01 | 6.32 | 29.3 | 1.61 | 15.5 | 120 |
| 3 | 1.73 | 6.93 | 6.81 | 29.3 | 1.54 | 18.1 | 120 |
| 4 | 1.57 | 6.82 | 6.11 | 28.4 | 1.45 | 14.2 | 121 |
| 5 | 1.39 | 5.64 | 5.54 | 25.1 | 1.32 | 12.1 | 104 |
| 6 | 1.31 | 5.51 | 4.81 | 22.2 | 1.14 | 10.3 | 95.3 |
| 7 | 1.26 | 4.82 | 5.12 | 22.3 | 1.23 | 12.1 | 88.3 |
| 8 | 1.21 | 4.81 | 4.72 | 19.3 | 1.24 | 9.22 | 85.5 |
| 9 | 1.25 | 4.73 | 4.01 | 21.4 | 1.23 | 10.3 | 85.4 |
| 10 | 1.31 | 4.92 | 4.51 | 22.2 | 0.93 | 9.33 | 87.1 |
| 11 | 1.25 | 4.91 | 4.30 | 21.1 | 0.84 | 8.21 | 90.1 |
| Average | 1.42 | 5.73 | 5.32 | 24.4 | 1.28 | 12.2 | 101 |
| Minimum | 1.21 | 4.73 | 4.01 | 19.3 | 0.84 | 8.21 | 85.4 |
| Maximum | 1.73 | 7.01 | 6.81 | 29.3 | 1.61 | 18.1 | 121 |
| RSD * | 0.20 | 0.99 | 0.94 | 3.71 | 0.25 | 3.14 | 15.5 |
* Relative standard deviation.
Table 3.
Trace element composition of the water of the Selenga River sampled at different stations and its basic statistical parameters, µg/L.
Table 3.
Trace element composition of the water of the Selenga River sampled at different stations and its basic statistical parameters, µg/L.
| Station | Sr | Al | Fe | Ti | Mn | Zn | Cu | V | Mo | Ni | Cr |
|---|---|---|---|---|---|---|---|---|---|---|---|
| 1 | 211 | 19.3 | 33.2 | 0.81 | 15.1 | 0.91 | 1.91 | 1.74 | 2.53 | 0.61 | 0.31 |
| 2 | 202 | 69.1 | 90.1 | 2.33 | 10.2 | 1.02 | 2.02 | 1.93 | 2.52 | 0.75 | 0.42 |
| 3 | 220 | 17.4 | 47.5 | 1.24 | 8.01 | 1.15 | 2.13 | 1.61 | 2.31 | 0.95 | 0.35 |
| 4 | 210 | 19.1 | 20.4 | 0.83 | 6.42 | 0.31 | 1.89 | 2.22 | 2.24 | 0.71 | 0.35 |
| 5 | 160 | 26.3 | 23.1 | 0.92 | 7.03 | 1.97 | 1.76 | 1.51 | 1.75 | 0.62 | 0.31 |
| 6 | 174 | 11.0 | 10.1 | 0.64 | 7.51 | 2.96 | 1.75 | 0.73 | 1.86 | 0.55 | 0.34 |
| 7 | 159 | 17.5 | 19.3 | 0.85 | 8.62 | 1.43 | 1.64 | 0.74 | 1.65 | 0.65 | 0.30 |
| 8 | 151 | 31.4 | 36.2 | 1.13 | 9.54 | 1.61 | 1.61 | 0.63 | 1.61 | 0.64 | 0.45 |
| 9 | 153 | 20.2 | 20.1 | 0.81 | 10.7 | 1.22 | 1.52 | 0.62 | 1.63 | 0.63 | 0.41 |
| 10 | 154 | 39.3 | 60.0 | 1.63 | 13.1 | 1.54 | 1.73 | 1.51 | 1.62 | 0.75 | 0.50 |
| 11 | 161 | 47.1 | 96.3 | 2.12 | 15.0 | 1.01 | 2.01 | 1.47 | 1.74 | 1.05 | 0.44 |
| Average | 175 | 29.1 | 41.2 | 1.21 | 10.1 | 1.32 | 1.83 | 1.34 | 1.91 | 0.71 | 0.44 |
| Minimum | 150 | 11.3 | 10.1 | 0.62 | 6.42 | 0.31 | 1.51 | 0.63 | 1.63 | 0.62 | 0.33 |
| Maximum | 220 | 69.4 | 96.5 | 2.33 | 15.0 | 2.93 | 2.14 | 2.21 | 2.54 | 1.13 | 0.51 |
| RSD * | 26.6 | 17.1 | 29.3 | 0.61 | 3.13 | 0.71 | 0.22 | 0.62 | 0.43 | 0.24 | 0.12 |
| DL ** | 0.014 | 0.027 | 0.020 | 0.011 | 0.016 | 0.021 | 0.013 | 0.014 | 0.020 | 0.026 | 0.022 |
* Relative standard deviation; ** Detection limit.
Table 4.
Trace element composition of riverine waters sampled on the western coast of Lake Baikal, µg/L.
Table 4.
Trace element composition of riverine waters sampled on the western coast of Lake Baikal, µg/L.
| Station | Sr | Al | Fe | Ti | Mn | Zn | Cu | V | Mo | Ni | Cr |
|---|---|---|---|---|---|---|---|---|---|---|---|
| Two-year average trace element composition of riverine water from 7 areas selected on the western coast | |||||||||||
| Marituisky | 78.1 | 76.2 | 81.5 | 9.52 | 13.1 | 2.73 | 3.87 | 0.94 | 0.63 | 1.12 | 0.31 |
| Baikalsky | 88.4 | 38.5 | 46.6 | 4.21 | 6.72 | 2.71 | 2.54 | 0.65 | 0.31 | 0.83 | 0.23 |
| Listvyansky | 124 | 20.3 | 46.1 | 2.63 | 7.45 | 2.52 | 2.61 | 0.51 | 0.72 | 0.74 | 0.32 |
| Goloustnensky | 123 | 16.1 | 47.3 | 2.35 | 7.26 | 1.77 | 2.62 | 0.54 | 0.54 | 0.75 | 0.34 |
| Buguldeyisky | 253 | 76.4 | 39.0 | 11.6 | 4.81 | 4.89 | 3.34 | 9.73 | 3.91 | 0.83 | 0.71 |
| Yelantsinsky | 77.0 | 93.3 | 42.2 | 22.9 | 6.73 | 3.85 | 3.03 | 7.72 | 1.23 | 0.51 | 0.35 |
| Onguryonsky | 118 | 119 | 64.1 | 20.3 | 7.44 | 7.24 | 4.12 | 0.96 | 1.12 | 0.74 | 0.43 |
| Basic statistical parameters of trace element composition of water from 75 western tributaries | |||||||||||
| Average | 118 | 71.3 | 55.4 | 12.1 | 8.04 | 4.03 | 3.31 | 3.01 | 1.22 | 0.83 | 0.34 |
| Minimum | 7.01 | 4.15 | 12.3 | 0.32 | 2.15 | 0.92 | 0.82 | 0.13 | 0.13 | 0.24 | 0.11 |
| Maximum | 360 | 351 | 214 | 68.1 | 50.2 | 38.0 | 12.4 | 53.2 | 13.4 | 3.56 | 1.45 |
| RSD * | 86.1 | 61.8 | 37.3 | 14.1 | 6.26 | 4.81 | 1.93 | 8.01 | 2.12 | 1.36 | 1.43 |
| DL ** | 0.014 | 0.027 | 0.020 | 0.011 | 0.016 | 0.021 | 0.013 | 0.014 | 0.020 | 0.026 | 0.022 |
* Relative standard deviation; ** Detection limit.
Table 5.
Average contributions of solute sources to ionic composition of water of western tributaties of Lake Baikal and Selenga River, %.
Table 5.
Average contributions of solute sources to ionic composition of water of western tributaties of Lake Baikal and Selenga River, %.
| Area | Sulfide-Bearing Silicates | Silicates | Carbonates |
|---|---|---|---|
| Marituisky | 46 | 52 | 2 |
| Baikalsky | 42 | 46 | 12 |
| Listvyansky | 58 | 22 | 20 |
| Goloustnensky | 20 | 33 | 47 |
| Buguldeyisky | 7 | 54 | 40 |
| Yelantsinsky | 9 | 82 | 9 |
| Onguryonsky | 8 | 75 | 17 |
| Selenga Watershed | 20 | 61 | 19 |
Publisher’s Note: MDPI stays neutral with regard to jurisdictional claims in published maps and institutional affiliations. |
© 2021 by the authors. Licensee MDPI, Basel, Switzerland. This article is an open access article distributed under the terms and conditions of the Creative Commons Attribution (CC BY) license (https://creativecommons.org/licenses/by/4.0/).
Share and Cite
MDPI and ACS Style
Semenov, M.Y.; Semenov, Y.M.; Silaev, A.V.; Begunova, L.A. Source Apportionment of Inorganic Solutes in Surface Waters of Lake Baikal Watershed. Sustainability 2021, 13, 5389. https://0-doi-org.brum.beds.ac.uk/10.3390/su13105389
AMA Style
Semenov MY, Semenov YM, Silaev AV, Begunova LA. Source Apportionment of Inorganic Solutes in Surface Waters of Lake Baikal Watershed. Sustainability. 2021; 13(10):5389. https://0-doi-org.brum.beds.ac.uk/10.3390/su13105389
Chicago/Turabian StyleSemenov, Mikhail Y., Yuri M. Semenov, Anton V. Silaev, and Larisa A. Begunova. 2021. "Source Apportionment of Inorganic Solutes in Surface Waters of Lake Baikal Watershed" Sustainability 13, no. 10: 5389. https://0-doi-org.brum.beds.ac.uk/10.3390/su13105389
Note that from the first issue of 2016, this journal uses article numbers instead of page numbers. See further details here.