
Synergistic Effect of Carbon Trading Scheme on Carbon Dioxide and Atmospheric Pollutants

School of Economics and Management, China University of Petroleum (Huadong), Qingdao 266580, China
*
Author to whom correspondence should be addressed.
Sustainability 2021, 13(10), 5403; https://0-doi-org.brum.beds.ac.uk/10.3390/su13105403
Submission received: 7 April 2021
/
Revised: 28 April 2021
/
Accepted: 30 April 2021
/
Published: 12 May 2021
Abstract
:To estimate the synergistic emission reduction effect resulting from carbon emissions trading scheme (ETS) pilots launched in 2013, this study estimated the synergistic emission reduction relationship between carbon dioxide (CO2) and atmospheric pollutants, consisting of sulfur dioxide (SO2), nitrogen oxides (NOX), dust pollutants (Dust) and particulate matter 2.5 (PM2.5). Using the extended logarithmic mean Divisia index (LMDI) method and the IPAT equation, the synergistic emission reduction effect was decomposed into direct and indirect categories driven by energy efficiency, economic development and industrial structure. Moreover, the synergistic emission reduction effect of ETS pilots was quantified with the difference-in-differences method (DID) and propensity score matching difference-in-differences method (PSM-DID). The results show that, from 2013 to 2016, CO2 and atmospheric pollutants achieved emission reduction synergistically through ETS, among which the synergistic emission reduction effect between CO2 and SO2 was most significant. Compared with the direct category, the indirect category accounted for smaller proportion of the synergistic emission reduction effect. The combined action of energy efficiency and industrial structure has a potential positive influence on synergistic emission reduction effect of ETS. Consequently, this suggests that the government needs to develop the domestic carbon market further, improve energy efficiency and optimize industrial structure to promote synergistic emission reduction.
JEL Classifications:
Q4; Q5; P281. Introduction
The externality cost of carbon emission can be internalized through emission trading schemes (ETSs), which contribute to carbon emission reduction. Consequently, ETSs have been widely adopted in the implementation of emission reduction targets. As the country producing the most carbon emissions, China promised a 60–65% reduction in carbon dioxide emissions per unit gross domestic product (GDP) by 2030 compared with 2005 at the Copenhagen Climate Change Conference. To achieve these emission reduction goals, China actively launched the ETS pilot program, which lasted for 3 years, from 2013 to 2015, consisting of Beijing, Tianjin, Shanghai, Guangdong, Hubei, Chongqing and Shenzhen. Then, the ETS was promoted widely, and the nationwide carbon trading market was gradually established by 2017.
Recently, a synergistic control method driven by carbon emission reduction has gradually attracted much attention. For example, the 13th Five-Year Plan of Work on Controlling Greenhouse Gas Emissions emphasized that synergistic control of carbon dioxide (CO2) and atmospheric pollutants is the key path for green transformation. With the increasingly stringent emission reduction goals, synergistic governance avoids excessive time costs and contributes to more socioeconomic welfare, resulting in the virtuous circle of environmental quality optimization. Moreover, CO2 and atmospheric pollutants are characterized as homologous as they are formed from the burning of fossil fuels and concentrated in highly energy-consuming sectors. Within the expansion mechanism of production activities, the carbon emission reduction strategy can reduce atmospheric pollutants simultaneously.
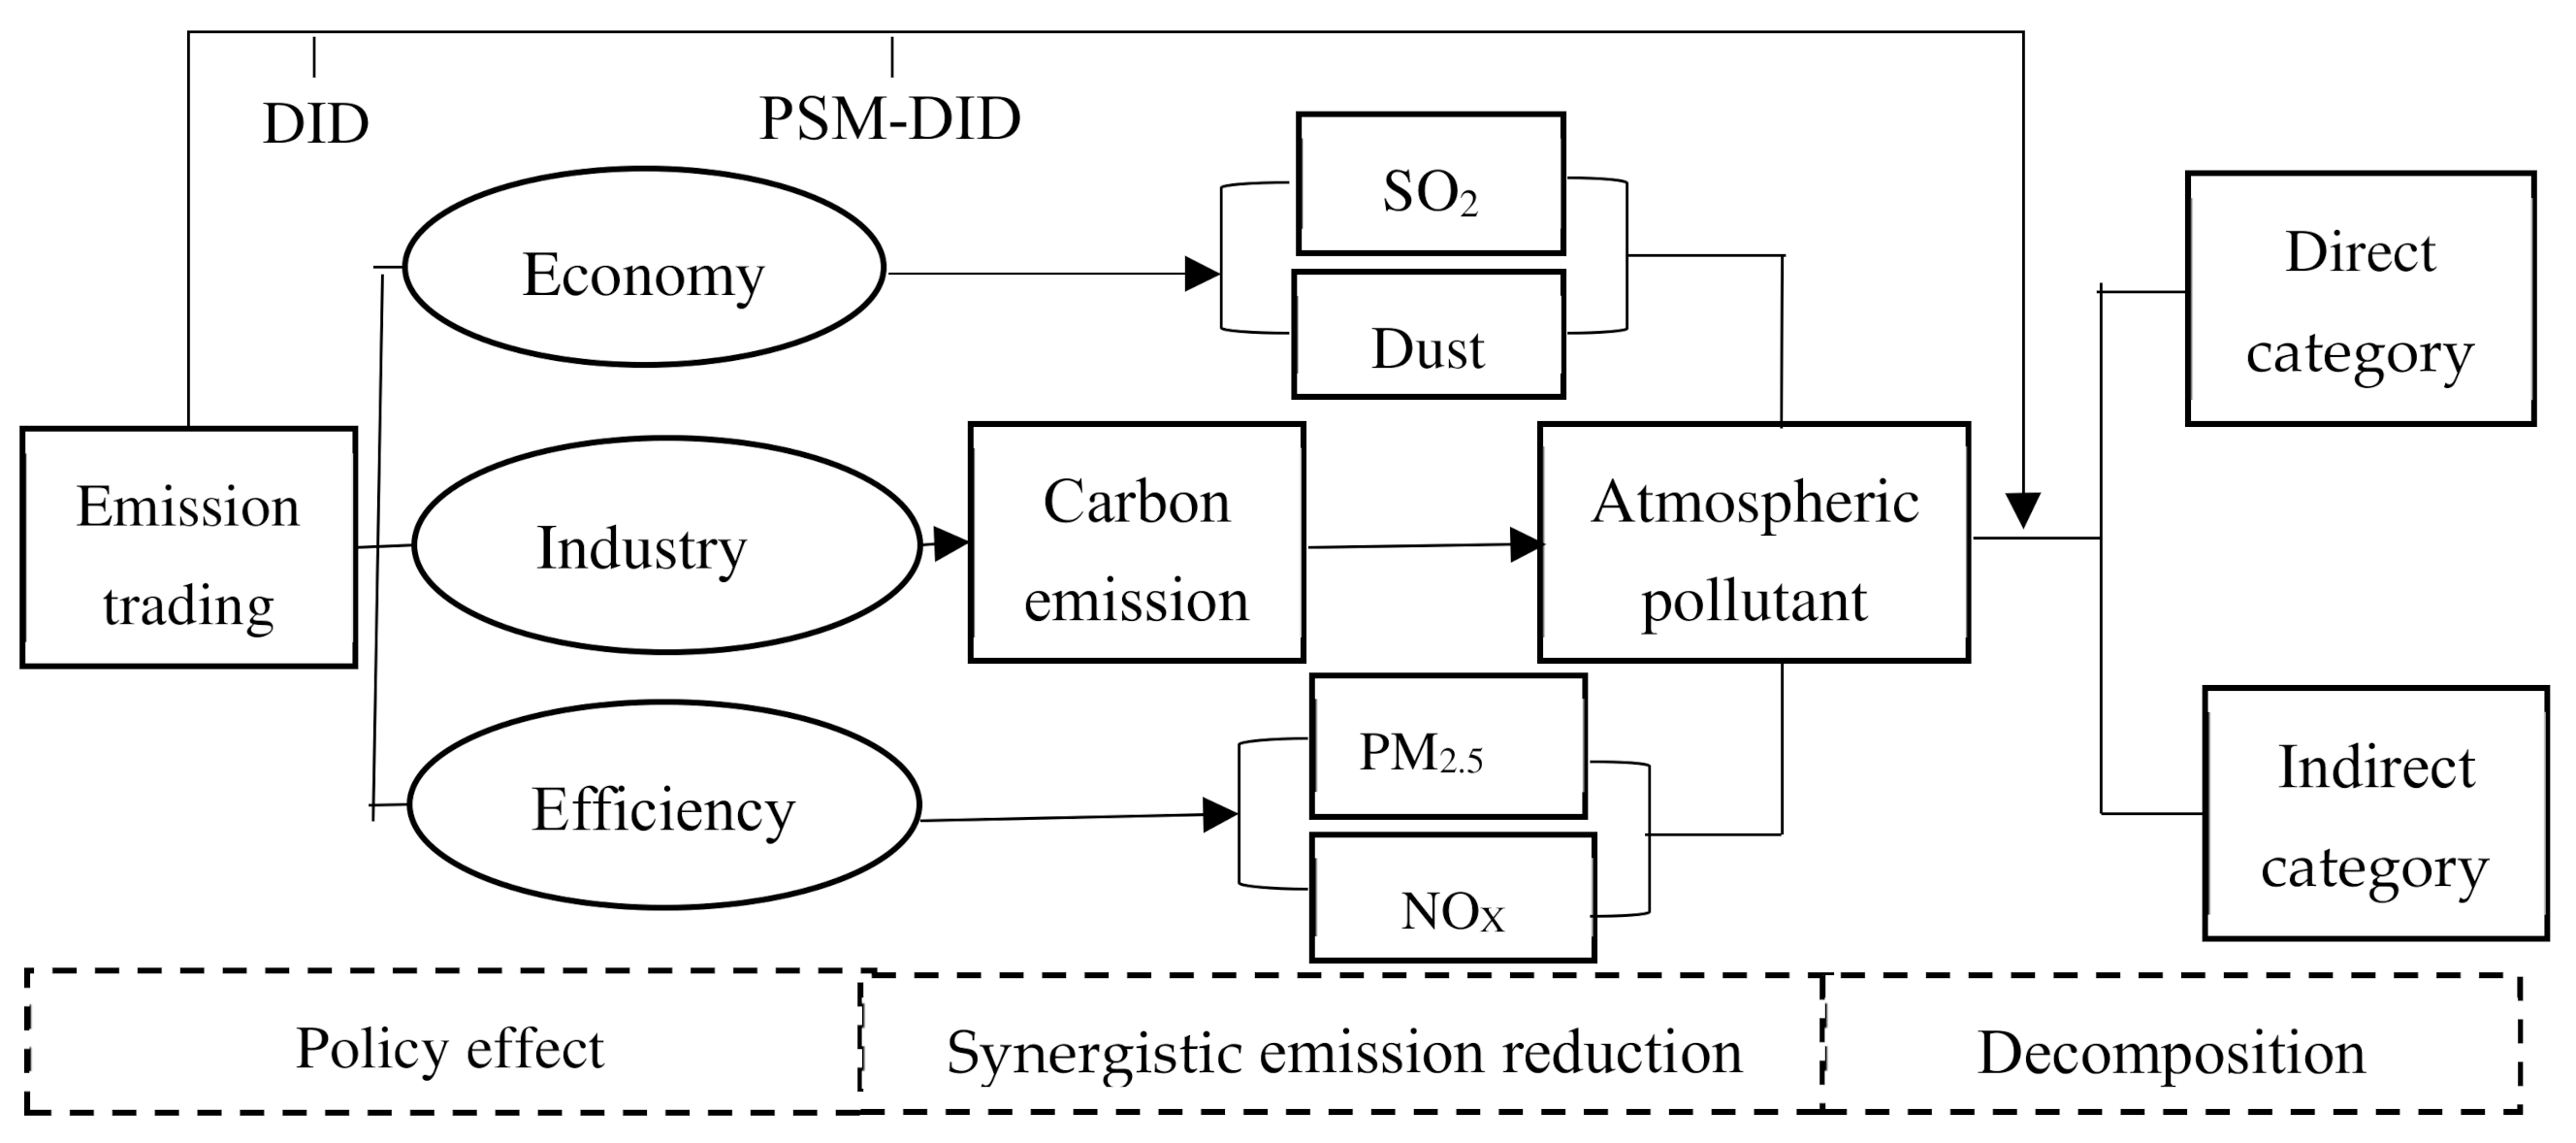
Though the ETS in China has been fully advanced, the carbon trading market has not been fully explored in research. Few studies focus on the synergistic control of CO2 and atmospheric pollutants. To investigate whether ETS can drive the synergistic emission reduction effect between CO2 and atmospheric pollutants, decomposition analysis was conducted in this study with the combination method of IPAT and logarithmic mean Divisia index (IPAT-LMDI) model, and quantitative analysis (as shown in Figure 1) was further undertaken. Moreover, difference-in-differences (DID) and propensity score matching difference-in-differences (PSM-DID) methods were used to verify the synergistic emission reduction effect of ETS pilots in China, covering the selected period from 2007 to 2016.
2. Literature Review
2.1. Brief Review of Carbon Emission Trading Scheme
Carbon trading is an important market tool in driving economic growth and carbon dioxide emission reduction, in which the emission rights are thought of as a commodity. A vast body of existing literature expounds the theoretical mechanisms and realities of the carbon emission effect achieved by the ETS. Generally, carbon trading is defined as a forced mechanism that restricts pollutants emission through high cost and technological progress. Fan et al. found that carbon trading contributes to cost reduction and further develops low-carbon technology through the reinvestment of revenue [1]. Furthermore, some studies show that carbon trading promotes low-carbon technological innovation. Li and Wang suggested that carbon trading promotes spatial carbon emission through a technical progress [2]. Considering the complex mechanism of the ETS, the industrial structure, energy consumption structure and economic development are all defined as conduction pathways. Wang and Gao reported that the ETS can stimulate the structural adjustment of high pollution industries and eliminate backward production capacity [3].
2.2. Summary of Emission Reduction Effect of Carbon Emission Trading Scheme
Due to the heterogeneity of economic development, technological level and various methods adopted, the policy effect of carbon trading is inconsistent. Most studies suggest that carbon trading contributes to carbon emission; however, some scholars still disagree. Undoubtedly, such different conclusions are closely related to the research object and research cycle. Table 1 summarizes and compares the recent literature that assesses the carbon emission reduction effect driven by carbon trading.
On the case of insignificant emission reduction effect, Streimikiene and Roos used the data of ETS in European countries to discuss the actual effect. Their results showed that ETS was difficult to curb the carbon emission indeed [4]. Wang, Sangbum and Cheng used the data of pilots in China to point out that emission trading did little to reduce pollutants emission [5,6,7]. More specifically, Hu paid attention to the Tianjin pilot and assessed the emission reduction effect in the period 2013–2016, whose result showed that the effect on environmental protection effect is minimal [8].
On the case of significant emission reduction effect, Cames and Weidlich suggested that the construction of carbon trading system optimized the energy consumption structure in Germany and ultimately achieved the decline of carbon emission [9]. Capoor and Ambrosi further reported the establishment of carbon trading systems reduced the total global carbon emissions by 2–5% over the period from 2005 to 2007 [10]. Zhang et al. attempted to evaluate the actual effect of international carbon market, and their results support above findings [11]. Through contrastive analysis on seven carbon trading pilots, Chen and Xu found that only Guangdong, Hubei and Shenzhen had produced significant emission reduction effects [12], while Shen et al. believed that the implementation of ETS effectively promote the low-carbon development of enterprises from the micro perspective [13]. Tu and Chen examined the dynamic effect of ETS from the time dimension [14]. Their results revealed that though the carbon emission reduction effect was insignificant in the short term, it will gradually strengthen over the long term. Song and Xia followed above studies to analyze the dynamic carbon emission reduction effect and confirmed such effect had been strengthened year by year [15]. Zhang and Duan reported that ETS pilots in China have not reduced the carbon emissions in industrial sub-sector [16].
Notably, the different methods adopted also leads to assessment deviation of ETS. Computable General Equilibrium Model was used widely to carry out simulation analysis on carbon emission policy. Wen et al. evaluated the influence of carbon trading in Hubei pilot. Their results showed that carbon trading was useful for decline of carbon emission [17]. Wang et al. used GD-CGE model to explore the environmental effect in Guangdong province [18]. Their results showed that carbon trading could reduce emission mitigation costs and further achieve carbon emission reduction. Liu et al. employed scenario analysis to investigate the environmental effects of Tianjin pilot [19]. Their results showed that the total carbon emissions could reduce 0.62% point. However, CGE model was identified that difficult to work efficiently due to the insufficiency of the premise assumptions and subjectivity of parameter setting. In contrast, the traditional difference method, such as double difference (DID) and double difference propensity score matching (PSM-DID), carry out ETS evaluation better through selecting the control group and constructing reasonable counterfactuals. Huang used DID method to study the impact of ETS and found that carbon emission reduced significantly [20]. Zhou and Tan suggested that caron trading policy accelerated the development of low-carbon economy [21]. In addition, Liu et al. investigated the emission reduction effects of seven pilots in China using synthetic control method (SCM) [22]. Their results showed that ETS reduced the carbon emission significantly. Cao et al. simulate the distribution of atmospheric co-pollutants and discussed the different public health with and without the ETS [23]. Shen et al. used the PSM-DID model to reveal the carbon emission reduction effect driven by ETS [24]. Their results showed that ETS made a reduction of 129.588 million tons’ carbon emissions, while the effect attenuates over time.
2.3. Overview of Synergistic Emission Reduction between CO2 and Atmospheric Pollutants
With the pressures of atmospheric pollutants, the existing literature analyzes the relationship between carbon emission reduction and atmospheric pollutants treatment, which is thought to be inseparable. Topics related to synergistic emission reduction effect include evaluation of the health benefits and measurement of the synergistic level. Nemet et al. proposed that the synergistic emission reduction of atmospheric pollutants benefited human health conditions [25]. Burtraw et al. and Groosman et al. applied CGE and APEEP models to quantitatively explore the health benefits of synergistic emission reduction [26,27]. Fujimi et al. discovered that ETS reduced the global welfare loss to 0.1–0.5% [28]. Therefore, the synergistic emission reduction effect has been absorbed into environmental policy evaluation system. Chae employed cost-effectiveness and synergistic effect to assess the atmospheric quality management schemes in Seoul Metropolitan Area [29]. Henneman et al. extended scenario analysis to investigate differentiated synergistic emission reduction effects [30]. As for the measurement of synergistic level, Song and Fu defined the universally positive correlation between CO2 and SO2 in energy consumption [31]. Mao et al. applied synergy theory to assess synergistic emission reduction in the power sector, and found that technological innovation promoted the synergistic control of carbon, sulfur and nitrogen oxides [32]. While Yan et al. and Zhou et al. found that the synergistic emission reduction effect showed regional heterogeneity and fluctuation characteristics [33,34].
Considering that synergistic control plays an indispensable role in emission reduction, investigating whether ETS promoted synergistic emission reduction is of practical significance. SYRI S et al. and VAN et al. studied that climate policies drove the regional pollutant emission reduction [35,36]. Furthermore, Ren and Fu researched that the implement of ETS in China reduced the carbon emission intensity while accelerated green development [37]. Specifically, synergistic emission reduction effect has caught more attention recently. Gu et al. revealed that the synergistic emission reduction effect of atmospheric pollutants mainly depended on the technical equipment in polluting sector [38]. Fu and Yuan constructed Kaya equation and decomposed the drivers for synergistic emission reduction effect into energy structure, energy efficiency, economic development and population effects [39]. Moreover, Borghesi analyzed the emissions reduction mechanism of ETS, emphasizing the intermediary effects of energy consumption structure and energy efficiency [40]. Wang et al. paid attention to the low-carbon technology innovation effects driven by ETS [41]. The results showed that the technology spillover enhanced emission reduction effect. Yu and Liu found that the extending of market scale also strengthened the green effects of ETS [42].
As mentioned above, most studies have only analyzed the carbon emission reduction effect of ETS, while the synergistic emission reduction effect of atmospheric pollutants are widely ignored. Moreover, existing studies just define the synergistic relationship between CO2 and atmospheric pollutants, but paid little attention to quantitative analysis, especially decomposition. In addition, few studies focus on the formation mechanism of synergistic emission reduction effect driven by ETS. The novelties of this paper are as follows: The aim of this study was to analyze synergistic emission reduction effect between CO2 and atmospheric pollutants with IPAT-LMDI method. Furthermore, DID and PSM-DID methods are used to conducts quantitative analysis on synergistic emission reduction effect driven by ETS. To show the synergistic emission reduction more clearly, the synergistic emission reduction effect was decomposed into direct and indirect categories. At last, the concrete formation mechanism is discussed further from the perspective of economic development, industry structure and energy efficiency.
3. Method and Data
3.1. Combination of IPAT Method with LMDI Technique
The IPAT method has been used widely in decomposition of environmental pollutants, which describes the equation between human Impact (I), Population (P), Affluence (A) and Technology (T). As the concrete form of IPAT method, Kaya identity has been used extensively to calculate and forecast the energy and environment. Similarly, the Logarithmic Mean Divisia Index (LMDI) method also is a versatile tool to analyze the driving forces of pollutants. Compared with other methods, the LMDI technique has double advantages of being adaptability and simplicity. The combination of the IPAT and the LMDI makes it easy to conduct quantitative analyses of how much various factors contribute to pollutants emission. The IPAT method used to decompose carbon emission is as follows:
In Equation (1), represents province. and refer to industry and the energy type. represents sulfur dioxide (SO2), nitrogen oxides (NOX), dust pollutants (Dust) and particulate matter (PM2.5), respectively. , , and donate carbon emission, energy consumption, economic output and population, respectively. equals , indicating atmospheric pollutants caused by carbon emission. ( means carbon emission factor. ( and ( represent energy consumption structure and industrial structure. ( reflects the energy consumption per unit of output. ( donates the per capita income level.
Considering the LMDI method applied in previous studies, a comparative analysis was conducted on changes of atmospheric pollutant emissions within addictive form:
In Equation (2), means the change in total atmospheric pollutant emissions between base year t−1 and year t. represents the synergistic effect driven by carbon emission reduction. and donate carbon emission coefficient effect, energy structure effect, energy efficiency effect, industrial structure effect, economic development effect and population scale effect, respectively. Considering that the carbon emission coefficient is constant, and energy consumption structure remains relatively stable in China, were set in this study.
Based on the practical guidance to the use of LMDI technique, the total atmospheric pollutant emission can be specified as follows:
where: .
3.2. Synergistic Effect Analysis and Decomposition Approach
To examine the synergistic relationship between carbon emission reduction and atmospheric pollutant emission reduction, this study established synergistic model as follows:
In this expression, k and t represent province and time. , and are the coefficients of the independent variables. , and represent time fixed effect, individual fixed effect and random error. and represent the emission reduction of atmospheric pollutant and CO2, respectively. , , and donate the per capita income, energy efficiency, the proportion of industry in total output and the population density. Considering the environmental Kuznets curve, revealing the inverted U relationship between economic development and environmental pollutants, this study introduced the quadratic term of into Equation (4). means the control variables, including technological progress (Tech), urbanization level (Urban), energy consumption level (Energy) and carbon intensity (Intensity). The definitions and expressions of variables mentioned above are showed in Table 2.
Furthermore, this study analyzed the expansion mechanism of synergistic emission reduction effect. Specifically, the interactive items of carbon emission reduction and economic development, energy efficiency and industrial structure were introduced into following Equation (5):
where: represent the coefficients of the interactive items.
Based on above, the overall synergistic emission reduction effect was decomposed into direct and indirect categories, latter of which contains the synergistic emission reduction driven by economy, energy efficiency and industrial structure, as shown in Equation (6):
In this expression, represents the direct synergistic emission reduction effect of atmospheric pollutants, which is calculated by multiplying the synergistic coefficient in Equation (4) and the historical carbon emission reduction. , and represent the indrect synergistic emission reduction of economy synergy, efficiency synergy and industry synergy, equal to the product of decomposition value obtained in Equation (3) and the coefficient of interaction items and adjustment variables.
3.3. Policy Evaluation Model and Mechanism Analysis
Considering the ETS pilots as independent natural experiment, this study analyzed the synergistic emission reduction effect using DID method. Briefly, the difference in outcomes between the two groups before and after implementation shows the political effect. Beijing, Tianjin, Shanghai, Hubei, Chongqing and Guangdong involved in pilots were taken as the treatment group, and other provinces formed the control group. Furthermore, compared with DID method, the combination of DID and PSM approaches contributed to better selection of the appropriate control group, satisfied the parallel trend hypothesis between the treatment group and control group, and solved possible endogenous and biased problems. Therefore, this study applied the Logit model to estimate the propensity score, ensuring samples in two groups reasonable match, then assessed the synergistic emission reduction effect of ETS using DID approach. The model was established as follows:
In above models, Time and Treated both are binary dummy variables, whose value is 1 during the implementation of the ETS or when the province belongs to pilots, otherwise is 0. DID = Time × Treated represents the effect of ETS pilots.
This study continued to utilize the DID and PSM-DID approaches to examine whether the emission trading pilots have affected the direct and indirect synergistic emission reduction on basis of Equation (8). Finally, this study texted the formation mechanism. For clarification and simplicity, Equation (7) is rewritten as follows:
where: Channel represents economic development, energy efficiency and industrial structure successively.
3.4. Data
The annual time-series data, covering the selected period from 2007 to 2016, are collected from China Statistical Yearbook, China Industrial Statistical Yearbook and China Energy Statistical Yearbook. Specifically, the data of SO2, NOX and Dust are available on State Statistical Bureau official website, PM2.5 is obtained from the global PM2.5 density data (1998–2016) released by Columbia University, and carbon dioxide emission comes from the China Carbon Emissions Database (CEADs), covering the carbon emissions associated with fossil fuel combustion and cement production. On this basis, the emission reduction of CO2 and atmospheric pollutants are calculated by subtracting the current emissions from the previous period emissions.
4. Empirical Results and Discussion
4.1. The Existence Test on Synergistic Effect
The test results of atmospheric pollutant emission reduction panel data for intra-group autocorrelation, heteroscedasticity and synchronous correlation between groups are shown in Table 3. SSO2, SDust, SNOX and SPM2.5 represent the synergistic emission reduction of SO2, Dust, NOX and PM2.5, respectively. Obviously, heteroscedasticity and synchronous correlation between groups problems exist throughout panel data, while the intra-group autocorrelation rarely occurs.
Comprehensive least generalized square method (C-FGLS) solves heteroscedasticity and synchronous correlation effectively. Table 4 provides regression results for Equation (4) evaluated using C-FGLS. The results verify the robust synergistic emission reduction relationship between CO2 and atmospheric pollutants, among which SO2, Dust and NOX pass significant tests within the 5% or 10% confidence interval, while the PM2.5 fails.
The coefficients of control variables identify their different impact on atmospheric pollutants emission reduction. The relationship between PGDP and atmospheric pollutants emission reduction exhibits U-shape. Early economic development usually drives carbon emission to increase sharply through scale expansion effect, resulting in the carbon emission reduction consistently decreasing. However, the carbon emission reduction effect becomes more pronounced with the transformation of economic development mode. The coefficients of efficiency pass significance test partially, whose values are all positive, indicating that the improvement of energy efficiency contributes to carbon emission reduction. Conversely, the industry variable shows inhibitory effect on reducing atmospheric pollutants under 10% confidence level.
4.2. The Quantitative Analysis of Synergistic Effect
Two-stage policy effect assessments were conducted to analyze the synergistic emission reduction effect of ETS. As Table 5 shown, the ETS works significantly in CO2 emission reduction. Such results are consistent with most of the latest research. Similarly, SO2 emission and PM2.5 are also curbed by ETS, but the PM2.5 fails in significant test. Therefore, the impact on atmospheric pollutants driven by ETS is mainly manifested as SO2 emission reduction currently. Therefore, the subsequent analysis focus on the synergistic emission reduction effect between CO2 and SO2.
According to Equation (6), the synergistic emission reduction effect is separated into direct synergy, economy synergy, industry synergy and efficiency synergy. Direct synergy is obtained through the multiplication of total CO2 emission and synergistic coefficient in Equation (4). However, indirect synergistic requires the coefficient of interactive item listed in Equation (5), as showed in Table 6.
The interaction items of efficiency and industry are negative, revealing that carbon emission reduction hindered atmospheric pollutant emission reduction through energy efficiency and industrial structure. On the one hand, rebound effect caused by the improvement of energy efficiency leads to an increase in energy consumption, which weakens ultimately the SO2 emission reduction effect. On the other hand, energy investment is the main driver for industrial development, similarly contributing to the decline in SO2 emission reduction. However, the coefficients of economy are positive. CO2 emission reduction contributes to the green economic development model and promotes SO2 emission reduction.
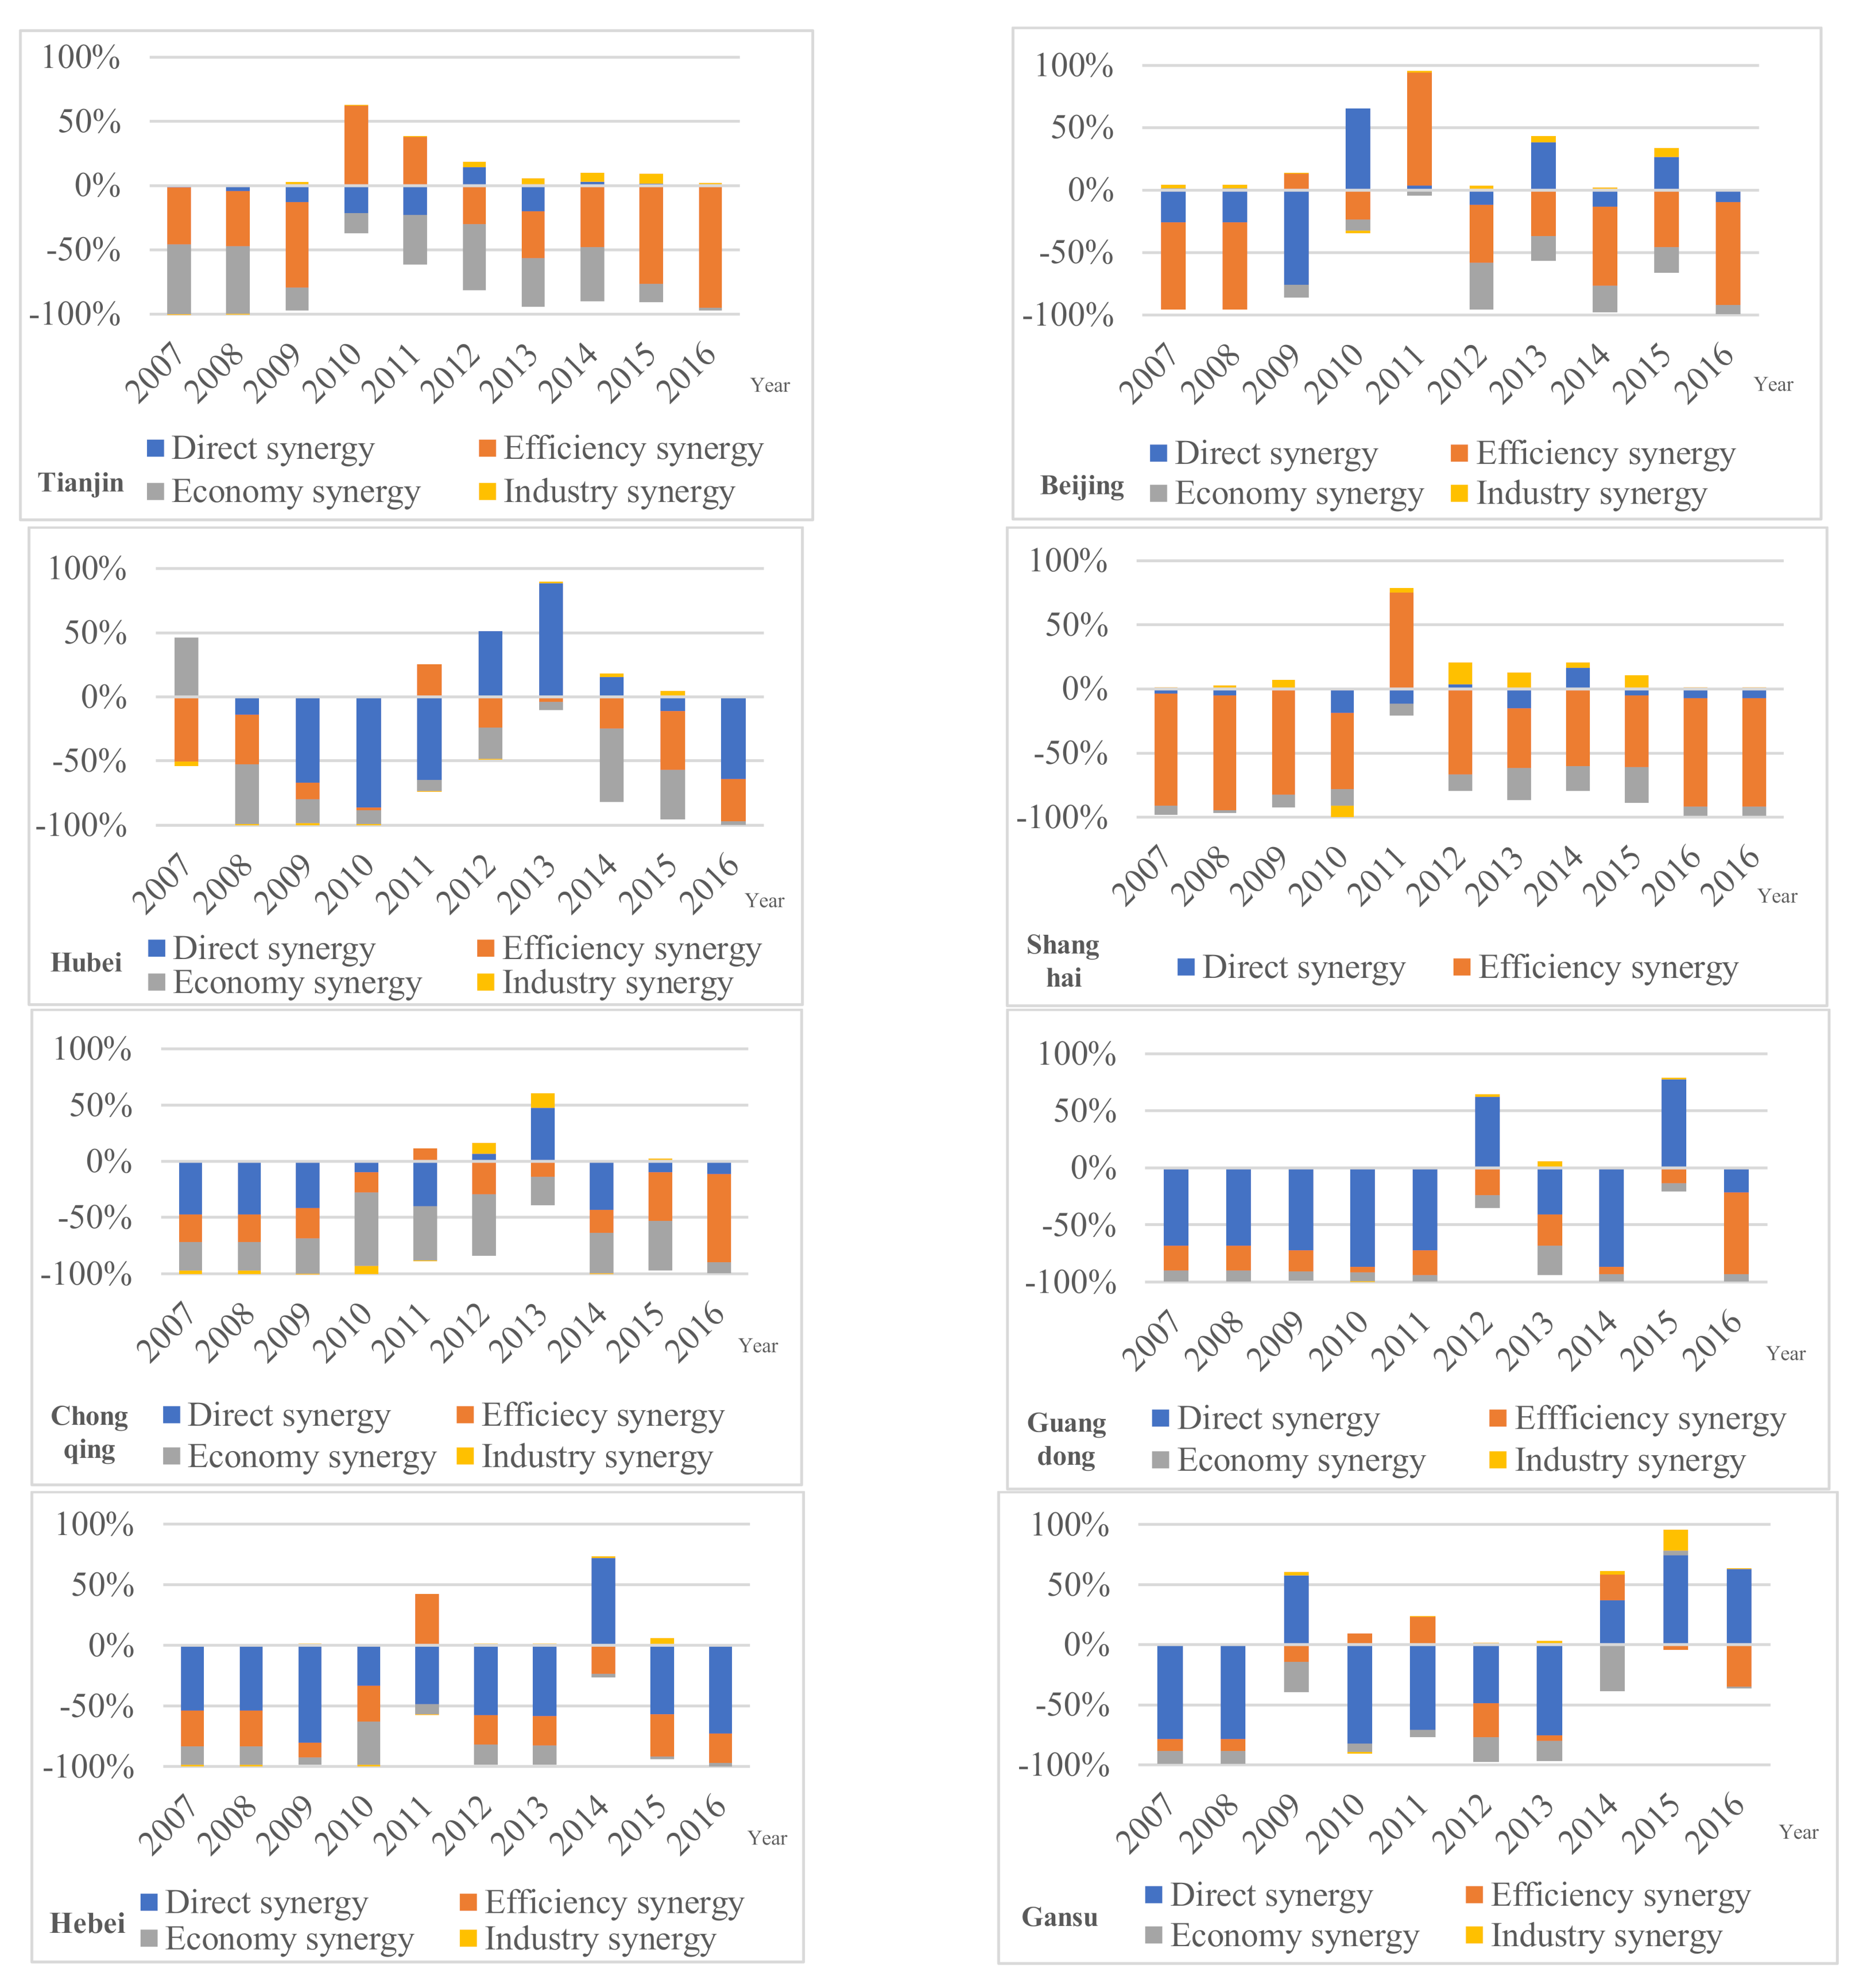
Furthermore, the synergistic emission reduction effect of ETS pilots and several representative regions were shown in Figure 2. Overall, the direct synergy accounts for relatively high proportion, which is consistent with the emission reduction of CO2. The indirect synergy accounted for low proportion, corresponding to the locked energy efficiency, economic development and industrial structure, among which efficiency synergy dominates in SO2 synergistic emission reduction, especially in Beijing, Tianjin and Shanghai. Therefore, focus was maintained on the direct synergy of SO2 driven by ETS in this study.
4.3. The Synergistic Effect of Carbon Emission Trading Scheme
Considering the possible nonrandom selection of treatment group, PSM method is applied to satisfy the parallel trend hypothesis of DID, making sure that carbon emissions of experimental group and control group show the same trend before the implementation of the carbon trading policy. The balance test results of variables before and after the propensity score matching are shown in Table 7. In general, if the averages of matched variables reject null hypothesis, then adopting PSM is thought to be reasonable. Apparently, standard deviation of most variables reduces greatly after matching, with non-significant t value and p value, meaning that treatment group and control group do not have significant difference.
To ensure the dominant role of ETS in the synergistic emission reduction of SO2, the nonparallel trends in the dependent variables between groups need to be tested further. The parallel trends of direct synergy, economy synergy, energy efficiency synergy and industry synergy in SO2 are shown in Figure 3. The vertical dashed line represents the starting year of ETS implementation. Overall, the change trends of the left curve remain basically stable, while that on the right differed significantly. Specifically, under the ETS pilots executed, the direct synergy of treatment group surpasses that of control group gradually, with growing gaps. However, the efficiency synergy and industry synergy show reverse change trend, and economy synergy maintains a stable gap consistently.
Based on above analysis, DID and PSM-DID methods are used to evaluate the synergistic emission reduction effect of SO2 and CO2 driven by pilots ETS. As shown in Table 8, the ETS promoted the direct synergy significantly, passing the test at 1% confidence level. However, the economy synergy, efficiency synergy and industry synergy are driven less by ETS. Consequently, the synergistic emission reduction effect of CO2 and atmospheric pollutants driven by ETS mainly manifested as the direct synergy of SO2 and CO2, as well as the potential effects on efficiency synergy and industry synergy. The main reason is that the industries involved in ETS contain electric power, chemical industry and smelting, and the pollutants generated are mainly CO2 and SO2. Due to the short implementation time, imperfect system and limited coverage, ETS is difficult to effectively fit with economic development, energy efficiency improvement and industrial structure optimization.
Table 8 also presents the estimated results of control variables. PGDP is negatively correlated with the direct synergy, showing that increasing incomes create higher demand for energy and curbed the synergistic emission reduction. Similarly, the urbanization and industrial development hinder direct synergy to some extent but not significant. On the contrary, the technical advance promotes the direct synergy substantially, and the energy efficiency also has been proved potential to improve direct synergy. Moreover, the population density is positive correlation with direct synergy, and the main reasons are as follows. The agglomeration of population and economy promotes direct synergy through means such as cost savings, specialization and device sharing, and further expands the direct synergy effect, with knowledge spillover and centralized disposal of pollutants.
Further, above results are robust across the different window period and pilots. Compared with the average treatment effect shown in Table 8, the models (1) and (2) in Table 9 reveal the dynamic direct synergy effects in 2014, 2015 and 2016, thus testify the sustainability of the synergistic emission reduction effect. As the results shown, ETS promotes the direct synergy overall, but fluctuates obviously. Through predating the implement time, the direct synergy is no longer impacted significantly by ETS. Further, assuming that pilots and non-pilot regions had changed, the direct synergy effect is minimal. Therefore, the results of DID and PSM-DID pass the multi-dimensional robustness tests.
4.4. The Action Mechanism of Synergistic Effect
Based on the decomposition results, Equations (5) and (9) are applied to test how ETS achieves synergistic emission reduction between CO2 and SO2. As shown in Table 6, economic development, energy efficiency and industrial structure prove to be potential channels for synergy effect. Meanwhile, synergistic emission reduction effect of CO2 and SO2 has been enhanced dramatically under multiple channels, which emphasizes the importance of multi-dimensional synergistic emission reduction.
Further, this study investigates how the ETS achieves the emission reduction of CO2 through the same channels. As illustrated in Table 10, the synergistic emission reduction effect is difficult to achieve with single channel. Under the background of ETS, the economic development channel hinders the CO2 emission reduction significantly, and energy efficiency and industrial structure both potentially restrained that either. However, under the function together with above three channels, ETS promotes the emission reduction of CO2. Especially energy efficiency and industry structure channels, their inhibitory effect on emission reduction of CO2 transforms into promotion effect and the effect intensity increases substantially. Therefore, the emission reduction of CO2 driven by ETS depends on the combined effects of energy efficiency and industrial structure.
5. Conclusions and Policy Implications
5.1. Conclusions
Combining extended IPAT-LMDI with DID and PSM-DID methods, this study explores the synergistic emission reduction effect of CO2 and atmospheric pollutants driven by ETS. The conclusions can be summarized as follows:
- (1)
- Atmospheric pollutants emission reduction synergistically responds to carbon emission reduction, among which, the SO2 and Dust are affected significantly, while the NOX and PM2.5 are less affected. Further, ETS reliably reduces CO2 and SO2, but fails to drive the emission reduction of NOX, Dust and PM2.5. Therefore, the synergistic emission reduction effect of CO2 and atmospheric pollutants mainly manifests as CO2 and SO2.
- (2)
- Compared with the indirect synergy, the direct synergy accounts for higher proportion of overall synergistic emission reduction effect. Moreover, ETS promotes the direct synergy of SO2 and CO2 significantly, but rarely affects their indirect synergy. The synergistic emission reduction effect driven by ETS mostly performs as continual increase in direct synergy.
- (3)
- Energy efficiency and industrial structure are the potential channels that achieve synergistic emission reduction effect driven by ETS. Conversely, economic development increases CO2 emission to a certain extent, owing to the expansion of scale effect. With the combination of multiple channels, the synergistic emission reduction effect driven by ETS is strengthened obviously.
5.2. Policy Implications
This paper highlights specific recommendations that may optimize China’s national emission trading scheme and promote synergistic emission reduction.
First, the government should emphasize the coordinated management of CO2 and atmospheric pollutants, through integrating high-carbon industries into comprehensive emission reduction system and innovating synergistic technology applied in environmental management. Given the current state of synergistic emission reduction, to avoid the dilemma of broken treatment, introducing environmental policies to strengthen the coordination of regional environmental protection work.
Second, national carbon trading market need to promoted vigorously and ETS should be continually improved. For example, the assessment criterion is no longer confined to carbon emission reduction, while also covers atmospheric pollutants emission reduction.
Finally, to improve carbon trading policy, improving energy efficiency and optimizing industry structure should be taken into account. On the one hand, the government should actively promote low-carbon technological innovation of enterprises, but also pay attention to avoid the excessive carbon emission caused by economic expansion. On the other hand, the government needs to promote the transformation of high-carbon industries, investment of green-oriented technology and improvement of energy efficiency within the framework of synergistic emission reduction.
Author Contributions
Conceptualization, Z.L.; methodology, Z.L.; software, J.W.; formal analysis, J.W.; writing original draft review and editing, J.W.; Data curation and writing original draft review and editing, S.C. All authors have read and agreed to the published version of the manuscript.
Funding
This research was funded by Fundamental Research Funds for the Central Universities “Research on Economic Efficiency Improvement of Natural Gas Industry Pipeline Network under the Background of Energy Supply Side Structural Reform”, grant number “20CX04001B”.
Institutional Review Board Statement
Not applicable.
Informed Consent Statement
Not applicable.
Data Availability Statement
The data used to support the findings of this study are included within the article.
Acknowledgments
Authors are grateful to the financial support from the Fundamental Research Funds for the Central Universities “Research on Economic Efficiency Improvement of Natural Gas Industry Pipeline Network under the Background of Energy Supply Side Structural Reform” (20CX04001B).
Conflicts of Interest
We declare that we have no financial and personal relationships with other people or organizations that can inappropriately influence our work, there is no professional or other personal interest of any nature or kind in any product, service that could be construed as influencing the position presented in, or the review of, the manuscript entitled, “Synergistic Emission Reduction Effect of Carbon Trading Scheme on Carbon Dioxide and Atmospheric Pollutants”.
References
- Fan, D.; Wang, W.G.; Liang, P.F. Analysis of the performance of carbon emissions trading right in China--The eval-uation based on the difference-in-difference model. China Environ. Sci. 2017, 37, 2383–2392. [Google Scholar] [CrossRef]
- Li, Z.G.; Wang, J. Spatial emission reduction effects of China’s carbon emissions trading:quasi-natural experi-ments and policy spillovers. China Popul. Resour. Environ. 2021, 31, 26–36. [Google Scholar]
- Wang, Q.; Gao, C.Y. Research on the effect of carbon trading system on helping China avoid carbon traps and promote carbon decoupling. China Popul. Resour. Environ. 2018, 28, 16–23. [Google Scholar]
- Streimikiene, D.; Roos, I. GHG emission trading implications on energy sector in Baltic States. Renew. Sustain. Energy Rev. 2009, 13, 854–862. [Google Scholar] [CrossRef]
- Wang, J.; Yang, J.; Ge, C.; Cao, D.; Schreifels, J. Controlling sulfurdioxide in China: Will Emission Trading Work? Environ. Sci. Policy Sustain. Dev. 2004, 46, 28–39. [Google Scholar] [CrossRef]
- Sangbum, S. China’s failure of policy innovation: The case of sulphur dioxide emission trading. Environ. Politics 2013, 22, 918–934. [Google Scholar] [CrossRef]
- Cheng, B.; Dai, H.; Wang, P.; Xie, Y.; Chen, L.; Zhao, D.; Masui, T. Impacts of low-carbon power policy on carbon mitigation in Guangdong Province, China. Energy Policy 2016, 88, 515–527. [Google Scholar] [CrossRef]
- Hu, R.X. Research on the Effect and Path of Emission Reduction in Tianjin Carbon Trading Pilot—Evidence Based on the Synthetic Control Method. J. Fujian Commer. Coll. 2019, 4, 77–84. [Google Scholar] [CrossRef]
- Cames, M.; Weidlich, A. Emissions trading and innovation in the German electricity industry-impact of possible design options for an emissions trading scheme on innovation strategies in the German electricity industry. In Emissions Trading Business; Springer: Berlin/Heidelberg, Germany, 2006; pp. 39–51. [Google Scholar] [CrossRef]
- Capoor, K.; Ambrosi, P. State and Trends of the Carbon Market 2009. In World Bank Other Operational Studies; The World Bank: Washington, DC, USA, 2009. [Google Scholar]
- Zhang, W.W.; Zhu, G.P.; Zhang, J.R. Empirical Study on emission reduction performance of international car-bon market. Res. Financ. Econ. 2014, 12, 35–40. [Google Scholar] [CrossRef]
- Chen, X.; Xu, J.T. Summary of China’s Carbon Trading Pilot Operation; Social Sciences Literature Press: Beijing, China, 2017. [Google Scholar]
- Shen, H.T.; Huang, N.; Liu, L. A Study of the Micro-effect and Mechanism of the Carbon Emission Trading Scheme. J. Xiamen Univ. Philos. Soc. Sci. 2017, 1, 13–22. [Google Scholar]
- Tu, Z.G.; Kan, R.J. Can Emissions Trading Scheme Achieve the Porter Effect in China? Econ. Res. J. 2015, 50, 160–173. [Google Scholar]
- Song, D.Y.; Xia, T.X. Performance evaluation of China’s carbon trading pilot policy. Stat. Decis. 2019, 35, 157–160. [Google Scholar] [CrossRef]
- Zhang, H.; Duan, M. China’s pilot emissions trading schemes and competitiveness: An empirical analysis of the provincial industrial sub-sectors. J. Environ. Manag. 2020, 258, 109997. [Google Scholar] [CrossRef] [PubMed]
- Wen, Y.; Hu, P.; Li, J.; Liu, Q.; Shi, L.; Ewing, J.; Ma, Z. Does China’s carbon emissions trading scheme really work? A case study of the hubei pilot. J. Clean. Prod. 2020, 277, 124151. [Google Scholar] [CrossRef]
- Wang, P.; Dai, H.C.; Zhao, D.Q. Assessment of Guangdong carbon emission trading based on GD_CGE model. Acta Sci. Circumstantiae 2014, 34, 2925–2931. [Google Scholar] [CrossRef]
- Liu, Y.; Wen, D.H.; Wang, Y.; Sun, Z.Q. Assessment of Impacts of Tianjin Pilot Emission Trading Schemes in China—A CGE-Analysis Using Term CO2 Model. Progress. Inquisitiones Mutat. Clim. 2016, 12, 561–570. [Google Scholar] [CrossRef]
- Huang, Z.P. Is carbon emission trading beneficial to carbon emission reduction? a study based on double dif-ference method. Resour. Environ. Arid Areas 2018, 32, 32–36. [Google Scholar] [CrossRef]
- Zhou, D.; Liu, Y.C. Impact of China’s carbon emission trading policy on the performance of urban carbon emis-sion and its mechanism. China Environ. Sci. 2020, 40, 453–464. [Google Scholar]
- Liu, C.M.; Sun, Z.; Zhang, J. Research on the effect of carbon emission reduction policy in China’s carbon emissions trading pilot. China Popul. Resour. Environ. 2019, 29, 49–58. [Google Scholar] [CrossRef]
- Cao, L.; Tang, Y.; Cai, B.; Wu, P.; Zhang, Y.; Zhang, F.; Xin, B.; Lv, C.; Chen, K.; Fang, K. Was it better or worse? Simulating the environmental and health impacts of emissions trading scheme in Hubei province, China. Energy 2021, 217, 119427. [Google Scholar] [CrossRef]
- Shen, J.; Tang, P.; Zeng, H. Does China’s carbon emission trading reduce carbon emissions? Evidence from listed firms. Energy Sustain. Dev. 2020, 59, 120–129. [Google Scholar] [CrossRef]
- Nemet, G.F.; Holloway, T.; Meier, P. Implications of incorporating air-quality co-benefits into climate change policymaking. Environ. Res. Lett. 2010, 5, 014007. [Google Scholar] [CrossRef]
- Burtraw, D.; Krupnick, A.; Palmer, K.; Paul, A.; Toman, M.; Bloyd, C. Ancillary benefits of reduced air pollution in the US from moderate greenhouse gas mitigation policies in the electricity sector. J. Environ. Econ. Manag. 2003, 45, 650–673. [Google Scholar] [CrossRef]
- Groosman, B.; Muller, N.Z.; O’Neill-Toy, E. The Ancillary Benefits from Climate Policy in the United States. Environ. Resour. Econ. 2011, 50, 585–603. [Google Scholar] [CrossRef] [Green Version]
- Fujimori, S.; Masui, T.; Matsuoka, Y. Gains from emission trading under multiple stabilization targets and technological constraints. Energy Econ. 2015, 48, 306–315. [Google Scholar] [CrossRef]
- Chae, Y. Co-benefit analysis of an air quality management plan and greenhouse gas reduction strategies in the Seoul metropolitan area. Environ. Sci. Policy 2010, 13, 205–216. [Google Scholar] [CrossRef]
- Henneman, L.R.; Rafaj, P.; Annegarn, H.J.; Klausbruckner, C. Assessing emissions levels and costs associated with climate and air pollution policies in South Africa. Energy Policy 2016, 89, 160–170. [Google Scholar] [CrossRef]
- Song, F.; Fu, J.F. The Synergistic Emission Reduction of GHG and Sulfur Dioxide in the World’ s Major Coun-tries and Its Revelation. Resour. Sci. 2012, 34, 1439–1444. [Google Scholar]
- Mao, X.Q.; Xing, Y.K.; Hu, T. An environmental-economic analysis of carbon, sulfur and nitrogen co-reduction path for China’s power industry. China Environ. Sci. 2012, 32, 748–756. [Google Scholar] [CrossRef]
- Yan, W.Q.; Gao, L.J.; Ren, J.J.; Fen, Y.C. Air pollutant reduction co-benefits of CDM in China. China Environ. Sci. 2013, 33, 1697–1704. [Google Scholar]
- Zhou, J.; Mao, X.; Hu, T.; Zeng, A.; Xing, Y.; Corsetti, G. Implications of the 11th and 12th Five-Year Plans for energy conservation and CO2 and air pollutants reduction: A case study from the city of Urumqi, China. J. Clean. Prod. 2016, 112, 1767–1777. [Google Scholar] [CrossRef]
- Syri, S.; Amann, M.; Capros, P.; Mantzos, L.; Cofala, J.; Klimont, Z. Low-CO2 energy pathways and regional air pollution in Europe. Energy Policy 2001, 29, 871–884. [Google Scholar] [CrossRef]
- Van Vuuren, D.; Cofala, J.; Eerens, H.; Oostenrijk, R.; Heyes, C.; Klimont, Z.; Elzen, M.D.; Amann, M. Exploring the ancillary benefits of the Kyoto Protocol for air pollution in Europe. Energy Policy 2006, 34, 444–460. [Google Scholar] [CrossRef] [Green Version]
- Ren, Y.Y.; Fu, J.Y. Research on the effect of carbon emissions trading on emission reduction and green development. China Popul. Resour. Environ. 2019, 29, 11–20. [Google Scholar] [CrossRef]
- Gu, A.L.; Teng, F.; Feng, X.Z. Assessment and Analysis on Co-benefits of Pollution Control and Greenhouse Gases Emission Reduction in Key Sectors. China Popul. Resour. Environ. 2016, 26, 10–17. [Google Scholar] [CrossRef]
- Fu, J.Y.; Yuan, Z.L. Evaluation of Effect and Analysis of Expansion Mechanism of Synergic Emission Abate-ment in China’s Power Industry. China Ind. Econ. 2017, 2, 43–59. [Google Scholar]
- Borghesi, S.; Cainelli, G.; Mazzanti, M. Linking emission trading to environmental innovation: Evidence from the Italian manufacturing industry. Res. Policy 2015, 44, 669–683. [Google Scholar] [CrossRef]
- Wang, M.Y.; Shi, W.Q.; Li, M.M.; Li, M.M.; Zhong, C. Research on technology remote synergic sharing strategy of low carbon under the ETS in China. Syst. Eng. Theory Pract. 2019, 39, 1419–1434. [Google Scholar] [CrossRef]
- Yu, P.; Liu, J.X. Researchon the Effects of Carbon Trading Market Size on Environment and Economic Growth. China Soft Sci. 2020, 4, 46–55. [Google Scholar]
Figure 1.
The framework of synergistic analysis, decomposition and policy evaluation.

Figure 2.
Decomposition results of synergistic emission reduction effects.

Figure 3.
Inconsistent trend test results of SO2 synergistic emission reduction.


Table 1.
Summary of selected literatures and major findings.
| Authors | Time | Region | Methodology | Main Findings |
|---|---|---|---|---|
| Insignificant Emission Reduction Effect | ||||
| Streimikiene et al. | 2009 | European | Comparative analysis | The EU ETS has not yet delivered potential to reduce carbon emission. |
| Wang et al. | 2004 | China | Descriptive analysis | Emission trading did little to reduce pollutants emission. |
| Sangbum | 2013 | China | Institutional analysis | SO2 and acid rain emission became virtually unavailable. |
| Cheng et al. | 2016 | Guangdong | Regional CGE model | Carbon intensity targets can be achieved within Guangdong pilot ETS. |
| Hu | 2019 | Tianjin | SCM model | The effect on environmental protection effect was minimal. |
| Yang et al. | 2020 | Hubei | DID model | The ETS has had little demonstrable impact on industrial CO2 emissions. |
| Zhang and Duan | 2020 | China | PSM-DID method | China ETS have not reduced the carbon emissions in industrial sectors. |
| Significant Emission Reduction Effect | ||||
| Cames et al. | 2006 | Germany | Allocation analysis | Carbon trading system ultimately achieved the decline of carbon emission. |
| Capoor et al. | 2011 | World | Descriptive analysis | ETS reduced the total global carbon emissions by 2–5%. |
| Zhang et al. | 2014 | World | 2SLS model | ETS reduced the total global carbon emissions significantly. |
| Xing and Xu | 2017 | China | Descriptive analysis | Partial pilots produced significant emission reduction effects. |
| Shen et al. | 2017 | China | DID method | ETS promoted the low-carbon development of enterprises. |
| Tu and Chen | 2015 | China | DID method | Carbon emission reduction effect gradually strengthened over long term. |
| Song and Xia | 2019 | China | DID method | Carbon emission reduction effect had been strengthened year by year. |
| Tang et al. | 2014 | China | Multi-Agent model | Carbon trading was useful for decline of carbon emission. |
| Wang et al. | 2014 | China | GD-CGE model | ETS reduced emission mitigation costs and carbon emission. |
| Liu et al. | 2016 | Tianjin | Scenario analysis | The total carbon emissions could reduce 0.62% |
| Liu et al. | 2019 | China | SCM model | ETS reduced the carbon emission significantly. |
| Cao et al. | 2020 | Hubei | Databases analysis | ETS improved air quality in large parts of Hubei. |
| Shen et al. | 2020 | China | PSM-DID method | ETS reduced 129.6 million tons’ CO2, but attenuates gradually. |
Table 2.
Definition and expression of variables.
| Variable | Variable Meaning | Variable Description | Expected Sign |
|---|---|---|---|
| PGDP | Economic Level | Per capita income level | + |
| Energy | Energy Consumption | Energy consumption per capita | + |
| Intensity | Carbon Intensity | CO2 emissions per unit of output | − |
| Efficiency | Energy Efficiency | Energy consumption level per unit of output | + |
| Tech | Technology Progress | The number of patent applications per capita | − |
| Density | Population Density | The ratio of total population to administrative area | + |
| Urban | Urban Level | The proportion of urban pollutants in total pollutants | − |
| Industry | Industry Structure | The proportion of industrial output value in total output value | − |
Table 3.
Test results of intra-group autocorrelation, heteroscedasticity and synchronous correlation between groups.
Table 3.
Test results of intra-group autocorrelation, heteroscedasticity and synchronous correlation between groups.
| SSO2 | SDust | SNOX | SPM2.5 | |
|---|---|---|---|---|
| Heteroscedasticity (Wald Test) | Reject | Reject | Reject | Reject |
| Autocorrelation (Wooldridge Test) | Accept | Reject | Accept | Accept |
| Synchronous Correlation (Friedman’s Test) | Reject | Reject | Reject | Reject |
Note: The null hypothesis of intra-group autocorrelation, heteroscedasticity and synchronous correlation between groups are all “nonexistent”.
Table 4.
Regression results of synergistic emission reduction effects.
| (1) | (2) | (3) | (4) | |
|---|---|---|---|---|
| SSO2 | SDust | SNOX | SPM2.5 | |
| SCO2 | 0.0010 ** (1.86) | 0.0011 ** (2.33) | 0.0022 * (1.52) | 0.0113 (1.18) |
| PGDP | −1.4505 ** (−2.14) | −0.0001 * (−1.55) | −0.0002 (−1.59) | 0.0025 ** (2.27) |
| PGDP2 | 1.2644 *** (2.84) | 0.0001 (1.26) | 0.0001 (1.50) | −0.0014 *** (−2.59) |
| Efficiency | 2.0437 * (1.30) | 0.0004 (1.26) | 0.0005 (1.51) | 0.0021 (1.05) |
| Density | 0.0004 * (1.11) | −0.0005 * (−1.74) | −0.0014 ** (−1.83) | 0.0016 (0.90) |
| Urban | −0.1051 (−0.23) | −0.0001 (−0.10) | 0.0001 (0.48) | −0.0007 (−0.62) |
| Energy | 0.0359 (0.91) | 0.0367 (1.11) | 0.0379 (0.52) | 0.5511 (0.70) |
| Tech | −0.0008 (−0.07) | 0.0122 (1.26) | 0.0164 (0.62) | −0.0142 (−0.10) |
| Industry | −0.4488 * (−1.20) | −0.0001 * (−1.64) | −0.0001 (−1.32) | 0.0001 (0.10) |
| Intensity | −0.0026 (−0.30) | −0.0001 (−0.41) | 0.0001 (0.40) | 0.0001 (0.19) |
| Constant Term | 0.4478 (1.18) | 0.0001 (1.35) | 0.0001 (0.63) | −0.0011 ** (−2.55) |
Note: ***, **, * indicates statistical significance at 1%, 5% and 10% levels, respectively.
Table 5.
Preliminary estimates of emission reduction effects.
| CO2 | SO2 | Dust | NOX | PM2.5 | |
|---|---|---|---|---|---|
| DID | −0.0027 * (−2.10) | −0.0002 ** (−2.52) | 0.0001 ** (2.51) | 0.0004 ** (2.19) | −0.0001 (−0.55) |
Note: ** and * indicate statistical significance at 5% and 10% levels, respectively.
Table 6.
The mechanism analysis of synergistic emission reduction.
| C-FGLS | (1) | (2) | (3) | (4) |
|---|---|---|---|---|
| SCO2 | 0.0012 (1.14) | 0.0025 (0.79) | 0.0004 (0.23) | 0.0043 (1.04) |
| PGDP | −0.0001 ** (−2.24) | −0.0001 ** (−2.24) | −0.0001 ** (2.23) | −0.0001 ** (−2.21) |
| PGDP2 | 0.0001 *** (2.88) | 0.0001 *** (2.92) | 0.0001 *** (2.88) | 0.0001 ** (2.87) |
| Efficiency | 0.0002 (1.46) | 0.0002 (1.33) | 0.0002 (1.39) | 0.0002 (1.46) |
| Industry | −0.0001 (−1.49) | −0.0001 (−1.31) | −0.0001 (−1.45) | −0.0001 (−1.35) |
| SCO2 × Efficiency | −0.0093 (−0.70) | −0.0139 (−0.97) | ||
| SCO2 × Industry | −0.0040 (−0.59) | −0.0064 (−0.87) | ||
| SCO2 × PGDP | 0.0003 (0.15) | 0.0003 (0.14) |
Note: *** and ** indicate statistical significance at 1% and 5% levels, respectively.
Table 7.
Balance test results of variables before and after propensity score matching.
| Variable | Mean Value (Treatment Group) | Mean Value (Control Group) | Standard Deviation | t Value | p Value |
|---|---|---|---|---|---|
| PGDP | 1.0887 | 0.6078 | 134.0000 | 11.11 | 0.0000 |
| 0.6273 | 0.6479 | −5.7000 | −0.28 | 0.7790 | |
| PGDP2 | 1.3750 | 0.4337 | 127.1000 | 11.78 | 0.0001 |
| 0.4260 | 0.4610 | −4.7000 | −0.37 | 0.7140 | |
| Efficiency | 0.1939 | 0.0883 | 164.5000 | 13.82 | 0.0000 |
| 0.1335 | 0.1354 | −2.8000 | −0.15 | 0.879 | |
| Density | 0.1219 | 0.0262 | 114.3000 | 12.07 | 0.0000 |
| 0.0326 | 0.0353 | −3.1000 | −0.45 | 0.6560 | |
| Urban | 0.7139 | 0.4889 | 182.6000 | 14.90 | 0.0000 |
| 0.5323 | 0.5377 | −4.4000 | −0.20 | 0.8010 | |
| Energy | 0.0003 | 0.0003 | −0.3000 | −0.02 | 0.9870 |
| 0.0002 | 0.0002 | 4.5000 | 0.34 | 0.7390 | |
| Tech | 0.0014 | 0.0004 | 103.1000 | 7.95 | 0.0000 |
| 0.0005 | 0.0005 | 0.5000 | 0.02 | 0.9810 | |
| Industry | 0.4262 | 0.4760 | −51.5000 | −3.78 | 0.0000 |
| 0.4816 | 0.5116 | −31.1000 | −2.36 | 0.0260 | |
| Intensity | 5.9212 | 15.859 | −117.5000 | −6.51 | 0.000 |
| 7.9840 | 7.9191 | 0.8000 | 0.07 | 0.9420 |
Table 8.
The synergistic emission reduction effect of emission trading pilots (SO2 and CO2).
| Direct Synergy (DSSO2) | Economy Synergy (DGDP) | Efficiency Synergy (DEficiency) | Industry Synergy (DIndustry) | |
|---|---|---|---|---|
| DID | 0.0034 ** (3.93) | −0.0003 (−0.90) | 0.0004 (1.20) | 0.0001 (0.82) |
| SCO2 | 0.0148 (0.51) | 0.0122 (0.37) | −0.0250 (−0.71) | −0.0012 (1.22) |
| PGDP | −0.0002 (−0.07) | −0.0067 (−1.40) | 0.0086 * (1.72) | 0.0002 (−0.48) |
| PGDP2 | −0.0024 ** (−2.07) | 0.0045 * (1.68) | −0.0058 ** (−2.03) | −0.0002 (0.59) |
| Efficiency | 0.0075 (1.49) | −0.0081 (−0.67) | 0.0101 (0.80) | 0.0006 (−1.24) |
| Density | 0.0088 *** (2.62) | −0.0038 (−0.46) | −0.0004 (−0.05) | 0.0004 (0.66) |
| Urban | −0.0017 (−0.60) | 0.0036 (0.68) | −0.0057 (−1.01) | −0.0001 (−0.68) |
| Energy | 2.8381 * (1.62) | −0.0689 (−0.03) | 0.4306 (0.18) | 0.2676 * (−0.07) |
| Tech | 0.9783 *** (2.90) | −0.1746 (−0.53) | 0.2632 (0.76) | 0.0170 (1.61) |
| Industry | −0.0006 (−0.33) | −0.0003 (−0.19) | −0.0010 (−0.72) | 0.0001 (0.71) |
| Intensity | 0.0001 (0.05) | −0.0001 (−0.77) | 0.0002 (0.95) | 0.0001 (0.34) |
| Constant Term | −0.0001 (−0.09) | 0.0031 (1.02) | −0.0027 (−0.86) | 0.0001 (0.33) |
Note: ***, **, * indicates statistical significance at 1%, 5% and 10% levels, respectively.
Table 9.
The result of robustness test.
| Dynamic Marginal Effect | Adjustment of Window | Adjustment of Pilot | ||
|---|---|---|---|---|
| (1) | (2) | (3) | (4) | |
| DID | 0.0001 (0.20) | 0.0002 (0.60) | ||
| Treated × T2014 | −0.0004 (−0.84) | −0.0004 (−0.76) | ||
| Treated × T2015 | 0.0007 * (1.54) | 0.0009 ** (1.90) | ||
| Treated × T2016 | 0.0001 (0.23) | 0.0005 (0.97) | ||
| PGDP | −0.0030 (−0.56) | −0.0019 (−0.34) | −0.0018 (−0.31) | |
| PGDP2 | −0.0006 (−0.22) | −0.0001 (−0.02) | −0.0001 (−0.01) | |
| Efficiency | −0.0088 (−0.72) | −0.0085 (−0.69) | −0.0075 (−0.61) | |
| Density | 0.0070 (0.74) | 0.0039 (0.42) | 0.0033 (0.35) | |
| Urban | 0.0072 (1.14) | 0.0044 (0.73) | 0.0038 (0.59) | |
| Energy | 1.3469 (0.46) | −0.1543 (−0.05) | 0.4396 (0.15) | |
| Tech | 0.3753 (1.22) | 0.2539 (0.88) | 0.2172 (0.77) | |
| Industry | −0.0005 (−0.45) | −0.0002 (−0.14) | −0.0002 (−0.21) | |
| Intensity | −0.0002 (−1.55) | −0.0002 (−1.11) | −0.0002 (−1.04) | |
| Constant Term | −0.0006 *** (−3.89) | 0.0005 (0.16) | 0.0009 (0.28) | 0.0010 (0.33) |
Note: ***, **, * indicates statistical significance at 1%, 5% and 10% levels, respectively.
Table 10.
The mechanism analysis of carbon emission policy.
| Variable | SCO2 | |||
|---|---|---|---|---|
| (1) | (2) | (3) | (4) | |
| DID | 0.0062 ** (2.40) | 0.0046 (0.93) | 0.0018 (1.33) | 0.0075 * (1.40) |
| Treated × PGDP | −0.0135 ** (−1.95) | −0.0265 ** (−2.26) | ||
| Treated × Efficence | −0.0406 (−0.57) | 0.0487 (0.61) | ||
| Treated × Idustry | −0.0202 (−0.62) | 0.0619 (1.30) | ||
| PGDP | −0.0296 * (−1.31) | −0.0368 * (−1.57) | −0.0347 * (−1.48) | −0.0250 (−1.09) |
| PGDP2 | −0.0025 (−0.22) | −0.0026 (−0.21) | −0.0046 (−0.37) | 0.0003 (0.02) |
| Efficiency | −0.0797 (−1.57) | −0.0666 (−1.27) | −0.0649 (−1.24) | −0.0914 * (−1.78) |
| Industry | −0.0138 *** (−3.20) | −0.0151 *** (−3.38) | −0.0154 *** (−3.47) | −0.0121 *** (−2.68) |
| Constant Term | 0.0141 (1.13) | 0.0105 (0.81) | 0.0099 (0.76) | 0.0186 (1.44) |
Note: ***, **, * indicates statistical significance at 1%, 5% and 10% levels, respectively.
Publisher’s Note: MDPI stays neutral with regard to jurisdictional claims in published maps and institutional affiliations. |
© 2021 by the authors. Licensee MDPI, Basel, Switzerland. This article is an open access article distributed under the terms and conditions of the Creative Commons Attribution (CC BY) license (https://creativecommons.org/licenses/by/4.0/).
Share and Cite
MDPI and ACS Style
Li, Z.; Wang, J.; Che, S. Synergistic Effect of Carbon Trading Scheme on Carbon Dioxide and Atmospheric Pollutants. Sustainability 2021, 13, 5403. https://0-doi-org.brum.beds.ac.uk/10.3390/su13105403
AMA Style
Li Z, Wang J, Che S. Synergistic Effect of Carbon Trading Scheme on Carbon Dioxide and Atmospheric Pollutants. Sustainability. 2021; 13(10):5403. https://0-doi-org.brum.beds.ac.uk/10.3390/su13105403
Chicago/Turabian StyleLi, Zhiguo, Jie Wang, and Shuai Che. 2021. "Synergistic Effect of Carbon Trading Scheme on Carbon Dioxide and Atmospheric Pollutants" Sustainability 13, no. 10: 5403. https://0-doi-org.brum.beds.ac.uk/10.3390/su13105403
Note that from the first issue of 2016, this journal uses article numbers instead of page numbers. See further details here.