
Assessment of the Governance Dimension in the Frame of the 2030 Agenda: Evidence from 100 Spanish Cities


Abstract
:1. Introduction
2. Theoretical Framework
2.1. Governance, Policy Integration, Strategic Planning, and Sustainable Development
2.2. Composite Indices to Measure Sustainable Development
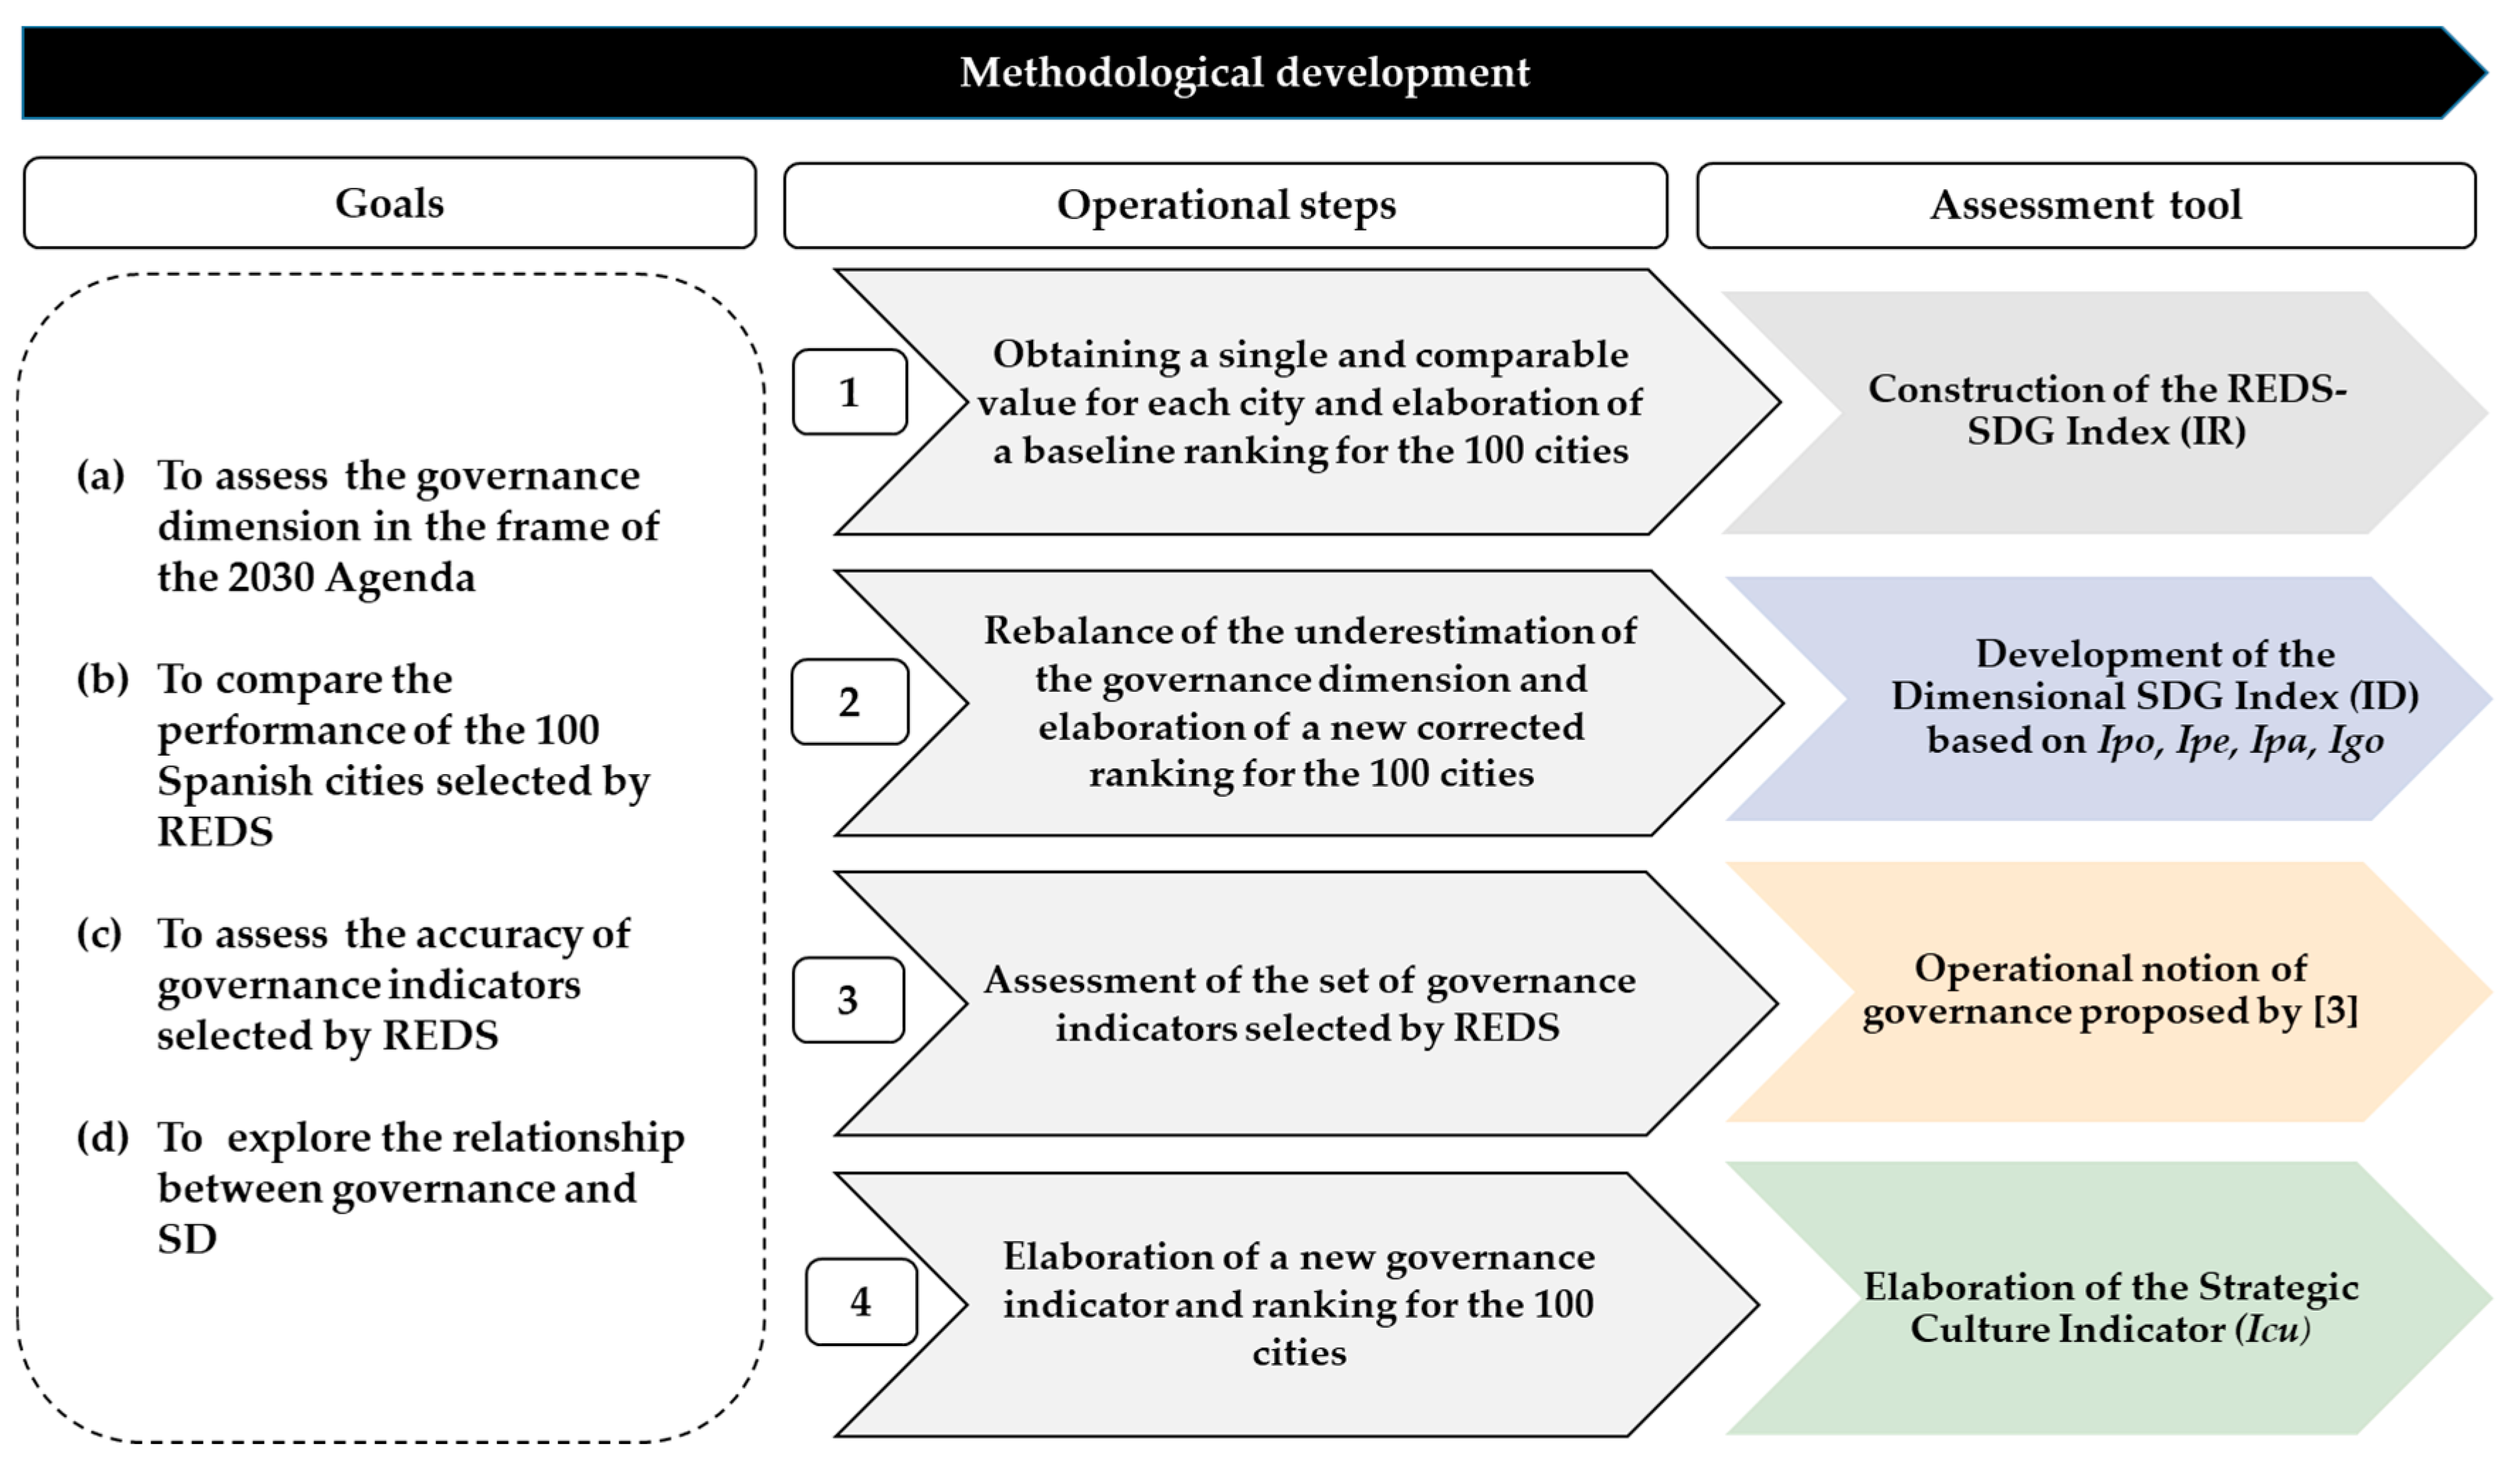
3. Materials and Methods
3.1. Constrution of the REDS-SDG Index (IR)
3.2. Development of the Dimensional SDG Index (ID)
3.3. Operational Notion of Governance
3.4. Elaboration of the Strategic Culture Indicator (Icu)
4. Results
4.1. Baseline Ranking of 100 Cities upon IR: SD Performance Is Midway
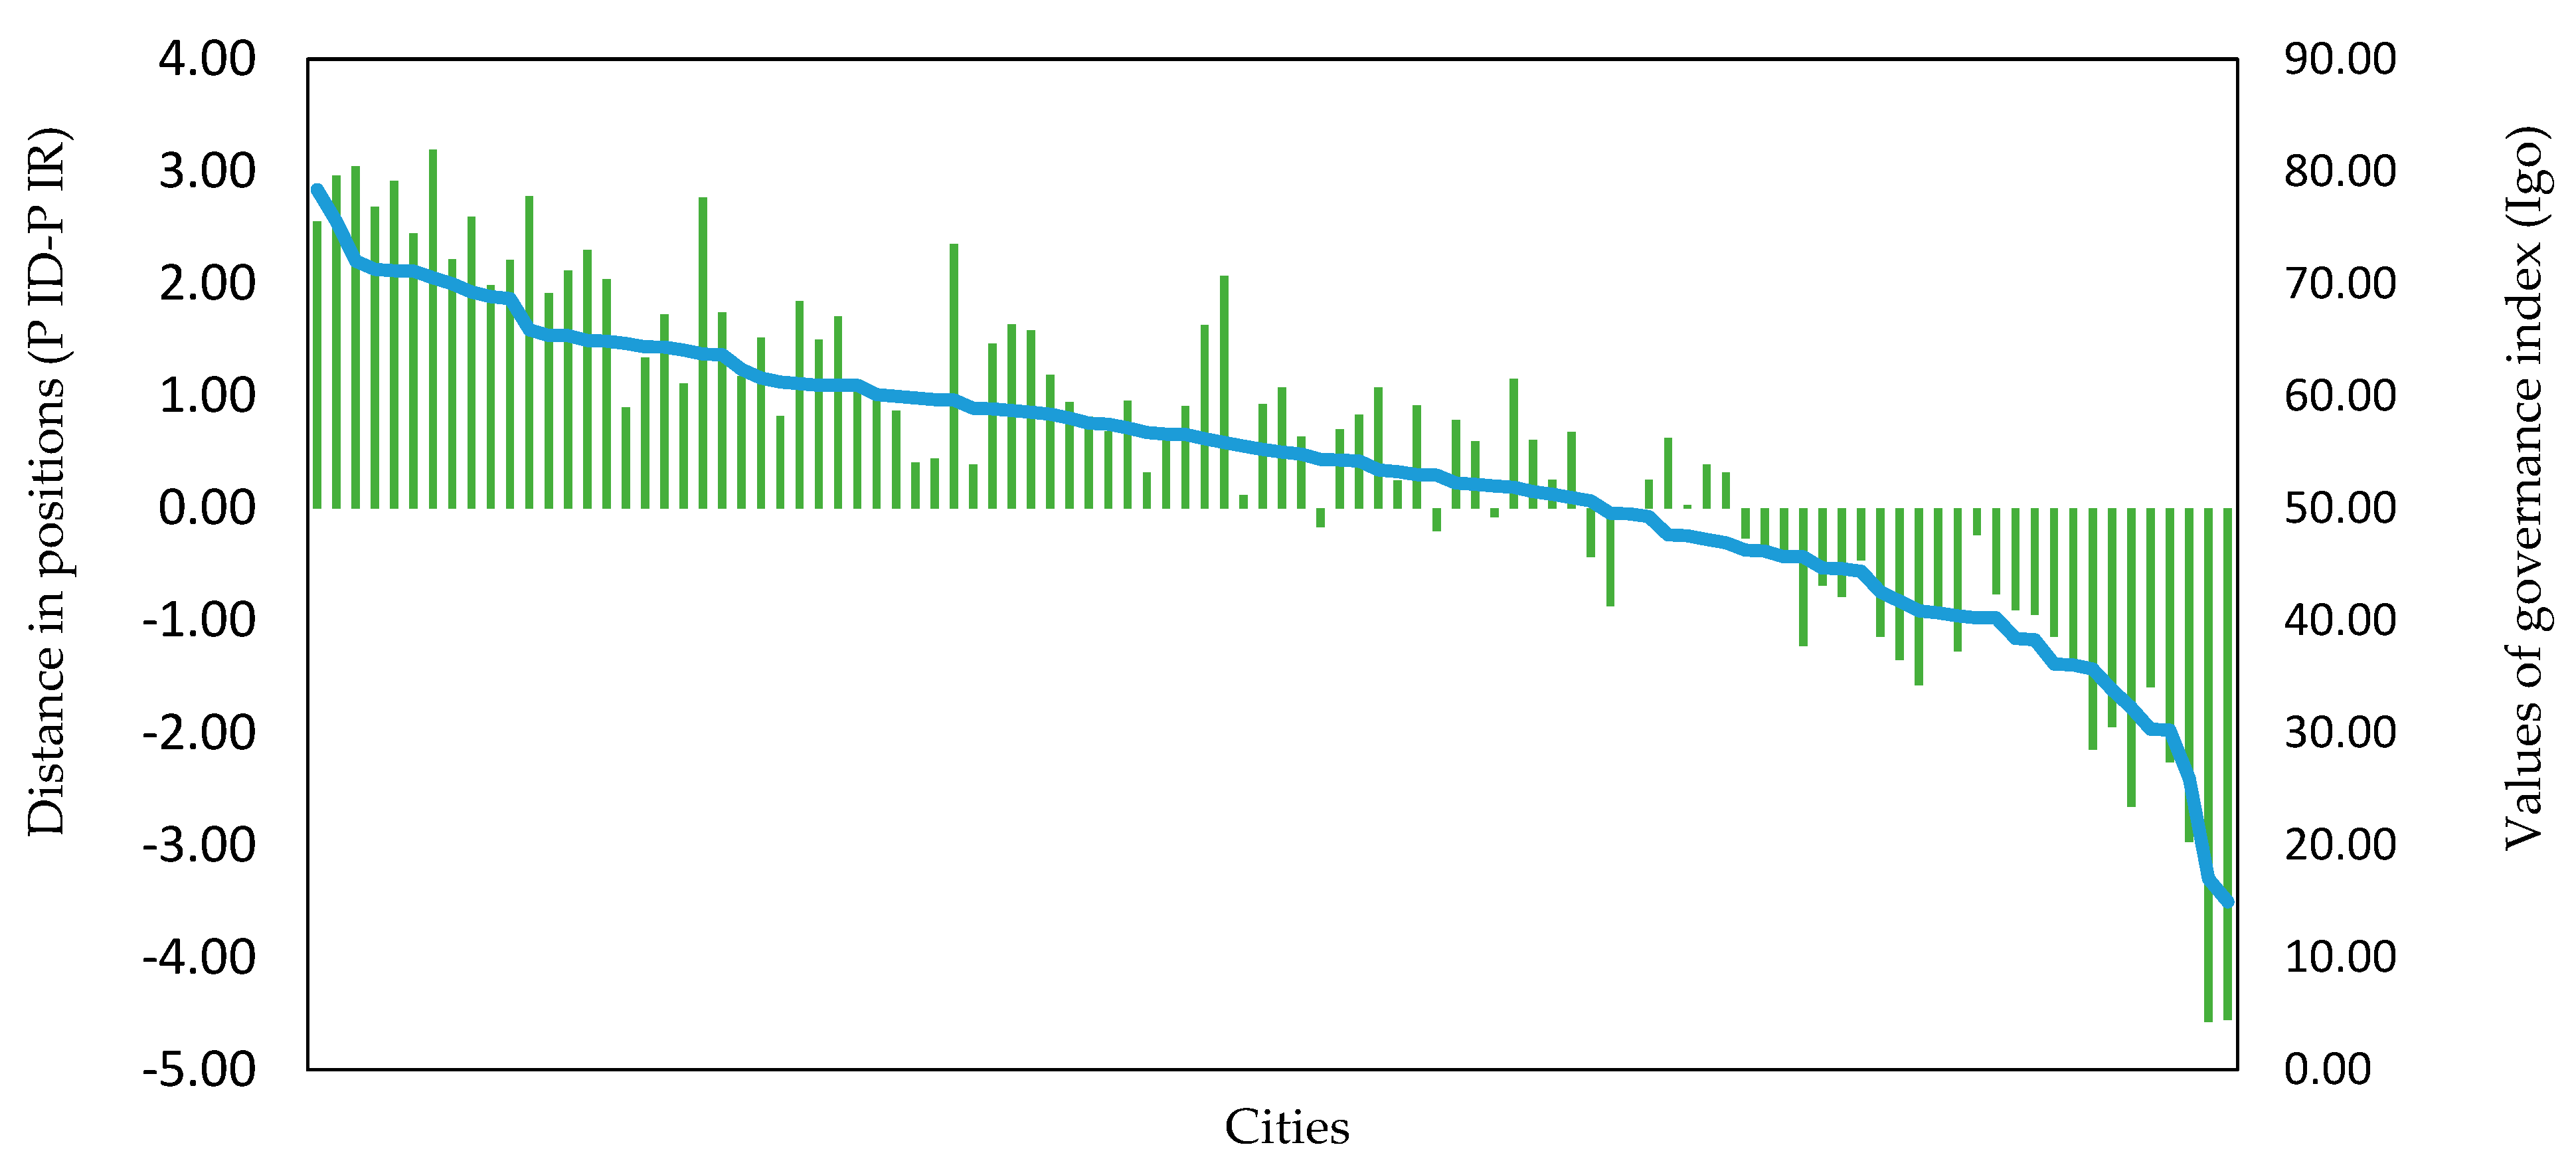
4.2. Corrected Ranking of 100 Cities upon ID: Better Governance Triggers Better SD Performance
4.3. Assessment of Governance Indicators Used by the REDS: Better Than Others but Still Incomplete
4.4. Ranking of 100 Cities upon Icu: More Experience in Urban Strategic Planning Accelerates SD Performance
5. Discussion
6. Conclusions
Author Contributions
Funding
Acknowledgments
Conflicts of Interest
Appendix A

| City | IR | Ipe | Ipa | Ipo | Igo | ID |
|---|---|---|---|---|---|---|
| Vitoria-Gasteiz | 60.54 | 58.07 | 61.99 | 53.93 | 78.37 | 63.09 |
| Pozuelo de Alarcón | 58.69 | 59.59 | 68.71 | 45.37 | 64.68 | 59.59 |
| Las Rozas de Madrid | 57.11 | 53.35 | 66.41 | 50.46 | 59.83 | 57.51 |
| Alcobendas | 56.74 | 55.91 | 62.02 | 51.11 | 59.67 | 57.18 |
| Madrid | 56.66 | 54.47 | 60.13 | 52.40 | 64.06 | 57.77 |
| Alcorcón | 56.31 | 53.54 | 63.95 | 50.40 | 58.91 | 56.70 |
| Getafe | 55.76 | 54.41 | 60.63 | 50.04 | 61.22 | 56.58 |
| Logroño | 55.75 | 51.50 | 51.63 | 56.58 | 75.51 | 58.72 |
| Soria | 55.60 | 37.86 | 69.55 | 54.09 | 68.83 | 57.58 |
| San Cugat del Vallés | 55.45 | 54.15 | 56.56 | 52.06 | 64.37 | 56.79 |
| Rivas-Vaciamadrid | 55.44 | 51.68 | 60.99 | 54.10 | 54.34 | 55.28 |
| Fuenlabrada | 55.35 | 52.05 | 62.43 | 53.88 | 49.54 | 54.48 |
| Donostia/San Sebastián | 55.23 | 50.08 | 60.47 | 49.23 | 69.99 | 57.44 |
| Burgos | 54.80 | 45.01 | 55.98 | 56.90 | 71.10 | 57.25 |
| San Sebastián de los Reyes | 54.75 | 52.82 | 60.02 | 51.11 | 55.53 | 54.87 |
| Leganés | 54.63 | 52.11 | 61.98 | 48.95 | 56.75 | 54.95 |
| Ávila | 54.52 | 47.64 | 62.41 | 50.37 | 62.36 | 55.70 |
| Alcalá de Henares | 54.31 | 51.13 | 56.80 | 55.54 | 52.94 | 54.10 |
| Huesca | 54.18 | 45.97 | 61.67 | 52.58 | 59.96 | 55.04 |
| Santander | 53.94 | 42.89 | 59.76 | 53.30 | 68.67 | 56.15 |
| Coslada | 53.85 | 51.08 | 58.89 | 54.84 | 45.67 | 52.62 |
| Móstoles | 53.54 | 54.11 | 56.68 | 51.01 | 50.64 | 53.11 |
| Zaragoza | 53.34 | 48.61 | 52.24 | 52.02 | 71.25 | 56.03 |
| Pamplona/Iruña | 53.28 | 49.27 | 56.19 | 51.32 | 60.93 | 54.43 |
| Girona | 53.06 | 55.61 | 50.78 | 49.97 | 60.12 | 54.12 |
| Cáceres | 52.92 | 47.55 | 57.33 | 52.05 | 57.47 | 53.60 |
| Albacete | 52.83 | 49.06 | 52.19 | 52.64 | 64.35 | 54.56 |
| Bilbao | 52.63 | 54.45 | 46.42 | 51.92 | 65.37 | 54.54 |
| Palma | 52.48 | 49.69 | 59.33 | 48.64 | 51.97 | 52.41 |
| Lugo | 52.12 | 38.94 | 59.06 | 56.20 | 57.57 | 52.94 |
| Gijón | 52.01 | 44.28 | 54.74 | 52.36 | 63.65 | 53.76 |
| Guadalajara | 51.93 | 47.27 | 55.79 | 45.81 | 69.24 | 54.53 |
| Santiago de Compostela | 51.93 | 49.29 | 51.52 | 53.10 | 56.60 | 52.63 |
| Oviedo | 51.73 | 46.90 | 48.08 | 52.11 | 72.01 | 54.78 |
| Palencia | 51.73 | 44.29 | 52.17 | 50.97 | 71.15 | 54.65 |
| Tarrasa | 51.73 | 50.30 | 49.93 | 52.45 | 58.02 | 52.67 |
| San Cristóbal de La Laguna | 51.63 | 47.02 | 64.84 | 42.37 | 53.25 | 51.87 |
| Ciudad Real | 51.47 | 51.33 | 50.12 | 48.89 | 61.60 | 52.99 |
| Torrejón de Ardoz | 51.33 | 47.52 | 60.30 | 50.38 | 40.85 | 49.76 |
| Castellón de la Plana | 51.29 | 46.03 | 52.51 | 49.91 | 64.86 | 53.33 |
| Lleida | 51.27 | 45.37 | 49.42 | 53.38 | 65.37 | 53.38 |
| Tarragona | 50.94 | 49.04 | 49.34 | 50.44 | 60.95 | 52.44 |
| Avilés | 50.76 | 47.67 | 49.23 | 52.84 | 57.15 | 51.72 |
| Baracaldo | 50.69 | 54.18 | 50.48 | 51.01 | 41.71 | 49.35 |
| Cornellá de Llobregat | 50.56 | 49.76 | 48.17 | 52.03 | 54.81 | 51.20 |
| Barcelona | 50.49 | 57.51 | 40.35 | 51.18 | 56.55 | 51.40 |
| San Baudilio de Llobregat | 50.47 | 50.29 | 44.93 | 53.02 | 58.38 | 51.65 |
| Santa Cruz de Tenerife | 50.15 | 46.21 | 63.69 | 43.59 | 42.55 | 49.01 |
| Arona | 50.01 | 39.37 | 71.02 | 45.36 | 35.69 | 47.86 |
| Parla | 49.95 | 48.26 | 56.22 | 52.43 | 32.25 | 47.29 |
| Las Palmas de Gran Canaria | 49.85 | 47.27 | 60.40 | 43.96 | 44.61 | 49.06 |
| Sabadell | 49.62 | 46.65 | 50.24 | 52.00 | 49.50 | 49.60 |
| Córdoba | 49.60 | 45.45 | 53.92 | 43.31 | 64.92 | 51.90 |
| Granada | 49.60 | 51.19 | 52.40 | 43.33 | 54.30 | 50.31 |
| Orense | 49.55 | 40.43 | 59.07 | 48.48 | 51.25 | 49.81 |
| Toledo | 49.54 | 51.95 | 50.58 | 41.54 | 60.94 | 51.25 |
| Badajoz | 49.27 | 45.73 | 53.62 | 50.29 | 44.67 | 48.58 |
| Segovia | 49.22 | 39.27 | 50.49 | 49.39 | 70.51 | 52.41 |
| Cuenca | 49.06 | 42.98 | 47.36 | 52.93 | 58.84 | 50.53 |
| Hospitalet de Llobregat | 49.04 | 47.61 | 44.08 | 52.96 | 55.23 | 49.97 |
| Cádiz | 49.00 | 53.58 | 52.43 | 42.10 | 46.19 | 48.58 |
| Jaén | 48.91 | 47.46 | 55.28 | 47.40 | 40.42 | 47.64 |
| León | 48.80 | 44.65 | 50.04 | 46.80 | 61.09 | 50.64 |
| Badalona | 48.69 | 51.20 | 41.29 | 54.78 | 45.70 | 48.24 |
| Salamanca | 48.66 | 41.88 | 55.37 | 46.50 | 54.21 | 49.49 |
| Marbella | 48.16 | 37.91 | 60.88 | 44.11 | 52.14 | 48.76 |
| Valencia | 48.07 | 49.53 | 47.07 | 48.33 | 46.27 | 47.80 |
| Alicante | 47.97 | 45.33 | 46.25 | 48.12 | 58.53 | 49.56 |
| Pontevedra | 47.82 | 45.30 | 45.54 | 49.77 | 55.00 | 48.90 |
| Vigo | 47.76 | 45.67 | 46.08 | 47.14 | 58.69 | 49.40 |
| Reus | 47.58 | 43.73 | 48.85 | 49.48 | 49.24 | 47.83 |
| Telde | 47.46 | 46.16 | 65.58 | 42.84 | 16.99 | 42.89 |
| Santa Coloma de Gramanet | 47.45 | 49.22 | 45.34 | 49.00 | 44.37 | 46.98 |
| Huelva | 47.44 | 48.02 | 48.33 | 44.34 | 51.48 | 48.04 |
| Valladolid | 47.36 | 46.40 | 36.11 | 52.18 | 65.88 | 50.14 |
| Mataró | 47.35 | 46.79 | 42.78 | 52.41 | 47.56 | 47.38 |
| Cartagena | 47.02 | 44.59 | 49.28 | 45.10 | 52.25 | 47.80 |
| La Coruña | 46.89 | 43.55 | 49.33 | 45.35 | 52.98 | 47.80 |
| San Fernando | 46.85 | 52.02 | 51.58 | 42.16 | 33.86 | 44.90 |
| El Puerto de Santa María | 46.53 | 46.33 | 54.40 | 41.21 | 40.68 | 45.65 |
| Málaga | 46.44 | 48.80 | 44.68 | 44.03 | 50.94 | 47.11 |
| Zamora | 46.24 | 37.91 | 49.02 | 48.92 | 53.39 | 47.31 |
| Ceuta | 45.71 | 50.33 | 52.21 | 42.52 | 25.92 | 42.75 |
| Algeciras | 45.33 | 48.42 | 51.02 | 42.59 | 30.25 | 43.07 |
| Melilla | 45.33 | 45.06 | 55.94 | 47.13 | 14.97 | 40.77 |
| Chiclana de la Frontera | 45.32 | 47.40 | 55.19 | 35.39 | 40.24 | 44.55 |
| Murcia | 45.31 | 45.73 | 42.68 | 40.14 | 63.73 | 48.07 |
| Sevilla | 45.30 | 47.52 | 40.07 | 43.96 | 56.17 | 46.93 |
| Jerez de la Frontera | 45.07 | 46.93 | 52.62 | 39.27 | 36.03 | 43.71 |
| Roquetas de Mar | 44.81 | 34.66 | 56.06 | 42.86 | 46.92 | 45.12 |
| Almería | 44.62 | 41.18 | 50.00 | 45.20 | 38.29 | 43.67 |
| Lorca | 44.61 | 39.23 | 50.76 | 42.79 | 47.21 | 45.00 |
| Vélez-Málaga | 44.44 | 39.05 | 57.14 | 39.55 | 38.40 | 43.53 |
| Torrent | 44.20 | 41.38 | 47.46 | 40.67 | 51.87 | 45.35 |
| Elche | 43.96 | 37.63 | 42.64 | 45.34 | 59.65 | 46.32 |
| Dos Hermanas | 43.77 | 48.78 | 40.05 | 45.52 | 36.13 | 42.62 |
| Talavera de la Reina | 43.47 | 39.79 | 50.38 | 38.58 | 47.64 | 44.10 |
| Teruel | 42.06 | 41.26 | 27.22 | 52.20 | 55.84 | 44.13 |
| Torrevieja | 41.85 | 35.31 | 49.99 | 40.88 | 40.25 | 41.61 |
| El Ejido | 40.95 | 32.60 | 55.55 | 38.96 | 30.34 | 39.36 |
| Cities | Icu | P Igo | Igo | P IR | IR | P ID | ID | P IR-ID | % P Change |
|---|---|---|---|---|---|---|---|---|---|
| Palencia | Group 1 | 5 | 71.15 | 35 | 51.73 | 21 | 54.65 | +14 | 28.57% (worse) 71.43% (better) |
| Alcobendas | 33 | 59.67 | 4 | 56.74 | 9 | 57.18 | −5 | ||
| Alicante | 38 | 58.53 | 68 | 47.97 | 57 | 49.56 | +11 | ||
| Barcelona | 46 | 56.55 | 46 | 50.49 | 46 | 51.40 | 0 | ||
| Sevilla | 47 | 56.17 | 88 | 45.30 | 81 | 46.93 | +7 | ||
| Málaga | 66 | 50.94 | 81 | 46.44 | 79 | 47.11 | +2 | ||
| Almería | 90 | 38.29 | 91 | 44.62 | 92 | 43.67 | −1 | ||
| Oviedo | Group 2 | 1 | 72.01 | 34 | 51.73 | 20 | 54.78 | +14 | 37.50% (worse) 62.50% (better) |
| Burgos | 3 | 71.10 | 14 | 54.80 | 8 | 57.25 | +6 | ||
| Santander | 6 | 68.67 | 20 | 53.94 | 13 | 56.15 | +7 | ||
| Bilbao | 11 | 65.37 | 28 | 52.63 | 23 | 54.54 | +5 | ||
| Córdoba | 13 | 64.92 | 53 | 49.60 | 42 | 51.90 | +11 | ||
| Albacete | 15 | 64.35 | 27 | 52.83 | 22 | 54.56 | +5 | ||
| Madrid | 19 | 64.06 | 5 | 56.66 | 4 | 57.77 | +1 | ||
| Murcia | 20 | 63.73 | 87 | 45.31 | 68 | 48.07 | +19 | ||
| Getafe | 21 | 61.22 | 7 | 55.76 | 12 | 56.58 | −5 | ||
| Pamplona/Iruña | 25 | 60.93 | 24 | 53.28 | 26 | 54.43 | −2 | ||
| Elche | 29 | 59.65 | 95 | 43.96 | 82 | 46.32 | +13 | ||
| Santiago de Compostela | 34 | 56.60 | 33 | 51.93 | 37 | 52.63 | −4 | ||
| Hospitalet de Llobregat | 45 | 55.23 | 60 | 49.04 | 53 | 49.97 | +7 | ||
| La Coruña | 50 | 52.98 | 78 | 46.89 | 73 | 47.80 | +5 | ||
| Torrent | 58 | 51.87 | 94 | 44.20 | 84 | 45.35 | +10 | ||
| Talavera de la Reina | 63 | 47.64 | 97 | 43.47 | 90 | 44.10 | +7 | ||
| Valencia | 71 | 46.27 | 67 | 48.07 | 74 | 47.80 | −7 | ||
| Cádiz | 75 | 46.19 | 61 | 49.00 | 66 | 48.58 | −5 | ||
| Badajoz | 76 | 44.67 | 57 | 49.27 | 65 | 48.58 | −8 | ||
| S. Coloma de Gramanet | 79 | 44.37 | 73 | 47.45 | 80 | 46.98 | −7 | ||
| Santa Cruz TF | 81 | 42.55 | 48 | 50.15 | 62 | 49.01 | −14 | ||
| Vélez-Málaga | 82 | 38.40 | 93 | 44.44 | 93 | 43.53 | 0 | ||
| Jerez de la Frontera | 89 | 36.03 | 89 | 45.07 | 91 | 43.71 | −2 | ||
| Vitoria | Group 3 | 92 | 78.37 | 1 | 60.54 | 1 | 63.09 | 0 | 40.00% (worse) 60.00% (better) |
| Zaragoza | 4 | 71.25 | 23 | 53.34 | 14 | 56.03 | +9 | ||
| San Sebastian | 8 | 69.99 | 13 | 55.23 | 7 | 57.44 | +6 | ||
| Gijón | 22 | 63.65 | 31 | 52.01 | 29 | 53.76 | +2 | ||
| Lugo | 41 | 57.57 | 30 | 52.12 | 35 | 52.94 | −5 | ||
| Ceuta | 98 | 25.92 | 83 | 45.71 | 96 | 42.75 | −13 | ||
| Logroño | Group 4 | 2 | 75.51 | 8 | 55.75 | 3 | 58.72 | +5 | 28.57% (worse) 71.4% (better) |
| Toledo | 28 | 60.94 | 56 | 49.54 | 47 | 51.25 | +9 | ||
| Huesca | 31 | 59.96 | 19 | 54.18 | 17 | 55.04 | +2 | ||
| Granada | 54 | 54.30 | 54 | 49.60 | 51 | 50.31 | +3 | ||
| Roquetas de Mar | 74 | 46.92 | 90 | 44.81 | 85 | 45.12 | +5 | ||
| Torrejón de Ardoz | 84 | 40.85 | 39 | 51.33 | 55 | 49.76 | −16 | ||
| Jaén | 86 | 40.42 | 62 | 48.91 | 75 | 47.64 | −13 | ||
| Valladolid | Group 5 | 12 | 65.88 | 75 | 47.36 | 52 | 50.14 | +23 | 48.28% (worse) 51.72% (better) |
| Castellón de la Plana | 16 | 64.86 | 40 | 51.29 | 32 | 53.33 | +8 | ||
| Ciudad Real | 24 | 61.60 | 38 | 51.47 | 34 | 52.99 | +4 | ||
| León | 26 | 61.09 | 63 | 48.80 | 49 | 50.64 | +14 | ||
| Tarragona | 27 | 60.95 | 42 | 50.94 | 39 | 52.44 | +3 | ||
| Girona | 30 | 60.12 | 25 | 53.06 | 27 | 54.12 | −2 | ||
| Cuenca | 36 | 58.84 | 59 | 49.06 | 50 | 50.53 | +9 | ||
| Vigo | 37 | 58.69 | 70 | 47.76 | 59 | 49.40 | +11 | ||
| S. Baudilio de Llobregat | 39 | 58.38 | 47 | 50.47 | 45 | 51.65 | +2 | ||
| Leganés | 44 | 56.75 | 16 | 54.63 | 18 | 54.95 | −2 | ||
| Teruel | 48 | 55.84 | 98 | 42.06 | 89 | 44.13 | +9 | ||
| Pontevedra | 51 | 55.00 | 69 | 47.82 | 63 | 48.90 | +6 | ||
| Salamanca | 55 | 54.21 | 65 | 48.66 | 58 | 49.49 | +7 | ||
| Zamora | 56 | 53.39 | 82 | 46.24 | 77 | 47.31 | +5 | ||
| S. Cristóbal La Laguna | 57 | 53.25 | 37 | 51.63 | 43 | 51.87 | −6 | ||
| Alcalá de Henares | 59 | 52.94 | 18 | 54.31 | 28 | 54.10 | −10 | ||
| Cartagena | 60 | 52.25 | 77 | 47.02 | 72 | 47.80 | +5 | ||
| Palma | 62 | 51.97 | 29 | 52.48 | 41 | 52.41 | −12 | ||
| Huelva | 64 | 51.48 | 74 | 47.44 | 69 | 48.04 | +5 | ||
| Móstoles | 67 | 50.64 | 22 | 53.54 | 33 | 53.11 | −11 | ||
| Sabadell | 69 | 49.50 | 52 | 49.62 | 56 | 49.60 | −4 | ||
| Mataró | 72 | 47.56 | 76 | 47.35 | 76 | 47.38 | 0 | ||
| Lorca | 73 | 47.21 | 92 | 44.61 | 86 | 45.00 | +6 | ||
| Badalona | 77 | 45.70 | 64 | 48.69 | 67 | 48.24 | −3 | ||
| Las Palmas de G.C. | 80 | 44.61 | 51 | 49.85 | 61 | 49.06 | −10 | ||
| Baracaldo | 83 | 41.71 | 44 | 50.69 | 60 | 49.35 | −16 | ||
| Arona | 93 | 35.69 | 49 | 50.01 | 70 | 47.86 | −21 | ||
| Algeciras | 97 | 30.25 | 84 | 45.33 | 94 | 43.07 | −10 | ||
| Telde | 99 | 16.99 | 72 | 47.46 | 95 | 42.89 | −23 | ||
| Melilla | 100 | 14.97 | 85 | 45.33 | 99 | 40.77 | −14 | ||
| Segovia | Group 6 | 7 | 70.51 | 58 | 49.22 | 40 | 52.41 | +18 | 52.94% (worse) 47.06% (better) |
| Guadalajara | 9 | 69.24 | 32 | 51.93 | 24 | 54.53 | +8 | ||
| Soria | 10 | 68.83 | 9 | 55.60 | 5 | 57.58 | +4 | ||
| San Cugat del Vallés | 18 | 64.37 | 10 | 55.45 | 10 | 56.79 | 0 | ||
| Ávila | 23 | 62.36 | 17 | 54.52 | 15 | 55.70 | +2 | ||
| Alcorcón | 35 | 58.91 | 6 | 56.31 | 11 | 56.70 | −5 | ||
| Tarrasa | 40 | 58.02 | 36 | 51.73 | 36 | 52.67 | 0 | ||
| Cáceres | 42 | 57.47 | 26 | 52.92 | 30 | 53.60 | −4 | ||
| Avilés | 43 | 57.15 | 43 | 50.76 | 44 | 51.72 | −1 | ||
| Cornellá de Llobregat | 52 | 54.81 | 45 | 50.56 | 48 | 51.20 | −3 | ||
| Rivas-Vaciamadrid | 53 | 54.34 | 11 | 55.44 | 16 | 55.28 | −5 | ||
| Marbella | 61 | 52.14 | 66 | 48.16 | 64 | 48.76 | +2 | ||
| Reus | 70 | 49.24 | 71 | 47.58 | 71 | 47.83 | 0 | ||
| Coslada | 78 | 45.67 | 21 | 53.85 | 38 | 52.62 | −17 | ||
| El Puerto de Santa María | 85 | 40.68 | 80 | 46.53 | 83 | 45.65 | −3 | ||
| San Fernando | 94 | 33.86 | 79 | 46.85 | 87 | 44.90 | −8 | ||
| Parla | 95 | 32.25 | 50 | 49.95 | 78 | 47.29 | −28 | ||
| El Ejido | 96 | 30.34 | 100 | 40.95 | 100 | 39.36 | 0 | ||
| Lleida | Group 7 | 14 | 65.37 | 41 | 51.27 | 31 | 53.38 | +10 | 55.56% (worse) 44.44% (better) |
| Pozuelo de Alarcón | 17 | 64.68 | 2 | 58.69 | 2 | 59.59 | 0 | ||
| Las Rozas de Madrid | 32 | 59.83 | 3 | 57.11 | 6 | 57.51 | −3 | ||
| S. Sebastián de los Reyes | 49 | 55.53 | 15 | 54.75 | 19 | 54.87 | −4 | ||
| Orense | 65 | 51.25 | 55 | 49.55 | 54 | 49.81 | +1 | ||
| Fuenlabrada | 68 | 49.54 | 12 | 55.35 | 25 | 54.48 | −13 | ||
| Torrevieja | 87 | 40.25 | 99 | 41.85 | 98 | 41.61 | +1 | ||
| Chiclana de la Frontera | 88 | 40.24 | 86 | 45.32 | 88 | 44.55 | −2 | ||
| Dos Hermanas | 91 | 36.13 | 96 | 43.77 | 97 | 42.62 | −1 |
| SDG | Dimension | 2030 Agenda | 2018 Spanish SDG Urban Index (REDS) | 2019 US SDG Urban Index | 2019 European SDG Urban Index | ||||
|---|---|---|---|---|---|---|---|---|---|
| Nk | WD | Nk | WD | Nk | WD | Nk | WD | ||
| 1 | Social | 11 | 32.79% | 3 | 34.52% | 5 | 2 | 33.93% | |
| 2 | Social | 13 | 3 | 3 | 38.60% | 1 | |||
| 3 | Social | 27 | 12 | 7 | 6 | ||||
| 4 | Social | 11 | 5 | 4 | 7 | ||||
| 5 | Social | 14 | 6 | 3 | 3 | ||||
| 7 | Economic | 6 | 25.11% | 4 | 35.71% | 3 | 33.33% | 2 | 39.29% |
| 8 | Economic | 16 | 5 | 3 | 3 | ||||
| 9 | Economic | 12 | 5 | 3 | 6 | ||||
| 10 | Economic | 10 | 6 | 5 | 1 | ||||
| 11 | Economic | 14 | 10 | 5 | 10 | ||||
| 6 | Environment | 11 | 22.67% | 3 | 20.24% | 3 | 21.05% | 1 | 17.86% |
| 12 | Environment | 12 | 4 | 3 | 4 | ||||
| 13 | Environment | 6 | 3 | 3 | 1 | ||||
| 14 | Environment | 10 | 4 | 0 | 0 | ||||
| 15 | Environment | 12 | 3 | 3 | 4 | ||||
| 16 | Governance | 22 | 19.43% | 5 | 9.53% | 4 | 7.02% | 5 | 8.92% |
| 17 | Governance | 25 | 3 | 0 | 0 | ||||
| Total | 5 | 232 | 100% | 84 | 100% | 61 | 100% | 56 | 100% |
References
- Jordan, A. The Governance of Sustainable Development: Taking Stock and Looking Forwards. Environ. Plan. C Gov. Policy 2008, 26, 17–33. [Google Scholar] [CrossRef] [Green Version]
- Singh, R.K.; Murty, H.; Gupta, S.; Dikshit, A. An overview of sustainability assessment methodologies. Ecol. Indic. 2012, 15, 281–299. [Google Scholar] [CrossRef]
- Glass, L.-M.; Newig, J. Governance for achieving the Sustainable Development Goals: How important are participation, policy coherence, reflexivity, adaptation, and democratic institutions? Earth Syst. Gov. 2019, 2, 100031. [Google Scholar] [CrossRef]
- WCED. World Commission on Environment and Development. Our Common Future; Oxford University Press: Oxford, UK, 1987; pp. 1–383. [Google Scholar]
- Treib, O.; Bähr, H.; Falkner, G. Modes of governance: Towards a conceptual clarification. J. Eur. Public Policy 2007, 14, 1–20. [Google Scholar] [CrossRef]
- Elkington, J.; Henriques, A.; Richardson, J. The Triple Bottom Line, Does It all Add up? In Assessing the Sustainability of Business and CSR, 1st ed.; Henriques, A., Richardson, J., Eds.; Earthscan Publications: London, UK, 2004; pp. 1–16. [Google Scholar]
- Lemos, M.C.; Agrawal, A. Environmental Governance. Annu. Rev. Environ. Resour. 2006, 31, 297–325. [Google Scholar] [CrossRef]
- Kanie, N.; Zondervan, R.; Stevens, C. Ideas on Governance ‘of’ and ‘for’ Sustainable Development Goals: UNU-IAS/POST2015 Conference Report; United Nations University Institute for the Advanced Study of Sustainability: Tokyo, Japan, 2014. [Google Scholar]
- UNDP. United Nations Development Programme. Governance for Sustainable Development Integrating Governance in the Post—2015 Development Framework; United Nations: New York, NY, USA, 2014; Available online: https://www.undp.org/content/dam/undp/library/Democratic%20Governance/Di—ussion-Paper—Governance-for-Sustainable-Development.pdf (accessed on 9 May 2020).
- Kroll, C. Sustainable Development Goals: Are the Rich Countries Ready? Bertelsmann Stiftung; Sustainable Development Indicators and Sustainable Development Solutions Network: New York, NY, USA, 2015. [Google Scholar]
- Sachs, J.; Schmidt-Traub, G.; Kroll, C.; Durand-Delacre, D.; Teksoz, K. SDG. Index and Dashboards Report 2017; Bertelsmann Stiftung and Sustainable Development Solutions Network: New York, NY, USA, 2017. [Google Scholar]
- Sachs, J.D.; Schmidt-Traub, G.; Kroll, C.; Lafortune, G.; Fuller, G. SDG Index and Dashboards Report 2018; Bertelsmann Stiftung and Sustainable Development Solutions Network: New York, NY, USA, 2018. [Google Scholar]
- Sachs, J.; Schmidt-Traub, G.; Kroll, C.; Lafortune, G.; Fuller, G. Sustainable Development Report 2020. In Sustainable Development Report 2020; Cambridge University Press (CUP): Cambridge, UK, 2021. [Google Scholar]
- Sánchez de Madariaga, I.; García López, J.; Sisto, R. Los Objetivos de Desarrollo Sostenible en 100 Ciudades Españolas. Informe; Red Española para el Desarrollo Sostenible: Madrid, Spain, 2018. [Google Scholar]
- Termeer, C.J.; Dewulf, A.; Biesbroek, R. A critical assessment of the wicked problem concept: Relevance and usefulness for policy science and practice. Policy Soc. 2019, 38, 167–179. [Google Scholar] [CrossRef] [Green Version]
- Meuleman, L.; Niestroy, I. Common but Differentiated Governance: A Metagovernance Approach to Make the SDGs Work. Sustainability 2015, 7, 12295–12321. [Google Scholar] [CrossRef] [Green Version]
- Tosun, J.; Lang, A. Policy integration: Mapping the different concepts. Policy Stud. 2017, 38, 553–570. [Google Scholar] [CrossRef]
- Teplanský, M. Cohesion Policy 2021–2027: Sustainable Urban Development-European Urban Initiative. In Proceedings of the UNICA Seminar on Research Policies & Urban Challenge, Brussels, Belgium, 7 February 2019. [Google Scholar]
- Carpenter, J.; González-Medina, M.; Huete García, M.A.; De Gregorio Hurtado, S. Variegated Europeanization and urban policy: Dynamics of policy transfer in France, Italy, Spain, and the UK. Eur. Urban Reg. Stud. 2020, 27, 227–245. [Google Scholar] [CrossRef]
- Informal Meeting of Ministers Responsible for Urban Development in the Member States of the EU. Leipzig Charter on Sustainable European Cities. 2007. Available online: http://www.esponontheroad.eu/library,leipzig-charter-on-sustainable-european-cities (accessed on 2 May 2020).
- Del Castillo, J.; Haarich, S. Desarrollo Urbano Sostenible Cofinanciado Por el FEDER en España 2014–2020: Directrices Estratégicas y Prioridades de Inversión; Final Report for DG Regio; European Commission: Brussels, Belgium, 2013. [Google Scholar]
- Carter, N. The Politics of the Environment, 2nd ed.; Cambridge University Press: Cambridge, UK, 2007. [Google Scholar]
- UCLG. United Cities and Local Governments. Towards the localization of the SDGs. Local and Regional Governments’ Report to the 2019 HLPF, 3rd ed.; United Cities and Local Governments: Barcelona, Spain, 2019. [Google Scholar]
- Albrechts, L. Strategic Spatial Planning Revisited Experiences from Europe. In Proceedings of the 3rd Regional Development and Governance Symposium, Mersin, Turkey, 27–28 October 2008. [Google Scholar]
- González-Medina, M. La planificación estratégica de “nueva generación”: Cómo evaluar su impacto como instrumento de gobernanza territorial? Geopolítica(s). Rev. Estud. Sobre Espac. Poder 2013, 3, 271–291. [Google Scholar] [CrossRef] [Green Version]
- Ioppolo, G.; Cucurachi, S.; Salomone, R.; Saija, G.; Shi, L. Sustainable Local Development and Environmental Governance: A Strategic Planning Experience. Sustainability 2016, 8, 180. [Google Scholar] [CrossRef] [Green Version]
- Van den Berg, L.; Van der Meer, J.; Meer, P.; Pol, J. Organizing Capacity and Social Policies in European Cities. Urban Stud. 2003, 40, 1959–1978. [Google Scholar] [CrossRef]
- Healey, P. Relational complexity, and the imaginative power of strategic spatial planning. Eur. Plan. Stud. 2006, 14, 525–546. [Google Scholar] [CrossRef]
- Albrechts, L. Strategic (Spatial) Planning Re-examined. Environ. Plan. B Plan. Des. 2004, 31, 743–758. [Google Scholar] [CrossRef] [Green Version]
- González-Medina, M. Procesos metropolitanos y planificación estratégica en el sur de Europa: Un enfoque de gobernanza territorial. Ciudad. Territ. 2013, 178, 487–499. [Google Scholar]
- Albrechts, L.; Balducci, A.; Hillier, J. (Eds.) Situated Practices of Strategic Planning. An International Perspective; Routledge: London, UK, 2016. [Google Scholar]
- Muminović, E.; Radosavljević, U.; Beganović, D. Strategic Planning and Management Model for the Regeneration of Historic Urban Landscapes: The Case of Historic Center of Novi Pazar in Serbia. Sustainability 2020, 12, 1323. [Google Scholar] [CrossRef] [Green Version]
- Pascual i Esteve, J. La Estrategia de las Ciudades. Planes Estratégicos Como Instrumento: Métodos, Técnicas y Buenas Prácticas; Diputación de Barcelona: Barcelona, Spain, 1997. [Google Scholar]
- Fernández Güell, J. Planificación Estratégica de Ciudades (Proyecto & Gestión); Gustavo Gili: Barcelona, Spain, 1997. [Google Scholar]
- Martinelli, F. La Pianificazione Strategica in Talia e in Europa. Metodologie ed Esiti a Confronto; Francoangeli: Milano, Italy, 2005. [Google Scholar]
- OECD. Centre for Entrepreneurship, SMEs, Regions and Cities, OECD Principles on Urban Policy. 2019. Available online: https://www.oecd.org/cfe/Brochure-OECD-Principles-Urban-Policy.pdf (accessed on 29 March 2021).
- Fioretti, C.; Pertoldi, M.; Busti, M.; Van Heerden, S. (Eds.) Handbook of Sustainable Urban Development Strategies; EUR 29990 EN; Publications Office of the European Union: Luxembourg, 2020.
- UCLG, United Cities and Local Governments. Policy Paper on Urban Strategic Planning: Local Leaders Preparing for the Future of Our Cities. 2010. Felicity Carus, Journalist, London. Available online: https://www.citiesalliance.org/sites/default/files/9636672792_%28EN%29_uclg_policy_paper_%28eng%29_web.pdf (accessed on 19 May 2021).
- Boulanger, P.-M. Sustainable development indicators: A scientific challenge, a democratic issue. Surv. Perspect. Integr. Environ. Soc. 2008, 1, 59–73. [Google Scholar] [CrossRef]
- Neuman, M.; Churchill, S.W. Measuring sustainability. Town Plan. Rev. 2015, 86, 457–482. [Google Scholar] [CrossRef] [Green Version]
- Böhringer, C.; Löschel, A. Computable general equilibrium models for sustainability impact assessment: Status quo and prospects. Ecol. Econ. 2006, 60, 49–64. [Google Scholar] [CrossRef]
- El Gibari, S.; Gómez, T.; Ruiz, F. Building composite indicators using multicriteria methods: A review. J. Bus. Econ. 2018, 89, 1–24. [Google Scholar] [CrossRef]
- Saltelli, A. Composite Indicators between Analysis and Advocacy. Soc. Indic. Res. 2007, 81, 65–77. [Google Scholar] [CrossRef]
- Greco, S.; Ishizaka, A.; Tasiou, M.; Torrisi, G. On the Methodological Framework of Composite Indices: A Review of the Issues of Weighting, Aggregation, and Robustness. Soc. Indic. Res. 2019, 141, 61–94. [Google Scholar] [CrossRef] [Green Version]
- Munda, G.; Nardo, M.; Saisana, M.; Srebotnjak, T. Measuring uncertainties in composite indicators of sustainability. Int. J. Environ. Technol. Manag. 2009, 11, 7–26. [Google Scholar] [CrossRef] [Green Version]
- Saisana, M.; Saltelli, A.; Tarantola, S. Uncertainty and sensitivity analysis techniques as tools for the quality assessment of composite indicators. J. R. Stat. Soc. Ser. A (Stat. Soc.) 2005, 168, 307–323. [Google Scholar] [CrossRef]
- Munda, G.; Saisana, M. Methodological Considerations on Regional Sustainability Assessment Based on Multicriteria and Sensitivity Analysis. Reg. Stud. 2011, 45, 261–276. [Google Scholar] [CrossRef]
- Lafortune, G.; Fuller, G.; Schmidt-Traub, G.; Kroll, C. How Is Progress towards the Sustainable Development Goals Measured? Comparing Four Approaches for the EU. Sustainability 2020, 12, 7675. [Google Scholar] [CrossRef]
- Costanza, R.; Daly, L.; Fioramonti, L.; Giovannini, E.; Kubiszewski, I.; Mortensen, L.F.; Pickett, K.E.; Ragnarsdottir, K.V.; De Vogli, R.; Wilkinson, R. Modelling and measuring sustainable wellbeing in connection with the UN Sustainable Development Goals. Ecol. Econ. 2016, 130, 350–355. [Google Scholar] [CrossRef]
- Miola, A.; Schiltz, F. Measuring sustainable development goals performance: How to monitor policy action in the 2030 Agenda implementation? Ecol. Econ. 2019, 164, 106373. [Google Scholar] [CrossRef] [PubMed]
- Devuyst, D. Linking impact assessment and sustainable development at the local level: The introduction of sustainability assessment systems. Sustain. Dev. 2000, 8, 67–78. [Google Scholar] [CrossRef]
- OECD. Measuring Distance to the SDG Targets 2019: An Assessment of Where OECD Countries Stand. 2019. Available online: https://www.oecd.org/sdd/measuring-distance-to-the-sdg-targets-2019-a8caf3fa-en.htm (accessed on 29 April 2021).
- Eurostat. Sustainable Development in the European Union: Monitoring Report on Progress Towards the SDGs in An EU Context (2019 Edition). 2019. Available online: https://ec.europa.eu/eurostat/web/products-statisticalbooks/-/KS-02-19-165 (accessed on 29 April 2021).
- ASviS. The European Union and the Sustainable Development Goals. 2020. Available online: https://asvis.it/public/asvis2/files/Pubblicazioni/Compositi_Europei_ENG_HR.pdf (accessed on 29 April 2021).
- Gan, X.; Fernandez, I.C.; Guo, J.; Wilson, M.; Zhao, Y.; Zhou, B.; Wu, J. When to use what: Methods for weighting and aggregating sustainability indicators. Ecol. Indic. 2017, 81, 491–502. [Google Scholar] [CrossRef]
- Valentin, A.; Spangenberg, J.H. A guide to community sustainability indicators. Environ. Impact. Assess. Rev. 2000, 20, 381–392. [Google Scholar] [CrossRef]
- CERM. Council of European Municipalities and Regions’ and Centre’d’études et D’expertise sur ’es Risques, L’environnement, La’mobilité et L’aménagement. The Reference Framework for Sustainable Cities (RFSC). Available online: http://rfsc.eu/ (accessed on 29 March 2021).
- UN United Nations. E-Handbook on Sustainable Development Goals Indicators. 2018. Available online: https://www.un.org/development/desa/capacity-development/tools/tool/e-handbook-on-sustainable-development-goals-indicators/ (accessed on 9 May 2020).
- Lafortune, G.; Zoeteman, K.; Fuller, G.; Mulder, R.; Dagevos, J.; Schmidt-Traub, G. The 2019 SDG Index and Dashboards Report for European Cities (Prototype Version). 2019. Sustainable Development Solutions Network (SDSN) and the Bra-bant Center for Sustainable Development (Telos). Available online: https://www.sdgindex.org/reports/sdg-index-and-dashboards-report-for-european-cities/ (accessed on 29 March 2021).
- Ebrópolis. Inventario de Planes Estratégicos Urbanos. Database. 2016. Available online: http://www.ebropolis.es/web/arbol/interior.asp?idArbol=239&idNodo=240 (accessed on 9 May 2020).
- Llamas, R.; García, V.J.; López, F.J. Un análisis institucional de la implantación de la Agenda Local 21 por los ayuntamientos españoles. Rev. Eur. Dir. Econ. Empresa 2005, 14, 9–40. [Google Scholar]
- Localizador de Actuaciones Urbanas. Red de Iniciativas Urbanas. Available online: http://apps.fomento.gob.es/riu (accessed on 9 May 2020).
- Lafortune, G.; Fuller, G.; Moreno, J.; Schmidt-Traub, G.; Kroll, V. SDG Index and Dashboards. Detailed Methodological Paper. Bertelsmann Stiftung and Sustainable Development Solutions Network; Sustainable Development Solutions Network: New York, NY, USA, 2018. [Google Scholar]
- Lynch, A.; LoPresti, A.; Fox, C. The 2019 US Cities Sustainable Development Report; Sustainable Development Solutions Network: New York, NY, USA, 2019. [Google Scholar]
- Prakash, M.; Teksoz, K.; Espey, J.; Sachs, J.; Shank, M.; Schmidt-Traub, G.U.S. Cities SDG Index Achieving a Sustainable Urban America; Sustainable Development Solutions Network: New York, NY, USA, 2017. [Google Scholar]
- Espey, J.; Dahmm, H.; Manderino, L. Leaving No U.S. City Behind: The U.S. Cities Sustainable Development Goals Index. US Cities Index Report; Sustainable Development Solutions Network: New York, NY, USA, 2018. [Google Scholar]
- Zoeteman, K.; Slabbekoorn, J.; Mommaas, H.; Dagevos, J.; Smeets, R. Sustainability Monitoring of European Cities: A Scoping Study Prepared in Collaboration with DG Environment for European Green Capital Award Applicants; TELOS: Tilburg, The Netherlands, 2014. [Google Scholar]
- Cavalli, L.; Farnia, L.; Lizzi, G.; Romani, I.; Alibegovic, M.; Vergalli, S. The SDSN Italia SDGs City Index Two Years Later: Update Report (July 27, 2020). FEEM Report No. 08-2020. Available online: https://ssrn.com/abstract=3733706 or http://0-dx-doi-org.brum.beds.ac.uk/10.2139/ssrn.3733706 (accessed on 9 May 2020).
- UN System Staff College. Understanding the Dimensions of Sustainable Development. 2017. Available online: https://www.unssc.org/news-and-insights/news/understanding-dimensions-sustainable-development-now-available-8-languages/ (accessed on 9 May 2020).
- Böhringer, C.; Jochem, P.E. Measuring the immeasurable—A survey of sustainability indices. Ecol. Econ. 2007, 63, 1–8. [Google Scholar] [CrossRef] [Green Version]
- Paruolo, P.; Saisana, M.; Saltelli, A. Ratings and rankings: Voodoo or science? J. R. Stat. Soc. Ser. A (Stat. Soc.) 2012, 176, 609–634. [Google Scholar] [CrossRef] [Green Version]
- Singh, R.K.; Murty, H.; Gupta, S.; Dikshit, A. An overview of sustainability assessment methodologies. Ecol. Indic. 2009, 9, 189–212. [Google Scholar] [CrossRef]
- Cabello, J.; Navarro, E.; Prieto, F.; Rodríguez, B.; Ruiz, F.L. Multicriteria development of synthetic indicators of the environmental profile of the Spanish regions. Ecol. Indic. 2014, 39, 10–23. [Google Scholar] [CrossRef]
- Boggia, A.; Massei, G.; Pace, E.; Rocchi, L.; Paolotti, L.; Attard, M. Spatial multicriteria analysis for sustainability assessment: A new model for decision making. Land Use Policy 2018, 71, 281–292. [Google Scholar] [CrossRef] [Green Version]
- Belton, V.; Stewart, T. Multiple Criteria Decision Analysis: An Integrated Approach; Springer Science & Business Media: Berlin, Germany, 2002. [Google Scholar]
- Diaz-Sarachaga, J.M.; Jato-Espino, D.; Castro-Fresno, D. Is the Sustainable Development Goals (SDG) index an adequate framework to measure the progress of the 2030 Agenda? Sustain. Dev. 2018, 26, 663–671. [Google Scholar] [CrossRef]
- De Gregorio Hurtado, S.; González-Medina, M. Understanding the Emergence of the Spanish Urban Agenda: Moving Towards a New Multi-level Urban Policy Scenario? In The Life and Afterlife of Gay Neighborhoods; Springer Science and Business Media LLC: Berlin, Germany, 2019; pp. 21–48. [Google Scholar]
- Navarro-Yáñez, C.J.; Rodríguez-García, M.J. Urban policies as multi-level policy mixes. The comparative urban portfolio analysis to study the strategies of integral urban development initiatives. Cities 2020, 102, 102716. [Google Scholar] [CrossRef]
- Navarro-Yáñez, C.J.; Rodríguez-García, M.-J.; Guerrero-Mayo, M.J. Evaluating the Quality of Urban Development Plans Promoted by the European Union: The URBAN and URBANA Initiatives in Spain (1994–2013). Soc. Indic. Res. 2019, 149, 215–237. [Google Scholar] [CrossRef]
- CEMR. Reference Framework for Sustainable Cities (RFSC). 2017. Available online: https://www.ccre.org/activites/view/25 (accessed on 9 May 2020).
- Schoon, M.; Cox, M. Collaboration, Adaptation, and Scaling: Perspectives on Environmental Governance for Sustainability. Sustainability 2018, 10, 679. [Google Scholar] [CrossRef] [Green Version]


| SD Dimension | Social | Economic | Environmental | Governance |
|---|---|---|---|---|
| 2030 Agenda pillar | People | Prosperity | Planet | Peace & Partnership |
| Distribution of the SDG | 1–5 | 7–11 | 6,12–15 | 16,17 |
| Dimensional SDG Index (ID) Sub-indices | Ipe | Ipo | Ipa | Igo |
| Variable | Description | Indicators |
|---|---|---|
| 1. Participation | The capability of economic and non-economic interest groups to propose and assess relevant policy measures and their implementation. | 1.1. Association competence (business) 1.2. Association competence (others) |
| 2. Policy coherence | The extent to which the institutional structure fosters coherent and coordinated policy making and implementation | 2.1 Inter-ministerial coordination 2.2. Coherent communication 2.3 Institutional coherence for implementation |
| 3. Reflexivity and adaptation | The degree of reflexivity and adaptation of institutional arrangements including self-monitoring, capacity for reform, the influence of strategic planning units, and regulatory impact assessments. | 3.1. Organizational reform 3.2. Adaptability 3.3. Strategic Planning 3.4. Evidence-based instruments |
| 4. Democratic institutions | The quality of democratic institutions including electoral process, media freedom and access to information, civil rights, and political liberties, as well as rule of law. | 4.1. Electoral process 4.2 Access to information 4.3. Civil rights and political liberties 4.4. Rule of law |
| Icu | |||
|---|---|---|---|
| Group | Value | Duration (years) | Instruments (n) |
| 1 | 7 | >13 | 4 |
| 2 | 6 | >13 | 3 |
| 3 | 5 | >13 | 2 |
| 4 | 4 | <13 | 3 |
| 5 | 3 | <13 | 2 |
| 6 | 2 | <13 | 1 |
| 7 | 1 | <13 | 0 |
| Position IR | City | IR ≥ 50 | Position IR | City | IR < 50 |
|---|---|---|---|---|---|
| 1 | Vitoria-Gasteiz | 60.54 | 50 | Parla | 49.95 |
| 2 | Pozuelo de Alarcón | 58.69 | 51 | Las Palmas de Gran Canaria | 49.85 |
| 3 | Las Rozas de Madrid | 57.11 | 52 | Sabadell | 49.62 |
| 4 | Alcobendas | 56.74 | 53 | Córdoba | 49.60 |
| 5 | Madrid | 56.66 | 54 | Granada | 49.60 |
| 6 | Alcorcón | 56.31 | 55 | Orense | 49.55 |
| 7 | Getafe | 55.76 | 56 | Toledo | 49.54 |
| 8 | Logroño | 55.75 | 57 | Badajoz | 49.27 |
| 9 | Soria | 55.60 | 58 | Segovia | 49.22 |
| 10 | San Cugat del Vallés | 55.45 | 59 | Cuenca | 49.06 |
| 11 | Rivas-Vaciamadrid | 55.44 | 60 | Hospitalet de Llobregat | 49.04 |
| 12 | Fuenlabrada | 55.35 | 61 | Cádiz | 49.00 |
| 13 | Donostia/San Sebastián | 55.23 | 62 | Jaén | 48.91 |
| 14 | Burgos | 54.80 | 63 | León | 48.80 |
| 15 | San Sebastián de los Reyes | 54.75 | 64 | Badalona | 48.69 |
| 16 | Leganés | 54.63 | 65 | Salamanca | 48.66 |
| 17 | Ávila | 54.52 | 66 | Marbella | 48.16 |
| 18 | Alcalá de Henares | 54.31 | 67 | Valencia | 48.07 |
| 19 | Huesca | 54.18 | 68 | Alicante | 47.97 |
| 20 | Santander | 53.94 | 69 | Pontevedra | 47.82 |
| 21 | Coslada | 53.85 | 70 | Vigo | 47.76 |
| 22 | Móstoles | 53.54 | 71 | Reus | 47.58 |
| 23 | Zaragoza | 53.34 | 72 | Telde | 47.46 |
| 24 | Pamplona/Iruña | 53.28 | 73 | Santa Coloma de Gramanet | 47.45 |
| 25 | Girona | 53.06 | 74 | Huelva | 47.44 |
| 26 | Cáceres | 52.92 | 75 | Valladolid | 47.36 |
| 27 | Albacete | 52.83 | 76 | Mataró | 47.35 |
| 28 | Bilbao | 52.63 | 77 | Cartagena | 47.02 |
| 29 | Palma | 52.48 | 78 | La Coruña | 46.89 |
| 30 | Lugo | 52.12 | 79 | San Fernando | 46.85 |
| 31 | Gijón | 52.01 | 80 | El Puerto de Santa María | 46.53 |
| 32 | Guadalajara | 51.93 | 81 | Málaga | 46.44 |
| 33 | Santiago de Compostela | 51.93 | 82 | Zamora | 46.24 |
| 34 | Oviedo | 51.73 | 83 | Ceuta | 45.71 |
| 35 | Palencia | 51.73 | 84 | Algeciras | 45.33 |
| 36 | Tarrasa | 51.73 | 85 | Melilla | 45.33 |
| 37 | San Cristóbal de La Laguna | 51.63 | 86 | Chiclana de la Frontera | 45.32 |
| 38 | Ciudad Real | 51.47 | 87 | Murcia | 45.31 |
| 39 | Torrejón de Ardoz | 51.33 | 88 | Sevilla | 45.30 |
| 40 | Castellón de la Plana | 51.29 | 89 | Jerez de la Frontera | 45.07 |
| 41 | Lleida | 51.27 | 90 | Roquetas de Mar | 44.81 |
| 42 | Tarragona | 50.94 | 91 | Almería | 44.62 |
| 43 | Avilés | 50.76 | 92 | Lorca | 44.61 |
| 44 | Baracaldo | 50.69 | 93 | Vélez-Málaga | 44.44 |
| 45 | Cornellá de Llobregat | 50.56 | 94 | Torrent | 44.20 |
| 46 | Barcelona | 50.49 | 95 | Elche | 43.96 |
| 47 | San Baudilio de Llobregat | 50.47 | 96 | Dos Hermanas | 43.77 |
| 48 | Santa Cruz de Tenerife | 50.15 | 97 | Talavera de la Reina | 43.47 |
| 49 | Arona | 50.01 | 98 | Teruel | 42.06 |
| 99 | Torrevieja | 41.85 | |||
| 100 | El Ejido | 40.95 |
| P IR | City | Value ID | P ID | Variation P IR-P ID | P R | City | Value ID | P ID | Variation P IR-P ID |
|---|---|---|---|---|---|---|---|---|---|
| 1 | Vitoria-Gasteiz | 63.09 | 1 | 0 | 50 | Parla | 47.29 | 78 | −28 |
| 2 | Pozuelo de Alarcón | 59.59 | 2 | 0 | 51 | Las Palmas de G.C | 49.06 | 61 | −10 |
| 3 | Las Rozas de Madrid | 57.51 | 6 | −3 | 52 | Sabadell | 49.60 | 56 | −4 |
| 4 | Alcobendas | 57.18 | 9 | −5 | 53 | Córdoba | 51.90 | 42 | 11 |
| 5 | Madrid | 57.77 | 4 | 1 | 54 | Granada | 50.31 | 51 | 3 |
| 6 | Alcorcón | 56.70 | 11 | −5 | 55 | Orense | 49.81 | 54 | 1 |
| 7 | Getafe | 56.58 | 2 | −5 | 56 | Toledo | 51.25 | 47 | 9 |
| 8 | Logroño | 58.72 | 3 | 5 | 57 | Badajoz | 48.58 | 65 | −8 |
| 9 | Soria | 57.58 | 5 | 4 | 58 | Segovia | 52.41 | 40 | 18 |
| 10 | San Cugat del Vallés | 56.79 | 10 | 0 | 59 | Cuenca | 50.53 | 50 | 9 |
| 11 | Rivas-Vaciamadrid | 55.28 | 16 | −5 | 60 | Hospitalet de Llobregat | 49.97 | 53 | 7 |
| 12 | Fuenlabrada | 54.48 | 25 | −13 | 61 | Cádiz | 48.58 | 66 | −5 |
| 13 | Donostia/San Sebastián | 57.44 | 7 | 6 | 62 | Jaén | 47.64 | 75 | −13 |
| 14 | Burgos | 57.25 | 8 | 6 | 63 | León | 50.64 | 49 | 14 |
| 15 | S.S. de los Reyes | 54.87 | 19 | −4 | 64 | Badalona | 48.24 | 67 | −3 |
| 16 | Leganés | 54.95 | 18 | −2 | 65 | Salamanca | 49.49 | 58 | 7 |
| 17 | Ávila | 55.70 | 15 | 2 | 66 | Marbella | 48.76 | 64 | 2 |
| 18 | Alcalá de Henares | 54.10 | 28 | −10 | 67 | Valencia | 47.80 | 74 | −7 |
| 19 | Huesca | 55.04 | 17 | 2 | 68 | Alicante | 49.56 | 57 | 11 |
| 20 | Santander | 56.15 | 13 | 7 | 69 | Pontevedra | 48.90 | 63 | 6 |
| 21 | Coslada | 52.62 | 38 | −17 | 70 | Vigo | 49.40 | 59 | 11 |
| 22 | Móstoles | 53.11 | 33 | −11 | 71 | Reus | 47.83 | 71 | 0 |
| 23 | Zaragoza | 56.03 | 14 | 9 | 72 | Telde | 42.89 | 95 | −23 |
| 24 | Pamplona/Iruña | 54.43 | 26 | −2 | 73 | Santa Coloma de Gramanet | 46.98 | 80 | −7 |
| 25 | Girona | 54.12 | 27 | −2 | 74 | Huelva | 48.04 | 69 | 5 |
| 26 | Cáceres | 53.60 | 30 | −4 | 75 | Valladolid | 50.14 | 52 | 23 |
| 27 | Albacete | 54.56 | 22 | 5 | 76 | Mataró | 47.38 | 76 | 0 |
| 28 | Bilbao | 54.54 | 23 | 5 | 77 | Cartagena | 47.80 | 77 | 5 |
| 29 | Palma | 52.41 | 41 | −12 | 78 | La Coruña | 47.80 | 73 | 5 |
| 30 | Lugo | 52.94 | 35 | −5 | 79 | San Fernando | 44.90 | 87 | −8 |
| 31 | Gijón | 53.76 | 29 | 2 | 80 | El Puerto de Santa María | 45.65 | 83 | −3 |
| 32 | Guadalajara | 54.53 | 24 | 8 | 81 | Málaga | 47.11 | 79 | 2 |
| 33 | Santiago de Compostela | 52.63 | 37 | −4 | 82 | Zamora | 47.31 | 77 | 5 |
| 34 | Oviedo | 54.78 | 20 | 14 | 83 | Ceuta | 42.75 | 96 | −13 |
| 35 | Palencia | 54.65 | 21 | 14 | 84 | Algeciras | 43.07 | 94 | −10 |
| 36 | Tarrasa | 52.67 | 36 | 0 | 85 | Melilla | 40.77 | 99 | −14 |
| 37 | S. Cristóbal de La Laguna | 51.87 | 43 | −6 | 86 | Chiclana de la Frontera | 44.55 | 88 | −2 |
| 38 | Ciudad Real | 52.99 | 34 | 4 | 87 | Murcia | 48.07 | 68 | 19 |
| 39 | Torrejón de Ardoz | 49.76 | 55 | −16 | 88 | Sevilla | 46.93 | 81 | 7 |
| 40 | Castellón de la Plana | 53.33 | 32 | 8 | 89 | Jerez de la Frontera | 43.71 | 91 | −2 |
| 41 | Lleida | 53.38 | 31 | 10 | 90 | Roquetas de Mar | 45.12 | 85 | 5 |
| 42 | Tarragona | 52.44 | 39 | 3 | 91 | Almería | 43.67 | 92 | −1 |
| 43 | Avilés | 51.72 | 44 | −1 | 92 | Lorca | 45.00 | 86 | 6 |
| 44 | Baracaldo | 49.35 | 60 | −16 | 93 | Vélez-Málaga | 43.53 | 93 | 0 |
| 45 | Cornellá de Llobregat | 51.20 | 48 | −3 | 94 | Torrent | 45.35 | 84 | 10 |
| 46 | Barcelona | 51.40 | 46 | 0 | 95 | Elche | 46.32 | 82 | 13 |
| 47 | San Baudilio de Llobregat | 51.65 | 45 | 2 | 96 | Dos Hermanas | 42.62 | 97 | −1 |
| 48 | Santa Cruz de Tenerife | 49.01 | 62 | −14 | 97 | Talavera de la Reina | 44.10 | 90 | 7 |
| 49 | Arona | 47.86 | 70 | −21 | 98 | Teruel | 44.13 | 89 | 9 |
| 99 | Torrevieja | 41.61 | 98 | 1 | |||||
| 100 | El Ejido | 39.36 | 100 | 0 |
| Variable | Description | Glass and Newig Indicators | REDS Indicators |
|---|---|---|---|
| 1. Participation | The capability of economic and non-economic interest groups to propose and assess relevant policy measures and their implementation. | 1.1. Association competence (business) 1.2. Association competence (others) | 1.2.1. National networks 1.2.2. Cooperation and development projects |
| 2. Policy coherence | The extent to which the institutional structure fosters coherent and coordinated policy making and implementation | 2.1 Inter-ministerial coordination 2.2. Coherent communication 2.3 Institutional coherence for implementation | None |
| 3. Reflexivity and adaptation | The degree of reflexivity and adaptation of institutional arrangements including self-monitoring, capacity for reform, the influence of strategic planning units, and regulatory impact assessments. | 3.1. Organizational reform 3.2. Adaptability 3.3. Strategic Planning 3.4 Evidence-based instruments | None |
| 4. Democratic institutions | The quality of democratic institutions including electoral process, media freedom and access to information, civil rights, and political liberties, as well as rule of law. | 4.1. Electoral process 4.2 Access to information 4.3. Civil Rights and Political Liberties 4.4. Rule of Law | 4.1.1. Electoral participation 4.2.1. Municipal transparency index 4.3.1. Solidity and autonomy of the municipal institution 4.4.1. Violence against minors 4.4.2. Money laundering and drug trafficking 4.4.3. Homicides and murders |
| Icu | Cities | Worse | Better |
|---|---|---|---|
| Group 1 | Alcobendas; Alicante; Almería; Barcelona; Málaga; Palencia; Sevilla | 28.57% | 71.43% |
| Group 2 | Albacete; Badajoz; Bilbao; Burgos; Cádiz; Córdoba; Elche; Getafe; Hospitalet de Llobregat; Jerez de la Frontera; La Coruña; Madrid; Murcia; Oviedo; Pamplona/Iruña; Santa Coloma de Gramanet; Santa Cruz de Tenerife; Santander; Santiago de Compostela; Talavera de la Reina; Torrent; Valencia; Vélez-Málaga; Vitoria-Gasteiz | 37.50% | 62.50% |
| Group 3 | Ceuta; Donostia/San Sebastián; Gijón; Lugo; Zaragoza | 40.00% | 60.00% |
| Group 4 | Granada; Huesca; Jaén; Logroño; Roquetas de Mar; Toledo; Torrejón de Ardoz | 28.57% | 71.43% |
| Group 5 | Alcalá de Henares; Algeciras; Arona; Badalona; Baracaldo; Cartagena; Castellón de la Plana/Castelló de la Plana; Ciudad Real; Cuenca; Girona; Huelva; Las Palmas de Gran Canaria; Leganés; León; Lorca; Mataró; Melilla; Móstoles; Palma; Pontevedra; Sabadell; Salamanca; San Baudilio de Llobregat; San Cristóbal de La Laguna; Tarragona; Telde; Teruel; Valladolid; Zamora | 48.28% | 51.72% |
| Group 6 | Alcorcón; Ávila; Avilés; Cáceres; Cornellá de Llobregat; Coslada; El Ejido; El Puerto de Santa María; Guadalajara; Marbella; Parla; Reus; Rivas-Vaciamadrid; San Cugat del Vallés; San Fernando; Segovia; Soria; Tarrasa; Vigo | 52.94% | 47.06% |
| Group 7 | Chiclana de la Frontera; Dos Hermanas; Fuenlabrada; Las Rozas de Madrid; Lleida; Orense; Pozuelo de Alarcón; San Sebastián de los Reyes; Torrevieja | 55.56% | 44.44% |
Publisher’s Note: MDPI stays neutral with regard to jurisdictional claims in published maps and institutional affiliations. |
© 2021 by the authors. Licensee MDPI, Basel, Switzerland. This article is an open access article distributed under the terms and conditions of the Creative Commons Attribution (CC BY) license (https://creativecommons.org/licenses/by/4.0/).
Share and Cite
García-Peña, C.; González-Medina, M.; Diaz-Sarachaga, J.M. Assessment of the Governance Dimension in the Frame of the 2030 Agenda: Evidence from 100 Spanish Cities. Sustainability 2021, 13, 5519. https://0-doi-org.brum.beds.ac.uk/10.3390/su13105519
García-Peña C, González-Medina M, Diaz-Sarachaga JM. Assessment of the Governance Dimension in the Frame of the 2030 Agenda: Evidence from 100 Spanish Cities. Sustainability. 2021; 13(10):5519. https://0-doi-org.brum.beds.ac.uk/10.3390/su13105519
Chicago/Turabian StyleGarcía-Peña, Carmen, Moneyba González-Medina, and Jose Manuel Diaz-Sarachaga. 2021. "Assessment of the Governance Dimension in the Frame of the 2030 Agenda: Evidence from 100 Spanish Cities" Sustainability 13, no. 10: 5519. https://0-doi-org.brum.beds.ac.uk/10.3390/su13105519