
A Conceptual Framework for Large-Scale Event Perception Evaluation with Spatial-Temporal Scales in Sustainable Smart Cities


Institute of Management, University of Szczecin, 71-004 Szczecin, Poland
Sustainability 2021, 13(10), 5658; https://0-doi-org.brum.beds.ac.uk/10.3390/su13105658
Submission received: 16 March 2021
/
Revised: 10 May 2021
/
Accepted: 10 May 2021
/
Published: 18 May 2021
(This article belongs to the Special Issue Urban Sustainability Futures)
Abstract
:The harmony relationship between people and places is crucial for sustainable development. The smart sustainable city concept is widely based on making efforts to understand this relationship and create sustainable communities. The placemaking process is highly dependent on people’s perception of places, events and situations in which they find themselves. Moreover, the greater the event scale, the more essential the research concentrated on them. A certain number of scientific papers have focused on the event management and event perception; however, there is still a research gap in works regarding sustainable development concepts. Thus, to fill this gap, the framework for large-scale event perception evaluation was created. Moreover, the cognitive map of large-scale event perception based on the Szczecin city citizens’ opinions was created. In order to acquire the opinions, a questionnaire with spatial–temporal measurement scales was applied. The representativeness estimation method, natural event ontology and framework for image interpretation were used for event segmentation. The storm phenomenon scenes were selected for picture measurement scale creation. The most significant factors of large-scale event perception were identified based on the questionnaire results. Finally, the cognitive map of global event perception factors is presented. By applying the analysis presented in this paper in various industries, relevant policies related to different dimensions of the citizens’ well-being could be created by governments.
1. Introduction
Recently, human behaviors analysis has begun to play a significant role for smart city construction [1]. Indeed, the connection between people and place is essential for creation of sustainable communities. Sustainability citizenship and placemaking are linked to realizing places and use of the citizenry to enact change [2] (p. 192).
Moreover, it is important to determine and understand the main qualities and characteristics linking people and places. Managers will be able to concentrate their efforts on appropriate initiatives and events to improve them [3]. Emerging information technology, such as Big Data, IoT, and remote sensing observing systems, helps to understand and interpret the people’s emotions and behaviors within the urban communities and plan the actions based on the results of the interpretation [4].
It needs to be highlighted that “the recent discourse on placemaking theory focuses on an interplay of physical factors, socio-cultural perceptions, and collaborative planning and mind-sets” [5]. According to Turvey, “the complex task of place-making to build sustainable communities has been challenging yet compelling when finding solutions to intertwined issues on the environment, the economy and society” [6] (p. 286). Thus, one of the most important challenges of the smart city is situation evaluation and risk prevention. According to the Global risk report 2020, five groups of risk are exists: economic risks, societal risks, technological risks, geopolitical risks, and environmental risks [7]. The purpose is the side effects anticipation, especially in case of global environmental and economic changes, such as, for example, the Brexit event [8]. This implies a reconsideration of the emerging interrelationships between environment, economy, and people as a basis for sustainable place-making [9] (p. 213).
Recently, information technology, especially internet communication technology, remote observing systems and remote sensing, urban data science, big data, and cognitive systems have begun to play an increasingly important role in urban sustainability [1]. These technologies help to quantitatively understand the smart city, its functions, events, and human behaviors in the cities.
Thus, one of the main purposes of sustainable society is to monitor, using digital technologies, the current situation and prevent the negative effects of global environmental, economic, and social events [10].
The contribution of artificial intelligence, robotics, and autonomous systems to solving urban challenges is widely described in [11]. The authors identified five main categories in which the cities articulate AI and robotics: automation, decision-making, education, smart infrastructure, and smart mobility.
Moreover, the above-mentioned technologies play crucial role in urban event planning, analysis, and management. The increasing meaning of urban events management for sustainable development was highlighted by many authors.
From the management perspective, the urban event is often treated as the scheduled event, which aims to increase the attractiveness and promote the concrete location [12,13].
The increasing meaning of urban events was also mentioned in books of Richards [14] and Cudny [15]. In a book edited by Waldemar Cudny “Urban Events, Place Branding and Promotion” authors explore the phenomenon of place event marketing. This book provides a novel contribution to the literature, describing in-depth insights on the meaning and role of urban events [15]. Moreover, in a work of Müller, “What makes an event a mega-event?”, the author provides the multi-dimensional, point-based classification scheme of large-scale events. The author distinguishes major events, mega-events, and giga-events [16]. Other works is concentrated on studying the event perception [17,18,19].
In work [8] (p. 780) authors argue that “current work ignores the distinction between an event, with a physical manifestation representing some form of change, and thus being bounded in time (and space), and reactions to such an event broadcast in location-based social media”.
Based on a literature review, it was concluded that there is a gap in research related to large-scale event perception. The large-scale event is a complicated phenomenon, which introduces changes on three core city dimensions: social, economic, and environmental.
Hereby, the proposed in this paper framework for large-scale event perception evaluation takes into consideration the relationship between three dimensions of the sustainability concept. The paper then presents the new framework for large-scale event perception and holistic situation evaluation regarding sustainability concept and using spatial–temporal measurement scales with natural environmental scenes.
In [20], the authors concluded that “natural images have been used in two ways in perception research: as a source of information about human environments, and as stimuli in experiments” [20] (p. 569).
In this paper, both ways presented in [20] were used to acquire the citizens perceptions.
Furthermore, it was proved by scientists that event perception is based on visual image interpretation. “Images are an obvious source of distributional information relevant to vision, but they can also potentially give us the information about the cognitive capacities” [21].
On the other hand, the visual interpretation of environmental images is a complex process. “It includes the meaning of the image content but also goes beyond what can be seen on the image to recognize spatial and landscape patterns and relations” [22].
It was also proven that dozens of visual mental imagery should be engaged in the interpretation process when people see an event, an object, or a scene in the absence of the related visual input [23,24]. “Mental imagery lies at the intersection of vision and memory” [25].
There are two ways to acquire the human judgments from images: the use of image database statistics or to conduct the research based on one’s own pictures. According to Griffiths et al. the growing number of large image databases presents many new opportunities for scientific research [20]. On the other hand, authors highlight that “it is challenging to collect relevant human judgments using these databases. Because of the sheer number of images they contain, only a small proportion are likely to be relevant to a particular research question” [20] (p. 58). In conclusion, the authors argue that new experimental methods are needed. Thus, in this paper the new approach based on picture measurement scale application to citizens’ perception evaluation is presented.
Summarizing the above mentioned, the large-scale events analysis such as for example Brexit, COVID-19 or global warming are crucial for the maintaining the sustainable development. The large-scale events could introduce changes in the three pillars of the sustainability. They often bring the destabilization, risk, changes, and new challenges. Moreover, these changes are complex, unpredictable, and hard to evaluate, especially from the citizens’ point of view. Thus, the situation perception evaluation requires the understanding of the nature of the changes and influencing factors.
In the emerging situation of the COVID-19 pandemic, such evaluation takes on great importance. The society should be prepared to evaluate the changes that take place not only in the economic sphere [26,27,28,29], but also in the social–cultural sphere [30,31,32], and the sphere of physical and psychical people health [33,34,35,36,37].
The main purpose of the research was to create the conceptual framework for large-scale events perception evaluation within smart sustainable cities. Several research methodology approaches were used. The literature study was conducted to analyze the current approaches to spatial semantics and knowledge representation, as well as event perception analysis. The spatial–temporal measurement scale was developed to acquire the citizens perception based on congregation of the concepts presented in Table 1. The cognitive map was applied to present the factors have impact on the large-scale event perception.
The paper is organized as follows. First, the literature review is presented. Based on literature review results the framework for large-scale event perception evaluation was created. In next part of the paper, the research methodology and the results are described. The main factors which had influence on events perception were identified and analyzed. In the final part of the paper, conclusions and future research perspectives are discussed.
2. Literature Review
The literature study was initiated with event management concept analysis.
“Event management refers to the targeting and managing of designed public events geared to invest emotional energies and economic resources to selected goals” [12] (p. 1).
Regarding the sustainability concept, event management is based on three interconnected groups: economic, social, and environmental. These groups are presented and explained in literature in different ways: mainly as the “pillars” [38,39,40,41,42,43,44], “dimensions” [45,46], “components” [47], or as “perspectives” [48].
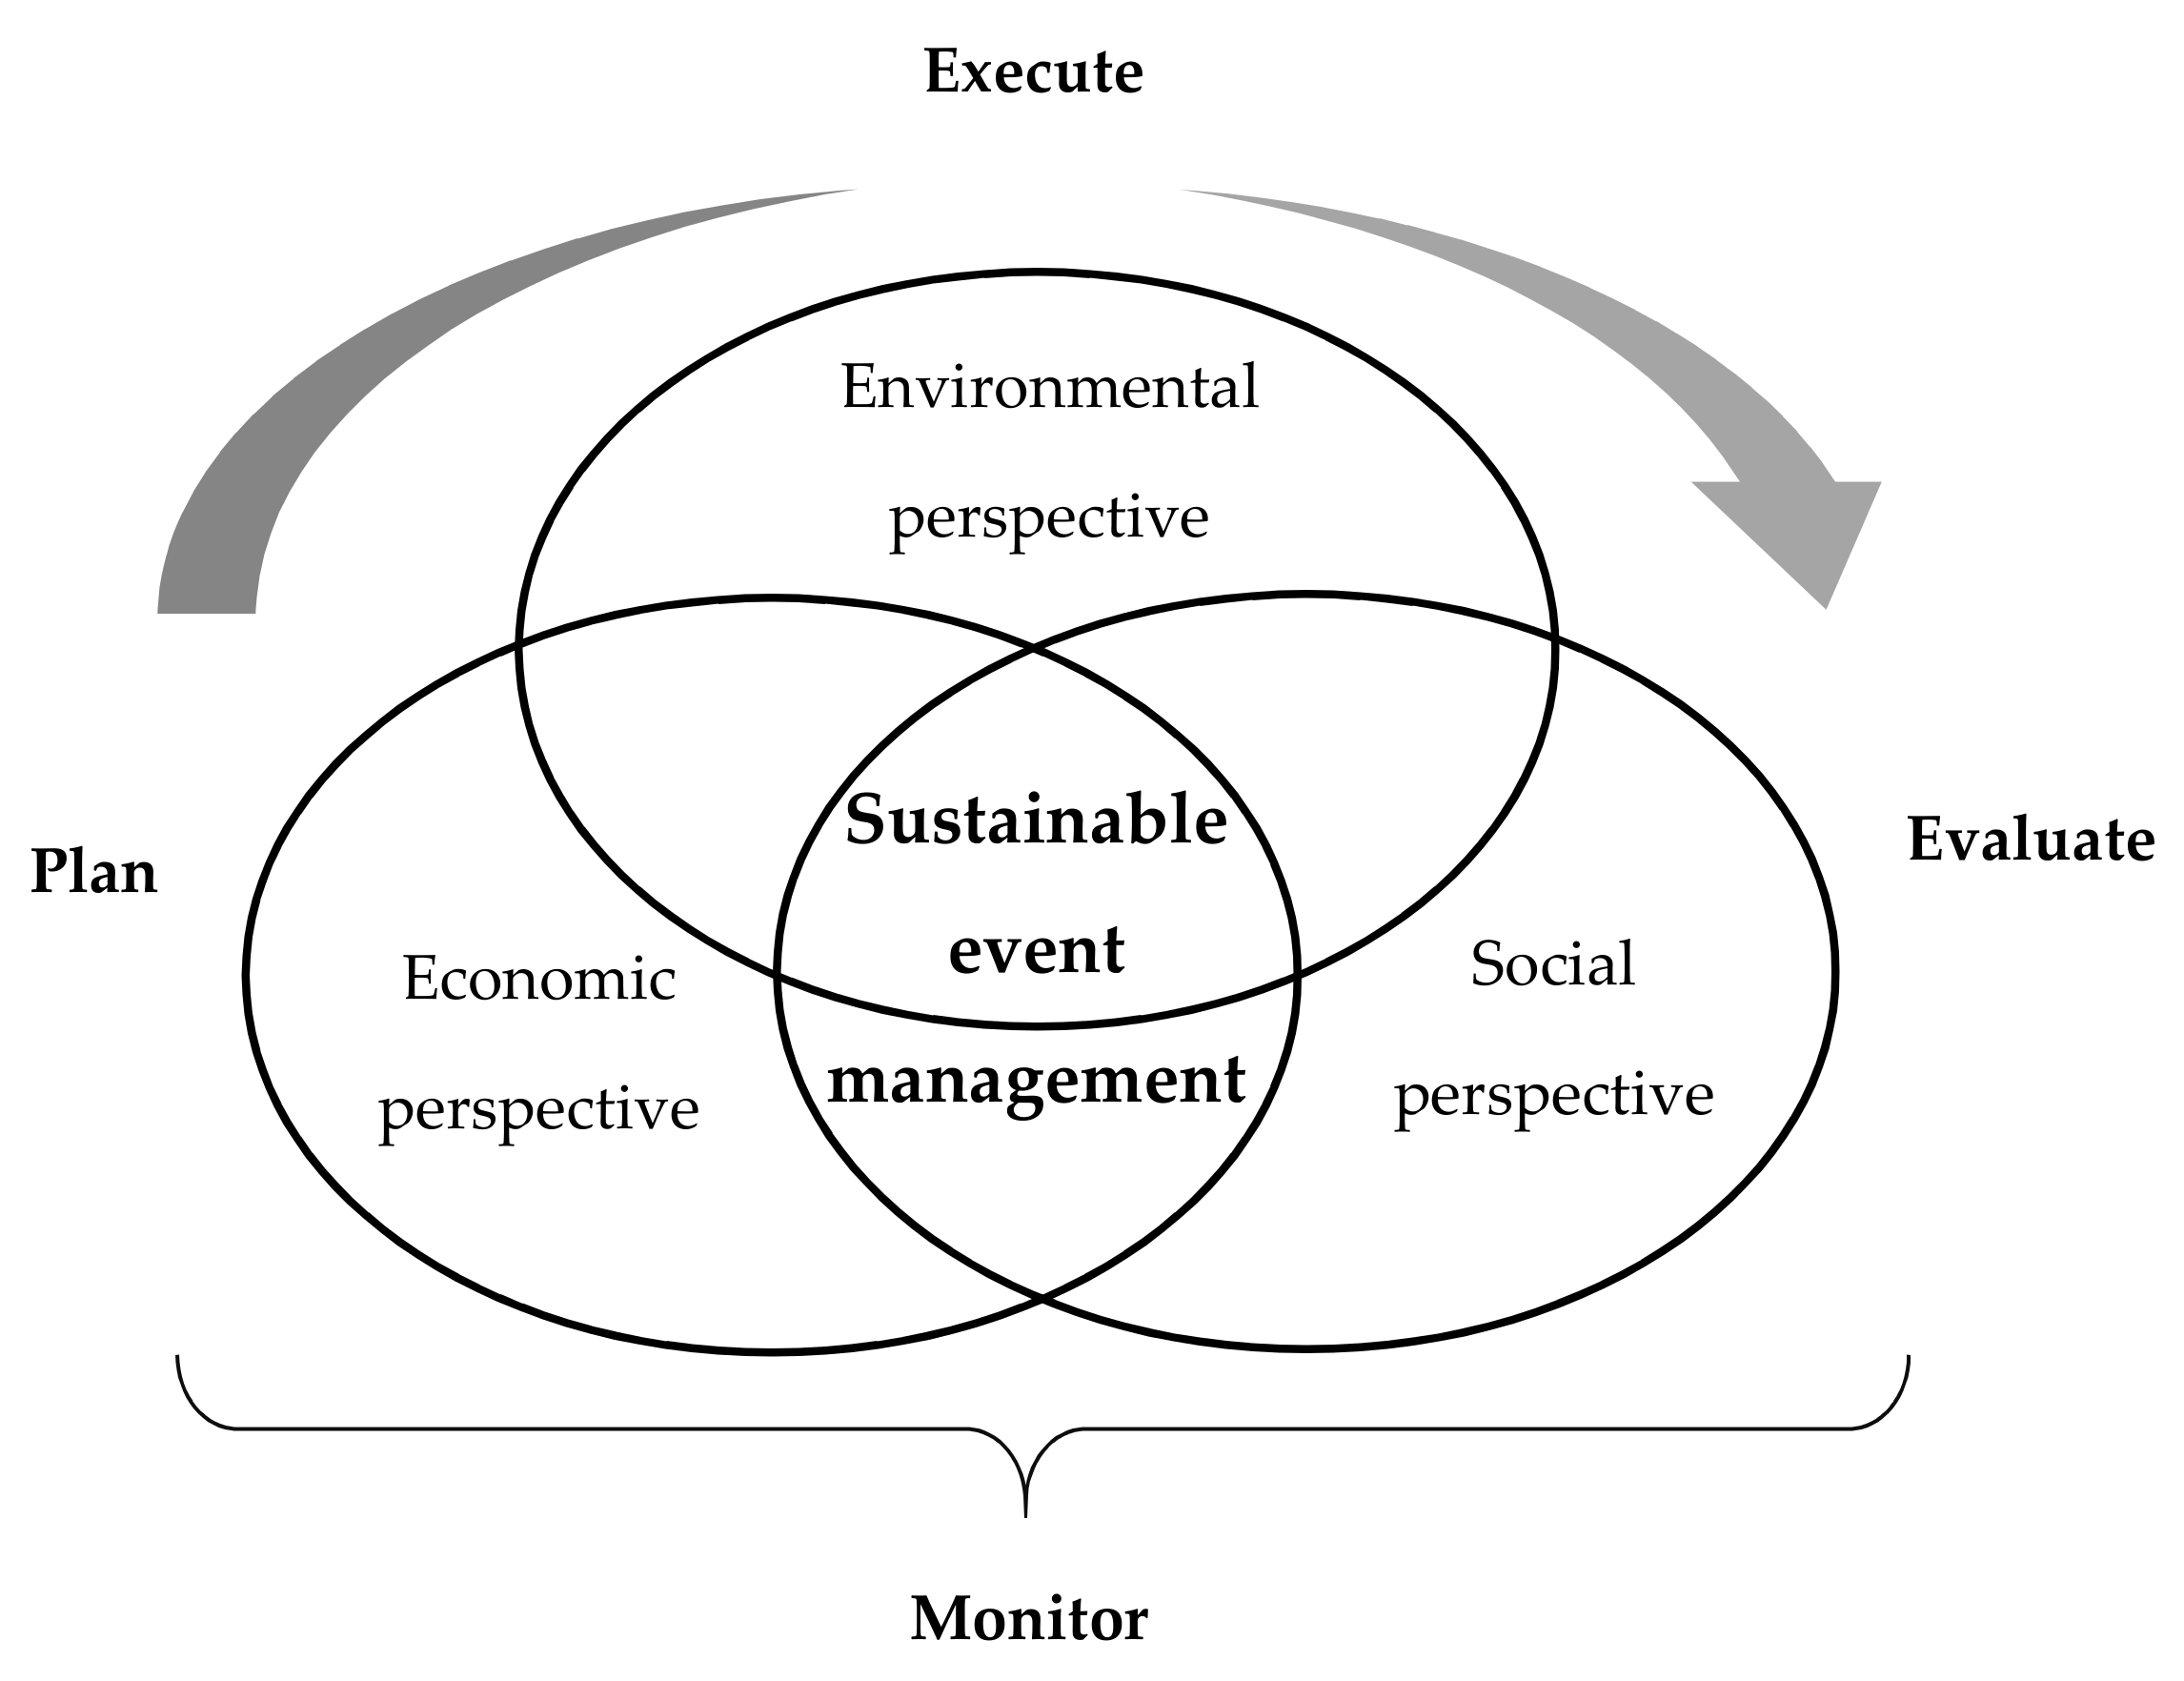
Ghavampour and Vale suggest that place-based engagement could be a way of managing large-scale issues [49]. Figure 1 presents the conceptual interpretation of sustainable event management and its main stages: event planning, execution, and evaluation. The first two stages refer to scheduled events. The third, evaluation stage, could be also applied also for unplanned, spontaneous events. The evaluation stage should contain not only economic, environmental, and social indexes calculation, but also the citizens’ event perception evaluation and the response analysis. Situation monitoring should occur throughout the process of event lifecycle.
According to Richmond and Zacks, “event perception research has tended to focus on how individuals process dynamic visual events in the moment” [50]. Thus, the term “event perception encompasses a range of phenomena involving the processing of temporally extended, dynamic information” [51] (p. 1).
From psychological point of view, Zacks in 2008 defines event “as a segment of time in a given location that an observer perceives as having a beginning and an end” [18]. In psychology domain, attention has focused on events that are relatively brief, on the timescale of seconds to minutes, and that are perceived rather than, say, read about. Representations of events cover spatiotemporal location, the people and objects involved, and the relations between these elements [52] (p. 609). In 2007, in a paper by Richmond, Gold, and Zacks [53], the authors present a theory of the perception of everyday events, review psychological data that have informed the theory, and discuss possible neural substrates of the theory’s components. The ability to perceive an event in such a way is supported by using later memory for the event. Moreover, event perception can be described by a relatively stable state at which predictions about the future development of the observed action guide perception [54].
From economy and technology perspective the events have more global nature. They may affect the entire world, continents, or countries. Furthermore, according to Zacks et al. “the spatial and temporal boundaries of events also can be fuzzy—it is sometimes difficult to say where or when one event ends and another begins” [17] (p. 273), especially in case of global events.
Several research were conducted to study the environmental events [55,56]. On the other hand, some papers describing the interrelation between the economic events and environmental events perception were published. In 2019, Dankel et al. proposed the conceptual framework for collective reactions analysis to the Brexit event [8]. The authors have used the data extracted from Flickr image database to conduct the study. However, Griffiths et al. argue that it is challenging to collect relevant human judgments using large image databases [20].
In 2019, Pilipczuk and Nowakowski [57] checked the possibility of using the spatial–temporal environmental scales to study the current economic and technological development in Poland in 2018. The scenes of “stormy sky” with different contrast levels were used to create two different scales [57]. The data were collected in 2018 using the questionnaire method [57]. The respondents were asked to review the current economic situation, situation on the labor market, and situation on ICT market in Poland. The online questionnaire was created and shared in open access using the Google Forms application. The results of scales acceptance were presented, and cognitive load was also calculated.
Additionally, more detailed results of the literature study are presented in Table 1. These concepts and theories were grouped by three perspectives: economic perspective, semantic perspective, and cognitive perspective.
The above-mentioned concepts were used in process of developing the framework for event perception evaluation presented in next part of the paper.
3. Materials and Methods
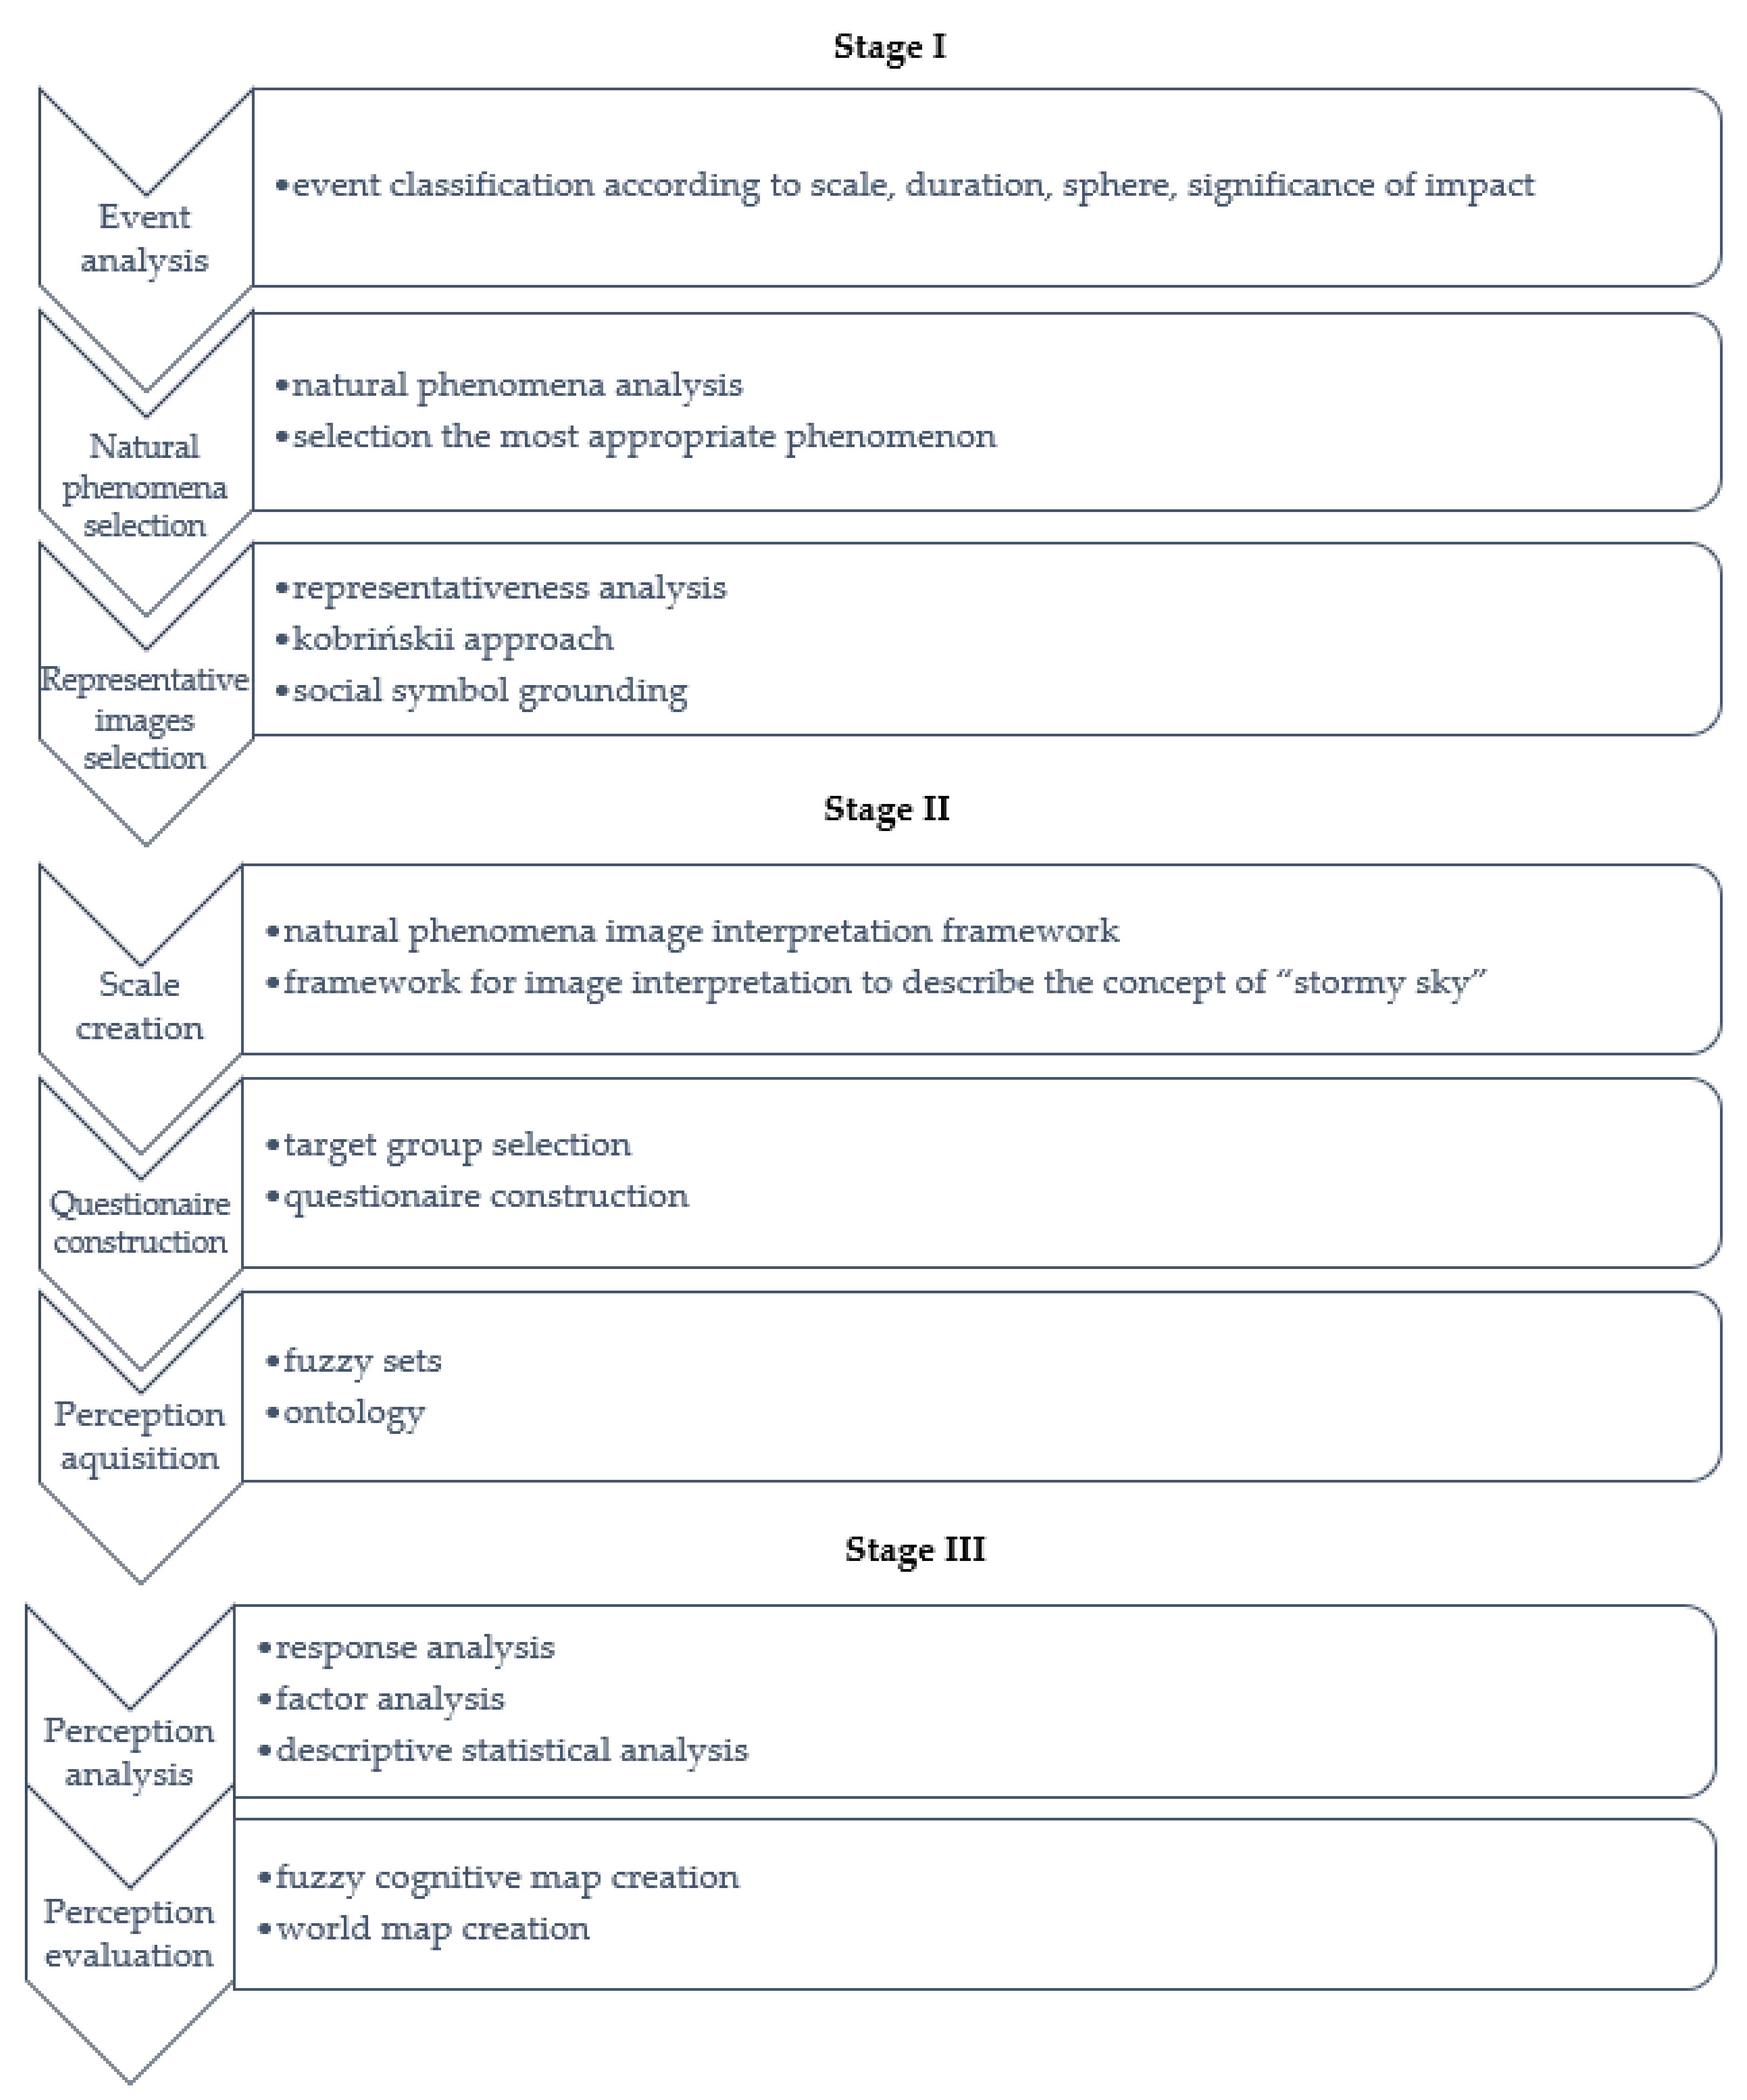
Based on the literature study, the large-scale event perception evaluation framework was created (Figure 2). The framework consists of three main stages: research preparation, research conduction and analysis and evaluation stage.
The process begins from the event analysis. It could be analyzed according to scale (local scale, large-scale, global scale), sphere (economic, social, environmental) duration (short-term, long-term), risk level (for example: low, average, high), and type of the impact (positive, negative, or neutral).
At the second stage, the appropriate natural phenomenon was selected. The natural phenomena should be selected based on results of the event analysis according to the same criteria.
The ontology for natural images interpretation was developed based on works of Bhatta et al. (2008), Grishin et al. (2003), Huang et al. (2017), Arvor et al. (2019), Kuhn et al. (2007), Chen et al. (2016), and Jenson et al. (2007) (Figure 3). The ontology has been simplified for the purposes of describing mental concepts.
The next step was the representative images selection. Then, the representative images have been selected, the measurement scale construction begins (semantic stage). The scale should be created regarding to phenomenon evolution stages keeping the time intervals.
The representative photo was analyzed according to following levels:
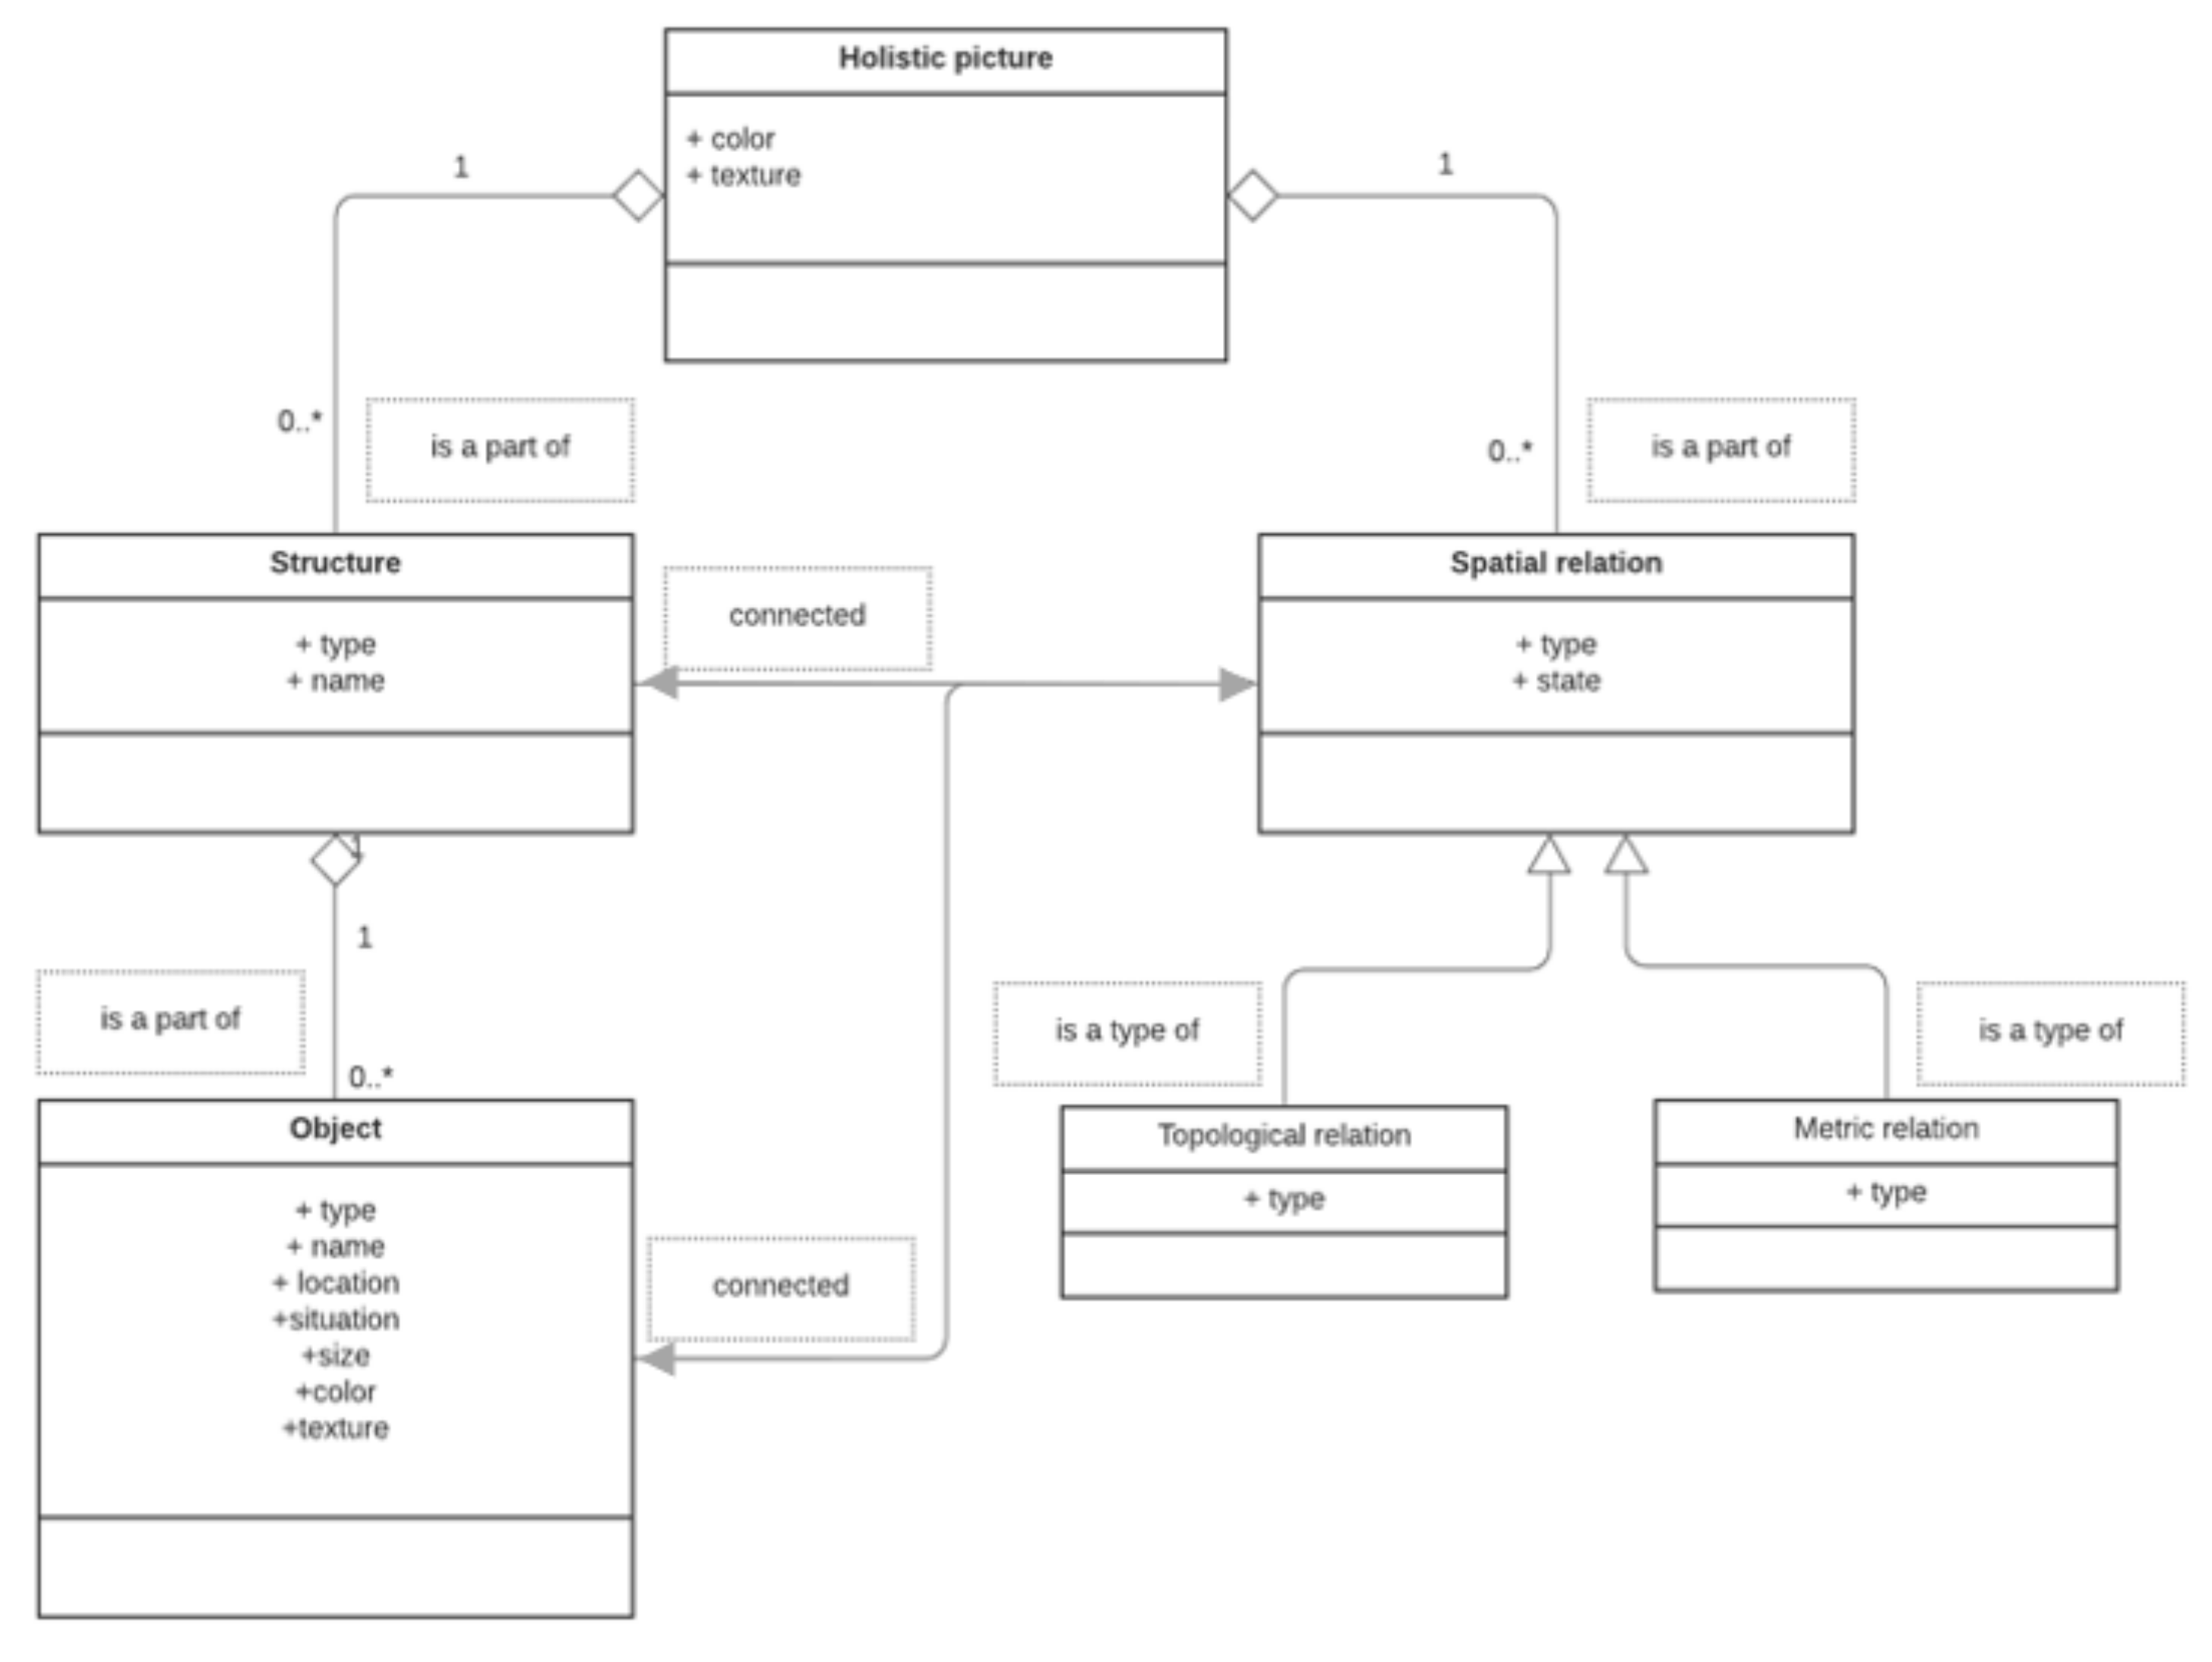
- Level I. Holistic image: stormy sky. (Features: dominant color/tone, texture.)
- Level II. Structures: Light clusters, phenomena clusters, precipitation clusters, cloud clusters Features used: type, name. )
- Level III. Objects: sky, wind, clouds, sun, ray, lightning, tornado, precipitation, land, buildings Features used: type, name, size, color, texture, location, situation.
The defined levels were structured by creating the framework for “stormy sky” image interpretation (Figure 4). The structure was based on ontology natural phenomenon image interpretation ontology.
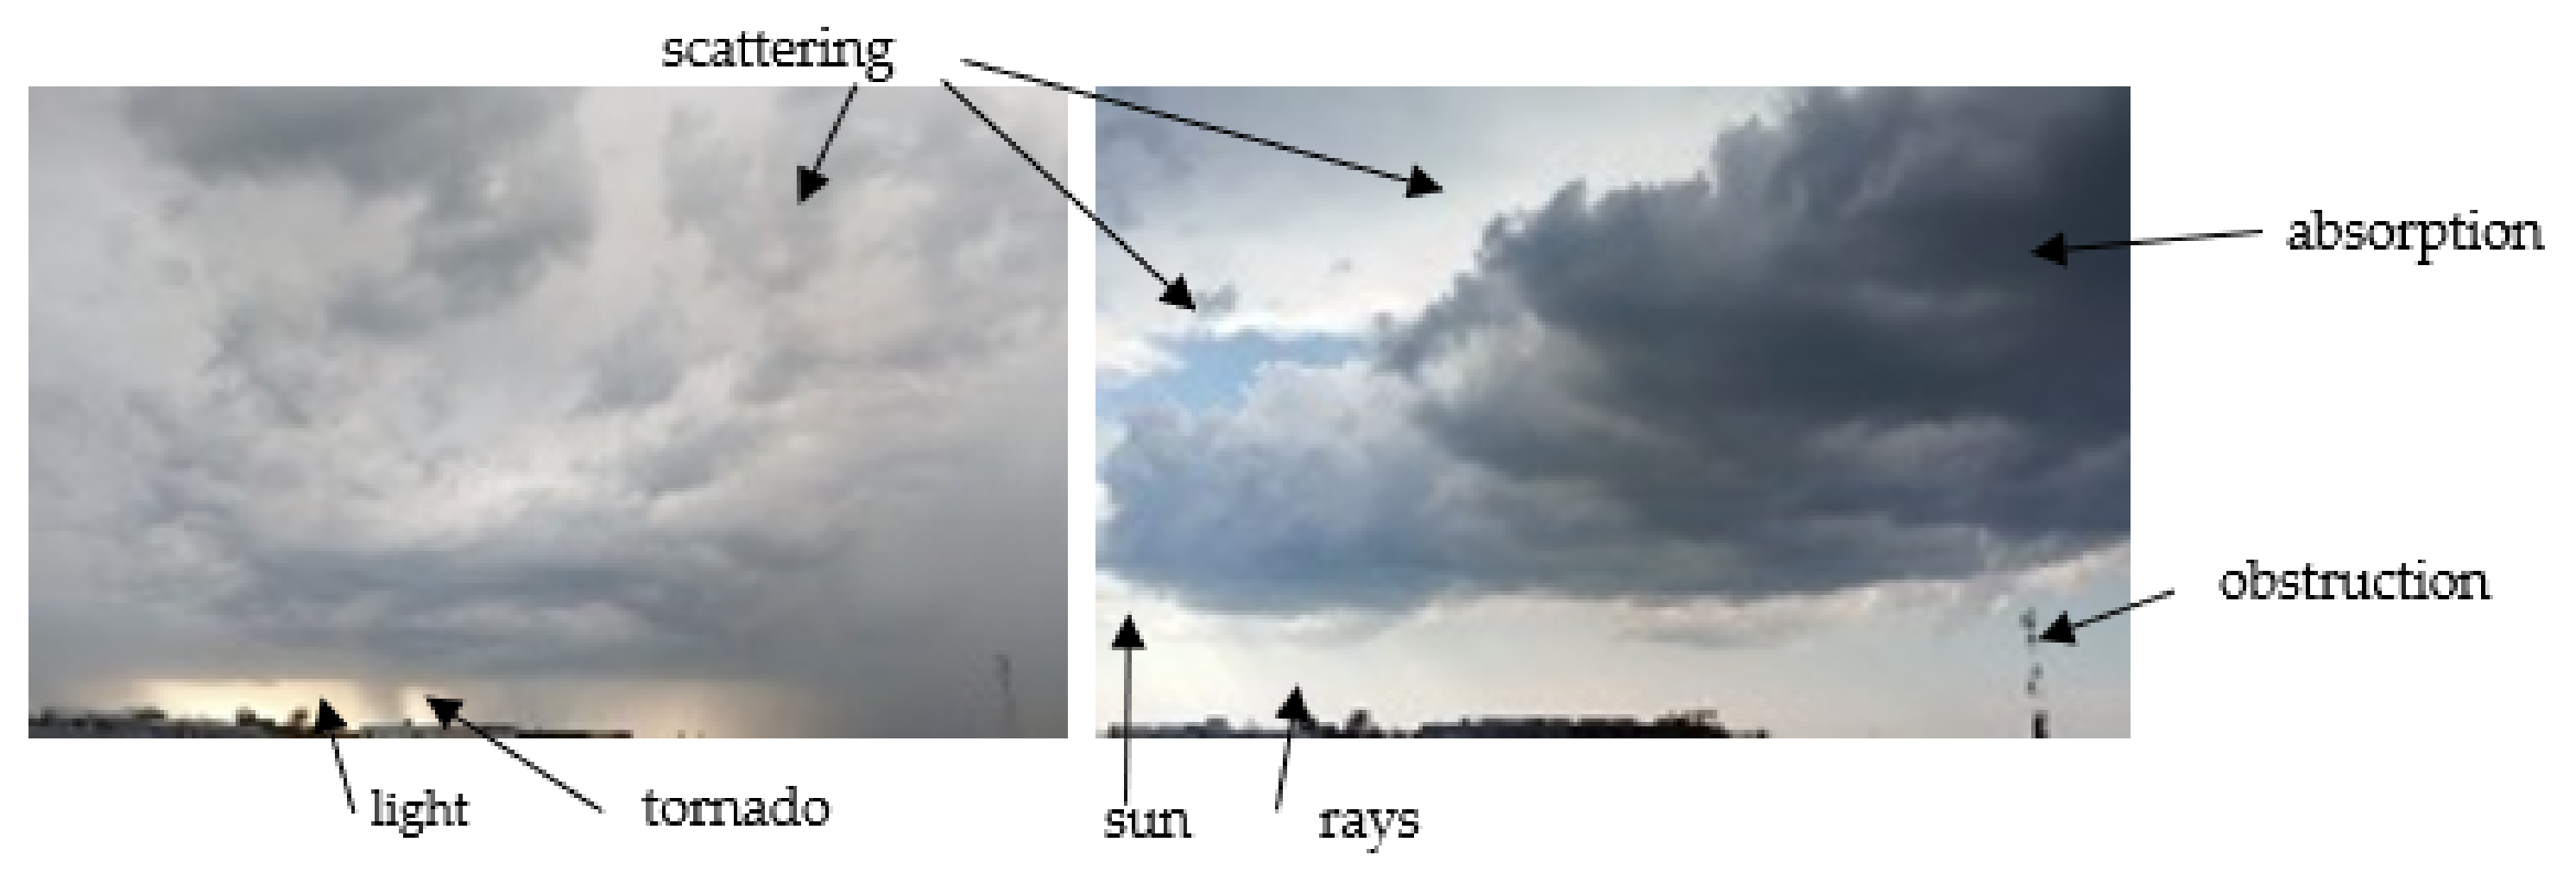
In Figure 5, two examples of representative images of “stormy sky” are presented.
The scale was created with respect to sustainable planning, starting from the center (balance) point—the most representative scene of the storm phenomenon.
The number of pictures was limited to nine regarding the fuzzy reasoning statements (Figure 6). According to expert’s opinions, the number of quantifies should not be greater than nine in order to ensure the correct and easy interpretation.
After that, the selection of representative scenes with similar temporal intervals was done. The 3 of scenes from storm forming stage and free from storm finishing stage were used. To complete the scale, one scene after the storm and one before the storm were used.
The set of photos as P = {p} was defined (Figure 7). The set was divided on five elementary sub-sets (E). p5 was defined as the most representative scene, which includes the greater number of representative objects and structures based on framework for image interpretation (Figure 4). The scenes from p2 to p4 present the storm forming cluster in comparable phase intervals. The scenes from p6 to p8 present the storm ending clusters in comparable phase intervals. The scenes p1 and p9 present the clear sky as an equivalent of the clear and safe situation.
In Appendix A, the tagged and discarded images are presented.
According to Chen, 2016, “the expert knowledge mobilized by environmental scientists to interpret remote sensing images tends to be somehow discarded from the data-driven image analysis, the development of knowledge-driven approaches has been identified as one of the most important directions of research by the remote sensing community” [71] (p. 913).
Additionally, according to Kuhn et al., knowledge representation in ontologies should approach experts’ cognitive semantics to describe the way humans conceptualize geographic features [72].
Therefore, the levels of image interpretation proposed in this paper were constructed as knowledge-driven and are more general than classic geographic ontologies with focus on perception acquisition. The levels were created based on following sources: [69,70,71,72,73,74,75,76,77]. It contains of structures, objects, and spatial relations.
The next stage was the target group selection and questionnaire construction. The target group was made up of Szczecin’s city citizens. The first part of the research was conducted in 2018 [57]. The questionnaire created in Google Forms was selected as the research method.
First, respondents were asked to evaluate the current economic situation and technological development level in Poland using the measurement scales constructed based on the photos presenting the stages of storm phenomenon evolution [57]. At the second part of the research, the respondents were asked to provide the word interpretation of the perceptions related to chosen scene (photo). The verbal interpretation was used to analyze the source conceptual metaphors (environmental objects, structures, and spatial relations) and target conceptual metaphors (social concepts).
The questionnaire includes only two questions: one with the picture measurement scales and second with the verbal interpretation (metaphors) of the selected scenes. The perception factor analysis could be done using one of following methods: fuzzy sets, descriptive statistics, ontology.
The final stage was the perception analysis and evaluation stage. The three methods could be used response analysis, factor analysis, descriptive statistics. The final evaluation results could be provided using fuzzy cognitive map. Additionally, at the end, the world event perception map using GIS software could be created (in case of global events).
In 2020, the analysis of perception factors was done, and the core perception factors were identified. A total of 588 cases of storm scenes interpretation were processed. Eighty-four cases of scenes were finally selected by citizens. The verbal associations related to the chosen by citizens scenes were analyzed.
4. Results and Discussion
The following relationships of the source and target conceptual metaphors from social and environmental domain (objects, structures, and spatial relations) were identified:
- Stability/variability—the lack of wind/strong wind, the lack of cloud/chaos in clouds;
- Threats/safety—presence/absence of dark clouds, tornado, lightening;
- Chances—presence/absence of rays, light; dark clouds flying away; sun above the clouds/sun behind the clouds;
- Satisfaction/unsatisfaction—clear sky, sun/cloudy sky; absence of sun;
- Clarity/lack of clarity,–clear sky, sky with light clouds/clouds; dark colors;
- Sustainability/confusion,–balance in colors, even clouds dispersion/lack of even dispersion.
Based on number of acquired conceptual metaphors, the percentage of the impact of each factor was calculated (Figure 8).
The impact of the factors on event perception is presented on Figure 8. The research reveals that the satisfaction was the most significant factor—36%. This result is convergent with the conception of happiness in smart sustainable city [78,79,80].
The second place took the “clarity of the situation” factor—31%, and the “chances on successful development”—29%. The rest of factors had similar impact—from 10 to 12%.
Several of respondents highlight the meaning of arrangement, development, the seriousness of the situation and harmony in situation. However, their number was too small to take these opinions into further consideration.
The results of survey were compared with the literature of the domain. The core factors connected to citizens well-being that have influence on smart cities development are sustainability, risks evaluation, prevention and elimination, citizens happiness and safety. The analysis reveals that the extracted factors were in line with the current global concepts [7,78,79,80].
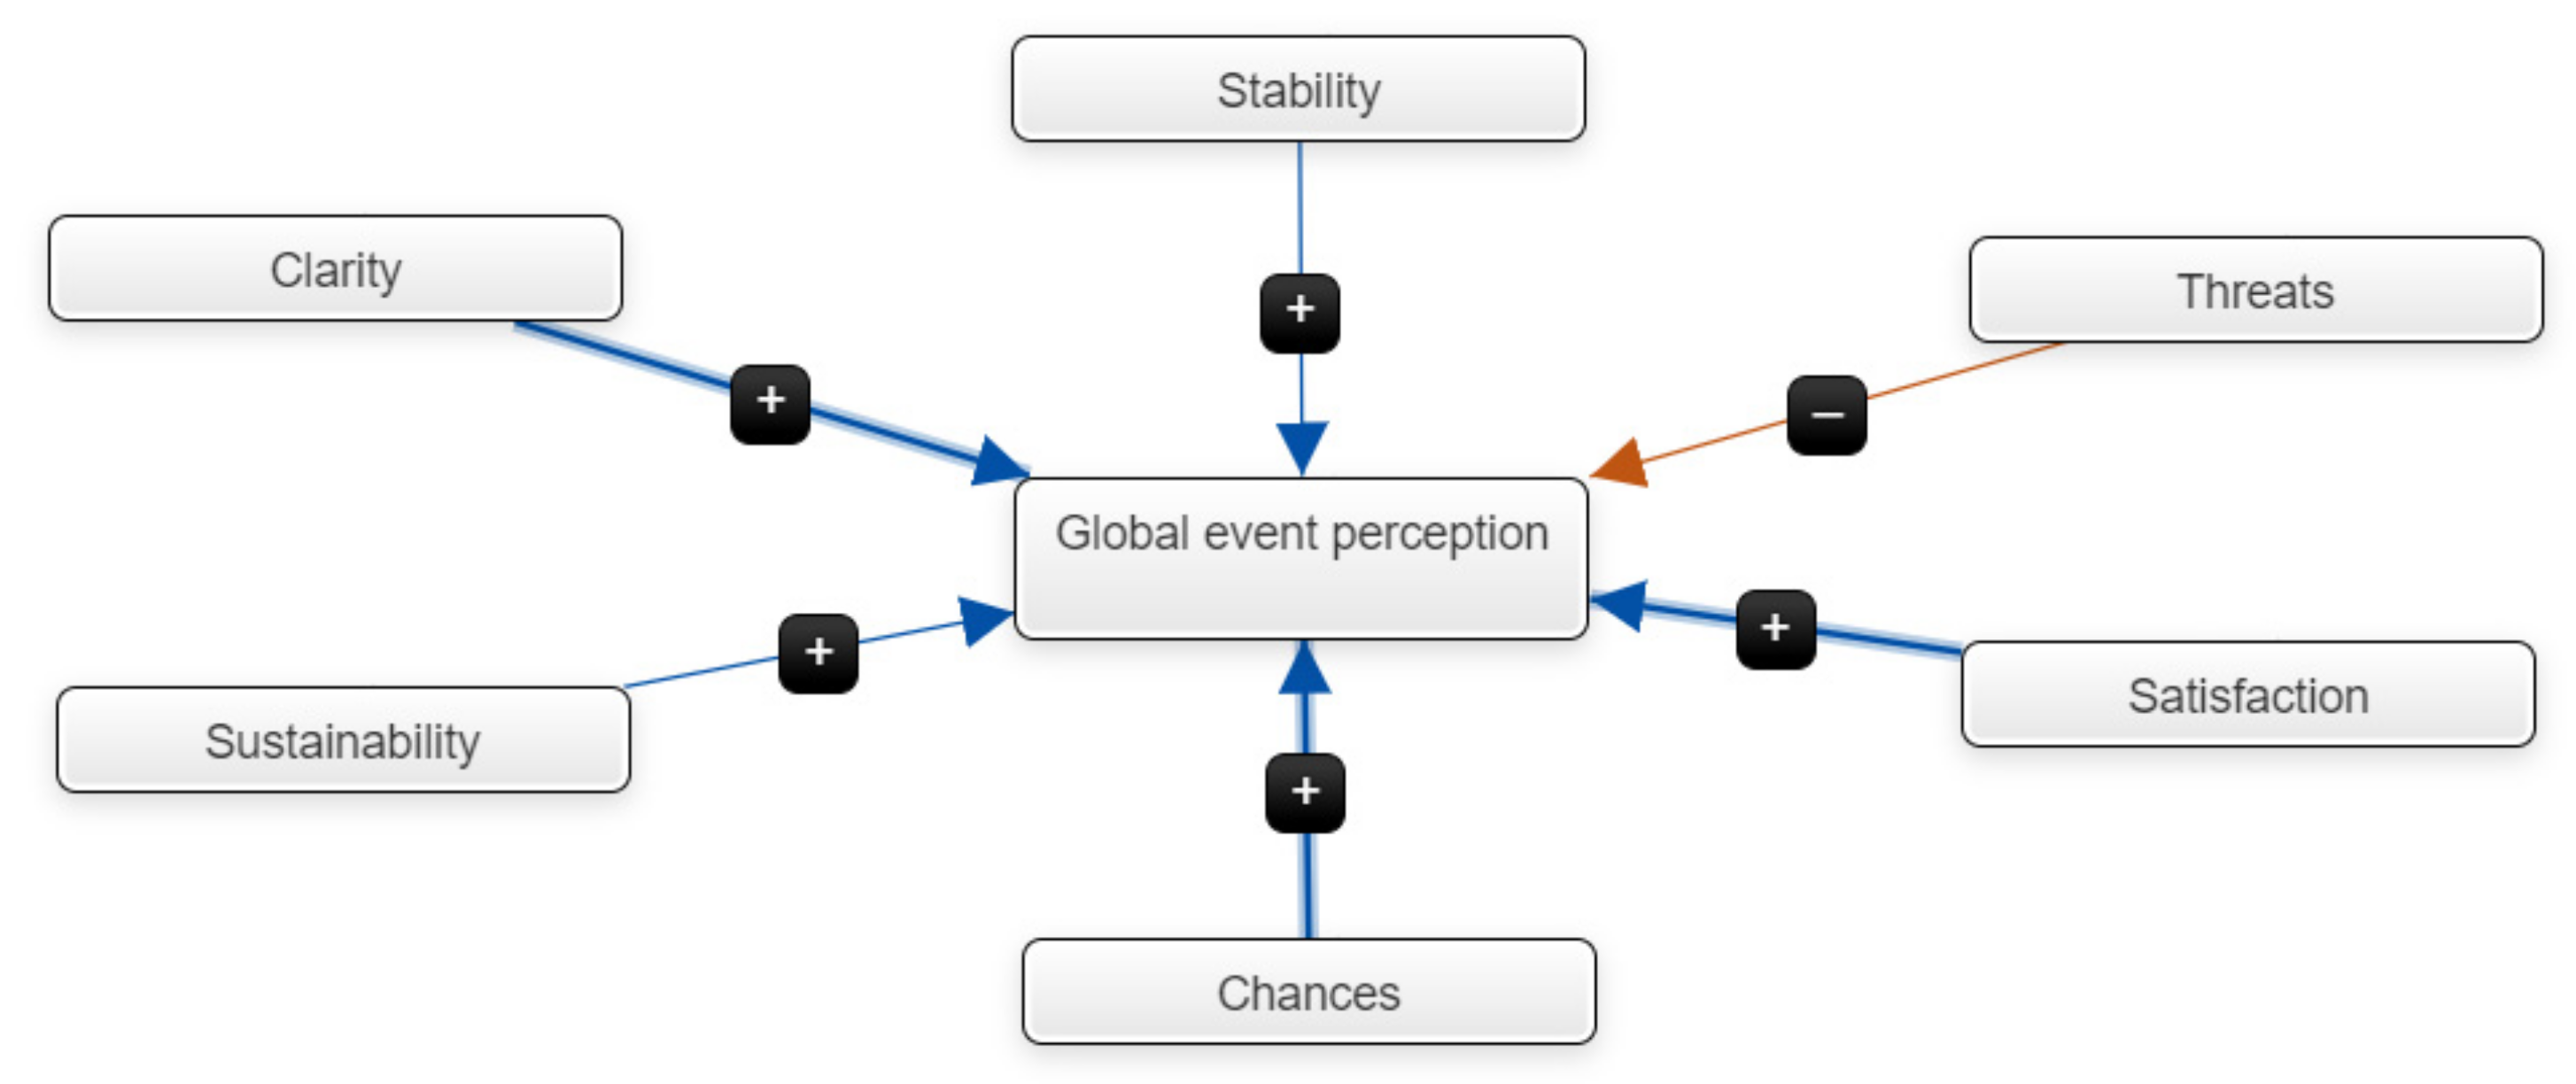
Based on results of the perception analysis the cognitive map of global event perception was created (Figure 9). The cognitive map was applied as an extremely popular tool in exploring and visualizing the determinants and factors in social–economic research [81,82,83,84].
The weights were assigned according to percentage of citizens opinions. The five of six factors have positive influence on global event perception. The threats have the negative influence on event perception.
5. Conclusions
The large-scale event perception evaluation is strongly complicated process due to complexity of nature, risks deafferentation, cross-culture nature, multilingual nature, and difficulty in predicting.
The advantage of the proposed framework is that it is applicable for different groups of citizens, regardless of age [85], gender, region of residence, etc. The measurement scale with nature phenomena is understandable for every person. It provides the extracted information unification.
The presented sample of measurement scale is not an universal one. Depending on event characteristics, different phenomena could be chosen for different event perception research. Although, the purpose of the research was to create the framework with spatial–temporal measurement scale which will be useful for every person and region or country regardless of demographic conditions, the selected natural phenomenon should be acceptable and well-known to most of the citizens in their urban community.
The research has several limitations. First, the developed framework was based on research conducted only for Poland. It would be better to make attempts to apply it for a larger scale.
Moreover, the image interpretation may depend on citizens’ cognitive style [86]. According to authors of work [86] Object-Spatial-Verbal theoretical model of cognitive style identifies three relatively independent dimensions: object, spatial, and verbal cognitive style. On the other hand, it is complex, time-consuming, and laborious task.
The further research will be concentrated on above-mentioned gaps analysis and elimination, as well as on more experiments related to using spatial–temporal scales in event perception.
The analysis of relationships existing between the environmental and social conceptual metaphors allowed to define the event perception factors. However, more research related to environmental and social metaphors relationship analysis should be done. The relationships of the source and target conceptual metaphors from social and environmental domain should be studied to provide the fuzzy rules which could be contained in knowledge bases of intelligent systems. As long as they could be analyzed and presented by means of cognitive mapping and cognitive modelling, the perception factors could be automatically evaluated by cognitive decision-making supporting systems.
Moreover, the spatial–temporal picture measurement scale together with cognitive linguistic analysis can replace the complicated ambiguous questionnaire method in process of perception acquisition. In this way, the picture measurement scales can contribute to the methodology improvement.
The dynamic, unplanned large-scale event perception evaluation is the challenging task for smart city managers. Beyond the event perception evaluation, the framework could be applied in large-scale research projects to evaluate global risk, disaster perception, economic and social situation in urban regions, and many others.
Moreover, the presented framework could be applied for COVID-19 perception evaluation. However, at the moment the framework is a conceptual one. Many experiments should be done to elaborate more detailed procedure. Thus, the future work will address the question how cities will find themselves in a Post-COVID world and what are the key factors likely to influence the citizen’s COVID-19 perception.
Currently, a large amount of research is focused on COVID-19 perception. In work of Shorey et al., the authors have identified the five main themes of COVID-19 perception. They are “fear and concern, panic buying and hoarding, reality and expectations about the situation, staying positive amid the ‘storm’ and worries about the future” [87], p. 666. Interestingly, the authors underline the mental association of COVID-19 and storm phenomenon.
The study conducted by Bruine de Bruin was aimed to examine age differences in risk perceptions, anxiety, and depression [88]. The presented findings agree with studies suggesting that “adults in United States who are relatively older tend to report less negative emotions, better mental health, and less responsiveness to daily stressors and experience less depression and anxiety” [88], (p. 26).
During another COVID-19 risk perception study the following risk-related cognitive variables were extracted: fear, anxiety, and uncertainty [89].
The abovementioned works, as well as more other works in the field affirm the reasonableness of the picture measurement scale application to the COVID-19 event perception evaluation.
Based on perception factors, relevant policies related to mental citizens’ health could be created by the government. As mental health is related to emotional, psychological, and social well-being, all these spheres should be covered by the perception’s evaluation study [90,91].
According to Malek et al. “considering citizens’ perceptions about and perspectives of smart city development is seen as a sound strategy for many political and administrative leaders” [92], (p. 1). Developing a “smart city”, leaders can follow various pathways and strategies basically associated with technology-focused perspective, a data-driven perspective, environmentally influenced perspective or citizen-centric approach.
This paper generally contributes to citizen-centric perspective literature with respect to other perspectives. Nevertheless, “following a people-centric smart city developmental path” means “a societal approach that involves public engagement” to measure “wellbeing, the state of happiness, and respond through its public policy frameworks” [93], (p. 141). In this paper, the idea of citizen-centric approach was not limited to citizen’s participation in decision-making. The author states that this approach should finally lead to self-identification with the city, giving rise to the feeling that “this City is my City” and its evaluation.
Funding
This research received no external funding.
Institutional Review Board Statement
Not applicable.
Informed Consent Statement
Not applicable.
Data Availability Statement
Not applicable.
Conflicts of Interest
The author declares no conflict of interest.
Appendix A
Figure A1.
Discarded scenes.
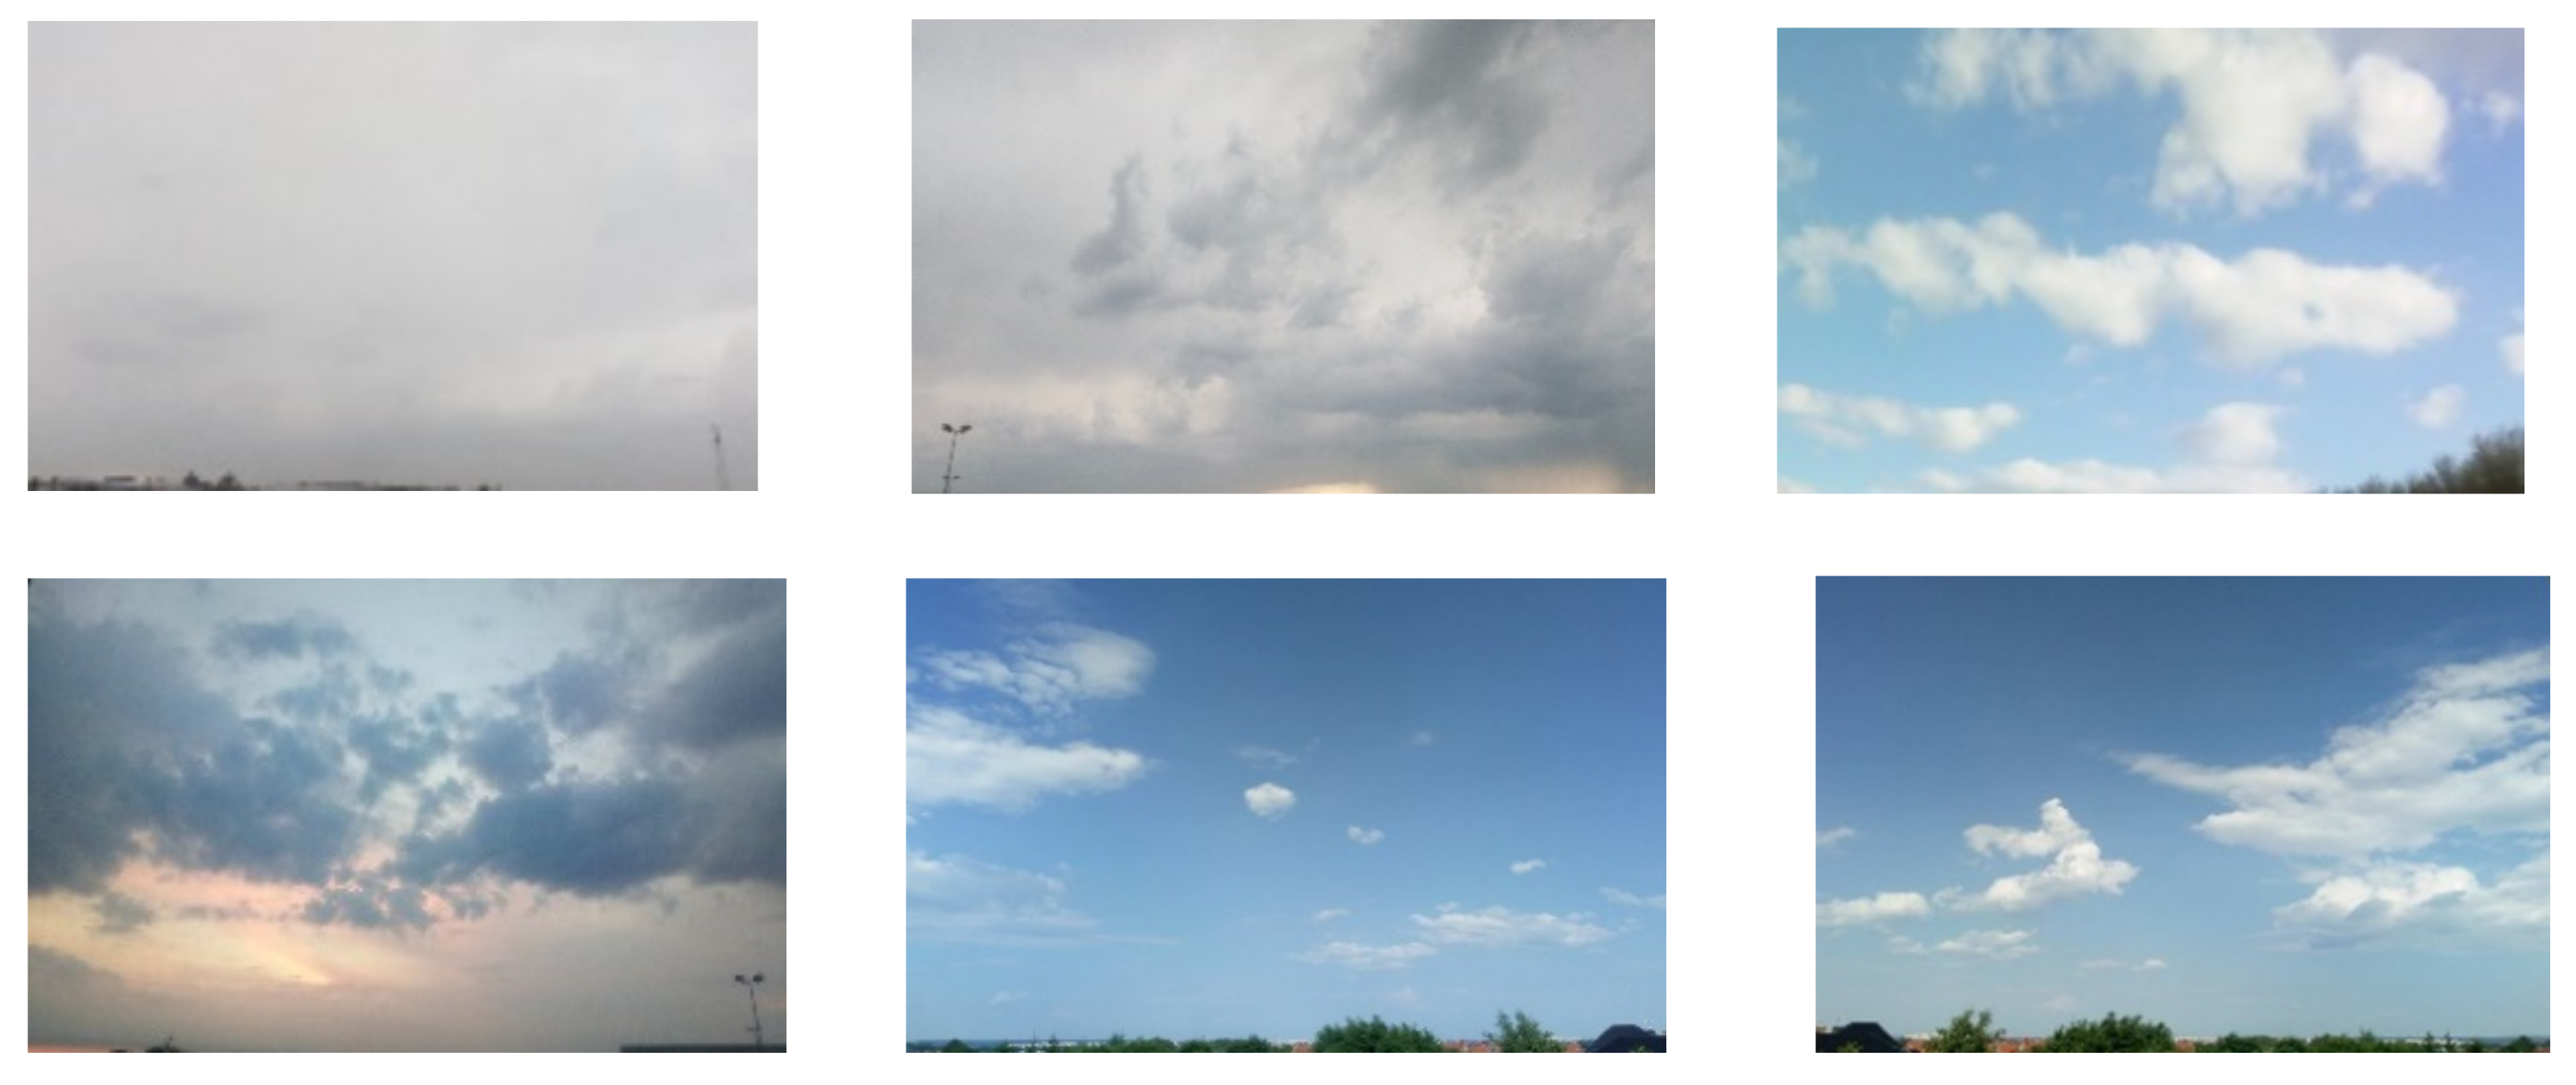
Figure A2.
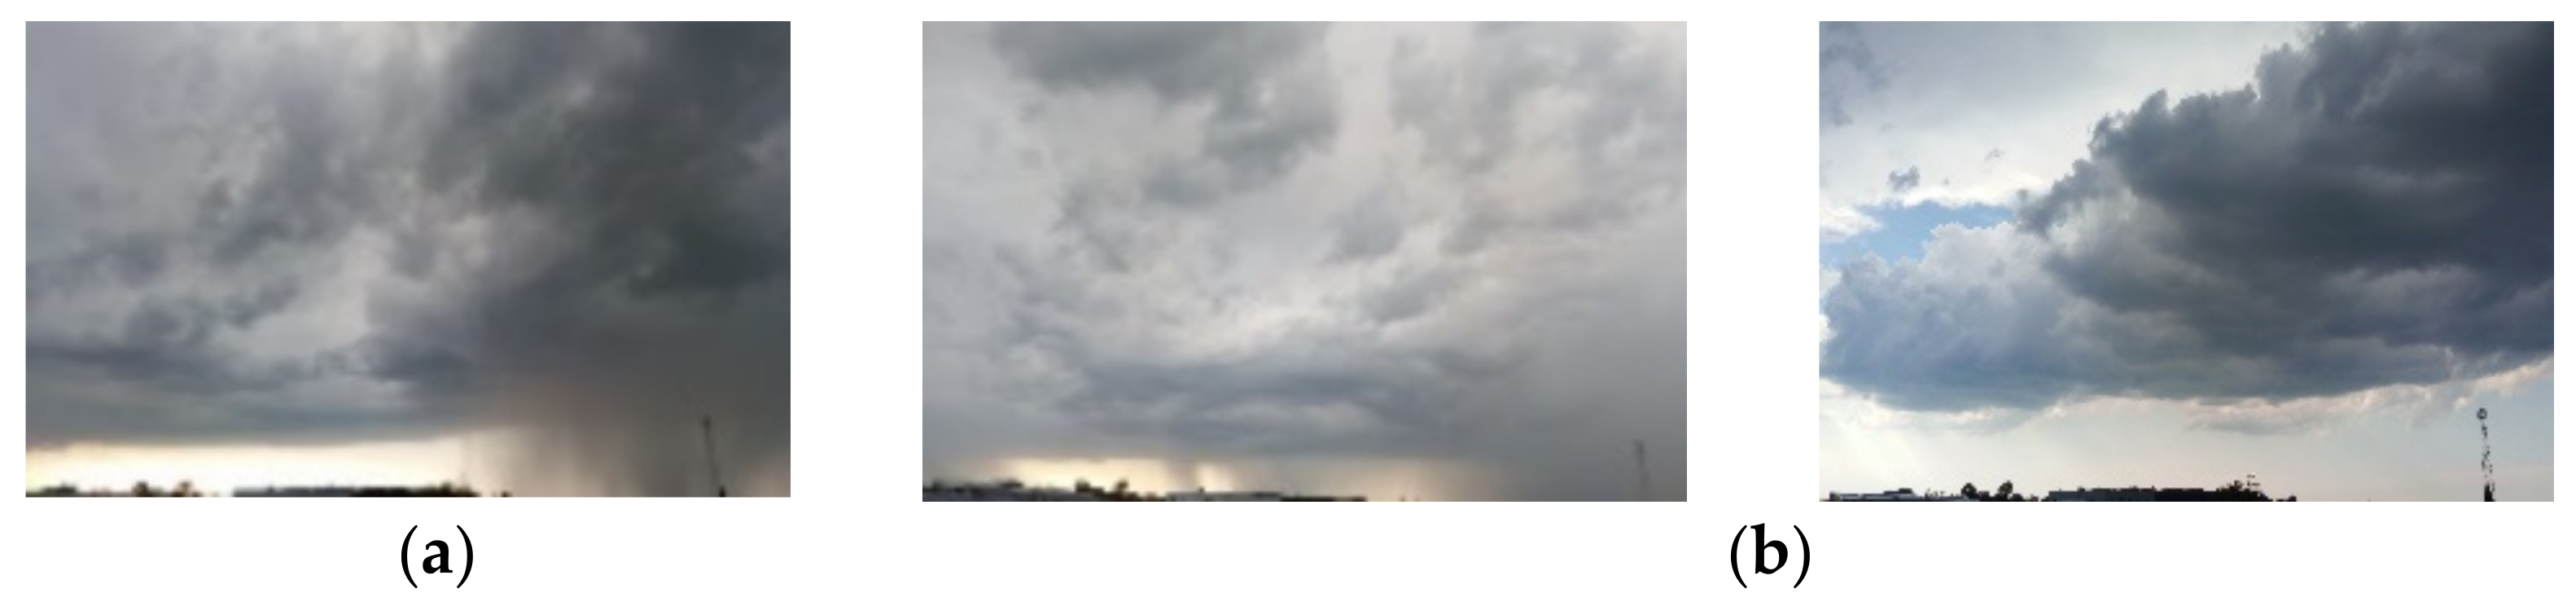
Ranged representative photos of “stormy sky” concept. (a) The p5- central scene. (b) The closest scenes—p4 and p6.
Figure A2.
Ranged representative photos of “stormy sky” concept. (a) The p5- central scene. (b) The closest scenes—p4 and p6.

Figure A3.
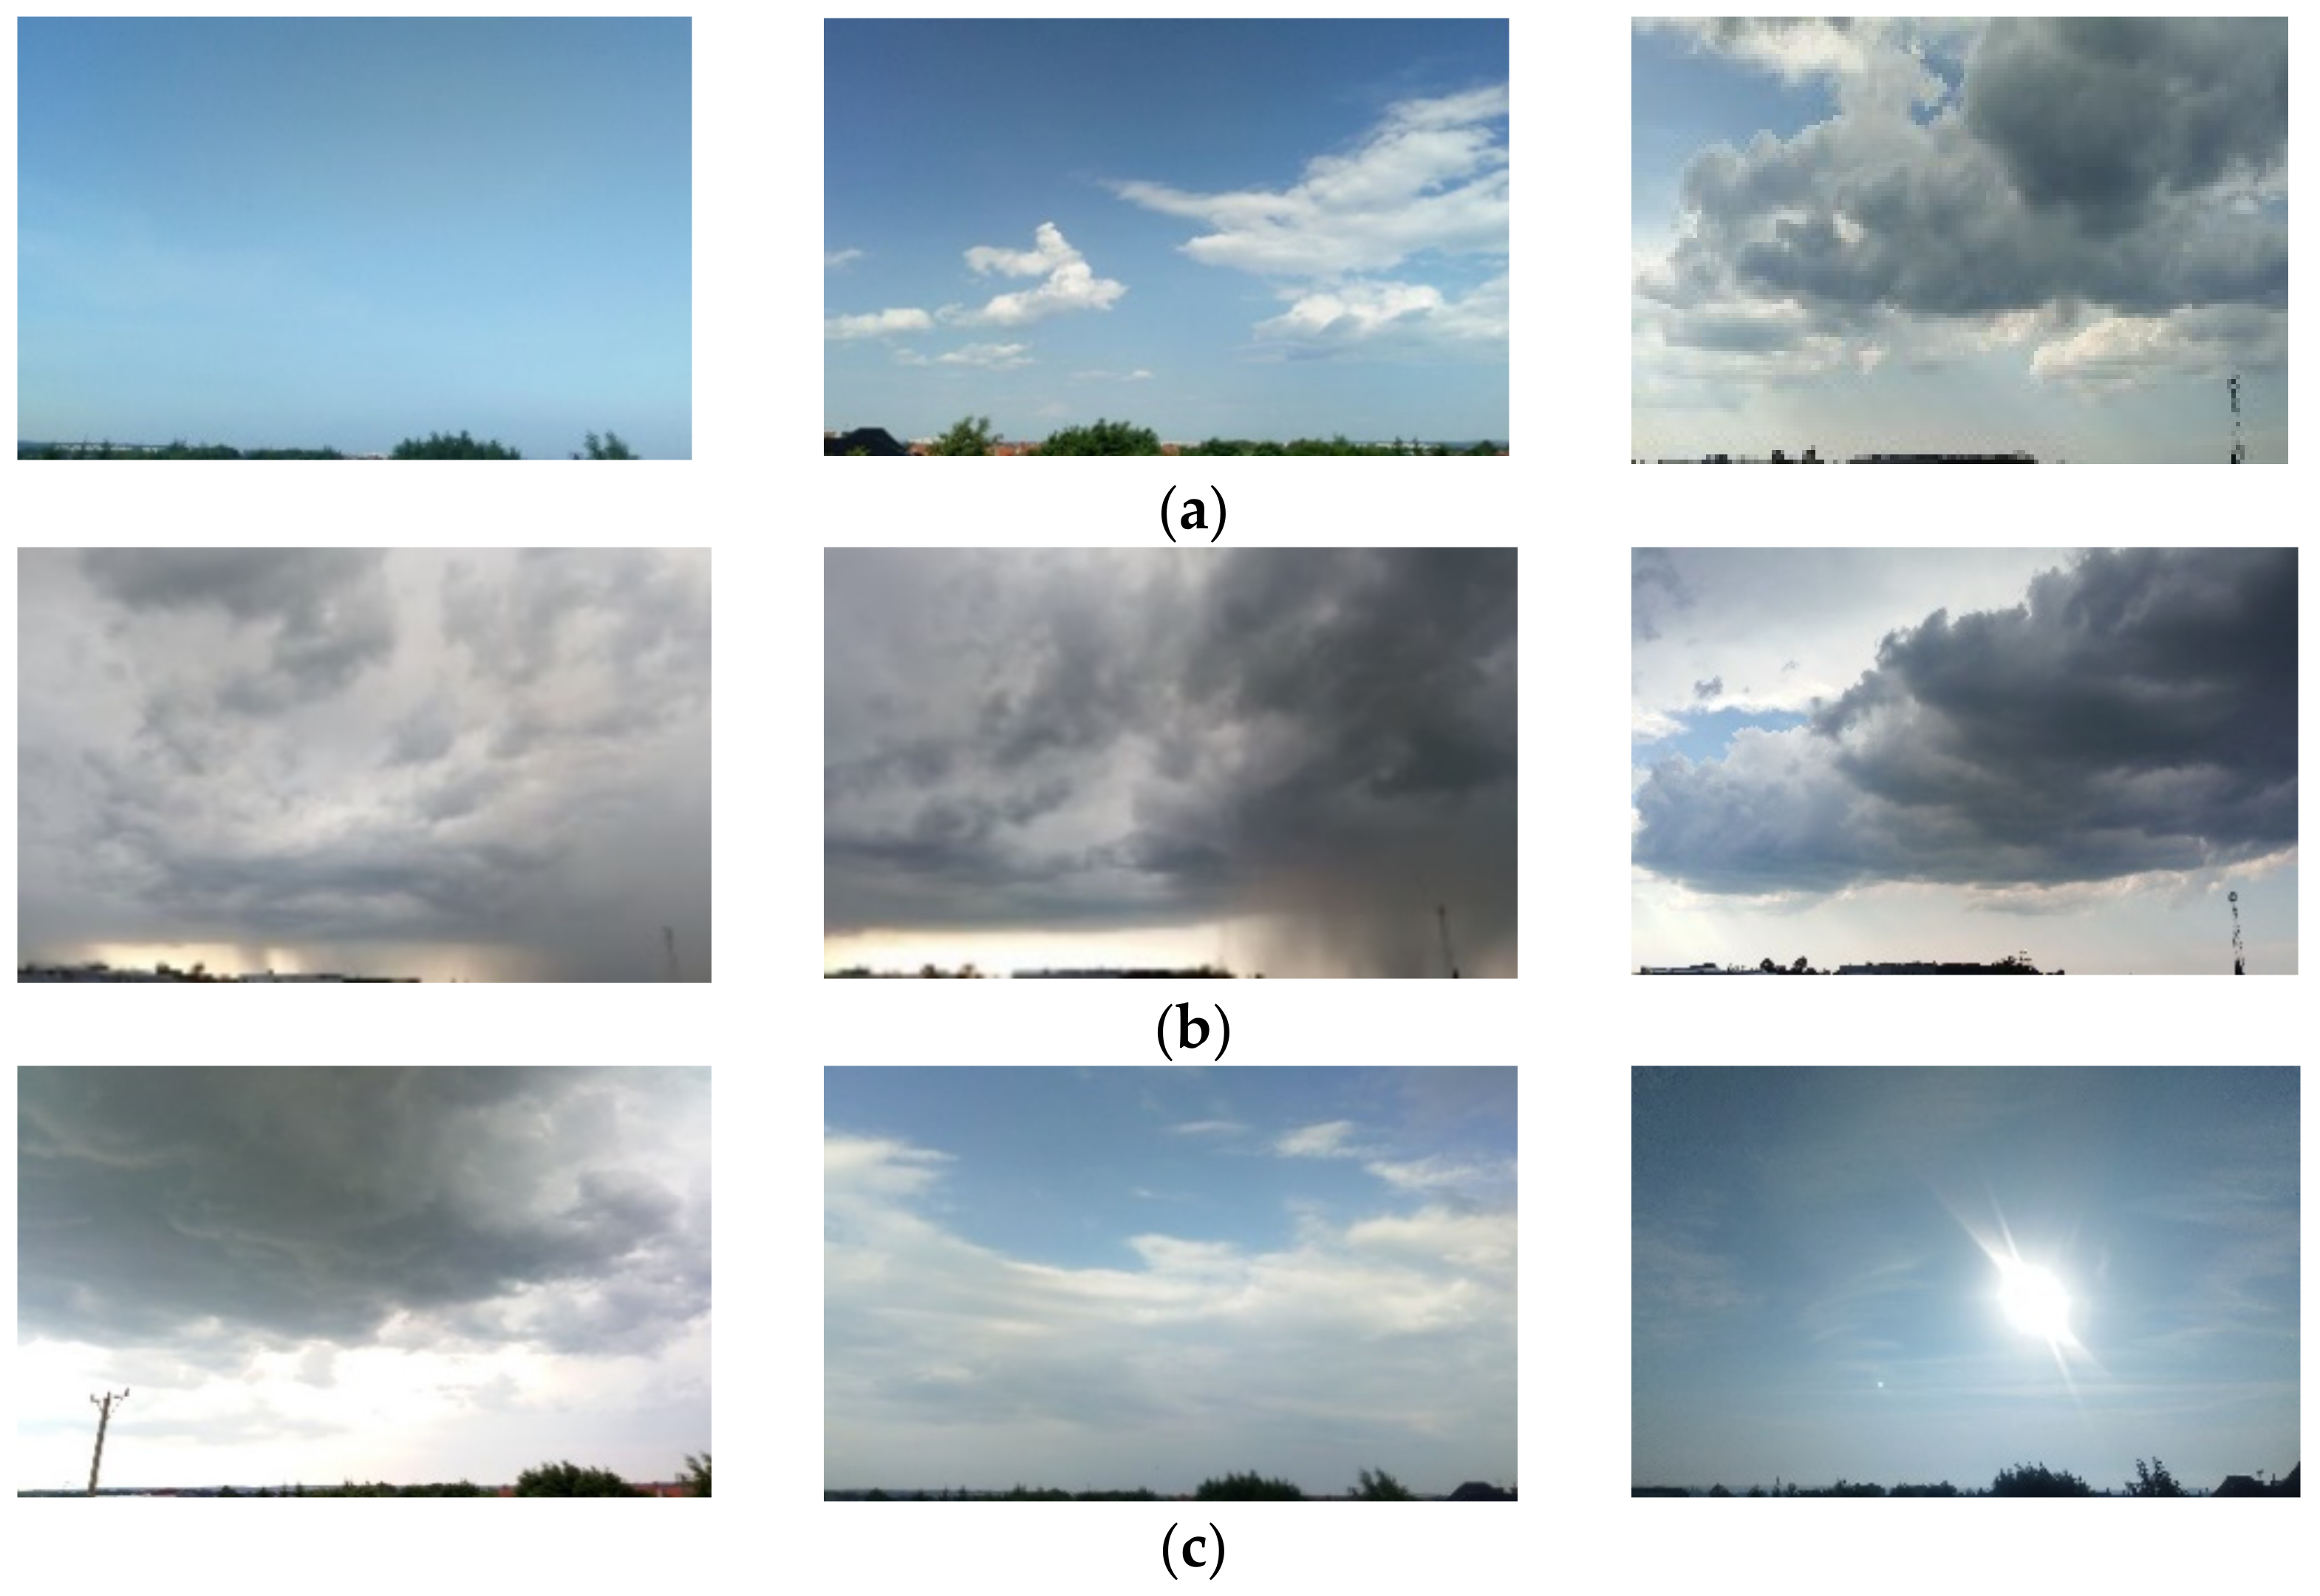
All the selected scenes. (a) Sky before the storm. (b) Stormy sky during the storm. (c) Sky after the storm.
Figure A3.
All the selected scenes. (a) Sky before the storm. (b) Stormy sky during the storm. (c) Sky after the storm.
References
- Van Bodegom, P.; Li, T.; Fabien, P. Special Issue editorial. Smart City Development and Remote Sensing Application in Urban Ecology. Remote Sens. 2021. Available online: https://0-www-mdpi-com.brum.beds.ac.uk/journal/remotesensing/special_issues/Smart_City_Development_and_RS_Application_Urban_Ecology (accessed on 2 February 2021).
- Beza, B.; Hernández-Garcia, J. From placemaking to sustainability citizenship: An evolution in the understanding of community realised public spaces in Bogotá’s informal settlements. J. Place Manag. Dev. 2018, 11, 192–207. [Google Scholar] [CrossRef]
- Lang, S. The Role of Placemaking in Sustainable Planning: A Case Study of the East Side of Cleveland, Ohio. Master’s Thesis, 2017. Available online: https://scholarworks.umass.edu/masters_theses_2/472 (accessed on 11 February 2021).
- Pilipczuk, O. Sustainable Smart Cities and Energy Management: The Labor Market Perspective. Energies 2020, 13, 6084. [Google Scholar] [CrossRef]
- Wesener, A.; Fox-Kämper, R.; Sondermann, M.; Münderlein, D. Placemaking in Action: Factors That Support or Obstruct the Development of Urban Community Gardens. Sustainability 2020, 12, 657. [Google Scholar] [CrossRef] [Green Version]
- Turvey, R. Place-making and sustainability in Ontario’s small urban municipalities. Int. J. Urban Sustain. Dev. 2017, 9, 286–299. [Google Scholar] [CrossRef]
- Global Risk Report 2020. Available online: http://www3.weforum.org/docs/WEF_Global_Risk_Report_2020.pdf (accessed on 10 February 2021).
- Dunkel, A.; Andrienko, G.; Andrienko, N.; Burghardt, D.; Hauthal, E.; Purves, R. A conceptual framework for studying collective reactions to events in location-based social media. Int. J. Geogr. Inf. Sci. 2019, 33, 780–804. [Google Scholar] [CrossRef]
- Marsden, T. Sustainable place-making for sustainability science: The contested case of agri-food and urban–rural relations. Sustain. Sci. 2013, 8, 213–226. [Google Scholar] [CrossRef]
- Jabłoński, A. (Ed.) Sustainable Business Models; MDPI: Basel, Switzerland, 2019; Available online: https://0-www-mdpi-com.brum.beds.ac.uk/journal/sustainability/specialissues/sustainablebusinessmodels (accessed on 12 February 2021).
- Golubchikov, O.; Thornbush, M. Artificial Intelligence and Robotics in Smart City Strategies and Planned Smart Development. Smart Cities 2020, 3, 1133–1144. [Google Scholar] [CrossRef]
- What Is Event Management? SAGE Publications Ltd.: London, UK, 2013; pp. 1–12. Available online: https://0-www-doi-org.brum.beds.ac.uk/10.4135/9781446270059.n1 (accessed on 26 February 2021).
- Rojek, C. What are the main types of event? In Event Power: How Global Events Manage and Manipulate; SAGE Publications Ltd.: London, UK, 2013; Available online: https://0-www-doi-org.brum.beds.ac.uk/10.4135/9781446270059.n2 (accessed on 26 February 2021).
- Richards, G.; Palmer, R. Why Cities Need to Be Eventful? Eventful Cities, 1st ed.; First Published; Imprint Routledge: London, UK, 2010; pp. 1–37. [Google Scholar]
- Cudny, W. Urban Events, Place Branding and Promotion, Place Event Marketing; Routledge: London, UK, 2019. [Google Scholar]
- Müller, M. What Makes an Event a Mega-Event? Definitions and Sizes. Leis. Stud. 2015, 34, 627–642. [Google Scholar] [CrossRef] [Green Version]
- Zacks, J.M.; Speer, N.K.; Swallow, K.M.; Braver, T.S.; Reynolds, J.R. Event perception: A mind-brain perspective. Psychol. Bull. 2007, 133, 273–293. [Google Scholar] [CrossRef] [PubMed] [Green Version]
- Zacks, J.M.; Tversky, B. Event structure in perception and conception. Psychol. Bull. 2001, 127, 3–21. [Google Scholar] [CrossRef] [PubMed] [Green Version]
- Shipley, T.F.; Zacks, J.M. (Eds.) Understanding Events: From Perception to Action; Oxford Series in Visual Cognition; Oxford University Press, 2008; Volume 4, Available online: https://0-doi-org.brum.beds.ac.uk/10.1093/acprof:oso/9780195188370.001.0001 (accessed on 12 February 2021).
- Griffiths, T.L.; Abbott, J.; Hsu, A. Exploring Human Cognition Using Large Image Databases. Top. Cogn. Sci. 2016, 8, 569–588. [Google Scholar] [CrossRef] [PubMed] [Green Version]
- Wimmer, M.; Maras, K.; Robinson, E.; Doherty, M.J.; Pugeault, N. How Visuo-Spatial Mental Imagery Develops: Image Generation and Maintenance. PLoS ONE 2015, 10, e0142566. [Google Scholar] [CrossRef] [PubMed] [Green Version]
- Peer, M.; Ron, Y.; Monsa, R.; Arzy, S. Processing of different spatial scales in the human brain. eLife 2019, 8, e47492. [Google Scholar] [CrossRef]
- Kosslyn, S.M. Image and Brain: The Resolution of the Imagery Debate; MIT Press: Cambridge, MA, USA, 1994. [Google Scholar]
- Kosslyn, S.M. Mental image. In Sensorium: Embodied Experience, Technology, and Contemporary Art; Jones, C.A., Ed.; MIT Press: Cambridge, MA, USA, 2006. [Google Scholar]
- Ganis, G.; Shendan, H. Visual Imagery. Wiley Interdisciplinary Reviews: Cognitive Science; John Wiley & Sons, Ltd.: Hoboken, NJ, USA, 2010. [Google Scholar]
- Walmsley, T.; Rose, A.; Wei, D. The Impacts of the Coronavirus on the Economy of the United States. Econ. Dis. Clim. Chang. 2020, 5, 1–52. [Google Scholar] [CrossRef]
- Maliszewska, M.; Mattoo, A.; van der Mensbrugghe, D. The Potential Impact of COVID-19 on GDP and Trade: A Preliminary Assessment; World Bank Policy Research Working Paper; The World Bank: Washington, DC, USA, 2020. [Google Scholar]
- Nagaj, R.; Korpysa, J. Impact of COVID-19 on the Level of Energy Poverty in Poland. Energies 2020, 13, 4977. [Google Scholar] [CrossRef]
- Global Economic Prospects. 2021. Available online: https://www.worldbank.org/en/publication/global-economic-prospects (accessed on 12 February 2021).
- Mahmood, S.; Hussain, T.; Mahmood, F.; Ahmad, M.; Majeed, A.; Beg, B.M.; Areej, S. Attitude, Perception, and Knowledge of COVID-19 among General Public in Pakistan. Front. Public Health 2020, 8, 602434. [Google Scholar] [CrossRef]
- Mondino, E.; Di Baldassarre, G.; Mård, J.; Ridolfi, E.; Rusca, M. Public perceptions of multiple risks during the COVID-19 pandemic in Italy and Sweden. Sci. Data 2020, 7, 434. [Google Scholar] [CrossRef]
- Delloite. The Social Impacts of COVID-19 Reset Not Restart: Taking Advantage of a Crisis for Social Change. 2020. Available online: https://www2.deloitte.com/content/dam/Deloitte/au/Documents/Economics/deloitte-au-dae-social-impact-of-covid-19-100820.pdf (accessed on 9 February 2021).
- Płomecka, M.; Jawaid, A.; Radziński, P.; Gobbi, S.; Neckels, R.; Baranczuk, Z. Mental Health Impact of COVID-19: A global study of risk and resilience factors. MedRxiv 2020. [Google Scholar] [CrossRef]
- Semo, B.; Frissa, S. The Mental Health Impact of the COVID-19 Pandemic: Implications for Sub-Saharan Africa. Psychol. Res. Behav. Manag. 2020, 13, 713–720. [Google Scholar] [CrossRef]
- Schäfer, S.; Sopp, M.; Schanz, C.; Staginnus, M.; Göritz, A.; Michael, T. Impact of COVID-19 on Public Mental Health and the Buffering Effect of a Sense of Coherence. Psychother. Psychosom. 2020, 89, 386–392. [Google Scholar] [CrossRef]
- The Impact of Covid-19 on Global Mental Health a Brief 2020, United for Global Mental Health. Available online: https://unitedgmh.org/sites/default/files/2020-09/The%2BImpact%2BOf%2BCovid-19%2BOn%2BGlobal%2BMental%2BHealth%2BReport.pdf (accessed on 12 February 2021).
- Morgül, E.; Kallitsoglou, A.; Essau, C. Psychological effects of the COVID-19 lockdown on children and families in the UK. Rev. Psicol. Clínica Niños Adolesc. 2020, 7, 42–48. [Google Scholar] [CrossRef]
- Basiago, A.D. Methods of defining “sustainability”. Sustain. Dev. 1995, 3, 109–119. [Google Scholar] [CrossRef]
- Pope, J.; Annandale, D.; Morrison-Saunders, A. Conceptualising sustainability assessment. Environ. Impact Assess. Rev. 2004, 24, 595–616. [Google Scholar] [CrossRef] [Green Version]
- Gibson, R.B. Beyond the pillars: Sustainability assessment as a framework for effective integration of social, economic and ecological considerations in significant decision-making. J. Environ. Assess. Policy Manag. 2006, 8, 259–280. [Google Scholar] [CrossRef]
- Waas, T.; Hugé, J.; Verbruggen, A.; Wright, T. Sustainable development: A bird’s eye view. Sustainability 2011, 3, 1637–1661. [Google Scholar] [CrossRef] [Green Version]
- Moldan, B.; Janoušková, S.; Hák, T. How to understand and measure environmental sustainability: Indicators and targets. Ecol. Indic. 2012, 17, 4–13. [Google Scholar] [CrossRef]
- Schoolman, E.D.; Guest, J.S.; Bush, K.F.; Bell, A.R. How interdisciplinary is sustainability research? Analyzing the structure of an emerging scientific field. Sustain. Sci. 2012, 7, 67–80. [Google Scholar] [CrossRef]
- Boyer, R.; Peterson, N.; Arora, P.; Caldwell, K. Five approaches to social sustainability and an integrated way forward. Sustainability 2016, 8, 878. [Google Scholar] [CrossRef] [Green Version]
- Stirling, A. The appraisal of sustainability: Some problems and possible responses. Local Environ. 1999, 4, 111–135. [Google Scholar] [CrossRef]
- Lehtonen, M. The environmental-social interface of sustainable development: Capabilities, social capital, institutions. Ecol. Econ. 2004, 49, 199–214. [Google Scholar] [CrossRef]
- Zijp, M.C.; Heijungs, R.; van der Voet, E.; Van de Meent, D.; Huijbregts, M.A.J.; Hollander, A.; Posthuma, L. An identification key for selecting methods for sustainability assessments. Sustainability 2015, 7, 2490–2512. [Google Scholar] [CrossRef] [Green Version]
- Arushanyan, Y.; Ekener, E.; Moberg, Å. Sustainability assessment framework for scenarios—SAFS. Environ. Impact Assess. Rev. 2017, 3, 23–34. [Google Scholar] [CrossRef]
- Ghavampour, E.; Vale, B. Revisiting the “Model of Place”: A Comparative Study of Placemaking and Sustainability. Urban Plan. 2019, 4, 196–206. [Google Scholar] [CrossRef]
- Richmond, L.; Zacks, J. Event Perception. 2018. Available online: https://www.oxfordbibliographies.com/view/document/obo-9780199828340/obo-9780199828340-0215.xml (accessed on 11 February 2021).
- Zacks, J. Event Perception. Scholarpedia 2008, 3, 3837. [Google Scholar] [CrossRef]
- Radvansky, G.A.; Zacks, J.M. Event perception. Wiley Interdiscip. Rev. Cogn. Sci. 2011, 2, 608–620. [Google Scholar] [CrossRef]
- Richmond, L.; Gold, D.; Zacks, J. Event Perception: Translations and Applications. J. Appl. Res. Mem. Cogn. 2017, 6, 111–120. [Google Scholar] [CrossRef] [PubMed]
- Huff, M.; Papenmeier, F. Event perception: From event boundaries to ongoing events. J. Appl. Res. Mem. Cogn. 2017, 6, 129–132. [Google Scholar] [CrossRef] [Green Version]
- Lee, E.H.; Kim, J. Development of New Inter-Event Time Definition Technique in Urban Areas. KSCE J. Civ. Eng. 2018, 22. [Google Scholar] [CrossRef]
- Joo, J.; Lee, J.; Kim, J.H.; Jun, H.; Jo, D. Inter-Event Time Definition Setting Procedure for Urban Drainage Systems. Water 2014, 6, 45–58. [Google Scholar] [CrossRef] [Green Version]
- Pilipczuk, O.; Nowakowski, M. Opinion Acquisition with Spatial Picture Measurement Scales. In Informatyka i Zarządzanie na Przełomie Wieków: Metody, Narzędzia, Systemy, Zastosowania; Parys, T., Ed.; ELIPSA: Warszaw, Poland, 2019; pp. 468–478. [Google Scholar]
- Müller-Seitz, G.; Schüßler, E. From event management to managing events. A process perspective on organized and unexpected field-level events. Managementforschung 2013, 23, 193–226. [Google Scholar]
- Gajdzik, B.; Grabowska, S.; Saniuk, S.; Wieczorek, T. Sustainable Development and Industry 4.0: A Bibliometric Analysis Identifying Key Scientific Problems of the Sustainable Industry 4.0. Energies 2020, 13, 4254. [Google Scholar] [CrossRef]
- Arvor, D.; Belgiu, M.; Falomir, Z.; Mougenot, I.; Durieux, L. Ontologies to interpret remote sensing images: Why do we need them? GIScience Remote Sens. 2019, 56, 911–939. [Google Scholar] [CrossRef] [Green Version]
- Fuhr, T.; Socher, G.; Scheering, C.; Sagerer, G. A Three-Dimensional Spatial Model for the Interpretation of Image Data. In Proceedings of the IJCAI-95 Workshop on Representation and Processing of Spatial Expressions, Montreal, QC, Canada, 20–25 August 1995; pp. 93–102. [Google Scholar]
- Bloch, I. Fuzzy spatial relationships for image processing and interpretation: A review. Image Vis. Comput. 2005, 23, 89–110. [Google Scholar] [CrossRef]
- Grishin, V.; Sula, A.; Ulieru, M. Pictorial analysis: A multi-resolution data visualization approach for monitoring and diagnosis of complex systems. Inf. Sci. 2003, 152, 1–24. [Google Scholar] [CrossRef]
- Hu, Y.; Gao, S.; Janowicz, K.; Yu, B.; Li, W.; Prasad, S. Extracting and understanding urban areas of interest using geotagged photos. Comput. Environ. Urban Syst. 2015, 54, 240–254. [Google Scholar] [CrossRef]
- Wang, W.; Stewart, K. Spatiotemporal and semantic information extraction from web news reports about natural hazards. Comput. Environ. Urban Syst. 2015, 50, 30–40. [Google Scholar] [CrossRef]
- Vasseur, L.; Thornbush, M.; Plante, S. Gender-Based Experiences and Perceptions after the 2010 Winter Storms in Atlantic Canada. Int. J. Environ. Res. Public Health 2015, 12, 12518–12529. [Google Scholar] [CrossRef] [Green Version]
- Cai, Z.; Zheng, S.; Huang, Y.; Zhang, X.; Qiu, Z.; Huang, A.; Wu, K. Emotional and Cognitive Responses and Behavioral Coping of Chinese Medical Workers and General Population during the Pandemic of COVID-19. Int. J. Environ. Res. Public Health 2020, 17, 6198. [Google Scholar] [CrossRef]
- Richardson, D.; Spivey, M.; Barsalou, L.; McRae, K. Spatial representations activated during real-time comprehension of verbs. Cogn. Sci. 2003, 27, 767–780. [Google Scholar] [CrossRef]
- Kobrinskii, B. Simvolno-obraznyi podchod v iskusstvennom intellekte. Fiz-mat Lit. 2000, 2, 601–608. [Google Scholar]
- Kobrinskii, B. Obraznye riady kak element bazy znanii. In Proceedings of the “Iskusstvennyi Intelekt Segodnya–Problemy i Perspektivy” Conference, Moscow, Russia, 4–5 December 2007; pp. 393–397. [Google Scholar]
- Chen, J.; Dowman, I.; Li, S.; Li, Z.; Madden, M.; Mills, J.; Paparoditis, N.; Rottensteiner, F.; Sester, M.; Trinder, J.; et al. Information from Imagery: ISPRS Scientific Vision and Research Agenda. ISPRS J. Photogramm. Remote Sens. 2016, 115, 3–21. [Google Scholar] [CrossRef] [Green Version]
- Kuhn, W.; Raubal, M.; Gardenfors, P. Editorial: Cognitive Semantics and Spatio-Temporal Ontologies. Spat. Cogn. Comput. 2007, 7, 3–12. [Google Scholar] [CrossRef]
- Bhatta, B. Remote Sensing and GIS; Oxford University Press: New Delhi, India, 2008; pp. 278–289. [Google Scholar]
- Huang, H.; Chen, J.; Li, Z.; Gong, F.; Chen, N. Ontology-Guided Image Interpretation for GEOBIA of High Spatial Resolution Remote Sense Imagery: A Coastal Area Case Study. ISPRS Int. J. Geo-Inf. 2017, 6, 105. [Google Scholar] [CrossRef] [Green Version]
- Jenson, J. Remote Sensing of the Environment, 2nd ed.; Pearson Prentice Hall: Upper Saddle River, NJ, USA, 2007. [Google Scholar]
- Neto, S.L.; Wangenheim, A.V.; Comunello, E.; Pereira, E. Methodology for Automatic Observation of Sky Patterns. 2009. Available online: https://www.semanticscholar.org/paper/Methodology-for-Automatic-Observation-of-sky-Neto-Wangenheim/bd146c108e42805c41c0a73cdad50355b65966a2 (accessed on 8 February 2021).
- Bostrom, A.; Morss, R.; Lazo, J.; Demuth, J.; Lazrus, H.; Hudson, R. A Mental Models Study of Hurricane Forecast and Warning Production, Communication, and Decision-Making. Weather Clim. Soc. 2016, 8, 111–129. [Google Scholar] [CrossRef]
- Trilok, J. Concept of Happy City: The Smart Cities of the Future. SSRN Electron. J. 2019. [Google Scholar] [CrossRef]
- The Global Happiness Council. Global Happiness Policy Report 2018; The Global Happiness Council, Sustainable Development Solutions Network: New York, NY, USA, 2018. [Google Scholar]
- Montgomery, C. Happy City: Transforming Our Lives through Urban Design Best Seller; Farrar, Straus and Giroux: New York, NY, USA, 2013. [Google Scholar]
- Papageorgiou, K.; Singh, P.K.; Papageorgiou, E.; Chudasama, H.; Bochtis, D.; Stamoulis, G. Fuzzy Cognitive Map-Based Sustainable Socio-Economic Development Planning for Rural Communities. Sustainability 2020, 12, 305. [Google Scholar] [CrossRef] [Green Version]
- Lourdel, N.; Gondran, N.; Laforest, V.; Debray, B.; Brodhag, C. Sustainable development cognitive map: A new method of evaluating student understanding. Int. J. Sustain. High. Educ. 2007, 8, 170–182. [Google Scholar] [CrossRef]
- Liu, L.; Zhou, B.; Zhao, J.; Brent, D. Ryan C-IMAGE: City cognitive mapping through geo-tagged photos. GeoJournal 2016, 81, 817–861. [Google Scholar] [CrossRef] [Green Version]
- Ladeira, M.; Ferreira, F.; Ferreira, J.; Fang, W.; Falcão, P.F.; Rosa, Á.A. Exploring the determinants of digital entrepreneurship using fuzzy cognitive maps. Int. Entrep. Manag. J. 2019, 15, 1077–1101. [Google Scholar] [CrossRef]
- Peter, E.C., Jr. Perception and Age. Gerontologist 1967, 7, 73–77. [Google Scholar] [CrossRef]
- Kozhevnikov, M.; Kosslyn, S.; Shephard, J. Spatial versus object visualizers: A new characterization of visual cognitive style. Mem. Cogn. 2005, 33, 710–726. [Google Scholar] [CrossRef] [Green Version]
- Shorey, S.; Ang, E.; Yamina, A.; Tam, C. Perceptions of public on the COVID-19 outbreak in Singapore: A qualitative content analysis. J. Public Health 2020, 42, 665–671. [Google Scholar] [CrossRef] [PubMed]
- Bruine de Bruin, W. Age Differences in COVID-19 Risk Perceptions and Mental Health: Evidence from a National, U.S. Survey Conducted in March 2020. J. Gerontol. Ser. B 2021, 76, e24–e29. [Google Scholar] [CrossRef] [PubMed]
- Lanciano, T.; Graziano, G.; Curci, A.; Costadura, S.; Monaco, A. Risk Perceptions and Psychological Effects during the Italian COVID-19 Emergency. Front. Psychol. 2020, 11, 580053. [Google Scholar] [CrossRef] [PubMed]
- Stutzer, A. Happiness and public policy: A procedural perspective. Behav. Public Policy 2020, 4, 210–225. [Google Scholar] [CrossRef] [Green Version]
- Adler, A.; Seligman, M. Using wellbeing for public policy: Theory, measurement, and recommendations. Int. J. Wellbeing 2016, 6, 1–35. [Google Scholar] [CrossRef] [Green Version]
- Malek, J.A.; Lim, S.B.; Yigitcanlar, T. Social Inclusion Indicators for Building Citizen-Centric Smart Cities: A Systematic Literature Review. Sustainability 2021, 13, 376. [Google Scholar] [CrossRef]
- Zakzak, L. Citizen-centric Smart City Development: The Case of Smart Dubai’s “Happiness Agenda”. In Proceedings of the 20th Annual International Conference on Digital Government Research, Dubai, United Arab Emirates, 18–20 June 2019; pp. 141–147. [Google Scholar] [CrossRef]
Figure 1.
The conceptual interpretation of sustainable event management in smart cities for perception evaluation.
Figure 1.
The conceptual interpretation of sustainable event management in smart cities for perception evaluation.

Figure 2.
The framework for event perception evaluation.

Figure 3.
Natural phenomenon image interpretation ontology.

Figure 4.
The framework for image interpretation to describe the concept of “stormy sky”.
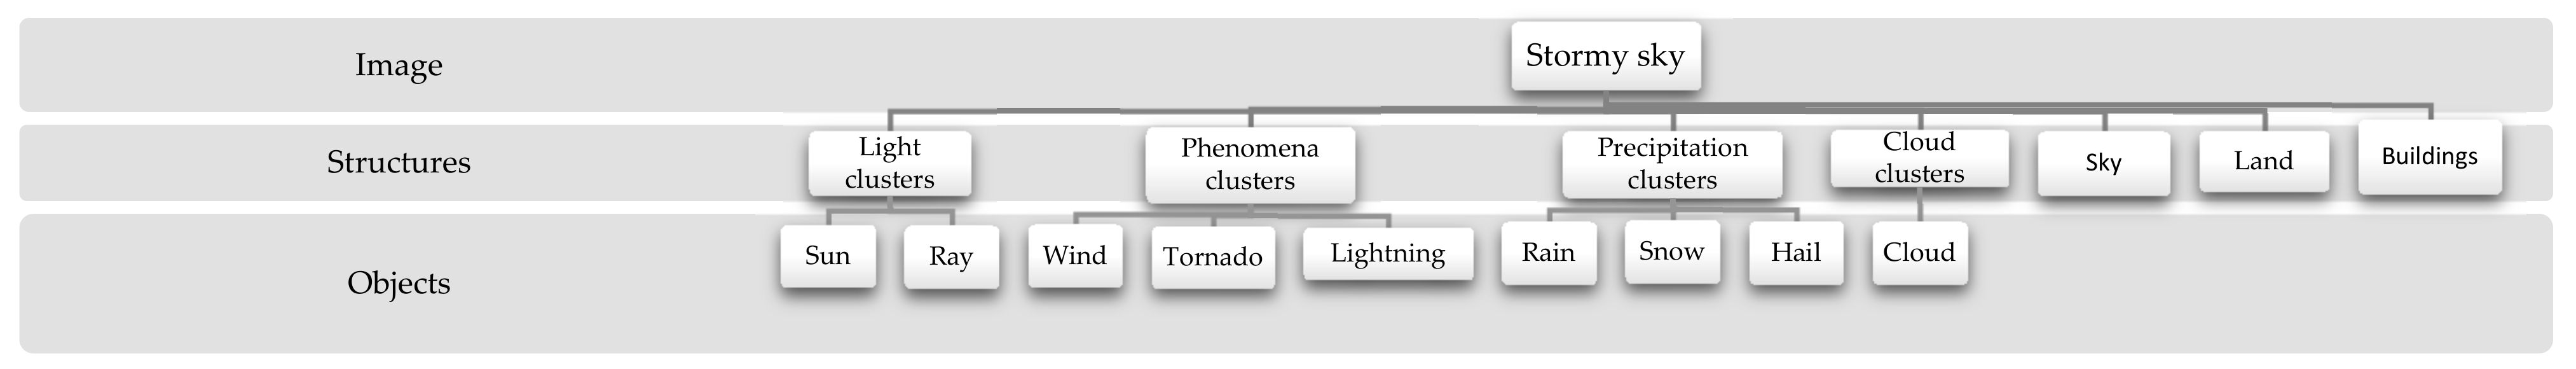
Figure 5.
The examples of the representative images of “stormy sky”. Source: own preparation based on work.
Figure 5.
The examples of the representative images of “stormy sky”. Source: own preparation based on work.

Figure 6.
The example of spatial–temporal scale for global event perception evaluation based on nine-stage storm phenomenon.
Figure 6.
The example of spatial–temporal scale for global event perception evaluation based on nine-stage storm phenomenon.
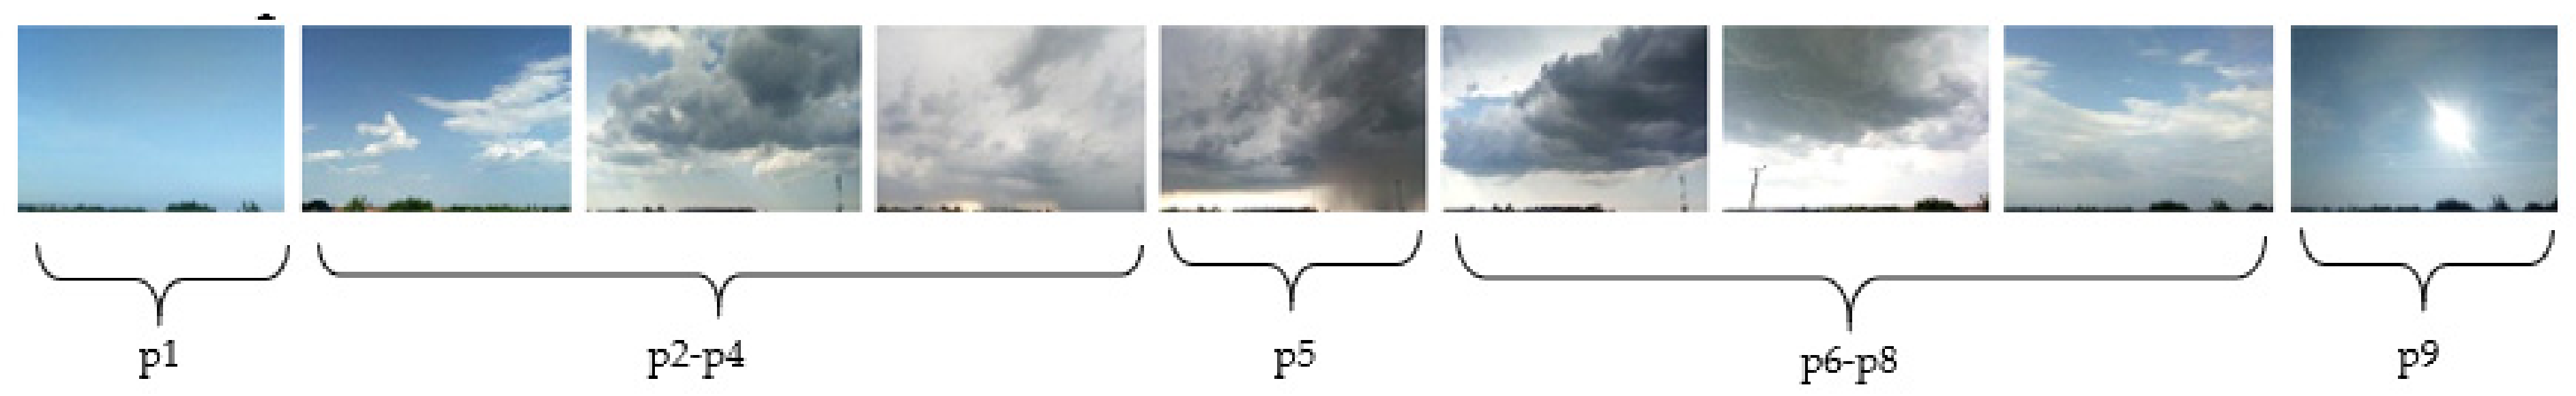
Figure 7.
Natural event segmentation procedure.
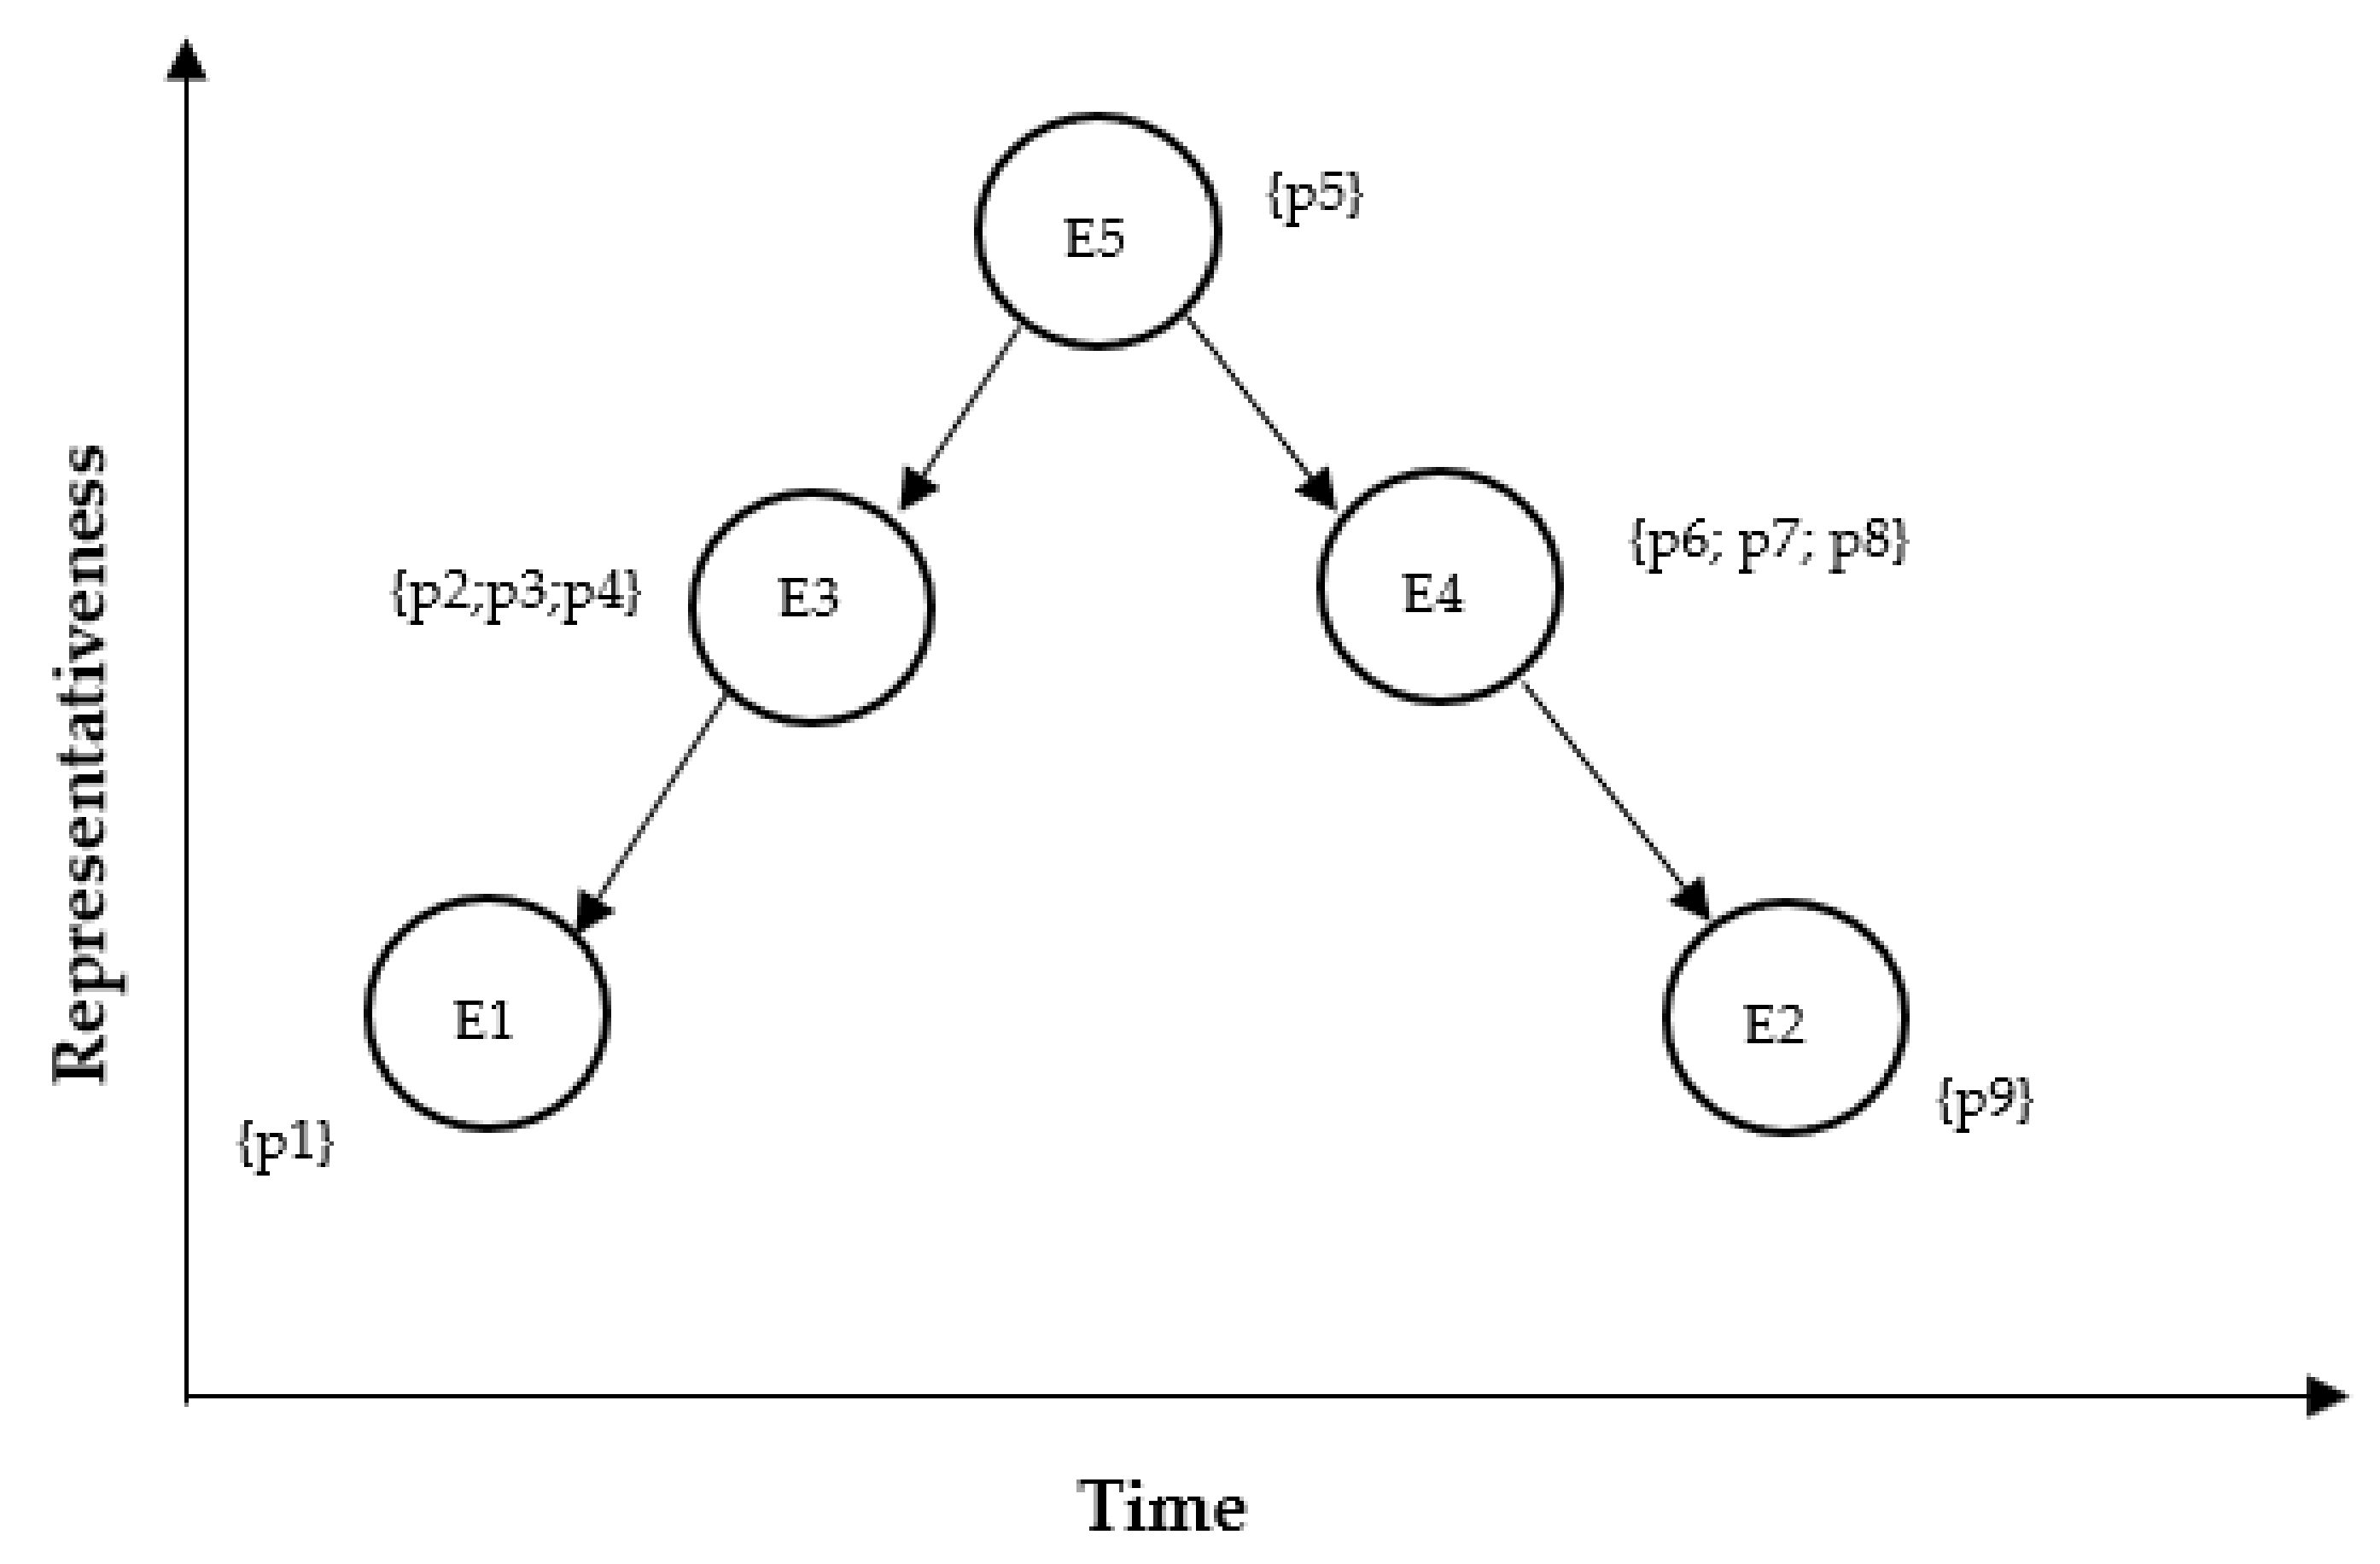
Figure 8.
The graphical presentation of the impact of the urban event perception factors.
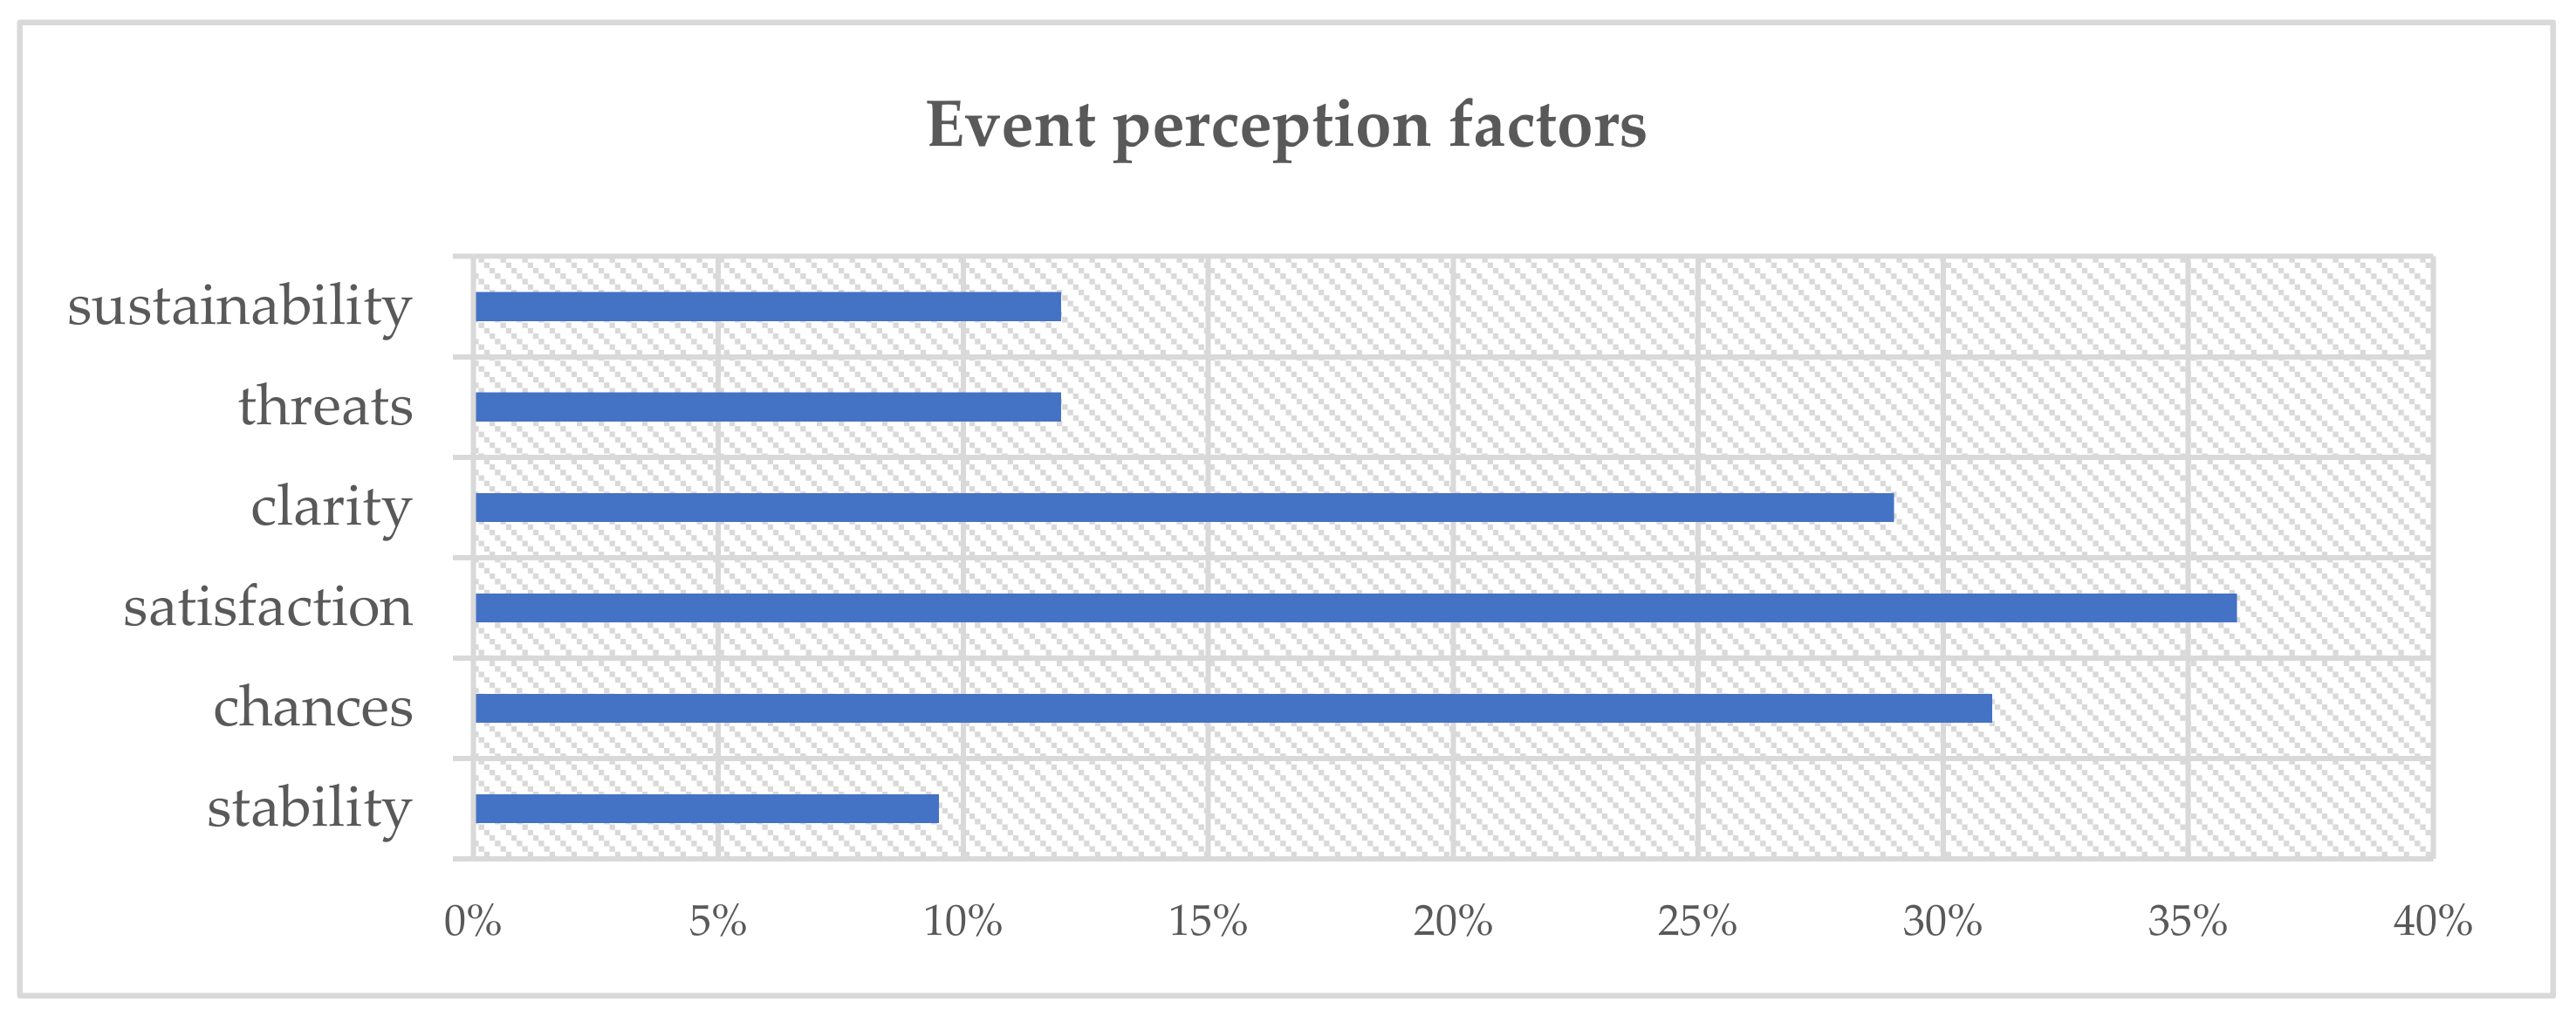
Figure 9.
Cognitive map of global event perception by urban community.


Table 1.
The literature review summary.
| Concept | Core Elements Used for Framework | Source |
|---|---|---|
| Economic Perspective | ||
| Event perception | “Events are key components of perception, attention, and memory”. The term event perception encompasses a range of phenomena involving the processing of temporally extended, dynamic information” [51], p. 1. “Perception–roughly hierarchical process in which sensory information is transformed into representations. Particularly important are representations of states of the world. The spatial and temporal boundaries of events also can be fuzzy” [17], p. 2. | [17,18,19,51,52,53,54] |
| Event management | “Event management refers to the targeting and managing of designed public events geared to invest emotional energies and economic resources to selected goals” [12], p. 1. | [12,13,14,15,16,58] |
| Event segmentation | “Event segmentation arises from the perceptual processing stream. In the visual modality, this corresponds to basic information about brightness, color, edge extraction” [17], p. 2. | [17], p. 2 |
| Sustainability | According to different scientific sources the concept of ‘sustainability’ includes the three interconnected groups of goals: economic, social, and environmental. These groups are presented and explained in literature in different way: mainly as the “pillars”, dimensions, etc. | [10,38,39,40,41,42,43,44,45,46,47,59] |
| Semantic Perspective | ||
| Ontology | “Knowledge representation in formal ontologies must approach experts’ cognitive semantics to capture how humans conceptualize geographic features” [60]. Ontologies used in the geographic domain may include spatial and/or temporal information [60]. Spatial reasoning can be defined as “the domain of spatial knowledge representation, in particular spatial relations between spatial entities, and of reasoning on these entities and relations” [61], p. 89. | [60], p. 926 [60], p. 918, [61,62] |
| Pictorial analysis | A multi-resolution data visualization approach for monitoring and diagnosis of complex systems. | [63] |
| Place semantics | Place semantics can be studied from thematic, spatial, and temporal perspectives or their combination [64]. “By combining space, time, and thematic topics to obtain a more comprehensive understanding on places and the associated events” [64]. “By combining time and theme, the evolution of topics over time could be explored, such as the emergence of new topics and the disappearance of old ones” [64]. | [64] |
| Landmark recognition | Landmark recognition method attempted to match landmark photos based on visual features, after filtering a set of images based on their location context. | [5,17,25,27] |
| Social symbol grounding | “Social symbol grounding refers to the ability to communicate with other systems by the creation of a shared lexicon of perceptually-grounded symbols” [60]. Scientists claim that cognition is embodied—that is, symbols must be grounded on perceptual, motoric, and emotional experience. The semantic image interpretation can be seen as a symbol grounding problem. In this context, ontologies provide a powerful framework to represent domain knowledge, concepts, and their relations, and to reason about them. The artificial intelligence is useful tool for symbol grounding. | [17,60,62] |
| Natural phenomenon perception and interpretation | Natural hazards are almost always associated with the risk and disaster. Most research is concentrated on risk/loss perception. The natural phenomena which could be used to describe the perception on global economic event should be selected depending on it scale, intensity, and risk level. It should be possible to describe development of this phenomena in time and space using the pictures. There are differences in perception of natural phenomena. Some groups are more vulnerable to climate change and extreme events, [66], p. 12519. | [65,66] |
| Cognitive Perspective | ||
| Response analysis | The response to the event has significant meaning for citizens. In the paper of Cai et al., the authors established an SEM of the associations among emotional response, cognitive response, and behavioral coping [67]. Firstly, emotional response as a respective factor for psychological health. Secondly, cognitive response consisted of paranoia and obsessive compulsion. The third area was the style of the population [67]. | [67] |
| Collective reaction | In 2019, Dankel et al. proposed the conceptual framework for study the collective reactions on the Brexit event with spatial images extracted from Flickr database. | [8] |
| Representativeness analysis | A common proposal in cognitive psychology is that people use representativeness, a similarity-based heuristic, to make these decisions. The image representativeness could be calculated. | [68] |
| Kobrinskii approach | In 2000 and 2008, Kobrinskii proposed the symbolic-image approach to knowledge base creation by using the symbolic ranges. According to his approach, the holistic picture created in mind has many related images which can be ranged according to associations and posted in the knowledgebase. | [69,70] |
| Spatial-temporal measurement scale | In 2019, Pilipczuk and Nowakowski have checked the possibility of using the spatial–temporal measurement scales with storm evolution images to study the citizen’s opinions on the current economic and technologic situation in Poland in 2018. The authors proved that this scale could be used for opinion acquisition. | [57] |
Publisher’s Note: MDPI stays neutral with regard to jurisdictional claims in published maps and institutional affiliations. |
© 2021 by the author. Licensee MDPI, Basel, Switzerland. This article is an open access article distributed under the terms and conditions of the Creative Commons Attribution (CC BY) license (https://creativecommons.org/licenses/by/4.0/).
Share and Cite
MDPI and ACS Style
Pilipczuk, O. A Conceptual Framework for Large-Scale Event Perception Evaluation with Spatial-Temporal Scales in Sustainable Smart Cities. Sustainability 2021, 13, 5658. https://0-doi-org.brum.beds.ac.uk/10.3390/su13105658
AMA Style
Pilipczuk O. A Conceptual Framework for Large-Scale Event Perception Evaluation with Spatial-Temporal Scales in Sustainable Smart Cities. Sustainability. 2021; 13(10):5658. https://0-doi-org.brum.beds.ac.uk/10.3390/su13105658
Chicago/Turabian StylePilipczuk, Olga. 2021. "A Conceptual Framework for Large-Scale Event Perception Evaluation with Spatial-Temporal Scales in Sustainable Smart Cities" Sustainability 13, no. 10: 5658. https://0-doi-org.brum.beds.ac.uk/10.3390/su13105658
Note that from the first issue of 2016, this journal uses article numbers instead of page numbers. See further details here.