
Soiling Comparison of Mirror Film and Glass Concentrating Solar Power Reflectors in Southwest Louisiana


Department of Mechanical Engineering, University of Louisiana at Lafayette, Lafayette, LA 70504, USA
*
Author to whom correspondence should be addressed.
Sustainability 2021, 13(10), 5727; https://0-doi-org.brum.beds.ac.uk/10.3390/su13105727
Submission received: 15 April 2021
/
Revised: 10 May 2021
/
Accepted: 18 May 2021
/
Published: 20 May 2021
(This article belongs to the Topic Nanomaterials for Sustainable Energy Applications)
Abstract
:Soiling effects influence the output of solar thermal plants, significantly causing unwanted transmittance, reflectance, and absorbance losses. Research is needed to identify what type of reflective surfaces are best suited for semitropical climates, such as the southeastern United States. This paper initially presents a review of several concentrating solar power (CSP) reflector testbeds used to analyze the soiling effects of various reflective materials. A soiling testbed is developed for this study that comprised six sets of reflective surfaces mounted at a fixed tilt of 30 degrees: three sets of thin-film surfaces and three sets of glass types. Two generations of 3M solar mirror film (SMF), 3M SMF 1100 and 3M SMF 2020, were used along with Konica Minolta SMF, silvered Corning Willow Glass, a dichroic cold mirror, and a standard mirror. Results show that the 3M SMF 2020 and Konica Minolta SMF performed the best during regular cleaning intervals, whereas the silvered Corning Willow Glass gave the best performance if only cleaned naturally. The other glass types showed the least average loss due to soiling throughout this study but gave the lowest performance for specular reflection.
1. Introduction
Concentrating solar power (CSP) parabolic troughs are used to convert solar energy to transportable thermal energy. The more energy that is reflected to the receiver, the more energy that is converted in the form of heat. With this information, CSP plants can weigh the cost of cleaning the reflectors versus the efficiency of the reflectors when cleaned. Soiling, or degradation of the reflectiveness of the concentrating reflectors, has a direct effect on the performance of CSP plants. The soiling that occurs in CSP plants is a significant factor influencing component and system reliability, thermal efficiency degradation, and mitigation of maintenance costs for the reflectors. Many factors affect the rate and nature of soiling, including location, time, mirror orientation, rainfall, wind, temperature, relative humidity, and the substances in the atmosphere [1,2]. Dust can be a significant problem in dry regions with little precipitation, whereas rainfall, wind, and gravity help self-cleaning in wet climate regions [3]. The most influential parameters on surface erosion phenomenon were found to be wind speed and direction [4]. However, wind speed and humidity were not shown to be good indicators of optical losses as there was no linear correlation found to soiling [5]. The soiling effect lowers the optical efficiency of the reflectors, which results in less of the available solar radiation being reflected onto the absorber tube. This results in a smaller energy output and an increase in the levelized cost of electricity.
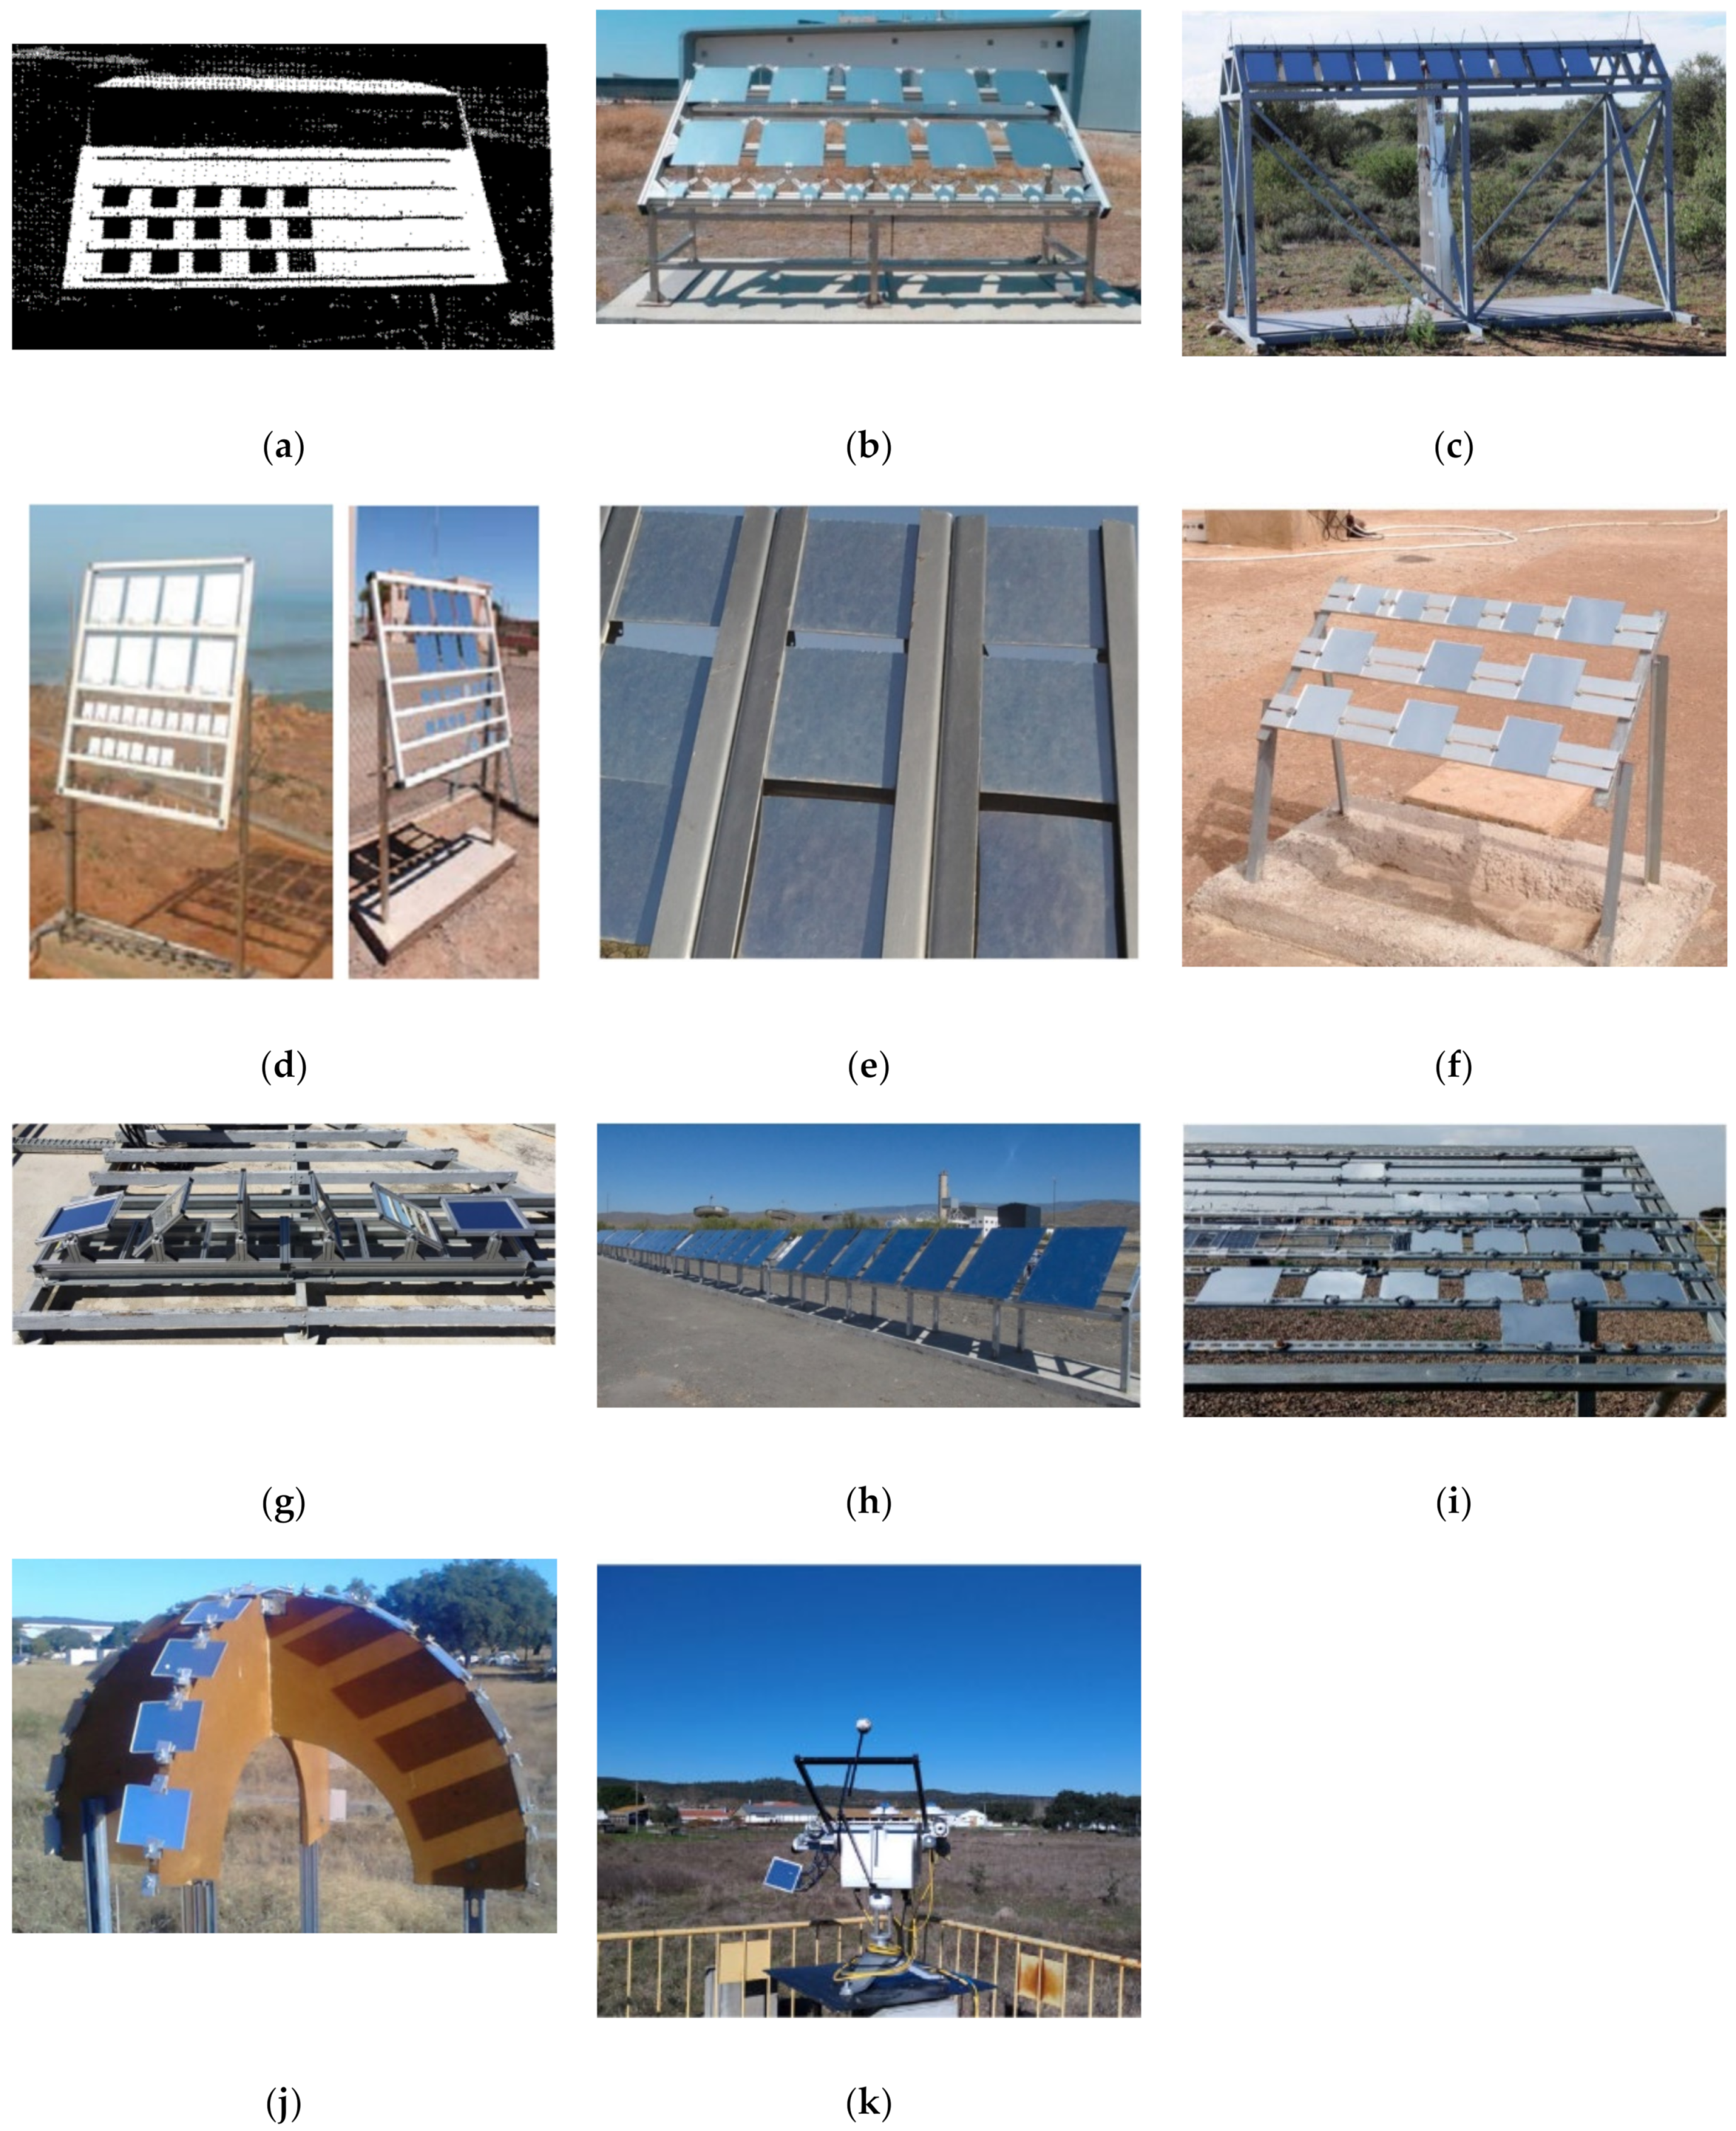
Reflector testbeds are used to study the effects of soiling in different geographical and climate regions. Multiple types of outdoor tests have been performed on reflective materials in CSP plants, including using different cleaning strategies [1,6,7,8,9], different reflectometers [10,11,12,13], different reflective materials [4,14,15,16,17,18,19], degradation effects from soiling [5], soiling adhesion [20,21], anti-soiling coatings [22,23], and the use of a real-time cleanliness sensor [24,25,26]. Various testbeds have been constructed to study the different effects of soiling on reflectors in different climate regions. In Figure 1 below, testbeds from Australia, Morocco, Portugal, Spain, South Africa, and the United States are shown.
The most common testbed design was found to be fixed tilt, with the tilt similar to the latitude where this study was conducted. This design allows for multiple rows of reflector panels to be easily cleaned and tested for multiple types of outdoor studies. Table 1 presents the location, studied technology, and main findings of studies of the reflector testbeds shown in Figure 1.
Soiling on solar reflectors is controlled by several factors, including soil parent material, microclimate, and frequency and intensity of dust events. A proper cleaning method is needed to keep a suitable average mirror reflectance and solar efficiency level [6]. Therefore, frequent reflector washing is required, and the effectiveness of the washing varies with location and time of year. The solar specular reflectance should be kept at its highest level to ensure high global yield, but economically keeping the solar collectors clean is the biggest maintenance challenge for CSP technology [28,32]. An economic analysis was performed at the Kramer Junction solar power park located in Boron, California, and it indicated that maintaining an average field reflectivity above 90% is cost effective [33]. There are many issues related to sustaining the CSP performance due to soiling, and technologies are continually being developed to keep the reflectors clean with minimal use of water [34].
The purpose of this research is to study the effects of short-term and long-term soiling in the southeastern United States on different thin-film and glass-type solar reflectors used in CSP plants. This research is significant not only because of the unique climatic region but also because studying several different thin-film and glass-type solar reflectors side by side is a novel variation. This paper initially presents a literature review of reflector soiling and testbeds developed for studying. In Section 2, cleaning applications are introduced along with the soiling rate calculation. The experimental methodology and testbed design is presented in Section 3 followed by the comparative analysis results. The last sections summarize the main findings and conclusions of this study.
2. Soiling Rate
To counteract excessive soiling, the reflectors must be cleaned regularly. In a previous study of different cleaning methods in a semi-arid region of the Tabernas Desert in southern Spain, the most effective method was found to be using deionized water and a brush; this resulted in an average efficiency of 98.8% in rainy periods and 97.2% in dry seasons [6]. As types of soiling materials vary with regions, and the cleaning methods and frequency will also vary. However, in a study that collected dust and sand from Europe, the Middle East, and the Americas, it was found that a soft cleaning brush with a small amount of water was the most effective way to clean thin-film reflectors without inflicting surface damage [35].
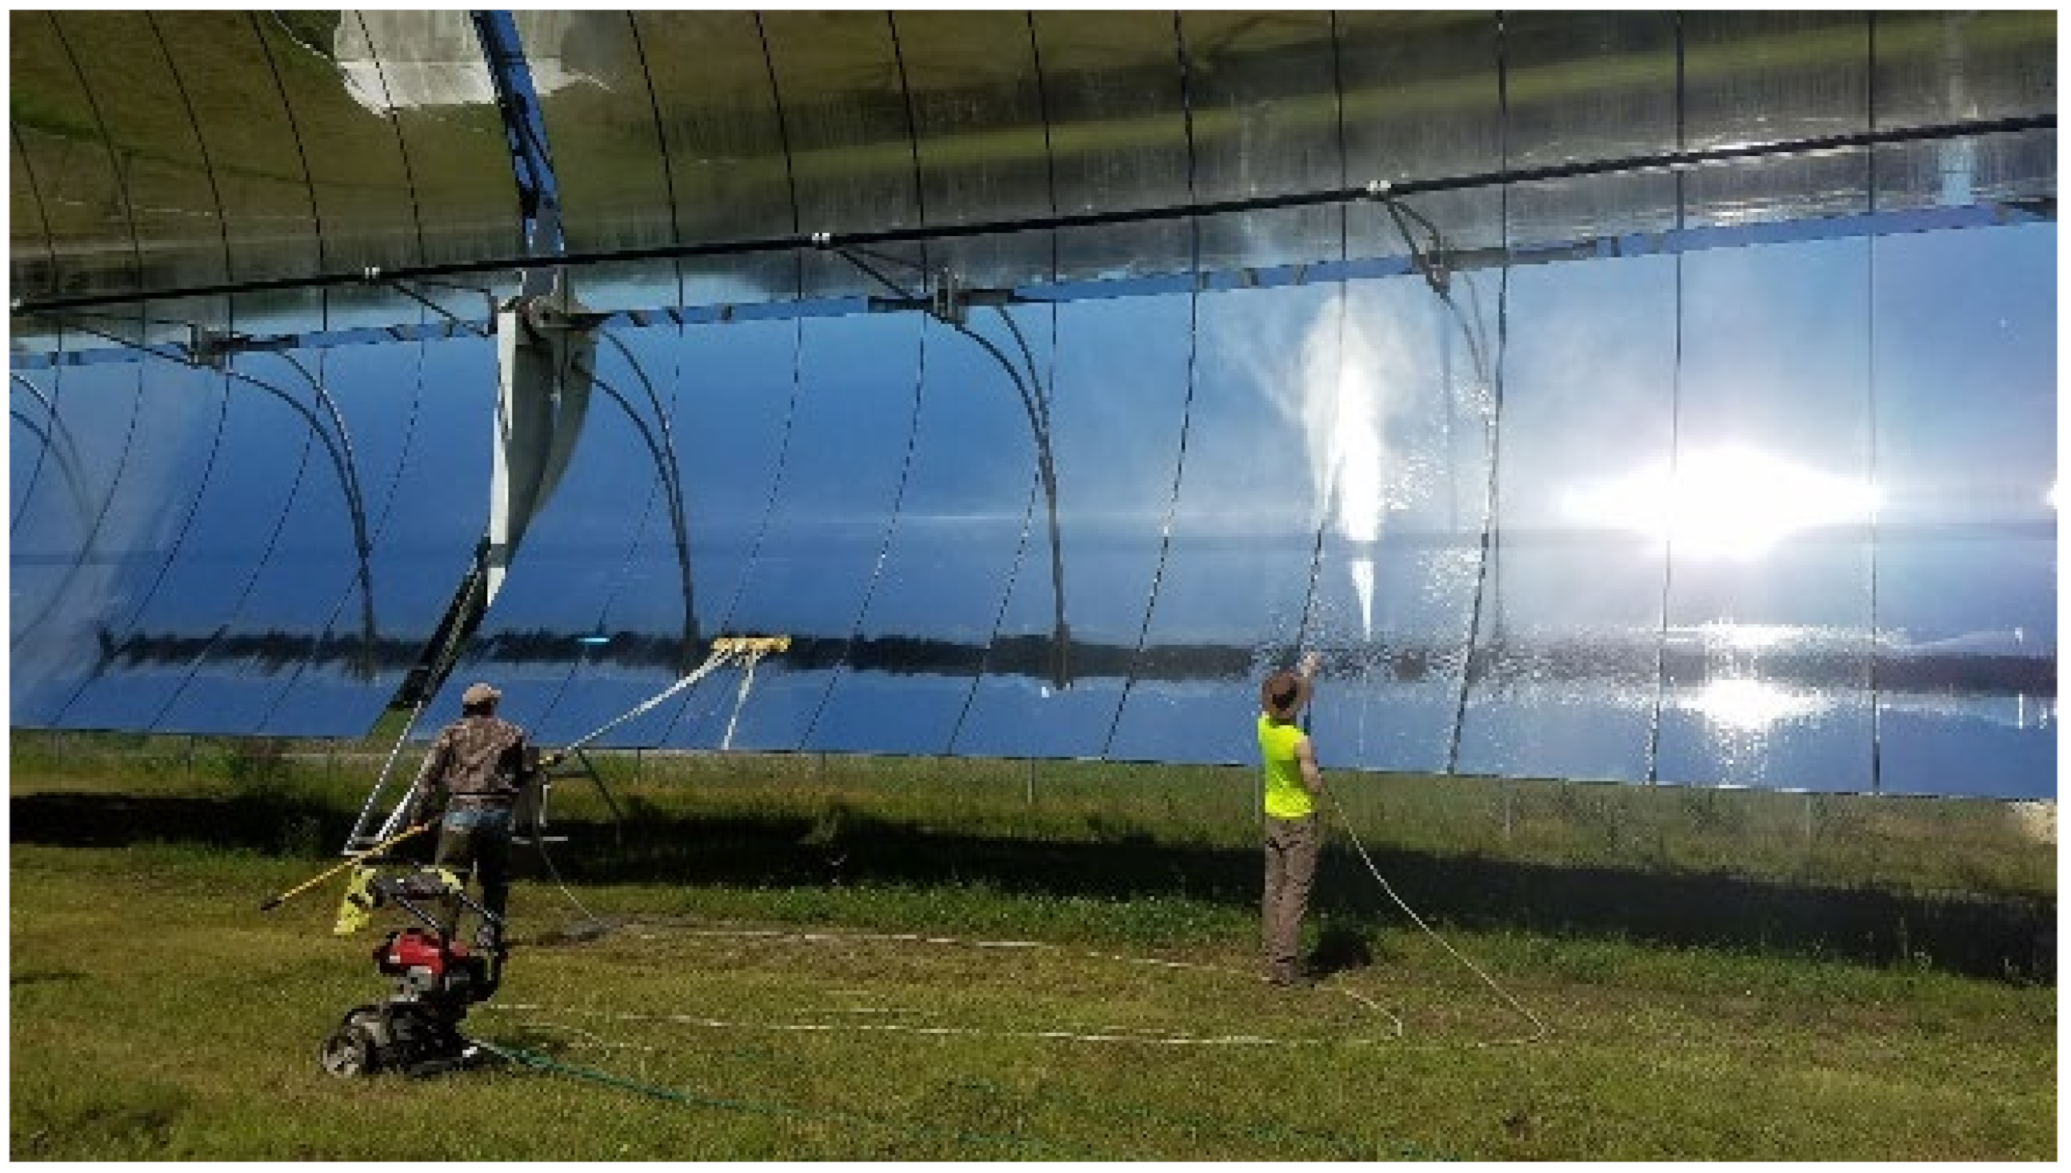
In a previous study in southern Louisiana, measurements taken of the specular reflectance showed that after having been reduced to less than 80%, washing the reflectors returned them to original performance specifications for reflectivity >95% [16]. The washing procedure currently employed at the Louisiana CSP plant involves using a pressure washer with deionized water and a microfiber cloth attached to a pole brush designed by 3M (Figure 2). This brush consists of a long pole attached to a brush head that clamps the microfiber cloth down on a sponge that has running water flowing to it to reduce surface friction. The reflector-washing procedure consists of an initial spray of water with a pressure washer, followed by wiping with the brush before the reflectors are sprayed again.
When soiling particles, such as dust and pollen, accumulate on the reflector, a reduction in the reflectance can be measured. Logging the reflectance of clean and dirty panels allows the calculation of the reflectors’ rate of soiling. This soiling rate can be used to compare the performance of various reflective materials in a particular climate region. Reflector cleanliness has been measured with several devices, including handheld reflectometers [10,15], DSLR cameras [27], gloss meters [16], and a tracking cleanliness sensor [7,24,25,26,31,36]. The cleanliness () parameter has been used to quantify the difference in reflectivity due to soiling losses [7,14,15]. For solar reflectors, the cleanliness is the ratio of the current reflectance () to the reflectance in a clean state ().
The reflectors are exposed to the environment and are measured and cleaned regularly. The reflectivity measurements of the dirty, , before weekly cleaning (or prewash), , and after cleaning reflectors, , represent the average values of the reflectivity from two measurements of specular reflection gloss on each reflector panel.
The soiling loss (SL) represents the percentage of reflectance loss and can be directly related to loss in production in solar plants. The SL is defined in the following formula:
Various climatological parameters, such as rainfall, dust storms, wind speed, and relative humidity, influence the cleanliness over periods of time. The parameter soiling rate (SR) is defined as the change in reflector cleanliness over a specified period of time [37]. This specified period can be between two cleaning events, such as rainfall events. The SR is used to determine the cleanliness with respect to time and is given as:
It should be noted that soiling does not equally affect the efficiency of CSP plants when compared with photovoltaic (PV) plants. Comparing soiling of CSP reflectors and PV, it was found that the SR for CSP is approximately 8–9-fold higher than PV [26,38]. This is assumed to be because of the optical differences between specular reflection versus diffuse transmission. Concerning PV solar power, the SR in Equation 3 is defined as the average daily soiling ratio (SRatio) and is indicative of annual SL [39]. The SR is then described as the rate that the SRatio varies between rainfall periods at each site [40].
3. Materials and Methods
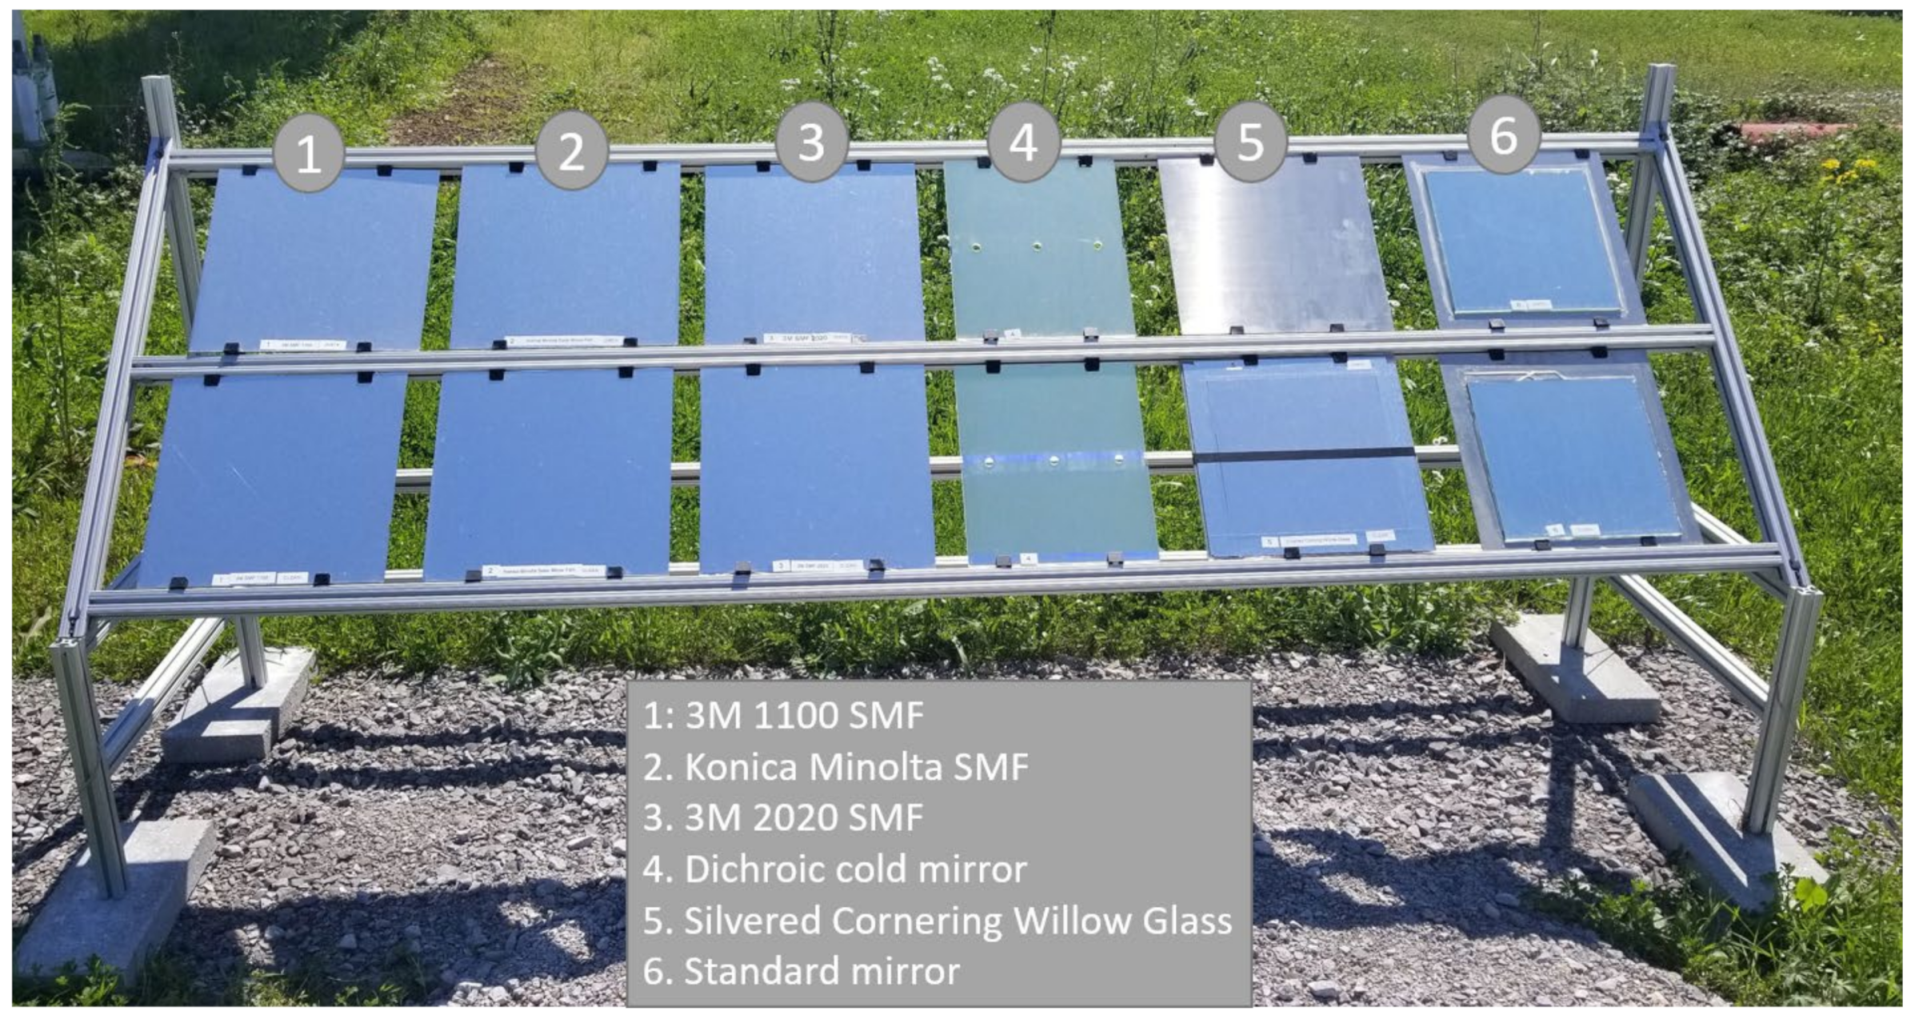
In a rural region of Crowley, Louisiana, a fixed-tilt CSP soiling testbed (Figure 3) was designed and built to analyze soiling of various reflective materials. The soiling testbed consisted of six sets of reflective surfaces mounted at a fixed tilt at 30 degrees. The reflective surfaces included three sets of thin-film surfaces and three sets of glass types. The samples are all secured on a 15 inch by 15 inch aluminum backplate. All the samples were developed for concentrating solar applications except the standard glass sample that is a 12 inch by 12 inch mirror purchased from Home Depot. Each set had one reflective surface that was cleaned weekly and one that was left dirty. Two generations of 3M thin-film, 3M 1100 SMF and 3M 2020 SMF, were tested along with Konica Minolta SMF. For the glass-type reflectors, silvered Corning Willow Glass is tested along with a standard mirror and a dichroic cold mirror used for beam splitting in concentrating solar photovoltaic applications [41]. The dichroic cold mirror is a spectrally selective mirror with dichroic film by the Evaporated Metal Films Corporation (EMF).
The soiling testbed study commenced in February of 2019 and weekly measurements were taken until November of 2019. Several measurements were taken for each reflector type, one was left dirty only to be cleaned by natural precipitation, and one was cleaned during weekly measurements. Measurements were taken before and after the cleaning, so the weekly SR is able to be calculated. To clarify, three measurements are taken for each test: one before washing the clean panels (prewash), another after cleaning the panels (clean), and then the last taken on the panels with only natural cleaning (dirty). Throughout the 8 month study, measurements were taken on average three times a month. For simplicity, the three measurements for each reflector type are referred to as dirty, prewash, and clean.
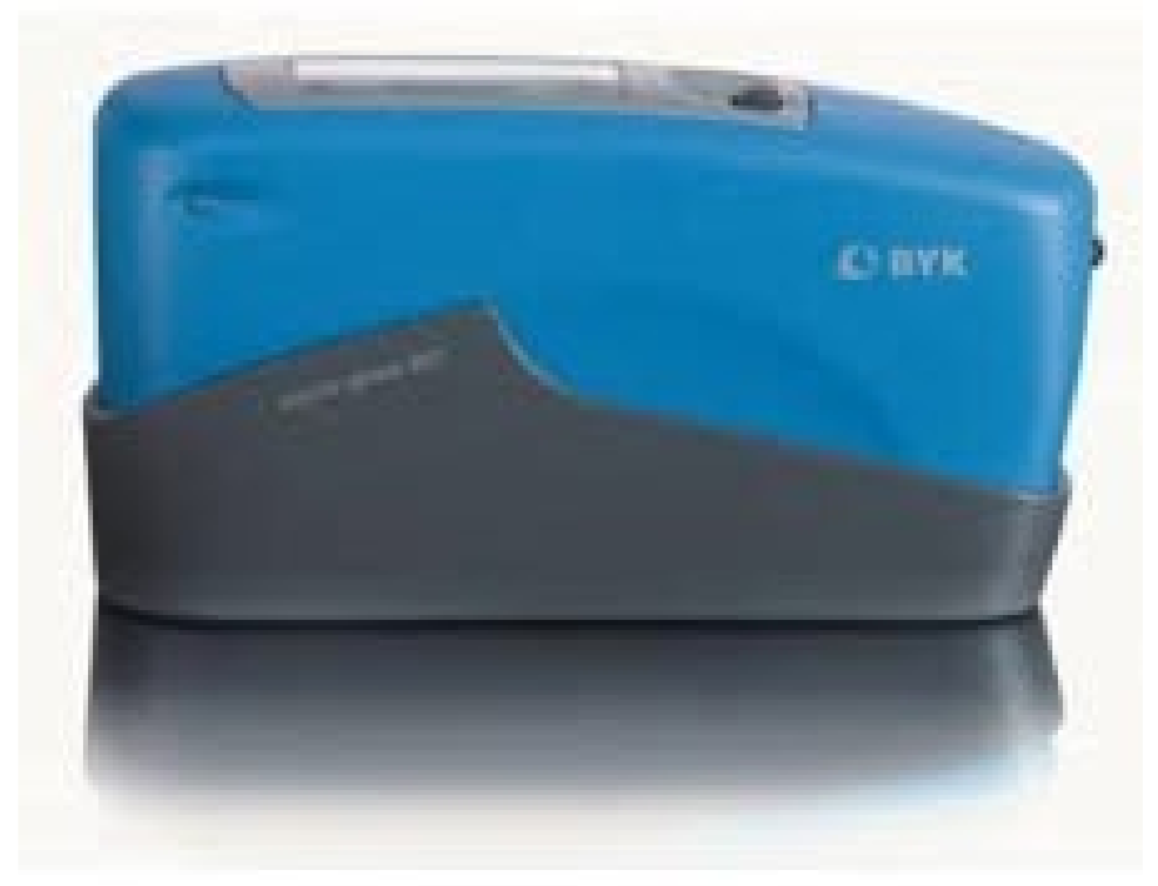
Mirror reflectivity analysis is driven by experimental data of the specular reflection of concentrating mirror surfaces. Specular reflection consists of the spectrum of light that is reflected at an angle equal and opposite to that of the incident light beam. A micro–TRI-gloss glossmeter by Byk-Gardner (Figure 4) has been used to measure specular reflectance of the solar reflectors. The device offers an easy one-time calibration versus a reference that allows for efficient measurement of multiple panels. This device produces a derived reflectivity value rather than a direct measurement [37]. This glossmeter measures the reflectance at an angle of 20° to the mirror surface and is repeatable to within ±0.2% for highly reflective surfaces [42]. It consists of a camera-shaped device and a standard comprising a true black sample, which can be measured by the glossmeter for calibration. The gloss measurements can be correlated to the specularity of the reflectors, a major factor in optical efficiency [43]. The gloss measurement, expressed in specular gloss units (SGU), as described in ASTM D523, states that a glass of refractive index n = 1.567 at 589.3 nm has a specular gloss value of 100 SGU for any angle of incidence [44]. Along with specular gloss measurements, an onsite weather station recorded temperature, humidity, wind speed and direction, and precipitation throughout this study. The National Renewable Energy Laboratory (NREL)’s Measurement and Instrumentation Data Center (MIDC) collects irradiance and meteorological data from various stations in the United States. All weather and solar resource data for the Crowley, Louisiana, testing location used in this study is available online on the MIDC website [45].
4. Results
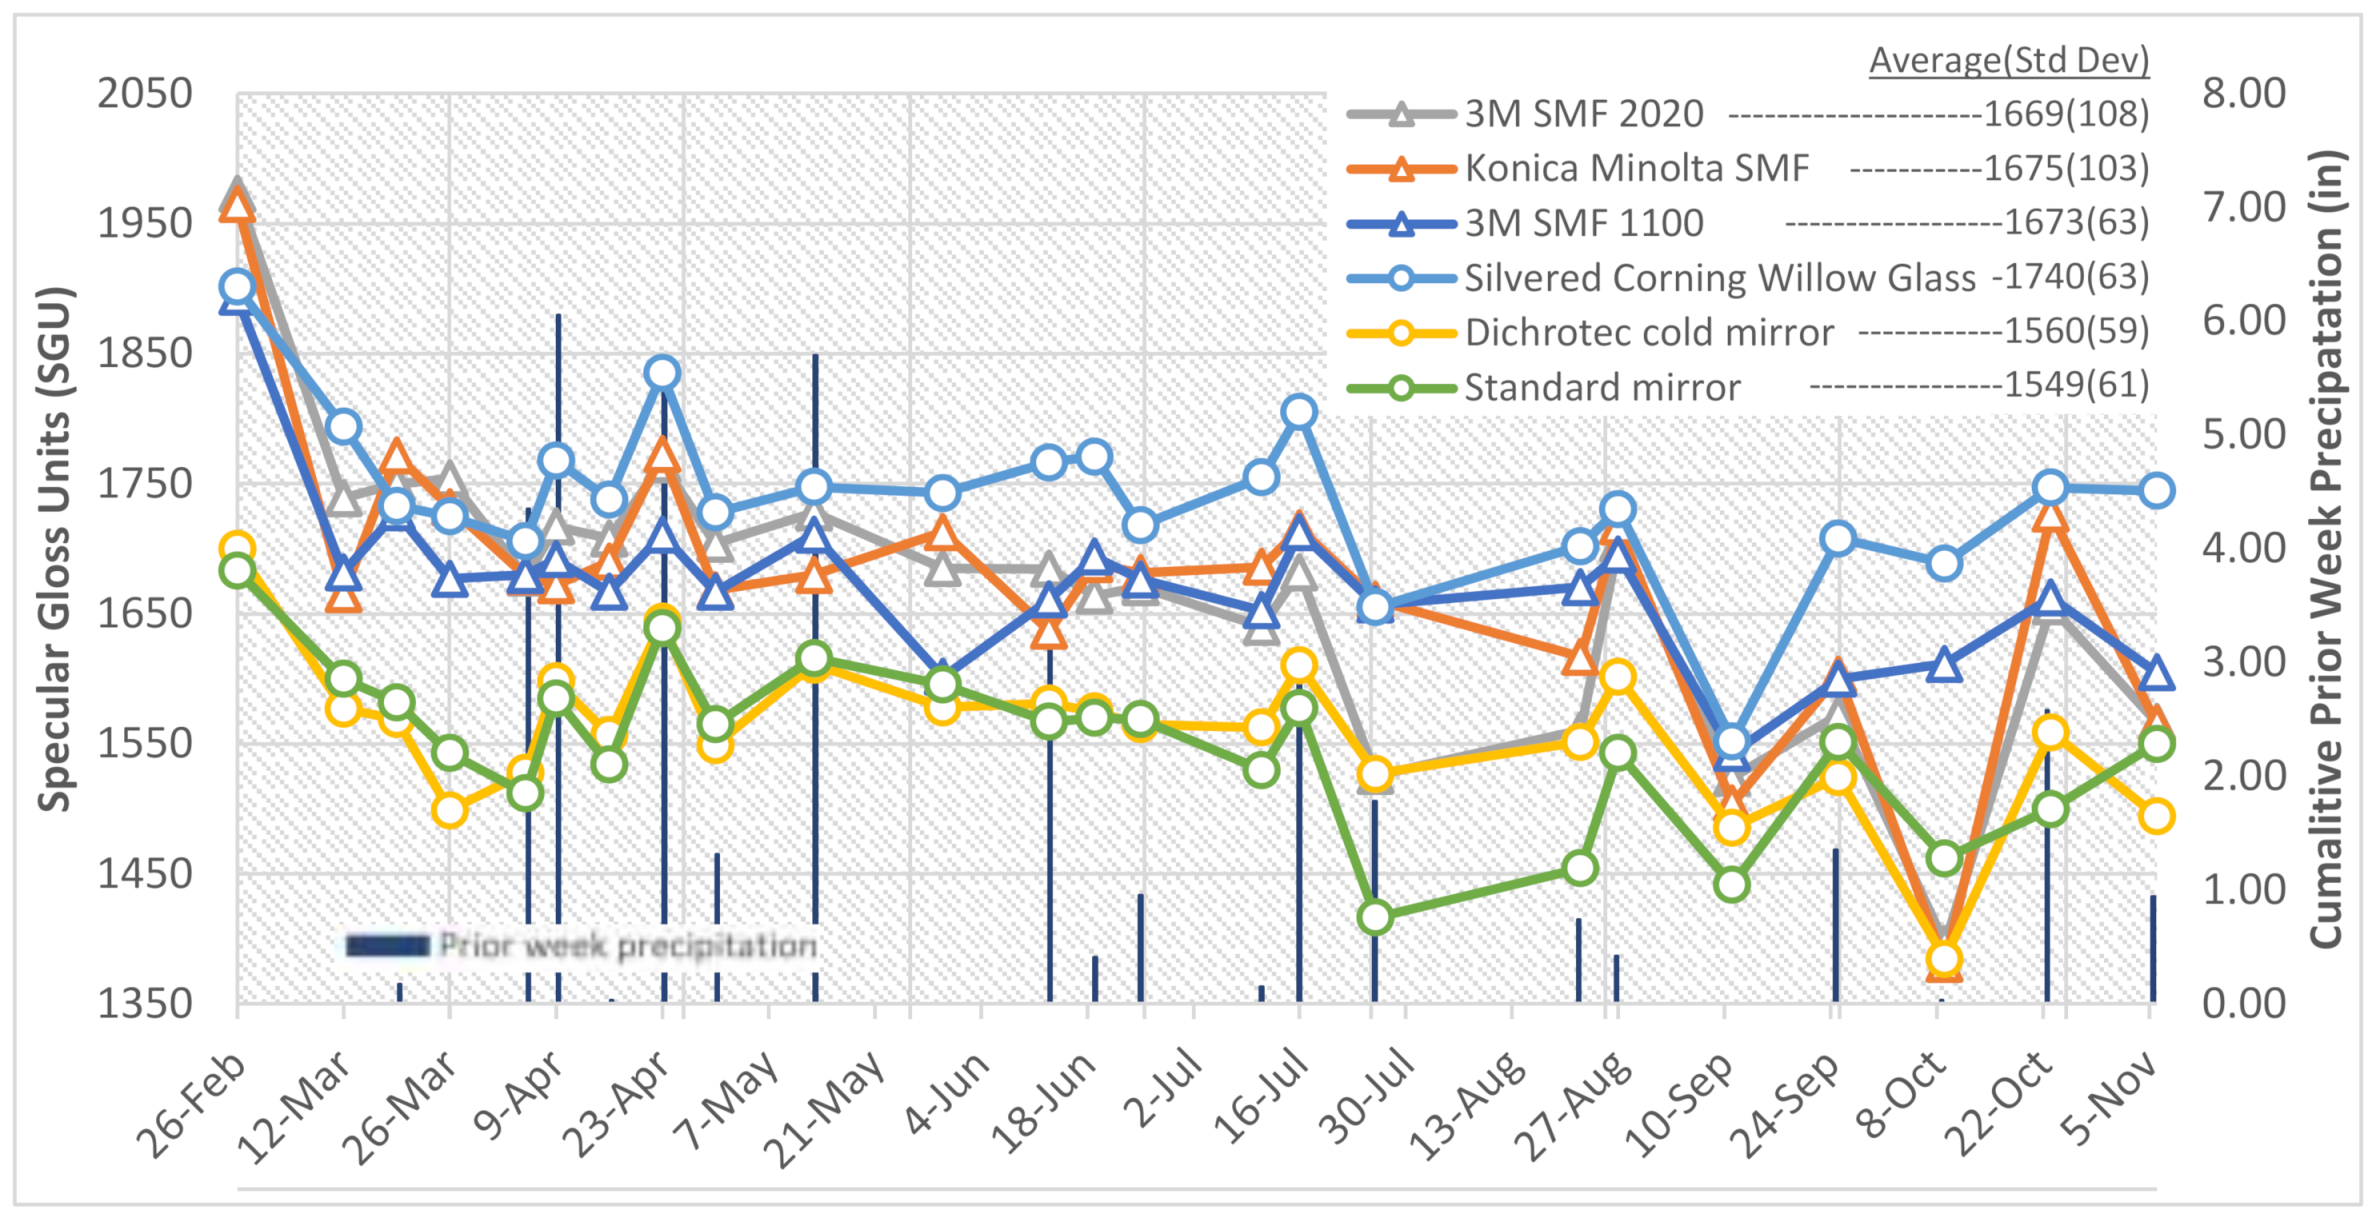
The measured SGU ranged from approximately 1350 to 2150 throughout this study. The raw SGU measurements for the panels that were not cleaned throughout this study, referred to as dirty, are shown in Figure 5. These panels were only cleaned by natural precipitation events. The prior week precipitation total is shown and correlates with dips in the SGU after little to no precipitation events, such as 11 September and 9 October. After precipitation events, SGU increases are shown in several tests, such as on 9 April, 23 April, 16 July, 25 September, and 23 October. In an analysis of 20 soiling stations in the US, it was found that no cleaning effect occurred following rain events of 0.012 inches or less; therefore, anything below 0.012 inches is considered negligible and is not counted in the cumulative prior week’s precipitation [39].
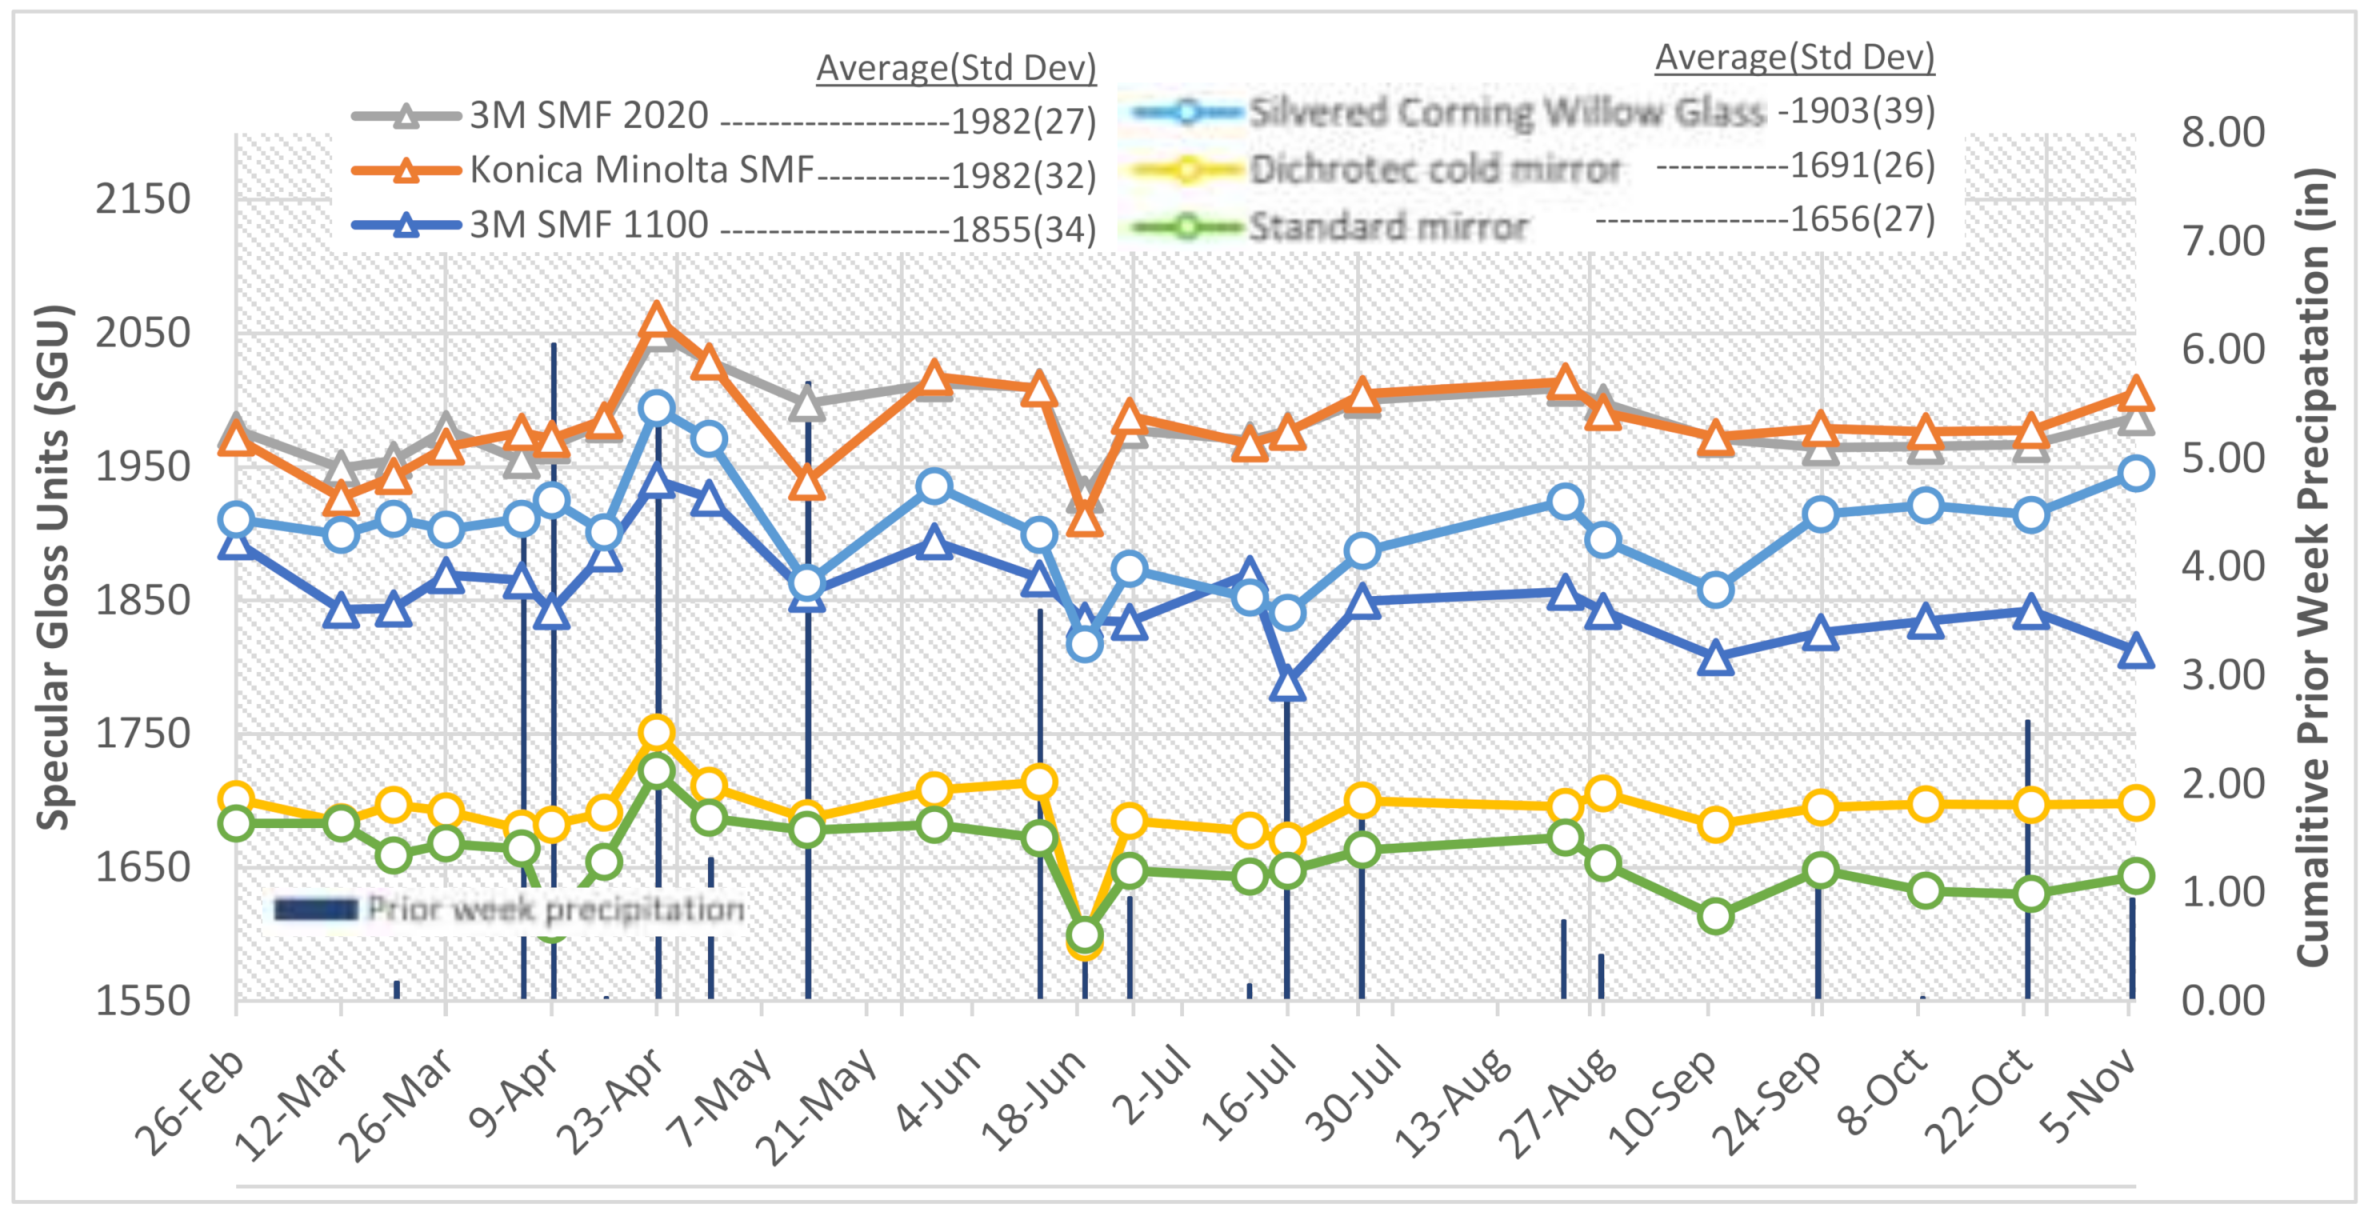
As shown in Figure 5, the silvered Corning Willow Glass had an average of 4% higher SGU readings throughout this study. Following precipitation events, the silvered Corning Willow Glass had significantly higher SGU readings, with up to 7.3% higher than the average thin-film tested. As stated in the Methods section, the reflector panels that were regularly cleaned were tested before and after cleaning, allowing the soiling rate to be calculated between precipitation events. The 3M SMF 2020 and Konica Minolta SMF gave an average of 1.6% higher SGU readings than the silvered Corning Willow Glass when cleaned at regular intervals, as shown in Figure 6.
The SGU of the cleaned reflector panels remained consistent with the least amount of standard deviation throughout this study compared with the dirty and prewash measurements. As shown in Figure 7, the Konica Minolta and 3M 2020 had an identical average gloss of 1982, trailed by the silvered Corning Willow Glass at 1903, and 3M 1100 at 1855.
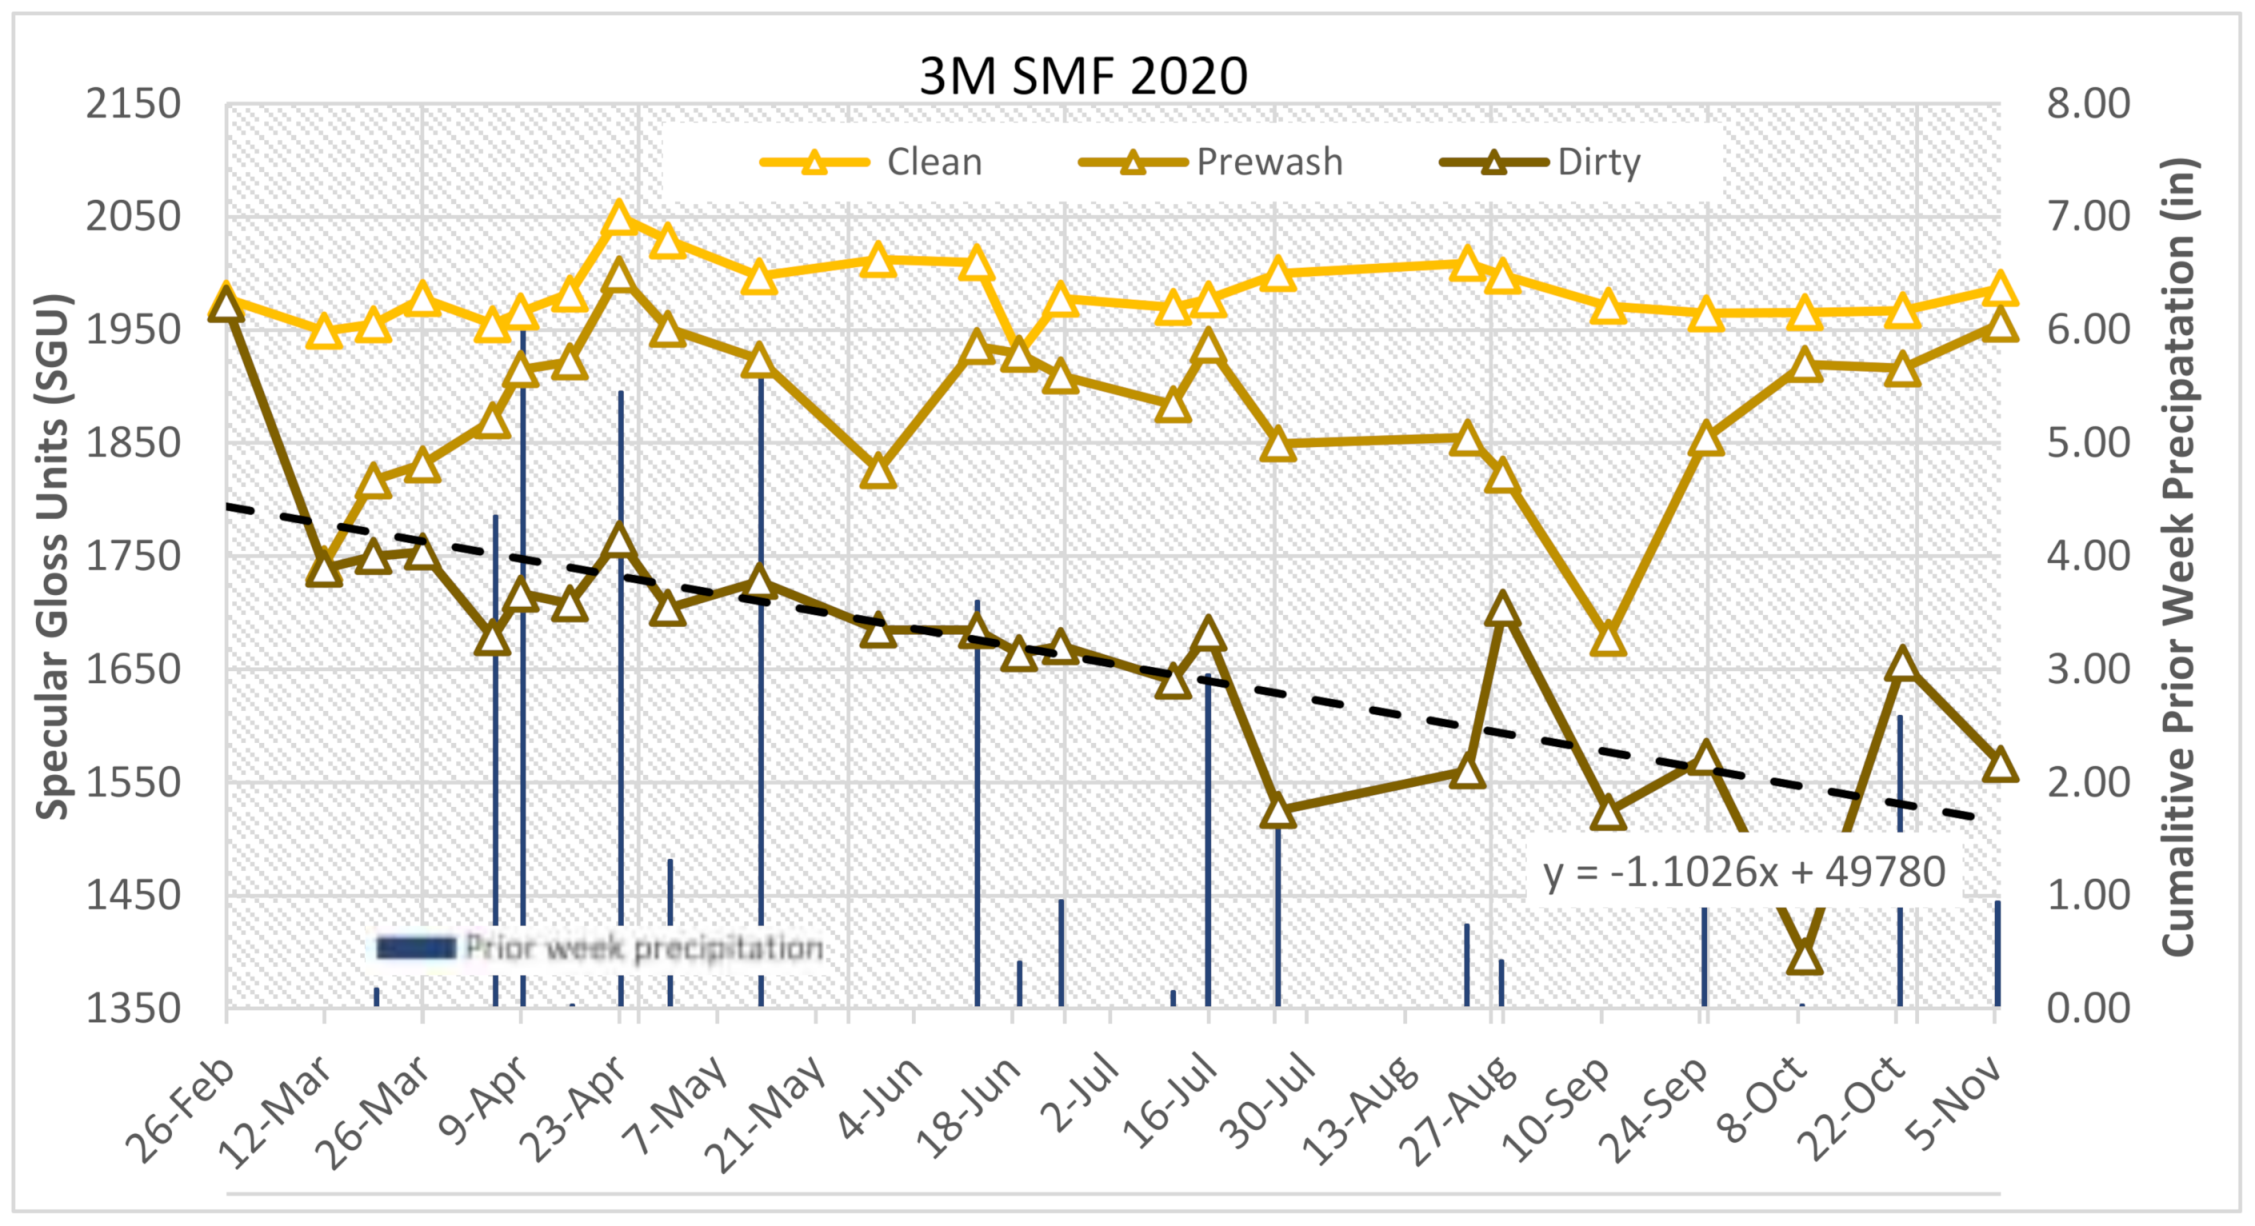
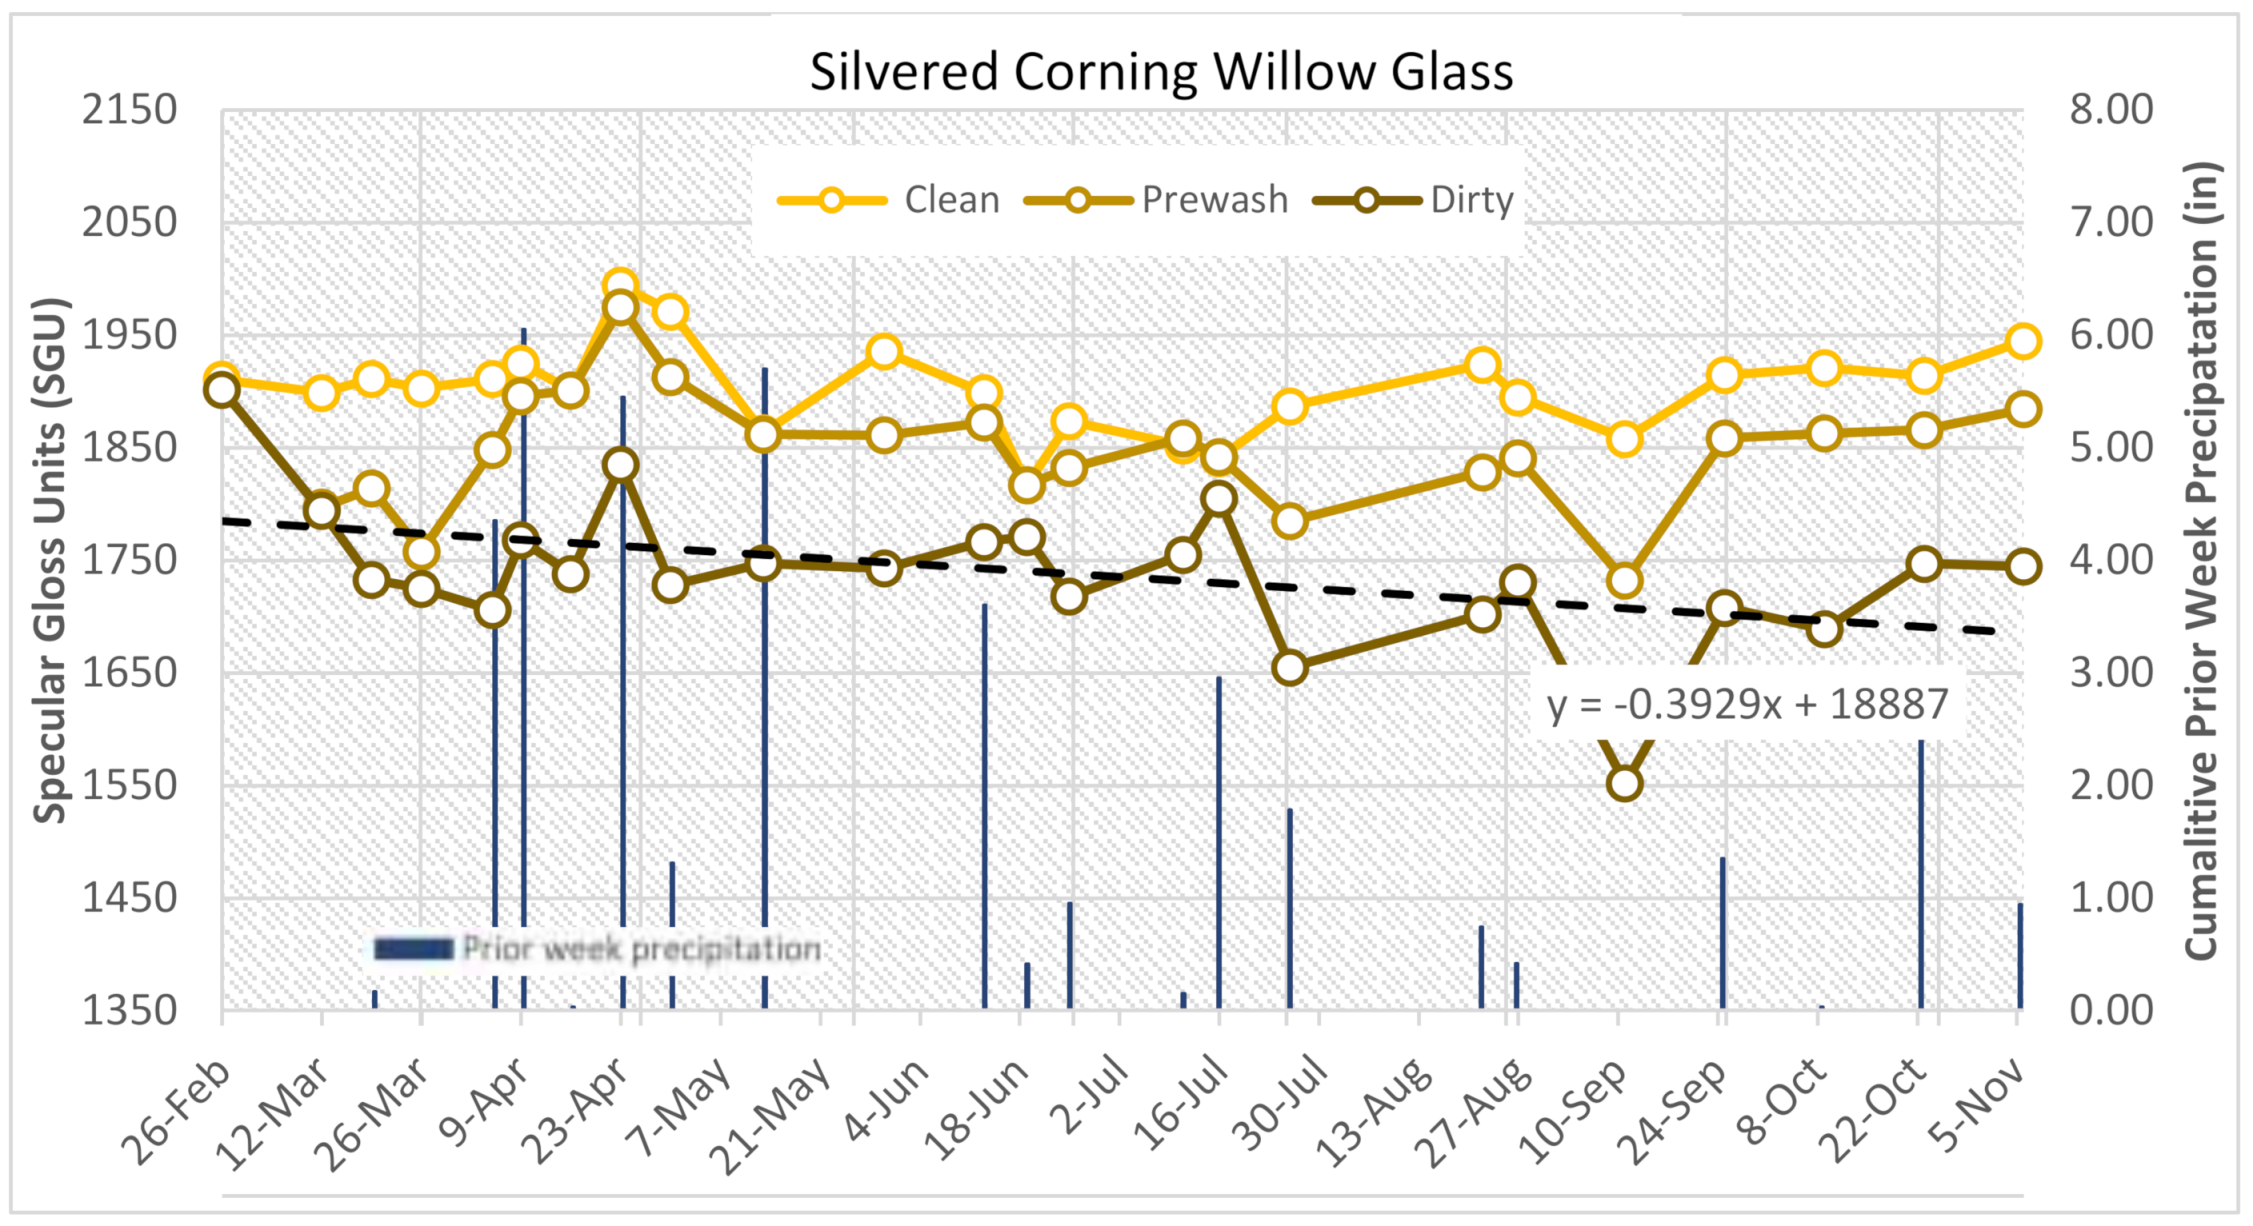
The natural event cleaned (dirty), the prewash, and cleaned tests are combined together to show the contrast between a thin-film and glass-type reflector. Figure 8 shows the 3M SMF 2020 and silvered Corning Willow Glass results for all three types of tests. Although the 3M SMF 2020 has the higher average for the cleaned and prewash tests the silvered Corning Willow Glass is dominant in the dirty test. A trend line is graphed for the dirty test and the slope is indicative of the long-term soiling rate. As shown in Figure 8 the silvered Corning Willow Glass has approximately one-third the slope, at −0.39, then the 3M SMF 2020 at −1.10.
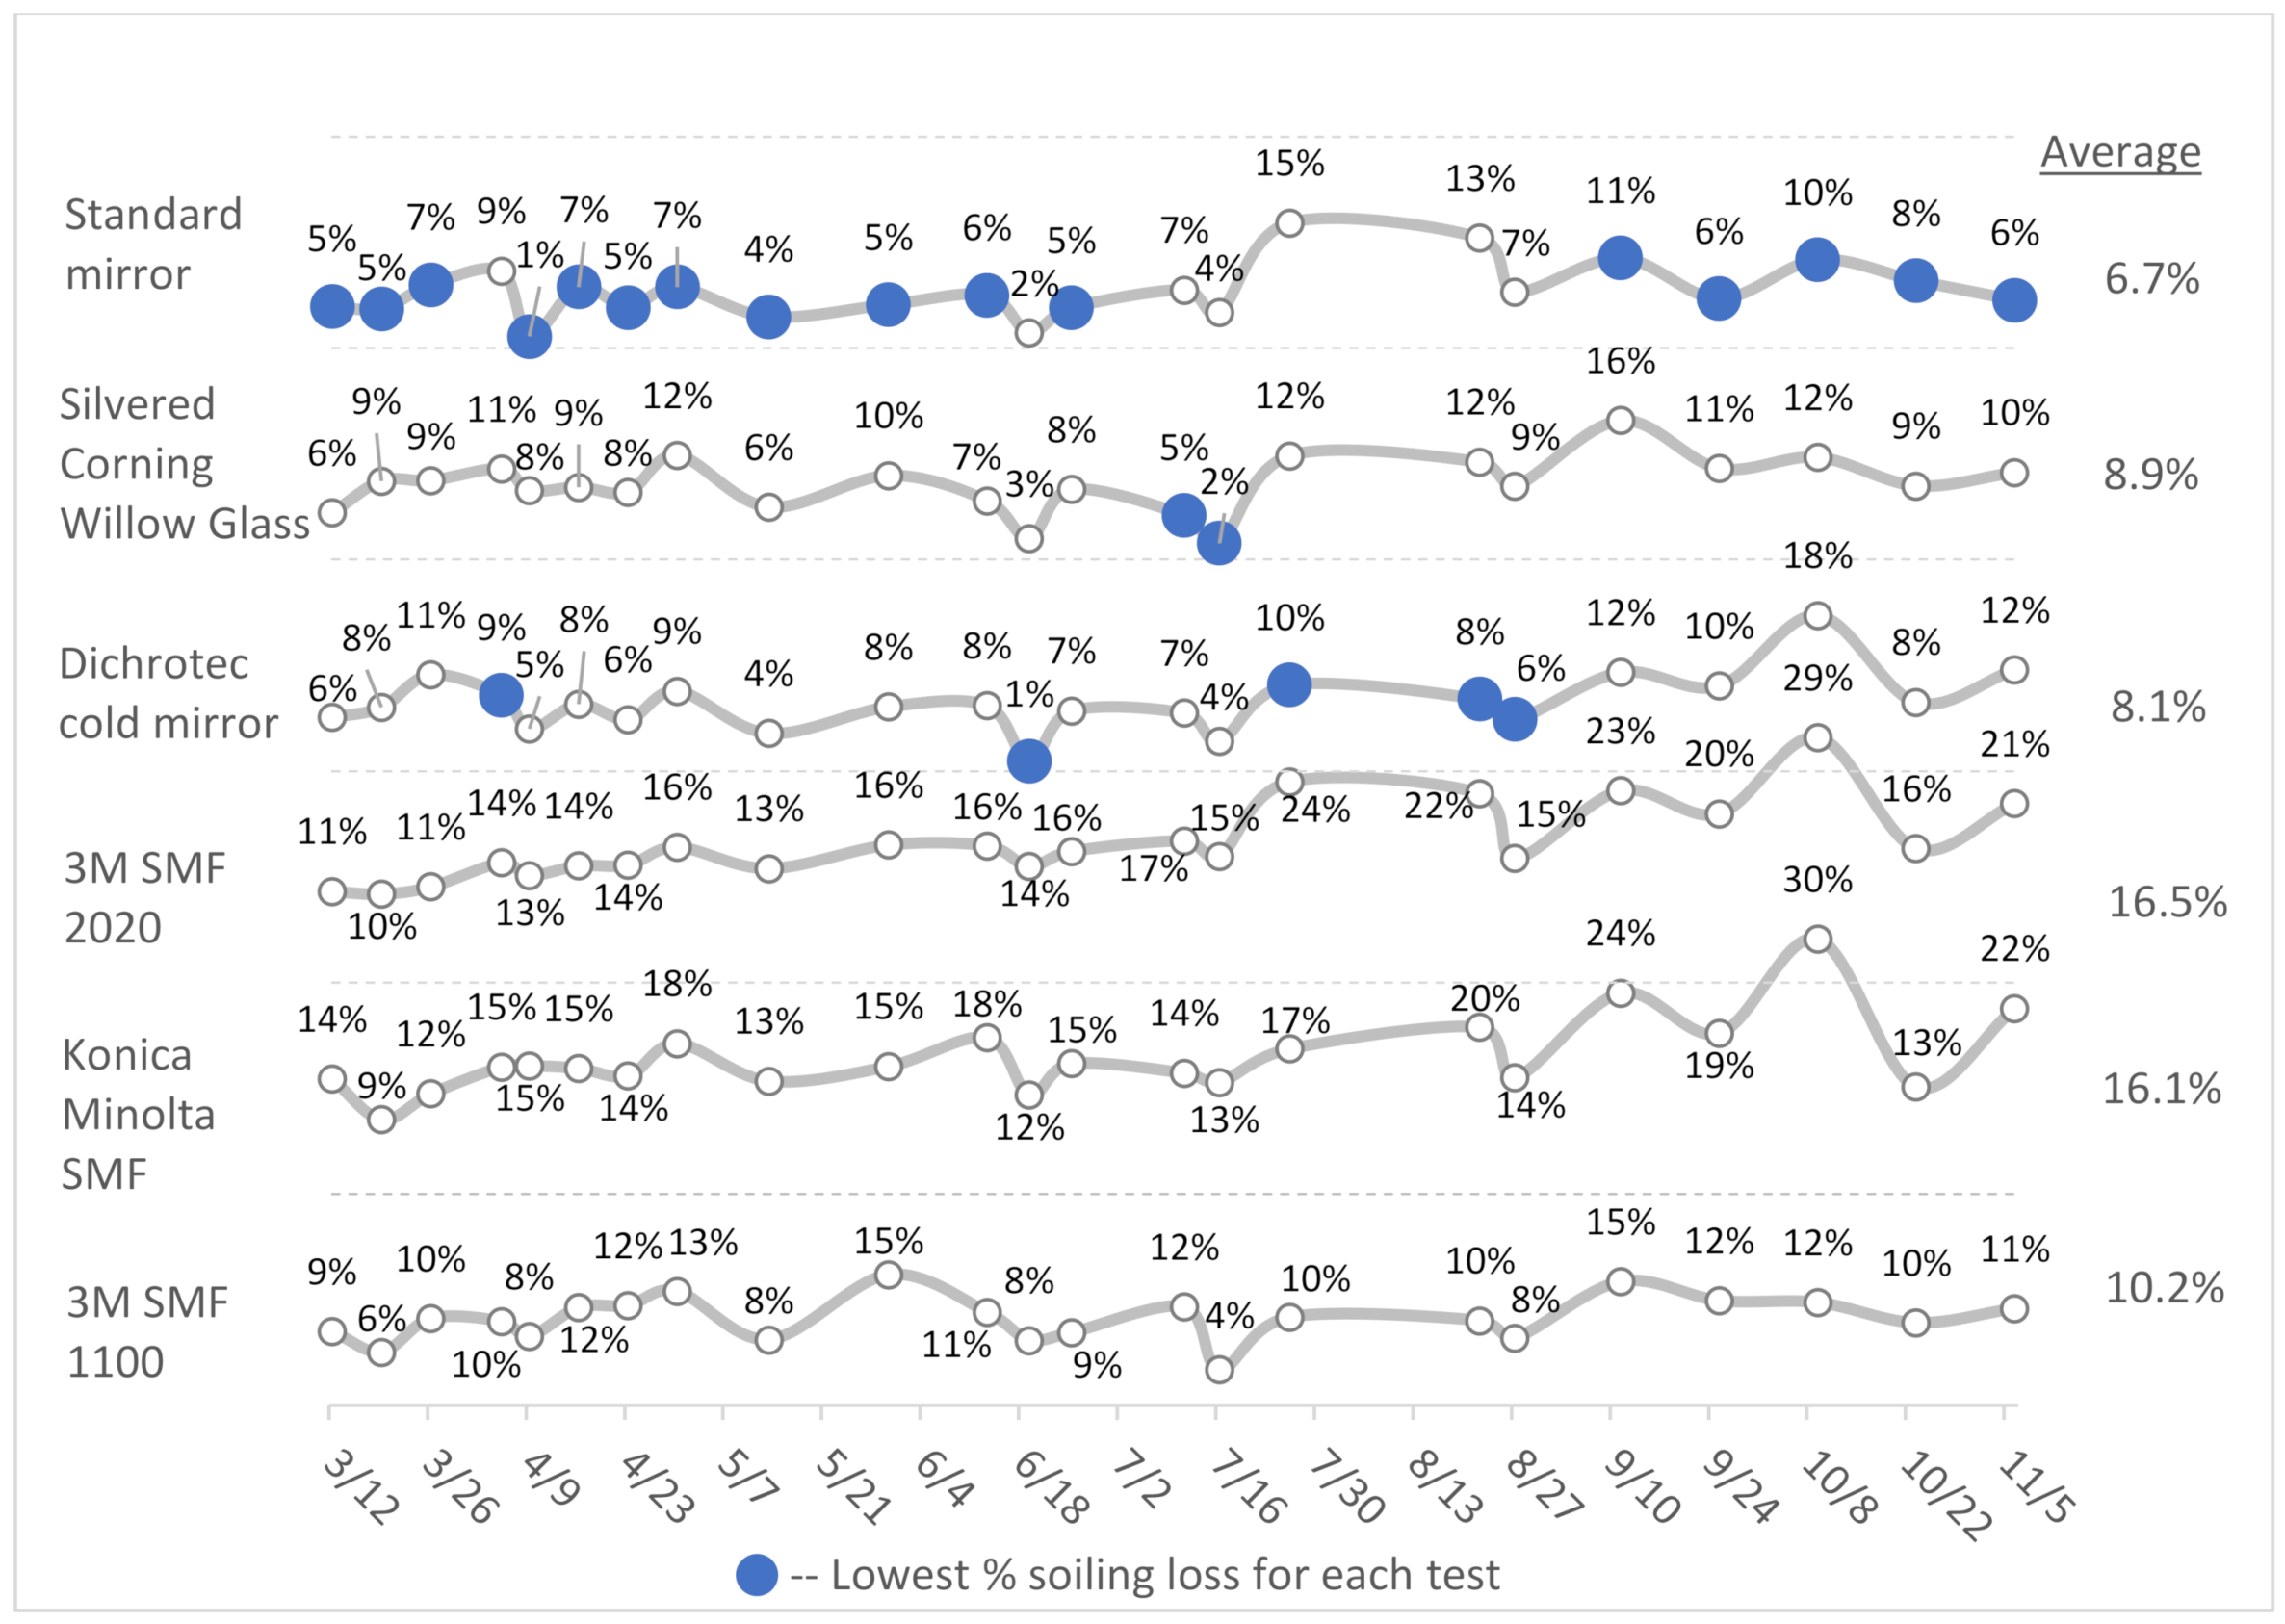
The cumulative SL percentage of the dirty compared with the clean panels is shown in Figure 9 below. The Konica Minolta and 3M 2020 demonstrated the highest losses from soiling. Although the dichrotec and standard mirrors showed consistently fewer SGU readings than other reflectors (Figure 5 above), they were less affected by soiling throughout the year. Furthermore, during high precipitation events, such as April 9 and June 18 as seen in Figure 9, the mirrors were cleaned more efficiently than other reflectors with less than 5% SLs following the precipitation events. As shown with the blue dots, the standard mirror demonstrated the lowest percent SL for 70% of the tests with an average of 6.7% throughout this study. This equates to 2.5-fold less SL than the 3M SMF 2020, which showed the highest average SL at 16.5%. The silvered Corning Willow Glass gave an average SL of 8.9% throughout this study, which is considerably less than the thin-films tested. The most significant average SL of all reflectors occurred on 9 October when there had been virtually no precipitation events for 18 days.
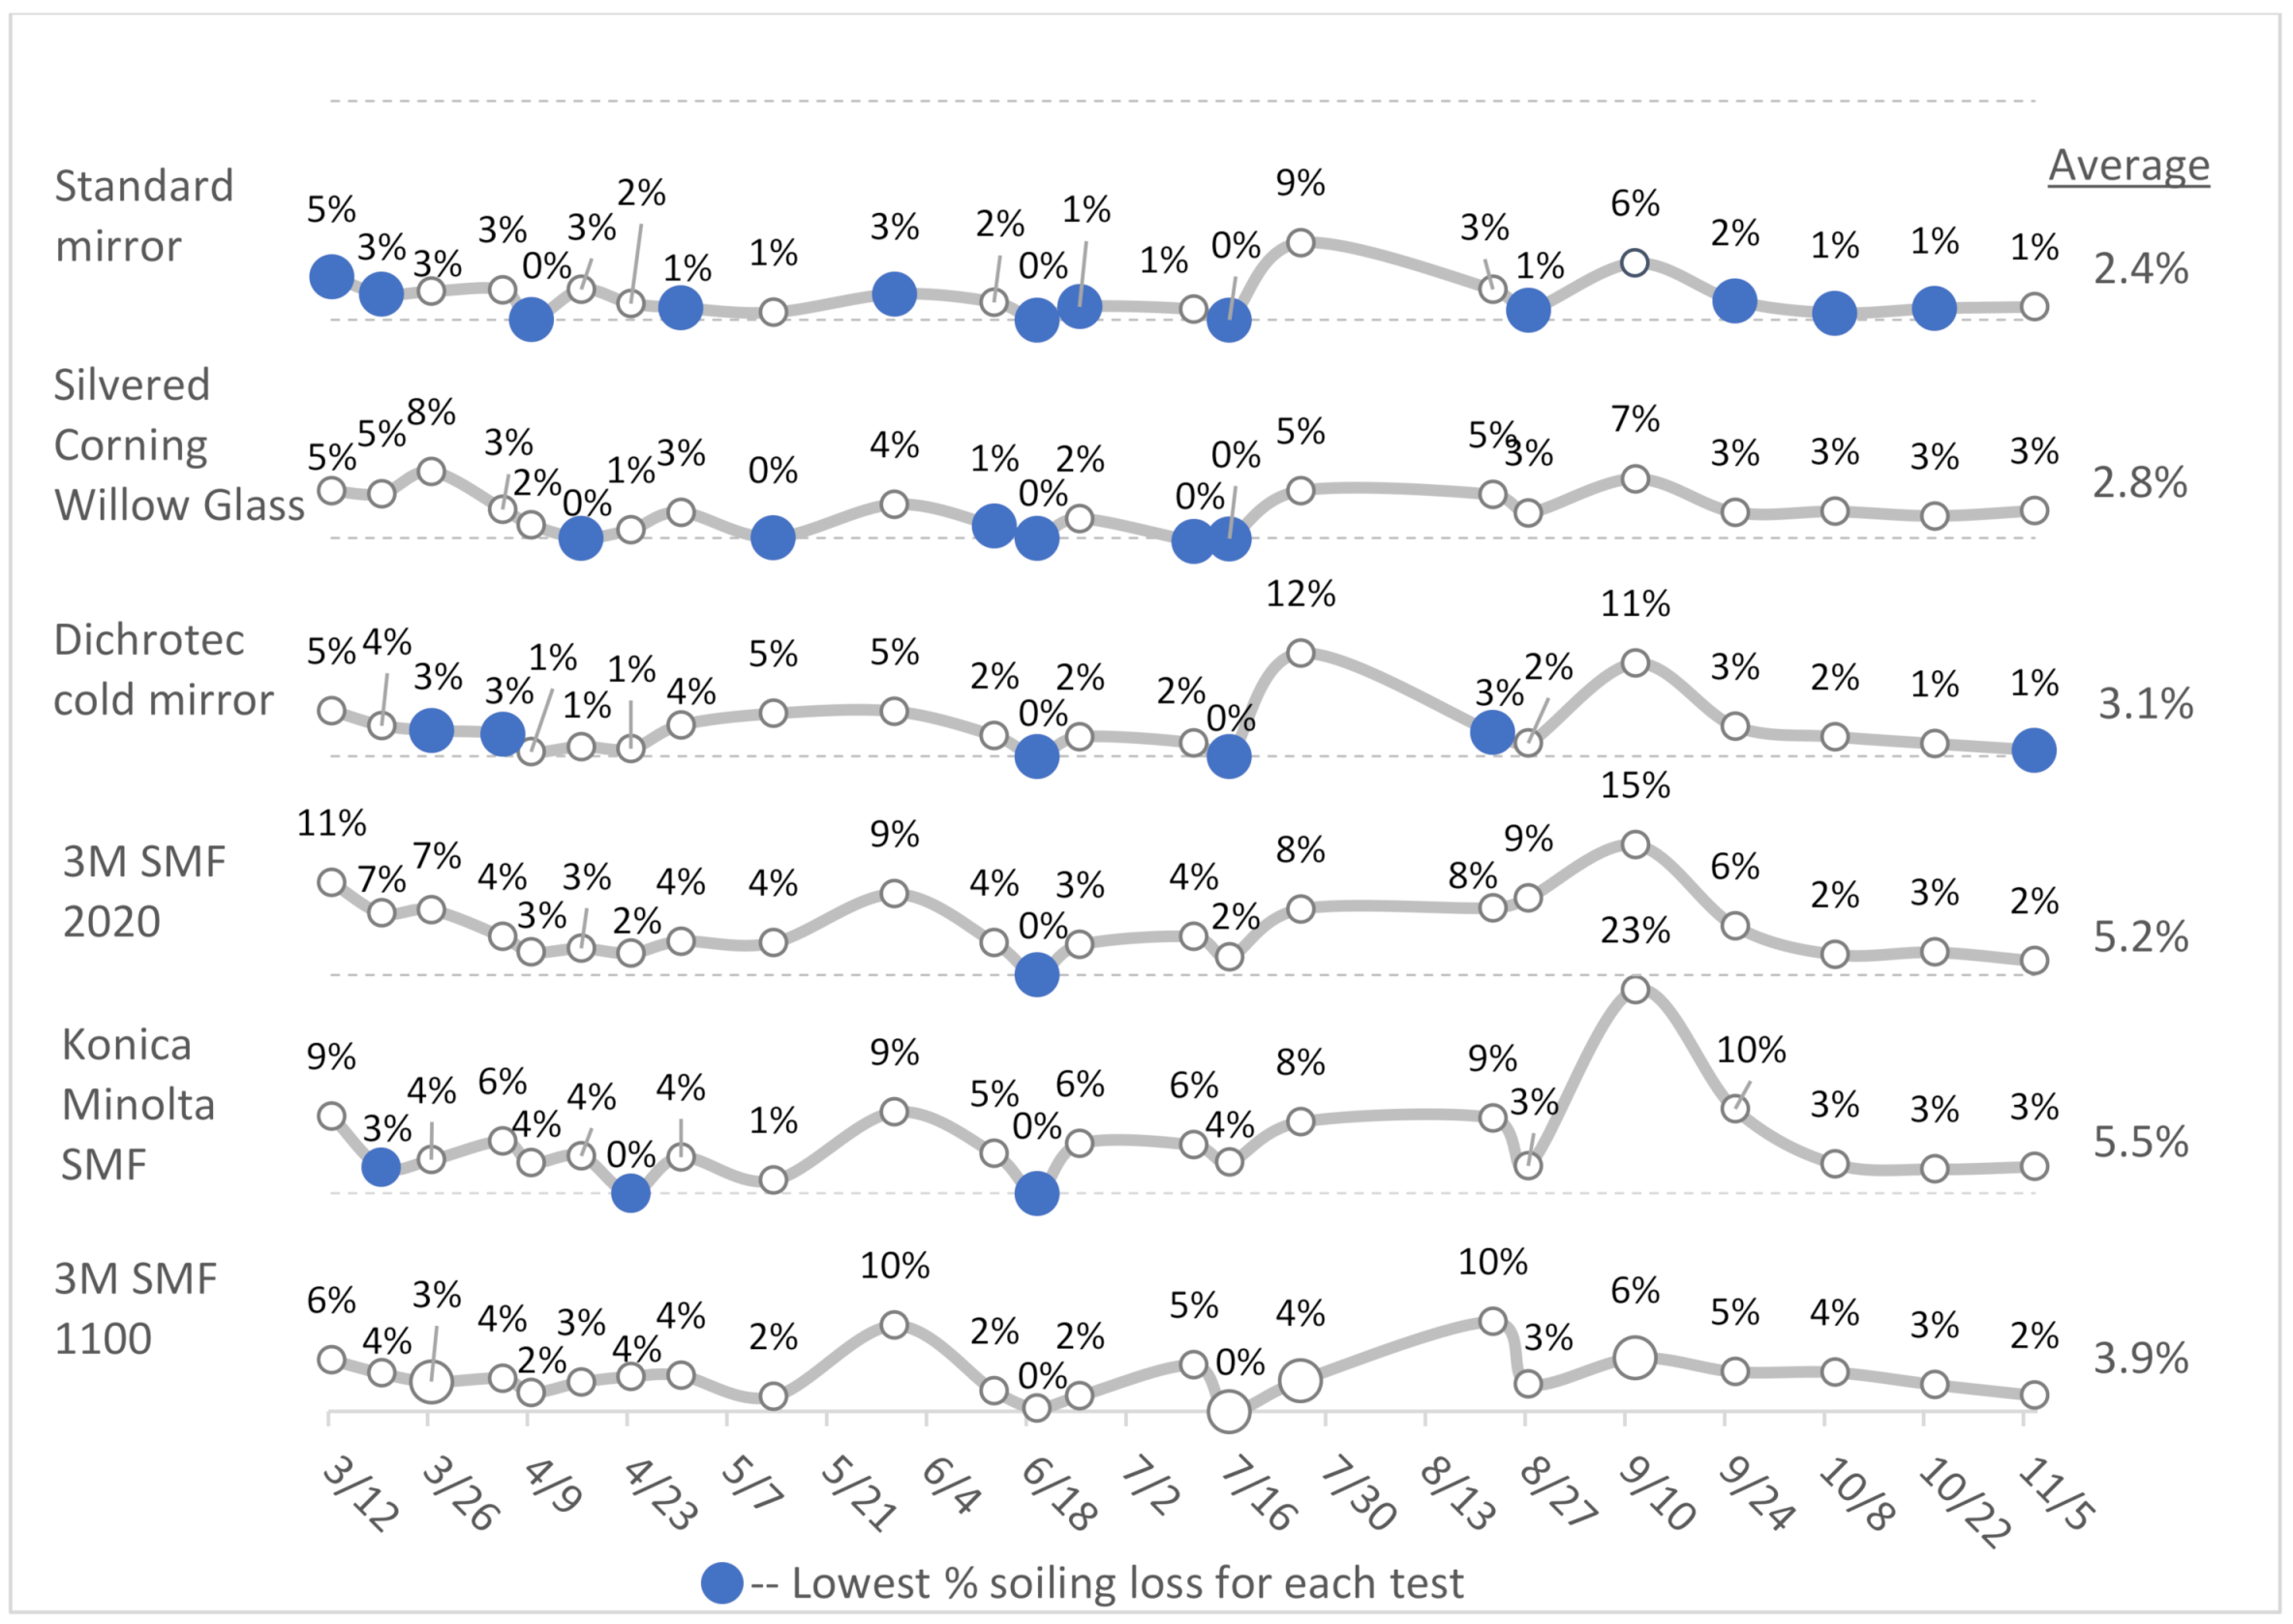
The SL of the prewash or regularly cleaned reflectors is shown in Figure 10. When comparing to the naturally cleaned reflector group in Figure 9, the silvered Corning Willow Glass outperformed the thin-film reflectors again and even showed slightly better performance than the dichroic cold mirror. The 3M SMF 2020 showed better average performance than the Konica Minolta SMF in the prewash but not the natural cleaning. This is partly due to the 11 September test when there were no precipitation events for the prior 10 days and the Konica Minolta SMF showed significant SL compared with the other reflectors tested.
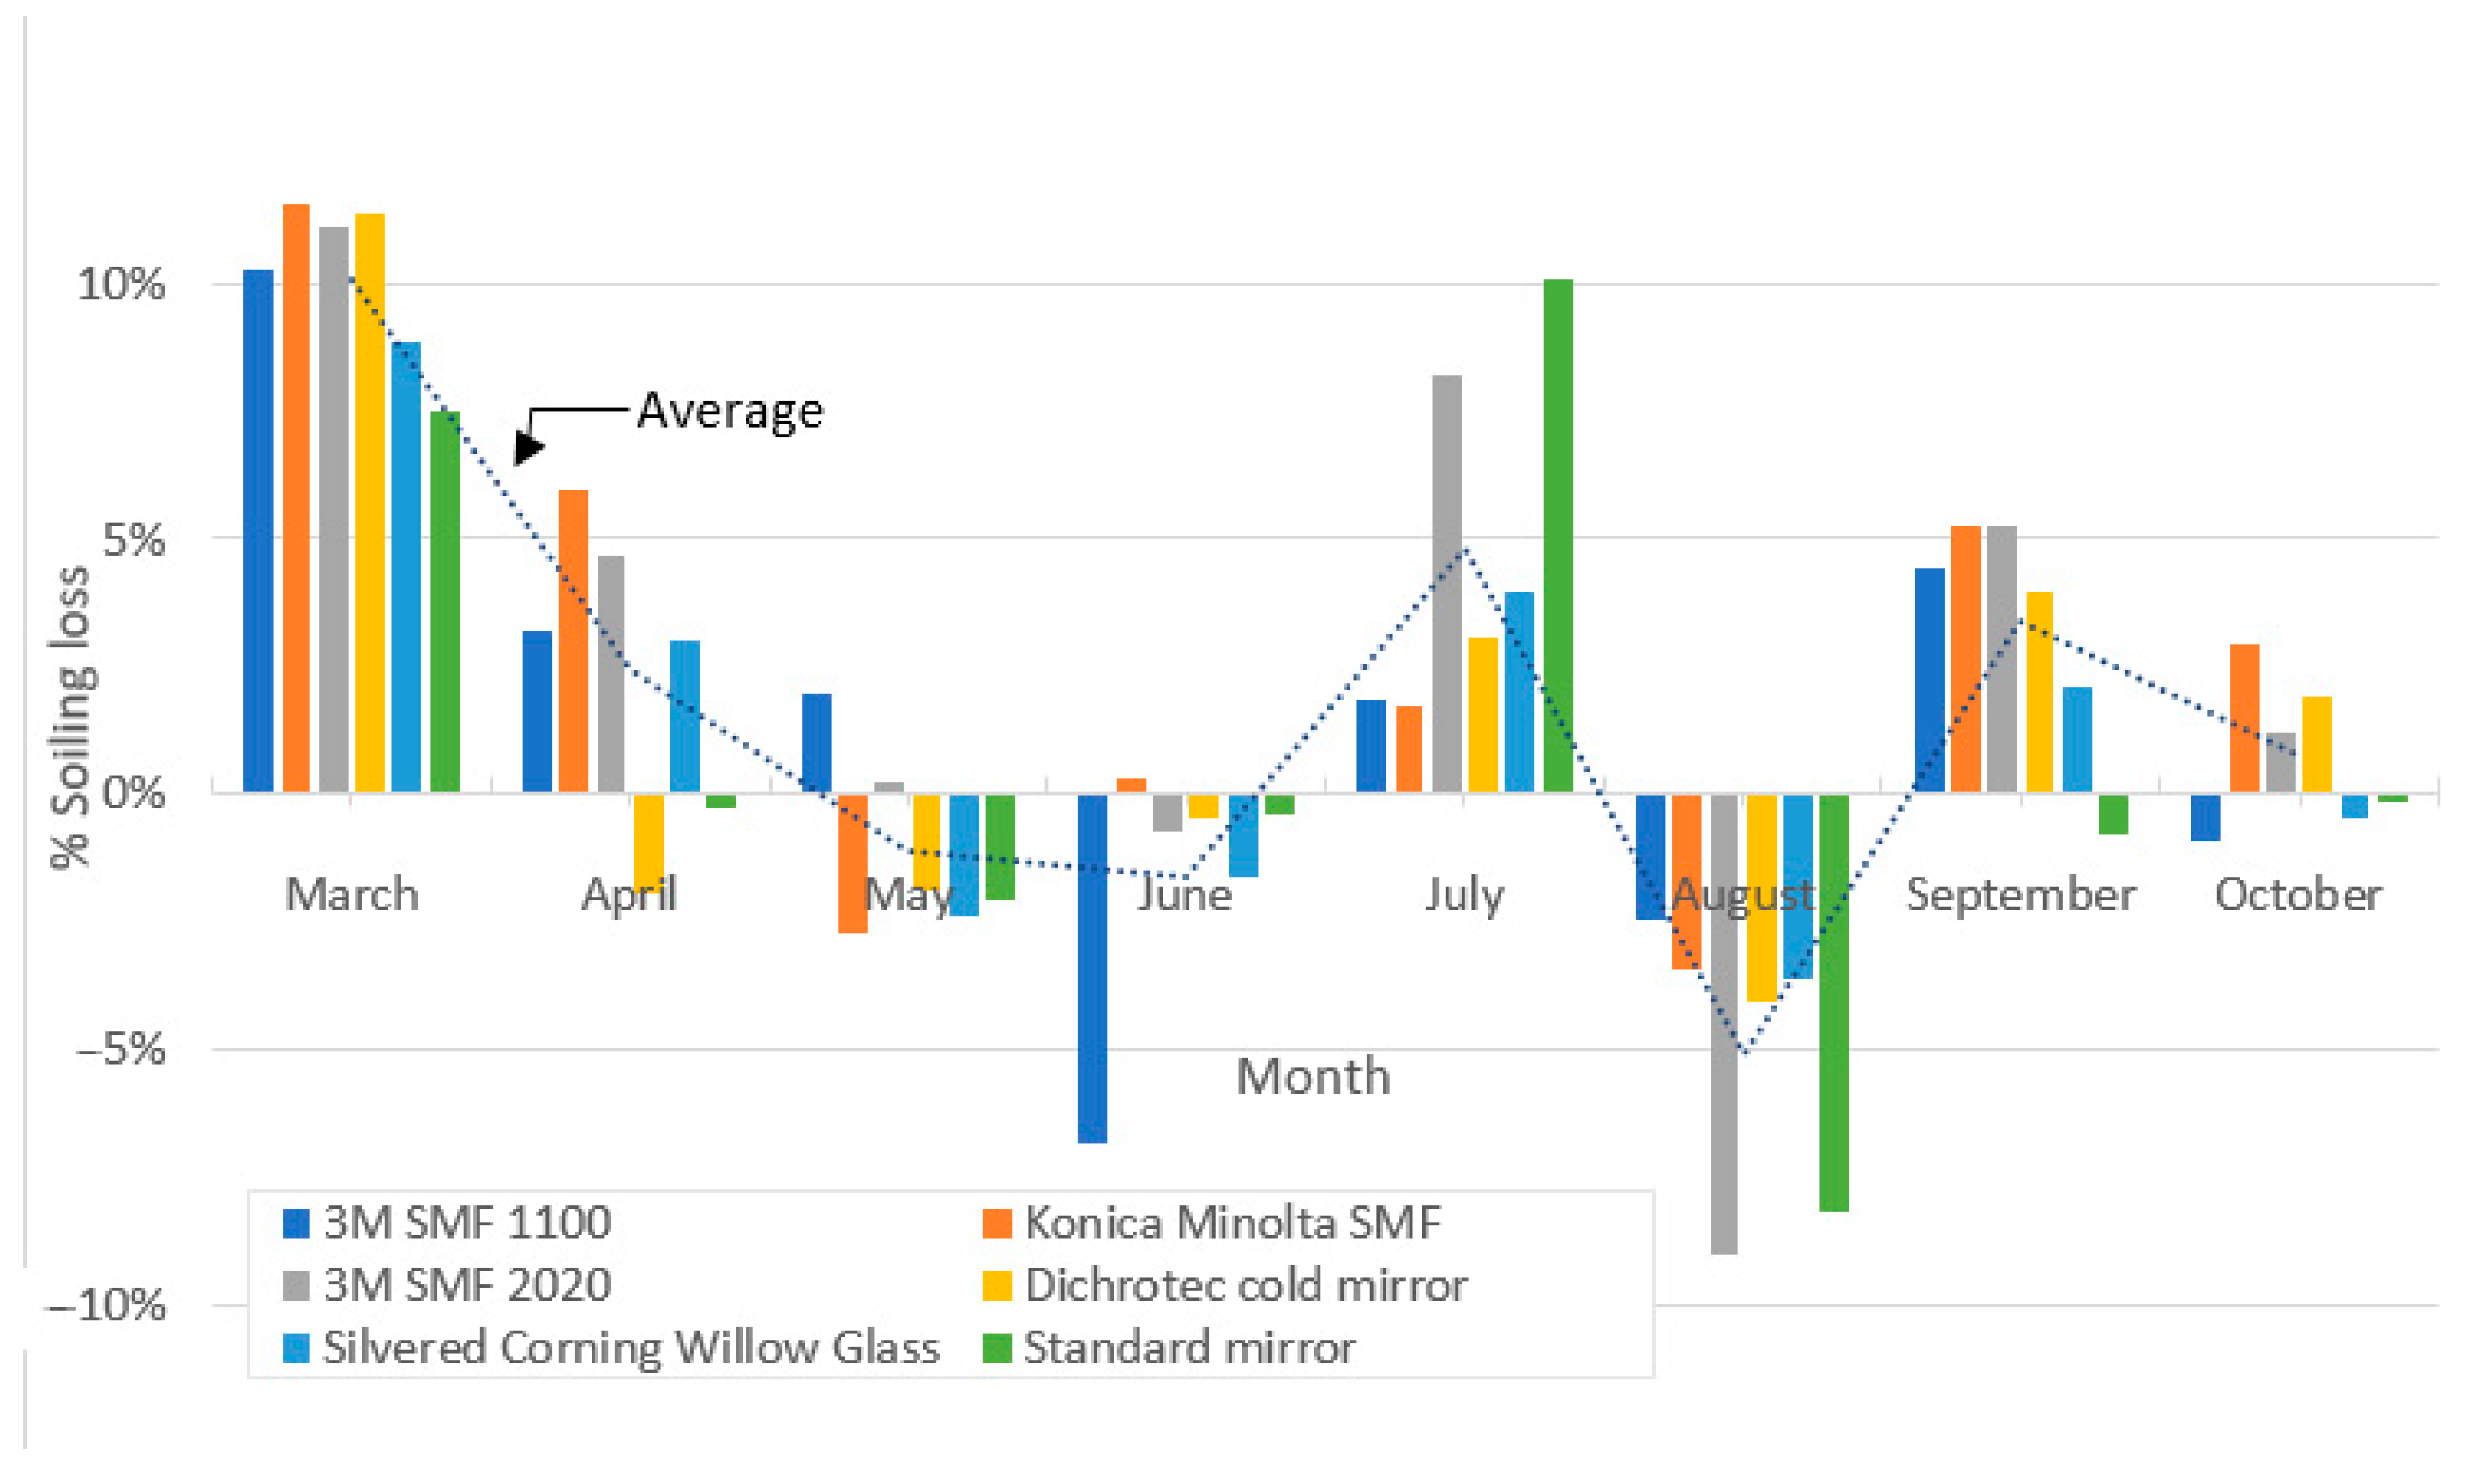
In the initial testing in February, the cleanliness, calculated using Equation 1, was found to be 99.8% averaging the value of all reflectors. In March, it was 89.7%, in April, it was 87.2%, and the lowest was the 9 October test with 81.3%. The monthly SL (Figure 11) shows the difference between the end of one month’s cleanliness and compared to the end of month following. In the beginning of the testing period and before any soiling occurred, there was a large contrast between the soiling at the beginning and end of the month. A trend is observed from the start of this study, where the SL percentage generally decreases each month (except for July and September), as shown with the dotted line in Figure 11. Initially, there is a large difference in the amount of soiling, but the rate decreases after reflectors are soiled. The July and September anomalies are possibly due to large precipitation events in the previous month. The average month across the entire testing period incurred a 2% SL however, in the beginning of this study a 10% SL average was shown. May, June, and August all showed an increase in cleanliness at the end of the month due to natural precipitation events.
The SR average and standard deviation of all testing dates is shown in Table 2. The average of all measurements and seasonal variation does not take into account the positive SR values, because these are due to rain cleaning; conversely, negative values represent a decrease in cleanliness. This can be due to several factors, including humidity, precipitation, wind, and soiling composition. Specific dates in between precipitation events at the end of spring and at the beginning of fall were picked to show SR without natural cleaning for this site. The two dates shown in Table 2, 30 May and 11 September, had 0 inches of precipitation in the prior week before taking measurement. Soiling rates in desert or semi-desert climates have been found to be −0.0052/d in the Tabernas desert in Spain [7]; and −0.005/d in the semi-arid southern Kalahari region near Kathu in Northern Cape, South Africa [27]. These are significantly larger than the average SR in this study. However, when observing specific dates between precipitation events, the average soiling of all reflectors on 11 September was found to be −0.0053/d, which correlates closely with these two regions.
As shown in Table 2, the Konica Minolta SMF gave the highest SR of −0.0135/d for the September 11th test. Other reflectors had a similar average, varying between −0.0024/d and −0.0037/d for the 2 days tested. The silvered Corning Willow Glass and standard mirror gave the lowest average SR at −0.0024/d. The average SR of all reflectors was found to be −0.0040/d, which is slightly less than the SR found in previous studies presented above.
Seasonal variations are also included in Table 2, as the SR has been shown to vary throughout the year. The summer had the highest average SR of −0.00465/d compared with −0.0032/d in the fall and −0.0020/d in the spring. Positive SR values are due to rain events, and, in the summer of 2019, there were 34 precipitation event days compared with 20 in the spring and 22 in the fall. Total precipitation was 25 inches in spring, 16.4 inches the summer, and 8.9 inches the fall. As stated earlier, a precipitation event must be 0.012 inches or greater to be counted.
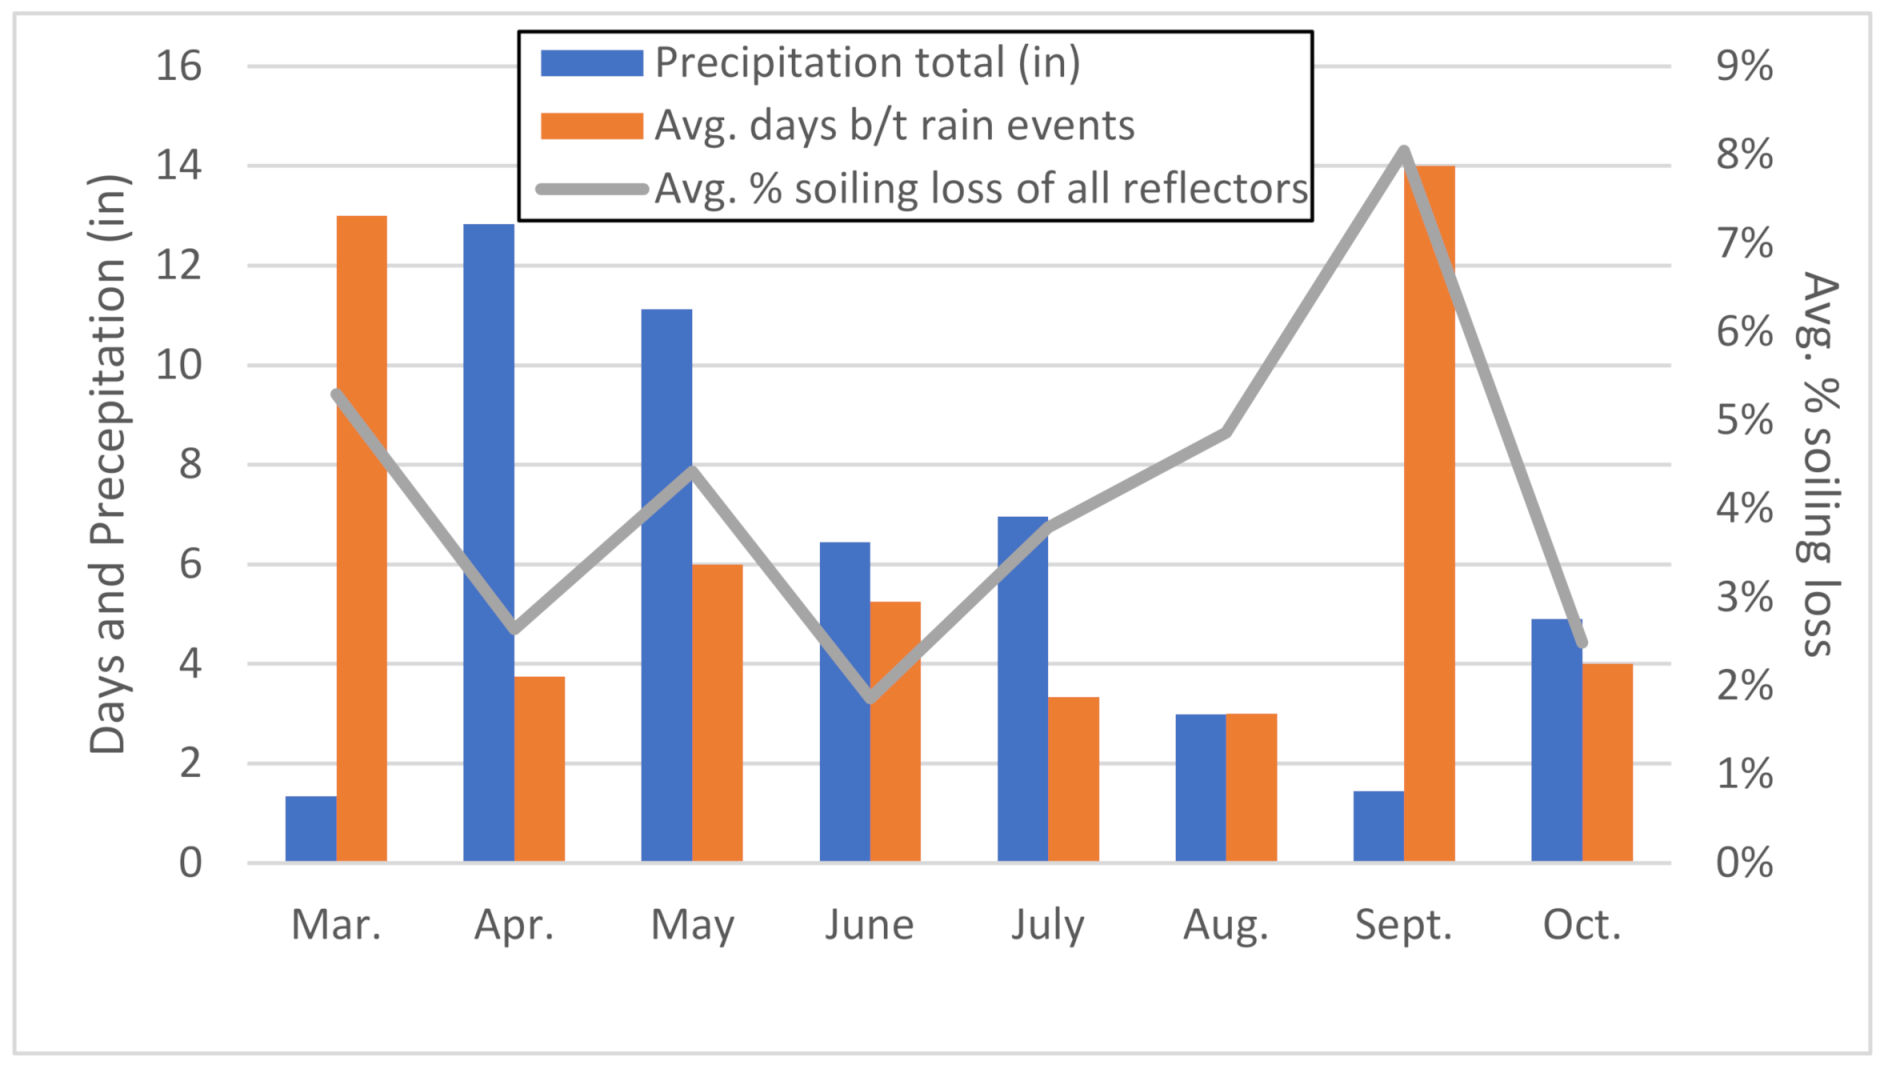
In a previous study, it was found that SLs had the strongest correlation with the average number of days between rain events [39]. As shown in Figure 12, the monthly average SL for all reflectors correlates with the average days between rain events. September had the least amount of precipitation and the highest average number of days between rain events. This combination resulted in the highest average SL of 8% across all the reflectors.
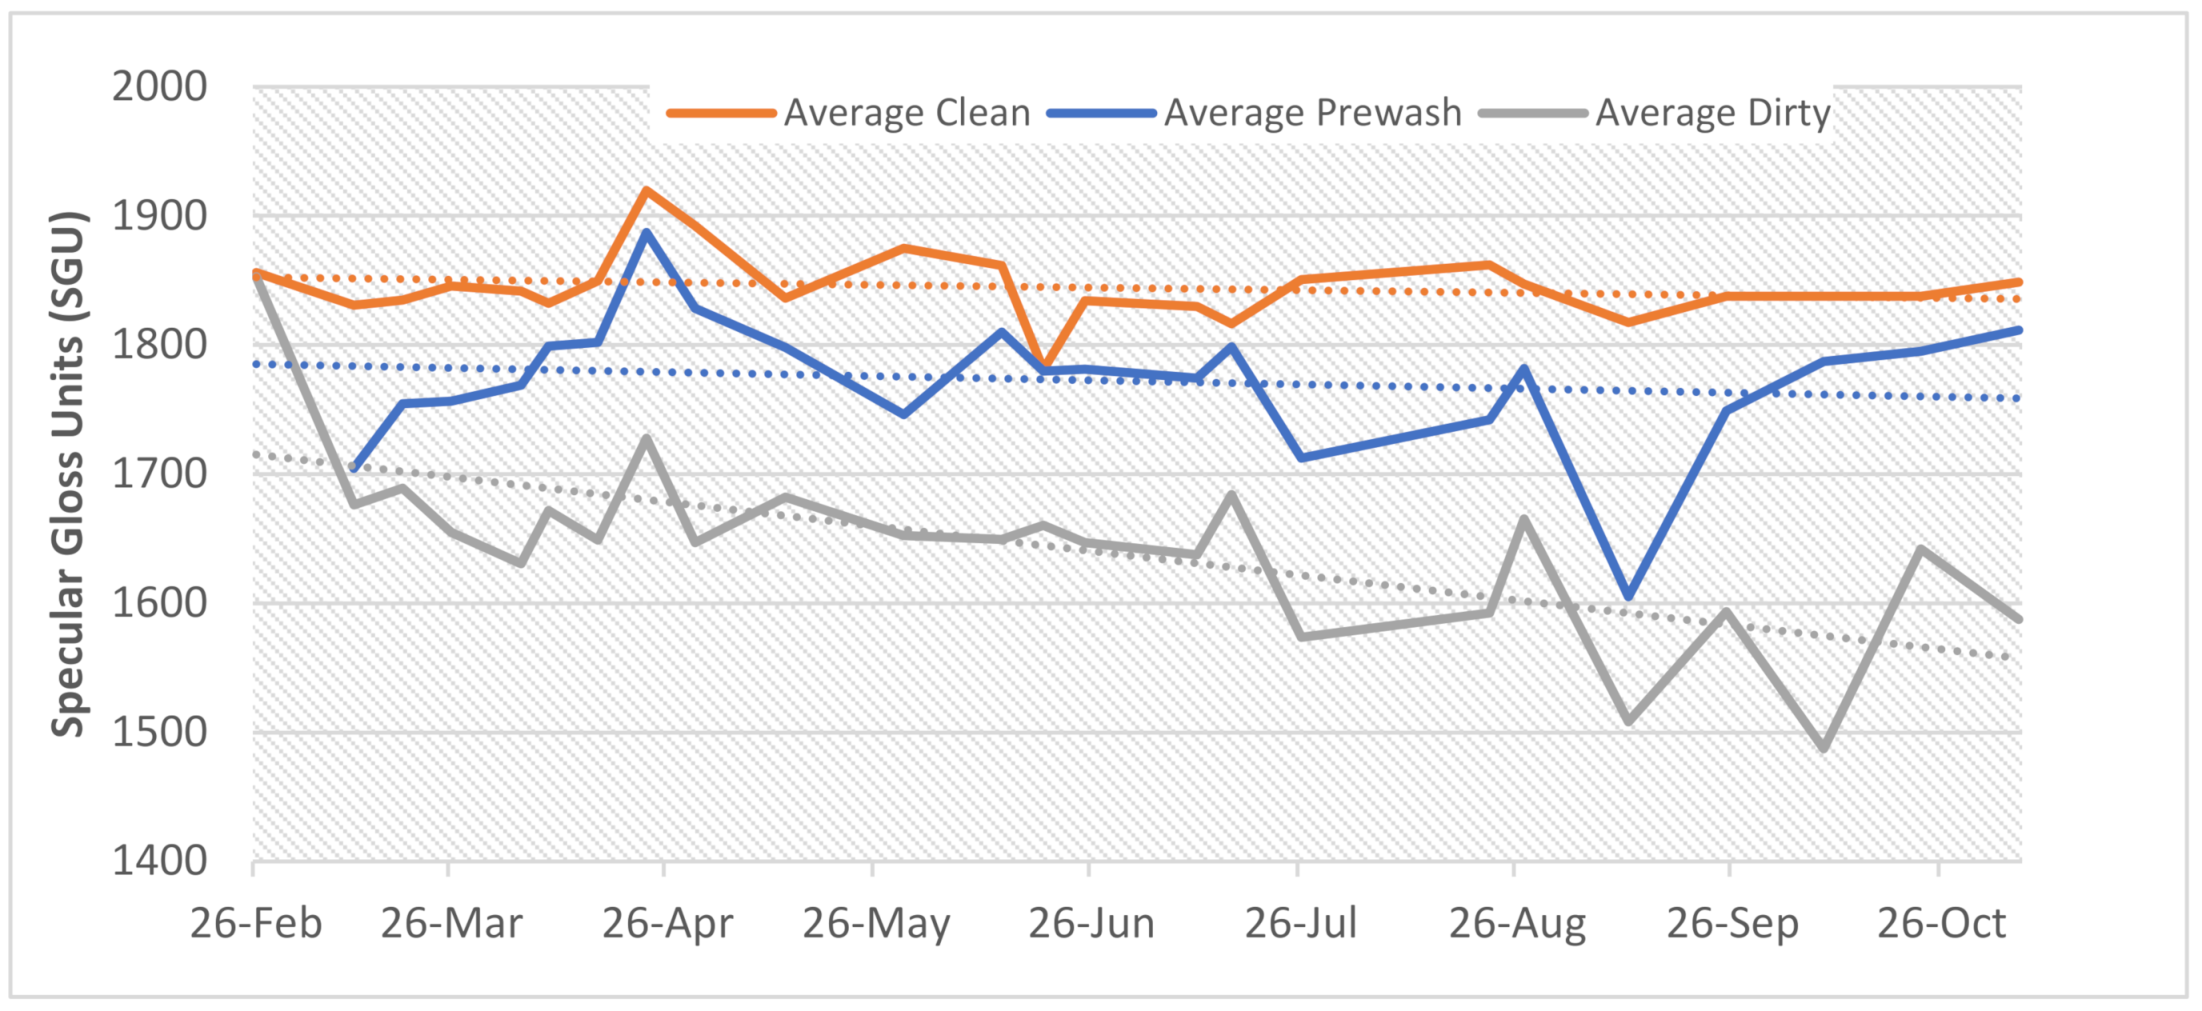
An average of all panels was taken to see the overall trend of the SGU measurements throughout this study as shown in Figure 13. The average clean reflectors stayed consistent with a linear slope of −0.0356. The average prewash reflectors showed more of a decline throughout the testing period with a linear slope of −0.31. Despite heavy precipitation events, the dirty reflectors have a gradually lower linear trend with a slope of −0.79.
5. Discussion
The silvered Corning Willow Glass had the highest SGU when no cleaning occurred during this study. This reflector was the least affected by soiling compared with the thin-films and showed a much higher SGU than the other glass types tested. Following precipitation events, the silvered Corning Willow Glass was more efficiently clean, with a 7.3% higher average than the thin-films tested. This thin-glass reflective material would be most suitable in applications where regular cleaning does not occur or is not possible. The 3M SMF 2020 and Konica Minolta SMF consistently outperformed other cleaned and prewashed reflectors with highest average SGU throughout this study. Although the 3M SMF 2020 provided a higher SGU reading than the predecessor, 3M SMF 1100, the 1100 was much less affected by soiling and showed a slightly higher average SGU when not cleaned.
Two of the glass-type reflectors tested, the dichrotec cold mirror and the standard mirror, gave the fewest SGU readings on average throughout this study. However, they were also the least affected by soiling compared with all the other reflectors; with the standard mirror having the least SL average (6.7%). The SR was found to be lowest in the silvered Corning Willow Glass and standard mirror, and it was highest in the Konica Minolta SMF and 3M SMF 2020 (Table 2). After initial soiling, the loss of cleanliness slowed down and even showed an increase in two of the months, possibly due to the frequency of precipitation events. The highest average percentage of SL for all reflectors throughout this study was 19%, which occurred on October 9, and, if this study continued, this number would keep increasing, following the trend in Figure 13. The prewashed reflector panels SGU decreased during the year, demonstrating a gradual increase in soiling. The trend of the average of the dirty panels continually showed less gloss throughout the year. Even though there were frequent rain events in semi-tropical regions, such as south Louisiana, such rain events were not sufficient to clean the reflectors tested.
6. Conclusions
In this study, a CSP reflector testbed was designed to test current and novel reflective materials in an effort to further knowledge of soiling effects in the semi-topical climate in southern Louisiana. Although the silvered Corning Willow Glass was shown to give the best SGU reading with only natural cleaning, the 3M SMF 2020 and Konaca Minolta SMF performed the best with regular cleaning intervals. In analyzing the seasons, the highest total seasonal precipitation occurred in the spring, and, consequently, the lowest SR was found during this season. It was also found that the lower the precipitation and higher average days between rain events, the higher the accumulation of soiling. Rain events in Louisiana were shown to decrease the SR average throughout the season. However, rain events do not adequately clean the reflectors, as evident by the SGU readings continuing a downward trend, whereas the weekly cleaned or prewash showed a relatively constant SGU reading throughout this study. The resulting soiling patterns are valuable in understanding the response of different reflector materials in semitropical regions. With increased interest in CSP, this research can be used for investors and actors in the field of energy in analyzing candidate CSP sites. There are many locations in semitropical and tropical regions in the United States and the Caribbean that have yet to be tested with CSP technologies. Future studies could include the ways contaminants, such as pollen, interact with the surface of the reflective materials and to determine the cause of the reduction in SGU readings that was noticed in this study.
Author Contributions
Conceptualization, K.R.III; methodology, K.R.III; software, K.R.III and A.M.; validation, K.R.III; formal analysis, K.R.III and A.M.; resources, T.C.; data curation, K.R.III and A.M.; writing—original draft preparation, K.R.III; writing—review and editing, A.M., and T.C.; supervision, K.R.III and T.C.; funding acquisition, T.C. All authors have read and agreed to the published version of the manuscript.
Funding
This work was made possible by the funding from Cleco Power LLC.
Institutional Review Board Statement
Not applicable.
Informed Consent Statement
Not applicable.
Data Availability Statement
The data presented in this study are available on request from the corresponding author.
Conflicts of Interest
The authors declare no conflict of interest.
References
- Bergeron, K.D.; Freese, J.M. Cleaning Strategies for Parabolic Trough Solar Collector Fields; Guidelines for Decisions; Sandia National Lab. (SNL-NM): Albuquerque, NM, USA, 1981.
- Wolfertstetter, F.; Wilbert, S.; Terhag, F.; Hanrieder, N.; Fernandez-García, A.; Sansom, C.; King, P.; Zarzalejo, L.; Ghennioui, A. Modelling the soiling rate: Dependencies on meteorological parameters. AIP Conf. Proc. 2019, 2126. [Google Scholar] [CrossRef] [Green Version]
- Roumpakias, E.; Stamatelos, T. Surface dust and aerosol effects on the performance of grid-connected photovoltaic systems. Sustainability 2020, 12, 569. [Google Scholar] [CrossRef] [Green Version]
- Sansom, C.; Comley, P.; Bhattacharyya, D.; Macerol, N. A comparison of polymer film and glass collectors for concentrating solar power. Energy Procedia 2013, 49, 209–219. [Google Scholar]
- Musango, J.; Dinter, F. Measuring and Modelling the Influence of Weather Factors on CSP Reflector Soiling. Master’s Thesis, Mechanical Engineering, Stellenbosch University, Matieland, South Africa, 2016. Available online: http://www.crses.sun.ac.za/files/research/completed-research/eppei/JMusango.pdf (accessed on 10 December 2019).
- Fernández-García, A.; Álvarez-Rodrigo, L.; Martínez-Arcos, L.; Aguiar, R.; Márquez-Payés, J.M. Study of different cleaning methods for solar reflectors used in CSP plants. Energy Procedia 2013, 49, 80–89. [Google Scholar]
- Wolfertstetter, F.; Wilbert, S.; Dersch, J.; Dieckmann, S.; Pitz-Paal, R.; Ghennioui, A. Integration of soiling-rate measurements and cleaning strategies in yield analysis of parabolic trough plants. J. Sol. Energy Eng. Trans. ASME 2018, 140, 4–8. [Google Scholar]
- Bouaddi, S.; Fernández-García, A.; Sansom, C.; Sarasua, J.A.; Wolfertstetter, F.; Bouzekri, H.; Sutter, F.; Azpitarte, I. A review of conventional and innovative- sustainable methods for cleaning reflectors in concentrating solar power plants. Sustainability 2018, 10, 3937. [Google Scholar] [CrossRef] [Green Version]
- Bouaddi, S.; Fernández-García, A.; Ihlal, A.; Ait El Cadi, R.; Álvarez-Rodrigo, L. Modeling and simulation of the soiling dynamics of frequently cleaned reflectors in CSP plants. Sol. Energy 2018, 166, 422–431. [Google Scholar]
- Merrouni, A.A.; Mezrhab, A.; Ghennioui, A.; Naimi, Z. Measurement, comparison and monitoring of solar mirror’s specular reflectivity using two different Reflectometers. Energy Procedia 2017, 119, 433–445. [Google Scholar]
- Salinas, I.; Heras, C.; Alcañiz, C.; Izquierdo, D.; Martínez, N.; Alonso, R. Portable Solar Spectrum Reflectometer for planar and parabolic mirrors in solar thermal energy plants. Sol. Energy 2016, 135, 446–454. [Google Scholar]
- Pettit, R.B. Characterizing Solar Mirror Materials Using Portable Reflectometers; Sandia National Lab. (SNL-NM): Albuquerque, NM, USA, 1982. Available online: http://www.osti.gov/scitech/biblio/6718528 (accessed on 10 December 2019).
- Levinson, R.; Akbari, H.; Berdahl, P. Measuring solar reflectance-Part II: Review of practical methods. Sol. Energy 2010, 84, 1745–1759. [Google Scholar]
- Ritter, I.I.I.K.A.; Prilliman, M.J.; Chambers, T.L.; Raush, J.R. Maintenance of a Small-Scale Parabolic Trough Concentrating Solar Power Plant in Louisiana. Int. J. Sustain. Green Energy 2018, 6, 104–111. [Google Scholar]
- Merrouni, A.A.; Wolfertstetter, F.; Mezrhab, A.; Wilbert, S.; Pitz-Paal, R. Investigation of Soiling Effect on Different Solar Mirror Materials under Moroccan Climate. Energy Procedia 2015, 69, 1948–1957. [Google Scholar]
- Azouzoute, A.; Merrouni, A.A.; Garoum, M.; Bennouna, E.G. Comparison of soiling effect of two different solar mirrors in mid-south of Morocco. AIP Conf. Proc. 2019, 2126. [Google Scholar] [CrossRef]
- Sutter, F.; Meyen, S.; Fernández-García, A.; Heller, P. Spectral characterization of specular reflectance of solar mirrors. Sol. Energy Mater. Sol. Cells 2016, 145, 248–254. [Google Scholar]
- Bouaddi, S.; Ihlal, A.; Fernández-García, A. Comparative analysis of soiling of CSP mirror materials in arid zones. Renew. Energy 2017, 101, 437–449. [Google Scholar]
- Kennedy, C.E.; Terwilliger, K. Optical Durability of Candidate Solar Reflectors. J. Sol. Energy Eng. 2005, 127, 262. [Google Scholar]
- El Baraka, A.; Ennaceri, H.; Ennaoui, A.; Ghennioui, A.; Jorio, A.; Khaldoun, A. A novel approach to evaluate soiling adhesion on the surface of CSP reflectors via extended DLVO theory. Appl. Phys. A Mater. Sci. Process. 2019, 125, 1–8. [Google Scholar]
- Biryukov, S.; Faiman, D.; Goldfeld, A. An Optical System for the Quantitative Study of Particulate Contamination on Solar Collector Surfaces. Sol. Energy 1999, 66, 371–378. [Google Scholar]
- Wette, J.; Fernández-García, A.; Sutter, F.; Buendía-Martínez, F.; Argüelles-Arízcun, D.; Azpitarte, I.; Pérez, G. Water saving in CSP plants by a novel hydrophilic anti-soiling coating for solar reflectors. Coatings 2019, 9, 739. [Google Scholar] [CrossRef] [Green Version]
- Wette, J.; Sutter, F.; Fernández-García, A. Evaluation of anti-soiling coatings for CSP reflectors under realistic outdoor conditions. Sol. Energy 2019, 191, 574–584. [Google Scholar]
- Conceição, R.; Merrouni, A.A.; Lopes, D.; Alae, A.; Silva, H.G.; Bennouna, E.G.; Collares-Pereira, M.; Ghennioui, A. A comparative study of soiling on solar mirrors in Portugal and Morocco: Preliminary results for the dry season. In Proceedings of the SolarPACES, Casablanca, Morocco, 1–4 October 2019; pp. 220001-1–220001-7. [Google Scholar] [CrossRef] [Green Version]
- Bellmann, P.; Wolfertstetter, F.; Conceição, R.; Silva, H.G. Comparative modeling of optical soiling losses for CSP and PV energy systems. Sol. Energy 2020, 197, 229–237. [Google Scholar]
- Wolfertstetter, F.; Pottler, K.; Geuder, N.; Affolter, R.; Merrouni, A.A.; Mezrhab, A.; Pitz-Paal, R. Monitoring of mirror and sensor soiling with TraCS for improved quality of ground based irradiance measurements. Energy Procedia 2013, 49, 2422–2432. [Google Scholar]
- Griffith, D.J.; Vhengani, L.; Maliage, M. Measurements of mirror soiling at a candidate CSP site. Energy Procedia 2013, 49, 1371–1378. [Google Scholar]
- Karim, M.; Naamane, S.; Delord, C.; Bennouna, A. Study of the Surface Damage of Glass Reflectors Used in Concentrated Solar Power Plants. Energy Procedia 2015, 69, 106–115. [Google Scholar]
- Bouaddi, S.; Ihlal, A. Monthly soiling comparison of CSP candidate mirrors exposed in southwest Morocco. Mater. Today Proc. 2016, 3, 2556–2561. [Google Scholar]
- Picotti, G.; Borghesani, P.; Manzolini, G.; Cholette, M.E.; Wang, R. Development and experimental validation of a physical model for the soiling of mirrors for CSP industry applications. Sol. Energy 2018, 173, 1287–1305. [Google Scholar]
- Conceição, R.; Silva, H.G.; Collares-Pereira, M. CSP mirror soiling characterization and modeling. Sol. Energy Mater. Sol. Cells 2018, 185, 233–239. [Google Scholar]
- Cohen, G.; Kearney, D.; Kolb, G. Final Report on the Operation and Maintenance Improvement Program for Concentrating Solar Power Plants; Sandia National Lab. (SNL-NM): Albuquerque, NM, USA, 1999.
- Xu, X.; Vignarooban, K.; Xu, B.; Hsu, K.; Kannan, A.M. Prospects and problems of concentrating solar power technologies for power generation in the desert regions. Renew. Sustain. Energy Rev. 2016, 53, 1106–1131. [Google Scholar]
- Pernick, R.; Wilder, C. Utility Solar (USA) Study Reaching Ten Percent Solar By 2025; Clean Edge, Inc., Co-op America Foundation: Washington, DC, USA, 2008. [Google Scholar]
- Sansom, C.; Fernandez-Garcia, A.; Sutter, F.; Almond, H.; King, P. Contact cleaning of polymer film solar reflectors. In Proceedings of the SolarPACES, Cape Town, South Africa, 11–14 October 2016; p. 020022-8. [Google Scholar]
- Wolfertstetter, F.; Pottler, K.; Merrouni, A.A.; Mezrhab, A.; Pitz-paal, R. A Novel Method for Automatic Real-Time Monitoring of Mirror Soiling Rates. In Proceedings of the SolarPACES, Marrakesch, Morocco, 11–14 September 2012; pp. 2–5. [Google Scholar]
- Fernández-García, A.; Sutter, F.; Montecchi, M.; Sallaberry, F.; Heimsath, A.; Heras, C.; Le Baron, E.; Soum-Glaude, A. Parameters and Method to Evaluate the Reflectance Properties of Reflector Materials for Concentrating Solar Power Technology, Official Reflectance Guideline Version 3.0. In Proceedings of the SolarPACES, Casablanca, Morocco, 2–5 October 2018; Available online: http://www.solarpaces.org/wp-content/uploads/20180320_SolarPACES-Reflectance-Guidelines-V3.pdf (accessed on 10 December 2019).
- Wolfertstetter, F.; Wilbert, S.; Hanrieder, N.; Keller, L.; Gonzalez Rodriguez, S.; Kuhn, P.M.; Nouri, B. Soiling in CSP: Modeling and Forecasting from Weather Inputs; DLR: Cologne, Germany, 2018. [Google Scholar] [CrossRef]
- Micheli, L.; Muller, M. An investigation of the key parameters for predicting PV soiling losses. Prog. Photovolt. Res. Appl. 2017, 25, 291–307. [Google Scholar]
- Deceglie, M.G.; Muller, M.; Defreitas, Z.; Kurtz, S. A scalable method for extracting soiling rates from PV production data. In Proceedings of the 2017 IEEE 44th Photovolt Spec Conf PVSC, Washington, DC, USA, 25–30 June 2017; pp. 1–5. [Google Scholar]
- Raush, J.R.; Chambers, T.L. Initial field testing of concentrating solar photovoltaic (CSPV) thermal hybrid solar energy generator utilizing large aperture parabolic trough and spectrum selective mirrors. Int. J. Sustain. Green Energy 2014, 3, 123–131. [Google Scholar]
- BYK-Gardner GmbH. Technical Performance Objectives. Geretsried. 2017. Available online: http://www.3gpp.org/ftp/Specs/html-info/0305.htm (accessed on 10 December 2019).
- Hanson, A.R. Good Practice Guide for the Measurement of Gloss; National Physical Laboratory: Teddington, UK, 2006. [Google Scholar]
- ASTM D523-14. In Standard Test Method for Specular Gloss; ASTM Internationnal: West Conshohocken, PA, USA, 2018; Available online: www.astm.org (accessed on 10 December 2019).
- National Renewable Energy Laboratory (NREL). Measurement and Instrumentation Data Center (MIDC). 2020. Available online: https://midcdmz.nrel.gov/ (accessed on 6 May 2019).
Figure 1.
Concentrating solar power reflector testbeds: (a) Sandia national laboratories, Albuquerque, NM [1]; (b) Plataforma Solar de Almería (PSA) Tabernas, Almería, Spain [6]; (c) the semi-arid southern Kalahari region in Northern Cape, South Africa [27]; (d) left is Temara Oceanside site and right is the Skoura desert site in Morocco [28]; (e) Southwest Morocco [29]; (f) University of Oujda in Eastern Morocco [10]; (g) Gardens Point campus, Brisbane, Australia [30]; (h) PSA in Tabernas, Almería, Spain [23]; (i) Benguerir, Morocco [14]; (j) Portugal on an experimental site (Valverde) of the University of Évora [26]; (k) in a rural region of Évora, Alentejo, Portugal [31].

Figure 2.
Solar reflector cleaning in Crowley, LA.

Figure 3.
Concentrating solar panel reflector testbed installed at the Solar Applied Research and Testing (START) Lab in Crowley, Louisiana. Bottom row is cleaned for testing and the top is left dirty.
Figure 3.
Concentrating solar panel reflector testbed installed at the Solar Applied Research and Testing (START) Lab in Crowley, Louisiana. Bottom row is cleaned for testing and the top is left dirty.

Figure 4.
Byk-Gardner micro-TRI-gloss glossmeter.

Figure 5.
Gloss of natural event–cleaned reflector panels.

Figure 6.
Gloss of prewash (cleaned at regular intervals) reflector panels.

Figure 7.
Gloss of cleaned reflector panels.

Figure 8.
All three tests on 3M SMF 2020, top, and silvered Cornering Willow Glass, bottom.


Figure 9.
Cumulative percentage of soiling loss in the dirty (natural cleaning only) reflectors.

Figure 10.
Soiling loss in prewash (cleaned at regular intervals) reflector panels.

Figure 11.
Reflector soiling loss for each month.

Figure 12.
Monthly average % soiling loss of all reflectors compared with precipitation and days between rain events.
Figure 12.
Monthly average % soiling loss of all reflectors compared with precipitation and days between rain events.

Figure 13.
Trends of the average clean, prewash, and dirty SGU measurements.


Table 1.
Main findings of reflector testbed studies.
| Reference | Location | Studied Technology | Main Findings | |
|---|---|---|---|---|
| (a) | [1] | Ten industrial sites in the United States | Cleaning strategies of 144 reflective materials | Cleaning problem is site specific |
| (b) | [6] | Tabernas, Almería, Spain | Different cleaning methods | High-pressure demineralized water method for semi-desert climate |
| (c) | [27] | Northern Cape, South Africa, in a semi-arid region | Novel reflectometer design to measure loss of reflectivity due to mirror soiling | Mean rate of loss of specular reflectivity was at the level of 0.5% per day |
| (d) | [28] | Oceanside and desert site in Morocco | Mirror surface damage from climatic stress factors | Reflectivity loss was under 0.4% after 240 days outdoors |
| (e) | [29] | Southwest Morocco | Comparison of aluminum and silvered-glass soiling | Glass shows lower reflectance values but cleaned more effectively by raining event |
| (f) | [10] | Eastern Morocco | Reflectivity measurements using different reflectometers | In dry periods, reflectance drop can reach 30%; non-industry standard reflectometer can over-estimate by 23.5% |
| (g) | [30] | Brisbane, Australia | Development and validation of a physical model for the soiling of mirrors | Measured daily loss of reflectance between 0.5%/day and 2.1%/day, the model reflectance loss predictions have an average relative error of 14% |
| (h) | [23] | Tabernas, Almería, Spain | Evaluation of anti-soiling coatings for CSP reflectors | Coatings resulted in higher reflectance, but their properties degrade over time resulting in lower reflectance values over several years of exposure |
| (i) | [14] | Benguerir, Morocco | Comparison of soiling effect of aluminum and glass reflectors | In terms of reflectivity losses, aluminum was less affected by dust than glass |
| (j) | [26] | Rural site (Valverde) near Évora, Portugal | Comparative modeling of optical soiling losses for CSP and PV | Optical soiling losses are found to be higher by a factor of 8–14 in CSP for the same particle surface densities compared with PV |
| (k) | [31] | A rural region of Évora, Alentejo, Portugal | CSP mirror soiling characterization and modeling using TraCS (tracking cleanliness sensor) | TraCS shows well-defined soiling rates during summer and trends between soiling increase or decrease and environmental behavior |
Table 2.
Soiling rates by reflector material.
| All Units are Per Day (#/d) | 3M SMF 1100 | Konica Minolta SMF | 3M SMF 2020 | Dichrotec Cold Mirror | Silvered Corning Willow Glass | Standard Mirror | Average of All |
|---|---|---|---|---|---|---|---|
| All Measurements | |||||||
| Average | −0.0021 | −0.0043 | −0.0022 | −0.0039 | −0.0023 | −0.0025 | −0.0029 |
| Std Dev | 0.0014 | 0.0044 | 0.0021 | 0.0041 | 0.0017 | 0.0029 | 0.0014 |
| Specific Dates | |||||||
| 5/30/19 | −0.0048 | −0.0046 | −0.0033 | −0.0002 | −0.0022 | −0.0012 | −0.0027 |
| 9/11/19 | −0.0020 | −0.0135 | −0.0041 | −0.0061 | −0.0026 | −0.0036 | −0.0053 |
| Average | −0.0034 | −0.0090 | −0.0037 | −0.0031 | −0.0024 | −0.0024 | −0.0040 |
| Seasonal Variations | |||||||
| Spring | −0.0016 | −0.0030 | −0.0016 | −0.0015 | −0.0025 | −0.0017 | −0.0020 |
| Summer | −0.0027 | −0.0048 | −0.0028 | −0.0078 | −0.0032 | −0.0057 | −0.0045 |
| Fall | −0.0020 | −0.0068 | −0.0021 | −0.0061 | −0.0010 | −0.0014 | −0.0032 |
Publisher’s Note: MDPI stays neutral with regard to jurisdictional claims in published maps and institutional affiliations. |
© 2021 by the authors. Licensee MDPI, Basel, Switzerland. This article is an open access article distributed under the terms and conditions of the Creative Commons Attribution (CC BY) license (https://creativecommons.org/licenses/by/4.0/).
Share and Cite
MDPI and ACS Style
Ritter, K., III; McBride, A.; Chambers, T. Soiling Comparison of Mirror Film and Glass Concentrating Solar Power Reflectors in Southwest Louisiana. Sustainability 2021, 13, 5727. https://0-doi-org.brum.beds.ac.uk/10.3390/su13105727
AMA Style
Ritter K III, McBride A, Chambers T. Soiling Comparison of Mirror Film and Glass Concentrating Solar Power Reflectors in Southwest Louisiana. Sustainability. 2021; 13(10):5727. https://0-doi-org.brum.beds.ac.uk/10.3390/su13105727
Chicago/Turabian StyleRitter, Kenneth, III, Albert McBride, and Terrence Chambers. 2021. "Soiling Comparison of Mirror Film and Glass Concentrating Solar Power Reflectors in Southwest Louisiana" Sustainability 13, no. 10: 5727. https://0-doi-org.brum.beds.ac.uk/10.3390/su13105727
Note that from the first issue of 2016, this journal uses article numbers instead of page numbers. See further details here.