
Development of Modified SERVQUAL–MCDM Model for Quality Determination in Reverse Logistics

 ,
,  , ,
, ,
Abstract
:1. Introduction
2. Literature Review
3. Methodology
4. Case Study
5. Results
- Between E10 and E19 r = +0.792
- Between P10 and P19 r = +0.654
- Between E10 and P10 r = +0.945
- Between E19 and P19 r = +0.915
- A total of 12 responses had significantly lower ratings than expected, such as: E01/P01, E03/P03, E04/P04, E06/P06, E08/P08, E09/P09, E11/P11, E15/P15, E16/P16, E18/P18, E20/P20, E21/P21;
- A total of 7 responses remained at the level of expectations: E02/P02, E05/P05, E07/P07, E10/P10, E13/P13, E17/P17, E19/P19;
- A total of 2 responses had significantly higher ratings than expected: E12/P12, E14/P14.
6. Discussion
7. Conclusions
Author Contributions
Funding
Institutional Review Board Statement
Informed Consent Statement
Data Availability Statement
Conflicts of Interest
Appendix A. Statistical Analysis

| E01 | E02 | E03 | E04 | E05 | E06 | E07 | E08 | E09 | E10 | E11 | E12 | E13 | E14 | E15 | E16 | E17 | E18 | E19 | E20 | E21 | |
|---|---|---|---|---|---|---|---|---|---|---|---|---|---|---|---|---|---|---|---|---|---|
| E01 | 0.131 | 0.022 | 0.450 | 0.000 | 0.002 | 1.000 | 0.182 | 0.000 | 0.000 | 0.182 | 0.000 | 0.000 | 0.000 | 0.131 | 0.008 | 0.013 | 1.000 | 0.000 | 0.046 | 0.000 | |
| E02 | 0.131 | 0.000 | 0.013 | 0.000 | 0.000 | 0.289 | 0.480 | 0.000 | 0.000 | 0.480 | 0.000 | 0.000 | 0.000 | 0.752 | 0.001 | 0.505 | 0.387 | 0.002 | 0.752 | 0.000 | |
| E03 | 0.022 | 0.000 | 0.043 | 0.302 | 1.000 | 0.003 | 0.000 | 0.000 | 0.000 | 0.000 | 0.000 | 0.000 | 0.000 | 0.002 | 0.803 | 0.000 | 0.002 | 0.000 | 0.001 | 0.267 | |
| E04 | 0.450 | 0.013 | 0.043 | 0.001 | 0.016 | 0.221 | 0.013 | 0.000 | 0.000 | 0.013 | 0.000 | 0.000 | 0.000 | 0.043 | 0.077 | 0.003 | 0.343 | 0.000 | 0.009 | 0.001 | |
| E05 | 0.000 | 0.000 | 0.302 | 0.001 | 0.134 | 0.000 | 0.000 | 0.000 | 0.000 | 0.000 | 0.000 | 0.000 | 0.000 | 0.000 | 0.070 | 0.000 | 0.000 | 0.000 | 0.000 | 0.617 | |
| E06 | 0.002 | 0.000 | 1.000 | 0.016 | 0.134 | 0.001 | 0.000 | 0.000 | 0.000 | 0.000 | 0.000 | 0.000 | 0.000 | 0.000 | 0.547 | 0.000 | 0.002 | 0.000 | 0.000 | 0.221 | |
| E07 | 1.000 | 0.289 | 0.003 | 0.221 | 0.000 | 0.001 | 0.289 | 0.000 | 0.000 | 0.221 | 0.000 | 0.000 | 0.000 | 0.421 | 0.016 | 0.046 | 0.773 | 0.000 | 0.145 | 0.000 | |
| E08 | 0.182 | 0.480 | 0.000 | 0.013 | 0.000 | 0.000 | 0.289 | 0.000 | 0.001 | 0.480 | 0.000 | 0.000 | 0.000 | 0.773 | 0.001 | 0.547 | 0.343 | 0.001 | 0.773 | 0.000 | |
| E09 | 0.000 | 0.000 | 0.000 | 0.000 | 0.000 | 0.000 | 0.000 | 0.000 | 0.000 | 0.000 | 0.000 | 0.000 | 0.000 | 0.000 | 0.000 | 0.000 | 0.000 | 0.000 | 0.000 | 0.000 | |
| E10 | 0.000 | 0.000 | 0.000 | 0.000 | 0.000 | 0.000 | 0.000 | 0.001 | 0.000 | 0.000 | 0.000 | 0.000 | 0.054 | 0.000 | 0.000 | 0.002 | 0.001 | 1.000 | 0.001 | 0.000 | |
| E11 | 0.182 | 0.480 | 0.000 | 0.013 | 0.000 | 0.000 | 0.221 | 0.480 | 0.000 | 0.000 | 0.000 | 0.000 | 0.000 | 0.773 | 0.001 | 0.505 | 0.387 | 0.002 | 0.752 | 0.000 | |
| E12 | 0.000 | 0.000 | 0.000 | 0.000 | 0.000 | 0.000 | 0.000 | 0.000 | 0.000 | 0.000 | 0.000 | 1.000 | 0.001 | 0.000 | 0.000 | 0.000 | 0.000 | 0.000 | 0.000 | 0.000 | |
| E13 | 0.000 | 0.000 | 0.000 | 0.000 | 0.000 | 0.000 | 0.000 | 0.000 | 0.000 | 0.000 | 0.000 | 1.000 | 0.002 | 0.000 | 0.000 | 0.000 | 0.000 | 0.000 | 0.000 | 0.000 | |
| E14 | 0.000 | 0.000 | 0.000 | 0.000 | 0.000 | 0.000 | 0.000 | 0.000 | 0.000 | 0.054 | 0.000 | 0.001 | 0.002 | 0.000 | 0.000 | 0.000 | 0.000 | 0.004 | 0.000 | 0.000 | |
| E15 | 0.131 | 0.752 | 0.002 | 0.043 | 0.000 | 0.000 | 0.423 | 0.773 | 0.000 | 0.000 | 0.773 | 0.000 | 0.000 | 0.000 | 0.001 | 0.450 | 0.522 | 0.002 | 0.480 | 0.000 | |
| E16 | 0.008 | 0.001 | 0.803 | 0.077 | 0.070 | 0.547 | 0.016 | 0.001 | 0.000 | 0.000 | 0.001 | 0.000 | 0.000 | 0.000 | 0.001 | 0.000 | 0.034 | 0.000 | 0.000 | 0.070 | |
| E17 | 0.013 | 0.505 | 0.000 | 0.003 | 0.000 | 0.000 | 0.046 | 0.547 | 0.000 | 0.002 | 0.505 | 0.000 | 0.000 | 0.000 | 0.450 | 0.000 | 0.190 | 0.021 | 1.000 | 0.000 | |
| E18 | 1.000 | 0.387 | 0.002 | 0.343 | 0.000 | 0.002 | 0.773 | 0.343 | 0.000 | 0.001 | 0.387 | 0.000 | 0.000 | 0.000 | 0.522 | 0.034 | 0.190 | 0.000 | 0.286 | 0.000 | |
| E19 | 0.000 | 0.002 | 0.000 | 0.000 | 0.000 | 0.000 | 0.000 | 0.001 | 0.000 | 1.000 | 0.002 | 0.000 | 0.000 | 0.004 | 0.002 | 0.000 | 0.021 | 0.000 | 0.008 | 0.000 | |
| E20 | 0.046 | 0.752 | 0.001 | 0.009 | 0.000 | 0.000 | 0.149 | 0.773 | 0.000 | 0.001 | 0.752 | 0.000 | 0.000 | 0.000 | 0.480 | 0.000 | 1.000 | 0.286 | 0.008 | 0.000 | |
| E21 | 0.000 | 0.000 | 0.267 | 0.001 | 0.617 | 0.221 | 0.000 | 0.000 | 0.000 | 0.000 | 0.000 | 0.000 | 0.000 | 0.000 | 0.000 | 0.070 | 0.000 | 0.000 | 0.000 | 0.000 |
| P01 | P02 | P03 | P04 | P05 | P06 | P07 | P08 | P09 | P10 | P11 | P12 | P13 | P14 | P15 | P16 | P17 | P18 | P19 | P20 | P21 | |
|---|---|---|---|---|---|---|---|---|---|---|---|---|---|---|---|---|---|---|---|---|---|
| P01 | 0.001 | 0.000 | 0.003 | 0.000 | 0.371 | 0.000 | 0.080 | 1.000 | 0.027 | 0.000 | 0.043 | 0.000 | 0.000 | 0.000 | 0.000 | 0.387 | 0.000 | 0.134 | 0.099 | 0.182 | |
| P02 | 0.001 | 0.505 | 0.617 | 0.003 | 0.016 | 0.114 | 0.000 | 0.001 | 0.000 | 0.000 | 0.000 | 0.000 | 0.724 | 0.000 | 0.000 | 0.039 | 0.000 | 0.000 | 0.000 | 0.013 | |
| P03 | 0.000 | 0.505 | 0.182 | 0.013 | 0.001 | 0.450 | 0.000 | 0.000 | 0.000 | 0.000 | 0.000 | 0.000 | 1.000 | 0.000 | 0.000 | 0.002 | 0.000 | 0.000 | 0.000 | 0.003 | |
| P04 | 0.003 | 0.617 | 0.182 | 0.001 | 0.043 | 0.013 | 0.000 | 0.002 | 0.000 | 0.000 | 0.000 | 0.000 | 0.343 | 0.000 | 0.000 | 0.096 | 0.000 | 0.001 | 0.000 | 0.077 | |
| P05 | 0.000 | 0.003 | 0.013 | 0.001 | 0.000 | 0.131 | 0.000 | 0.000 | 0.000 | 0.000 | 0.000 | 0.000 | 0.008 | 0.000 | 0.000 | 0.000 | 0.000 | 0.000 | 0.000 | 0.000 | |
| P06 | 0.371 | 0.016 | 0.001 | 0.043 | 0.000 | 0.000 | 0.010 | 0.343 | 0.010 | 0.000 | 0.010 | 0.000 | 0.002 | 0.000 | 0.000 | 1.000 | 0.000 | 0.031 | 0.029 | 0.789 | |
| P07 | 0.000 | 0.114 | 0.450 | 0.013 | 0.131 | 0.000 | 0.000 | 0.000 | 0.000 | 0.000 | 0.000 | 0.000 | 0.343 | 0.000 | 0.000 | 0.000 | 0.000 | 0.000 | 0.000 | 0.001 | |
| P08 | 0.080 | 0.000 | 0.000 | 0.000 | 0.000 | 0.010 | 0.000 | 0.169 | 1.000 | 0.003 | 0.683 | 0.000 | 0.000 | 0.000 | 0.000 | 0.002 | 0.000 | 0.823 | 0.773 | 0.004 | |
| P09 | 1.000 | 0.001 | 0.000 | 0.002 | 0.000 | 0.343 | 0.000 | 0.169 | 0.080 | 0.000 | 0.121 | 0.000 | 0.000 | 0.000 | 0.000 | 0.302 | 0.000 | 0.200 | 0.190 | 0.077 | |
| P10 | 0.027 | 0.000 | 0.000 | 0.000 | 0.000 | 0.010 | 0.000 | 1.000 | 0.080 | 0.001 | 1.000 | 0.001 | 0.000 | 0.001 | 0.000 | 0.006 | 0.001 | 1.000 | 1.000 | 0.001 | |
| P11 | 0.000 | 0.000 | 0.000 | 0.000 | 0.000 | 0.000 | 0.000 | 0.003 | 0.000 | 0.001 | 0.002 | 0.710 | 0.000 | 0.710 | 0.000 | 0.000 | 1.000 | 0.030 | 0.010 | 0.000 | |
| P12 | 0.043 | 0.000 | 0.000 | 0.000 | 0.000 | 0.010 | 0.000 | 0.683 | 0.121 | 1.000 | 0.002 | 0.000 | 0.000 | 0.000 | 0.000 | 0.002 | 0.000 | 0.845 | 0.752 | 0.001 | |
| P13 | 0.000 | 0.000 | 0.000 | 0.000 | 0.000 | 0.000 | 0.000 | 0.000 | 0.000 | 0.001 | 0.710 | 0.000 | 0.000 | 1.000 | 0.000 | 0.000 | 0.683 | 0.000 | 0.000 | 0.000 | |
| P14 | 0.000 | 0.724 | 1.000 | 0.343 | 0.008 | 0.002 | 0.343 | 0.000 | 0.002 | 0.000 | 0.000 | 0.000 | 0.000 | 0.000 | 0.000 | 0.003 | 0.000 | 0.000 | 0.000 | 0.004 | |
| P15 | 0.000 | 0.000 | 0.000 | 0.000 | 0.000 | 0.000 | 0.000 | 0.000 | 0.000 | 0.001 | 0.713 | 0.002 | 1.000 | 0.000 | 0.000 | 0.000 | 0.681 | 0.000 | 0.001 | 0.000 | |
| P16 | 0.000 | 0.000 | 0.000 | 0.000 | 0.000 | 0.000 | 0.000 | 0.000 | 0.000 | 0.000 | 0.000 | 0.000 | 0.000 | 0.000 | 0.000 | 0.000 | 0.000 | 0.000 | 0.000 | 0.000 | |
| P17 | 0.385 | 0.039 | 0.002 | 0.091 | 0.000 | 1.000 | 0.003 | 0.002 | 0.302 | 0.006 | 0.000 | 0.002 | 0.000 | 0.003 | 0.000 | 0.000 | 0.000 | 0.008 | 0.006 | 1.000 | |
| P18 | 0.000 | 0.000 | 0.000 | 0.000 | 0.000 | 0.000 | 0.000 | 0.000 | 0.000 | 0.001 | 1.000 | 0.000 | 0.683 | 0.000 | 0.683 | 0.000 | 0.000 | 0.000 | 0.000 | 0.000 | |
| P19 | 0.134 | 0.000 | 0.000 | 0.001 | 0.000 | 0.031 | 0.000 | 0.823 | 0.200 | 1.000 | 0.030 | 0.845 | 0.000 | 0.000 | 0.000 | 0.000 | 0.008 | 0.000 | 0.823 | 0.015 | |
| P20 | 0.099 | 0.000 | 0.000 | 0.000 | 0.000 | 0.029 | 0.000 | 0.773 | 0.190 | 1.000 | 0.010 | 0.752 | 0.000 | 0.000 | 0.000 | 0.000 | 0.006 | 0.000 | 0.823 | 0.002 | |
| P21 | 0.182 | 0.013 | 0.003 | 0.077 | 0.000 | 0.789 | 0.001 | 0.004 | 0.077 | 0.001 | 0.000 | 0.001 | 0.000 | 0.004 | 0.000 | 0.000 | 1.000 | 0.000 | 0.015 | 0.002 |
| Mean Expectations | Relation | Mean Perception | Difference Δ | Zeta (from Signum) | p | |
|---|---|---|---|---|---|---|
| Q1 | 3.830357 | > | 3.696429 | −0.133928 | 3.614784 | 0.000301 |
| Q2 | 3.785714 | ≈ | 3.812500 | +0.026786 | 0.755929 | 0.449692 |
| Q3 | 3.928571 | > | 3.839286 | −0.089285 | 2.598076 | 0.009375 |
| Q4 | 3.857143 | > | 3.794643 | −0.062500 | 2.267787 | 0.023342 |
| Q5 | 3.973214 | ≈ | 3.910714 | −0.062500 | 1.809068 | 0.070440 |
| Q6 | 3.937500 | > | 3.723214 | −0.214286 | 4.694855 | 0.000003 |
| Q7 | 3.821429 | ≈ | 3.866071 | +0.044642 | 1.109400 | 0.267258 |
| Q8 | 3.785714 | > | 3.625000 | −0.160714 | 4.006938 | 0.000062 |
| Q9 | 4.178571 | > | 3.687500 | −0.491071 | 7.142749 | 0.000000 |
| Q10 | 3.651786 | ≈ | 3.616071 | −0.035715 | 0.801784 | 0.422678 |
| Q11 | 3.785714 | > | 3.482143 | −0.303571 | 5.659453 | 0.000000 |
| Q12 | 3.375000 | < | 3.625000 | +0.250000 | 5.102520 | 0.000000 |
| Q13 | 3.383929 | ≈ | 3.455357 | +0.071428 | 1.322876 | 0.185877 |
| Q14 | 3.553571 | < | 3.830357 | +0.276786 | 5.388159 | 0.000000 |
| Q15 | 3.785714 | > | 3.455357 | −0.330357 | 5.918364 | 0.000000 |
| Q16 | 3.910714 | > | 3.241071 | −0.669643 | 7.682213 | 0.000000 |
| Q17 | 3.758929 | ≈ | 3.732143 | −0.026786 | 0.485071 | 0.627626 |
| Q18 | 3.821429 | > | 3.473214 | −0.348215 | 6.084870 | 0.000000 |
| Q19 | 3.642857 | ≈ | 3.607143 | −0.035714 | 0.866025 | 0.386476 |
| Q20 | 3.767857 | > | 3.625000 | −0.142857 | 3.061862 | 0.002200 |
| Q21 | 3.973214 | > | 3.741071 | −0.232143 | 4.902903 | 0.000001 |
References
- Chen, Z.-S.; Zhang, X.; Govindan, K.; Wang, X.-J.; Chin, K.-S. Third-party reverse logistics provider selection: A computational semantic analysis-based multi-perspective multi-attribute decision-making approach. Expert Syst. Appl. 2021, 166, 114051. [Google Scholar] [CrossRef]
- Tighazoui, A.; Turki, S.; Sauvey, C.; Sauer, N. Optimal design of a manufacturing-remanufacturing-transport system within a reverse logistics chain. Int. J. Adv. Manuf. Technol. 2019, 101, 1773–1791. [Google Scholar] [CrossRef]
- Govindan, K.; Bouzon, M. From a literature review to a multi-perspective framework for reverse logistics barriers and drivers. J. Clean. Prod. 2018, 187, 318–337. [Google Scholar] [CrossRef]
- Awan, M.A.; Ali, Y. Sustainable modeling in reverse logistics strategies using fuzzy MCDM: Ase of China Pakistan Economic Corridor. Manag. Environ. Qual. Int. J. 2019, 30, 1132–1151. [Google Scholar] [CrossRef]
- Ardeshirilajimi, A.; Azadivar, F. Reverse supply chain plan for remanufacturing commercial returns. Int. J. Adv. Manuf. Technol. 2014, 77, 1767–1779. [Google Scholar] [CrossRef]
- Yu, H.; Sun, X.; Solvang, W.D.; Zhao, X. Reverse Logistics Network Design for Effective Management of Medical Waste in Epidemic Outbreaks: Insights from the Coronavirus Disease 2019 (COVID-19) Outbreak in Wuhan (China). Int. J. Environ. Res. Public Health 2020, 17, 1770. [Google Scholar] [CrossRef] [Green Version]
- Morgan, T.R.; Tokman, M.; Richey, R.G.; Defee, C. Resource commitment and sustainability: A reverse logistics performance process model. Int. J. Phys. Distrib. Logist. Manag. 2018, 48, 164–182. [Google Scholar] [CrossRef]
- Ayilara, M.S.; Olanrewaju, O.S.; Babalola, O.O.; Odeyemi, O. Waste Management through Composting: Challenges and Potentials. Sustainability 2020, 12, 4456. [Google Scholar] [CrossRef]
- Galijašević, E.; Nunić, Z.; Alihodžić, A. Waste management system and reverse logistics of Tešanj. HORIZONS B 2018, 5, 41–52. [Google Scholar] [CrossRef]
- Aćimović, S.; Mijušković, V.; Rajić, V. The impact of reverse logistics onto green supply chain competitiveness evidence from Serbian consumers. Int. J. Retail. Distrib. Manag. 2020, 48, 1003–1021. [Google Scholar] [CrossRef]
- Hazen, B.; Cegielski, C.; Hanna, J.B. Diffusion of green supply chain management. Int. J. Logist. Manag. 2011, 22, 373–389. [Google Scholar] [CrossRef]
- Homrich, A.S.; Galvão, G.; Abadia, L.G.; Carvalho, M.M. The circular economy umbrella: Trends and gaps on integrating pathways. J. Clean. Prod. 2018, 175, 525–543. [Google Scholar] [CrossRef]
- Julianelli, V.; Caiado, R.G.G.; Scavarda, L.F.; Cruz, S.P.D.M.F. Interplay between reverse logistics and circular economy: Critical success factors-based taxonomy and framework. Resour. Conserv. Recycl. 2020, 158, 104784. [Google Scholar] [CrossRef]
- Moghaddam, K.S. Fuzzy multi-objective model for supplier selection and order allocation in reverse logistics systems under supply and demand uncertainty. Expert Syst. Appl. 2015, 42, 6237–6254. [Google Scholar] [CrossRef]
- Marić, J.; Opazo-Basáez, M. Green Servitization for Flexible and Sustainable Supply Chain Operations: A Review of Reverse Logistics Services in Manufacturing. Glob. J. Flex. Syst. Manag. 2019, 20, 65–80. [Google Scholar] [CrossRef]
- Agrawal, S.; Singh, R.K. Analyzing disposition decisions for sustainable reverse logistics: Triple Bottom Line approach. Resour. Conserv. Recycl. 2019, 150, 104448. [Google Scholar] [CrossRef]
- Kumar, V.; Brady, M.; Garza-Reyes, J.A.; Simpson, M. Resolving forward-reverse logistics multi-period model using evolutionary algorithms. Int. J. Prod. Econ. 2017, 183, 458–469. [Google Scholar] [CrossRef] [Green Version]
- Henninger, C.E.; Bürklin, N.; Niinimäki, K. The clothes swapping phenomenon—when consumers become suppliers. J. Fash. Mark. Manag. Int. J. 2019, 23, 327–344. [Google Scholar] [CrossRef] [Green Version]
- Sajjanit, C.; Rompho, N. Measuring customer-oriented product returns service performance. Int. J. Logist. Manag. 2019, 30, 772–796. [Google Scholar] [CrossRef]
- Bagur-Femenías, L.; Perramon, J.; Amat, O. Impact of quality and environmental investment on business competitiveness and profitability in small service business: The case of travel agencies. Total. Qual. Manag. Bus. Excel. 2014, 26, 1–14. [Google Scholar] [CrossRef]
- Bastas, A.; Liyanage, K. Sustainable supply chain quality management: A systematic review. J. Clean. Prod. 2018, 181, 726–744. [Google Scholar] [CrossRef] [Green Version]
- Wang, Y.L.; Luor, T.; Luarn, P.; Lu, H.-P. Contribution and Trend to Quality Research—A literature review of SERVQUAL model from 1998 to 2013. Inform. Econ. 2015, 19, 34–45. [Google Scholar] [CrossRef]
- Stević, Ž.; Đalić, I.; Pamučar, D.; Nunić, Z.; Vesković, S.; Vasiljević, M.; Tanackov, I. A new hybrid model for quality assessment of scientific conferences based on Rough BWM and SERVQUAL. Scientometrics 2019, 119, 1–30. [Google Scholar] [CrossRef]
- Rezaei, J.; Kothadiya, O.; Tavasszy, L.; Kroesen, M. Quality assessment of airline baggage handling systems using SERVQUAL and BWM. Tour. Manag. 2018, 66, 85–93. [Google Scholar] [CrossRef]
- Meidutė-Kavaliauskienė, I.; Vasilienė-Vasiliauskienė, V.; Vasiliauskas, A.V. Identification of sectoral logistics service quality gaps by applying servqual method. Transport 2020, 35, 419–434. [Google Scholar] [CrossRef]
- Prentkovskis, O.; Erceg, Ž.; Stević, Ž.; Tanackov, I.; Vasiljević, M.; Gavranović, M. A new methodology for im-proving service quality measurement: Delphi-FUCOM-SERVQUAL model. Symmetry 2018, 10, 757. [Google Scholar] [CrossRef] [Green Version]
- Kilibarda, M.; Nikolicic, S.; Andrejic, M. Measurement of logistics service quality in freight forwarding companies. Int. J. Logist. Manag. 2016, 27, 770–794. [Google Scholar] [CrossRef]
- Knop, K. Evaluation of quality of services provided by transport & logistics operator from pharmaceutical industry for improvement purposes. Transp. Res. Procedia 2019, 40, 1080–1087. [Google Scholar] [CrossRef]
- Limbourg, S.; Giang, H.T.Q.; Cools, M. Logistics Service Quality: The Case of Da Nang City. Procedia Eng. 2016, 142, 124–130. [Google Scholar] [CrossRef] [Green Version]
- Memić, Z.; Vasiljević, M.; Tanackov, I.; Stević, Ž. Measuring the quality of logistics services in the transport company using the servqual model. In Proceedings of the 2nd International Conference on Management, Engineering and Environment, ICMNEE 2018, Belgrade, Serbia, 11–12 October 2018; pp. 119–129. [Google Scholar]
- Czajkowska, A.; Stasiak-Betlejewska, R.; Agnieszka, C.; Renata, S.-B. Quality management tools applying in the strategy of logistics services quality improvement. Serb. J. Manag. 2015, 10, 225–234. [Google Scholar] [CrossRef] [Green Version]
- Roslan, N.A.A.; Wahab, E.; Abdullah, N.H. Service Quality: A Case Study of Logistics Sector in Iskandar Malaysia Using SERVQUAL Model. Procedia Soc. Behav. Sci. 2015, 172, 457–462. [Google Scholar] [CrossRef] [Green Version]
- Parmata, U.M.D.; Sankara Rao, B.; Rajashekhar, B. Measuring service quality in pharmaceutical supply chain—distributor’s perspective. Int. J. Pharm. Healthc. Mark. 2016, 10, 258–284. [Google Scholar] [CrossRef]
- Vesković, S.; Stević, Ž.; Stojić, G.; Vasiljević, M.; Milinković, S. Evaluation of the railway management model by using a new integrated model DELPHI-SWARA-MABAC. Decis. Mak. Appl. Manag. Eng. 2018, 1, 34–50. [Google Scholar] [CrossRef]
- Pamučar, D.; Stević, Ž.; Sremac, S. A New Model for Determining Weight Coefficients of Criteria in MCDM Models: Full Consistency Method (FUCOM). Symmetry 2018, 10, 393. [Google Scholar] [CrossRef] [Green Version]
- Ali, Y.; Mehmood, B.; Huzaifa, M.; Yasir, U.; Khan, A.U. Development of a new hybrid multi criteria deci-sion-making method for a car selection scenario. Facta Univ. Ser. Mech. Eng. 2020, 18, 357–373. [Google Scholar]
- Badi, I.; Abdulshahed, A. Ranking the Libyan airlines by using Full Consistency Method (FUCOM) and Analytical Hierarchy Process (AHP). Oper. Res. Eng. Sci. Theory Appl. 2019, 2, 1–14. [Google Scholar] [CrossRef] [Green Version]
- Puška, A.; Stević, Ž.; Šadić, S. Uticaj razmjene informacija sa dobavljačem i kupcem na organizacione performanse prehrambenih preduzeća u Bosni i Hercegovini. EMC-Review 2019, 17, 33–52. [Google Scholar] [CrossRef] [Green Version]


| Phase | Steps |
|---|---|
| Phase 1. Data collection | Forming an original SERVQUAL questionnaire Sending the SERVQUAL questionnaire to users Data processing and preparation for analysis |
| Phase 2. Determining dimension weights | Surveying users about the dimension importance percentages they have for them Synthesis of dimension weight ratings obtained by users Implementing the Delphi method Collecting data from decision-makers Calculating the weights of quality dimensions using the FUCOM method |
| Phase 3. Research results | Descriptive analysis of results Comparison of expectations and perceptions in respondents’ answers Determining insignificant and significant differences in expectations and quality perception Conducting a Signum test |
| Phase 4. Discussion of results | Analysis of the results obtained Comparison of results in terms of expectations and quality perception Proposed guidelines for quality improvement |
| Dimensions | Statements | Grades | |||||
|---|---|---|---|---|---|---|---|
| Reliability | Q1 | Services will be provided at the expected time | 1 | 2 | 3 | 4 | 5 |
| Q2 | Waste will be collected regularly | 1 | 2 | 3 | 4 | 5 | |
| Q3 | Waste collection will be performed without difficulties | 1 | 2 | 3 | 4 | 5 | |
| Assurance | Q4 | Workers will be careful when performing work tasks | 1 | 2 | 3 | 4 | 5 |
| Q5 | The user will be informed in a timely manner | 1 | 2 | 3 | 4 | 5 | |
| Q6 | The cost of the waste collection service will be fixed | 1 | 2 | 3 | 4 | 5 | |
| Tangibles | Q7 | The cost of the service will be acceptable | 1 | 2 | 3 | 4 | 5 |
| Q8 | No noise will be generated during waste collection | 1 | 2 | 3 | 4 | 5 | |
| Q9 | Invoices will be clear and delivered to home addresses | 1 | 2 | 3 | 4 | 5 | |
| Q10 | The streets will be clean and tidy | 1 | 2 | 3 | 4 | 5 | |
| Q11 | The containers will be placed close to the household | 1 | 2 | 3 | 4 | 5 | |
| Q12 | There will be no unpleasant odors at waste disposal sites | 1 | 2 | 3 | 4 | 5 | |
| Q13 | Waste collection vehicles will be modern | 1 | 2 | 3 | 4 | 5 | |
| Empathy | Q14 | Services will be flexible and customized | 1 | 2 | 3 | 4 | 5 |
| Q15 | The time of waste collection and transport will be appropriate | 1 | 2 | 3 | 4 | 5 | |
| Q16 | When charging, population categories will be taken into account | 1 | 2 | 3 | 4 | 5 | |
| Responsiveness | Q17 | Workers will be professional during the waste collection process | 1 | 2 | 3 | 4 | 5 |
| Q18 | Novelties will be accepted quickly | 1 | 2 | 3 | 4 | 5 | |
| Q19 | Users’ needs will be adequately responded to | 1 | 2 | 3 | 4 | 5 | |
| Q20 | Waste collection will be fast and adequate | 1 | 2 | 3 | 4 | 5 | |
| Q21 | Traffic will not be disturbed | 1 | 2 | 3 | 4 | 5 | |
| Weight Coefficients | Values |
|---|---|
| Reliability | 0.204 |
| Assurance | 0.199 |
| Tangibles | 0.191 |
| Empathy | 0.190 |
| Responsiveness | 0.216 |
| Total | 1.000 |
| Reliability | Assurance | Tangibles | Empathy | Responsiveness | |
|---|---|---|---|---|---|
| DM1 | 0.203 | 0.203 | 0.194 | 0.167 | 0.233 |
| DM2 | 0.214 | 0.196 | 0.181 | 0.174 | 0.235 |
| DM3 | 0.214 | 0.195 | 0.195 | 0.172 | 0.224 |
| DM4 | 0.217 | 0.198 | 0.192 | 0.175 | 0.217 |
| DM5 | 0.207 | 0.194 | 0.182 | 0.172 | 0.244 |
| 𝑊𝑗 | 0.211 | 0.197 | 0.189 | 0.172 | 0.231 |
| Dimension | Expectations | Perception | SQ Gap | ||||
|---|---|---|---|---|---|---|---|
| AV | ST | CA | AV | ST | CA | ||
| Reliability | 3.848 | 1.230 | 0.845 | 3.783 | 1.189 | 0.813 | −0.014 |
| Assurance | 3.915 | 1.234 | 0.746 | 3.385 | 1.269 | 0.600 | −0.009 |
| Tangibles | 3.712 | 1.348 | 0.822 | 3.655 | 1.321 | 0.618 | −0.017 |
| Empathy | 3.342 | 1.281 | 0.942 | 3.247 | 1.229 | 0.338 | −0.018 |
| Responsiveness | 3.833 | 1.287 | 0.810 | 3.699 | 1.242 | 0.600 | −0.029 |
| SERVQUAL | 3.730 | 1.276 | 0.833 | 3.554 | 1.250 | 0.600 | −0.017 |
| Ordinals | Expectation Ratings | Mean | Perception Ratings | Mean | ||||||||
|---|---|---|---|---|---|---|---|---|---|---|---|---|
| E(1) | E(2) | E(3) | E(4) | E(5) | P(1) | P(2) | P(3) | P(4) | P(5) | |||
| Q1 | 11 | 11 | 9 | 36 | 45 | 3.8304 | 11 | 15 | 7 | 43 | 36 | 3.6964 |
| Q2 | 10 | 12 | 10 | 40 | 40 | 3.7857 | 7 | 17 | 7 | 40 | 41 | 3.8125 |
| Q3 | 6 | 9 | 13 | 43 | 41 | 3.9286 | 5 | 15 | 12 | 41 | 39 | 3.8393 |
| Q4 | 7 | 15 | 8 | 39 | 43 | 3.8571 | 8 | 16 | 6 | 43 | 39 | 3.7946 |
| Q5 | 5 | 14 | 10 | 33 | 50 | 3.9732 | 5 | 12 | 12 | 42 | 41 | 3.9107 |
| Q6 | 6 | 13 | 12 | 32 | 49 | 3.9375 | 11 | 11 | 11 | 44 | 35 | 3.7232 |
| Q7 | 6 | 18 | 8 | 38 | 42 | 3.8214 | 7 | 12 | 9 | 45 | 39 | 3.8661 |
| Q8 | 9 | 13 | 10 | 41 | 39 | 3.7857 | 9 | 15 | 17 | 39 | 32 | 3.6250 |
| Q9 | 6 | 5 | 15 | 23 | 63 | 4.1786 | 13 | 13 | 8 | 40 | 38 | 3.6875 |
| Q10 | 14 | 14 | 9 | 35 | 40 | 3.6518 | 9 | 20 | 12 | 35 | 36 | 3.6161 |
| Q11 | 9 | 14 | 9 | 40 | 40 | 3.7857 | 18 | 13 | 15 | 29 | 37 | 3.4821 |
| Q12 | 21 | 16 | 8 | 34 | 33 | 3.3750 | 9 | 18 | 12 | 40 | 33 | 3.6250 |
| Q13 | 15 | 24 | 11 | 27 | 35 | 3.3839 | 11 | 14 | 27 | 33 | 27 | 3.4554 |
| Q14 | 9 | 16 | 18 | 42 | 27 | 3.5536 | 5 | 16 | 12 | 39 | 40 | 3.8304 |
| Q15 | 10 | 12 | 15 | 30 | 45 | 3.7857 | 11 | 14 | 27 | 33 | 27 | 3.4554 |
| Q16 | 8 | 15 | 4 | 38 | 47 | 3.9107 | 18 | 23 | 15 | 26 | 30 | 3.2411 |
| Q17 | 11 | 13 | 11 | 34 | 43 | 3.7589 | 8 | 13 | 13 | 45 | 33 | 3.7321 |
| Q18 | 6 | 14 | 10 | 46 | 36 | 3.8214 | 12 | 14 | 24 | 33 | 29 | 3.4732 |
| Q19 | 6 | 16 | 21 | 38 | 31 | 3.6429 | 5 | 14 | 30 | 34 | 29 | 3.6071 |
| Q20 | 10 | 13 | 14 | 31 | 44 | 3.7679 | 6 | 20 | 12 | 46 | 28 | 3.6250 |
| Q21 | 4 | 14 | 11 | 35 | 48 | 3.9732 | 7 | 19 | 9 | 38 | 39 | 3.7411 |
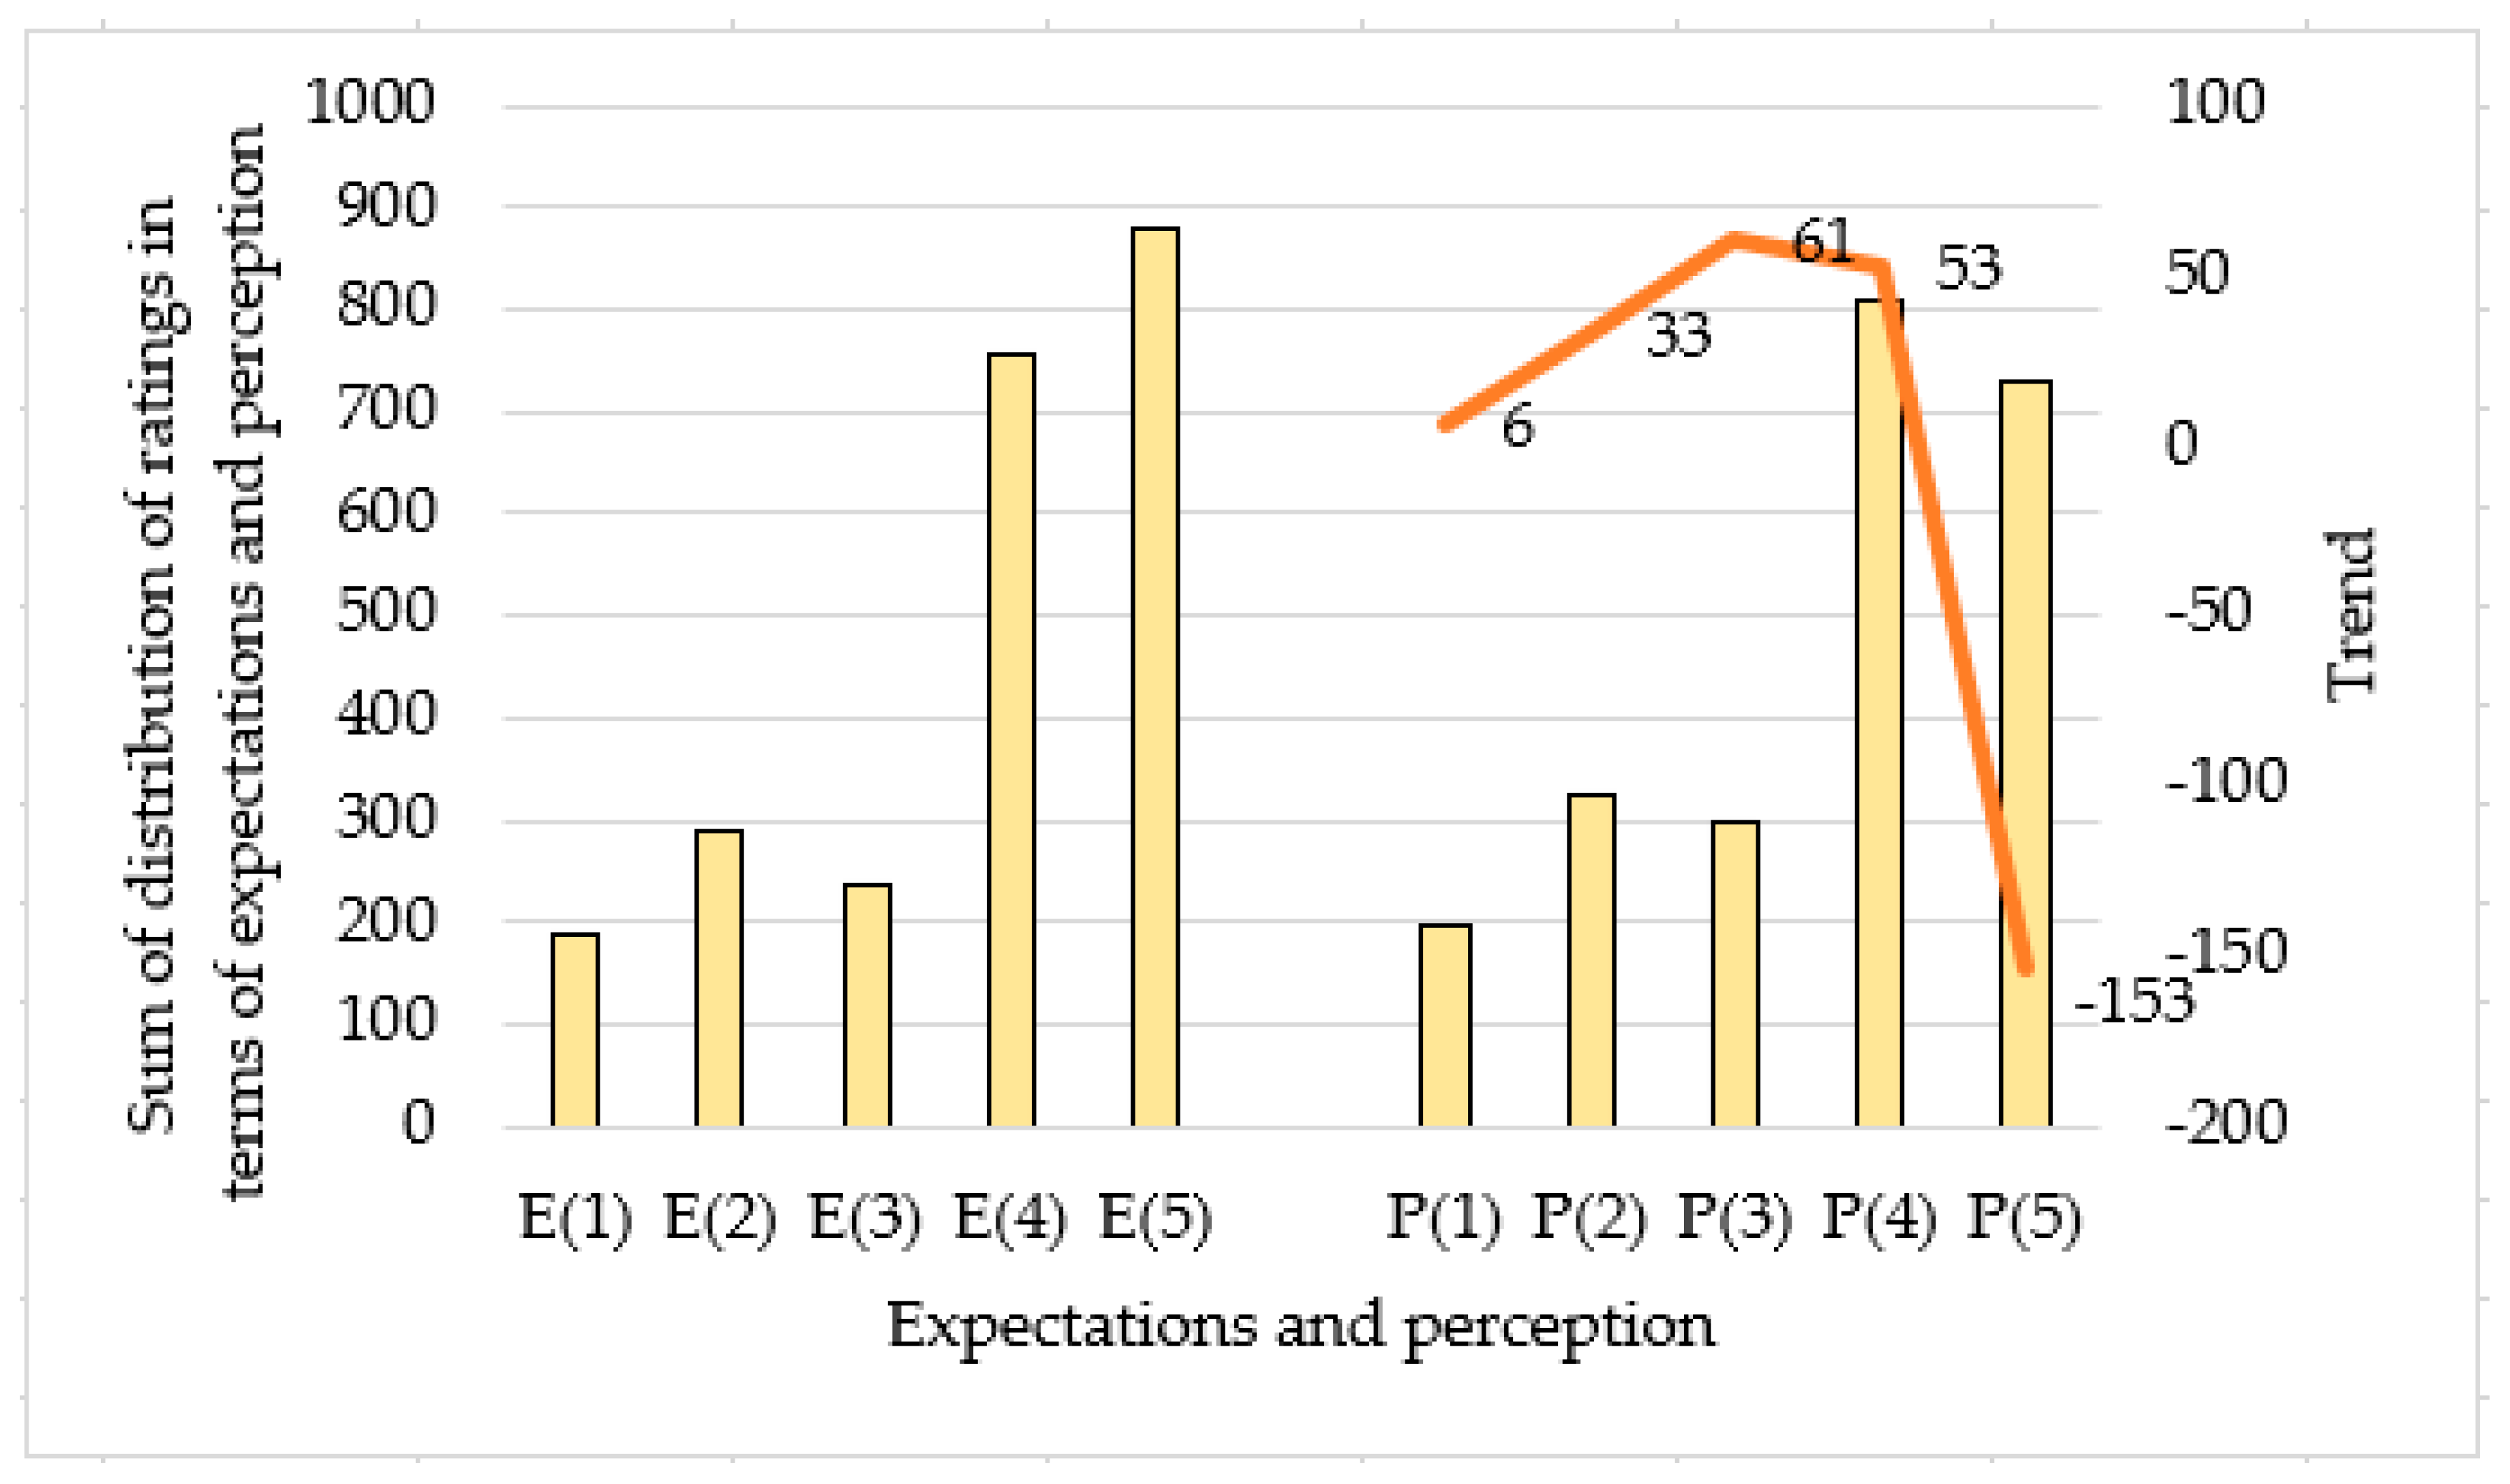
| sum | 189 | 291 | 236 | 755 | 881 | 195 | 324 | 297 | 808 | 728 | ||
| E(1) | E(2) | E(3) | E(4) | E(5) | |
|---|---|---|---|---|---|
| P(1) | +0.109 | +0.293 | +0.090 | −0.075 | −0.318 |
| P(2) | −0.056 | +0.051 | +0.404 | −0.237 | −0.307 |
| P(3) | −0.465 | −0.296 | +0.396 | +0.102 | −0.138 |
| P(4) | −0.119 | +0.110 | −0.014 | −0.149 | +0.214 |
| P(5) | +0.284 | −0.109 | −0.421 | +0.207 | +0.223 |
Publisher’s Note: MDPI stays neutral with regard to jurisdictional claims in published maps and institutional affiliations. |
© 2021 by the authors. Licensee MDPI, Basel, Switzerland. This article is an open access article distributed under the terms and conditions of the Creative Commons Attribution (CC BY) license (https://creativecommons.org/licenses/by/4.0/).
Share and Cite
Stević, Ž.; Tanackov, I.; Puška, A.; Jovanov, G.; Vasiljević, J.; Lojaničić, D. Development of Modified SERVQUAL–MCDM Model for Quality Determination in Reverse Logistics. Sustainability 2021, 13, 5734. https://0-doi-org.brum.beds.ac.uk/10.3390/su13105734
Stević Ž, Tanackov I, Puška A, Jovanov G, Vasiljević J, Lojaničić D. Development of Modified SERVQUAL–MCDM Model for Quality Determination in Reverse Logistics. Sustainability. 2021; 13(10):5734. https://0-doi-org.brum.beds.ac.uk/10.3390/su13105734
Chicago/Turabian StyleStević, Željko, Ilija Tanackov, Adis Puška, Goran Jovanov, Jovica Vasiljević, and Darko Lojaničić. 2021. "Development of Modified SERVQUAL–MCDM Model for Quality Determination in Reverse Logistics" Sustainability 13, no. 10: 5734. https://0-doi-org.brum.beds.ac.uk/10.3390/su13105734