
The COVID-19 Scenario in Terms of Gender: A Preliminary Analysis in IBEX-35 Companies


Business Administration (ADO), Applied Economics II and Fundaments of Economic Analysis, Rey Juan Carlos University, 28933 Móstoles, Madrid, Spain
Sustainability 2021, 13(10), 5750; https://0-doi-org.brum.beds.ac.uk/10.3390/su13105750
Submission received: 30 March 2021
/
Revised: 18 May 2021
/
Accepted: 18 May 2021
/
Published: 20 May 2021
(This article belongs to the Special Issue Management, Corporate Social Responsibility and Reporting Policies in the Era of COVID-19 and Beyond)
Abstract
:The COVID-19 pandemic has had serious consequences on employment and recent reports have warned that the impacts of the crisis are never gender-neutral. The objective of this research is to analyse the variations that have existed in terms of female representation in the Spanish listed companies during the COVID-19 scenario. The integrated annual reports and the non-financial information reports of each company have been examined to identify the changes that have occurred in their governance structures, leadership positions, and total workforce. A descriptive and correlational analysis was carried out in 2019 and 2020. The findings reveal that: (1) there has been a slight increase in the figures of female representation in different hierarchical positions; (2) the proportion of women on the boards of directors does not depend on the number of women in lower positions; and (3) there is a positive relationship between female representation in leadership positions and the number of women in the total workforce. These results have important implications for business sustainability in the medium and long term.
1. Introduction
In recent years, the volatility and complexity of the environment has led many companies to redirect their efforts and strategies according to their competitive position, the life cycle of the sector in which they operate, the demands of their target groups, and so on. In many cases, the strategic redesign has led to new decisions on diversification, internationalization and/or restructuring, which have had consequences on both the resources and the capacities to be used. The emergence of the COVID-19 pandemic has only accentuated the need to reorganise economic activity and the business ecosystem, forcing many companies to rethink their strategies to create long-term competitive advantages and achieve sustainability. However, this is a difficult challenge given the impact that the new scenario has had and will mean for the main economic and social indicators.
Several institutions have recently published reports on the COVID-19 pandemic, showing the effect and the worldwide disastrous forecasts on international flows, GDP, the stock market, consumer confidence, the evolution of different industries or employment (see, for example, the OECD’s report The world economy on a tightrope, the UNPD’s COVID-19: Socio-economic impact, the World Bank’s COVID-19 to plunge global economy into worst recession since World War II, the IMF’s A crisis like no other, an uncertain recovery, McKinsey & Company’s COVID-19: Implications for business, and the ILO’s COVID-19 and the world of work).
Regarding employment, the destruction of jobs and the drastic reduction of the labour force, mainly in the secondary and tertiary sectors, are worrying. In this respect, news on gender and the labour market have drawn attention: women have been hit particularly hard. They are disproportionately represented in high-risk sectors and are often among the first to lose employment and are the last to return to work [1,2,3,4,5,6,7,8]. Surprising data shows that the COVID-19 pandemic has made the female workforce more essential due to its presence in health, educational, domestic, or cleaning activities, assuming a higher physical and emotional cost. However, this contrasts with: (1) the low importance that women have had in decision-making; and (2) the greater risk of being unemployed. On the one hand, most decisions about the design and execution of responses to the pandemic have been made by men, and this lack of female leadership has led to some gender issues not being considered. Women generally tend to be more cooperative than men in social dilemmas, more concerned about the way in which the money is spent and they show more communal orientation—disinterested, altruistic, transparent, or ethical [9,10,11]. Accordingly, articles like Why we need women’s leadership in the COVID-19 response [12] have underlined the benefits of female leadership in crisis management. The communal leadership style may be an advantage [13] and female leadership is more effective because women seem to navigate into uncharted waters better [14]. On the other hand, the gender imbalances that persist in the workplace (e.g., higher percentages of part-time employment, precarious or low-paid jobs, occupational segregation by gender, etc.) will also have a negative impact on the professional possibilities of women and their occupancy rates.
The COVID-19 scenario has generated an intense debate around the need to reinvent governance and leadership, redefine labour relations, and put a greater focus on sustainability. The objective of this research is to analyse the situation immediately before and after the outbreak of the pandemic in terms of gender in Spanish companies. Specifically, the integrated annual reports and the non-financial information reports of the IBEX-35 companies are examined to identify changes that have occurred in their governance structures, leadership positions, and total workforce. A descriptive and correlational analysis was carried out in 2019 and 2020.
This study shows the panorama in terms of gender in Spanish listed companies during the COVID-19 scenario, and it questions how changes could affect the sustainability of companies in the medium and long term.
2. Women in the Labour Market during the COVID-19 Pandemic: The Spanish Context
In recent decades, the female representation in the labour market has increased markedly in most regions of the world. For example, the female rate of labour force participation was 47.9%, 49.41%, and 52.12% in 1990, 2000, and 2020 in OECD countries. For the European Union, those same rates were 45.55%, 46.9%, and 50.64%. Spain had female rates of 33.84%, 40.6%, and 51.85% [15]. However, women represented 44.24%, 45.87%, and 46.25% of total labour force in the OECD, the European Union and Spain, respectively [16]. Therefore, women are, on average, somewhat less likely to participate in the labour force than men. Despite an increase of women pursuing higher education globally, a gender gap in employment rates remains among highly educated women and men. Unpaid caregiving responsibilities can prevent paid employment opportunities and this work disproportionally falls to women [17]. In addition, women are more likely to be in temporary, part-time, and precarious employment than men. About a quarter (26.5%) of women employees across the EU are in a precarious job, compared to 15.1% of men [3]. These disadvantages largely justify the gender pay gap: once all of the compensable factors, such as experience, industry, and job level, are accounted for, a woman doing the same job as a man, with the exact same qualifications as a man, is still paid 2% less [18].
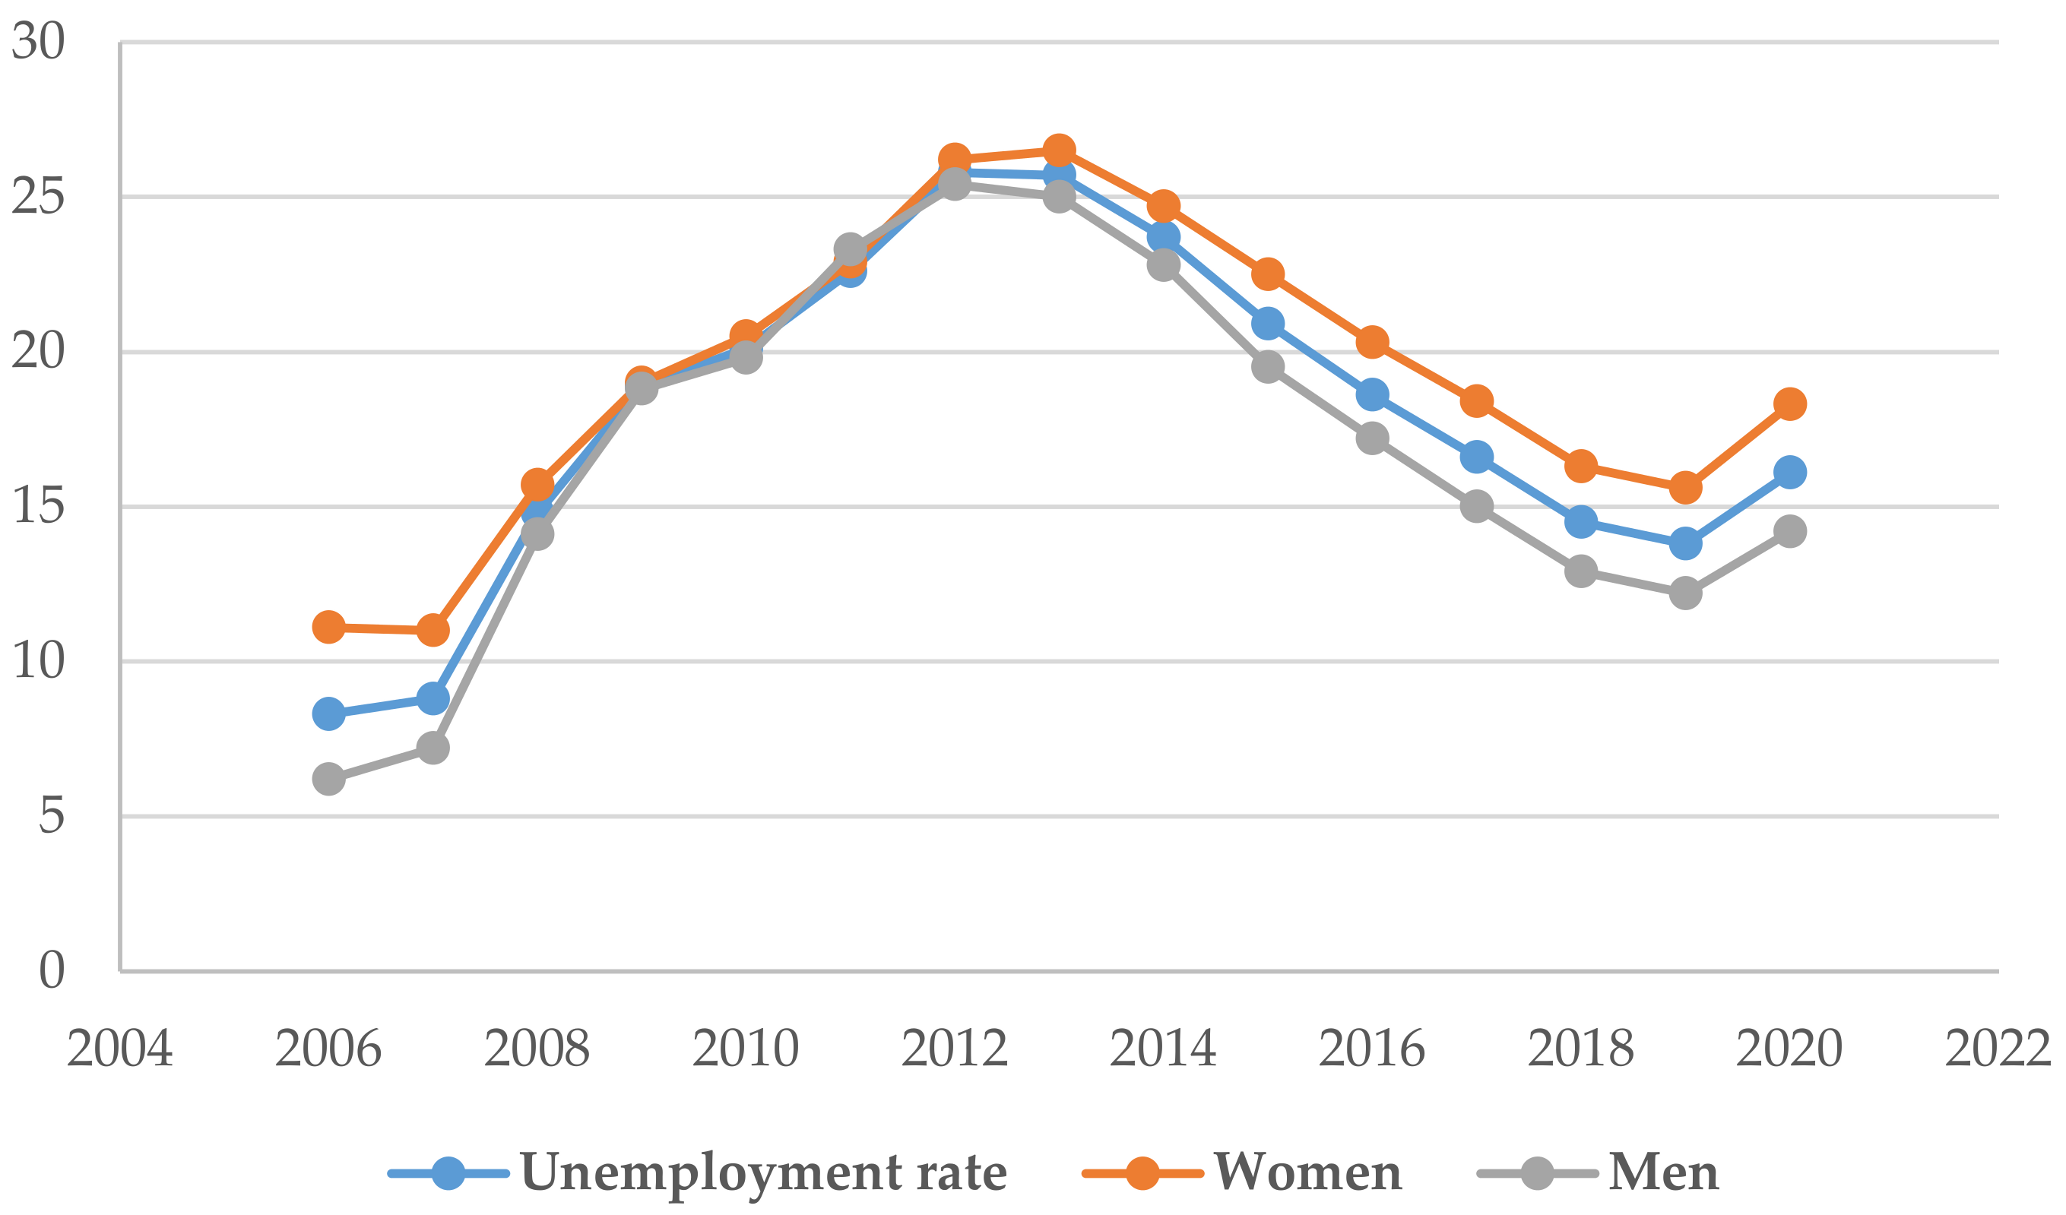
The gender gap has been narrowing in Spain in recent years (see, for example, the evolution of the Gender Equality Index elaborated by the European Institute for Gender Equality). However, since the outbreak of the COVID-19 pandemic, INE data and forecasts point to and confirm a decline in the situation of women in the labour market. As Figure 1 shows, as happened in the 2008 financial crisis, the Spanish unemployment rate was higher for women than for men and during the recovery phase, men’s employment improved more quickly than women’s employment. The COVID-19 crisis may leave women more vulnerable than men to job loss and women’s lesser status in the labour market can leave them more exposed and easier to lay off [6].
Women have been key players in the workplace during the health and social crisis brought about by the pandemic. They are highly represented in essential services, such as medical care, communication and utilities, emergency services, and so on. However, this crisis has shown the essential, yet economically underestimated, value of women as a labour force and numerous international organisations warned from the beginning that female employment would be seriously affected [1,2,3,4,5,6,19]. Drawing on INE data, Figure 2 reflects the latest figures for female unemployment in Spain disaggregated by month. As can be seen, the reduction in employment began in March 2020. In high-income and upper-middle-income countries, the sectors overexposed to the collapse in economic activity absorbed a sizeable share of female employment (e.g., accommodation and food services; real estate, business and administrative activities; manufacturing; and the wholesale/retail trade) [1]. By mid-2020, women already accounted for 51% of the population in ERTE (temporary lay-off proceedings) and the fourth quarter closed with 1,728.400 men and 1,991.400 women unemployed. The total number of unemployed has increased by 527,900 people in one year, with an increase of 222,300 for men and 305,600 for women [20]. Thus, female unemployment has grown more and is more persistent: 56.7% and 56.1% of long-term and very-long-term unemployed, respectively, are women. This quantitative gap also translates into qualitative differences: it will be more difficult for women and it will take them longer to rejoin the labour market, accounting for a greater degree of temporary employment (i.e., 26.6%, compared to 22.8% for men) and involuntary employment bias (i.e., 74.4% of part-time jobs are held by women) [20].
The COVID-19 pandemic has also served to remind us that the glass ceiling remains firmly in place and has cast light once again on the little space given to women [1]. Women account for just 25% in national political and scientific COVID-19 task forces, and have had little importance in decision-making, so the gender approach has been little incorporated into responses to the pandemic [1]. In many countries, very few women sit on national social dialogue institutions, such as economic and social councils, tripartite commissions, and labour advisory boards. Only 28% of management positions worldwide are occupied by women [1] and they are an even smaller minority as organisational leaders (e.g., only 37 companies in the Fortune 500 list are led by women) [21]. Specifically, in Spain, female representation in leadership positions, despite progress, remains low. For example, companies with a market capitalisation of less than 500 million euros in 2017 had 15.6% women on their boards of directors and 12.9% in senior management, increasing these percentages to 16.9% and 14% in 2018, respectively, and up to 21.1% and 13.4% in 2019, respectively. Meanwhile, companies with a market capitalisation of more than 500 million euros show somewhat higher figures: 18.4% in the board of directors and 16.9% in senior management in 2017, 19.2% and 17.7% in 2018, respectively, and 22% and 17.7% in 2019, respectively. IBEX-35 companies reach slightly higher percentages in this period: women occupy 22.8% of the seats on the boards of directors and 14.3% of senior management in 2017, 23.9% and 16% in 2018, respectively, and 27.5 and 15.7% in 2019, respectively [22]. While it is true that progress is ‘pushed’ by legislation in favour of increasing women (e.g., the Code of Good Governance of Listed Companies established in 2015 the objective of achieving 30% female representation on boards of directors by 2020, and in 2020 it has raised the quota to 40% by 2022), underrepresentation in all leadership positions is still evident.
3. Materials and Methods
Since the Good Governance Code of Listed Companies and the Law on Non-Financial Information and Diversity 11/2018 were implemented in Spain, listed companies are obliged to include in their publications matters related to diversity policy and the measures adopted to promote equal treatment and opportunities between men and women. Hence, the choice of the sample (i.e., IBEX-35 companies) responds to the volume of information available on diversity and gender issues. The companies that we have analysed are those that made up the IBEX-35 list at the end of 2020. This list is similar to the one that existed at the end of 2019: Ence, MásMóvil and Mediaset left the index, while Almirall, PharmaMar and Solaria joined it.
The information contained in the integrated annual reports and non-financial information reports of each company was examined, and GRI indicators of social performance at the end of 2019 and 2020 were collected. Specifically, the variables selected for this study refer to the gender composition of the different hierarchical positions: percentage of women on boards of directors, in leadership positions (some companies show separately the figures for women managers, senior managers or top executives, while others only refer to the management roles occupied by women; in all cases, an attempt has been made to reflect the percentage of women in leadership positions in general) and in the total workforce. Data are also provided on the size of the boards of directors and the total volume of employees in both years.
An exploratory and descriptive analysis is carried out to examine the changes in terms of gender in the government structure, leadership positions, and the total workforce. The SPSS software was used to perform a Pearson Correlation analysis.
4. Results
Table 1 shows each company’s sector, the composition of their corporate governance, and the female representation in managerial roles and the total workforce.
At the end of 2019, there were 123 female directors on boards of directors of the IBEX-35 companies, with a greater female representation on the boards of Iberdrola, Red Eléctrica, and Santander. In contrast, the lowest figures corresponded to Naturgy, Amadeus, CIE Automotive, Bankia, Ferrovial, and Solaria. In 2020, 25 new female directors were appointed, bringing the total number of female directors to 138 from a total of 445 —the change in the composition of the index, the termination of nine of them and the variation in the size of the boards must be taken into account. The new appointments during 2020 have raised the presence of women on the boards of directors of IBEX-35 companies to 30.89%, which is almost 3% more than in the previous year. In 2020, 21 of the 35 companies have met the recommendation of 30% of female representation included in the Good Governance Code, while in 2019 only 15 exceeded 30% [22]. Specifically, from 2019 to 2020 Enagás modified the composition of its board of directors and reduced female representation to below 30%, but several companies increased the proportion of women and raised it above 30% (i.e., Acerinox, Aena, Almirall, BBVA, Endesa, Pharmamar, and Siemens). Of these, Almirall and Endesa, together with Naturgy, achieve the greatest increase, although the latter fails to comply with the CNMV recommendation. ACS, Ferrovial, and Solaria are also very far from achieving this goal.
Despite progress in terms of women on boards of directors, it should be emphasised that in 2019 and 2020 only two women were CEOs in the IBEX-35 companies (i.e., Santander and Bankinter) and the majority of female directors were external independent. Only Sabadell, Santander, Bankinter, Indra, and Red Eléctrica had female executive directors.
With regard to women in leadership positions, except for a few companies in which the percentage of female managers has decreased because of the restructuring of the workforce, the evolution for the others has been positive, especially for BBVA, Indra, and Ferrovial. The average total variation in female representation in managerial roles is 4.02%. In general, this progress results from greater attention to aspects related to diversity and inclusion and the effort to equalise gender balances. In recent years, some companies (i.e., Acciona, Bankia, CaixaBank, Enagás, Endesa, Iberdrola, Indra, Mapfre, Red Eléctrica, Santander, Siemens Gamesa, and Telefónica) have signed the Women’s Empowerment Principles (UN). Acciona, Amadeus, CaixaBank, Indra, Mapfre, Santander, Siemens Gamesa, and Telefónica have also signed the Target Gender Equality initiative launched by UN Global Compact to increase female representation in executive management positions. Moreover, at the national level, Acciona, Amadeus, Sabadell, BBVA, CaixaBank, Enagás, Endesa, Ferrovial, Mapfre, Repsol, Santander, Indra, Red Eléctrica, and Siemens Gamesa have joined the project Más Mujeres, Mejores Empresas, which was started in 2014 by the Institute for Women and the Ministry of Equality of Spain. All of these companies have signed the voluntary agreement to promote balanced participation in management positions and management committees. Additionally, some companies have designed their own initiatives and programmes focused specifically on promoting female leadership (e.g., Women in Leadership by Telefónica, Take The Lead by Banco Santander, AED Lead Mentoring Women Directors by CaixaBank, and Sabadell Women Inspiration Group by Banco Sabadell), and have implemented procedures and protocols in relation to external hiring and internal promotions. Other companies have set targets to increase female representation in managerial positions, for example: CaixaBank intends for women to represent 43% of managers in 2021; Endesa and Red Eléctrica show the commitment to reach 19% and 35%, respectively, in 2022; Iberdrola wants to reach 25% of women in managerial positions by 2022 and raises the figure to 30% in 2025; and Siemens Gamesa and Naturgy are targeting 25% and 40%, respectively, by 2025. These efforts have led many of these companies to form part of the Bloomberg Gender Equality Index, which measures gender equality, valuing among others, the promotion of female leadership, and the talent pipeline. Santander, Bankia, BBVA, CaixaBank, Enagás, Endesa, Ferrovial, Iberdrola, Inditex, Indra, Repsol, Siemens Gamesa, and Telefónica appear on the 2020 list.
With regard to the total workforce, although some companies belonging to the sectors with the greatest activity during the crisis have increased the volume of employees (the largest increases are found in Acerinox, Cellnex, Solaria, and Viscofán), the balance in absolute terms in the IBEX-35 companies is negative (the average total variation is −1.32%), with companies dedicated to tourism and transportation suffering the most significant reductions. The proportion of women employed remains similar or slightly decreases in most companies, although there is a substantial growth in female representation in some companies with a predominantly male workforce (especially Acerinox and Cellnex —it is caused by the acquisitions made in 2020: VDM Metals in the case of Acerinox and OMTEL, NOS Towering and Arqiva in the case of Cellnex—, followed by CIE Automotive and Solaria). This increase leads to a positive average variation (2.87%).
Table 2 shows the descriptive statistics (i.e., mean, standard deviation, and minimum and maximum values) and the correlation matrix for the set of data collected.
On the one hand, the variation in the average values from 2019 to 2020 shows a slight increase in female representation in all hierarchical positions considered, which is more pronounced in the case of the boards of directors. On the other hand, the Bivariate Pearson Correlation shows that the relationship between female representation on the boards of directors in 2020 and in leadership positions is positive but not significant (0.260 in 2019 and 0.272 in 2020), which happens with the presence of women on the boards in 2020 and total workforce (0.151 in 2019 and 0.214 in 2020). Positive and significant correlations are found between female representation in leadership positions and the total workforce for both 2019 and 2020 (0.731 ** and 0.726 **, respectively). The figures of female employees in 2019 and female managers in 2020 are also positively correlated (0.722 **). These results reveal two important issues: (1) the presence of women on the boards of directors does not depend on the representation of women in lower hierarchical positions; and (2) the presence of more women in leadership positions positively depends on the proportion of female employees.
This analysis has been replicated by adding the data available for 2017 and 2018. On the one hand, the descriptive statistics show the progressive increase in female representation in all hierarchical positions from 2017 to 2020, without the COVID-19 crisis breaking the growing trend for this set of companies. The Bivariate Pearson Correlation has also revealed that the presence of women on the boards of directors does not depend on the representation of women in lower hierarchical positions, and the presence of more women in leadership positions positively depends on the proportion of female employees (see Appendix A, Table A1 and Table A2).
5. Discussion and Conclusions
The COVID-19 pandemic has served to question and rethink some business models, and corporate and competitive strategies, making it more necessary to pay greater attention to the performance of companies in non-financial matters. Recent reports have warned that the impacts of crisis are never gender-neutral [8,19]. Consequently, this research has tried to analyse the variations that have existed in terms of female representation in the Spanish listed companies during the COVID-19 scenario.
The analysis was carried out in the IBEX-35 companies and has revealed the following findings:
- The average proportion of women has grown slightly on the boards of directors, leadership positions and the total workforce in 2020 compared to 2019. In other words, the irruption of the pandemic, despite reducing employment levels, has not caused a decrease in the figures of female representation in IBEX-35 companies.
- The presence of women on the boards of directors does not depend on the gender composition of the rest of the organisational positions.
- Female representation in leadership positions depends on the number of women in the total workforce.
These results may prompt companies to reflect and consider some relevant issues. First, despite the positive trend in the increase in the figures of female representation in 2020, there is still no gender parity in any of the hierarchical positions and very few companies can ’boast’ of having truly diverse boards, managerial roles, or workforce. However, previous research has underscored the many benefits of diversity in organisations. Several authors have revealed the positive impact on financial performance the more gender-diverse the board is [23,24,25]. Diverse boards are associated with more effective risk management and fraud-control practices, as well as greater engagement among board members. The benefits also extend to the ESG indicators: more women in the boardroom leads to more socially responsible behaviour [26,27,28], which impacts on the value of intangibles (e.g., reputation) and long-term business sustainability [29]. A more diverse management team also improves the quality of a company’s leadership, and more women in managerial positions could build more transparent and inclusive workplaces [30], which could have a positive impact on the levels of turnover and absenteeism, social climate, working conditions, and well-being of employees, and may contribute to the generation of long-term value [31,32,33,34]. With regard to lower levels, there is also evidence that teams with an equal gender mix perform better by having a greater variety of perspectives, tasks, and skills [35,36], and human resource practices that address and value diversity fosters employee engagement [37].
Second, the fact that the proportion of female directors on the boards is not linked to the figures of female representation in other leadership positions (e.g., there is a large majority of female external independent directors and there are few female executive directors) may lead us to think that, in most cases, the new appointments are only a matter of reaching established quotas. Therefore, the increase in female representation on the boards of directors would be seen here as a trap that contributes to the publicity of diversity policies but has little real impact on the advancement of the pool of women with leadership experience towards the top hierarchical positions.
Third, it is logical that women are more likely to access positions of responsibility if there is a greater volume of available female talent at lower levels. A progressive reduction in horizontal segregation in employment could contribute to women increasing their presence in certain traditionally masculinized activities and sectors. This would increase the degree of gender diversity in certain workforces and this could ‘push’ women towards higher positions.
Based on these reflections, it is important that companies pay special attention to gender issues in the processes of promotion, new hires, and dismissals to continue a positive trend. In this regard, the COVID-19 scenario could become an opportunity to redefine the equality and diversity objectives, and reorient (if necessary) the corporate culture to create more socially responsible and more sustainable companies.
Finally, this research has observed some limitations. On the one hand, the absence of data and/or the dearth of homogeneity when publishing metrics on gender detracts from the precision of the results obtained. Accordingly, in September 2020 the International Business Council of the World Economic Forum launched the Measuring Stakeholder Capitalism Initiative, which is a commitment that companies can adhere to promote transparency and convergence in the presentation of non-financial reports and the publication of sustainability metrics. This advance could facilitate in subsequent years a more complete and realistic analysis of the impact of the pandemic in terms of gender in IBEX-35 companies, which will be able to verify what the incorporation or presence of more or fewer women in the different hierarchical positions really responds to. On the other hand, the results that we have obtained cannot be extrapolated to the entire Spanish business fabric, which is mainly made up of SMEs that have been affected differently by the pandemic. Therefore, future research could consider expanding the sample and the study period. Hence, it would be possible: (1) to show the different effects taking into account the size of the companies and the sectors of activity; (2) establish causal relationships by adding GRI indicators of economic performance to verify the medium-term and long-term impacts of a greater or lesser representation of women in the different hierarchical positions; and (3) assess progress on sustainability.
Funding
This research was funded by the SPANISH MINISTRY OF SCIENCE, INNOVATION AND UNIVERSITIES, grant number RTI2018-097447-B-I00.
Institutional Review Board Statement
Not applicable.
Informed Consent Statement
Not applicable.
Data Availability Statement
All of the data has been collected from the integrated and non-financial reports that each company publishes annually.
Conflicts of Interest
The author declares no conflict of interest.
Appendix A. Female Representation in IBEX-35 Companies (2017–2020)

Table A1.
Female representation in different organizational positions (2017–2020).
| Company | Women on the Board of Directors | Women in Leadership Positions | Women in the Workforce | |||||||||
|---|---|---|---|---|---|---|---|---|---|---|---|---|
| 2017 | 2018 | 2019 | 2020 | 2017 | 2018 | 2019 | 2020 | 2017 | 2018 | 2019 | 2020 | |
| Acciona | 27.3% | 27.3% | 27.3% | 27.3% | n.a. | 20.4% | 20.3% | 20.7% | n.a. | 32% | 31% | 30% |
| Acerinox | 26.67% | 20% | 23.08% | 33.33% | n.a. | n.a. | 18.07% | 17.37% | 12.02% | 12.1% | 10.9% | 16.27% |
| ACS | 16.67% | 16.67% | 17.65% | 18.75% | 16.5% | 17.1% | 17.5% | 12.3% | 41.2% | 38.8% | 41.5% | 42.3% |
| Aena | 26.67% | 20% | 26.67% | 33.33% | 42.7% | 44% | 43.56% | 44.3% | 35.5% | 35.7% | 36.6% | 36.1% |
| Almirall | 18.8% | 18.8% | 20% | 33.33% | n.a. | n.a. | 40.2% | 41.5% | 55% | 54% | 53.5% | 53% |
| Amadeus | 18.18% | 18.18% | 15.38% | 23.07% | 32.5% | 32.6% | 48.4% | 48.2% | 40.4% | 40.1% | 53.1% | 52.1% |
| Arcelor Mittal | 33.33% | 33.33% | 33.33% | 33.33% | 12% | 12% | 12.6% | 13.7% | n.a. | 9.4% | 6% | n.a. |
| BA Sabadell | 13.33% | 20% | 20% | 26.66% | 24.2% | 25.4% | 24.7% | 25.86% | 55.8% | 55.7% | 55.9% | 55.1% |
| Bankia | 10% | 16.6% | 16.6% | 23.07% | n.a. | n.a. | 42.68% | 43.24% | 54.1% | 56.3% | 56.22% | 56.25% |
| Bankinter | 30% | 30% | 33.33% | 36.36% | n.a. | n.a. | 40.18% | 39.12% | 50.8% | 50.6% | 52.2% | 52.4% |
| BBVA | 23.08% | 26.67% | 26.67% | 33.33% | 17.6% | 18.1% | 22.8% | 31.6% | 54% | 53% | 53.7% | 53.7% |
| CaixaBank | 27.78% | 27.78% | 37.5% | 42.85% | 39.1% | 39.9% | 41.3% | 41.6% | 53.5% | 53.8% | 54.4% | 54.6% |
| Cellnex | 10% | 33.33% | 33.33% | 36.36% | 20.6% | 23.07% | 21.3% | 23.5% | 21.2% | 27.2% | 25.3% | 29.58% |
| CIE Automotive | 15.38% | 15.38% | 15.38% | 21.42% | 8.4% | 9% | 11.59% | 10.13% | 16% | 16% | 16% | 18% |
| Enagás | 23.08% | 23.08% | 30.77% | 25% | 26.1% | 26.4% | 26% | 27.8% | 26.2% | 27% | 27.1% | 29% |
| Endesa | 18.18% | 18.18% | 18.18% | 30.77% | 16.4% | 17.5% | 18.7% | 19.7% | 23.2% | 23% | 23.9% | 24.6% |
| Ferrovial | 16.67% | 16.67% | 16.67% | 16.67% | 16.6% | 16.7% | 12.5% | 15.3% | 29% | 29% | 30.8% | 32% |
| Grifols Cla | 30.77% | 30.77% | 30.77% | 30.77% | 34.7% | 32% | 32% | 36% | 57.4% | 59.2% | 60.36% | 59.76% |
| IAG | 18.18% | 33.33% | 33.33% | 33.33% | 24% | 27% | 30% | 30% | 37.5% | 38% | 44% | 43% |
| Iberdrola | 35.71% | 35.71% | 42.86% | 35.71% | 20.7% | 20.2% | 19.83% | 20.25% | 23.3% | 23.4% | 23.3% | 23.27% |
| Inditex | 22.22% | 33.33% | 36.36% | 36.36% | 79% | 79% | 79% | 81% | 75% | 75% | 76% | 76% |
| Indra | 23.08% | 23.08% | 30.77% | 38.46% | 16.1% | 16.5% | 20% | 24.84% | 34.3% | 33.1% | 35% | 34.13% |
| Inmob. Colonial | 10% | 9.09% | 23.08% | 27.27% | 31.6% | 33.33% | 38% | n.a. | 60% | 60.5% | 61% | n.a. |
| Mapfre | 26.67% | 28.57% | 33.33% | 33.33% | 38.8% | 40.8% | 40.1% | 40.9% | 54.4% | 55% | 54.9% | 55.1% |
| Meliá | 23.08% | 18.18% | 27.27% | 27.27% | 31.7% | 32.9% | 26.9% | 25.5% | 50.1% | 51.4% | 44.6% | 40.4% |
| Merlin Properties | 33.33% | 33.33% | 33.33% | 35.7% | 11.1% | 12.5% | 18.9% | 19.2% | 42.6% | 41.5% | 44.5% | 44.5% |
| Naturgy | 17.65% | 8.33% | 8.33% | 25% | 26.2% | 28.3% | 26.8% | 27.4% | 29% | 31% | 32% | 33% |
| Pharma Mar | 22.22% | 20% | 27.27% | 36.36% | 35.7% | 34.9% | 43.5% | 46.1% | 53.8% | 56.4% | 58.2% | 61.8% |
| Red Eléctrica | 33.33% | 41.67% | 41.67% | 50% | 24.8% | 28.8% | 33.3% | 33.6% | 24.4% | 24.1% | 25.9% | 26.6% |
| Repsol | 12.50% | 20% | 33.33% | 33.33% | 26.1% | 29.2% | 31% | 31% | 36% | 35.8% | 37.4% | 37% |
| Santander | 35.71% | 33.33% | 40% | 40% | n.a. | 20.5% | 22.7% | 23.7% | 55% | 54.5% | 54.7% | 53.7% |
| Siemens Gamesa | 50% | 46.15% | 23.08% | 30% | n.a. | n.a. | 19% | 19.15% | 17.9% | 19% | 18.9% | 18.8% |
| Solaria | 0% | 0% | 16.67% | 16.67% | n.a. | n.a. | n.a. | 33% | 10% | 10.2% | 20.5% | 23% |
| Telefónica | 18.75% | 17.65% | 29.41% | 29.41% | 21.5% | 23% | 26% | 27% | 37.7% | 38% | 38% | 38% |
| Viscofan | 10% | 20% | 20% | 27.27% | 14.7% | 14.8% | 12.5% | 14.75% | 28.8% | 29% | 28.7% | 29.4% |
Table A2.
Summary statistics and correlation matrix.
| Panel A: Summary Statistics | |||||||
| Variable | Mean | Std. Dev. | Min. | Max. | |||
| %Women on Boards 2017 | 22.24 | 9.74 | 0 | 50 | |||
| %Women on Boards 2018 | 23.36 | 9.57 | 0 | 46.15 | |||
| %Women on Boards 2019 | 26.93 | 8.51 | 8.33 | 42.86 | |||
| %Women on Boards 2020 | 30.89 | 7.21 | 16.67 | 50 | |||
| %Women in leadership positions 2017 | 26.27 | 13.97 | 8.40 | 79 | |||
| %Women in leadership positions 2018 | 26.75 | 13.51 | 9 | 79 | |||
| %Women in leadership positions 2019 | 28.88 | 13.73 | 11.59 | 79 | |||
| %Women in leadership positions 2020 | 29.68 | 13.89 | 10.13 | 81 | |||
| %Women in the workforce 2017 | 39.25 | 16.16 | 10 | 75 | |||
| %Women in the workforce 2018 | 38.53 | 16.45 | 9.40 | 75 | |||
| %Women in the workforce 2019 | 39.6 | 16.55 | 6 | 76 | |||
| %Women in the workforce 2020 | 40.38 | 14.87 | 16.3 | 76 | |||
| Panel B: Correlation Matrix | |||||||
| Variable | 1 | 2 | 3 | 4 | |||
| %Women on Boards 2017 | 1.000 | ||||||
| %Women on Boards 2018 | 0.765 ** | 1.000 | |||||
| %Women on Boards 2019 | 0.580 ** | 0.705 ** | 1.000 | ||||
| %Women on Boards 2020 | 0.537 ** | 0.657 ** | 0.792 ** | 1.000 | |||
| %Women in leadership positions 2017 | 0.101 | 0.128 | 0.279 | 0.252 | |||
| %Women in leadership positions 2018 | 0.030 | 0.103 | 0.251 | 0.258 | |||
| %Women in leadership positions 2019 | −0.071 | −0.013 | 0.196 | 0.259 | |||
| %Women in leadership positions 2020 | −0.080 | 0.001 | 0.176 | 0.226 | |||
| %Women in the workforce 2017 | 0.050 | 0.074 | 0.267 | 0.220 | |||
| %Women in the workforce 2018 | −0.035 | 0.015 | 0.197 | 0.198 | |||
| %Women in the workforce 2019 | −0.090 | −0.033 | 0.155 | 0.151 | |||
| %Women in the workforce 2020 | 0.004 | 0.084 | 0.228 | 0.214 | |||
| 5 | 6 | 7 | 8 | 9 | 10 | 11 | 12 |
| 1.000 | |||||||
| 0.995 ** | 1.000 | ||||||
| 0.957 ** | 0.962 ** | 1.000 | |||||
| 0.942 ** | 0.940 ** | 0.988 ** | 1.000 | ||||
| 0.679 ** | 0.622 ** | 0.681 ** | 0.636 ** | 1.000 | |||
| 0.711 ** | 0.667 ** | 0.714 ** | 0.672 ** | 0.996 ** | 1.000 | ||
| 0.697 ** | 0.65 8** | 0.733 ** | 0.721 ** | 0.980 ** | 0.980 ** | 1.000 | |
| 0.699 ** | 0.647 ** | 0.727 ** | 0.723 ** | 0.967 ** | 0.969 ** | 0.994 ** | 1.000 |
† p < 0.10, * p < 0.05, ** p < 0.01, *** p < 0.001.
References
- ILO. The COVID-19 Response: Getting Gender Equality Right for a Better Future for Women at Work. 2020. Available online: https://www.ilo.org/global/topics/coronavirus/WCMS_744685/lang--en/index.htm (accessed on 21 September 2020).
- INMUJER. The Gender Approach, Key in COVID-19 Response. 2020. Available online: http://www.inmujer.gob.es/diseno/novedades/PlantillaCovid-19/EN_IMPACTO_DE_GENERO_DEL_COVID-19_03_EN.pdf (accessed on 21 September 2020).
- EIGE. Covid-19 and Gender Equality. 2020. Available online: https://eige.europa.eu/topics/health/covid-19-and-gender-equality (accessed on 21 September 2020).
- ELCANO Royal Institute. La Crisis Covid y Sus Impactos En La Igualdad De Género. 2020. Available online: http://www.realinstitutoelcano.org/wps/portal/rielcano_es/contenido?WCM_GLOBAL_CONTEXT=/elcano/elcano_es/zonas_es/ari33-2020-solanas-crisis-del-covid-19-y-sus-impactos-en-igualdad-de-genero (accessed on 21 September 2020).
- OECD. Women at the Core of the Fight against Covid. 2020. Available online: https://0-read-oecd--ilibrary-org.brum.beds.ac.uk/view/?ref=127_127000-awfnqj80me&title=Women-at-the-core-of-the-fight-against-COVID-19-crisis (accessed on 21 September 2020).
- UN. POLICY BRIEF: THE IMPACT OF COVID-19 ON WOMEN. 2020. Available online: https://www.un.org/sexualviolenceinconflict/wp-content/uploads/2020/06/report/policy-brief-the-impact-of-covid-19-on-women/policy-brief-the-impact-of-covid-19-on-women-en-1.pdf (accessed on 21 September 2020).
- Eurofound. Gender Equality at Work: European Working Conditions Survey. 2020. Available online: https://www.eurofound.europa.eu/publications/report/2020/gender-equality-at-work (accessed on 27 November 2020).
- UN WOMEN. COVID-19 and Its Economic Toll on Women: The Story behind the Numbers. 2020. Available online: https://www.unwomen.org/en/news/stories/2020/9/feature-covid-19-economic-impacts-on-women (accessed on 27 November 2020).
- Capraro, V.; Sippel, J. Gender differences in moral judgment and the evaluation of gender-specified moral agents. Cogn. Process. 2017, 18, 399–405. [Google Scholar] [CrossRef] [PubMed]
- Rosener, J.B. Ways women lead. In Leadership, Gender, and Organization; Springer: Dordrecht, The Netherlands, 2011; pp. 19–29. [Google Scholar]
- Sczesny, S.; Bosak, J.; Neff, D.; Schyns, B. Gender stereotypes and the attribution of leadership traits: A cross-cultural comparison. Sex Roles 2004, 51, 631–645. [Google Scholar] [CrossRef] [Green Version]
- World Economic Forum. Why We Need Women’s Leadership in the COVID-19 Response. 2020. Available online: https://www.weforum.org/agenda/2020/04/women-female-leadership-gender-coronavirus-covid19-response/ (accessed on 14 December 2020).
- Vroman, S.R.; Danko, T. Against what model? Evaluating women as leaders in the pandemic era. Gend. Work. Organ. 2020, 27, 860–867. [Google Scholar] [CrossRef]
- Sergent, K.; Stajkovic, A.D. Women’s leadership is associated with fewer deaths during the COVID-19 crisis: Quantitative and qualitative analyses of United States governors. J. Appl. Psychol. 2020, 105, 771–783. [Google Scholar] [CrossRef] [PubMed]
- The World Bank. Labor Force Participation Rate, Female (% of Female Population Ages 15+) (Modeled ILO Estimate). 2020. Available online: https://data.worldbank.org/indicator/sl.tlf.cact.fe.zs?most_recent_year_desc=true (accessed on 16 December 2020).
- The World Bank. Labor Force, Female (% of Total Labor Force). 2020. Available online: https://data.worldbank.org/indicator/SL.TLF.TOTL.FE.ZS (accessed on 16 December 2020).
- Catalyst. Women in the Workforce–Global: Quick Take. 2020. Available online: https://www.catalyst.org/research/women-in-the-workforce-global/ (accessed on 16 December 2020).
- Payscale. The State of the Gender Pay Gap 2020. 2020. Available online: https://www.payscale.com/data/gender-pay-gap (accessed on 16 December 2020).
- McKinsey&Company. COVID-19 and Gender Equality: Countering the Regressive Effects. 2020. Available online: https://www.mckinsey.com/featured-insights/future-of-work/covid-19-and-gender-equality-countering-the-regressive-effects (accessed on 12 January 2021).
- INE. Encuesta De Población Activa: Cuarto Trimestre De 2020. 2021. Available online: https://www.ine.es/daco/daco42/daco4211/epa0420.pdf (accessed on 9 February 2021).
- Fortune. The Number of Female CEOs in the Fortune 500 Hits an All-Time Record. 2020. Available online: https://fortune.com/2020/05/18/women-ceos-fortune-500-2020/ (accessed on 16 December 2020).
- CNMV. Presencia De Mujeres En Los Consejos De Administración y En La Alta Dirección De Las Sociedades Cotizadas. 2020. Available online: https://www.cnmv.es/portal/Publicaciones/Consejeras_Directivas.aspx (accessed on 16 December 2020).
- Adams, R.B.; Ferreira, D. Women in the boardroom and their impact on governance and performance. J. Financ. Econ. 2009, 94, 291–309. [Google Scholar] [CrossRef] [Green Version]
- Catalyst. Why Diversity and Inclusion Matter. 2020. Available online: https://www.catalyst.org/research/why-diversity-and-inclusion-matter/ (accessed on 25 February 2021).
- Lückerath-Rovers, M. Women on boards and firm performance. J. Manag. Gov. 2013, 17, 491–509. [Google Scholar] [CrossRef] [Green Version]
- Galbreath, J. Are there gender-related influences on corporate sustainability? A study of women on boards of directors. J. Manag. Organ. 2011, 17, 17–38. [Google Scholar] [CrossRef]
- Setó-Pamies, D. The relationship between women directors and corporate social responsibility. Corp. Soc. Responsib. Environ. Manag. 2015, 22, 334–345. [Google Scholar] [CrossRef]
- Hyun, E.; Yang, D.; Jung, H.; Hong, K. Women on boards and corporate social responsibility. Sustainability 2016, 8, 300. [Google Scholar] [CrossRef] [Green Version]
- ILO. Women in Business and Management: The Business Case for Change. 2019. Available online: https://www.ilo.org/global/publications/books/WCMS_700953/lang--en/index.htm (accessed on 25 February 2021).
- McElhaney, K.A.; Mobasseri, S. Women Create a Sustainable Future; U.C. Berkeley Haas School of Business, University of California: Berkeley, CA, USA, 2012. [Google Scholar]
- Business & Sustainable Development Commission. Behind Every Global Goal: Women Leading the World to 2030. 2017. Available online: http://s3.amazonaws.com/aws-bsdc/BSDC_Behind-Every-Gobal-Goal.pdf (accessed on 25 February 2021).
- Business and Sustainable Development Commission. Better Leadership, Better World. Women Leading for the Global Goals. 2018. Available online: https://d306pr3pise04h.cloudfront.net/docs/publications%2F2018%2FWomenRising2030-Better-Leadership-Better-World.pdf (accessed on 25 February 2021).
- Madera, J.M.; Ng, L.; Sundermann, J.M.; Hebl, M. Top management gender diversity and organizational attraction: When and why it matters. Arch. Sci. Psychol. 2019, 7, 90–101. [Google Scholar] [CrossRef]
- Corporate Excellence & Canvas. Approaching the future 2019. 2019. Available online: https://uploads.strikinglycdn.com/files/133d4d0c-17ca-430d-b2f5-c0f34f85510f/Informe%20Approaching%20The%20Future%202019%20Digital.pdf (accessed on 25 February 2021).
- Herring, C. Does diversity pay? Race, gender, and the business case for diversity. Am. Sociol. Rev. 2009, 74, 208–224. [Google Scholar]
- Hoogendoorn, S.; Oosterbeek, H.; Van Praag, M. The impact of gender diversity on the performance of business teams: Evidence from a field experiment. Manag. Sci. 2013, 59, 1514–1528. [Google Scholar] [CrossRef] [Green Version]
- Luu, T.T.; Rowley, C.; Vo, T.T. Addressing employee diversity to foster their work engagement. J. Bus. Res. 2019, 95, 303–315. [Google Scholar] [CrossRef]
Figure 1.
Evolution of unemployment rates (%) by gender in Spain (2006–2020).

Figure 2.
Evolution of unemployment rates (%) by gender in Spain (2019–2021).

Table 1.
Female representation in different organizational positions.
| Company | Sector * | Women on the Board of Directors (Number of Female Members of the Total) | Women in Leadership Positions | Women in the Workforce (Number of Employees) | ||||||
|---|---|---|---|---|---|---|---|---|---|---|
| 2019 | 2020 | %Var | 2019 | 2020 | %Var | 2019 | 2020 | %Var | ||
| Acciona | CONST | 27.3% (3 of 11) | 27.3% (3 of 11) | 0 | 20.3% | 20.7% | 1.97 | 31% (39,699) | 30% (38,335) | −3.23 (−3.44) |
| Acerinox | META | 23.08% (3 of 13) | 33.33% (4 of 12) | 44.41 | 18.07% | 17.37% | −3.87 | 10.9% (5977) | 16.27% (8195) | 49.27 (37.11) |
| ACS | CONST | 17.65% (3 of 17) | 18.75% (3 of 16) | 6.23 | 17.5% | 12.3% | −29.7 | 41.5% (190,431) | 42.3% (179,539) | 1.9 (−5.7) |
| Aena | TRANSP | 26.67% (4 of 15) | 33.33% (5 de 15) | 24.97 | 43.56% | 44.3% | 1.70 | 36.6% (8878) | 36.1% (8771) | −1.37 (−1.21) |
| Almirall | PHARM | 20% (2 of 10) | 33.33% (4 de 12) | 66.65 | 40.2% | 41.5% | 3.2 | 53.5% (1765) | 53% (1785) | −0.93 (1.13) |
| Amadeus | TOUR | 15.38% (2 of 13) | 23.07% (3 de 13) | 50 | 48.4% | 48.2% | −0.41 | 53.1% (1035) | 52.1% (979) | −1.88 (−5.41) |
| Arcelor Mittal | META | 33.33% (3 of 9) | 33.33% (3 of 9) | 0 | 12.6% | 13.7% | 8.7 | 6% (191,248) | n.a. (167,743) | n.a. (−12.29) |
| BA Sabadell | FIN | 20% (3 of 15) | 26.66% (4 de 15) | 33.30 | 24.7% | 25.86% | 4.70 | 55.9% (24,454) | 55.1% (23,458) | −1.43 (−4.07) |
| Bankia | FIN | 16.6% (2 of 12) | 23.07% (3 of 13) | 38.98 | 42.68% | 43.24% | 1.31 | 56.22% (15,609) | 56.25% (15,522) | 0.05 (−0.56) |
| Bankinter | FIN | 33.33% (4 of 12) | 36.36% (4 of 11) | 9.09 | 40.18% | 39.12% | −2.64 | 52.2% (8531) | 52.4% (8668) | 0.38 (1.61) |
| BBVA | FIN | 26.67% (4 of 15) | 33.33% (5 of 15) | 24.97 | 22.8% | 31.6% | 38.60 | 53.7% (126,793) | 53.7% (123,174) | 0 (−2.85) |
| CaixaBank | FIN | 37.5% (6 of 16) | 42.85% (6 of 14) | 14.27 | 41.3% | 41.6% | 0.73 | 54.4% (35,736) | 54.6% (35,434) | 0.37 (−0.85) |
| Cellnex | TELEC | 33.33% (4 of 12) | 36.36% (4 de 11) | 9.09 | 21.3% | 23.5% | 10.33 | 25.3% (1610) | 29.58% (2008) | 16.92 (24.72) |
| CIE Automotive | AUTOM | 15.38% (2 of 13) | 21.42% (3 of 14) | 39.27 | 11.59% | 10.13% | −12.60 | 16% (28,124) | 18% (25,196) | 12.50 (−10.41) |
| Enagás | ENER | 30.77% (4 of 13) | 25% (4 de 16) | −18.75 | 26% | 27.8% | 6.92 | 27.1% (1306) | 29% (1330) | 7.01 (1.84) |
| Endesa | ENER | 18.18% (2 of 11) | 30.77% (4 of 13) | 69.25 | 18.7% | 19.7% | 5.35 | 23.9% (9952) | 24.6% (9591) | 2.93 (−3.63) |
| Ferrovial | CONST | 16.67% (2 of 12) | 16.67% (2 of 12) | 0 | 12.5% | 15.3% | 22.40 | 30.8% (89,968) | 32% (80,119) | 3.90 (−10.95) |
| Grifols Cla | PHARM | 30.77% (4 of 13) | 30.77% (4 of 13) | 0 | 32% | 36% | 12.50 | 60.36% (24,016) | 59.76% (23,668) | −0.99 (−1.45) |
| IAG | TRANSP | 33.33% (4 of 12) | 33.33% (4 of 12) | 0 | 30% | 30% | 0 | 44% (72,268) | 43% (57,928) | −2.27 (−19.84) |
| Iberdrola | ENER | 42.86% (6 of 14) | 35.71% (5 of 14) | −16.71 | 19.83% | 20.25% | 2.12 | 23.3% (35,374) | 23.27% (37,127) | −0.13 (4.96) |
| Inditex | TEXT | 36.36% (4 of 11) | 36.36% (4 of 11) | 0 | 79% | 81% | 2.5 | 76% (176,611) | 76% (144,116) | 0 (−18.4) |
| Indra | CONS | 30.77% (4 of 13) | 38.46% (5 de 13) | 24.99 | 20% | 24.84% | 20.2 | 35% (49,607) | 34.13% (47,980) | −2.49 (−3.28) |
| Inmob. Colonial | REALES | 23.08% (3 of 13) | 27.27% (3 of 11) | 18.15 | 38% | n.a. | n.a. | 61% (234) | n.a. (231) | n.a. (−1.28) |
| Mapfre | INS | 33.33% (5 of 15) | 33.33% (5 of 15) | 0 | 40.1% | 40.9% | 2 | 54.9% (34,324) | 55.1% (33,730) | 0.36 (−1.73) |
| Meliá | TOUR | 27.27% (3 of 11] | 27.27% (3 of 11) | 0 | 26.9% | 25.5% | −5.20 | 44.6% (45,717) | 40.4% (22,571) | −9.42 (−50.63) |
| Merlin Properties | REALES | 33.33% (4 of 12) | 35.7% (5 de 14) | 7.11 | 18.9% | 19.2% | 1.59 | 44.5% (218) | 44.5% (220) | 0 (0.92) |
| Naturgy | ENER | 8.33% (1 of 12) | 25% (3 of 12) | 200.12 | 26.8% | 27.4% | 2.24 | 32% (11,847) | 33% (10,540) | 3.13 (−11.03) |
| Pharma Mar | PHARM | 27.27% (3 of 11) | 36.36% (4 of 11) | 33.33 | 43.5% | 46.1% | 5.98 | 58.2% (436) | 61.8% (443) | 6.19 (1.61) |
| Red Eléctrica | ENER | 41.67% (5 of 12) | 50% (6 de 12) | 19.99 | 33.3% | 33.6% | 0.90 | 25.9% (2056) | 26.6% (2051) | 2.70 (−0.24) |
| Repsol | ENER | 33.33% (5 of 15) | 33.33% (5 of 15) | 0 | 31% | 31% | 0 | 37.4% (25,228) | 37% (24,125) | −1.07 (−4.37) |
| Santander | FIN | 40% (6 of 15) | 40% (6 of 15) | 0 | 22.7% | 23.7% | 4.41 | 54.7% (196,419) | 53.7% (191,189) | −1.83 (−2.66) |
| Siemens Gamesa | ENER | 23.08% (3 of 13) | 30% (3 of 10) | 29.98 | 19% | 19.15% | 0.79 | 18.9% (23,869) | 18.8% (25,458) | −0.53 (6.66) |
| Solaria | PHARM | 16.67% (1 of 6) | 16.67% (1 of 6) | 0 | n.a. | 33% | n.a. | 20.5% (73) | 23% (104) | 12.20 (42.47) |
| Telefónica | TELEC | 29.41% (5 of 17) | 29.41% (5 of 17) | 0 | 26% | 27% | 3.85 | 38% (117,347) | 38% (113,182) | 0 (−3.55) |
| Viscofan | FOOD | 20% (2 of 10) | 27.27% (3 of 11) | 36.35 | 12.5% | 14.75% | 18 | 28.7% (4628) | 29.4% (5128) | 2.44 (10.80) |
* CONST = Construction; META = Metallurgy; TRANSP = Transportation; TOUR = Tourism; FIN = Finance; TELEC = Telecommunications; ENER = Energy; AUTO = Automotive; PHARM = Pharmaceutical; TEXT = Textile; CONS = Consultancy; REALES = Real Estate; INS = Insurance; and FOOD = Food.
Table 2.
Summary statistics and correlation matrix.
| Panel A: Summary Statistics | |||||
| Variable | Mean | Std. Dev. | Min. | Max. | |
| %Women on boards 2019 | 26.93 | 8.51 | 8.33 | 42.86 | |
| %Women on boards 2020 | 30.89 | 7.21 | 16.67 | 50 | |
| %Women in leadership positions 2019 | 28.88 | 13.73 | 11.59 | 79 | |
| %Women in leadership positions 2020 | 29.68 | 13.89 | 10.13 | 81 | |
| %Women in the workforce 2019 | 39.6 | 16.55 | 6 | 76 | |
| %Women in the workforce 2020 | 40.38 | 14.87 | 16.3 | 76 | |
| Panel B: Correlation Matrix. | |||||
| Variable | 1 | 2 | 3 | 4 | 5 |
| %Women on boards 2019 | 1.000 | ||||
| %Women on boards 2020 | 0.796 ** | 1.000 | |||
| %Women in leadership positions 2019 | 0.181 | 0.260 | 1.000 | ||
| %Women in leadership positions 2020 | 0.196 | 0.272 | 0.987 ** | 1.000 | |
| %Women in the workforce 2019 | 0.132 | 0.151 | 0.731 ** | 0.722 ** | 1.000 |
| %Women in the workforce 2020 | 0.207 | 0.214 | 0.727 ** | 0.726 ** | 0.994 ** |
† p < 0.10, * p < 0.05, ** p < 0.01, *** p < 0.001.
Publisher’s Note: MDPI stays neutral with regard to jurisdictional claims in published maps and institutional affiliations. |
© 2021 by the author. Licensee MDPI, Basel, Switzerland. This article is an open access article distributed under the terms and conditions of the Creative Commons Attribution (CC BY) license (https://creativecommons.org/licenses/by/4.0/).
Share and Cite
MDPI and ACS Style
Campos-García, I. The COVID-19 Scenario in Terms of Gender: A Preliminary Analysis in IBEX-35 Companies. Sustainability 2021, 13, 5750. https://0-doi-org.brum.beds.ac.uk/10.3390/su13105750
AMA Style
Campos-García I. The COVID-19 Scenario in Terms of Gender: A Preliminary Analysis in IBEX-35 Companies. Sustainability. 2021; 13(10):5750. https://0-doi-org.brum.beds.ac.uk/10.3390/su13105750
Chicago/Turabian StyleCampos-García, Irene. 2021. "The COVID-19 Scenario in Terms of Gender: A Preliminary Analysis in IBEX-35 Companies" Sustainability 13, no. 10: 5750. https://0-doi-org.brum.beds.ac.uk/10.3390/su13105750
Note that from the first issue of 2016, this journal uses article numbers instead of page numbers. See further details here.