
Carbon Footprint of Landscape Tree Production in Korea


Department of Ecological Landscape Architecture Design, Kangwon National University, Chuncheon 24341, Korea
*
Author to whom correspondence should be addressed.
Sustainability 2021, 13(11), 5915; https://0-doi-org.brum.beds.ac.uk/10.3390/su13115915
Submission received: 11 April 2021
/
Revised: 17 May 2021
/
Accepted: 20 May 2021
/
Published: 24 May 2021
(This article belongs to the Special Issue Green Infrastructures and Climate Change)
Abstract
:Landscape trees sequester carbon during their growth processes, but they emit carbon through production in nurseries, which may offset carbon uptake. This study quantified the carbon footprint of landscape tree production. After determining the scope of life cycle for landscape tree production, the energy and material used to produce trees of a target size were analyzed by conducting a field survey of 35 nurseries. This energy consumption and input material were converted to an estimate of carbon emitted using data on carbon emission coefficients. The net carbon uptake was 4.6, 12.2, and 24.3 kg/tree for trees with a DBH of 7, 10, and 13 cm, respectively. Thus, even though carbon is emitted during the production process, landscape trees can act as a source of carbon uptake in cities that have high energy consumption levels. This study broke new ground for quantifying the carbon footprint of landscape tree production by overcoming limitations of the past studies that only considered carbon uptake due to absence of data on energy consumption and difficulty of field survey. These study results are expected to provide information on the carbon footprint of landscape trees and to be useful in determining optimal greenhouse gas emissions reduction goal through urban greenspaces.
1. Introduction
Climate change arising from the increase in greenhouse gas emissions since the Industrial Revolution is considered the most threatening global environmental issue. To mitigate the impact of climate change, the global community has adopted various international agreements and policies. In 2015, the Paris Climate Agreement was signed [1]. As a successor to the Kyoto Protocol, it mandates a reduction in greenhouse gas emissions across all countries. Recently, the European Union and Korea announced the Europe Green Deal and Long-term Low Carbon Greenhouse Gas Emission Development Strategies (LEDS), respectively, which seek to reduce carbon emissions to zero by 2050 [2,3]. The increase in carbon levels in the atmosphere is mostly caused by the destruction of greenspace and the consumption of fossil fuels due to urbanization [4,5]. In this context, landscape trees are a vital design and construction material of urban greenspaces. They sequester and accumulate carbon in the air during growth and thus play an important role in mitigating climate change. As landscape tree planting is recognized as one of the core activities in reducing greenhouse gas emissions among major global carbon-neutral programs, its importance is increasing [6,7].
While landscape trees sequester carbon through photosynthesis, they also emit carbon due to production, transport, planting, management, removal, disposal, and recycling throughout their life cycle. These carbon emissions thus partially offset total carbon uptake by the trees themselves. For this reason, it is important to account for these emissions when assessing practical carbon reduction effects of landscape trees. Closely related to the quantification of net carbon uptake is carbon footprint analysis. Carbon footprint is an estimate of the carbon released and sequestered during the life cycle of a good or service. Few studies have estimated the carbon footprint of landscape trees over their life cycle [8]. Strobach et al. (2012) analyzed the carbon footprint by planted trees of urban greenspaces in Leipizig, Germany [8]. The net carbon uptake per unit area of urban greenspace over 50 years ranged from 37.4 to 44.2 t/ha. However, this study did not include carbon emissions from landscape tree production in nurseries. In fact, landscape tree production emits a significant amount of carbon because it involves intensive management, such as irrigation, fertilization, and pest control, in order to sell quality trees. Few studies have addressed carbon emissions from tree production, as follows. Aldentun (2002) reported that forest seedlings produced in a Swedish nursery resulted in emissions of 12.6–36.8 g of carbon per tree [9], while the carbon emissions per tree of forest seedlings produced in an American nursery were 7.9–10.9 g [10,11,12]. Kendall and McPherson (2012) also conducted a field study in California nurseries to quantify total carbon emissions across the entire container landscape tree production process and analyzed the major sources of carbon emissions [13]. Trees in five- and nine-gallon containers resulted in emissions of 1.3 kg and 4.2 kg of carbon per tree, respectively, and irrigation and greenhouse heating were identified as the major sources of carbon emissions.
Similarly, studies calculating carbon emissions of landscape tree production worldwide are still scarce, and existing studies focus mainly on forest trees rather than landscape trees. Forest trees are used for afforestation, and the production methods and input materials for this type of tree differ considerably from those for landscape trees. While forest trees are mainly produced in large quantities for a short period of 1–2 years, landscape trees planted in urban parks, streets, and gardens required a longer production period and more intensive management [14,15]. Applying the results obtained from forest trees to landscape trees may result in significant errors.
Furthermore, carbon emissions from landscape tree production may also differ depending on the country, growth environment, and production method, even for the same tree species and sizes. Landscape tree production can be divided into open-field tree (OFT) and container tree (CT) production [15,16]. OFT involves the outdoor sowing of seeds and several transplant cycles until the trees mature. CT production includes seed sowing or seedling planting in a greenhouse before transplanting and growing them in containers after they reach a certain size. In general, previous studies have considered only carbon emissions from CT, which means that the results cannot be easily applied to OFT production, which differs in terms of input resources and production methods. This must be addressed because some countries differ in their dominant production type; for example, the United States cultivates most of its trees using CT production, while Korea typically adopts OFT production [16]. Despite these potential differences, studies comparing the emission of carbon from landscape tree production globally have been rare. More studies like these that investigate various production methods and growth environments are required to accurately determine net carbon uptake of landscape trees.
On the other hand, various studies related to the carbon footprint have been conducted in industrial fields such as building, civil engineering, and agriculture [17,18,19,20,21,22,23]. Gong and Shong (2016) quantified carbon emissions over the life cycle of buildings, including material production, construction, operation, and demolition, in Wuhan, China [17]. The carbon emissions were approximately 23.7 Mt, and the main factor in carbon emissions was energy consumption from building operation. Studies calculating the carbon emissions of building materials production or operation have also been conducted [18,19,20,21]. Sambito and Freni (2017) estimated the carbon footprint of the integrated urban water system in Palermo, Italy, and proposed replacing old pumps with high-efficiency ones to reduce carbon emissions [22]. Diacono et al. (2019) reported that the carbon emissions of biofertilizer production were 17.4 and 18.3 kg/Mg for anaerobic digestate and olive waste compost, respectively [23]. The production of zucchini and lettuce resulted in emissions of 0.8 t of carbon per ha, and irrigation was a major source of carbon emissions [23].
Quantifying the carbon footprint by landscape trees over their life cycle requires the development and application of carbon estimates indicators for production, planting, growth, management, removal, and recycling. Among these, landscape tree production is considered a major source of carbon emission that offsets carbon uptake of trees because intensive management is conducted to sell trees. However, there is currently little information on carbon footprint of landscape tree production not only in Korea but also globally due to the absence of energy consumption data on nurseries and difficulties in conducting field surveys. Therefore, the purpose of this study was to quantify the carbon footprint for landscape tree production by conducting a field survey of Korean landscape tree nurseries. To this end, this study comprised field survey of study nurseries, analysis of energy consumption and input material, calculation of carbon emissions from tree production, estimation of cumulative carbon uptake through tree growth, and quantification of net carbon uptake by deducting emission from uptake. The results of this study could be useful in internationally sharing the information regarding carbon footprint of landscape tree production and ecological design and construction of urban greenspaces.
2. Materials and Methods
2.1. Study Framework
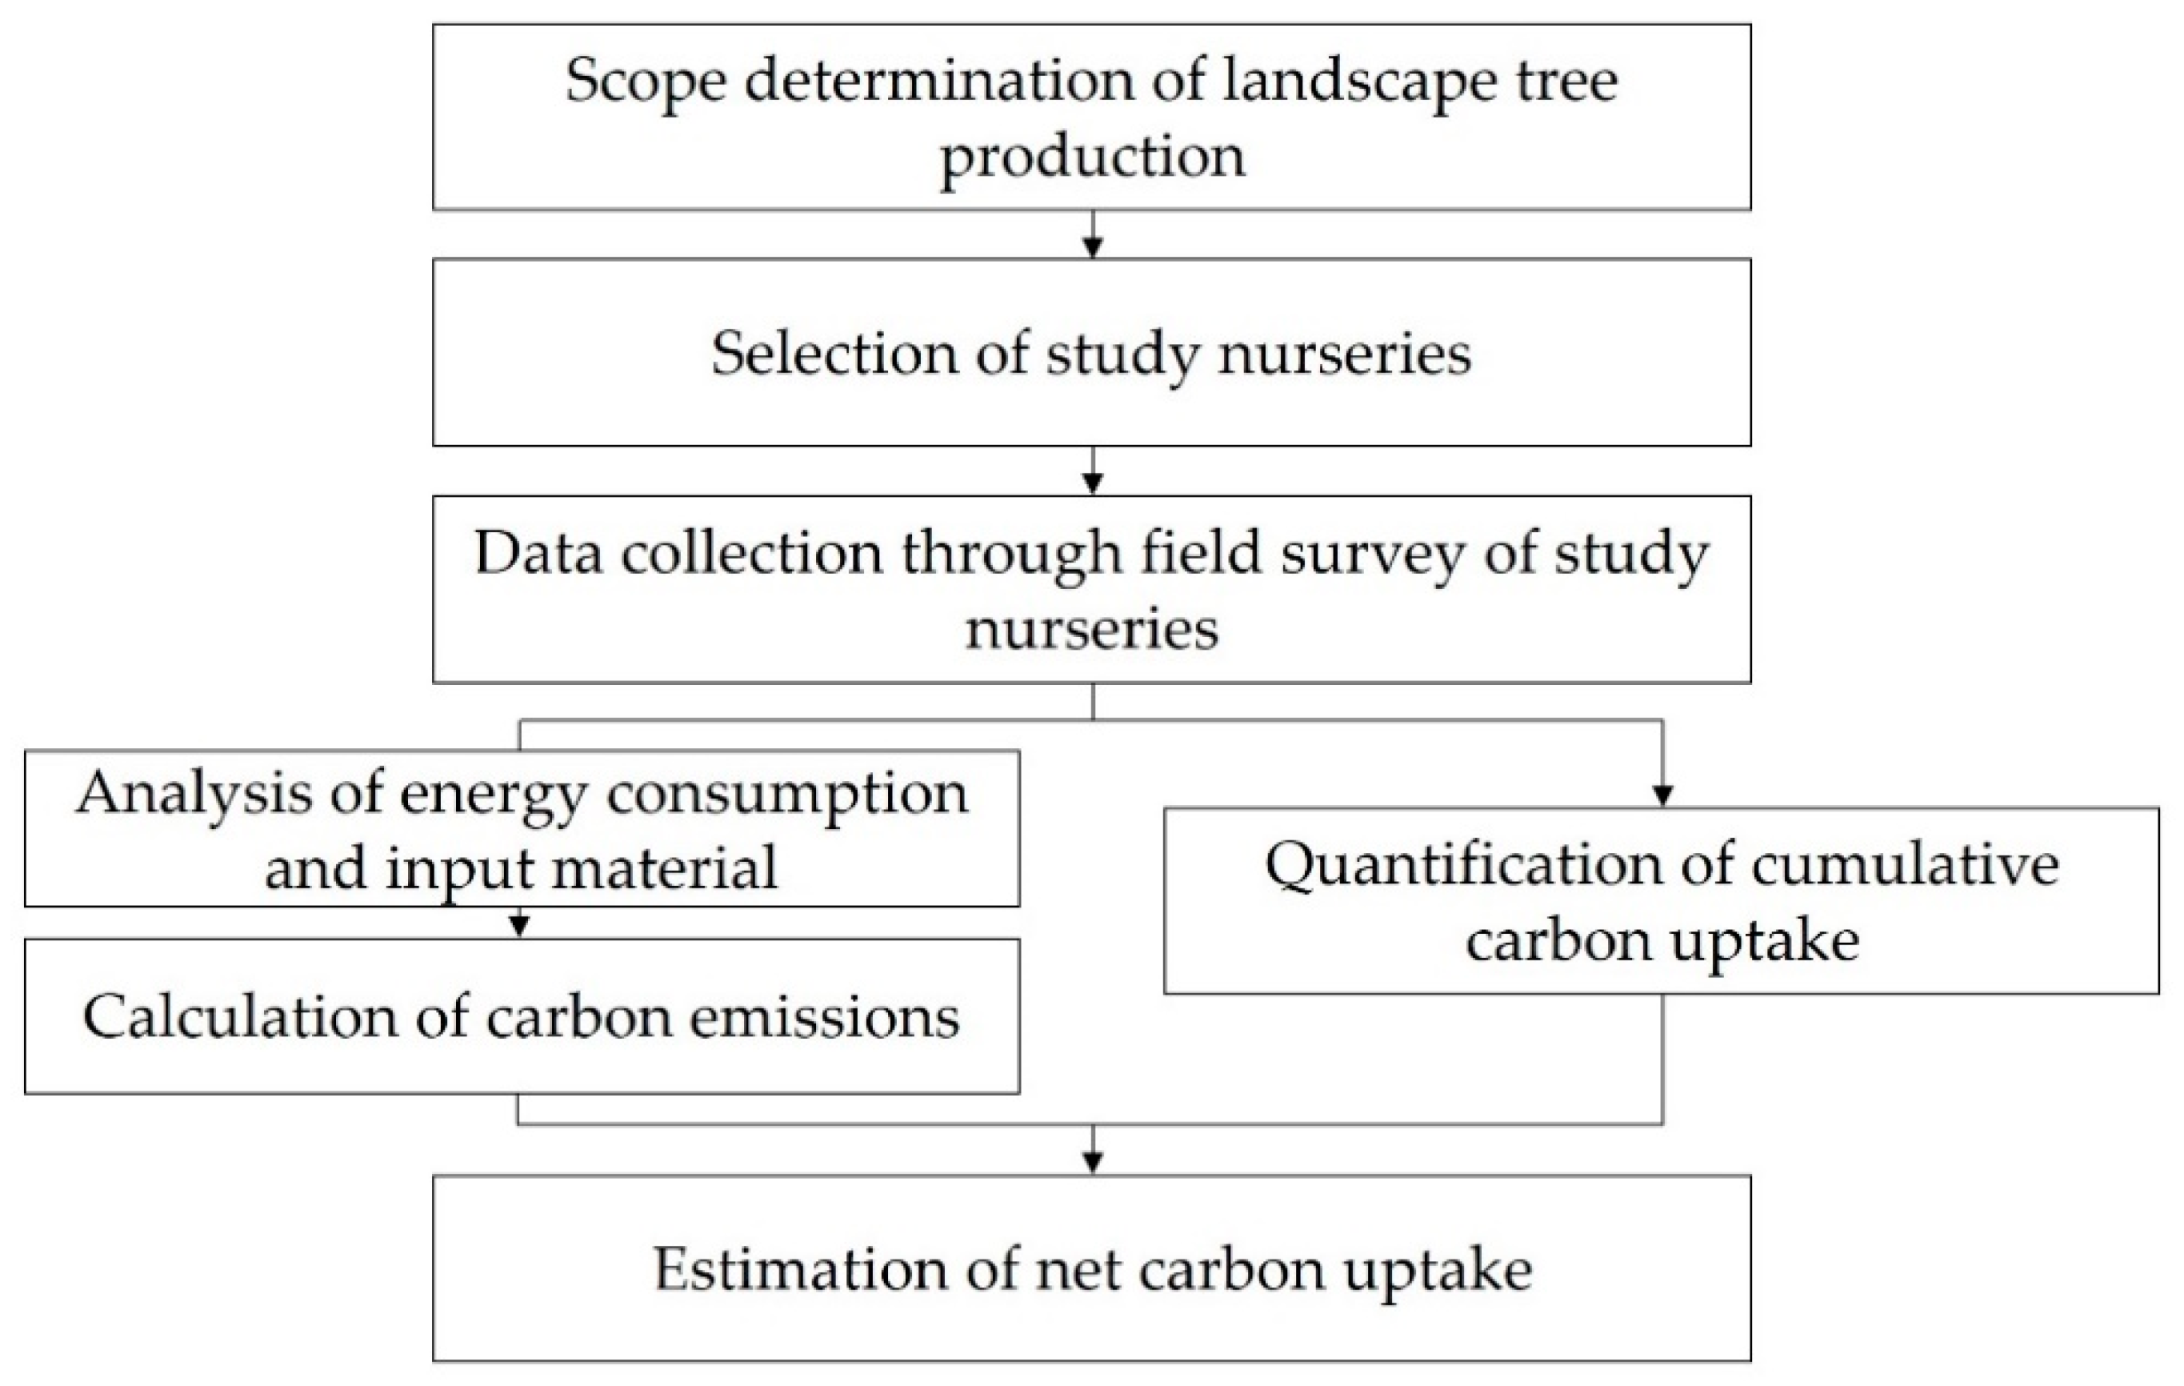
The study consists of seven phases: (1) scope determination of landscape tree production; (2) selection of study nurseries; (3) data collection through field survey of study nurseries; (4) analysis of energy consumption and input material by landscape tree production; (5) calculation of carbon emissions; (6) quantification of cumulative carbon uptake; and (7) estimation of net carbon uptake. Figure 1 shows the framework and procedure of this study. This study first grasped the process of how trees are produced before they are shipped. In addition, study nurseries were selected to measure energy consumption and input material for each stage of landscape tree production. Energy consumption and input material measured through field surveys of study nurseries were converted to an estimate of carbon by applying each carbon emission coefficient. In addition, the carbon absorbed during the growth of landscape trees (i.e., from sowing to maturity) was quantified, and net carbon uptake was estimated by deducting emission from uptake.
2.2. Overview of Landscape Tree Production
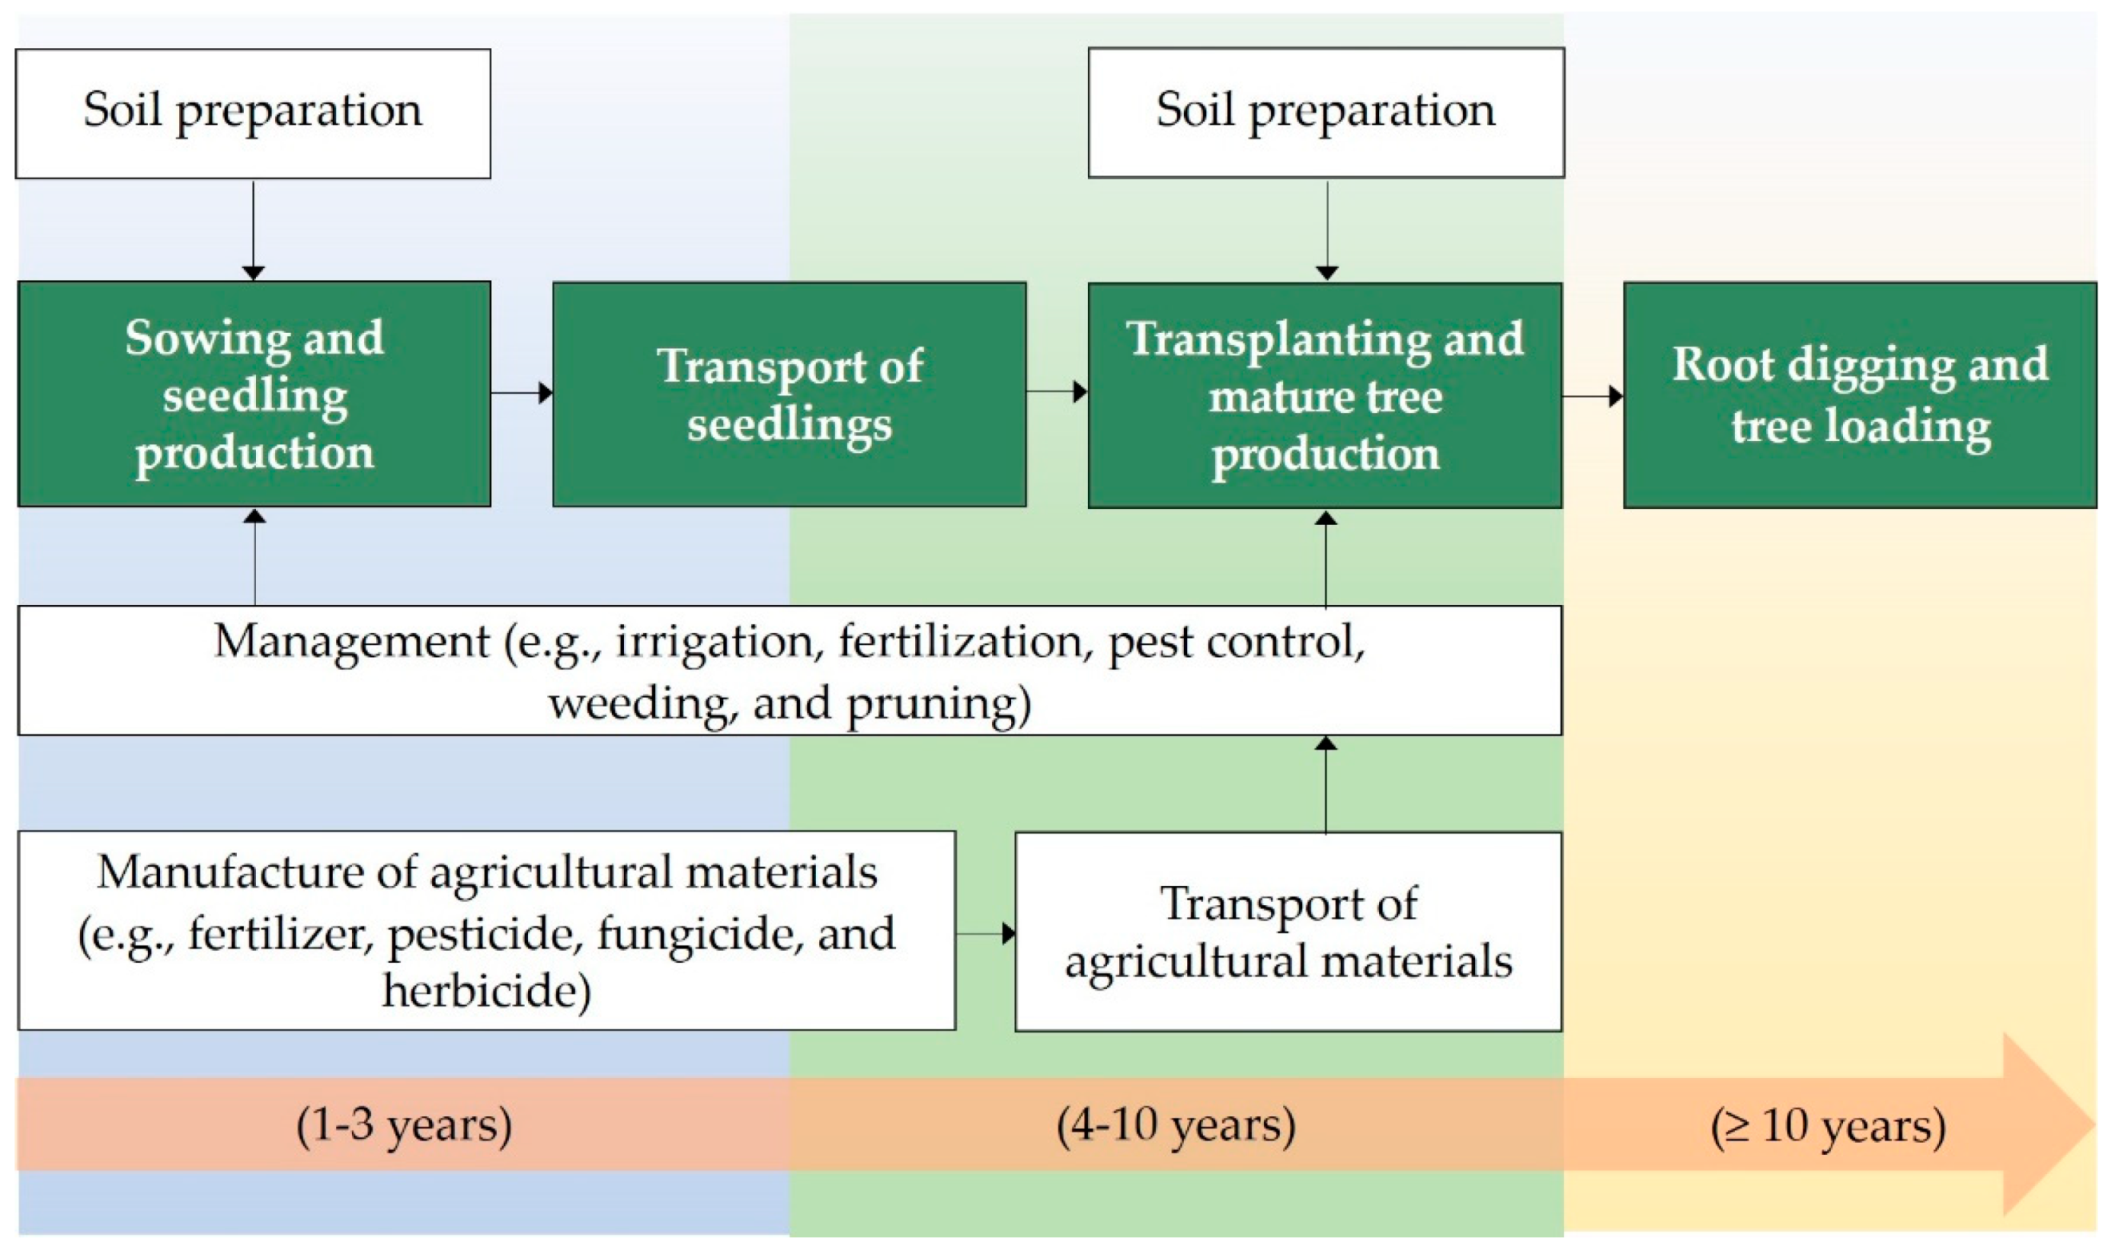
Korea’s landscape tree nurseries can be divided into those that produce seedlings after sowing and those that purchase and grow seedlings into mature trees. Because the labor and financial costs for nursery owners are high if the nursery attempts to handle the entire production cycle itself, from sowing seeds to producing mature trees, most nurseries choose between growing seedlings or growing mature trees. Some nurseries do handle the entire production process, but most of these only sow on a small scale and procure most of their most popular trees from seedling nurseries. Figure 2 presents the landscape tree production process considered for the present study, which includes four main steps: (1) sowing and seedling production, (2) transport of seedlings, (3) transplanting and mature tree production, and (4) root digging and tree loading.
According to the Korea Landscaping Tree Association, landscape trees are produced and sold in various sizes, with a stem diameter at breast height (DBH) of between 3 cm and 50 cm [24]. As a result, the same tree species may still vary in terms of its growth period and input resources depending on its size, which needs to be considered when determining the carbon footprint. To ensure the validity of the data, this study investigated trees with a DBH of 7 cm, 10 cm, and 13 cm, sizes that are commonly supplied to urban greenspace projects in Korea [24], as the standard for carbon footprint calculations.
2.3. Selection of Study Nurseries
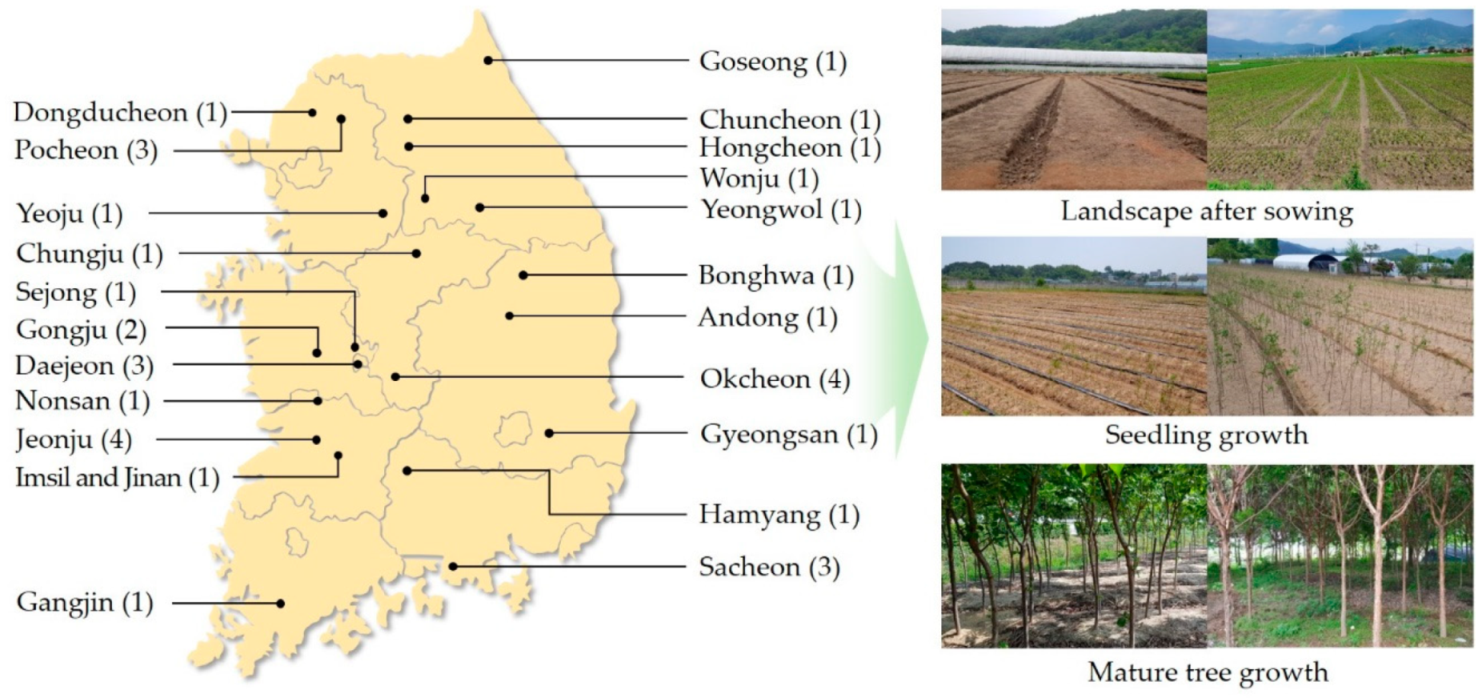
A field survey of tree nurseries was conducted to quantify the carbon footprint for landscape tree production in Korea. The number of tree nurseries in the sample was important in determining the credibility of the study results. There are 1100 registered members of the Korea Landscaping Tree Association in Korea; thus, the actual number of nurseries will be higher when considering the non-registered members. However, conducting a field survey of all nurseries in Korea was challenging in terms of time, cost, and cooperation. Therefore, the study used lists provided by the Landscape Times, Korea Landscaping Tree Association, and Korea National Forestry Cooperative Federation to select nurseries with a production area of over 3000 m2 and experience as a supplier to government projects. In total, 35 nurseries that consented to take part in the study were selected as the target group for this study (Figure 3).
2.4. Data Collection and Analysis
Landscape trees emit carbon via direct and indirect energy consumption during the production process. In the present study, direct consumption included the fuel used to operate equipment, while indirect consumption was the energy generated from the manufacturing of the fertilizers, pesticides, fungicides, and herbicides used in the production process. Because no previously published information on energy consumption in landscape tree production was available to calculate the carbon footprint, these data were obtained from a field survey and interviews with the study nurseries. After conducting the field survey for two years from 2020 to 2021, the study estimated the direct and indirect energy consumption required to produce the most common size of planting tree (DBH of 7, 10, and 13 cm) for greenspace projects.
The study examined the materials and types of equipment used in each step in the production process, including soil preparation, sowing, transplanting, irrigation, fertilization, pest control, weeding, transport, root digging, and tree loading, as well as the usage frequency, energy consumption, and transport distance (Table 1, Appendix A). The actual quantity of compost, fertilizers, pesticides, fungicides, and herbicides used was measured to the nearest 10 g at those nurseries that allowed actual measurements to be taken. The data were compared and reinforced after reviewing the operation manual of the actually used products. The results were statistically analyzed using Microsoft Office Excel 2016, and the average energy consumption per tree was calculated.
2.5. Estimation of the Carbon Footprint
The carbon footprint is a valuable method for estimating the carbon released and sequestered over the life cycle of landscape trees. In this study, the carbon footprint was estimated by applying Equation (1), as follows.
where C is the carbon footprint, CE is carbon emissions of landscape tree production, and CU is cumulative carbon uptake of landscape trees. The carbon footprint was computed by deducting carbon emissions from cumulative carbon uptake. Carbon emissions were calculated by aggregating the emissions from direct and indirect energy consumption for each stage of landscape tree production. Mathematically, this can be written as:
where CEdirect and CEindirect refer to carbon emissions due to direct and indirect energy consumption, respectively. The direct carbon emissions were quantified using the carbon emission coefficients of 0.59 kg/L for gasoline, 0.71 kg/L for diesel, and 0.127 kg/kWh for electricity [25,26]. The indirect carbon emissions were computed by multiplying the total amounts of irrigation, fertilizer, compost, pesticide, fungicide, and herbicide used in landscape tree production by each carbon emission coefficient (Table 2) [27,28,29,30,31].
C = −CE + CU
CE = CEdirect + CEindirect
The cumulative carbon uptake of landscape trees refers to carbon uptake accumulated during growth from seedling to a tree for specimens with a DBH of 7, 10, and 13 cm. The cumulative carbon uptake of landscape trees can be mathematically determined from the following equation:
where U is carbon uptake of the annual rate of carbon absorption. It is calculated by applying the annual stem diameter growth and a quantitative model developed for Korea’s landscape trees. This concept can be represented by the formula:
where D is annual stem diameter growth of 0.76 cm [32], T is age of landscape trees, and Q is quantitative model developed for a direct harvesting method including root digging, with the stem diameter as an independent variable (Table 3) [33,34,35,36,37,38]. That is, cumulative carbon uptake of a landscape tree was estimated by continuously adding annual carbon uptake until tree grows to DBH of 7, 10, and 13 cm based on Equation (3).
U = (D × T) × Q
3. Results and Discussion
3.1. Study Nurseries
A total of 35 tree nurseries were examined in this study. Of these, 5 produced only seedlings, 13 produced both seedlings and mature trees, and the remaining 17 handled only mature trees (Table 4). These nurseries all had at least eight years of production experience, with a total production area ranging from 1.6–22.5 ha. The most commonly grown tree species were Chionanthus retusus, Ginkgo biloba, Pinus densiflora, Prunus yedoensis, and Zelkova serrata, all of which are commonly found in Korea’s greenspaces. The target nurseries produced these trees using both OFT and CT production, but most employed the former method. The nurseries that utilized CT production were excluded from the current study because they focused on the production of trees between 1 and 2 years old for afforestation.
3.2. Carbon Footprint of Landscape Tree Production
The study targeted the most commonly produced landscape tree species in Korea, which include C. retusus, G. biloba, P. densiflora, P. yedoensis, and Z. serrata in the calculation of the carbon footprint. There was no statistically significant (p > 0.01) difference in the carbon footprint between these tree species.
3.2.1. Sowing and Seedling Production
According to the field survey, it takes 2 to 3 years to produce landscape tree seedlings after sowing. Table 5 presents the energy consumption for the sowing and seedling production stage, which includes soil preparation, irrigation, fertilization, pest control, weeding, and transport. The average carbon emissions were 144.89 ± 13.25 g/tree (Table 6), with the main sources being irrigation, soil preparation, and fertilization. In particular, irrigation accounted for 95% of total carbon emissions. The nurseries irrigated for at least 30 min every 2 to 3 days from the spring to the summer after sowing to boost the seedling survival rate. After that, they either irrigated the trees every week or did not use any irrigation unless drought occurred for at least 15 days. The amount of water applied during each irrigation session was between 50.5–840.0 mL per tree, with an average of 347.6 ± 65.1 mL.
3.2.2. Transport of Seedlings
The study nurseries mostly purchased seedlings from Oakchun-gun to produce mature trees. Oakchun-gun is the largest seedling production city in Korea and is responsible for 70% of all seedling production in Korea [39]. The study nurseries dug out these seedlings from the roots manually and did not use other tools. The seedlings were generally transported using 1.0 or 4.5 t trucks, with a 1.0 t truck able to transport between 1,000 and 2,000 seedlings. The average diesel consumption and carbon emissions required to transport the trees from Oakchun-gun to the nurseries were 13.57 ± 1.09 mL/tree and 9.63 ± 0.77 g/tree, respectively.
3.2.3. Transplanting and Mature Tree Production
The total energy consumption and carbon emissions required to produce trees with a DBH of 7, 10, and 13 cm from the seedlings are summarized in Table 7 and Table 8. The carbon emissions for trees with a DBH of 7, 10, and 13 cm were 1.49 ± 0.13, 1.82 ± 0.19, and 2.36 ± 0.27 kg/tree, respectively. Irrigation was responsible for the largest carbon emissions, followed by fertilization, soil preparation, pest control, and weeding. Most nurseries irrigated about 5–20 L from one to five times per tree at the beginning of transplanting but did not irrigate after that. Fertilization was conducted one or two times a year, except for a few nurseries. The nurseries used 0.01 to 1 kg of fertilizer per tree each time.
Most of the target nurseries (70%) conducted pest control at least once a year, and the average amount of pesticide and fungicide used was 2.8 ± 0.4 mL/tree and 2.1 ± 0.3 g/tree. The most common pesticides were Smitchon, Salbiwang, and Conido, which are effective against moths and mites, while the fungicides DisenM-45 and FreeN were employed against anthrax and leaf blight. Weeds were typically removed by spraying herbicides and using a mower two to four times every year. The average gasoline consumption for each use of the motor sprayer and mower was 5.1 ± 1.4 and 7.5 ± 1.2 mL/tree, respectively. Some nurseries did not do any weeding or halved the frequency after the fourth or fifth post-transplant year, by which time the tree crowns had become shade-forming. The average pruning frequency at the study nurseries was one to two times a year using secateurs, which do not require any energy. However, topiary trees required the use of electronic pruning tools and electric saws, which used 10–20 mL of gasoline for each tree with each use. Most of the pruned branches were left on the ground to allow natural decomposition to occur.
3.2.4. Root Digging and Tree Loading
The study nurseries manually conducted root digging and tree loading without any additional tools for trees with a DBH of less than 10 cm. For trees with a DBH of 10 and 13 cm, small excavators were used, consuming about 0.8 and 1.1 L/tree for each tree, respectively. As such, trees with a DBH of 7 cm did not produce any carbon emissions due to root digging and tree loading, whereas those with a DBH of 10 and 13 cm emitted 0.6 and 0.8 kg/tree, respectively. After root digging, the trees required additional materials, such as jute ropes, rubber bands, and wires. The carbon emissions for each material were excluded from this study because no reliable information for these could be obtained.
3.2.5. Carbon Footprint
The total carbon emissions from landscape tree production were 1.6, 2.5, and 3.3 kg/tree for trees with a DBH of 7, 10, and 13 cm, respectively (Table 9). A previous study reported that the total carbon emitted in the production of five- and nine-gallon CTs in a US nursery was 1.3 kg/tree and 4.2 kg/tree, respectively [13]. In this study, carbon emissions from landscape tree production were lower than those of the above-mentioned study, since this research did not use consumable materials, such as containers, piles, and topsoil, nor did it include long-distance travel.
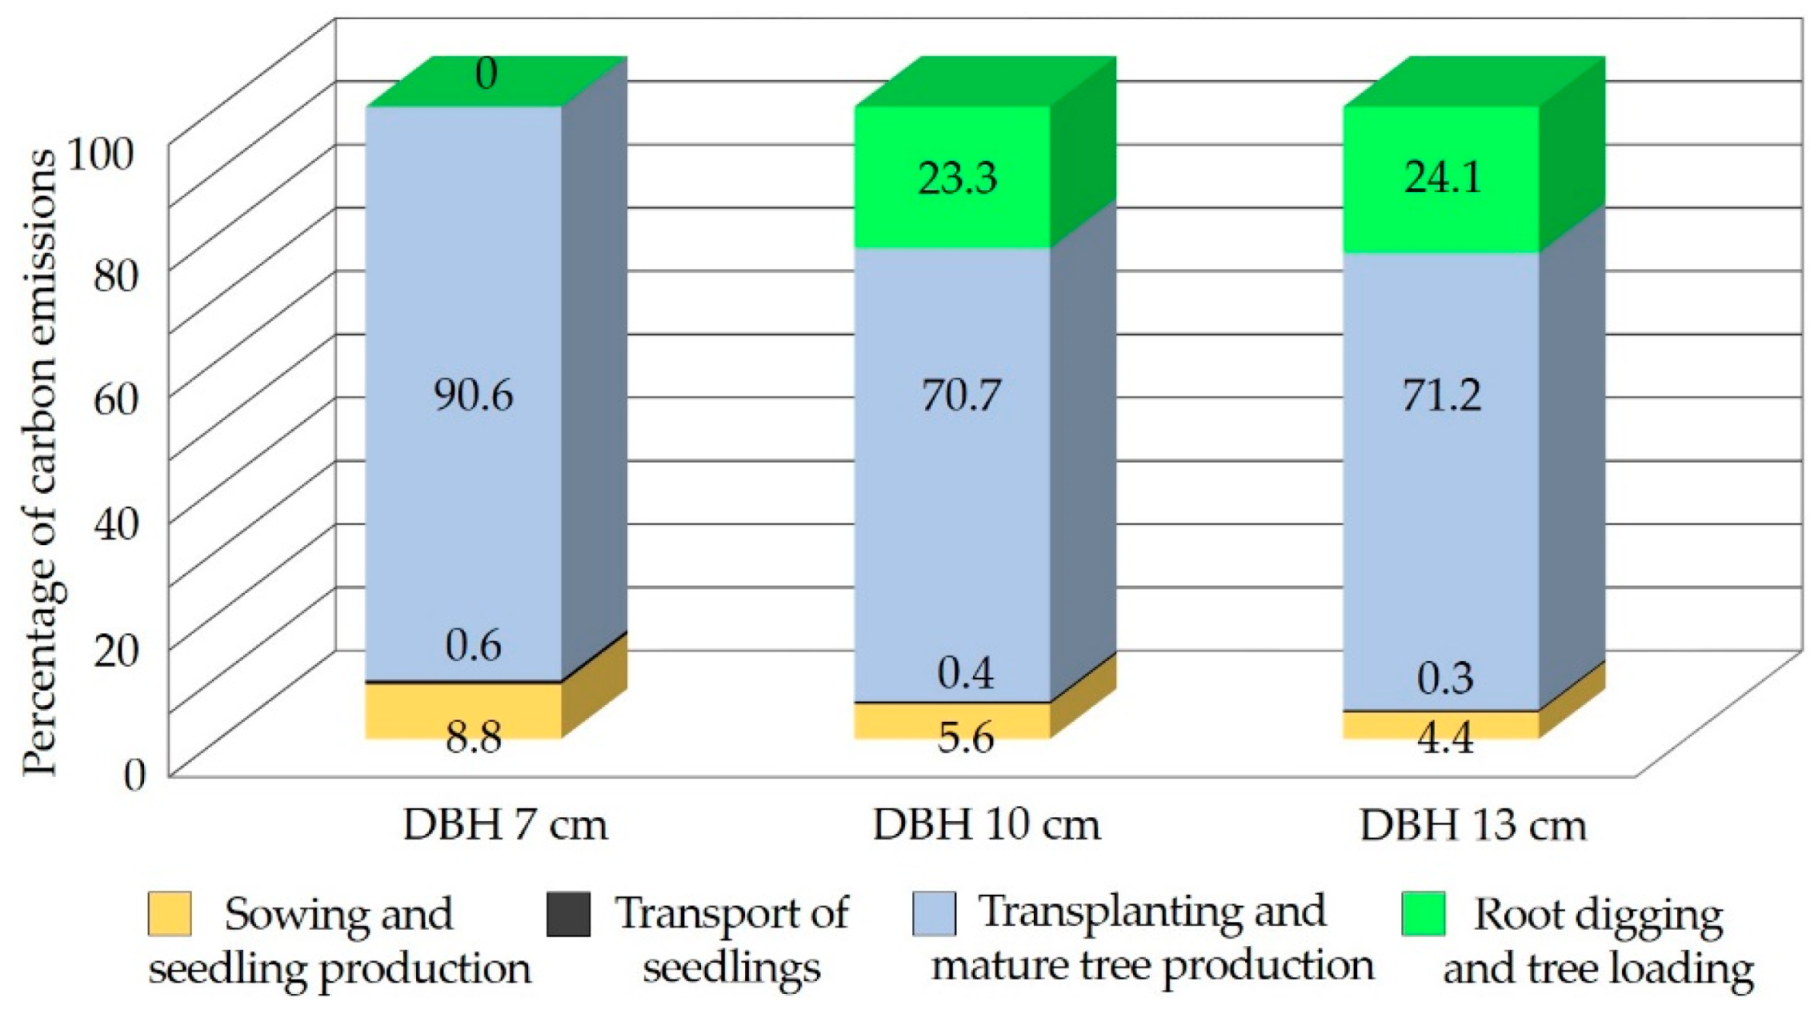
Figure 4 shows the percentage of carbon emissions by each stage in the life cycle of landscape tree production based on Table 9. Transplanting and mature tree production accounted for 70.7% of total carbon emissions from a tree with a DBH of 10 cm, followed by root digging and tree loading (23.3%), sowing and seedling production (5.6%), and transport of seedlings (0.4%). Although there are no studies whose results can be directly compared with this one, similar trends can be inferred from previous research. In other words, considering that the carbon emissions (7.9–36.8 g/tree) of forest seedlings production is only 1–3% of carbon estimates (1.3–4.2 kg/tree) for mature landscape trees [9,10,11,12,13], it can be deduced that the stage of highest carbon emissions is transplanting and seedling production, as in this study.
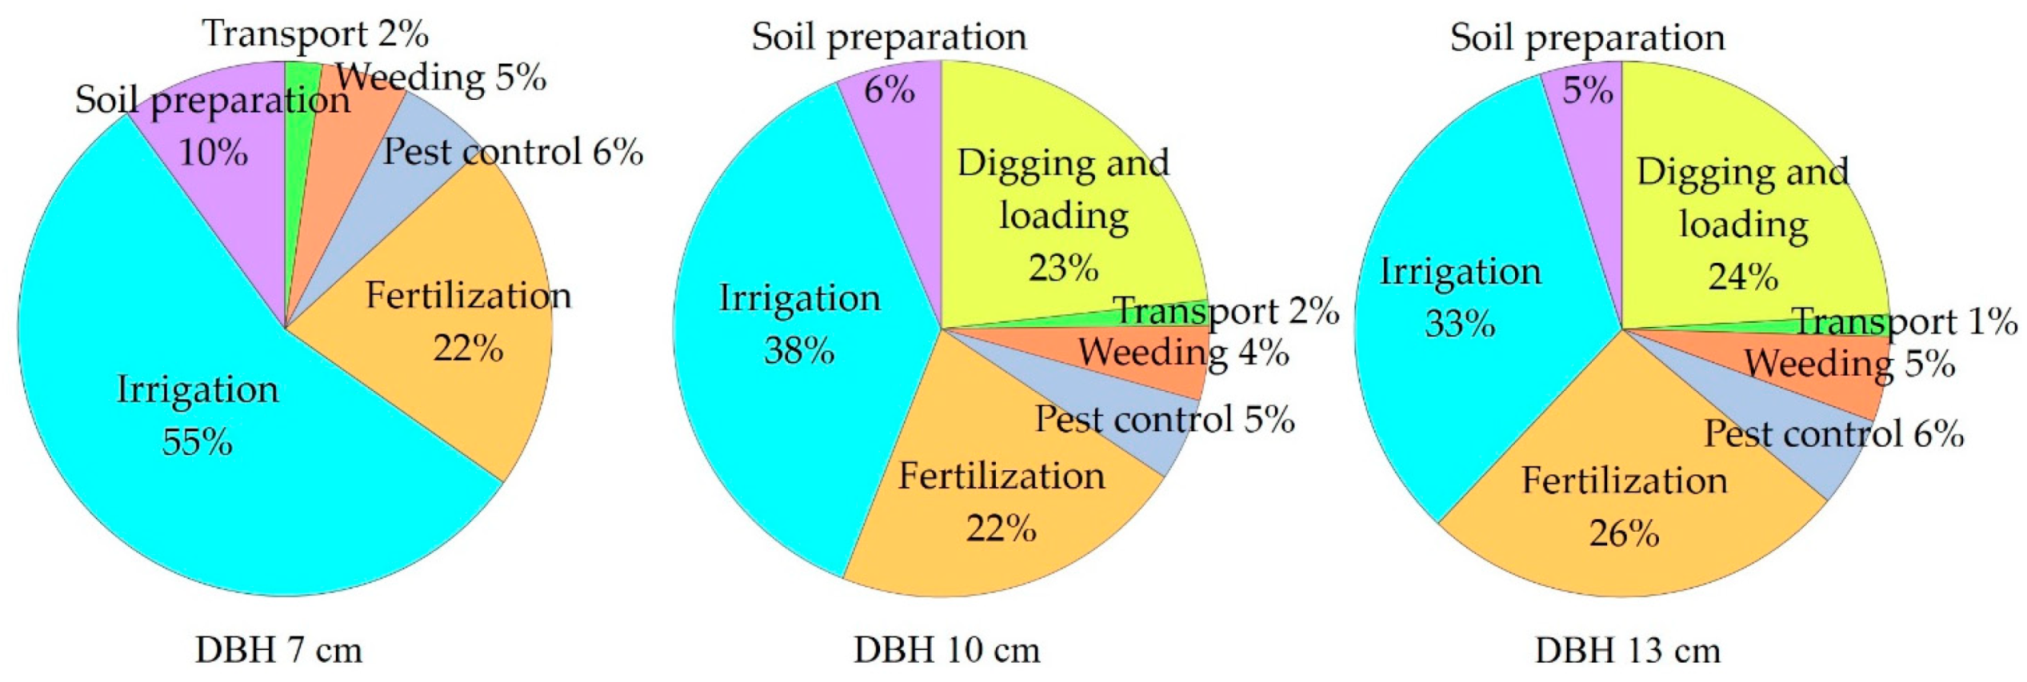
On the other hand, sowing and seedling production and transplanting and mature tree production emitted carbon due to energy consumption according to annual management procedures, such as irrigation and fertilization. Taking this into account, Figure 5 shows in more detail carbon emissions by each stage of landscape tree production. Irrigation accounted for 38% of total carbon emissions from a tree with a DBH of 10 cm, followed by root digging and tree loading (23%), fertilization (22%), soil preparation (6%), pest control (5%), weeding (4%), and transport (2%). The most significant factor contributing to carbon emissions for landscape tree production was irrigation. This is because most nurseries used spray irrigation and motor sprayers that consumed energy. Similarly, the main source of carbon emission from CT production in the United States was electricity use by irrigation [13].
To reduce carbon emissions from landscape tree production, irrigation must take place only when the survival of the tree is at risk due to prolonged drought (once the tree is fully transplanted), and ways to use alternative energy sources or rainwater to replace existing energy-consuming irrigation systems must be devised. In addition, existing chemical fertilizers and pesticides that emit carbon during their manufacturing process must be replaced by eco-friendly products to minimize carbon emissions.
The cumulative carbon uptake for trees with a DBH of 7, 10, and 13 cm was 6.2 ± 0.6, 14.7 ± 1.4, and 27.6 ± 2.7 kg/tree, respectively. The carbon emissions for landscape tree production were 12–26% of cumulative carbon uptake. The net carbon uptake calculated by subtracting emissions from cumulative carbon uptake was 4.6, 12.2, and 24.3 kg/tree for trees with a DBH of 7, 10, and 13 cm, respectively. Thus, even though carbon is emitted in the production process, landscape trees play an important role as a source of carbon uptake in cities where energy consumption remains high. Kendall and McPherson (2012) also concluded that carbon uptake of landscape trees is about two to five times higher than their carbon emissions [13].
4. Conclusions
Landscape trees have become increasingly important as a source of carbon uptake to mitigate the impact of climate change. This study quantified carbon released and sequestered in landscape tree production with little information based on a field survey of Korean nurseries. Subsequently, the practical carbon reduction effects of landscape trees were calculated by deducting emission from uptake.
The total carbon emissions from producing trees with a DBH of 7, 10, and 13 cm in OFT production were 1.6, 2.5, and 3.3 kg/tree, respectively. The two largest carbon emission sources were irrigation and fertilization. In particular, irrigation generated 33–55% of all emissions. To reduce carbon emissions generated during landscape tree production, alternative energy sources should be explored to replace existing irrigation systems or techniques that utilize rainwater should be developed. In addition, environmentally friendly chemical fertilizers and pesticides must replace those that emit carbon during their manufacturing process.
The cumulative carbon uptake for trees with a DBH of 7, 10, and 13 cm was 6.2, 14.7, and 27.6 kg/tree, respectively, with total carbon emissions from tree production accounting for 12–27% of this uptake. This led to a net carbon uptake for landscape tree production of 4.6, 12.2, and 24.3 kg/tree, respectively. This means that landscape trees remain an important source of carbon uptake for cities despite the emissions generated during their production.
According to previous studies, the lifespan of landscape trees in urban greenspaces was approximately 50–60 years [8,40]. Landscape trees not only sequester carbon in the process of their growth but also emit carbon due to production, transport, planting, management, removal, disposal, and recycling over their entire life cycle. Quantifying net carbon uptake of landscape trees by deducting emission from uptake is essential to clearly analyze carbon reduction effects of urban greenspaces. As a limitation, this study considered only the carbon footprint of production in the life cycle of landscape trees. In addition, the carbon emissions due to the production of landscape trees larger than DBH of 13 cm were not considered. Nevertheless, this study opened new avenues to quantify carbon footprint of landscape tree production by overcoming the limitations of the previous studies that only considered carbon uptake due to the absence of data on energy consumption and difficulty in conducting field survey of nurseries.
The results of this study can serve as the basis for determining optimal policies for greenhouse gas emissions reduction goal and carbon emission credits through urban greenspaces. In the future, it will be necessary to conduct additional studies considering the entire life cycle to quantify carbon budgets of landscape trees, as well as to explore ecological design and construction strategies to improve carbon reduction effects of urban greenspaces. In addition, it is desirable to compare and reinforce the data by performing similar studies for a variety of production methods and growing environments of landscape trees.
Author Contributions
Conceptualization, H.-M.P.; methodology, H.-M.P. and H.-K.J.; investigation, H.-M.P., H.-K.J., and J.-Y.K.; analysis, H.-M.P.; writing—original draft preparation, H.-M.P. and H.-K.J.; writing—review and editing, H.-M.P. and H.-K.J.; visualization, H.-M.P. and J.-Y.K.; supervision, H.-M.P. and H.-K.J. All authors have read and agreed to the published version of the manuscript.
Funding
This study was carried out with the support of the “R&D Program for Forest Science Technology (Project No. 2019151D10-2123-0301)” provided by the Korea Forest Service (Korea Forestry Promotion Institute).
Institutional Review Board Statement
Not applicable.
Informed Consent Statement
Not applicable.
Data Availability Statement
Not applicable.
Acknowledgments
This paper partially summarizes and reconstructs the doctoral dissertation submitted by Hye-Mi Park [41]. This study would not have been possible without assistance and information provided by owners in the study nursery. We are very grateful to nursery owners, for their cooperation in fulfilling this study.
Conflicts of Interest
The authors declare no conflict of interest.
Appendix A

Table A1.
Form of inventory sheets for field survey.
| Component | Field Survey Inventory | 1 Year | … | n Year | ||
|---|---|---|---|---|---|---|
| Tree production practices | Tree species | |||||
| Planting distance (m) | ||||||
| Sowing and seedling per unit area (trees/m2) | ||||||
| Production type (open-field or container) | ||||||
| Soil preparation | Equipment | Type (e.g., tractor) | ||||
| Annual frequency of use | ||||||
| Energy consumption per event | ||||||
| Material | Type (e.g., compost) | |||||
| Amount | ||||||
| Management | Irrigation | Annual frequency | ||||
| Amount of irrigation per event (L) | ||||||
| Equipment | Type (e.g., spray) | |||||
| Energy consumption | ||||||
| Fertilization | Type & annual frequency | |||||
| Amount of fertilization per event (g) | ||||||
| Equipment | Type (e.g., power sprayer) | |||||
| Energy consumption | ||||||
| Pesticide & fungicide | Type & annual frequency | |||||
| Amount of pesticide per event (L or g) | ||||||
| Equipment | Type (e.g., power sprayer) | |||||
| Energy consumption | ||||||
| Weeding | Type of herbicide used & annual frequency | |||||
| Amount of herbicide per event (L) | ||||||
| Equipment | Type (e.g., power sprayer, mower) | |||||
| Energy consumption | ||||||
| Pruning | Annual frequency | |||||
| Amount of pruned branches per event (t) | ||||||
| Equipment | Type (e.g., chainsaw) | |||||
| Energy consumption | ||||||
| Disposal method of pruned branches | ||||||
| Transport | Seed or seedling | Type of Equipment | ||||
| Loadage per truck (trees/truck) | ||||||
| Transport distance | ||||||
| Agricultural material | Type of Equipment | |||||
| Loadage per truck (kg/truck) | ||||||
| Transport distance | ||||||
| Transplanting | Type of Equipment | |||||
| Energy consumption | ||||||
| Root digging andtree loading | Type of Equipment | |||||
| Number of trees that can be digged | ||||||
| Energy consumption per event | ||||||
References
- UN (United Nations). Paris Agreement; UN: New York, NY, USA, 2015. [Google Scholar]
- EU (European Union). The Action Plan of European Green Deal; EU: Brussels, Belgium, 2019. [Google Scholar]
- Cheongwadae. Long-Term Low Carbon Greenhouse Gas Emission Development Strategies; Cheongwadae: Seoul, Korea, 2020.
- Detwiler, R.; Hall, C. Tropical forests and the global carbon cycle. Science 1987, 239, 42–47. [Google Scholar] [CrossRef] [PubMed]
- Schneider, S.H. The changing climate. In Managing Planet Earth, 1st ed.; Freeman and Company: New York, NY, USA, 1990; pp. 25–36. [Google Scholar]
- IPCC (Intergovernmental Panel on Climate Change). Good Practice Guidance for Land Use, Land-Use Change and Forestry; IGES: Kanagawa, Japan, 2003. [Google Scholar]
- IPCC (Intergovernmental Panel on Climate Change). 2019 Refinement to the IPCC Guidelines for National Greenhouse Gas Inventories; IPCC: Geneve, Switzerland, 2019. [Google Scholar]
- Strohbach, M.W.; Arnold, E.; Haase, D. The carbon footprint of urban green space-A life cycle approach. Landsc. Urban Plan. 2012, 104, 220–229. [Google Scholar] [CrossRef]
- Aldentun, Y. Life cycle inventory of forest seedling production-from seed to regeneration site. J. Clean. Prod. 2002, 10, 47–55. [Google Scholar] [CrossRef]
- CORRIM Inc. Phase I Research Report on the Research Plan to Develop Environmental-Performance Measures for Renewable Building Materials with Alternatives for Improved Performance; CORRIM Inc.: Seattle, WA, USA, 2004. [Google Scholar]
- PE International. GaBi 4 Professional; PE International: Boston, CA, USA, 2009. [Google Scholar]
- National Renewable Energy Laboratory. Available online: http://www.nrel.gov/lci/database (accessed on 3 January 2021).
- Kendall, A.; McPherson, E.G. A life cycle greenhouse gas inventory of a tree production system. Int. J. Life Cycle Assess. 2012, 17, 444–452. [Google Scholar] [CrossRef]
- KFRI (Korea Forest Research Institute). The Seedling Production Technique of Major Forest Trees; KFRI: Seoul, Korea, 2009.
- KFRI (Korea Forest Research Institute). Technology and Management of Landscape Tree Production; KFRI: Seoul, Korea, 2009.
- Kim, J.J.; Lee, S.W.; Jo, M.S. Open-Field and Container Tree Production. In Theory of Landscape Tree Production, 5th ed.; Ahn, B.W., Ed.; Munundang: Seoul, Korea, 2019; pp. 107–153. [Google Scholar]
- Gong, Y.; Song, D. Life cycle building carbon emissions assessment and driving factors decomposition analysis based on LMDI—A case study of Wuhan city in China. Sustainability 2015, 7, 16670–16686. [Google Scholar] [CrossRef] [Green Version]
- Aktas, C.B.; Bilec, M.M. Impact of lifetime on US residential building LCA results. Int. J. Life Cycle Assess. 2012, 17, 337–349. [Google Scholar] [CrossRef] [Green Version]
- Onat, N.C.; Kucukvar, M.; Tatari, O. Scope-based carbon footprint analysis of U.S. residential and commercial buildings: An input-output hybrid life cycle assessment approach. Build. Environ. 2014, 72, 53–62. [Google Scholar] [CrossRef]
- Zhang, J.; Cheng, J.C.P.; Lo, I.M.C. Life cycle carbon footprint measurement of Portland cement and ready mix concrete for a city with local scarcity of resources like Hong Kong. Int. J. Life Cycle Assess. 2014, 19, 745–757. [Google Scholar] [CrossRef]
- Tonini, D.; Schrijvers, D.; Nessi, S.; Gutierrez, P.G.; Giuntoli, J. Carbon footprint of plastic from biomass and recycled feedstock: Methodological insights. Int. J. Life Cycle Assess. 2021, 26, 221–237. [Google Scholar] [CrossRef]
- Sambito, M.; Freni, G. LCA methodology for the quantification of the carbon footprint of the integrated urban water system. Water 2017, 9, 395. [Google Scholar] [CrossRef] [Green Version]
- Diacono, M.; Persiani, A.; Testani, E.; Montemurro, F.; Ciaccia, C. Recycling agricultural wastes and by-products in organic farming: Biofertilizer production, yield performance and carbon footprint analysis. Sustainability 2019, 11, 3824. [Google Scholar] [CrossRef] [Green Version]
- Korea Landscaping Tree Association. Available online: https://klta.or.kr:6016 (accessed on 5 January 2021).
- ME (Ministry of Environment). 2020 National Greenhouse Gas Inventory Report of Korea; ME: Sejong, Korea, 2020.
- KEP (Korea Environment Corporation). Guidelines for Local Government Greenhouse Gas Inventories; KEP: Incheon, Korea, 2016. [Google Scholar]
- Pitt, G.D. Conservation of Embodied Energy through Landscape Design. In Energy-Conserving Site Design, 1st ed.; McPherson, E.G., Ed.; ASLA: Washington, DC, USA, 2015; pp. 215–229. [Google Scholar]
- Lee, J.S.; Kim, K.Y.; Jeong, H.C.; Choi, E.J.; Lee, S.Y.; Heo, J.H.; Jeong, S.C. Estimation of Carbon Emission Coefficients for Fertilizer in Korea. In Proceedings of the 2018 KSCC International Conference, Jeju, Korea, 18 June 2018; KSCC: Seoul, Korea, 2018; p. 90. [Google Scholar]
- NAS (National Institute of Agricultural Sciences). Assessment of Carbon Basic Unit and DB Development with Agro-Material; NAS: Wanju, Korea, 2017.
- Lee, J.S.; National Institute of Agricultural Sciences, Wanju, Jeollabuk-do, Korea. Personal communication, 2020.
- Lal, R. Carbon emission from farm operations. Environ. Int. 2004, 30, 981–990. [Google Scholar] [CrossRef]
- Jo, H.K.; Park, H.M. Changes in growth rate and carbon sequestration by age of landscape trees. J. Korean Inst. Landsc. Archit. 2017, 45, 97–104. [Google Scholar]
- Jo, H.K.; Kim, J.Y.; Park, H.M. Carbon reduction effects of urban landscape trees and development of quantitative models: For five native species. J. Korean Inst. Landsc. Archit. 2014, 42, 13–21. [Google Scholar] [CrossRef] [Green Version]
- Jo, H.K.; Cho, D.H. Annual CO2 uptake by urban popular landscape tree species. J. Korean Inst. Landsc. Archit. 1998, 26, 38–53. [Google Scholar]
- Jo, H.K.; Ahn, T.W. Carbon storage and uptake by deciduous tree species for urban landscape. J. Korean Inst. Landsc. Archit. 2012, 40, 160–168. [Google Scholar] [CrossRef] [Green Version]
- Jo, H.K.; Ahn, T.W. Annual CO2 uptake and atmospheric purification by urban coniferous trees: For Pinus densiflora and Pinus koraiensis. Korean J. Environ. Ecol. 2001, 15, 118–124. [Google Scholar]
- Jo, H.K.; Kim, J.Y.; Park, H.M. Carbon storage and uptake by evergreen trees for urban landscape for Pinus densiflora and Pinus koraiensis. Korean J. Environ. Ecol. 2013, 27, 571–578. [Google Scholar] [CrossRef]
- Jo, H.K. Development of Model and Technology for Establishment, Management and Evaluation of Urban Forests in Living Zone to Improve Carbon Sequestration Sources and Multi-dimensional Benefits Against New Climate Change Regime; Korea Forest Service: Daejeon, Korea, 2020.
- Okcheon-Gun. Available online: https://www.oc.go.kr/tree/index.do (accessed on 13 November 2020).
- Balder, H.; Ehlebracht, K.; Mahler, E. Street Trees: Planning, Planting, Cultivating, 1st ed.; Patzer: Berlin, Germany, 1997. [Google Scholar]
- Park, H.M. Ecological Design and Construction Strategies through Life Cycle Assessment of Carbon Budget by Land Cover Types in Urban Parks. Ph.D. Thesis, Kangwon National University, Chuncheon, Korea, February 2021. [Google Scholar]
Figure 1.
Systematic study flowchart.

Figure 2.
Overview of landscape tree production process.

Figure 3.
Location of study nurseries and example images of their operations.

Figure 4.
Percentage of carbon emissions by life cycle of landscape tree production.

Figure 5.
Percentage of carbon emissions by each stage of landscape tree production.

Table 1.
Field survey inventory used to quantify the carbon footprint for landscape tree production in study nurseries.
Table 1.
Field survey inventory used to quantify the carbon footprint for landscape tree production in study nurseries.
| Component | Field Survey Inventory |
|---|---|
| Tree production practices |
|
| Soil preparation and transplanting |
|
| Management (irrigation, fertilization, pest control, weeding, and pruning) |
|
| Transport |
|
| Root digging and tree loading |
|
Table 2.
Carbon emission coefficients used to estimate the carbon footprint of landscape trees.
| Component | Carbon Emission Coefficients (kg/C/kg) | Reference |
|---|---|---|
| Irrigation | 0.024 | Pitt, 1984 |
| Fertilizer | 0.221 | Lee et al., 2018 |
| Compost | 0.058 | NAS, 2017; Lee, 2020 |
| Pesticide | 3.79 | Pitt,1984; Lal, 2004 |
| Fungicide | 3.38 | Pitt,1984; Lal, 2004 |
| Herbicide | 5.29 | NAS, 2017; Lee, 2020 |
Table 3.
Quantitative model sources used to estimate carbon uptake of landscape trees.
| Species | DBH Range (cm) 1 | Reference |
|---|---|---|
| Chionanthus retusus | 3–11 | Jo et al., 2014 |
| Ginkgo biloba | 6–31 | Jo and Cho, 1998 |
| “ | 5–25 | Jo and Ahn, 2012 |
| Pinus densiflora | 5–29 | Jo and Ahn, 2001; Jo et al., 2013 |
| Prunus yedoensis | 5–23 | Jo and Ahn, 2012 |
| Zelkova serrata | 6–34 | Jo and Cho, 1998 |
| ” | 5–28 | Jo and Ahn, 2012 |
| General hardwoods | 3–28 | Jo, 2020 |
| General softwoods | 5–31 | Jo, 2020 |
1 Stem diameter at breast height (the same with subsequent tables and figures).
Table 4.
Landscape tree production practices of study nurseries.
| Nursery | Location | Career (Year) | Production Tree | Production Types | |||
|---|---|---|---|---|---|---|---|
| Province | City | Seedling | Mature Tree | Open Field | Container | ||
| 1 | Gangwon | Goseong | 19 | ◯ | ◯ | ◯ | |
| 2 | Yeongwol | 30 | ◯ | ◯ | |||
| 3 | Wonju | 8 | ◯ | ◯ | |||
| 4 | Chuncheon | 10 | ◯ | ◯ | |||
| 5 | Hongcheon | 30 | ◯ | ◯ | |||
| 6 | Gyeonggi | Dongducheon | 30 | ◯ | ◯ | ◯ | |
| 7 | Yeoju | 20 | ◯ | ◯ | |||
| 8 | Pocheon | 11 | ◯ | ◯ | |||
| 9 | 30 | ◯ | ◯ | ◯ | |||
| 10 | 19 | ◯ | ◯ | ||||
| 11 | Gyeongsang | Sacheon | 40 | ◯ | ◯ | ||
| 12 | 20 | ◯ | ◯ | ||||
| 13 | 25 | ◯ | ◯ | ◯ | |||
| 14 | Andong | 10 | ◯ | ◯ | ◯ | ||
| 15 | Bonghwa | 25 | ◯ | ◯ | ◯ | ◯ | |
| 16 | Hamyang | 20 | ◯ | ◯ | ◯ | ||
| 17 | Gyeongsan | 24 | ◯ | ◯ | |||
| 18 | Daejeon | 30 | ◯ | ◯ | ◯ | ◯ | |
| 19 | 30 | ◯ | ◯ | ||||
| 20 | 25 | ◯ | ◯ | ◯ | |||
| 21 | Sejong | 24 | ◯ | ◯ | ◯ | ◯ | |
| 22 | Jeolla | Gangjin | 8 | ◯ | ◯ | ||
| 23 | Jeonju | 30 | ◯ | ◯ | |||
| 24 | 35 | ◯ | ◯ | ||||
| 25 | 32 | ◯ | ◯ | ||||
| 26 | 27 | ◯ | ◯ | ||||
| 27 | Imsil and Jinan | 35 | ◯ | ◯ | ◯ | ||
| 28 | Chungcheong | Gongju | 40 | ◯ | ◯ | ◯ | ◯ |
| 29 | 45 | ◯ | ◯ | ◯ | |||
| 30 | Nonsan | 27 | ◯ | ◯ | ◯ | ||
| 31 | Okcheon | 30 | ◯ | ◯ | ◯ | ||
| 32 | 8 | ◯ | ◯ | ◯ | |||
| 33 | 21 | ◯ | ◯ | ◯ | |||
| 34 | 25 | ◯ | ◯ | ◯ | |||
| 35 | Chungju | 30 | ◯ | ◯ | ◯ | ||
Table 5.
Energy consumption per tree of sowing and seedling production 1.
| Soil Preparation | Irrigation (L) | Fertilization (g) | Pest Control | Weeding | Transport 2 (D, mL) | |||||
|---|---|---|---|---|---|---|---|---|---|---|
| G (mL) | D (mL) | Compost (g) | Pesticide (mL) | Fungicide (g) | Power Sprayer | Herbicide (mL) | Power Sprayer (G, mL) | |||
| (G, mL) | ||||||||||
| 0.08 ± 0.01 | 0.46 ± 0.07 | 54.5 ± 5.4 | 5.7 ± 0.5 | 10.3 ± 1.7 | 0.04 ± 0.00 | 0.05 ± 0.01 | 0.4 ± 0.1 | 0.06 ± 0.02 | 0.4 ± 0.1 | 0.5 ± 0.1 |
1 G: gasoline; D: diesel. 2 Diesel consumption in the transport of agricultural materials.
Table 6.
Carbon emissions per tree of sowing and seedling production (g/tree).
| Soil Preparation | Irrigation | Fertilization | Pest Control | Weeding | Transport 1 | Total | |||
|---|---|---|---|---|---|---|---|---|---|
| Pesticide | Fungicide | Power Sprayer | Herbicide | Power Sprayer | |||||
| 3.74 ± 0.37 | 137.52 ± 12.63 | 2.27 ± 0.37 | 0.14 ± 0.02 | 0.15 ± 0.03 | 0.21 ± 0.04 | 0.31 ± 0.08 | 0.21 ± 0.07 | 0.34 ± 0.03 | 144.89 ± 13.25 |
1 Carbon emissions in the transport of agricultural materials.
Table 7.
Energy consumption per tree of transplanting and mature tree production 1.
| DBH | Soil Preparation | Irrigation (L) | Fertilization (g) | Pest Control | Weeding | Transport 2 (D, mL) | |||||
|---|---|---|---|---|---|---|---|---|---|---|---|
| D (mL) | Compost (g) | Pesticide (mL) | Fungicide (g) | Power Sprayer | Herbicide (mL) | Power Sprayer | Mower | ||||
| (G, mL) | (G, mL) | ||||||||||
| 7 | 26.57 ± 1.66 | 2.45 ± 0.58 | 31.98 ± 4.12 | 1.60 ± 0.33 | 14.29 ± 3.52 | 7.28 ± 1.85 | 22.09 ± 4.43 | 8.42 ± 1.92 | 18.45 ± 5.35 | 49.13 ± 6.39 | 37.65 ± 2.97 |
| 10 | 26.57 ± 1.66 | 2.45 ± 0.58 | 34.70 ± 5.10 | 2.52 ± 0.59 | 19.79 ± 4.89 | 10.01 ± 2.51 | 31.73 ± 6.61 | 11.50 ± 2.65 | 20.11 ± 4.04 | 66.08 ± 9.43 | 42.26 ± 3.31 |
| 13 | 26.57 ± 1.66 | 2.45 ± 0.58 | 39.85 ± 7.92 | 3.89 ± 0.83 | 27.78 ± 6.94 | 13.93 ± 3.52 | 46.01 ± 9.66 | 16.87 ± 3.88 | 30.63 ± 6.63 | 96.66 ± 13.94 | 48.87 ± 4.00 |
1 G: gasoline; D: diesel. 2 Diesel consumption in the transport of agricultural materials.
Table 8.
Carbon emissions per tree of transplanting and mature tree production (kg/tree).
| DBH (cm) | Soil Preparation | Irrigation | Fertilization | Pest Control | Weeding | Transport 1 | Total | ||||
|---|---|---|---|---|---|---|---|---|---|---|---|
| Pesticide | Fungicide | Power Sprayer | Herbicide | Power Sprayer | Mower | ||||||
| 7 | 0.16 ± 0.03 | 0.77 ± 0.10 | 0.35 ± 0.07 | 0.05 ± 0.01 | 0.02 ± 0.01 | 0.01 ± 0.00 | 0.04 ± 0.01 | 0.01 ± 0.00 | 0.03 ± 0.00 | 0.03 ± 0.00 | 1.49 ± 0.13 |
| 10 | 0.16 ± 0.03 | 0.83 ± 0.12 | 0.56 ± 0.13 | 0.07 ± 0.02 | 0.03 ± 0.01 | 0.02 ± 0.00 | 0.06 ± 0.01 | 0.01 ± 0.00 | 0.04 ± 0.01 | 0.03 ± 0.00 | 1.82 ± 0.19 |
| 13 | 0.16 ± 0.03 | 0.96 ± 0.19 | 0.86 ± 0.18 | 0.11 ± 0.03 | 0.05 ± 0.01 | 0.03 ± 0.01 | 0.09 ± 0.02 | 0.02 ± 0.00 | 0.06 ± 0.01 | 0.04 ± 0.00 | 2.36 ± 0.27 |
1 Carbon emissions in the transport of agricultural materials.
Table 9.
Total carbon emissions per tree of landscape tree production (kg/tree).
| DBH (cm) | Sowing and Seedling Production | Transport of Seedlings | Transplanting and Mature Tree Production | Root Digging and Tree Loading | Total |
|---|---|---|---|---|---|
| 7 | 0.1 ± 0.01 | 0.01 ± 0.00 | 1.5 ± 0.1 | - | 1.6 |
| 10 | 0.1 ± 0.01 | 0.01 ± 0.00 | 1.8 ± 0.2 | 0.6 | 2.5 |
| 13 | 0.1 ± 0.01 | 0.01 ± 0.00 | 2.4 ± 0.3 | 0.8 | 3.3 |
Publisher’s Note: MDPI stays neutral with regard to jurisdictional claims in published maps and institutional affiliations. |
© 2021 by the authors. Licensee MDPI, Basel, Switzerland. This article is an open access article distributed under the terms and conditions of the Creative Commons Attribution (CC BY) license (https://creativecommons.org/licenses/by/4.0/).
Share and Cite
MDPI and ACS Style
Park, H.-M.; Jo, H.-K.; Kim, J.-Y. Carbon Footprint of Landscape Tree Production in Korea. Sustainability 2021, 13, 5915. https://0-doi-org.brum.beds.ac.uk/10.3390/su13115915
AMA Style
Park H-M, Jo H-K, Kim J-Y. Carbon Footprint of Landscape Tree Production in Korea. Sustainability. 2021; 13(11):5915. https://0-doi-org.brum.beds.ac.uk/10.3390/su13115915
Chicago/Turabian StylePark, Hye-Mi, Hyun-Kil Jo, and Jin-Young Kim. 2021. "Carbon Footprint of Landscape Tree Production in Korea" Sustainability 13, no. 11: 5915. https://0-doi-org.brum.beds.ac.uk/10.3390/su13115915
Note that from the first issue of 2016, this journal uses article numbers instead of page numbers. See further details here.