Article

Risk Management in the Import/Export Process of an Automobile Company: A Contribution for Supply Chain Sustainability

by
Gabriela Costa Dias
1,
Ualison Rébula de Oliveira
1,2,
Gilson Brito Alves Lima
2 and
Vicente Aprigliano Fernandes
3,*
1
MPA-PPGA, Universidade Federal Fluminense (UFF), Volta Redonda 27213-145, Brazil
2
MSG-LATEC, Universidade Federal Fluminense (UFF), Niterói 24210-240, Brazil
3
Instituto de Geografía, Pontificia Universidad Católica de Valparaíso, Valparaíso 2362807, Chile
*
Author to whom correspondence should be addressed.
Sustainability 2021, 13(11), 6049; https://0-doi-org.brum.beds.ac.uk/10.3390/su13116049
Submission received: 23 March 2021 / Revised: 19 May 2021 / Accepted: 24 May 2021 / Published: 27 May 2021
(This article belongs to the Special Issue Risk Management as a Tool for Sustainability)

Abstract

:
Supply chain risk management (SCRM) is imperative to achieve business sustainability in the long-term perspective and also to increase companies’ competitiveness. ISO 31000—Risk Management explains in its latest versions the need for companies to integrate a risk management process into their business models. Complementary to this standard, ISO 31010 presents 31 risk tools to guide companies in this task. However, a question of practical application arises as to which tools should be used for each stage of the SCRM process. In view of the raised question, the main objective of this research is to select ISO 31010 tools that can be used in each of the stages (identify, analyze, and evaluate) of the risk management of the import and export process of an automotive industry located in Brazil. For this, the analytic hierarchy process (AHP method) was used in a case study to prioritize the tools to compose the SCRM. As practical implications, this study resulted in the suggestion of a structured risk management process, considering the assessment of key professionals of the department studied in the company.

1. Introduction

Supply chain risks can generate huge losses for companies. Factors such as increasingly spatially dispersed supply chains, increasing interdependence between companies, shorter life cycles of ever-smaller products, and strategies such as Lean Six Sigma and Just in Time, are examples that have increased the exposure of chains to risk [1,2]. Given the relevance of the theme, the concept of supply chain risk management (SCRM) has emerged from the intersection between risk management and supply chain management [3]. Moreover, the SCRM comes to contribute to business sustainability, by increasing the probability of projects achieving their strategic goals and also enabling a shift from the short- and medium-term perspective to a long-term perspective regarding business strategy. It is a relatively new subject, and according to Pfohl et al. [4], its scope is broader than the traditional risk management process.
A reflection of this relative novelty of SCRM is the lack of consensus among researchers about its stages. For example, Wu, Blackhurst & Chidambaram [5], Khan & Burnes [6], and Singhal, Agarwal & Mittal [7] argue that SCRM should be carried out in at least three stages, which differ in their procedures from author to author. Other authors [8,9,10] advocate different procedures, with more than three stages. Ritchie & Brindley [11] favor seven stages for SCRM. Because of these variances, De Oliveira et al. [12] and Santos & De Oliveira [13] propose ISO 31000 as a systematic procedure for SCRM. Santos et al. [14] in turn, propose the techniques presented by ISO 31010 as tools for the execution of this process.
ISO 31010 (Risk Management—Risk Assessment Techniques) was created to complement ISO 31000 and presents 31 tools to help professionals to structure their risk management processes. The document presents and classifies the tools as applicable or not to each stage of management. However, with such a wide range of tools, a question of practical application arises: for the import and export process of an automotive industry, located in Brazil, which of the tools presented by ISO 31010, in the view of specialists who work in this process, are the more appropriate in identifying risks, analyze their consequences and probabilities and, finally, evaluate them?
In view of the question presented, our main objective is to select ISO 31010 tools that can be used in each of the risk management stages (identifying, analyzing, and evaluating) of the import and export process of an automotive industry located in Brazil. This general objective is aligned with other recent researches, for example [15,16,17] and others.
In order for the aforementioned general objective to be achieved, the research will carry out a unique case study in the import and export process of an automotive industry, whereby seven specialists with extensive professional experience, who work in this process, will be interviewed by means of a structured questionnaire, previously organized so that the collected data can later be used as input data in the AHP method, for establishing the hierarchy of the ISO 31010 tools most suitable for identification, analysis, and assessment of risks. More details of the method will be provided in Section 3 (Materials and Methods).
The automobile company mentioned is the Brazilian subsidiary of a multinational group. Within the company, the Alliance Customs & Trade (ACT) department was chosen as a key department in the company’s strategy. The department is responsible for importing productive inputs and exporting finished products. In other words, it is simultaneously in one of the initial links and in one of the final links in the company’s supply chain: at the entrance of the imported productive inputs (which, after a study by the costs team, was found to account for about 53% of the cost of the vehicle); and at the exit of the finished product, ensuring that the product reaches the final consumer (in this case, the importer).
This is a relevant research for at least four reasons: (i) research on SCRM applied in the automotive industry is relatively scarce; (ii) research on the application of risk management tools in automotive industry import and export processes is non-existent—unless mistaken, no article on this topic was published in journals listed in the Web of Science database; (iii) risk management processes have the potential to improve the sustainability of supply chains; and (iv) the import process of the target company of this study works with inputs that are responsible for more than 50% of the final cost of a produced vehicle. Except for the last justification, which is related to the empirical study, the other justifications will be addressed in literature review section.

2. Literature Review

2.1. Sustainability and Supply Chain Risk Management

SCRM is highly focused on reducing the chances of disruption of a supply chain, in its different stages, in the face of the diversity of risks/threats [18]. However, there is an increase in the sustainable commitment of different types of companies that operate at the global and regional scale—leading to several kinds of research and actions involving various companies and stages within the supply chain related to social and environmental benefits [19,20]. Moreover, studies highlight that the sustainability of a supply chain is sensitive to its resilience level [18]. Nowadays, it is unavoidable to relate corporate image with sustainability values and performance. With the increasing implementation of outsourced services and stages within supply chains, the capacity of a company to contribute to the sustainability and resilience of a supply chain has become crucial for its prosperity and longevity in the current global market context [21].
Besides the pressure between business partners to reduce risks and increase sustainability in the supply chain, consumers are more aware and concerned with products’ social and environmental impacts [21]. A good risk management process should improve the sustainability of supply chains because it can reduce accidents that can have adverse effects on workers’ health (depending on the sector) or even reduce the loss of financial resources [22], which sustains companies and jobs. For example, Alikhani et al. [23] bring evidence that risk assessment is important to identify sustainable suppliers, not necessarily those with the best performance. This type of action may contribute to the sustainability of supply chains [23].
Different approaches to SCRM involve dealing with risk analysis to support sustainable supply chains. For example, there can be a measurement of specific indicators under a quantitative and/or qualitative perspective to evaluate a supply chain’s social, environmental, and economic performance [24,25]. Risk analysis may also undertake a qualitative approach with semi-structured interviews with managers of the supply chain [23]. A more recent research and practical approach has involved dealing with smart logistics ecological chains (SLECs), considering a risk management process that involves implementing advanced technological features related, for example, to automated risk control processes and data sharing [26]. Under another approach, Hallikas et al. [27] offer an understanding of the contribution of an adequate purchasing and supply management practice to ensure the sustainability of supply chains.

2.2. Supply Chain Risk Management and ISO 31000

SCRM originated from supply chain management (SCM) and has been gradually gaining importance [3,12], mainly due to the need to develop skills to adapt to changing environments and because supply chains operate within conflicting aspects in a global business environment [28]. Supply chains are exposed to a wide variety of risks [29], where insufficient resistance or a lack of focus on managing risks in highly complex environments can erode companies’ competitiveness [30].
Regarding the relevance of the theme, Xia & Chen [31] consider that SCRM has a strong influence on establishing cooperation between partners and on the performance of the chain as a whole. Scannell, Curkovic & Wagner [32] argue that a risk-oriented chain establishes a competitive position and long-term benefits for its stakeholders. Ritchie & Brindley [11] highlight reasons for the increasing interest in the subject: chain-related strategies and structures evolve very fast, thus there is frequent change in formats in search of competitive advantage, as well as technological changes that, despite bringing benefits, pose a threat to the established supply chain.
Mogre, Talluri & D’Amico [33] point out that the literature advocates the introduction of a structured risk management process to help companies assess supply chain risks and identify appropriate mitigation actions. Kamalahmadi & Parast [34] consider that SCRM involves the identification of potential sources of risk followed by the implementation of appropriate strategies, through a coordinated approach between members of the chain, to reduce its vulnerability. Lavastre, Gunasekaran & Spalanzani [35], in turn, argue that SCRM implies assessment, in strategic and operational horizons, in the short and long term, of risks that can affect information and material and financial flows in order to decrease their adverse effects.
Furthermore, Trkman & Mccormack [29] state that the goals of SCRM are to identify, evaluate, analyze, and treat vulnerability and risk in supply chains. In that sense, Ledwoch et al. [36] state that this interaction with each link is necessary in order to strengthen the entire system and analyze the performance and needs of the weakest link in order to improve it. They also indicate that this assumption brings to the fore considerations about the best strategy (direct mitigation or contingency) and where that strategy should be applied to improve the system’s performance in general.
The objective can also be to identify potential sources of risk in the chain and implement appropriate actions to avoid or contain the chain’s vulnerability. Mentzer & Manuj [37] state that in global chains the aims should be to reduce losses, the probability or speed of adverse events, the time for detection of these events, and the frequency and exposure to them. Kleindorfer & Saad [9] in turn, contribute to the field by defining 17 principles, as follows, representing an evolution in terms of the recognition of its importance:
(1)
The focus of risk management is on the company’s border areas in the supply chain.
(2)
The company has a deep knowledge of the interfaces in its chain.
(3)
Supply chain management and SCRM are seen as integrated and not independent of each other.
(4)
Internal SCRM is coordinated and integrated.
(5)
SCRM is part of the corporate strategy.
(6)
Managers and executives support and are responsible for SCRM.
(7)
All members of the chain have a mutual understanding of potential risks.
(8)
Information about risks in the chain is available to the entire company.
(9)
Companies within the chain have a cooperative, fair, and close relationship.
(10)
Companies within the chain have strong mutual trust.
(11)
Asymmetries between companies do not exist.
(12)
Companies have process planning and mutual goals for the chain.
(13)
Risk information is shared within the chain.
(14)
Direct partners within the chain cooperate with each other regarding risk management.
(15)
Risks and rewards are shared within the chain.
(16)
All members are involved in the chain’s risk management activities.
(17)
All members of the chain aim for the same goals regarding the supply chain.
With regards to the SCRM steps, Hallikas et al. [8], Faisal et al. [38], and Tuncel and Alpan [39] argue that a typical risk management process is composed of risk identification, risk evaluation; the decision and implementation of risk management actions; and risk monitoring. Despite that, Fan et al. [40] and De Oliveira et al. [12] state there is no consensus in the literature on how many and which phases should be considered in the SCRM process. Due to this, De Oliveira et al. [12] propose ISO 31000 as a systematic procedure for SCRM.
It is possible to observe previous studies that evaluate the influence of the ISO 31000 standard on supply chain risk management, such as Olechowski et al. [41], Ernawati et al. [42], and Lalonde and Boiral [43]. Olechowski et al. [41] focused on understanding the effectiveness of the ISO 31000 principles within the engineering industry, undertaking a large-scale survey across seven companies/organizations directed to engineering practitioners. Ernawati et al. [42] applied the ISO 31000 principles to a design science research methodology (DSRM), which sought to assess risk management with data collected through focus groups, in which the researcher was an external observer and analyzed the data of a company in the information technology sector. In the case of Lalonde and Boiral [43], they focused on the state-of-the-art of ISO 31000 principles applied to the risk management process.

2.3. Supply Chain Risk Management in the Automotive Industry

The automotive industry is extremely competitive, wielding considerable power and influence over the members of its production chain. Despite their success, the relationships between the parties in the supply chains are complex and with a series of structural weaknesses that, when considered individually, represent significant risks and, when considered collectively, can be amplified several times [44]. For example, Thun and Hoenig [45] refer to a loss of millions of dollars that occurred with the German component supplier Robert Bosch, which delivered defective high-pressure pumps for diesel injection systems to its customers in early 2005. This error was caused by a Bosch sub-supplier, compromising the entire supply chain. This example is in line with what was observed by Bloss [3], who identified significant risks in the automotive industry that could severely interrupt the operations of the entire supply chain or even end these operations for a long period of time.
There are several reasons for the high vulnerability of automotive supply chains, in a globalization context [45], such as: the need to offer many product variants and approaches to build an increasingly leaner chain; intensification of the outsourcing process; and the reduction of suppliers and cost reduction. Besides these and other reasons and risks, the situation is aggravated by managers’ lack of knowledge on how to manage these risks, as observed by Bloss [3], who stated that only 9% of those who participated in his research had a high knowledge about issues related to the SCRM, whereas 91% had no knowledge or only superficial knowledge. Perhaps this high percentage (91%) is related to the few empirical studies on SCRM in this industry [46], of which almost half were published only about a year ago, as summarized in Table 1.
Regarding the automotive chain suppliers, Singh et al. [44] noted that the smallest and most “distant” face risks that are disproportionately greater and occur in many different forms. Vanalle et al. [51] also proved that the perceived risks in layer two are higher than those observed in layer one. In addition, they found that the performance of companies in layer two (higher risk) is lower than that of companies in layer one, providing important contexts for decision making in day-to-day business in the automotive sector. Still, as regards risk levels, Junaid et al. [52] noted that forecasting errors, failures in supplier communication, supplier quality problems, and delivery delays by suppliers are the most vulnerable risks in automotive supply chains in Pakistan, with delivery delays being the most damaging for the analyzed automotive chain.
In reference to risks involving suppliers, Zhang et al. [49] observed in the supply chain of the Chinese automotive industry that both the vehicle manufacturer (automakers) and the vehicle distributors (dealerships) are affected by supplier interruptions; which makes perfect sense, since if an assembler has its production process impacted by problems at the supplier, in a domino effect this will result in the interruption of the delivery of finished products (auto-furniture) to concessionaires. However, it was also noted that dealerships are affected by the direct commercial contact between the supplier and the distributors in terms of spare automotive parts that will be used to service customers during after-sales services. In this manner, problems in the supply chain of an auto parts supplier can affect the dealership’s business doubly, one directly and the other indirectly.
On the sources of risk in the supply chain, although some classification structures are robust, such as the one developed by Rangel et al. [53], many others are extremely generic, which makes the adaptation of these classifications for each branch of activity/type of business an extremely important issue for an adequate risk analysis. In this regard, Junaid et al. [52], Mzougui et al. [50], Ceryno et al. [46], and Blos [3] raised the main types of risks in the automotive industry, as organized and presented in Table 2, below.
Regarding the actions and strategies adopted by the automotive industry for risk management in the supply chain, although managers agree that it is important to act and take risk into consideration in supply chain decisions, it is observed, in practice, that there is a lack of formal SCRM instruments across different levels of the supply chain [46]. This finding only reinforces similar results in the automotive industry raised before by other studies, such as Blos [3] and Thun and Hoenig [45], that is, that despite SCRM having become an extremely relevant topic for sustainability of business, practical applications of SCRM are still far from being widely implemented in this industry [46]. For this reason, as previously exposed in the introduction of this research, the next sections will be aimed at addressing tools for risk management in the supply chain of an automotive company, with the study being outlined for the import/export department of the target company.

3. Materials and Methods

To meet the general objective, that is, to select ISO 31010 tools that could be used to identify, analyze, and assess risks in the import and export process of an automotive industry, a unique case study was developed, where specialists who work in this process were interviewed. Allied to the case study, the AHP method (analytic hierarchy process) was used because it has a wide structure for multi-criteria decision making to determine priorities, using sets of paired comparisons, based on the intrinsic capacity that a human being has to structure their perceptions hierarchically when comparing two similar alternatives, with reference to a certain criterion, judging the degree of importance of one over the other [54].
As a data collection instrument, a questionnaire was prepared that asked respondents to make hierarchical comparisons, side by side, of the tools listed in ISO 31010, judging the degree of importance of one over the other. This data collection instrument was organized so that respondents could classify the degree of importance among different risk management tools. Table 3 presents all the risk tools/methods considered in ISO 31010 [55] and the classification of applicability for the stages of identification, analysis, and evaluation. It is important to highlight that to facilitate the use of the term tools/methods from the table, from here on, the use of the term “tools” may also be referring to methods because brainstorming, for example, could be considered a method.
The survey questionnaire considered all the risk tools listed in ISO 31010 and participants were asked to identify the risk tools they knew or had previously applied. Initial data on the respondents, such as time of professional experience, time in the company, education, etc., were also collected.
For the survey, seven employees of the company directly connected to the Alliance Customs & Trade (ACT) process were interviewed. These respondents were selected intentionally, based on their experience, knowledge, and interaction with the import/export process (see Table 4). The choice for this selection was to ensure that only key people in the process were interviewed. These interviewees had the following characteristics:
  • All interviewees had college degrees
  • 29% had master’s degrees
  • All interviewees had at least five years of professional experience
  • All interviewees have been in the company for at least two years
The questionnaire was prepared taking into account the recommendations of Saaty [56], as regards: (i) defining the problem based on the type of knowledge sought; (ii) structuring the hierarchy; (iii) building peer comparison matrices; and (iv) obtaining the global priority of the alternatives.
The intention was to raise tools to identify risks, analyze the consequences of risks, analyze the probability of risks, and assess them. The problem was divided into four questions: (a) Which tool is more suitable to identify risks in operations importation/exportation? (b) Which tool is best suited to analyze the consequences of risks in import/export operations? (c) Which tool is best suited to analyze the probability of risks in import/export operations? (d) Which tool is best suited to assess risks in import/export operations? For each of these questions, a hierarchical structure was developed based on the tools in the ISO 31010 (see Table 3), where peer comparison matrices were elaborated, as shown in Table 5.
In these matrices, respondents made paired comparisons based on an ordinal scale (see Table 6) known in the literature as the Saaty fundamental scale [57]. When making the comparisons, the respondent evaluated, in relation to the four questions elaborated in the previous step, how much more important the tool in the column on the left was in relation to the tool that appeared in the line at the top of the matrix.
After completing the questionnaires, in the presence of the researcher, a verification of the consistency of the responses was carried out, aiming to detect possible contradictions in the weight values attributed by the specialists. This action is supported by Ishizaka and Nemery [58] as, according to these authors, when several comparisons in pairs are considered successively, they can contradict each other. The responses were then entered into a comparison matrix and checked for consistency. The questionnaires that presented inconsistent results were separated and, through a perturbation matrix, respondents were shown where the inconsistencies occurred, so that they, occasionally, could reassess their judgments, as recommended by Saaty [59].
The perturbation matrix was elaborated according to Saaty [59], with the values obtained through Equation (1).
Ɛij = aij × (wj/wi)
where:
Ɛij = disturbance value in the wij cell of the matrix.
aij = weight value assigned in cell aij of the comparison matrix.
wj = value of the relative priority of element j, obtained by the comparison matrix.
wi = value of the relative priority of element i, obtained by the comparison matrix.
Table 7 and Table 8, below, exemplify this phase of the research method. Table 7 illustrates a comparison matrix. The inconsistent cell is highlighted with borders.
Table 8, in turn, illustrates a disturbance matrix, which indicates which judgment should be reviewed. The disturbance value that departs the most from 1 indicates the point where the specialist must review his judgment [59]. In the case of the example, the cell T2/Tn, which is 11.21.
After reviewing the judgment, the questionnaire was again submitted to the consistency test. If the result was less than 0.10—the standard defined by Saaty [
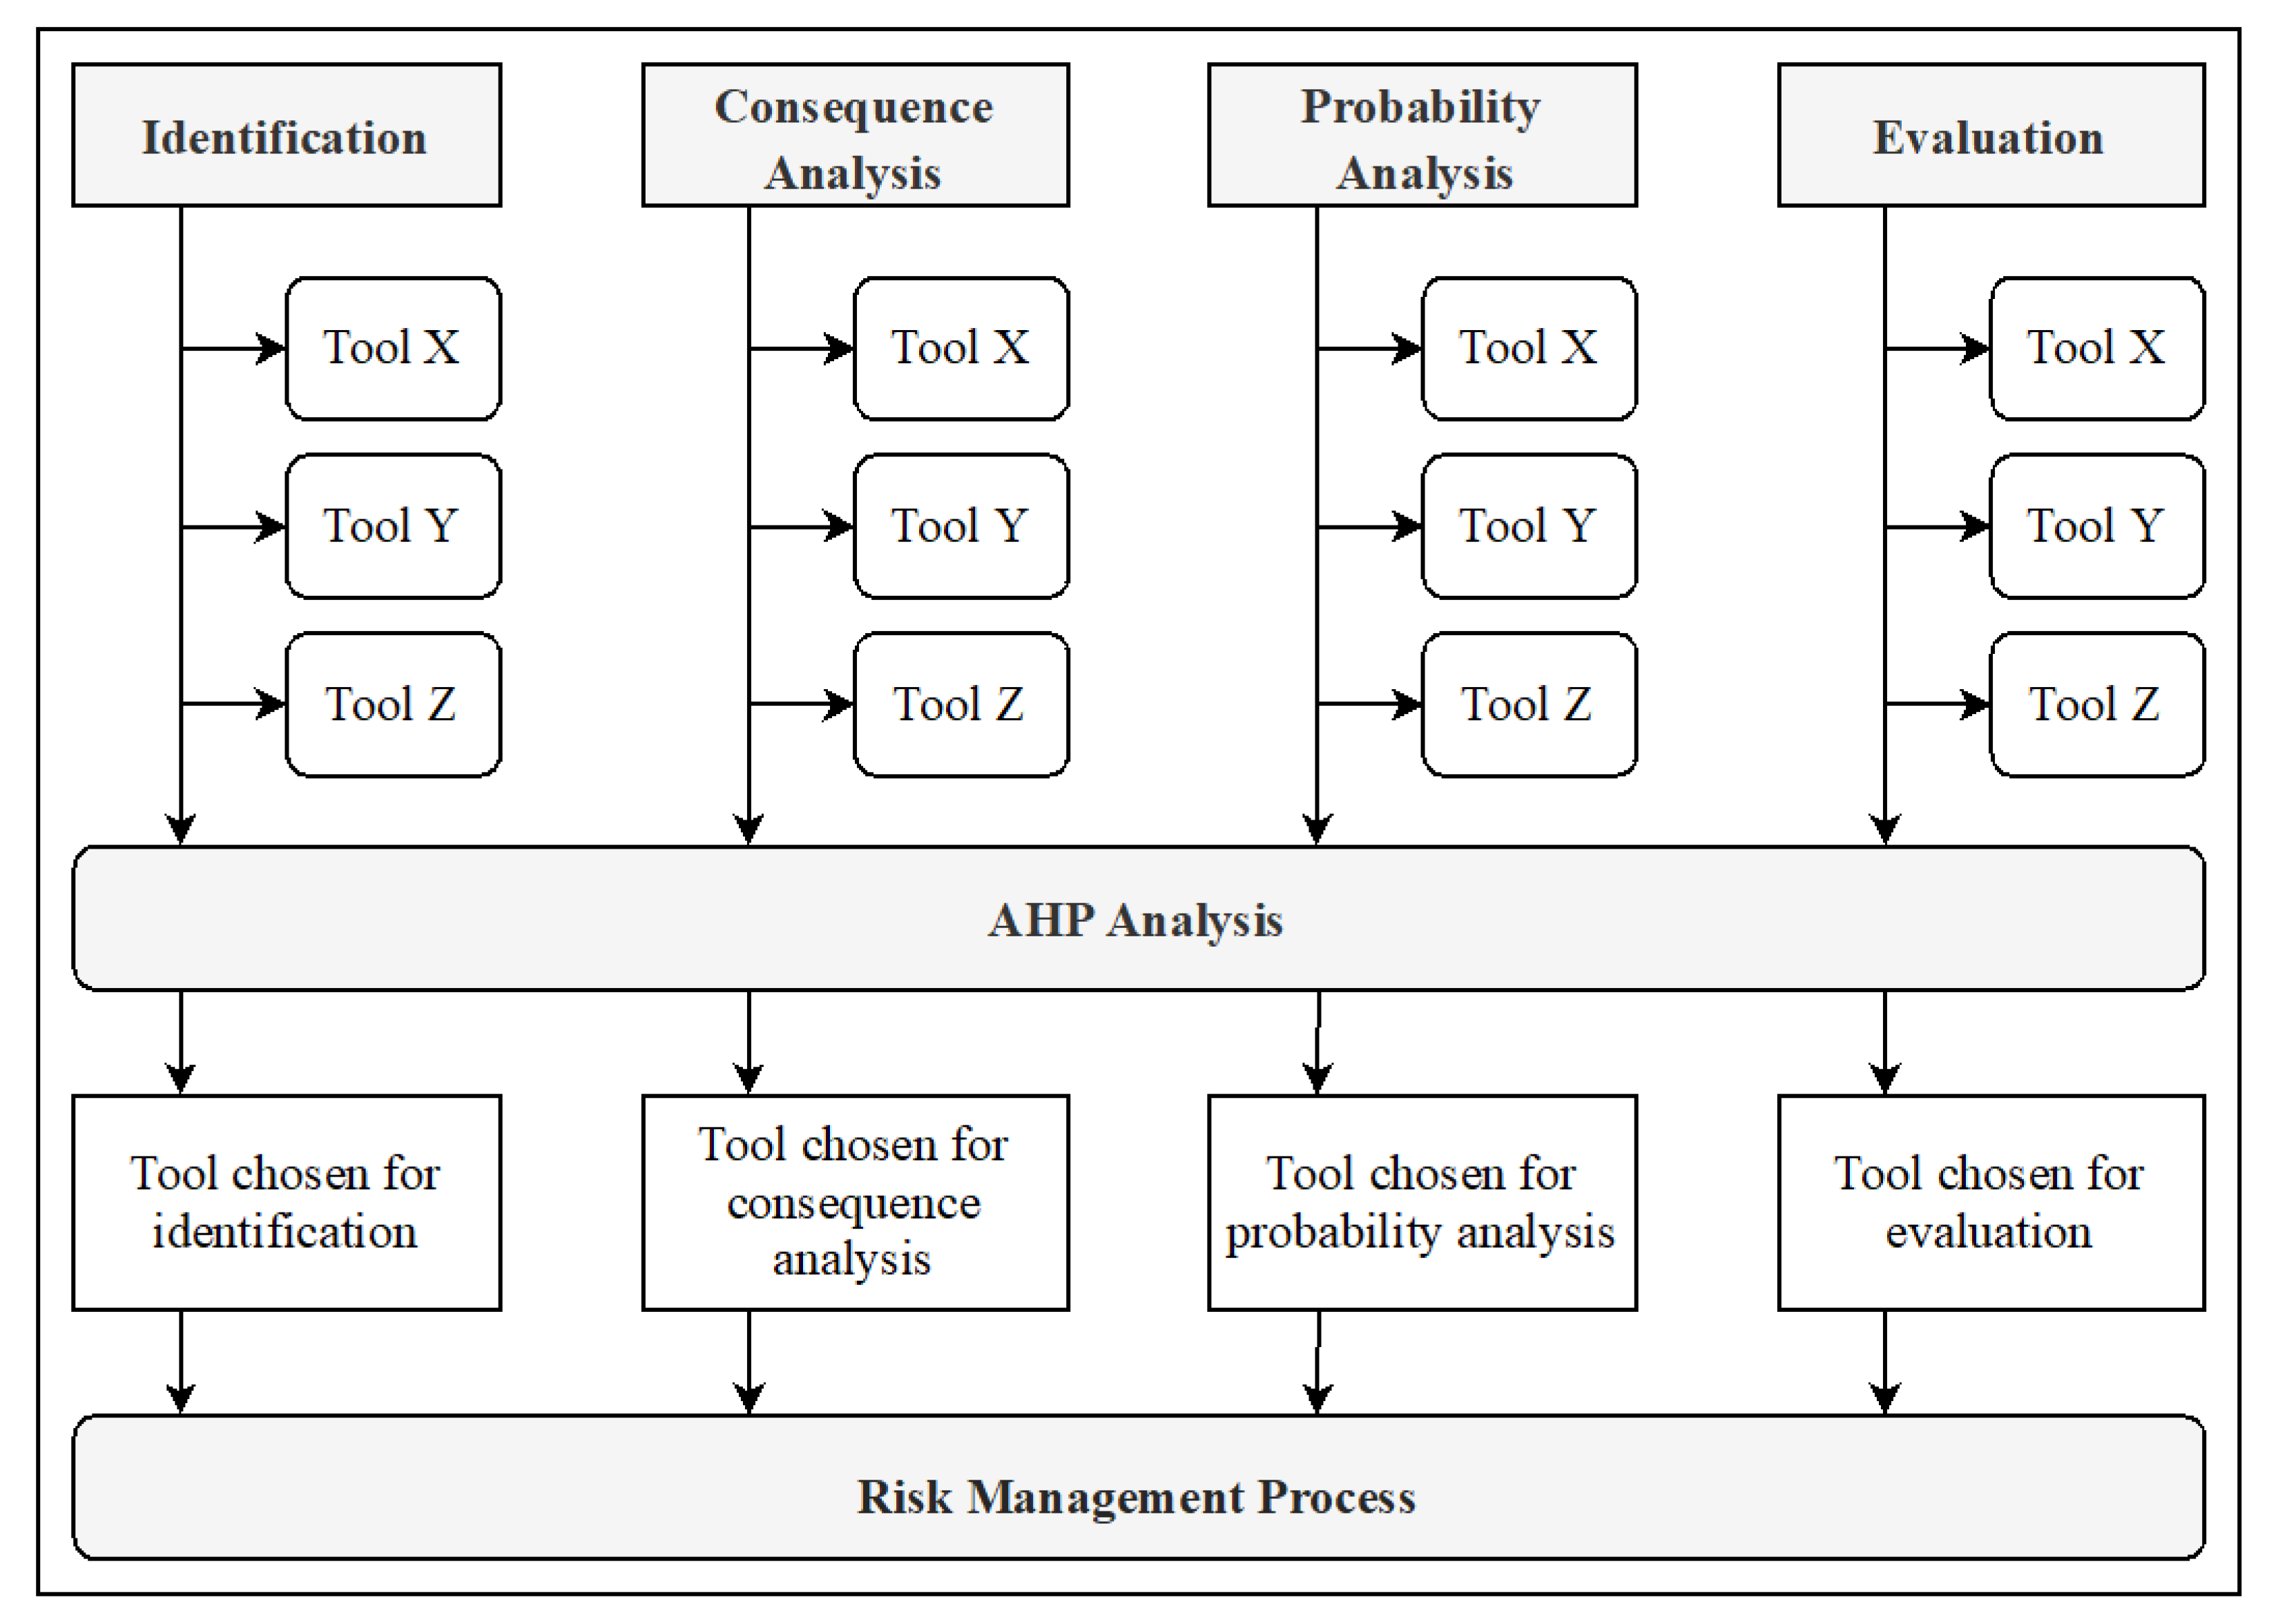
60]—the questionnaire was accepted; otherwise, it was again subjected to the disturbance matrix. Four AHP analyzes were performed, one for each stage of the risk management (risk identification, analysis of consequences, analysis of probability, and final assessment). Figure 1 ends this section, illustrating the construction of the research based on the AHP method.

4. Results and Discussion

Although seven people participated in the survey, this section only describes the results related to Interviewee 1 (hereinafter referred to as I1), in order to optimize the available space. The final tables in this section organize the results of the seven experts interviewed.

4.1. Parity Matrices

This topic presents I1′s parity matrices for the four steps: identification, consequence analysis, probability analysis, and evaluation. In Table 9, the interviewee evaluated which tool, in his opinion, stood out from the others due to its ability to identify, analyze, and evaluate risks. Each section in this table addresses one of the steps recommended by ISO 31010.

4.2. Consistency Test

The twenty-eight matrices (four for each of the seven specialists) were submitted to a consistency test and obtained a CR (consistency ratio) equal to or less than 0.10, as recommended by Saaty [56]. The participants were informed of the consistency criteria and received guidance and examples to rely on when judging their parity matrices. When a questionnaire showed inconsistency, the respondent was invited to review their responses (for more details, see Section 3). This ensured the minimum consistency required by the AHP method in all matrices (identification, consequence analysis, probability analysis, and evaluation), as shown in Table 10.

4.3. Aggregation of Individual Priorities

Considering all respondents with equal weight within the decision, the geometric means of the priorities for each step were calculated. Tools that at least one of the respondents was not aware of or had not applied in his/her professional experience were excluded from the means.
Therefore, the tools used had to meet the following requirements:
  • Be classified by ISO 31010 as strongly applicable;
  • Have been marked by respondents as known.
Table 11, Table 12, Table 13 and Table 14 show the geometric means for each ISO 31000 risk management step. The tools with “#” results are those that were excluded from the geometric mean because they were not scored by all seven respondents. Table 11 presents the geometric means of the risk identification step.
Table 12 presents the geometric means of the consequence analysis step.
Table 13 presents the geometric means of the probability analysis step.
Finally, Table 14 presents the geometric means of the evaluation step.
The fact that there were seven interviewees who were instructed to tick only the tools they knew or had already applied created a natural filter of the various tools proposed by ISO.
As can be seen in the previous Table 11, Table 12, Table 13 and Table 14, for the analysis and evaluation steps, the choice was between two options of tools. This shows that the group had a degree of homogeneity of knowledge regarding the tools.

4.4. Selected Tools for Risk Management in the Import/Export Process

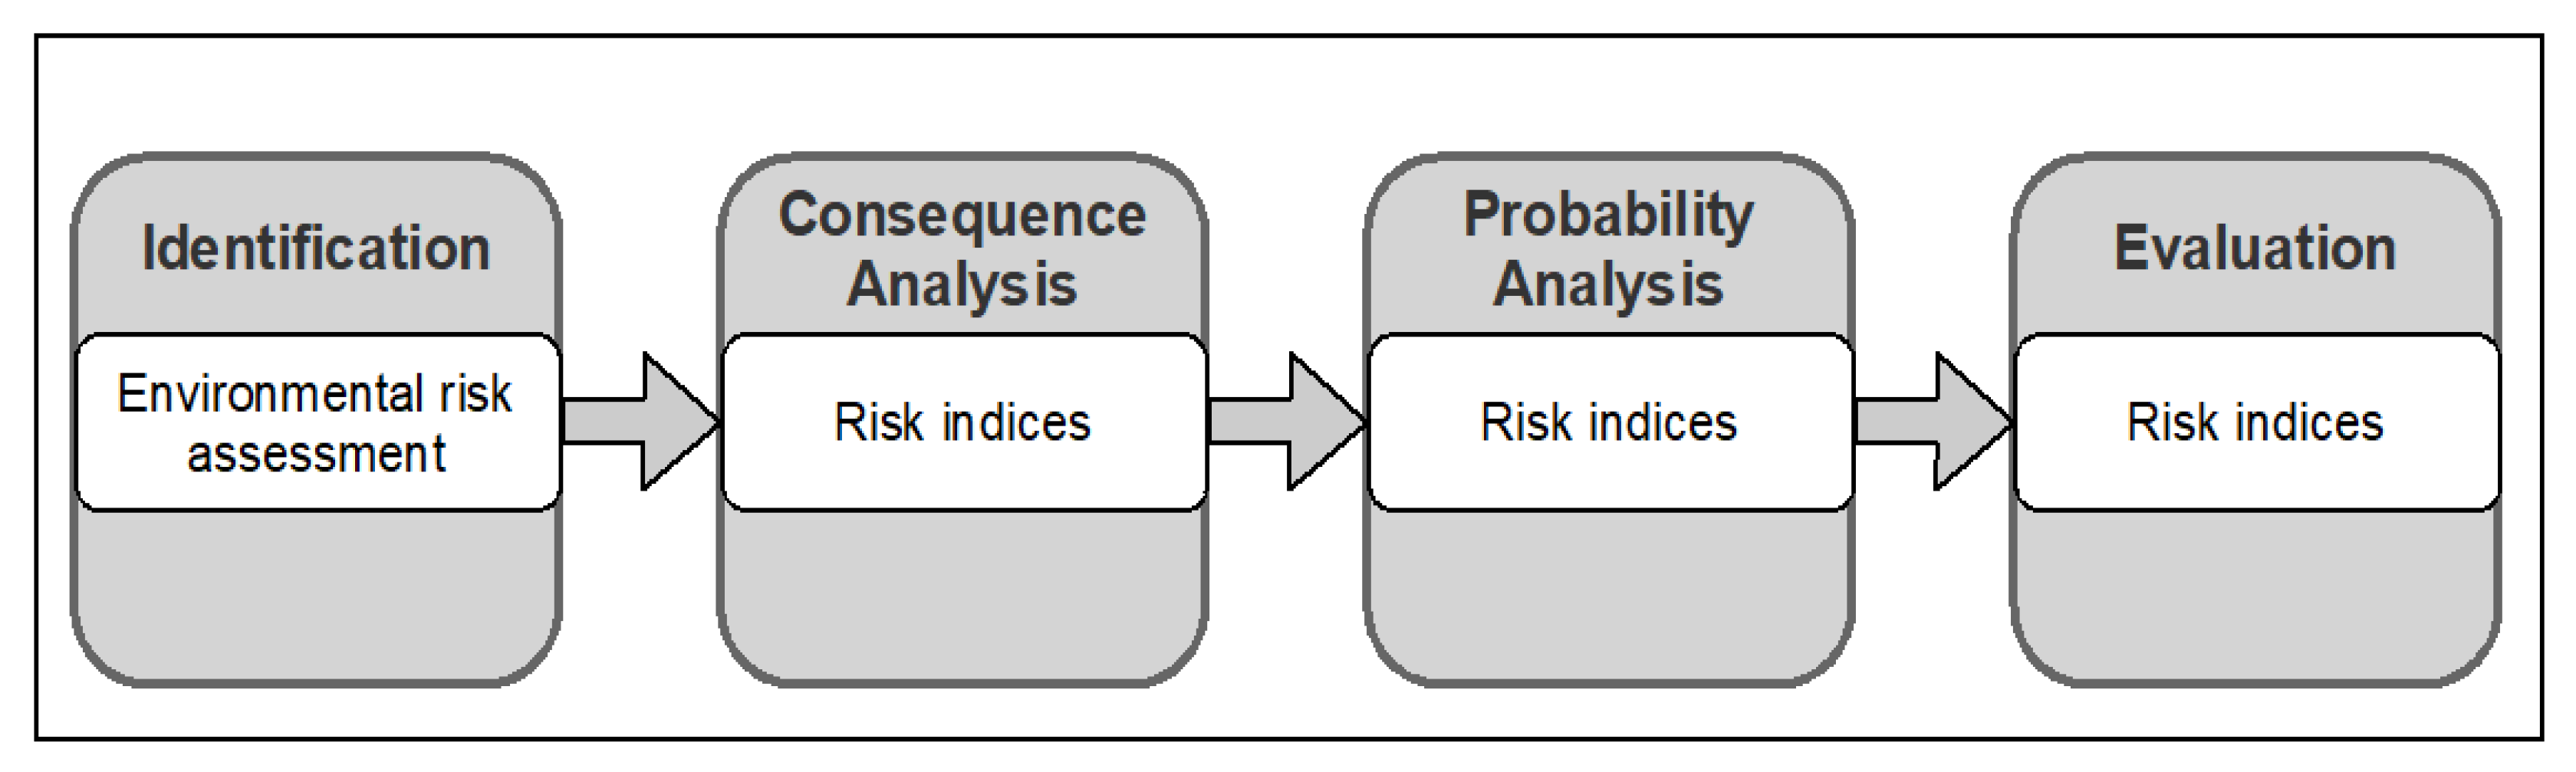
As a result of the judgment of the seven interviewees’ priorities, the tools presented by ISO 31010 that would be most appropriate to identify, analyze consequences and probabilities and, finally, assess risks in the import and export process of an automotive industry located in Brazil, are shown in Figure 2.
For the identification step, the AHP analysis resulted in selecting the environmental risk assessment tool. This tool involves the assessment of the environment through observation and factual and quantitative/qualitative analysis of the risks of the environment in order to define the effects of exposure. Additionally, according to ISO 31010, this tool can be used in different fields, as its methodology explores the different ways in which a target can be exposed to a certain source of risk. Initially, this tool was used to assess risks in plants, animals, and humans when exposed to environmental risks. One of the known strengths of this tool is the provision of a more detailed understanding of the nature of the problem and the factors that increase risk.
The inputs for this tool come from observation and factual analysis. For this reason, the participants were asked to provide documents identifying the sources of risk that their processes have already suffered or an analysis of any potential sources of risk.
For the analysis and evaluation steps, the AHP analysis returned the same tool: risk indices. According to ISO 31010, a risk index is a semi-quantitative measure of risk. It is a derived estimate using a scoring approach using ordinal scales.
Analyzing separately the reasons behind the fact that the two steps returned the same tool, it is possible to highlight a few points:
  • For the consequence analysis step, risk indices had the highest relative priority for five of the seven respondents, and for the other two respondents they represented the second highest relative priority.
  • For the probability analysis step, risk indices had the highest relative priority for three of the seven respondents, while for two respondents they represented the second highest relative priority, and for the others, the third.
  • In the evaluation step, risk indices again had the highest relative priority for five of the seven respondents and came in second place for the other two.
These data prove the interviewees’ preference for this tool. Additionally, their matrices obtained a consistency index within the recommended range. Therefore, this would not prevent the application of the same method for the steps.
Another factor that can explain the preference of this tool is the interviewees’ familiarity with the risk indices in their professional practice. Not only at the company studied, but also in their previous experiences, the interviewees mentioned having used KPIs (key performance indicators) to measure process performance.
When analyzing the literature on the tools “environmental risk assessment” and “risk indices”, it is observed that: (i) both are considered to be strongly applicable for a risk management process, that is, for the stages of identification, analysis and assessment of risks [55]; (ii) a way to improve the communication of a certain level of risk between people and, thus, to prevent information from being misinterpreted is through risk indices, which can be expressed by numbers or categories, such as words, letters or colors [61]; (iii) the “environmental risk assessment” tool finds increasingly broad applications [62], such as megaprojects [63], transportation [64], industrial parks [65], and in support of decision-making processes [66].

5. Final Considerations

As risk management processes are appropriately implemented in supply chains, the level of resilience of these chains increases and, as a result, business sustainability is positively impacted, which can occur in the economic, environmental, and social spheres as a whole, or in any of them separately. The logic behind this relationship is, in theory, relatively simple: the more investments in “formal instruments” adjusted for a company’s SCRM, the fewer the occurrences of: (i) accidents; (ii) machines breaking; (iii) adverse effects on workers’ health; (iv) problems with suppliers; (v) environmental problems; (vi) loss of financial resources (which can lead to the dismissal of employees, decreased generation of taxes, and less investment in social projects), among other side effects of risks, which can be avoided together or alone.
In the case of the Brazilian automotive industry targeted by this study, the research had the general objective of selecting ISO 31010 tools that could be used in each of the stages (identification, consequence analysis, probability analysis, and evaluation) of the risk management of the import and export process, so that an appropriate “formal instrument” of SCRM could be obtained. This objective was achieved through interviews (structured questionnaires) with professionals with extensive experience in the Alliance Customs & Trade (ACT) department, who made priority comparisons between the tools proposed by ISO 31000, one by one, based on the AHP method. One of the biggest advantages of the AHP method is shown in the analysis of possible inconsistencies in the responses of the specialists, through a “disturbance matrix”, developed for this purpose. This analysis happens almost immediately after the delivery of the completed questionnaire, still in the presence of the respondent, with the answers checked against this matrix of disturbance. As a result of the empirical study, the “environmental risk assessment” and “risk indices” tools were selected, culminating in a customized process to meet the risk management needs of the target process of this study. A relevant aspect of this result is the support that the specialized literature on risk management (ISO 31010) gives to both tools, making them as applicable to all stages of a risk management process.

5.1. Theoretical Implications and Contributions

The literature review showed that, despite advances in research on SCRM, both in quantity and in different approaches, little research had been directed to the automotive industry. As an example, delimiting the universe of research to the Web of Science database, it was observed that less than ten studies focusing on this industry had been published in journals over the past twenty years. Of these works, almost half were published only last year. Recent research, such as that developed by Vanalle et al. [51], corroborates this gap. Still, as regards the SCRM literature, it was observed that a good portion of what was found focused on raising and identifying the main risks in the automotive supply chain, while few were dedicated to developing “formal instruments” to manage these risks.
Another relevant point observed in the literature refers to the risks that caused the most vulnerability in the supply chain, including delivery delays, quality problems, communication failures between the different layers of suppliers, and forecast errors. When taking into account the issue of vulnerability, it is observed that nowadays the operations of supply chains are more and more exposed, for innumerable reasons, of which the following stand out: new trends in business (life cycles of increasingly smaller products, strategies such as Lean Six Sigma, Just in Time, and Outsourcing); cultural adaptations in operations with less and less geographical barriers; “depreciation” of the environment, which ends up generating a reaction from nature with hurricanes, earthquakes, and other natural disasters capable of generating disruptions in supply chains; amongst others. The fact is that these findings (scarcity of research focused on the automotive industry versus increasing supply chain vulnerability) make this work a relevant complement to SCRM research, by providing suggestions for tools for the execution of risk management steps in the import/export process of the automotive industry.

5.2. Practical and Managerial Implications

Although many managers are aware that SCRM is an indispensable practice to be incorporated into supply chain management, it is observed that in the day-to-day life of the automotive industries—at least as has been found in much of the literature dedicated to this theme—is that many of these managers do not use “formal instruments” to minimize (or even eliminate) risks along the different levels of the supply chain. This does not mean that managers do not use tools for risk management, but that, in most cases, these tools are used focally, without thinking about the chain as a whole.: it is precisely in this context that the so-called “formal instruments” should come in to minimize risks. In this direction, recent studies have shown that smaller suppliers and those more distant from vehicle manufacturers suffer the adverse effects of risks in a disproportionately larger and less predictable manner. However, with chains increasingly connected and interconnected, risks that affect suppliers at more distant levels result in, due to the domino effect, effects across the entire chain.
The final result of this research can contribute to the improvement of the risk management of the import/export processes of the Brazilian automotive industry, which was the target of this case study, insofar as it takes into account the tools previously selected by those who know and directly participate in the operational activities of that process. At this point, it is emphasized that the most significant contribution of this study to practical application was the suggestion of a customized procedure with the tools “environmental risk assessment” and “risk indices”, which will allow the risks to be identified, analyzed, and evaluated by the Alliance Customs & Trade department.

5.3. Limitations and Recommendations for Future Research

Given that the present research was carried out through a single case study, its most significant limitation is that its results cannot be generalized to other industries in the automotive sector, nor to companies from different sectors. In addition, as the research was focused on the process of importing productive inputs and the export of vehicles, its conclusions cannot be extrapolated to different areas of the researched company. Despite these limitations, it is believed that rational analogies—that is, an extrapolation based on the qualitative criteria of the results exposed here,—can be developed by professionals and researchers, since the study had a real application and that followed a logical sequence of structured steps, as explained and exemplified in the selection of organized tools for the identification, analysis, and assessment of risks. It is also noteworthy that the research had an exploratory nature; given the scarcity of research as specific as the one developed here, it contributes to a better understanding and the obtaining of initial insights to increase the familiarity of researchers and professionals on this topic.
Based on the limitations addressed here and the proven scarcity of specific research on this subject, it is recommended, as future research, that: (i) more practical research on applications of tools for the realization of SCRM in automotive industries be developed, regardless of area, department, or process; (ii) descriptive research, which has a focus on obtaining statistical conclusions on risk management in import and export processes for the automotive industry, is considered; (iii) action research should be developed based on the results obtained here, that is, that the risk management process composed by the tools “environmental risk assessment” and “risk indices” is tested, preferably in processes of import and export of automotive industries.

Author Contributions

Conceptualization, G.C.D., U.R.d.O., and V.A.F.; methodology, G.C.D. and U.R.d.O.; validation, U.R.d.O.; formal analysis, G.C.D. and U.R.d.O.; investigation, G.C.D. and U.R.d.O.; resources, G.C.D., G.B.A.L., and V.A.F.; data curation, G.C.D. and U.R.d.O.; writing—original draft preparation, G.C.D., U.R.d.O., and G.B.A.L.; writing—review and editing, G.C.D., U.R.d.O., and V.A.F.; visualization, U.R.d.O. and V.A.F.; supervision, U.R.d.O.; project administration, U.R.d.O. All authors have read and agreed to the published version of the manuscript.

Funding

This research received no external funding.

Institutional Review Board Statement

Not applicable.

Informed Consent Statement

Not applicable.

Data Availability Statement

Not applicable.

Conflicts of Interest

The authors declare no conflict of interest.

References

  1. Kern, D.; Moser, R.; Hartmann, E.; Moder, M. Supply risk management: Model development and empirical analysis. Int. J. Phys. Distrib. Logist. Manag. 2012, 42, 60–82. [Google Scholar] [CrossRef]
  2. Zhao, L.; Huo, B.; Sun, L.; Zhao, X. The impact of supply chain risk on supply chain integration and company performance: A global investigation. Supply Chain Manag. Int. J. 2013, 18, 115–131. [Google Scholar] [CrossRef]
  3. Blos, M.F.; Quaddus, M.; Wee, H.; Watanabe, K. Supply chain risk management (SCRM): A case study on the automotive and electronic industries in Brazil. Supply Chain Manag. Int. J. 2009, 14, 247–252. [Google Scholar] [CrossRef]
  4. Pfohl, H.; Gallus, P.; Thomas, D. Interpretive structural modeling of supply chain risks. Int. J. Phys. Distrib. Logist. Manag. 2011, 41, 839–859. [Google Scholar] [CrossRef]
  5. Wu, T.; Blackhurst, J.; Chidambaram, V. A model for inbound supply risk analysis. Comput. Ind. 2006, 57, 350–365. [Google Scholar] [CrossRef]
  6. Khan, O.; Burnes, B. Risk and supply chain management: Creating a research agenda. Int. J. Logist. Manag. 2007, 18, 197–216. [Google Scholar] [CrossRef]
  7. Singhal, P.; Agarwal, G.; Mittal, M.L. Supply chain risk management: Review, classification and future research directions. Int. J. Bus. Sci. Appl. Manag. 2011, 6, 15–42. [Google Scholar]
  8. Hallikas, J.; Karvonen, I.; Pulkkinen, U.; Virolainen, V.-M.; Tuominen, M. Risk management processes in supplier networks. Int. J. Prod. Econ. 2004, 90, 47–58. [Google Scholar] [CrossRef]
  9. KleindorferGermaine, P.R.; Saad, G.H. Managing Disruption Risks in Supply Chains. Prod. Oper. Manag. 2009, 14, 53–68. [Google Scholar] [CrossRef]
  10. Tummala, R.; Schoenherr, T. Assessing and managing risks using the Supply Chain Risk Management Process (SCRMP). Supply Chain Manag. Int. J. 2011, 16, 474–483. [Google Scholar] [CrossRef]
  11. Ritchie, B.; Brindley, C. Supply chain risk management and performance. Int. J. Oper. Prod. Manag. 2007, 27, 303–322. [Google Scholar] [CrossRef]
  12. de Oliveira, U.R.; Marins, F.A.S.; Rocha, H.M.; Salomon, V. The ISO 31000 standard in supply chain risk management. J. Clean. Prod. 2017, 151, 616–633. [Google Scholar] [CrossRef] [Green Version]
  13. Santos, R.B.; De Oliveira, U.R. Analysis of occupational risk management tools for the film and television industry. Int. J. Ind. Ergon. 2019, 72, 199–211. [Google Scholar] [CrossRef]
  14. Santos, R.B.; De Oliveira, U.R.; Rocha, H.M. Failure mapping for occupational safety management in the film and television industry. Int. J. Prod. Econ. 2018, 203, 1–12. [Google Scholar] [CrossRef]
  15. Machado, L.D.V.; de Oliveira, U.R. Analysis of failures in the accessibility of university buildings. J. Build. Eng. 2021, 33, 101654. [Google Scholar] [CrossRef]
  16. Dias, G.C.; Hernandez, C.T.; De Oliveira, U.R. Supply chain risk management and risk ranking in the automotive industry. Manag. Oper. Rev. 2020, 27, 1–21. [Google Scholar] [CrossRef]
  17. De Oliveira, U.R.; Espindola, L.S.; Marins, F.A.S. Analysis of supply chain risk management researches. Manag. Oper. Rev. 2018, 25, 671–695. [Google Scholar] [CrossRef] [Green Version]
  18. Jabbarzadeh, A.; Fahimnia, B.; Sabouhi, F. Resilient and sustainable supply chain design: Sustainability analysis under disruption risks. Int. J. Prod. Res. 2018, 56, 5945–5968. [Google Scholar] [CrossRef]
  19. Fan, D.; Lo, C.K.; Zhou, Y. Sustainability risk in supply bases: The role of complexity and coupling. Transp. Res. Part E: Logist. Transp. Rev. 2021, 145, 102175. [Google Scholar] [CrossRef]
  20. Multaharju, S.; Lintukangas, K.; Hallikas, J.; Kähkönen, A.-K. Sustainability-related risk management in buying logistics services: An exploratory cross-case analysis. Int. J. Logist. Manag. 2017, 28, 1351–1367. [Google Scholar] [CrossRef]
  21. Valinejad, F.; Rahmani, D. Sustainability risk management in the supply chain of telecommunication companies: A case study. J. Clean. Prod. 2018, 203, 53–67. [Google Scholar] [CrossRef]
  22. Gouda, S.K.; Saranga, H. Sustainable supply chains for supply chain sustainability: Impact of sustainability efforts on supply chain risk. Int. J. Prod. Res. 2018, 56, 5820–5835. [Google Scholar] [CrossRef]
  23. Alikhani, R.; Torabi, S.A.; Altay, N. Strategic supplier selection under sustainability and risk criteria. Int. J. Prod. Econ. 2019, 208, 69–82. [Google Scholar] [CrossRef] [Green Version]
  24. Chowdhury, M.H.; Quaddus, M.A. Supply chain sustainability practices and governance for mitigating sustainability risk and improving market performance: A dynamic capability perspective. J. Clean. Prod. 2021, 278, 123521. [Google Scholar] [CrossRef]
  25. Xu, M.; Cui, Y.; Hu, M.; Xu, X.; Zhang, Z.; Liang, S.; Qu, S. Supply chain sustainability risk and assessment. J. Clean. Prod. 2019, 225, 857–867. [Google Scholar] [CrossRef]
  26. Liu, W.; Wei, W.; Yan, X.; Dong, D.; Chen, Z. Sustainability risk management in a smart logistics ecological chain: An evaluation framework based on social network analysis. J. Clean. Prod. 2020, 276, 124189. [Google Scholar] [CrossRef]
  27. Hallikas, J.; Lintukangas, K.; Kähkönen, A.-K. The effects of sustainability practices on the performance of risk management and purchasing. J. Clean. Prod. 2020, 263, 121579. [Google Scholar] [CrossRef]
  28. Žic, J.; Zic, S. Multi-criteria decision making in supply chain management based on inventory levels, environmental impact and costs. Adv. Prod. Eng. Manag. 2020, 15, 151–163. [Google Scholar] [CrossRef]
  29. Trkman, P.; McCormack, K. Supply chain risk in turbulent environments—A conceptual model for managing supply chain network risk. Int. J. Prod. Econ. 2009, 119, 247–258. [Google Scholar] [CrossRef]
  30. Shu, T.; Chen, S.; Wang, S.; Lai, K.K. GBOM-oriented management of production disruption risk and optimization of supply chain construction. Expert Syst. Appl. 2014, 41, 59–68. [Google Scholar] [CrossRef]
  31. Xia, D.; Chen, B. A comprehensive decision-making model for risk management of supply chain. Expert Syst. Appl. 2011, 38, 4957–4966. [Google Scholar] [CrossRef]
  32. Scannell, T.; Curkovic, S.; Wagner, B. Integration of ISO 31000:2009 and Supply Chain Risk Management. Am. J. Ind. Bus. Manag. 2013, 03, 367–377. [Google Scholar] [CrossRef] [Green Version]
  33. Mogre, R.; Talluri, S.S.; D’Amico, F. A Decision Framework to Mitigate Supply Chain Risks: An Application in the Offshore-Wind Industry. IEEE Trans. Eng. Manag. 2016, 63, 316–325. [Google Scholar] [CrossRef] [Green Version]
  34. Kamalahmadi, M.; Parast, M.M. A review of the literature on the principles of enterprise and supply chain resilience: Major findings and directions for future research. Int. J. Prod. Econ. 2016, 171, 116–133. [Google Scholar] [CrossRef]
  35. Lavastre, O.; Gunasekaran, A.; Spalanzani, A. Supply chain risk management in French companies. Decis. Support Syst. 2012, 52, 828–838. [Google Scholar] [CrossRef]
  36. Ledwoch, A.; Yasarcan, H.; Brintrup, A. The moderating impact of supply network topology on the effectiveness of risk management. Int. J. Prod. Econ. 2018, 197, 13–26. [Google Scholar] [CrossRef] [Green Version]
  37. Manuj, I.; Mentzer, J.T. Global supply chain risk management strategies. Int. J. Phys. Distrib. Logist. Manag. 2008, 38, 192–223. [Google Scholar] [CrossRef] [Green Version]
  38. Faisal, M.N.; Banwet, D.; Shankar, R. Supply chain risk mitigation: Modeling the enablers. Bus. Process. Manag. J. 2006, 12, 535–552. [Google Scholar] [CrossRef]
  39. Tuncel, G.; Alpan, G. Risk assessment and management for supply chain networks: A case study. Comput. Ind. 2010, 61, 250–259. [Google Scholar] [CrossRef]
  40. Fan, H.; Li, G.; Sun, H.; Cheng, T. An information processing perspective on supply chain risk management: Antecedents, mechanism, and consequences. Int. J. Prod. Econ. 2017, 185, 63–75. [Google Scholar] [CrossRef]
  41. Olechowski, A.; Oehmen, J.; Seering, W.; Ben-Daya, M. The professionalization of risk management: What role can the ISO 31000 risk management principles play? Int. J. Proj. Manag. 2016, 34, 1568–1578. [Google Scholar] [CrossRef] [Green Version]
  42. Ernawati, T.; Nugroho, D.R. IT risk management framework based on ISO 31000: 2009. In Proceedings of the 2012 International Conference on System Engineering and Technology (ICSET), Bandung, Indonesia, 11–12 September 2012; pp. 1–8. [Google Scholar] [CrossRef]
  43. LaLonde, C.; Boiral, O. Managing risks through ISO 31000: A critical analysis. Risk Manag. 2012, 14, 272–300. [Google Scholar] [CrossRef]
  44. Singh, P.J.; Smith, A. Strategic supply chain management issues in the automotive industry: An Australian perspective. Int. J. Prod. Res. 2005, 43, 3375–3399. [Google Scholar] [CrossRef]
  45. Thun, J.H.; Hoenig, D. An empirical analysis of supply chain risk management in the German automotive industry. Int. J. Prod. Econ. 2011, 131, 242–249. [Google Scholar] [CrossRef]
  46. Ceryno, P.; Scavarda, L.F.; Klingebiel, K. Supply chain risk: Empirical research in the automotive industry. J. Risk Res. 2015, 18, 1145–1164. [Google Scholar] [CrossRef]
  47. Simchi-Levi, D.; Schmidt, W.; Wei, Y.; Zhang, P.Y.; Combs, K.; Ge, Y.; Gusikhin, O.; Sanders, M.; Zhang, D. Identifying Risks and Mitigating Disruptions in the Automotive Supply Chain. Interfaces 2015, 45, 375–390. [Google Scholar] [CrossRef] [Green Version]
  48. Chen, A.; Hsieh, C.-Y.; Wee, H.M. A resilient global supplier selection strategy—a case study of an automotive company. Int. J. Adv. Manuf. Technol. 2014, 87, 1475–1490. [Google Scholar] [CrossRef]
  49. Zhang, J.; Chen, X.; Fang, C. Transmission of a supplier’s disruption risk along the supply chain: A further investigation of the Chinese automotive industry. Prod. Plan. Control. 2018, 29, 773–789. [Google Scholar] [CrossRef]
  50. Mzougui, I.; Carpitella, S.; Certa, A.; El Felsoufi, Z.; Izquierdo, J. Assessing Supply Chain Risks in the Automotive Industry through a Modified MCDM-Based FMECA. Processes 2020, 8, 579. [Google Scholar] [CrossRef]
  51. Vanalle, R.M.; Lucato, W.; Ganga, G.; Filho, A.A. Risk management in the automotive supply chain: An exploratory study in Brazil. Int. J. Prod. Res. 2019, 58, 783–799. [Google Scholar] [CrossRef]
  52. Junaid, M.; Xue, Y.; Syed, M.W.; Zu Li, J.; Ziaullah, M. A Neutrosophic AHP and TOPSIS Framework for Supply Chain Risk Assessment in Automotive Industry of Pakistan. Sustainability 2019, 12, 154. [Google Scholar] [CrossRef] [Green Version]
  53. Rangel, D.A.; De Oliveira, T.K.; Leite, M.S.A. Supply chain risk classification: Discussion and proposal. Int. J. Prod. Res. 2014, 53, 6868–6887. [Google Scholar] [CrossRef]
  54. Forman, E.; Peniwati, K. Aggregating individual judgments and priorities with the analytic hierarchy process. Eur. J. Oper. Res. 1998, 108, 165–169. [Google Scholar] [CrossRef]
  55. ISO. Risk Management—Risk Assessment Techniques: ISO 31010; ISO: Geneve, Switzerland, 2009. [Google Scholar]
  56. Saaty, T.L. Decision making with the analytic hierarchy process. Int. J. Serv. Sci. 2008, 1, 83. [Google Scholar] [CrossRef] [Green Version]
  57. Saaty, T.L. A scaling method for priorities in hierarchical structures. J. Math. Psychol. 1977, 15, 234–281. [Google Scholar] [CrossRef]
  58. Ishizaka, A.; Nemery, P. Multi-Criteria Decision Analysis: Methods and Software; John Wiley & Sons: Chichester, UK, 2013. [Google Scholar]
  59. Saaty, T.L. Decision-making with the AHP: Why is the principal eigenvector necessary. Eur. J. Oper. Res. 2003, 145, 85–91. [Google Scholar] [CrossRef]
  60. Saaty, T.L. Some mathematical concepts of the Analytic Hierarchy Process. Behaviormetrika 1991, 29, 1–9. [Google Scholar] [CrossRef]
  61. MacKenzie, C.A. Summarizing Risk Using Risk Measures and Risk Indices. Risk Anal. 2014, 34, 2143–2162. [Google Scholar] [CrossRef] [PubMed] [Green Version]
  62. Eduljee, G. Trends in risk assessment and risk management. Sci. Total. Environ. 2000, 249, 13–23. [Google Scholar] [CrossRef]
  63. Chen, Z.; Li, H.; Ren, H.; Xu, Q.; Hong, J. A total environmental risk assessment model for international hub airports. Int. J. Proj. Manag. 2011, 29, 856–866. [Google Scholar] [CrossRef]
  64. Dvorak, Z.; Rehak, D.; David, A.; Cekerevac, Z. Qualitative Approach to Environmental Risk Assessment in Transport. Int. J. Environ. Res. Public Health 2020, 17, 5494. [Google Scholar] [CrossRef] [PubMed]
  65. Ding, G.; Xin, L.; Guo, Q.; Wei, Y.; Li, M.; Liu, X. Environmental risk assessment approaches for industry park and their applications. Resour. Conserv. Recycl. 2020, 159, 104844. [Google Scholar] [CrossRef]
  66. Wu, K.; Zhang, L. Progress in the Development of Environmental Risk Assessment as a Tool for the Decision-Making Process. J. Serv. Sci. Manag. 2014, 7, 131–143. [Google Scholar] [CrossRef] [Green Version]
Figure 1. Construction of AHP analysis for the research.
Sustainability 13 06049 g001
Figure 2. Suggested tools for risk management in the import/export process of a Brazilian automotive company.
Sustainability 13 06049 g002
Table 1. Studies on SCRM in the automotive industry published in periodicals.
YearAuthorsTopics
2009Blos [3]Identifying risks in the supply chain and highlighting the urgency of implementing SCRM in the Brazilian automotive industry.
2011Thun e Hoenig [45]Distinction of internal and external risks to the supply chain and the analysis of instruments to deal with these risks in the German automotive industry.
2015Ceryno et al. [46]Identifying of risks in the supply chain in different stages of the chain, offering an initial risk profile for this chain in the Brazilian automotive industry.
2015Simchi-Levi et al. [47]Development of a risk exposure model at Ford Motor Company that assesses the impact of an interruption anywhere in the supply chain, so that the company can consider risk mitigation actions and develop contingency plans.
2016Chen et al. [48]Identifies global supplier selection criteria through performance measurements to mitigate risks in uncertain environments.
2018Zhang et al. [49]Analysis of the transmission of risks between suppliers, manufacturers, and distributors, in addition to an investigation of the strategies used by the Chinese automotive industry to mitigate the adverse effects of supplier interruptions.
2020Mzougui et al. [50]Compiles a comprehensive list of specific risks related to the automotive supply chain and proposes a method adapted for the analysis of failure modes, referred to as effect of risk criticality analysis.
2020Vanalle et al. [51]Identifies the main characteristics of risk management in the automotive supply chain in Brazil, considering first- and second-tier companies.
2020Dias et al. [16]Analysis of how an automotive industry located in Brazil identifies and manages the risk factors related to its supply chain.
2020Junaid et al. [52]Identifies and assesses risks in Pakistan’s automotive industry, ranking the most vulnerable risks for supply chains.
Table 2. Main risks associated with the automotive industry found in the literature.
RisksCited by
Supplier delivery delays[3,50,52]
Supplier communication failure[50,52]
Increase in input prices[3,50,52]
Forecasting errors[52]
Supplier quality problem[3,50,52]
Machine breakdown[3,50,52]
Inventory shortage[50,52]
IT system failure[3,52]
Cargo damages[3,50,52]
Supplier insolvency[3,52]
Troubling third-party logistics[3,52]
Government regulations and/or restrictions[3,46,52]
Insufficient capacity [46,50]
Underutilized capacity [46,52]
Lead times[52]
Natural disasters[3,50,52]
Eco/environmental risks[3,52]
Terrorist attacks[50,52]
Lack of flexibility[50]
Ineffective transport[50]
Strikes of workers or disputes at work[50]
Increase in labor costs[50]
Health safety or environmental (HSE) incident[3,50]
Social instability and/or economics crises[3,46,50]
Dependence or loss of key supplier[3,50]
Inefficient delivery of products[50]
Demand change for new cars or auto parts[46]
Network-related risk source: inertia[46]
Utilities failures[3]
New or foreign competitors[3]
Sabotage[3]
Theft[3]
Operator errors[3]
Financial vulnerability (currency and foreign exchange rate fluctuations; credit default)[3]
Table 3. Risk tools included in ISO 31010. Source: Adapted from ISO [55].
Tools/MethodsRisk Assessment Process
Risk
Identification
Risk AnalysisRisk
Evaluation
ConsequenceProbability
Bayesian statistics and Bayesian netsNASANASA
Brainstorming SANANANA
Bow tie analysisNAASAA
Business impact analysisASAAA
Cause and consequence analysisASASAA
Cause and effect analysisSASANANA
ChecklistsSANANANA
Consequence/probability matrixSASASAA
Cost benefit analysis (CBA)ASAAA
Decision treeNASASAA
DelphiSANANANA
Environmental risk assessment (ERA)SASASASA
Event tree analysis (ETA)ASAANA
Failure mode effect analysis (FMEA)SASASASA
Fault tree analysis (FTA)ANASAA
FN curveASASASA
HACCPSASANASA
HAZOPSASAAA
Human reliability analysisSASASAA
Layer protect analysisASAANA
Markov analysisASANANA
Monte Carlo simulation (MCS)NANANASA
Multi criteria decision analysis (MCDA)ASAAA
Primary hazard analysis (PHA)SANANANA
Reliability centered maintenanceSASASASA
Risk indicesASASASA
Root cause analysis (RCA)NASASASA
Scenario analysisSASAAA
Sneak circuit analysisANANANA
Structured or semi-structured interviewsSANANANA
SWIFT (structure and what if)SASASASA
Legend: (A—Applicable; SA—Strongly Applicable; NA—Not Applicable).
Table 4. Hierarchy of interviewees.
ParticipantsHierarchical Level
I1Senior ACT Manager
I2Brazil Plant Controller
I3Cost Control Coordinator
I4ACT Coordinator
I5Control Analyst
I6Import Analyst
I7Export Analyst
Table 5. Criteria comparison matrix.
TOOLTool 1 (t1)Tool 2 (t2)Tool 3 (t3)Tool 4 (t4)Tool n (tn)
Tool 1 (t1)t1/t1t1/t2t1/t3t1/t4t1/tn
Tool 2 (t2)t2/t1t2/t2t2/t3t2/t4t2/tn
Tool 3 (t3)t3/t1t3/t2t3/t3t3/t4t3/tn
Tool 4 (t4)t4/t1t4/t2t4/t3t4/t4t4/tn
Tool n (tn)tn/t1tn/t2tn/t3tn/t4tn/tn
Source: Adapted from Saaty [57].
Table 6. Fundamental Saaty scale.
Intensity of ImportanceDefinitionExplanation
1Equal importanceBoth tools help equally to identify risks
3Moderate importanceExperience and judgment favor one tool slightly over another in identifying risks
5Strong importanceExperience and judgment favor one tool strongly over another in identifying risks
7Demonstrated importanceOne tool is strongly favored over another in identifying risks and can be demonstrated in practice
9Absolute importanceOne tool is favored over another in identifying risks with the highest degree of certainty
Source: Adapted from Saaty [57].
Table 7. Example of a comparison matrix with an inconsistent value.
ToolT1T2T3T4Tn
T119991
T21/91319
T31/91/311/51/9
T41/91511/9
Tn11/9991
Table 8. Example of a disturbance matrix.
ToolT1T2T3T4Tn
T113.000.581.380.42
T20.3310.580.4611.21
T31.721.7210.470.71
T40.722.172.1110.30
Tn2.410.091.403.321
Table 9. Results related to Interviewee 1 (I1).
SECTION 1: Identification Parity Matrix
I1BrainstormingStructured InterviewsDelphi MethodChecklistsPHAHAZOPERAScenario AnalysisFMEA
Brainstorming131/71/3331/31/51/7
Structured interviews1/311/91/51/31/31/51/71/9
Delphi method791599531
Checklists351/515531/31/5
PHA1/331/91/5111/51/71/9
HAZOP1/331/91/5111/51/71/9
ERA351/51/355111/7
Scenario analysis571/3377111/3
FMEA791599731
Total27.0045.003.2115.2740.3340.3317.938.963.15
SECTION 2: Consequence Analysis Parity Matrix
I1HAZOPERAScenario analysisRCAFMEAETADecision treeRiskindicesCBA
HAZOP13331/5331/71/3
ERA1/31111/7111/91/5
Scenario analysis1/31111/7111/91/5
RCA1/31111/7111/51/7
FMEA577717735
ETA1/31111/7111/51/5
Decision tree1/31111/7111/51/5
Risk indices79951/35513
CBA35571/5551/31
Total17.6729.0029.0027.002.4525.0025.005.3010.28
SECTION 3: Probability Analysis Parity Matrix
I1ERARCAFMEADecision treeRisk indices
ERA131/351/3
RCA1/311/711/5
FMEA37173
Decision tree1/511/711/5
Risk indices351/351
Total7.5317.001.9519.004.73
SECTION 4: Evaluation Parity Matrix
I1PHAERARCAFMEAMCSRisk indices
PHA11/331/51/31/5
ERA3151/311/3
RCA1/31/511/71/31/5
FMEA537153
MCS3131/511/7
Risk indices5351/371
Total17.338.5324.002.2114.674.88
Table 10. Consistency indexes related to all interviewees.
IdentificationConsequence
Analysis
Probability
Analysis
Evaluation
I17.05%4.19%4.48%8.55%
I27.84%8.38%5.11%5.65%
I39.89%8.73%0.00%5.65%
I48.79%9.99%9.81%0.00%
I57.92%5.21%6.74%8.59%
I68.69%9.84%7.65%7.35%
I79.77%9.86%9.15%7.08%
Table 11. Identification geometric mean.
IdentificationI1I2I3I4I5I6I7Geometric Mean
Brainstorming0.050.070.250.120.080.020.140.08
Structured interviews0.020.030.060.060.030.030.290.05
Delphi method0.280.26##0.240.07#-
Checklists0.100.200.090.050.040.070.290.10
Primary hazard analysis0.03###0.050.07#-
HAZOP0.03###0.050.19#-
Environmental risk analysis0.090.040.540.240.120.120.080.13
Failure mode and effect analysis0.290.20#0.390.360.280.08-
Cause and effect analysis#0.020.060.020.020.060.03-
Failure mode and effect analysis0.140.20#0.10##0.07-
SWIFT (structure and what if)#####0.07#-
Consequence/probability matrix###0.02##0.02-
Table 12. Consequence analysis geometric mean.
Consequence AnalysisI1I2I3I4I5I6I7Geometric Mean
HAZOP0.08###0.050.12#-
Environmental risk assessment0.030.080.080.130.090.180.100.09
Failure Mode and effect analysis0.340.20#0.370.200.190.06-
Cause and consequence analysis#0.03##0.02#0.04-
Cause and effect analysis#0.030.030.020.020.040.07-
Risk indices0.250.380.490.080.290.290.400.28
Cost benefit analysis0.160.220.26#0.29#0.21-
Multi criteria decision analysis##0.14#0.02##-
Failure mode and effect analysis0.030.06#0.13##0.05-
Root cause analysis0.03####0.02#-
Event tree analysis0.04######-
Decision tree0.04##0.03#0.020.03-
SWIFT (structure and what if)#####0.06#-
Layer protect analysis###0.02#0.02#-
Consequence/probability matrix###0.03#0.050.04-
Business impact analysis###0.13###-
Fault tree analysis###0.04###-
Table 13. Probability analysis geometric mean.
Probability AnalysisI1I2I3I4I5I6I7Geometric Mean
Environmental risk assessment0.160.120.130.210.120.140.160.15
Failure mode and effect analysis0.460.42#0.530.430.240.07-
Cause and consequence analysis#0.04##0.04#0.03-
Risk indices0.270.420.880.140.410.420.570.39
Root cause analysis0.05####0.03#-
Decision tree0.05##0.03#0.040.07-
SWIFT (structure and what if)#####0.03#-
Consequence/probability matrix###0.03#0.100.10-
Fault tree analysis###0.07###-
Table 14. Evaluation geometric mean.
EvaluationI1I2I3I4I5I6I7Geometric Mean
Primary hazard analysis0.06###0.050.09#-
Environmental risk assessment0.130.070.070.090.110.170.150.11
Failure mode and effect analysis0.390.28#0.450.530.260.07-
Risk indices0.280.640.640.450.310.410.780.47
Root cause analysis0.04####0.03#-
Monte Carlo simulation0.10#0.28####-
SWIFT (structure and what if)#####0.05#-
Publisher’s Note: MDPI stays neutral with regard to jurisdictional claims in published maps and institutional affiliations.

