Next Article in Journal
CEO Overconfidence and Voluntary Disclosure of Greenhouse Gas Emissions: With a Focus on the Role of Corporate Governance
Next Article in Special Issue
Allantoin from Valuable Romanian Animal and Plant Sources with Promising Anti-Inflammatory Activity as a Nutricosmetic Ingredient
Previous Article in Journal
Quantifying Ecosystem Services of High Mountain Lakes across Different Socio-Ecological Contexts
 
 
Correction published on 16 November 2021, see Sustainability 2021, 13(22), 12634.
Article

Multi-Scale Minero-Chemical Analysis of Biomass Ashes: A Key to Evaluating Their Dangers vs. Benefits

1
Dipartimento di Fisica e Geologia, Università degli Studi di Perugia, 06121 Perugia, Italy
2
UOC PSAL, AUSL Umbria 1, 06127 Perugia, Italy
3
Dipartimento di Scienze Farmaceutiche, Università degli Studi di Perugia, 06121 Perugia, Italy
4
Dipartimento di Giurisprudenza, Università Telematica Pegaso, 80132 Napoli, Italy
5
Dipartimento di Ingegneria, Università degli Studi di Perugia, 06121 Perugia, Italy
*
Author to whom correspondence should be addressed.
Sustainability 2021, 13(11), 6052; https://0-doi-org.brum.beds.ac.uk/10.3390/su13116052
Submission received: 7 May 2021 / Revised: 23 May 2021 / Accepted: 25 May 2021 / Published: 27 May 2021 / Corrected: 16 November 2021
(This article belongs to the Collection Advances in Biomass Waste Valorization)

Abstract

:
A multi-methodic analysis was performed on five samples of fly ashes coming from different biomasses. The aim of the study was to evaluate their possible re-use and their dangerousness to people and the environment. Optical granulometric analyses indicated that the average diameter of the studied fly ashes was around 20 µm, whereas only ~1 vol% had diameters lower that 2.5 µm. The chemical composition, investigated with electron probe microanalysis, indicated that all the samples had a composition in which Ca was prevalent, followed by Si and Al. Large contents of K and P were observed in some samples, whereas the amount of potentially toxic elements was always below the Italian law thresholds. Polycyclic aromatic hydrocarbons were completely absent in all the samples coming from combustion plants, whereas they were present in the fly ashes from the gasification center. Quantitative mineralogical content, determined by Rietveld analysis of X-ray powder diffraction data, indicated that all the samples had high amorphous content, likely enriched in Ca, and several K and P minerals, such as sylvite and apatite. The results obtained from the chemo-mineralogical study performed make it possible to point out that biomass fly ashes could be interesting materials (1) for amendments in clayey soils, as a substitution for lime, to stimulate pozzolanic reactions and improve their geotechnical properties, thus, on the one hand, avoiding the need to mine raw materials and, on the other hand, re-cycling waste; and (2) as agricultural fertilizers made by a new and ecological source of K and P.

1. Introduction

Fly ashes represent the amount of solid, inorganic residue left after the complete burning of biomasses. They are an integral part of plant materials and can have a wide range of elements. Due to the difference in raw materials as well as in the combustion plant type, the chemical physical characteristics of fly ashes can be quite different [1]. Moreover, the percentage of ashes produced during biomass burning varies according to the biomass type, ranging from a few units to about 10 dry weight percent [2,3].
Several papers [4,5,6] have shown that the principal chemical components of biomass ashes are silicon, aluminum, calcium, iron, magnesium, and sodium, together with valuable amounts of important plant nutrients, such as potassium and phosphorous.
The strong push towards the reuse of materials, together with the likely large increase of fly ashes from biomass over the last decades, suggest the need to take actions devoted to their re-use as second generation products [7]. Important examples include in agriculture, where biomass fly ashes are used either as fertilizers or as raw materials to manufacture fertilizers, and in the concrete industry, where biomass fly ashes are used as an aggregate/binder in concrete production (see [8] and references therein), contributing to enhancing the sustainability of the concrete industry. In particular, biomass ashes, e.g., from sugarcane bagasse, forest residues, or wheat straw, can be added to concrete as relevant components due to their pozzolanic properties [9,10,11,12].
On the other hand, they also can be used for producing silicon-based materials because of their very high silica content or in soil stabilization management [13,14].
Due to their broad range of features, the identification of beneficial re-uses must pass through the detailed characterization of biomass fly ashes. The chemical composition of biomass ashes is usually represented by the macro-elements Ca, K, P, and S, which suggest the possibility of their agricultural use [15], but they can contain heavy metals [16], as well as polycyclic aromatic hydrocarbons (PAHs) that can be produced by the thermal decomposition of organic matter due to incomplete combustion, e.g., either in engines and incinerators or when biomass burns in forest fires. Domestic wood burning and road traffic are the major sources of PAHs [17].
These components can hinder the use of biomass ashes due to their the cancerogenic character [18] and thus they should be monitored before being reused in a sustainable way, either directly as fertilizers or as raw material to manufacture fertilizers, and returned to soils.
Cabrera et al. [11] have characterized the biomass performances (energetic, physical, and chemical) of different biomass feedstocks, including lignocellulosic residues of cardoon energy crops, residues from the pruning of grapevines and olive trees, and residues from river maintenance (turkey oak). Each biomass sample was characterized in terms of the moisture content, ashes content, volatile substances, fixed carbon, low and high heating values [19], and the content levels of carbon, nitrogen, hydrogen, and the main metals [20]
This study aimed to investigate, with a multi-methodic approach, a group of ash products from different biomasses and from different combustion plants. Some of these samples have already been characterized in [3] and this allowed us to relate the characteristics of raw materials with those of ashes. In addition, a sample from a gasification plant and a sample from pellet combustions were investigated.
The samples were characterized from morphological, chemical, and mineralogical points of view. In particular, granulometric analysis was performed by diffraction light scattering and optical analysis in order to determine the PM10 and PM2.5 fractions which could impact on air pollution. X-ray powder diffraction (XRPD) analysis was used to determine the amount of the amorphous component, as well the crystalline fraction, in order to define the forms in which the chemical component are allocated and their availability and solubility for agricultural and/or other employments [21]. Thermal analyses (TA) were used to investigate the loss of mass during heating cycles and to determine the amount of volatile components. Moreover, bulk chemical analysis of major, minor, and trace elements (in particular heavy metals and potentially toxic elements (PTEs)) were deployed by means of an electron microprobe coupled with the wavelength dispersive spectroscopy (EMPA-WDS) technique. Field emission scanning electron microscopy (FE-SEM), coupled with microanalysis (energy dispersive spectroscopy (EDS)), was used to investigate micro-textural characteristics, especially focusing on the analysis of the possible occurrence of either concentric or zoned element distributions. Lastly, gas chromatography was used to determine PAH contents.

2. Materials and Methods

2.1. Samples

The type and the origin of samples investigated in this study are reported in Table 1.

2.2. Experimental Thecniques

2.2.1. XRPD Analyses

X-ray powder diffraction analyses were performed on randomly oriented powder at room temperature using a Phillips PW-1830, equipped with a graphite monochromator on the outgoing rays, and using CuKα radiation (λ = 1.5406). The voltage and current intensity of the generator were 40 kV and 30 mA, the step size was 0.3°, and the acquisition time for each step was 18 s. The diffraction patterns were collected in a Bragg–Brentano geometry (θ–2θ), in a range of 2θ between 5° to 80°. The Rietveld method [22], as implemented in GSAS—EXPGUI [23,24], was used for quantitative mineralogical analysis of the samples. A fraction of 10% by weight of crystalline silicon (Si) was added as external standard for the determination of the amorphous content. The background was fitted with a Chebyshev polynomial function and diffraction peaks were modeled with a pseudo-Voight function. Scale factor, lattice constants, and coefficients for the peak shapes were refined for each phase.

2.2.2. TGA and DTA

Thermogravimetric analyses (TGAs) were performed with a Netzsch STA 449F3. Approximately 50 to 100 mg of finely ground material was heated at a rate of 10 °C min−1, under room atmosphere, from 20 °C up to 1000 °C. The Netzsch software was used to process the results at the Department of Chemistry of Perugia University, Italy.
Differential thermal analysis (DTA) is a thermal analysis technique in which the heat flow into or out of a sample is measured as a function of temperature or time while the sample is exposed to a controlled temperature program. It is a very powerful technique for the evaluation of material properties such as glass transition temperature, melting temperature, crystallization, specific heat capacity, cure process, purity, oxidation behavior, and thermal stability.

2.2.3. SEM Analyses

The surface morphology and the chemical composition were examined through field emission scanning electron microscopy (FE-SEM) using an LEO 1525 with a ZEISS AsB (angle-selective backscatter) detector (Oberkochen, Germany), available at the Department of Physics and Geology of the University of Perugia. The FE-SEM instrument was coupled with EDS microanalysis (BrukerQuantax EDS). Gold coating was applied for SEM observations.

2.2.4. Granulometric Analysis

Particle sizes greater than 3 microns were determined by using an Accusizer TM Optical Particle Sizer Model 770 (Santa Barbara, CA, USA), whereas, for particle sizes lower than 3 microns, the dynamic light scattering technique was employed by using a NICOMP 380 ZLS zeta potential/particle sizer (PSS NICOMP; Santa Barbara, CA, USA). Approximately 10 mg of each sample was dispersed in 1 mL of bi-distilled water and sonicated for 10 s to improve the dispersion of the single particles.

2.2.5. EMPA and LA-ICP-MS Analyses

The samples were also analyzed in terms of bulk composition. In order to obtain homogeneous pellets, the ashes were heat-treated up to and beyond their fusion points. The heating was performed by putting a few grams of each specimen into a crucible made out of pure Pt and using a muffle capable of heating to 1600 °C. Once the samples were completely molten, they were quickly quenched at room temperature. The glass pellets obtained after the quenching were embedded with epoxy resin; the mounts were cut, ground, and highly polished down to a 1 µm grade diamond polishing paste. Minor and trace elements were analysed at the Department of Physics and Geology (Perugia University) by LA-ICP-MS using the analytical protocol reported in Ref. [25].
Before being analyzed, each polished mount had to be coated using graphite. EMPA–WDS analyses were carried out at the Electron Microprobe Laboratory of the Earth Science Department “Ardito Desio” (University of Milan, Milan, Italy), using the EMPA–WDS JEOL 8200 Super Probe with 5 WDS channels and one EDS channel under the following operating conditions: accelerating voltage, 15 kV; beam current, 5 nA; counting time, 30 s for all the elements and 10 s for the backgrounds. Calibration for chemical analysis was accomplished with a set of synthetic and natural standards, including: grossular (Al, Si, Ca), omphacite (Na), olivine (Mg), apatite (P), scapolite (Cl), pure Cr, rhodonite (Mn), fayalite (Fe), K-feldspar (K), and ilmenite (Ti).

2.2.6. PAHs (Polycyclic Aromatic Hydrocarbons)

To evaluate the possibly dangerous character of fly ashes and to determine their possible employments, polycyclic aromatic hydrocarbons measurements were performed.
The samples were analyzed with gas chromatography (Agilent mod. 6890) coupled with mass spectrometry (5973N, Agilent Technologies), using reference standards.
The total amounts of PAHs, including naftalene, acenaftene, acenaftilene, fluorene, fenatrene, antracene, fluoratene, pirene, benzoantracene crysene, benzo(b,k,j) fluorantene, benzo(e)pirene, benzo(a)pirene, indenopirene, dibenzo(a,h)antracene, and benzo(g,h,i)perilene, were determined.

3. Results

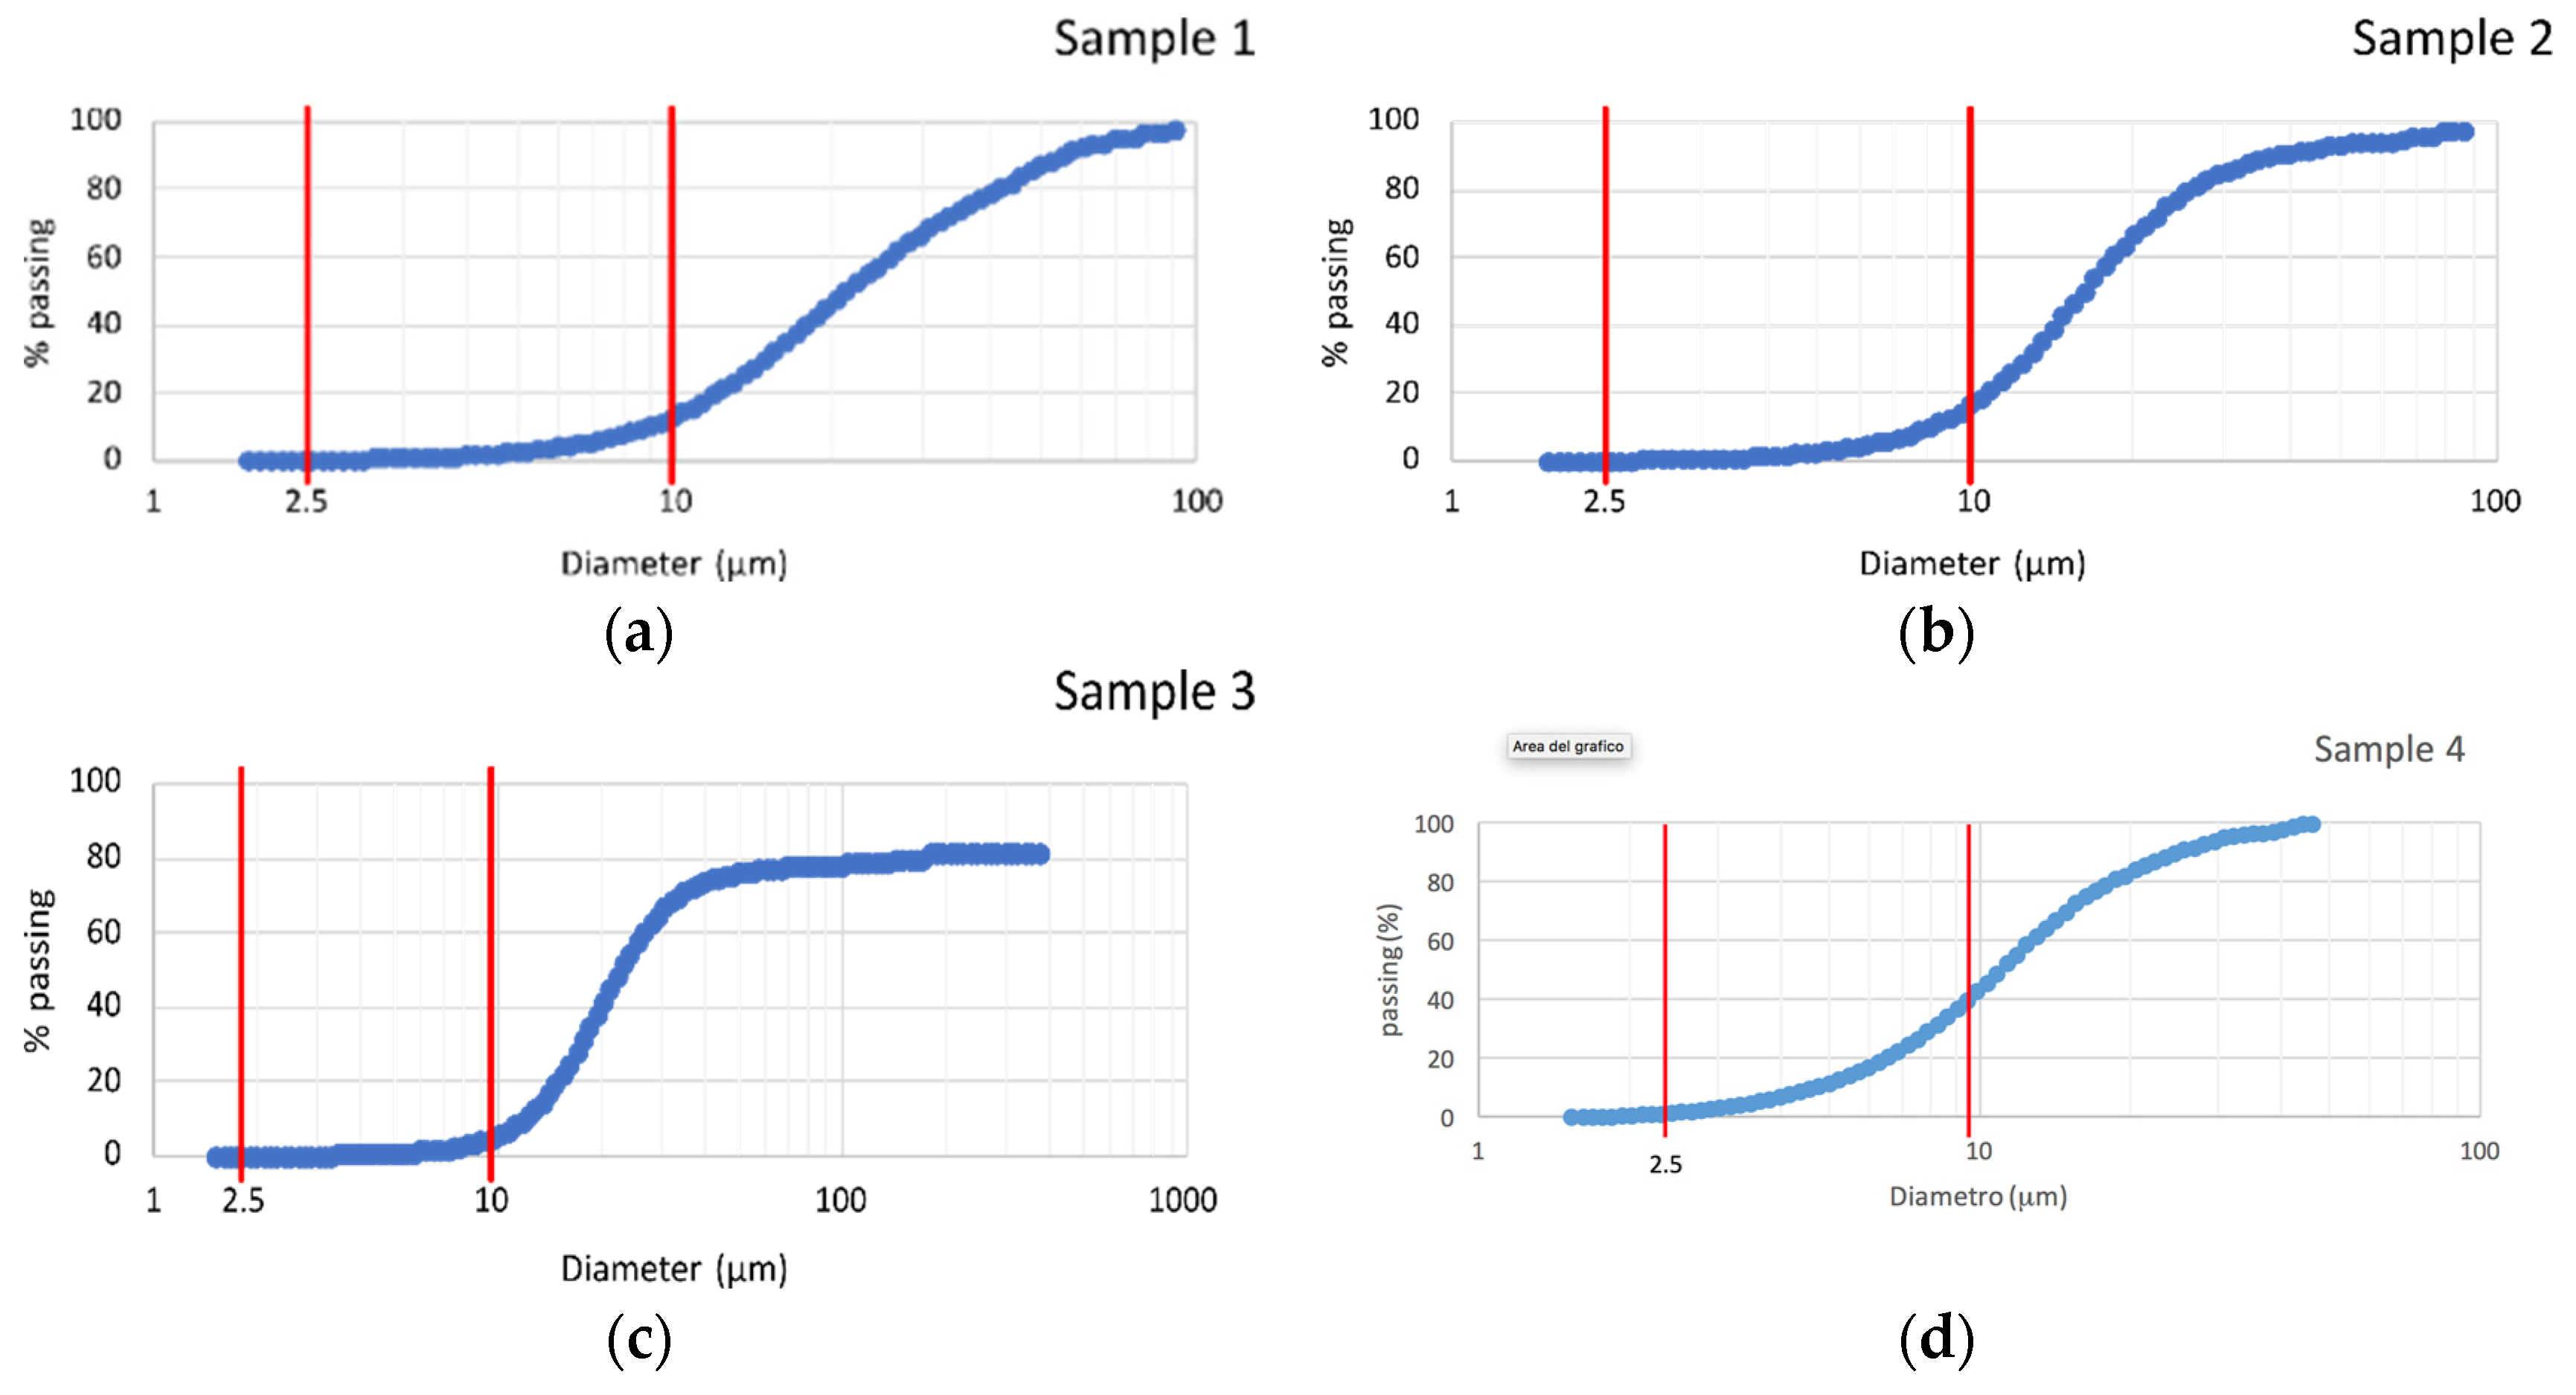
3.1. Granulometric Results

The results of the granulometric analysis are reported in Figure 1. The average sizes were quite similar for the five samples and equal to 23.8, 17.0, 21.0, 21.0, and 18 µm, from sample 1 to 5.
On the other hand, more relevant differences can be seen from the analysis of the granulometric curves reported in Figure 1, where the red lines highlight the positions of the 2.5 and 10 µm diameter particles. These values represent important limits as they identify the inhalation properties and, thus, the health hazard with regard to their inhalation capacities.
All samples contained very low percentages of particles with dimensions under 2.5 µm (less than 1 vol%), whereas the contents in particles with diameters less than 10 µm was quite different, varying from 5 vol% in sample 5 to 40 vol% in sample 4.

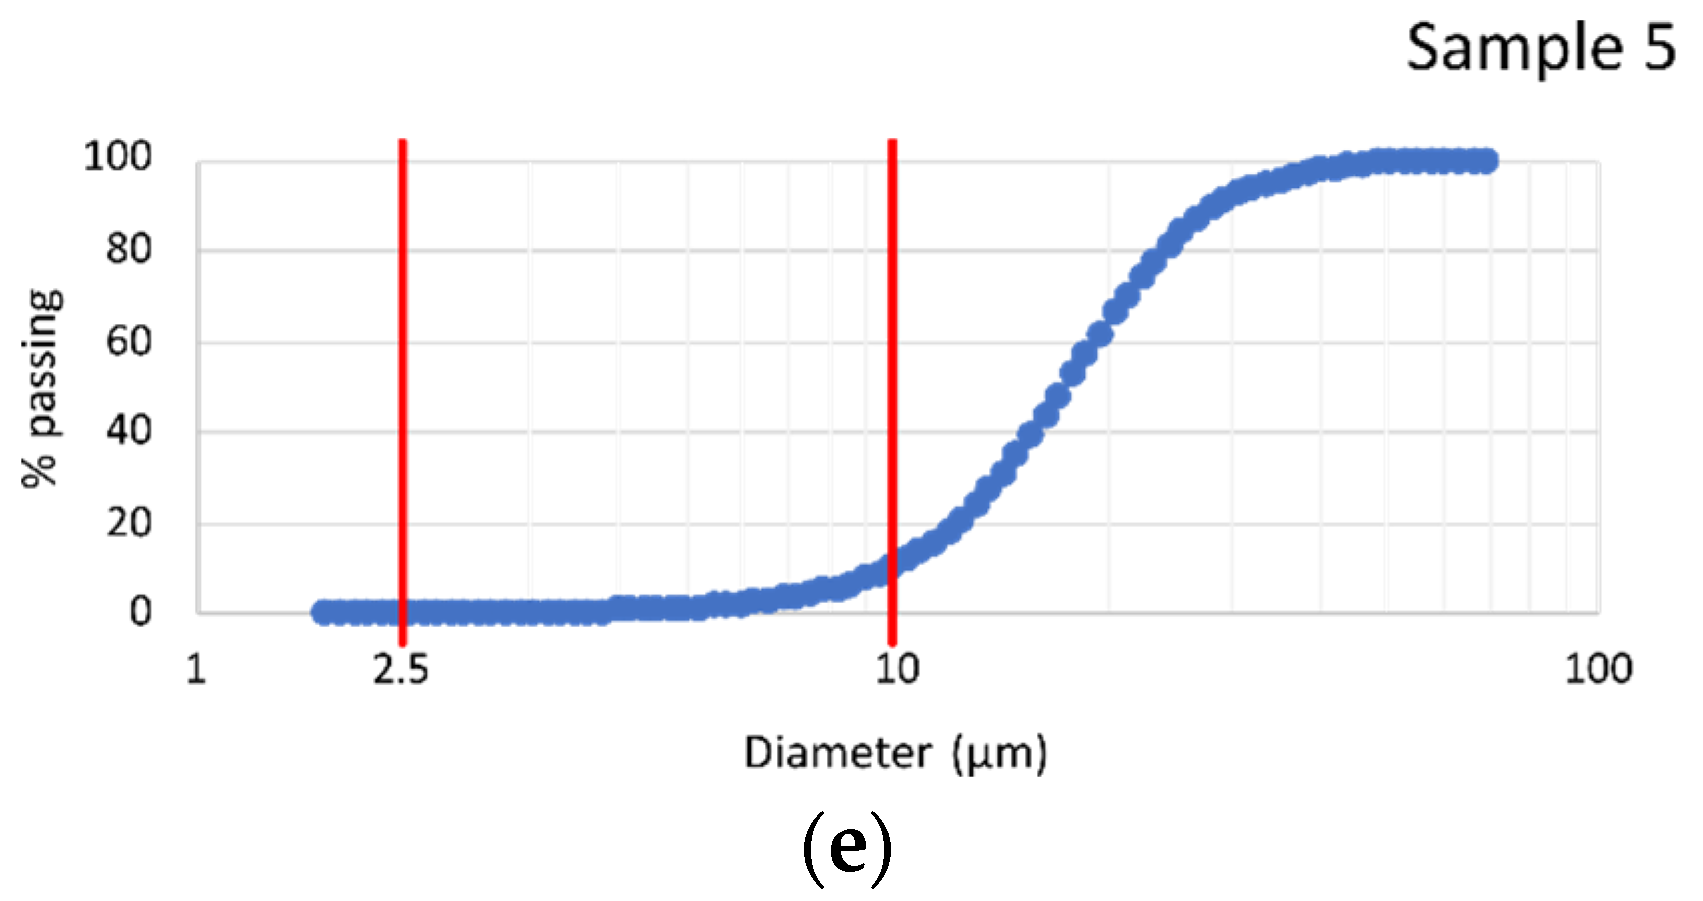
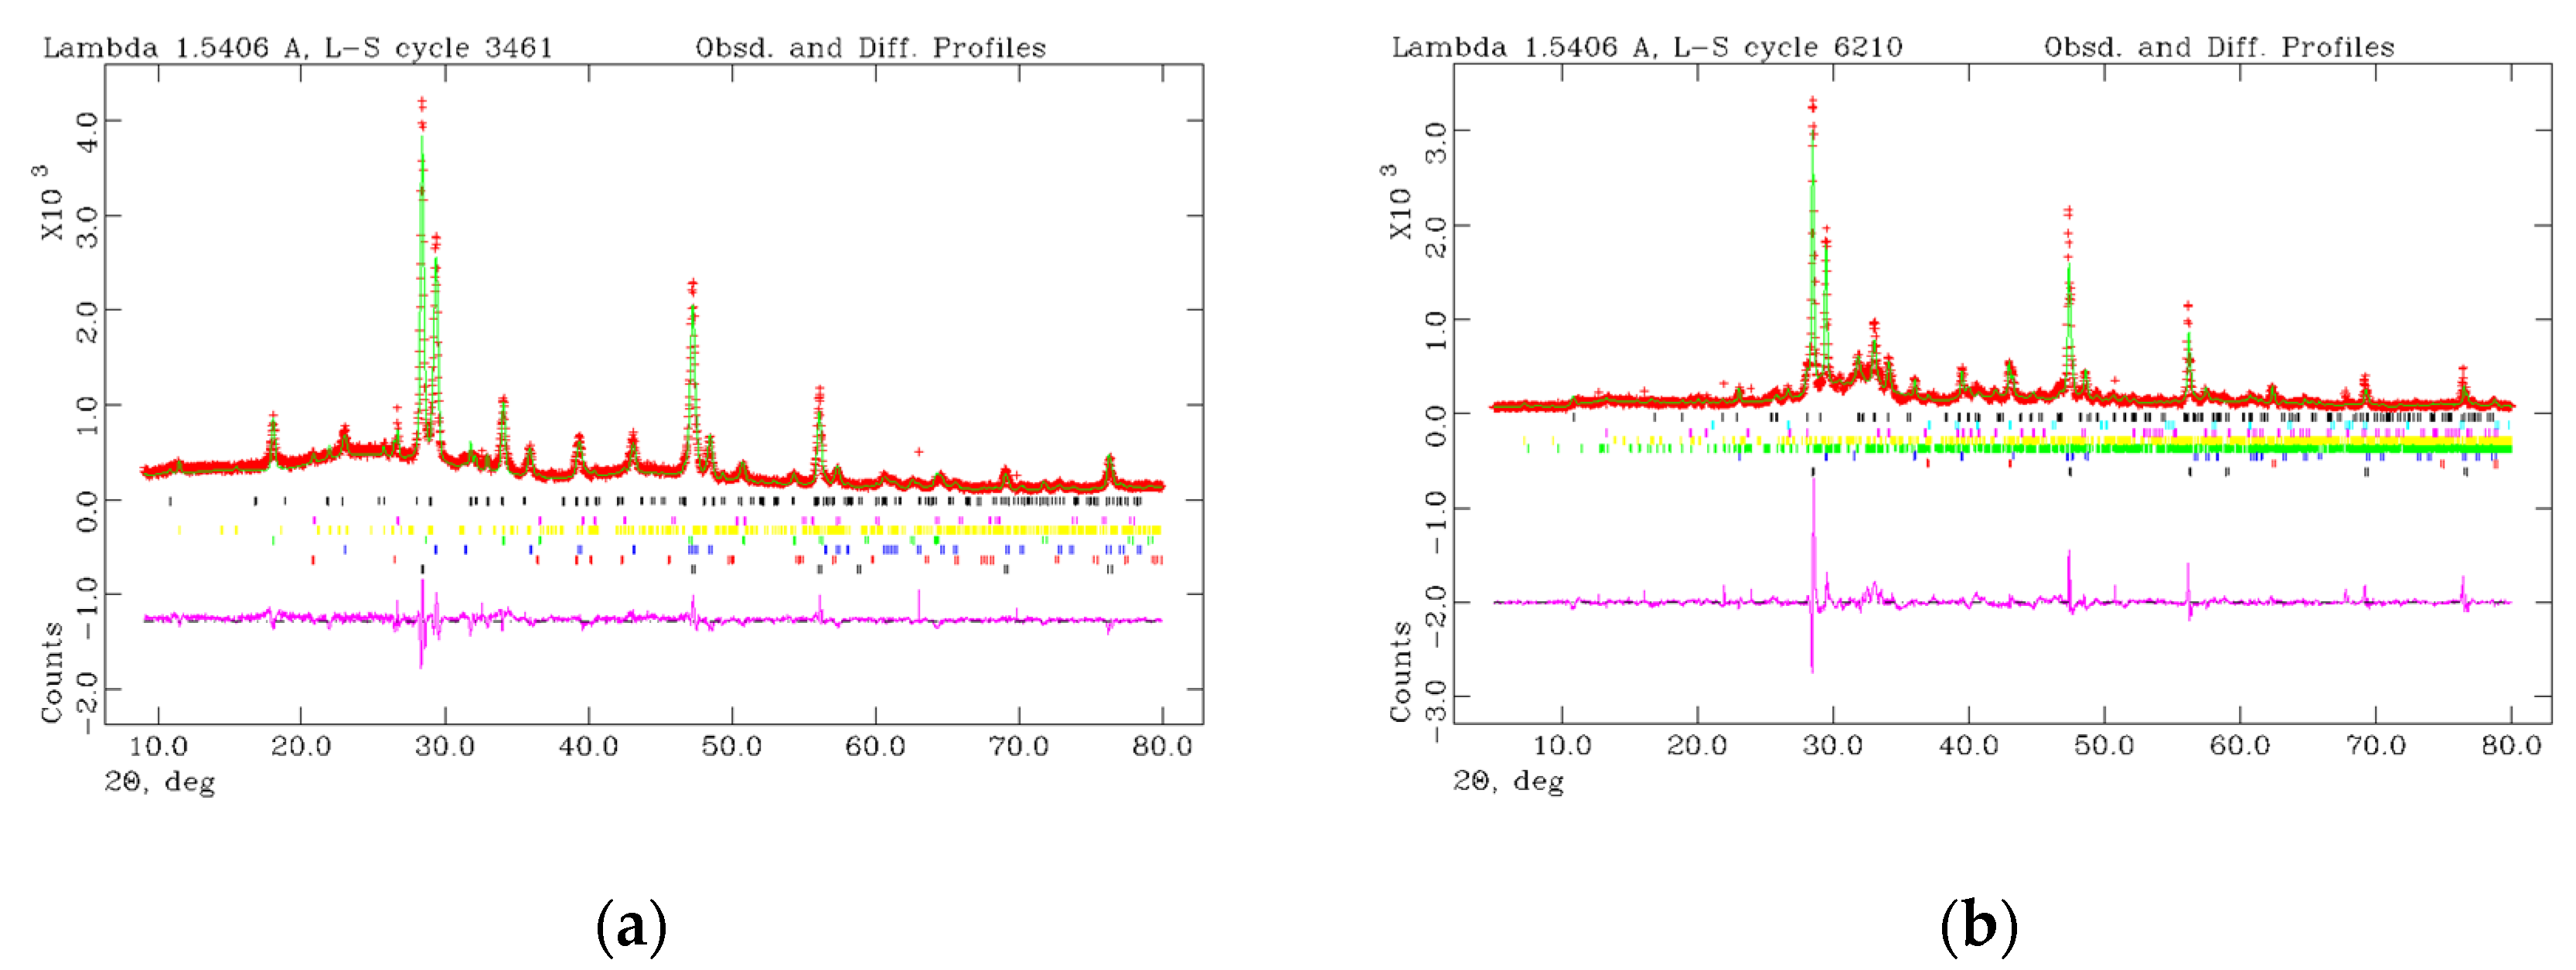
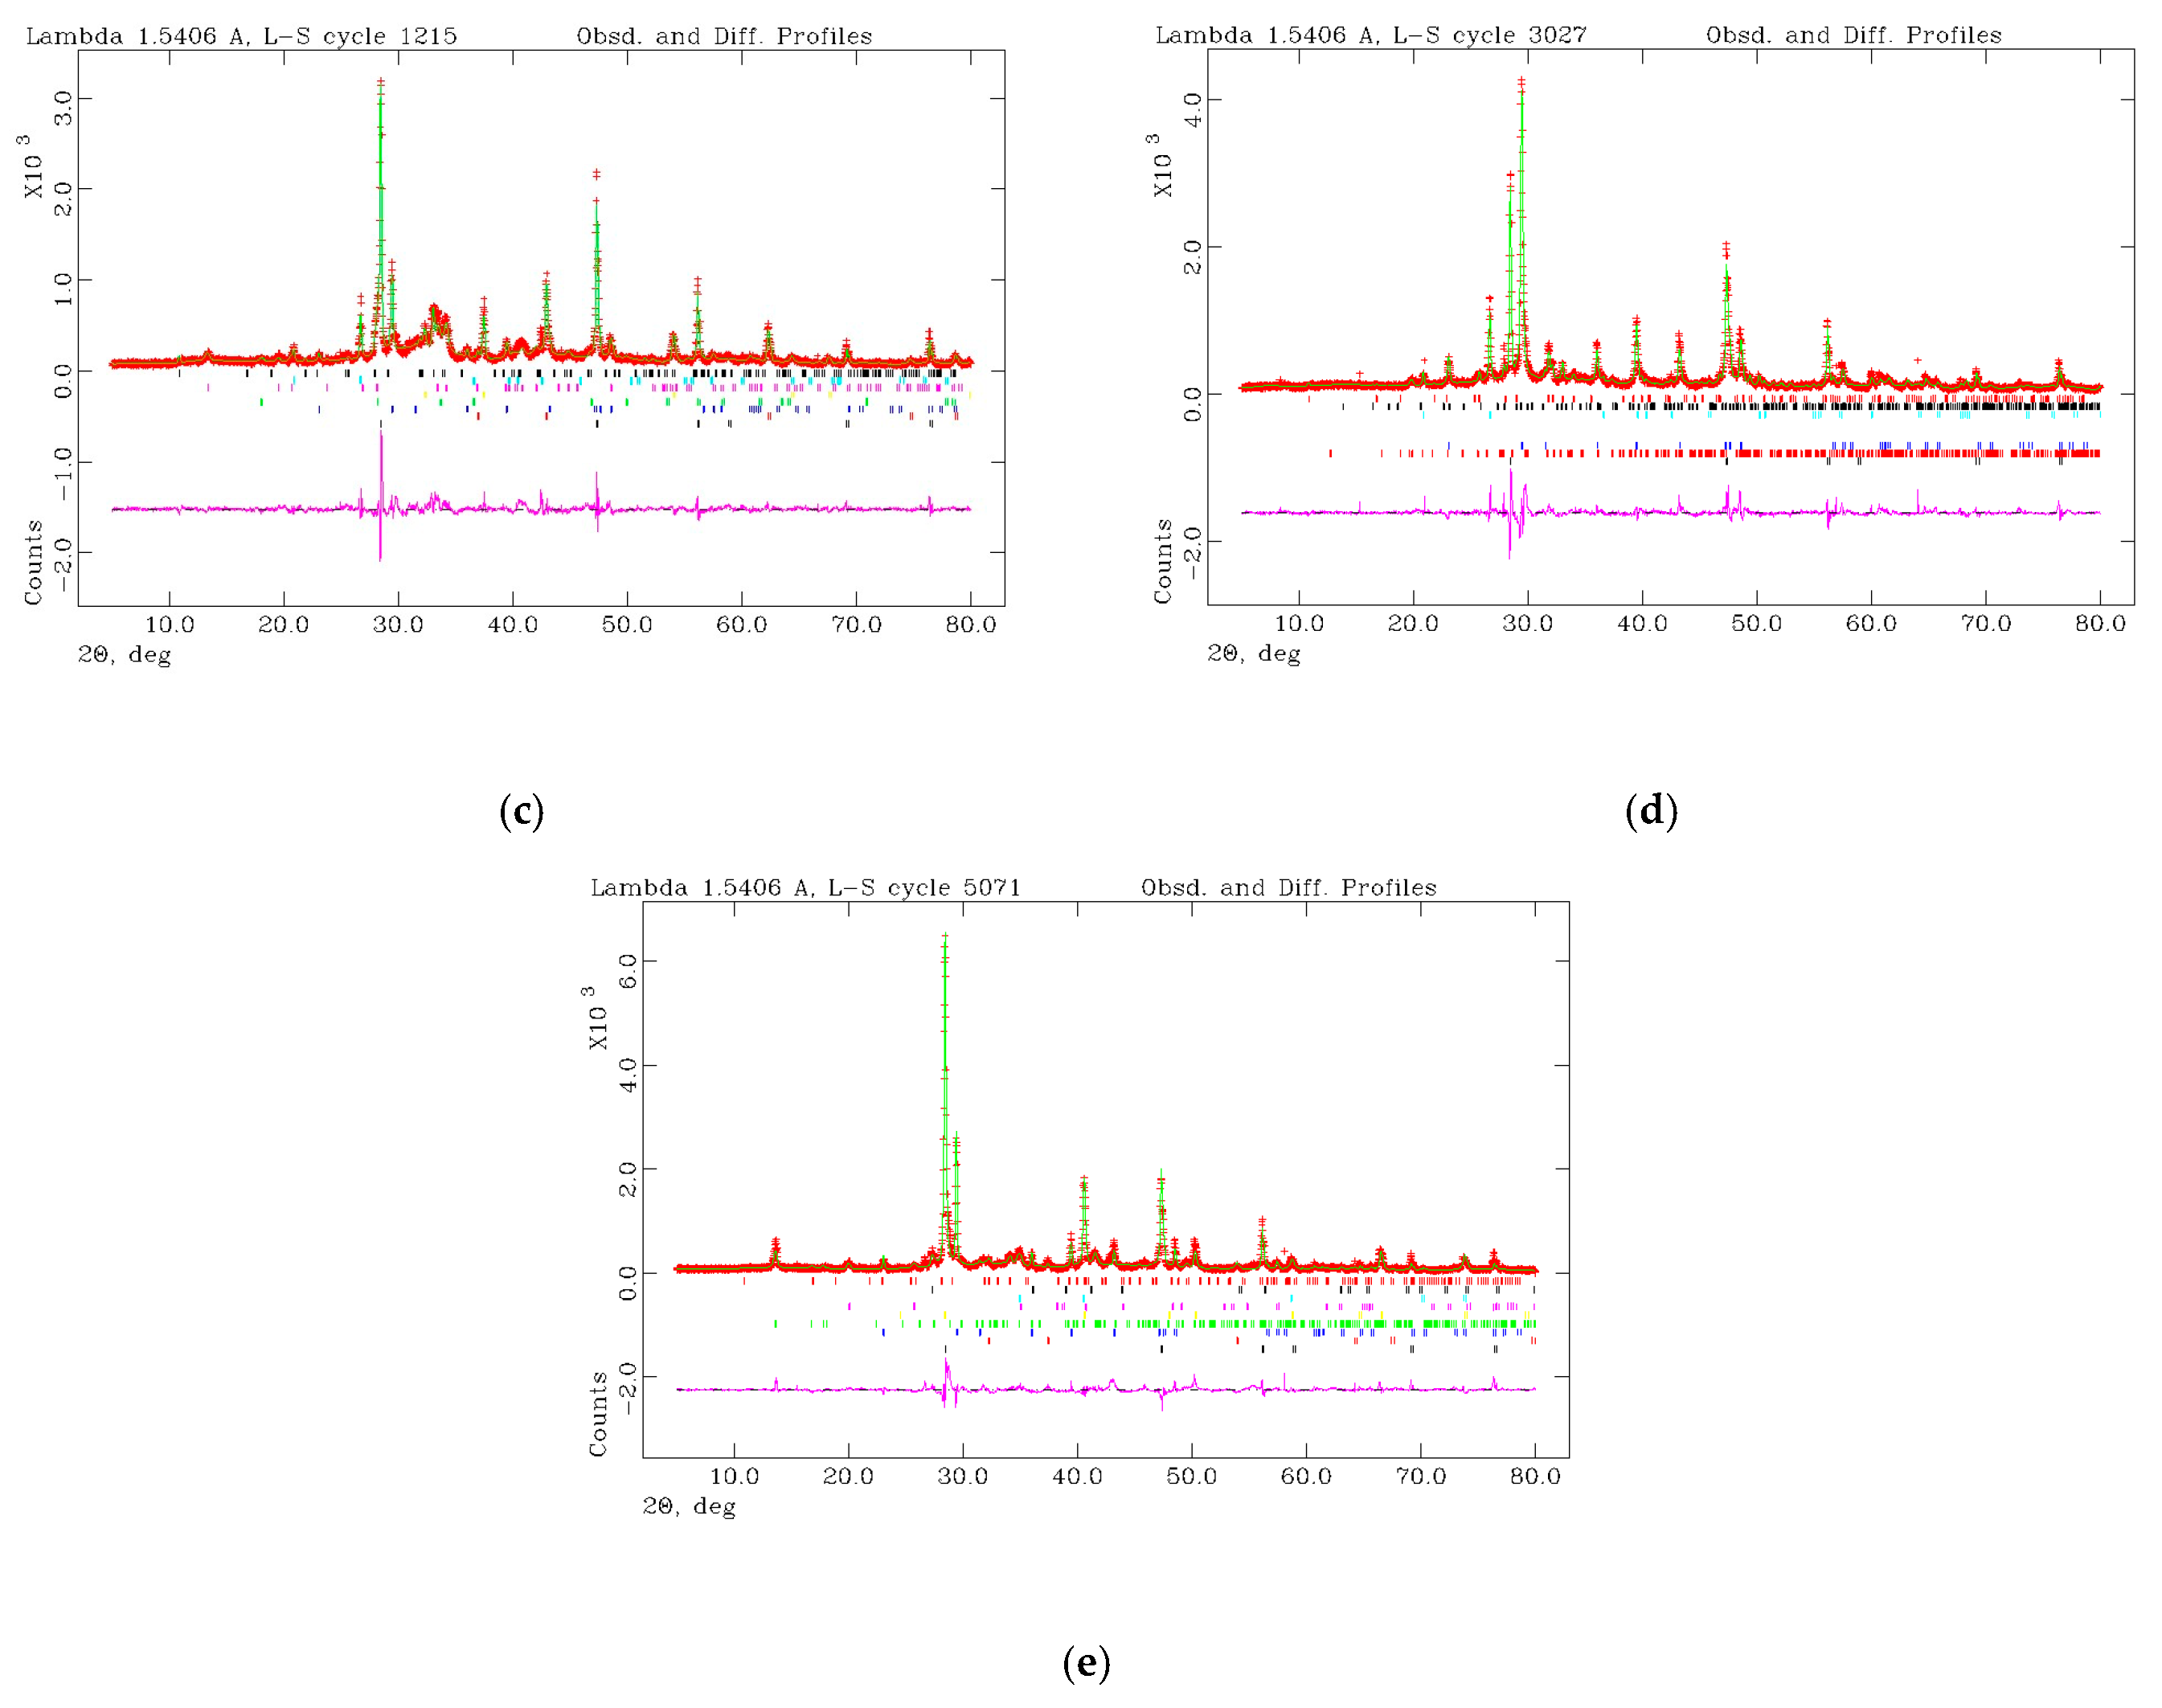
3.2. X-ray Diffraction Results

The quantitative mineralogical composition, as well as the amount of amorphous components, are reported in Table 2, whereas Figure 2 shows the X-ray diffraction profiles collected and calculated with Rietveld analyses. In particular, in the graphs, the red crosses represent the data collected and the green lines represent the calculated best-fitting profiles, obtained by adding in the refinements of the minerals reported in Table 2. The theoretical peak positions of each mineral are reported under the profile, i.e., each horizontal line with different bars represents the theoretical peak position for that mineral. The lowest bar line reports the theoretical peak position of metallic Si, added to each sample as an internal standard for the quantitative analysis. The pink profile in the lower part of each graph represents the difference profile generated by subtracting the measured profile from the calculated one [24].

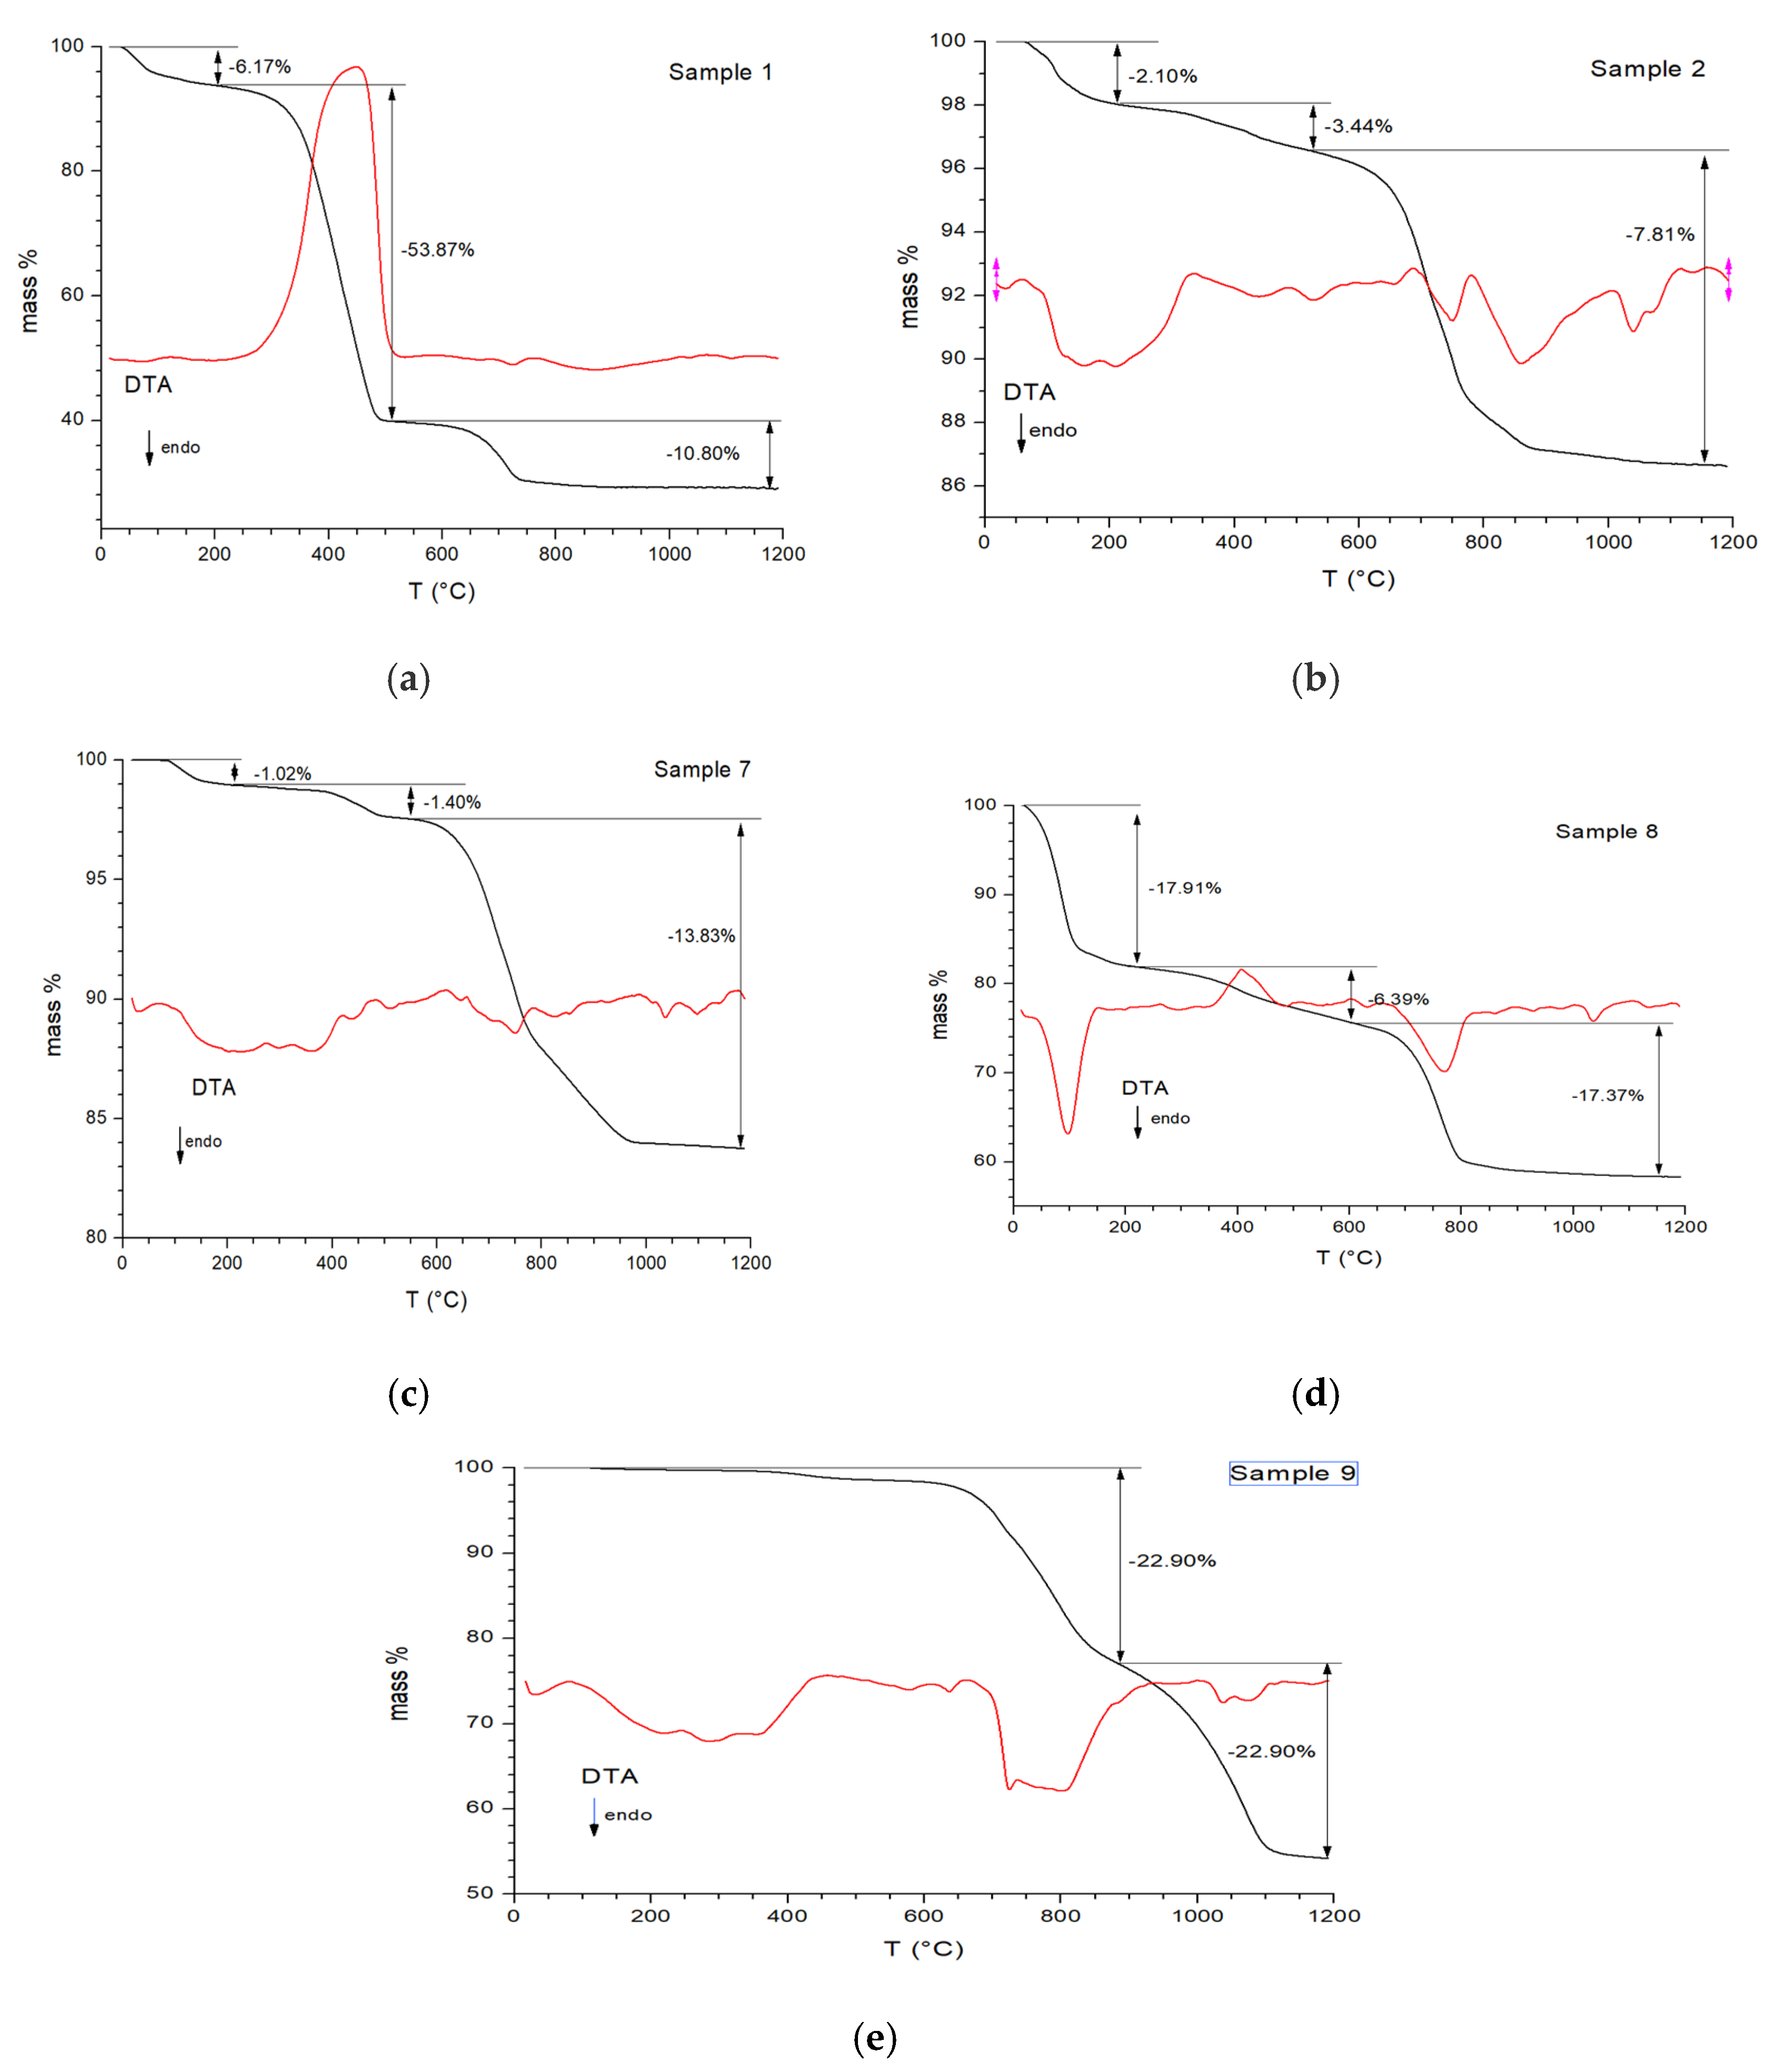
3.3. Thermal Analysis Results

The thermal analysis of the five investigated samples showed relevant differences for the weight losses. The results are given in Figure 3.
The first steps in the TGAs, at approximately 100 °C, demonstrated weight losses between 1 and 18 wt%, which were observed in all the samples excluding sample 5. These corresponded to endothermic peaks in the DTA (Figure 4) and can be associated with the loss of hygroscopic water, absorbed after the combustion of oxides [26]. In sample 1, at approximately 400 °C, there was a weight loss of about 50 wt%, corresponding to an exothermic peak in the DTA spectra and associated with the combustion of residual organic matter.
The step at approximately 600 °C could have been related either to the well-known carbonate decomposition reaction (CaCO3 to CaO + CO2) or to the decomposition of calcium-phosphates (Ca3(PO4)2 = CaO + P2O5 or K3PO4 = 3K2O + P2O5) where the phosphorous pentoxide is lost as gas.
On the whole, the total mass losses between 20 and 1200 C varied from 13.38 in sample 2 to 70.84 in sample 1.

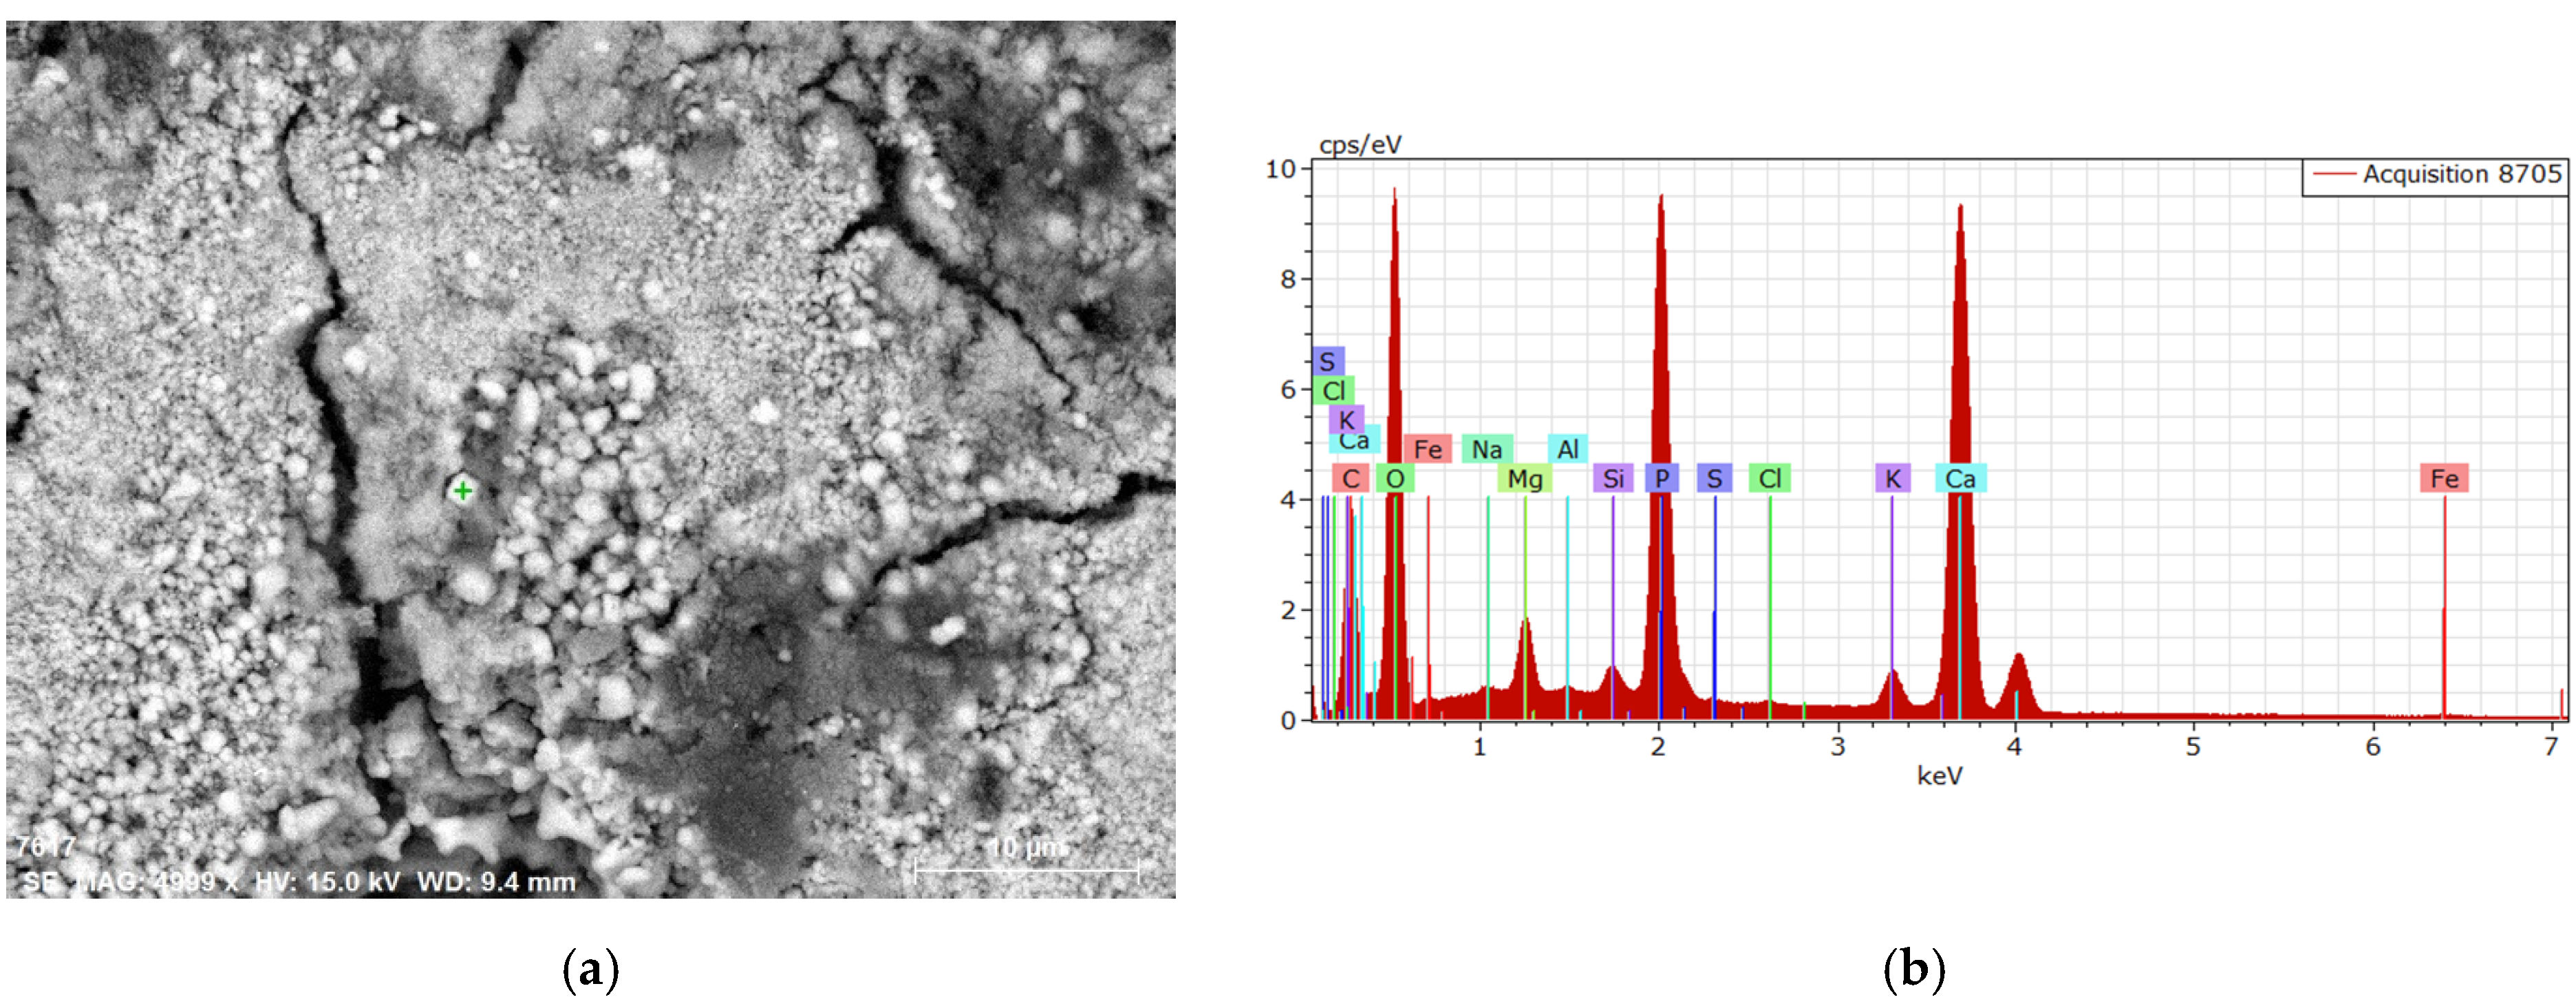
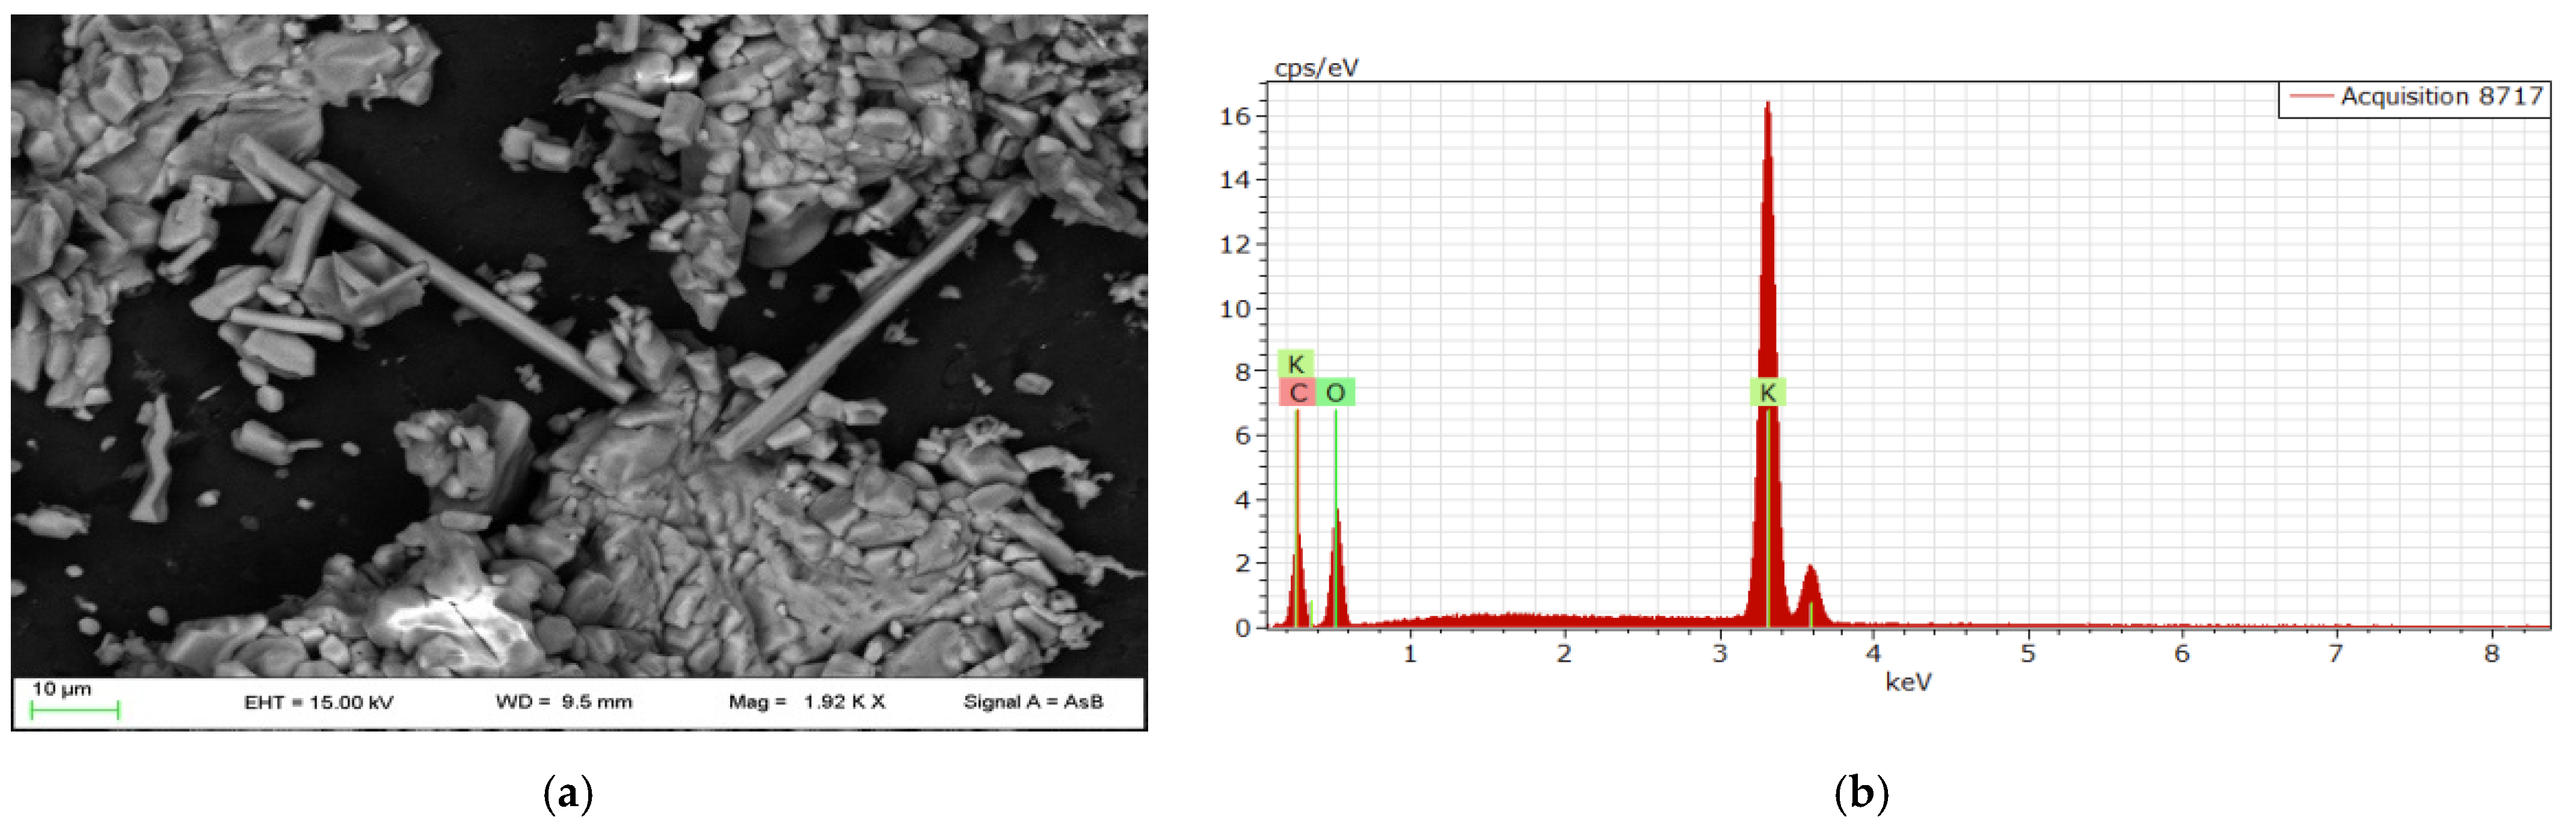
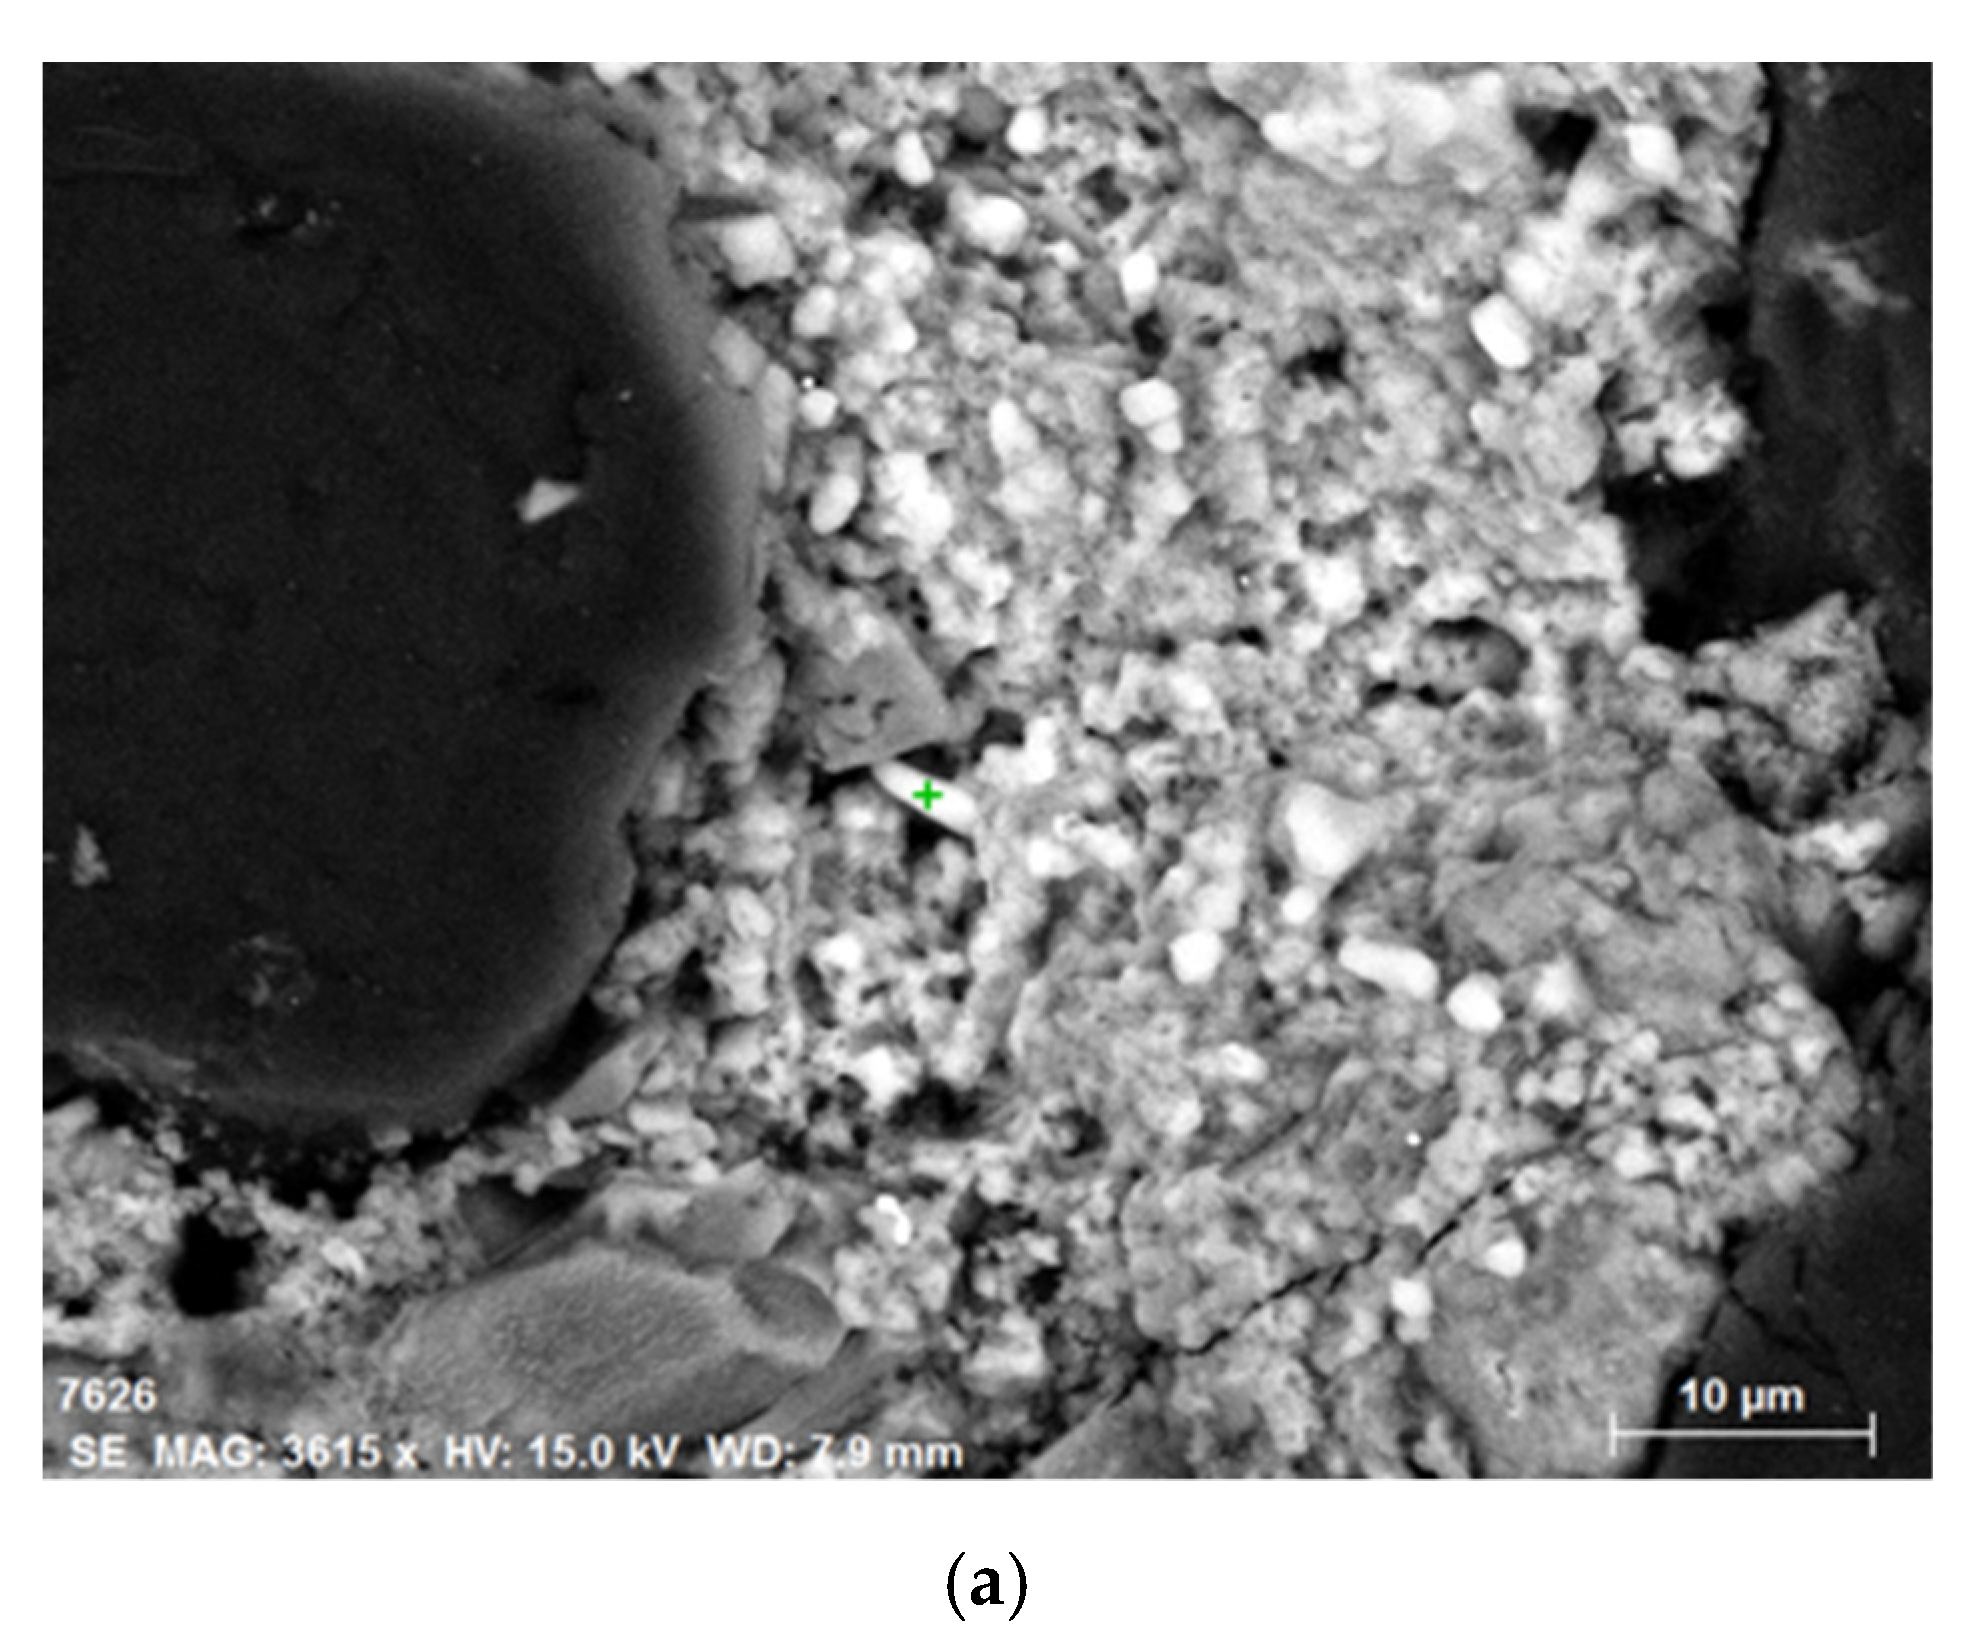
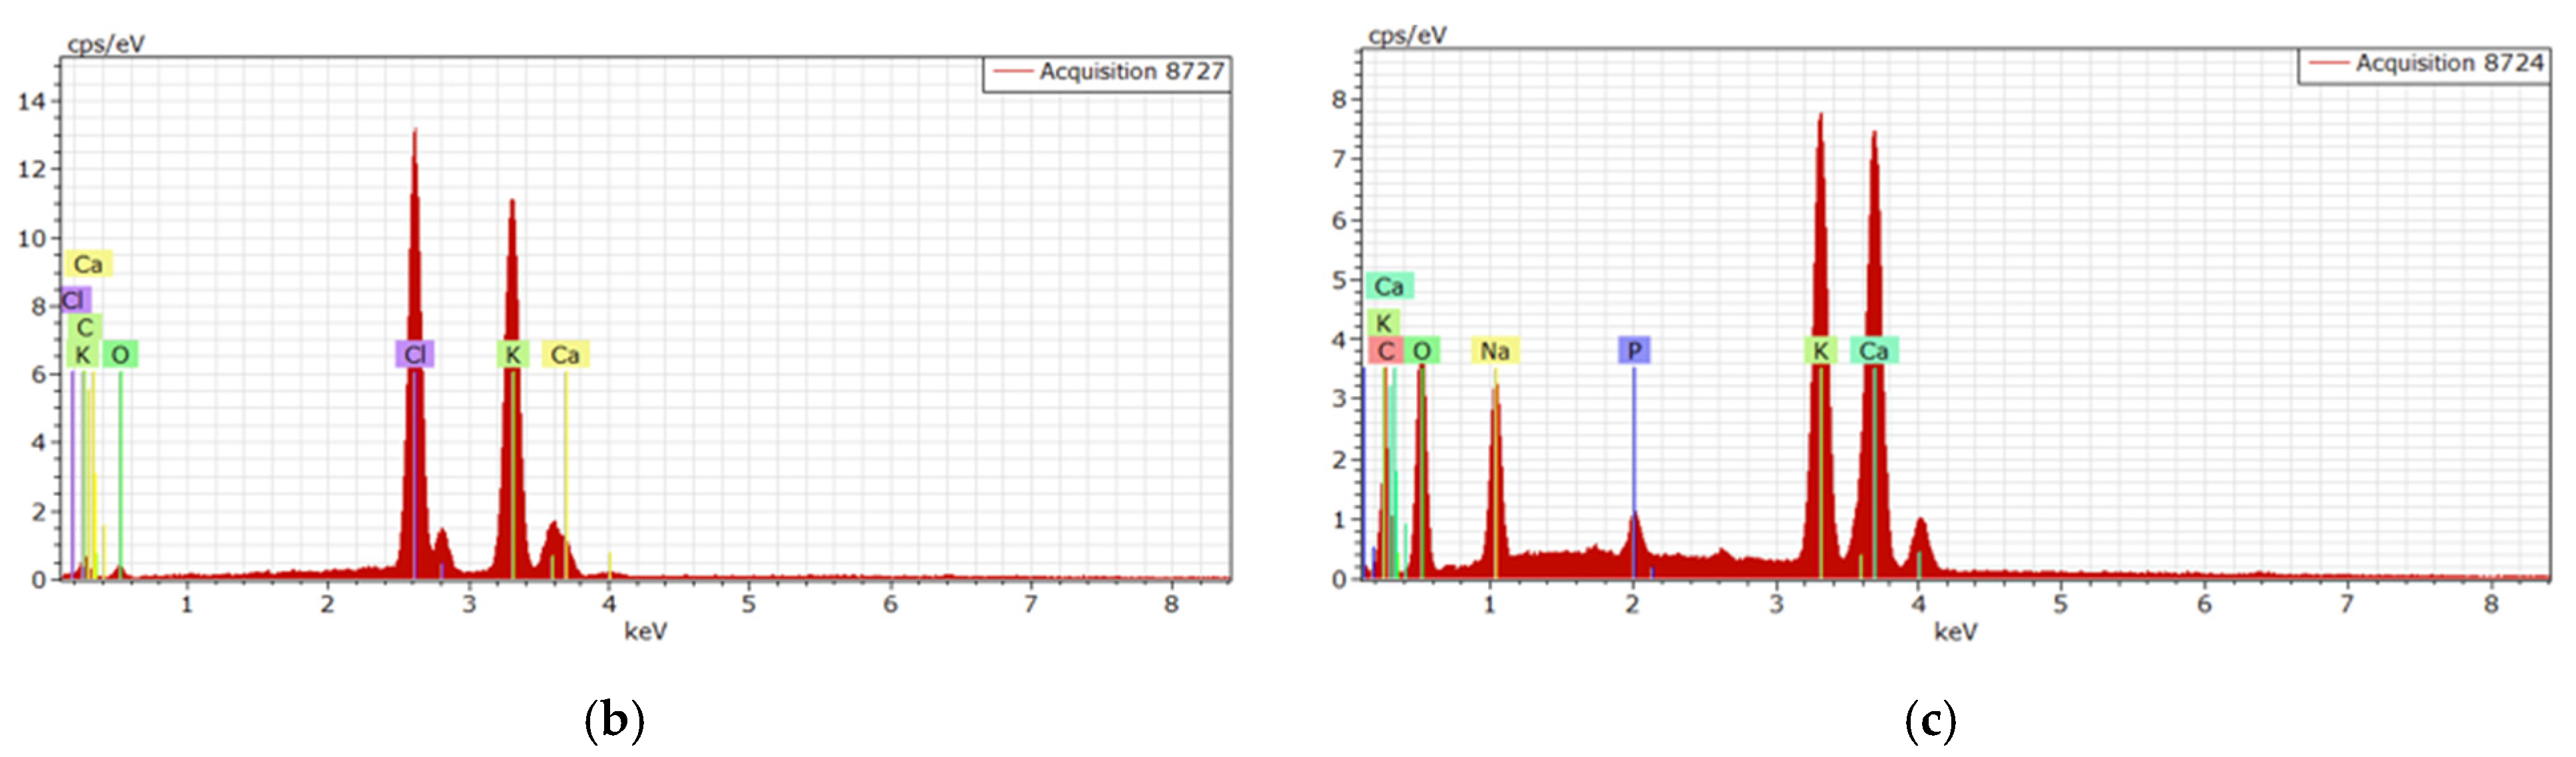
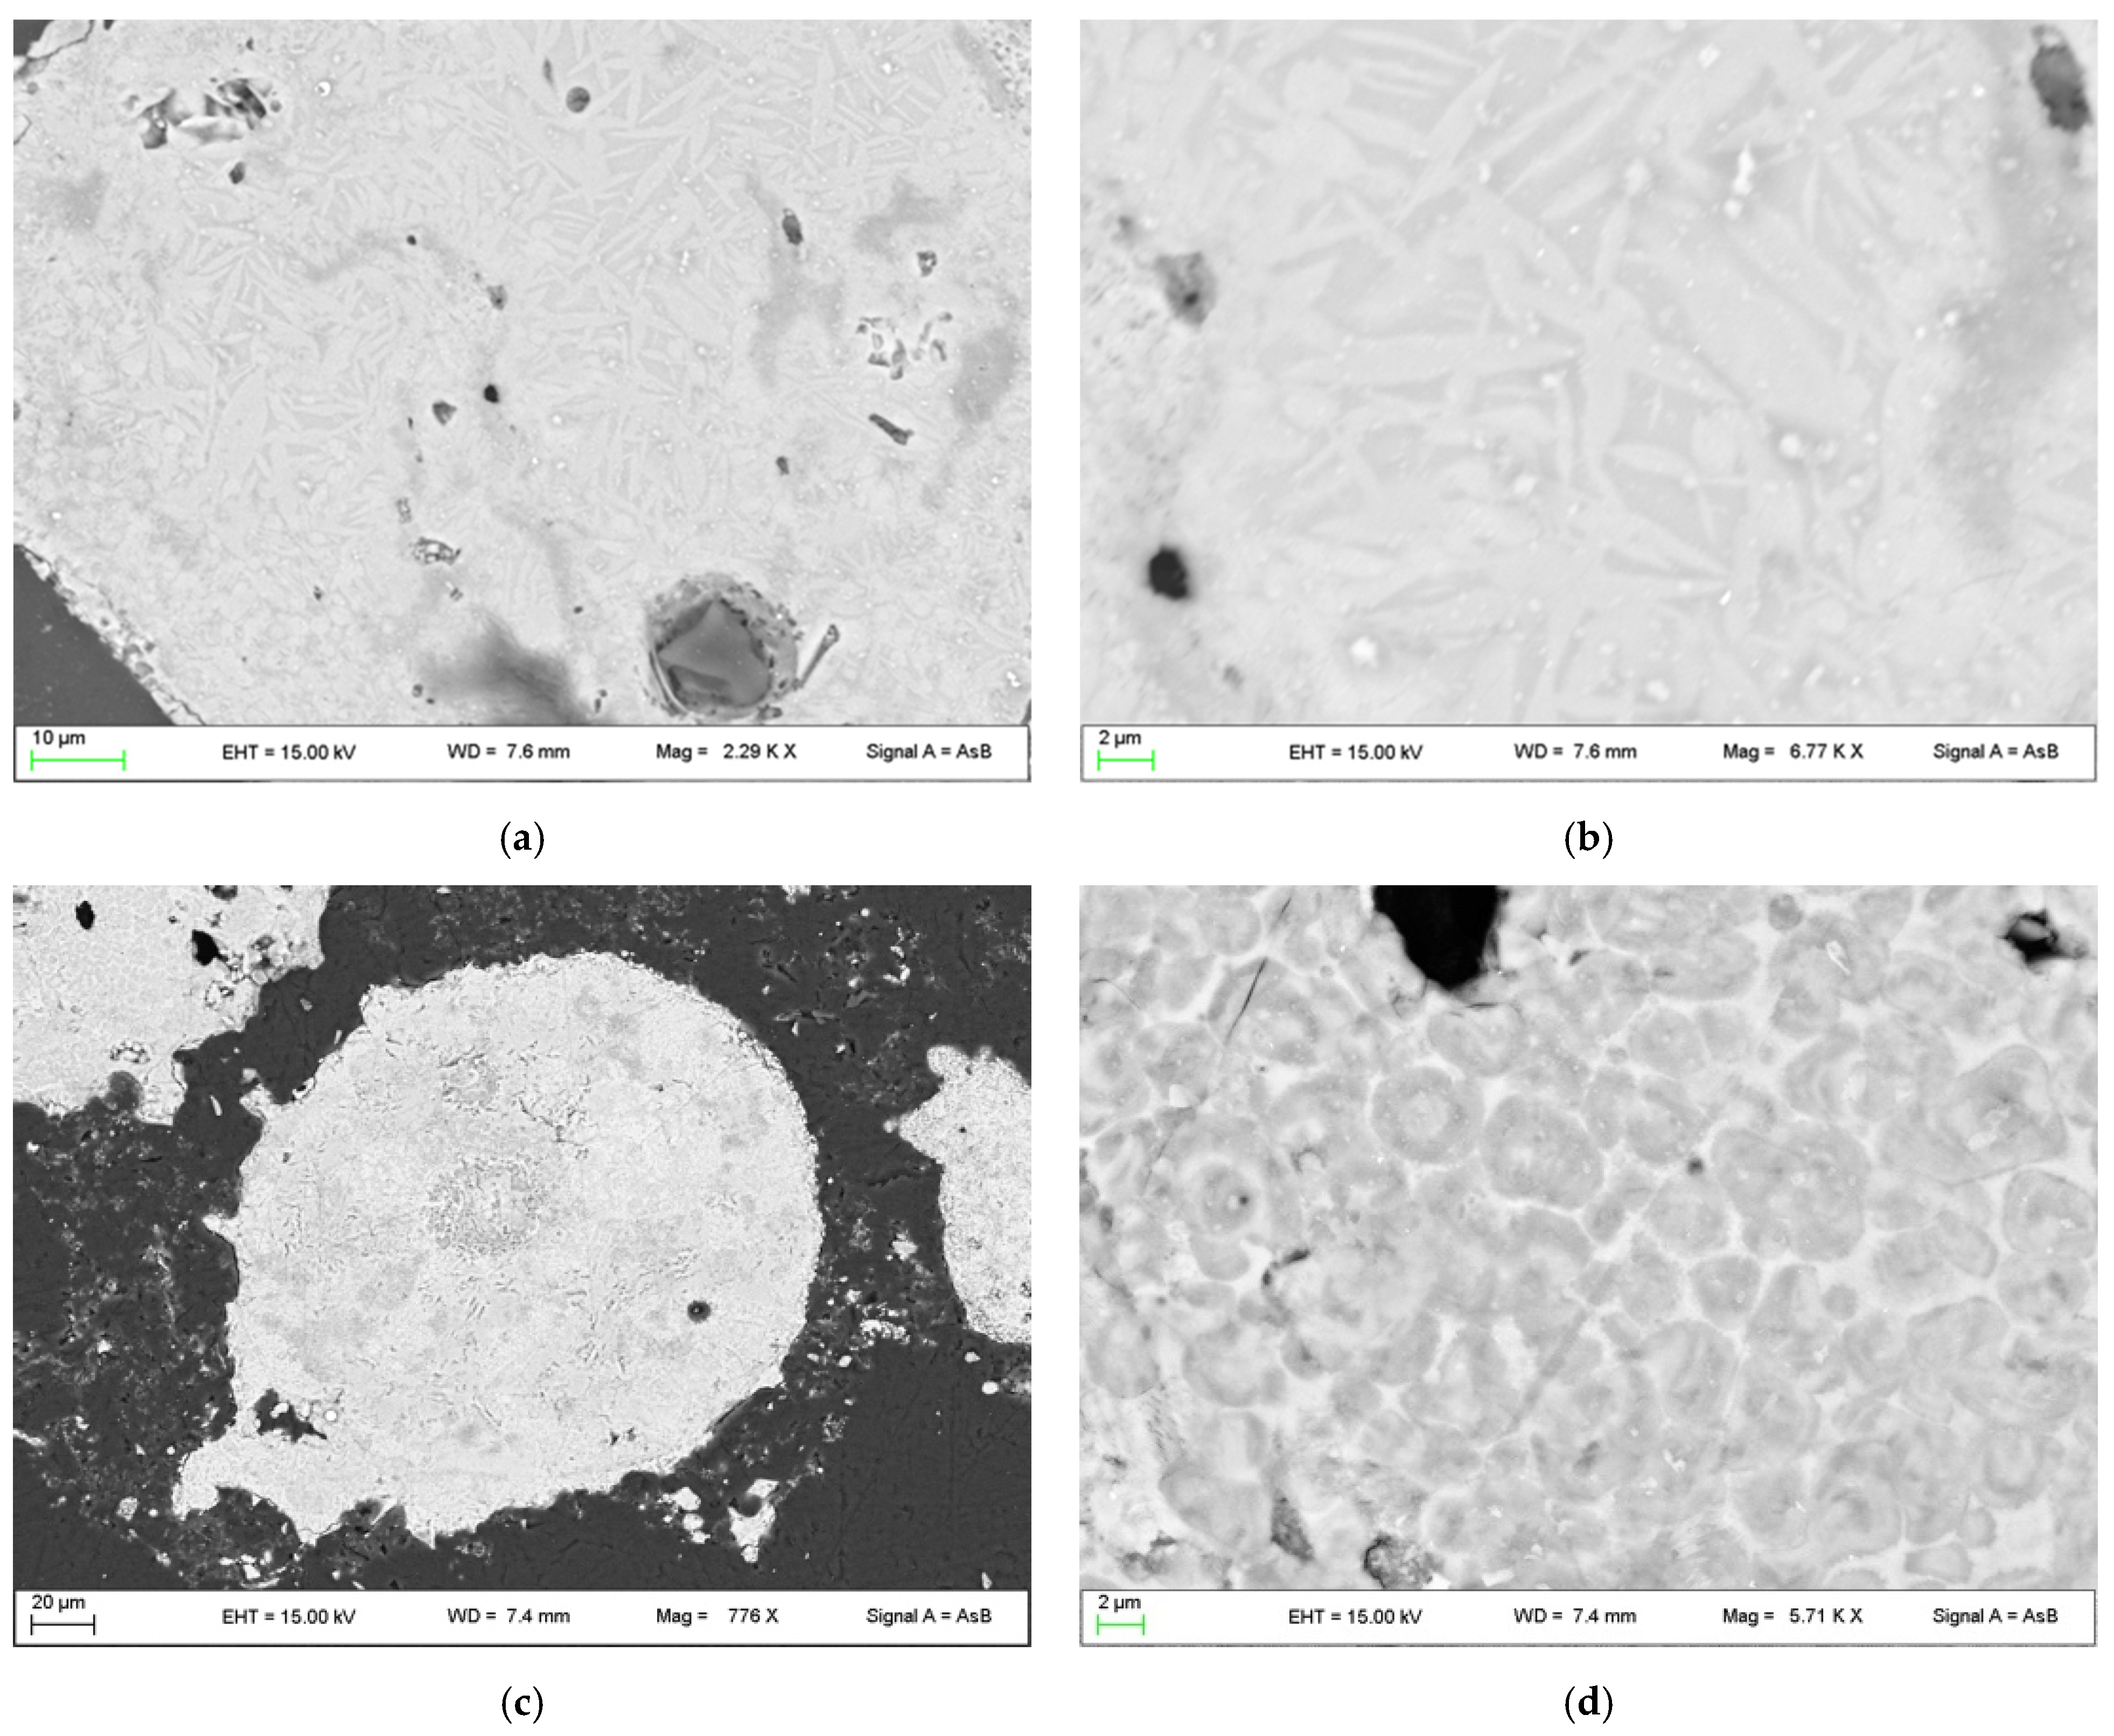
3.4. Electron Microscopy Results

The results of the FE-SEM analysis coupled with EDS semi-quantitative chemical analysis are shown in Figure 5, Figure 6, Figure 7 and Figure 8, with interesting textural features shown together with some of the accessory minerals also found by XRPD analysis. Apatite crystals appeared as roundly shaped at sub-micrometric to deci-micrometric sizes (apatite in samples 2 and 5, Figure 5 and Figure 7). Moreover, elongated K2O and KCl crystals are shown in samples 4 and 5 (Figure 6 and Figure 7).
Interesting de-vitrification microstructures were also observed in sample 3 (Figure 8). In particular, windmill structures and neoblasts surrounded by glass are shown.

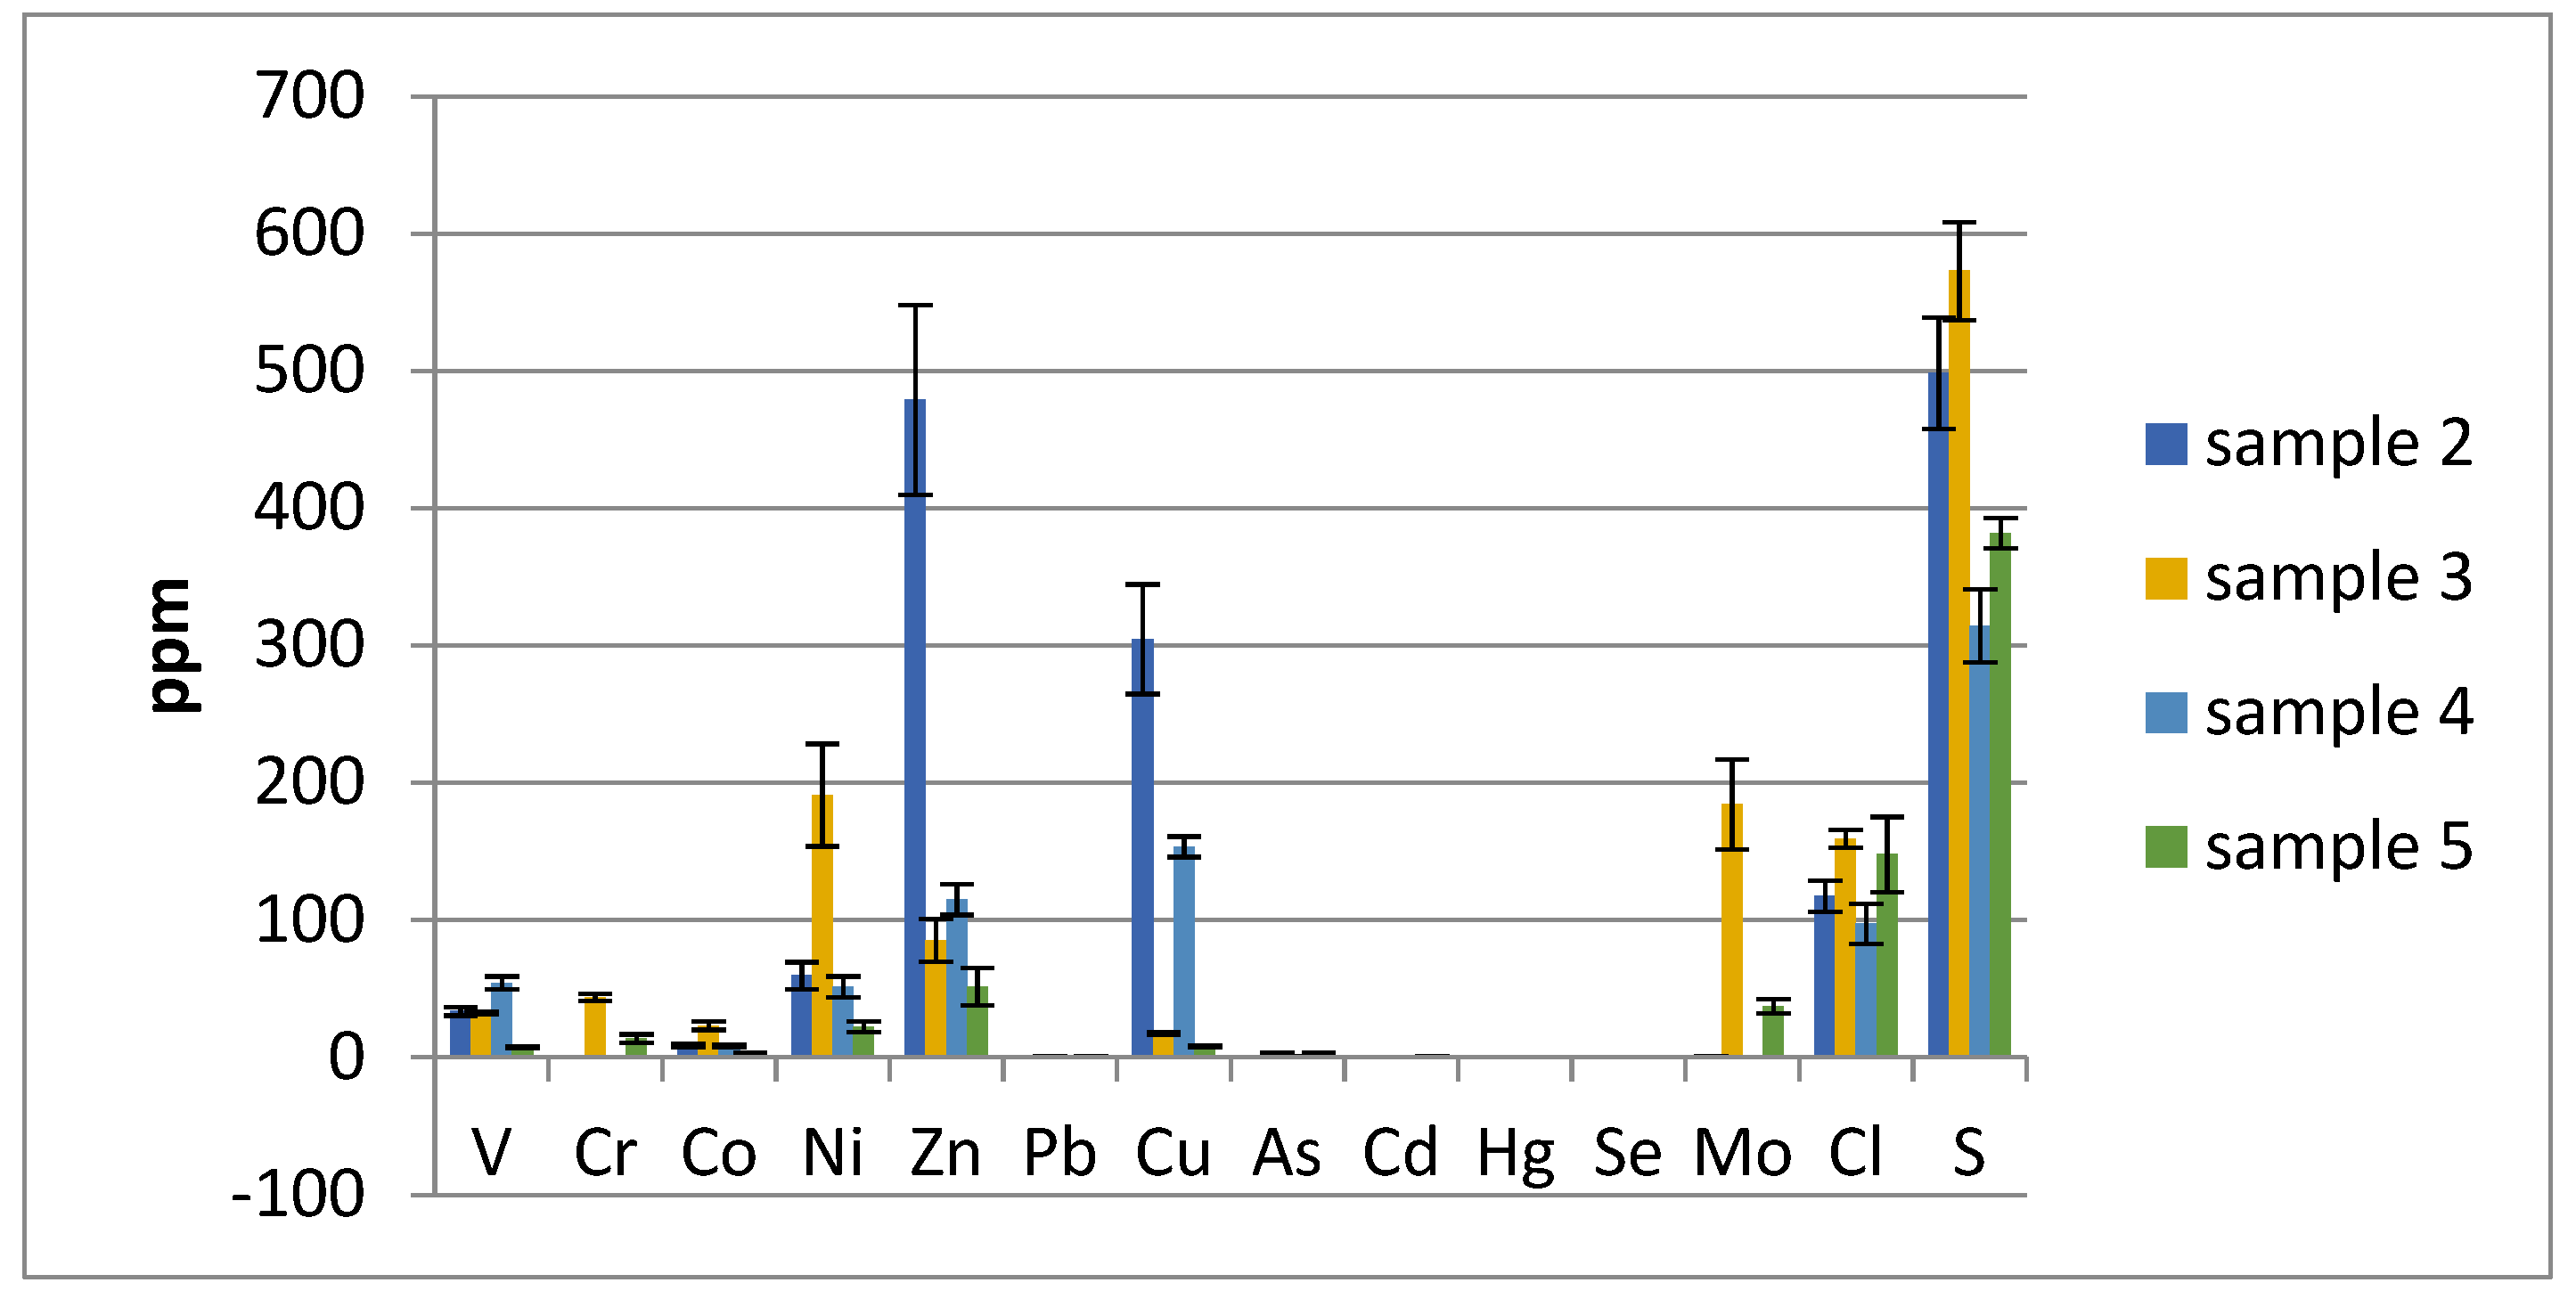
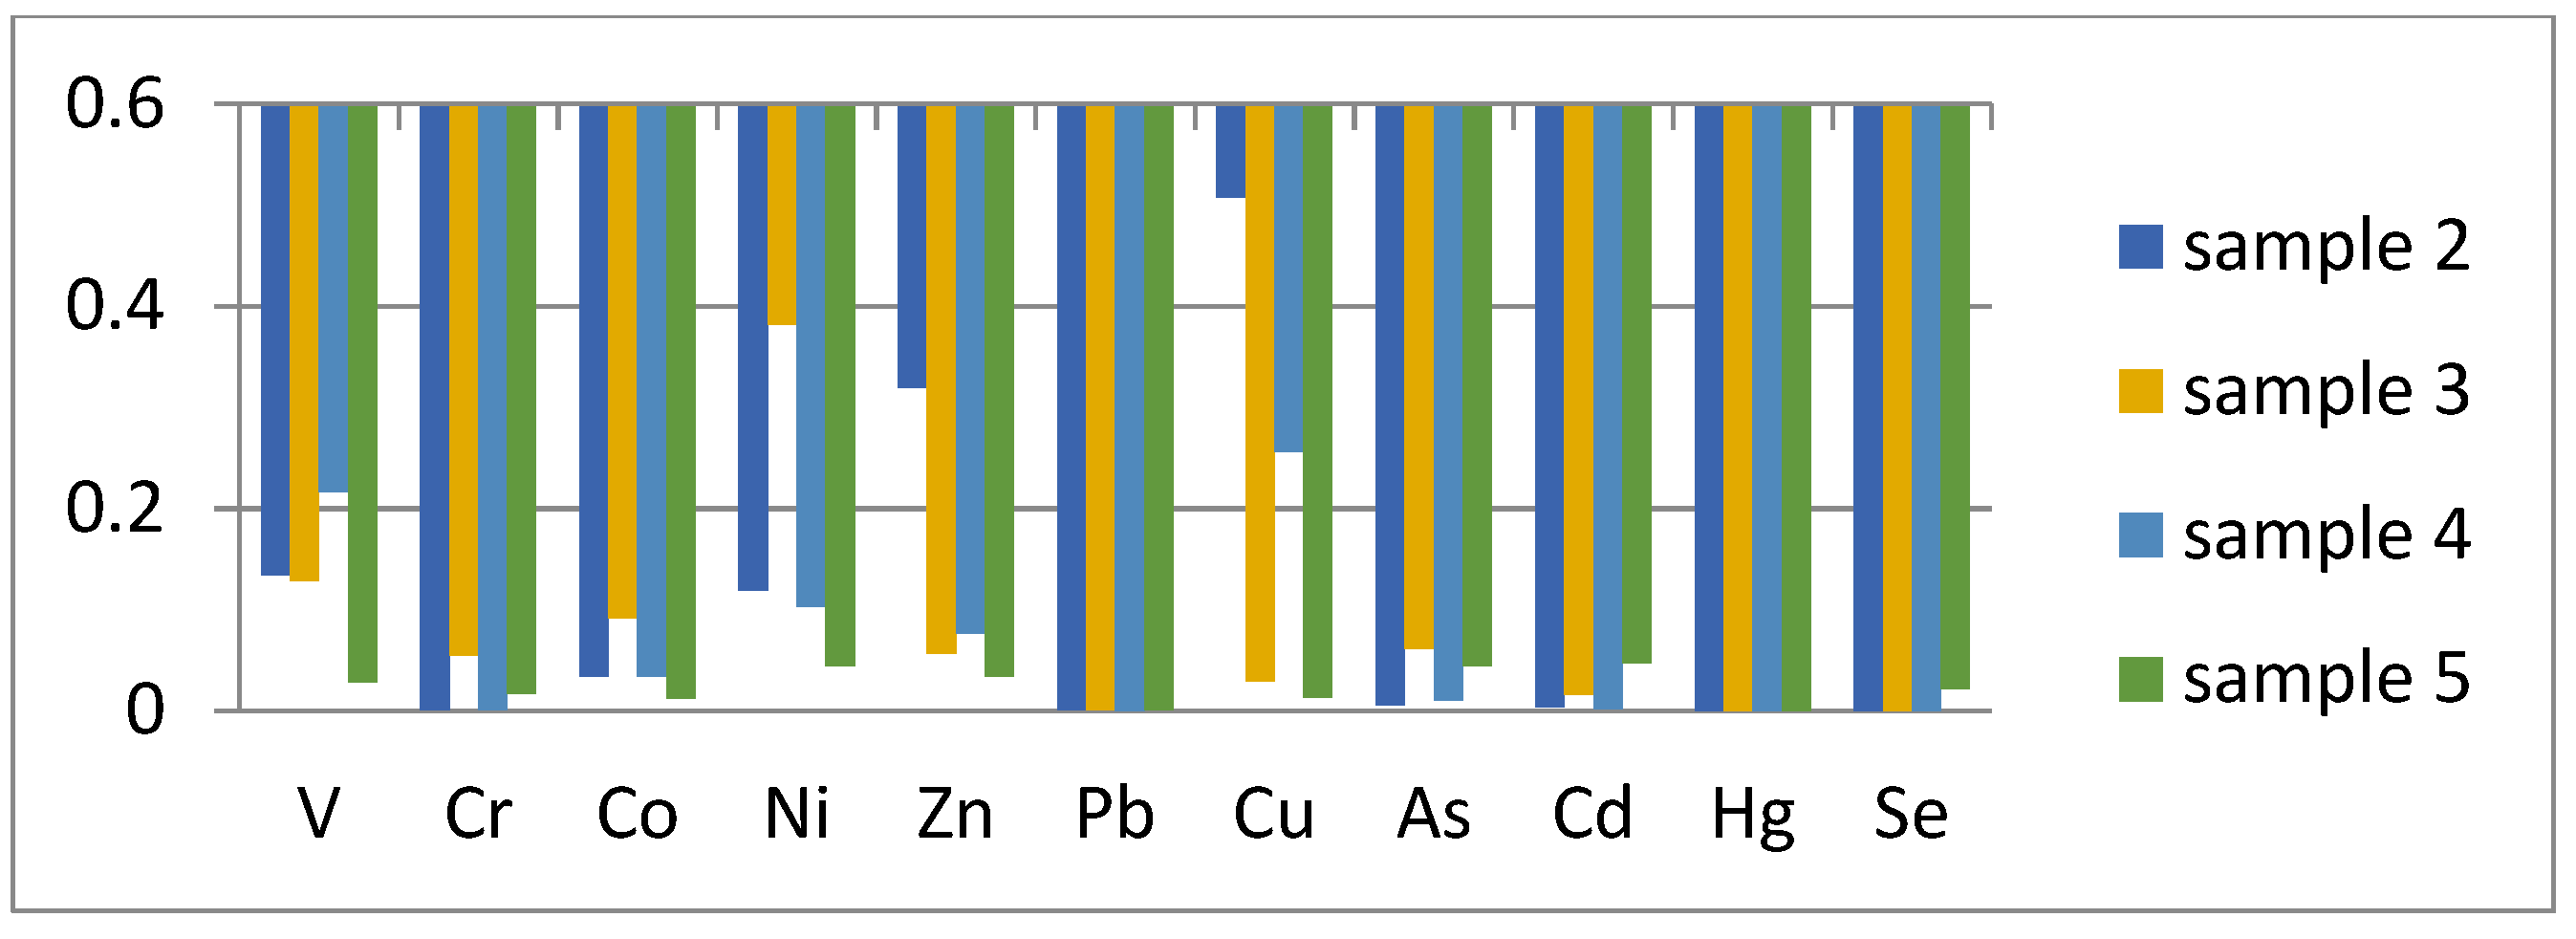
3.5. Chemical Composition Results

The chemical analysis of the major elements in the studied fly ashes (Table 3) indicated that the main component for all of them was CaO, followed by SiO2 and then Al2O3 or, in one case, by MgO. The component P2O5 was dominant for sample 2, reaching approximately 9 wt%, whereas for sample 4 the concentration of K2O reached 5 wt%.
These data fit well with the FE-SEM-EDS microanalysis, where several apatite microcrystals were found in sample 2 (Figure 5) and an elongated crystal of K2O in sample 4 (Figure 6).
Potentially toxic elements (PTEs), namely As, Cd, Cr, Cu, F, Pb, Hg, Mo, Ni, Se, V, and Zn, are naturally present in the environment [27] and some of them, in low percentages, can be essential for the correct metabolism of biologic activity. However, when their concentrations increase, they can become toxic. Their accumulation can be caused by anthropogenic activities, such as mining and industrial and agricultural activities [28], and is dependent on their mobility. For most of the PTEs, the mobility increases with the decrease in pH, very rapidly at a pH lesser than 7, whereas at higher pH conditions it slows down. Beyond the pH, other soil parameters, including the organic matter (OM), redox considerations, the chemistry of soil particles, and the composition of clay, affect the distribution, concentration, and mobility of PTEs. They are considered as hazardous contaminants due to their ability to intoxicate and become aggregated and persistent in the environmental media. For these reasons, several legislative decrees define the concentration limits for PTEs in urban and industrial areas.
Chemical analyses of PTEs are listed in Table 4 for samples 2, 3, 4, and 5. It was impossible to homogenize sample 1 as it burned during annealing even before melting. In Figure 9, the values of some selected PTEs (V, Cr, Co, Ni, Zn, Pb, Cu, As, Hg, and Se), together with Cl and S, are reported, as measured in the four analyzed samples of fly ashes.
The ratios of the measured concentrations of PTEs and the limit concentrations of these same metals for urban and industrial sites, following the Italian legislation (legislative decree 52/2006 Table 1 and Table 5, part V), are shown in Figure 10 and Figure 11, respectively.
All samples had PTE concentrations below the legislative limit for industrial sites and only sample 2 had Cu and Zn, and sample 4 Cu, with values above the legislative limits.
The total amount of the PAHs naftalene, acenaftene, acenaftilene, fluorene, fenatrene, antracene, fluoratene, pirene, benzoantracene crysene, benzo(b,k,j) fluorantene, benzo(e)pirene, benzo(a)pirene, indenopirene, dibenzo(a,h)antracene, and benzo(g,h,i)perilene (Table 5) were below the detection limits for all the investigated samples, with the exception of sample 1, which came from a gasification plant.

4. Discussion

The comparison of the multi-methodological analyses performed here on five samples coming from fly ashes of different vegetal biomasses allows us to outline the following considerations:
  • The PTE concentrations were evaluated for the potential human and ecological risks, since their accumulation increases the toxic hazard [29,30]. In all of the samples of fly ashes from biomasses, the PTE concentrations analyzed were below the limits indicated in Italian legislation. Moreover, the PAH content was undetectable for all samples with the exception of sample 1, which was a unique sample coming from a gasification plant.
  • Gasification is a process that converts either biomass [31] or fossil fuel-based carbonaceous materials into gases. The process consists of the reaction of the feedstock material, at high temperatures (typically > 700 °C) without combustion, via control of the amount of oxygen and/or steam present in the reaction. The resulting gas mixture is called syngas (from synthesis gas) or producer gas and its largest fraction is composed of nitrogen (N2), carbon monoxide (CO), hydrogen (H2), and carbon dioxide (CO2). Due to the flammability properties of the H2 and CO, syngas is itself a fuel. The thermal analysis performed in this work showed a strong weight loss, more than 50 wt%, at approximately 400 °C for sample 1. Indeed, during the process some material remained un-combusted, likely due to the large amount of PAH content in that sample.
  • The granulometric analysis indicated that the PM2.5 fraction, namely the amount of particles with average dimensions below 2.5 μm, which can represent a danger to human health due to their potential of being inhaled, was significantly lower than 1%; the amount of particles with diameters less than 10 μm was quite different, varying from 5% in sample 5 to 40% in sample 4.
  • The high phosphorous content, as an apatite mineral, as well potassium content, as a sylvite mineral, suggests that these materials may represent good amendments for agricultural lands once the bioavailability of these elements is proved and verified. The electron microscopy analysis showed that the crystals usually have very small dimensions, from the nanometer scale to a few microns. Moreover, the Rietveld analysis indicated that the amorphous content in all samples was very high, ranging from 47.6 wt% in sample 1 up to 84.7 wt% in sample 5. Both the above-mentioned characteristics are good indicators of a large reaction surface, one the most important parameters for bioavailability.
  • The high Ca content revealed by the chemical analysis did not have a counterpart in the mineralogical composition of the samples, as relevant amounts of Ca minerals were not observed in the XRPD data processing. Thus, the high Ca content is supposedly stored in the amorphous phase, which was quite abundant in the studied fly ashes.
  • The high Ca content measured in the samples suggests that these materials can be used as amendments in soils, usually clayey soils, with low geotechnical properties. In these soils, the traditional addition of CaO, coming from the decarbonation reaction of carbonate minerals, improves the mechanical properties as pozzolanic reactions induced by the highly alkaline environment promote the formation of new binding compounds such as calcium silicate hydrate minerals (C-A-H; C-S-H) [32,33,34]. In a high pH environment, natural pozzolanas, rich in silicon and amorphous phase, promote pozzolanic reactions as they increase the availability of silicon and alumina [35]. The large amount of amorphous content, evidenced by the Rietveld analysis, and the chemical compositions of the analyzed ash samples suggest that at least some of them could be successfully used in combination with or as substitutions for traditional binders in soil stabilization. Such use would require the environment to reach the alkalinity needed to promote pozzolanic reactions, with or without the addition of alkaline activators, which are normally used for soil treatment by means of fly ashes [35].

5. Conclusions

The addition of Ca from fly ashes in soil with poor geotechnical properties may represent a good example of end of waste. In fact, in this way, two waste materials, namely fly ashes and clayey soils, can be reconverted into a good second-generation product, thus avoiding the removal and transport of the soils and the opening of new caves for the extraction of carbonate, as well as reducing the CO2 emissions from transports and de-carbonatation reactions.
The present study indicates that the dimensions and the chemical compositions of the studied fly ashes, namely the low concentrations of PTEs and PAHs (with the exception of the sample from the gasification plant), as well as the high CaO content in the amorphous fraction, represent favorable factors that can enhance interest in the applicability areas of these products. In fact, biomass fly ashes could be used as amendments in clayey soils to substitute for lime and stimulate pozzolanic reactions and improve their geotechnical properties. Further experiments to check the effect of the addition of fly ashes with high CaO content in clayey soils are in progress.
Moreover, the application of P fertilizer in intensive crop and animal production systems has increased pressure on finite global reserves of phosphate rocks [36], and their availability worldwide has recently drawn important criticisms due to both the high depletion of natural reserves and their geo-localization in limited areas.
Biomass fly ashes demonstrate high levels of phosphorous and potassium contents, which are present in nano/micro-crystals (as shown by electron microscopy) that biomasses have assimilated during their life cycle. The possibility that biomass fly ashes could be used as agricultural fertilizes opens an interesting perspective on a new and ecological source of K and P.
The above-mentioned scenarios fit well with the principles of the circular economy, in which waste materials, such as biomass fly ashes, could be recycled and used as second-generation products, thus avoiding the need to mine natural raw materials, such as carbonated and phosphate rocks.

Author Contributions

Conceptualization, P.C., F.C. and G.C.; methodology, P.C., A.Z., U.S., G.C., R.V. and C.C.; validation, A.Z., U.S. and P.C.; resources, P.C.; data curation, P.C., A.Z., U.S., G.C., R.V, P.C., A.Z. and C.C.; funding acquisition, P.C. All authors have read and agreed to the published version of the manuscript.

Funding

This research was founded by the Fondazione Cassa di Risparmio di Perugia (Italy) with the title: Ceneri da biomassa e da carbone: possibili reimpieghi e strategie di bonifica. Project number: #2018.0508.

Institutional Review Board Statement

Not applicable.

Informed Consent Statement

Not applicable.

Data Availability Statement

The data presented in this study are available on request from the corresponding author.

Conflicts of Interest

The authors declare no conflict of interest.

References

  1. Torquati, B.; Marino, D.; Venanzi, S.; Porceddu, P.; Chiorri, M. Using tree crop pruning residues for energy purposes: A spatial analysis and an evaluation of the economic and environmental sustainability. Biomass Bioenergy 2016, 95, 124–131. [Google Scholar] [CrossRef]
  2. James, A.K.; Thring, R.W.; Helle, S.; Ghuman, H.S. Ash Management Review—Applications of Biomass Bottom Ash. Energies 2012, 5, 3856–3873. [Google Scholar] [CrossRef]
  3. Cavalaglio, G.; Cotana, F.; Nicolini, A.; Coccia, V.; Petrozzi, A.; Formica, A.; Bertini, A. Characterization of Various Biomass Feedstock Suitable for Small-Scale Energy Plants as Preliminary Activity of Biocheaper Project. Sustainibility 2020, 12, 6678. [Google Scholar] [CrossRef]
  4. Michalik, M.; Wilczynska-Michalik, W. Mineral and chemical composition of biomass ash. In Proceedings of the European Mineralogical Conference, Frankfurt, Germany, 2–6 September 2012; Volume 1. [Google Scholar]
  5. Kalembkiewicz, J.; Galas, D.; Sitarz-Palczak, E. The Physicochemical Properties and Composition of Biomass Ash and Evaluating Directions of its Applications. Pol. J. Environ. Stud. 2018, 27, 2593–2603. [Google Scholar] [CrossRef]
  6. Zając, G.; Szyszlak-Bargłowicz, J.; Gołębiowski, W.; Szczepanik, M. Chemical Characteristics of Biomass Ashes. Energies 2018, 11, 2885. [Google Scholar] [CrossRef] [Green Version]
  7. Obenberger, L.; Supancic, K. Possibilities of ash utilization from biomass combustion plants. In Proceedings of the 17th European Biomass Conference and Exhibition, Hamburg, Germany, 29 June–3 July 2009. [Google Scholar]
  8. Carević, I.; Štirmer, N.; Trkmić, M.; Kostanić Jurić, K. Leaching Characteristics of Wood Biomass Fly Ash Cement Composites. Appl. Sci. 2020, 10, 8704. [Google Scholar] [CrossRef]
  9. Wang, S.; Baxter, L. Comprehensive study of biomass fly ash in concrete: Strength, microscopy, kinetics and durability. Fuel Process. Technol. 2007, 88, 1165–1170. [Google Scholar] [CrossRef]
  10. Salvo, M.; Rizzo, S.; Caldirola, M.; Novajra, G.; Canonico, F.; Bianchi, M.; Ferraris, M. Biomass ash as supplementary cementitious material (SCM). Adv. Appl. Ceram. 2015, 114, S3–S10. [Google Scholar] [CrossRef] [Green Version]
  11. Cabrera, M.; Díaz-López, J.L.; Agrela, F.; Rosales, J. Eco-Efficient Cement-Based Materials Using Biomass Bottom Ash: A Review. Appl. Sci. 2020, 10, 8026. [Google Scholar] [CrossRef]
  12. Rajamma, R.; Ball, R.J.; Tarelho, L.A.C.; Allen, G.C.; Labrincha, J.A.; Ferreira, V.M. Characterization and use of bio-mass fly ash in cement-based materials. J. Hazard. Mater. 2009, 172, 1049–1060. [Google Scholar] [CrossRef]
  13. Sun, L.; Gong, K. Silicon-Based Materials from Rice Husks and Their Applications. Ind. Eng. Chem. Res. 2001, 40, 5861–5877. [Google Scholar] [CrossRef]
  14. Soltani, N.; Bahrami, A.; Pech-Canul, M.I.; González, L.A. Review on the physicochemical treatments of rice husk for production of advanced materials. Chem. Eng. J. 2015, 264, 899–935. [Google Scholar] [CrossRef]
  15. Demirbaş, A. Heavy metal contents of fly ashes from selected biomass samples. Energy Sources 2005, 27, 1269–1276. [Google Scholar] [CrossRef]
  16. Boström, C.E.; Gerde, P.; Hanberg, A.; Jemstrom, B.; Johansson, C.; Kyrkslund, T.; Ranung, A.; Tomqvist, M.; Victorin, K.; Westerholm, R. Cancer risk assessment, indicators, and guidelines for polycyclic aromatic hydrocar-bons in the ambient. Environ. Health Perspect. 2002, 110, 451–488. [Google Scholar] [PubMed] [Green Version]
  17. Baird, W.M.; Hooven, L.A.; Mahdevan, B. Carcinogenic polycyclic aromatic hydrocarbon-DNA adducts and mechanism of action. Environ. Mol. Mutagen. 2005, 2–3, 106–114. [Google Scholar] [CrossRef]
  18. Haykırı-Açma, H. Combustion characteristics of different biomass materials. Energy Convers. Manag. 2003, 44, 155–162. [Google Scholar] [CrossRef]
  19. Cai, J.; He, Y.; Yu, X.; Banks, S.W.; Yang, Y.; Zhang, X.; Yu, Y.; Liu, R.; Bridgwater, A.V. Review of physicochemical properties and analytical characterization of lignocellulosic biomass. Renew. Sustain. Energy Rev. 2017, 76, 309–322. [Google Scholar] [CrossRef] [Green Version]
  20. Hasler, P.; Nussbaumer, T. Particle size distribution of the fly ash from biomass combustion. In Proceedings of the 10th European Conference and Technology Exhibition Biomass for Energy and Industry, Wurzburg, Germany, 8–11 June 1998. [Google Scholar]
  21. Rietveld, H.M. A profile refinement method for nuclear and magnetic structures. J. Appl. Cryst. 1969, 2, 65–71. [Google Scholar] [CrossRef]
  22. Larson, A.C.; Von Dreele, R.B. Generalized Structure Analysis System (GSAS) LANSCE, MS-H805; Los Alamos National Laboratory: Los Alamos, NM, USA, 2000; p. 87545. [Google Scholar]
  23. Toby, B.H. EXPGUI, a graphical user interface for GSAS. J. Appl. Crystallogr. 2001, 34, 210–213. [Google Scholar] [CrossRef] [Green Version]
  24. Gentili, S.; Comodi, P.; Nazzareni, S.; Zucchini, A. The orvieto-Bagnoregio ignimbrite: Pyroxene crystalchemistry and bulk pahse composition of pyroclastic deposits, a tool to identify sym and post-depositional processes. Eur. J. Mineral. 2014, 26, 743–756. [Google Scholar] [CrossRef]
  25. Petrelli, M.; Morgavi, D.; Vetere, F.; Perugini, D. Elemental Imaging and Petro-Volcanological Applications of an Improved Laser Ablation Inductively Coupled Quadrupole Plasma Mass Spectrometry. Period. Mineral. 2016. [Google Scholar] [CrossRef]
  26. Balic-Zunic, T.; Birkedal, R.; Katerinopoulou, A.; Comodi, P. Dehydration of bloedite, Na2Mg(SO4)2(H2O)4 and leonite K2Mg(SO4)2(H2O)4. Eur. J. Mineral. 2016, 28, 33–42. [Google Scholar] [CrossRef]
  27. Frondini, F.; Zucchini, A.; Comodi, P. Water-rock interaction and trace elements distribution in dolomite aquifers: The Sassolungo and Sella system (Northern Italy). Geochem. J. 2014, 48, 231–246. [Google Scholar] [CrossRef] [Green Version]
  28. Saddique, U.; Muhammad, S.; Tariq, M.; Zhang, H.; Arif, M.; Isthtiaq, A.K.; Khattak, N.U. Potentially toxic elements in soil of the Khyber Pakhtunkhwa province and Tribal areas, Pakistan: Evaluation for human and ecological risk. Environ. Geochem. Health 2018, 40, 2177–2190. [Google Scholar] [CrossRef]
  29. Palansooriya, K.N.; Shaheen, M.S.; Chen, S.S.; Tsang, D.C.W.; Hashimoto, Y.; Hou, D.; Bolan, N.S.; Rinklebe, J.; Ok, Y.S. Soil amendments for immobilization of potentially toxic elements in contaminated soils: A critical review. Environ. Int. 2020, 134, 105046. [Google Scholar] [CrossRef]
  30. Ur Rehman, I.; Ishaq, M.; Ali, L.; Muhammad, S.; Ud Din, I.; Yaseen, M.; Ullah, H. Potentially toxic elements’ occurrence and risk assessment through water and soil of Chitral urban environment, Pakistan: A case study. Environ. Geochem. Health 2020, 42, 4355–4368. [Google Scholar] [CrossRef] [PubMed]
  31. Schulzke, T. Biomass gasification: Conversion of forest residues into heat, electricity and base chemicals. Chem. Pap. 2019, 73, 1833–1852. [Google Scholar] [CrossRef]
  32. Bell, F.G. Lime stabilization of clay minerals and soils. Eng. Geol. 1996, 42, 223–237. [Google Scholar] [CrossRef]
  33. Al-Mukhtar, M.; Lasledj, A.; Alcover, J.F. Behaviour and mineralogy changes in lime-treated expansive soil at 20 °C. Appl. Clay Sci. 2010, 50, 191–198. [Google Scholar] [CrossRef]
  34. Guidobaldi, G.; Cambi, C.; Cecconi, M.; Comodi, P.; Deneele, D.; Paris, M.; Russo, G.; Vitale, E.; Zucchini, A. Chemo-Mineralogical evolution and microstructural modifications of a lime treated pyroclastic soil. Eng. Geol. 2018, 245, 333–343. [Google Scholar] [CrossRef]
  35. Vitale, E.; Russo, G.; Dell’Agli, G.; Ferone, C.; Bartolomeo, C. Mechanical behaviour of soil improved by alkali activated binders. Environments 2017, 4, 80. [Google Scholar] [CrossRef] [Green Version]
  36. Rowe, E.; Withers, A.J.; Baas, P.; Chan, N.; Doody, D.; Holiman, J.; Jacobs, B.; Li, H.; MacDonald, G.K.; McDowell, R.; et al. Integrating legacy soil phosphorus into sustainable nutrient management strategies for future food, bioenergy and water security. Nutr. Cycling Agroecosyst. 2016, 104, 393–412. [Google Scholar] [CrossRef]
Figure 1. Average grain size distribution for the five samples determined by dynamic light scattering. Samples from 1 to 5 are shown from (ae). The vertical red lines highlight the 10 and 2.5 micron diameters.
Sustainability 13 06052 g001aSustainability 13 06052 g001b
Figure 2. XRPD patterns refined by means of the Rietveld method for samples 1 (a), 2 (b), 3 (c), 4 (d), and 5 (e). Observed and calculated profiles are given in red and green, respectively. The differences between the observed and calculated powder diffraction profiles are in purple. Thick marks below the diffractograms are the diffraction peak positions per each phase.
Sustainability 13 06052 g002aSustainability 13 06052 g002b
Figure 3. Thermal gravimetric analyses (TGAs) for the five samples of the biomass fly ashes studied.
Sustainability 13 06052 g003
Figure 4. Thermal gravimetric analyses in black and differential thermal analysis (DTA) in red for the five analyzed fly ashes: 1 (a), 2 (b), 3 (c), 4 (d), and 5 (e).
Sustainability 13 06052 g004
Figure 5. FE-SEM analysis of sample 2. On the left (a), a secondary electron (SE) image where micrometric sub-spherical crystals of apatite are shown. On the right (b), the graph shows the EDS data collected for the apatite crystal at the point indicated with the green cross.
Sustainability 13 06052 g005
Figure 6. FE-SEM analysis of sample 4. On the left (a), an SE image with elongated K2O crystals. On the right (b), the EDS data collected for one of the elongated crystals are shown.
Sustainability 13 06052 g006
Figure 7. FE-SEM analysis of sample 5. On the left (a), an SE image in which elongated and rounded crystals are shown. Below (b,c), the graphs report the EDS spectra collected for one of the elongated crystals (sylvite, KCl) and for the rounded crystals (apatite, Ca5(PO4)3(F, OH, Cl) crystals), respectively.
Sustainability 13 06052 g007aSustainability 13 06052 g007b
Figure 8. De-vetrification microstructures observed in sample 3. Above (a,b), two different magnifications of windmill structures are shown; below (c,d), two different SE imagines at different magnifications of microstructures showing neoblasts surrounded by glass.
Sustainability 13 06052 g008
Figure 9. Selected PTE concentrations (V, Cr, Co, Ni, Zn, Pb, Cu, As, Hg, and Se), along with Cl and S concentrations, in the four samples with potentially toxic elements.
Sustainability 13 06052 g009
Figure 10. Ratios between the measured concentrations of V, Cr, Co, Ni, Zn, Pb, Cu, As, Hg, and Se in the four samples (Figure 9) and the values for the Italian limits of those metals for urban sites.
Sustainability 13 06052 g010
Figure 11. Ratios between the measured concentrations of V, Cr, Co, Ni, Zn, Pb, Cu, As, Hg, and Se in the four samples (Figure 9) and the values for the Italian limits of those metals for industrial sites.
Sustainability 13 06052 g011
Table 1. Samples used in the present work.
CodeName/TypeOrigin
#1Sample 1 biomass ashesGasification power plant, Magione (PG), Italy
#2Sample 2 biomass ashesGrapevine prunings, Torgiano (PG), Italy
#3Sample 3 biomass ashesWood pellets
#4Sample 4 biomass ashesOlive tree prunings
#5Sample 5 biomass ashesCardoon plants
Table 2. Quantitative analysis by Rietveld refinement of XRPD data. Quantitative results are given in wt%. Errors in wt% are also listed. Amorphous content was recalculated based on Si as an external standard.
SamplePhasesChemical Formulawt%Error
#1QuartzSiO22.910.01
CalciteCaCO321.010.07
PortlanditeCaO(OH)24.470.05
SulphurS0.410.02
HydroxylapatiteCa5(PO4)3(OH)3.110.02
Amorphous 68.10.1
#2PericlaseMgO1.810.01
CalciteCaCO38.340.04
Heulandite(Ca.Na)2–3Al3(Al.Si)2Si13O36·12(H2O)1.150.03
CalcioferriteCa4Fe2+(Fe3+.Al)4(PO4)6(OH)4·12(H2O)1.600.02
FairchilditeK2Ca(CO3)22.230.01
QuartzSiO20.330.11
HydroxylapatiteCa5(PO4)3(OH)5.080.21
Amorphous 79.50.2
#3PericlaseMgO5.770.02
CalciteCaCO36.360.05
PortlanditeCa(OH)20.630.04
LimeCaO2.060.02
FairchilditeK2Ca(CO3)211.200.03
QuartzSiO20.520.14
ApatiteCa5(PO4)3(OH.F.Cl)1.390.26
Amorphous 72.10.3
#4ReichenbachiteCu2+5(PO4)2(OH)40.950.02
CalciteCaCO342.240.15
QuartzSiO24.180.07
Phosphoferrite(Fe2+.Mn)3(PO4)2·3(H2O)0.420.03
HydrossilapatiteCa5(PO4)3(OH)4.570.03
Amorphous 47.60.5
#5LimeCaO0.080.01
CalciteCaCO36.620.03
FluelliteAl2(PO4)F2(OH)·7(H2O)3.480.03
SylviteKCl2.990.01
QuartzSiO20.280.01
RhodochrositeMnCO30.510.09
RutileTiO20.160.18
HydroxilapatiteCa5(PO4)3(OH)1.130.26
Amorphous 84.70.3
Table 3. Major elements (in oxide wt%) measured with EMPA in the five samples.
Sample#1#2#3#4#5
NaO0.080.940.1120.5820.907
Cl0.300.0090.0080.0060.008
MnO0.1460.1271.1130.1210.025
K2O0.1841.780.0054.9440.008
MgO0.2139.14332.393.8541.563
SiO211.7626.1916.51227.9499.567
Cr2O30.1360.01860.0070.0140.007
FeO0.6112.342.7652.8890.537
CaO39.8444.2637.21543.3165.042
Al2O30.555.525.5407.9071.103
P2O50.3928.8563.5087.8327.677
TiO20.0670.3180.2020.3490.084
Total54.2899.51599.37599.76086.53
Table 4. Minor elements (ppm) measured with LA-ICP-MS in the four samples (2, 3, 4, and 5).
Sample#2#3#4#5
V33.4432.0754.087.08
Cr0.1343.440.1313.55
Co8.3822.928.443.09
Ni59.40191.0051.3022.18
Zn479.2085.20114.9651.30
Pb0.220.530.130.52
Cu304.6217.36153.387.85
As0.253.050.512.21
Cd0.050.230.020.71
Hg0.000.000.000.00
Se0.000.000.000.32
Mo0.59184.370.2337.28
Cl117.40159.3397.20147.80
S498.63573.00314.50382.00
Table 5. PAH contents in the five samples investigated in the present work. Data are given in mg/kg t.q.
PAH Type/Samples12345
Total IPA1088<0.050<0.050<0.050<0.050
Naftalene3706<0.010<0.010<0.010<0.010
Acenaftene4.6<0.010<0.010<0.010<0.010
Acenaftilene341<0.010<0.010<0.010<0.010
Fluorene<0.010<0.010<0.010<0.010<0.010
Fenantrene29<0.010<0.010<0.010<0.010
Antracene4.0<0.010<0.010<0.010<0.010
Fluorantene1.6<0.010<0.010<0.010<0.010
Pirene1.3<0.010<0.010<0.010<0.010
Benzo(a)antracene0.015<0.010<0.010<0.010<0.010
Crysene0.020<0.010<0.010<0.010<0.010
Benzo(b,k,j)fluorantene<0.010<0.010<0.010<0.010<0.010
Benzo(e)pirene<0.010<0.010<0.010<0.010<0.010
Benzo(a)pirene<0.010<0.010<0.010<0.010<0.010
Indenopirene<0.010<0.010<0.010<0.010<0.010
Dibenzo(a,h)antracene<0.010<0.010<0.010<0.010<0.010
Benzo(g,h,i)perilene<0.010<0.010<0.010<0.010<0.010
Publisher’s Note: MDPI stays neutral with regard to jurisdictional claims in published maps and institutional affiliations.

