
Projection of Water Availability and Sustainability in Nigeria Due to Climate Change


1
Department of Civil Engineering, Seoul National University of Science and Technology, Seoul 01811, Korea
2
Department of Environmental Sciences, Faculty of Science, Federal University Dutse, Dutse P.M.B 7156, Nigeria
3
Department of Water and Environmental Engineering, School of Civil Engineering, Faculty of Engineering, Universiti Teknologi Malaysia (UTM), Johor Bahru 81310, Malaysia
*
Author to whom correspondence should be addressed.
Sustainability 2021, 13(11), 6284; https://0-doi-org.brum.beds.ac.uk/10.3390/su13116284
Submission received: 14 May 2021
/
Revised: 31 May 2021
/
Accepted: 31 May 2021
/
Published: 2 June 2021
(This article belongs to the Special Issue Climate Change Impacts on Hydrology, Water Quality and Ecology)
Abstract
:This study projects water availability and sustainability in Nigeria due to climate change. This study used Gravity Recovery and Climate Experiment (GRACE) terrestrial water storage data (TWS), Global Precipitation Climatology Center (GPCC) precipitation data and Climate Research Unit (CRU) temperature data. Four general circulation models (GCMs) of the Coupled Model Intercomparison Project 5 were downscaled using the best of four downscaling methods. Two machine learning (ML) models, RF and SVM, were developed to simulate GRACE TWS data for the period 2002–2016 and were then used for the projection of spatiotemporal changes in TWS. The projected TWS data were used to assess the spatiotemporal changes in water availability and sustainability based on the reliability–resiliency–vulnerability (RRV) concept. This study revealed that linear scaling was the best for downscaling over Nigeria. RF had better performance than SVM in modeling TWS for the study area. This study also revealed there would be decreases in water storage during the wet season (June–September) and increases in the dry season (January–May). Decreases in projected water availability were in the range of 0–12 mm for the periods 2010–2039, 2040–2069, and 2070–2099 under RCP2.6 and in the range of 0–17 mm under RCP8.5 during the wet season. Spatially, annual changes in water storage are expected to increase in the northern part and decrease in the south, particularly in the country’s southeast. Groundwater sustainability was higher during the period 2070–2099 under all RCPs compared to the other periods and this can be attributed to the expected increases in rainfall during this period.
1. Introduction
Water is not uniformly distributed across the globe as there is variability in its natural occurrence, and it can be affected by direct and indirect human actions [1,2]. This is particularly the case for socioeconomic developments, which are strongly dependent on steady freshwater resources availability in local water systems, leading to a decrease in water availability due to overexploitation [3]. Climate changes have further aggravated water availability due to decreases in rainfall [4,5,6,7] and generally increasing temperature [8,9,10]. These have led to shrinkages of lakes and other surface water bodies in some parts of the globe. For example, Chen et al. [11] found that lake Zhari Namco in Tibet, China, has shrunk from 4605 km2 about 8.2 ka ago to 996 km2, with about 300 km3 of water lost from the lake. Additionally, Lake Chad in the Sahelian zone of west-central Africa has been reported to have shrunk from 1339.018 km2 in 1987 to 130.686 km2 in 2005 [12].
Like surface water, groundwater has faced the impacts of climate change because it is seen as a buffer to droughts when there is insufficient rainfall or decrease in surface waters. However, historical and projected assessments of climate variability on water resources usually exclude groundwater, particularly in Africa, due to the unavailability of appropriate observation wells [13]. Nevertheless, studies on the impacts of climate change on groundwater showed an overall decline in water availability due to climate variability [14,15,16]. Thus, general circulation models (GCMs) have been used to project climate change impacts on water availability, showing a more severe decline in water in the future [17,18].
Across the globe, Africa has the highest growing national population, with a growth rate of between 1.6 and 3.1% annually [19,20], and a projection of half a billion more people in the middle of the 21st century [21]. The climate of Africa is changing in line with global climate variability. In response to these changes, the current and future adaptation measures and increasing growth in population place much reliance on groundwater for domestic, industrial, and agricultural purposes [21]. Groundwater stresses are increasingly being reported in many parts of the continent and projections indicate that this will intensify in the future [19,22,23].
While studies on the impacts of changing climate on water resources have been conducted in some parts of Africa, such studies are mostly lacking in Nigeria. In addition, unlike in the Indian subcontinent, where the declination of water resources has become alarming due to over-abstraction for irrigation purposes [24], agricultural practices in Nigeria are mostly rain-fed, making changes in other sources of water such as groundwater less studied. Nevertheless, there have been reports of declining groundwater levels in the country, mostly in the arid and semi-arid areas [25,26].
The Gravity Recovery and Climate Experiment (GRACE), launched in April 2002, provides opportunities to study water resources changes. GRACE provides an estimation of terrestrial water storage (TWS), which is the total water available on the earth’s surface (river, lakes, atmosphere, and ice) and subsurface (soil moisture and groundwater) [27]. Therefore, the TWS of an area represents the total water available in the area [28]. The collection of water sources data is virtually impossible, and thus, GRACE has been widely used in recent years for the estimation of the changes in water availability, sustainability, and different kinds of droughts [29,30,31].
Sustainability in water resources is the major component of economic development and improvement of human wellbeing [32,33]. Therefore, the task to “ensure availability and sustainable management of water and sanitation” has been made a major sustainable development goal. Sustainability in water resources is generally estimated based on its reliability, resiliency and vulnerability—among other characteristics. The reliability–resiliency–vulnerability (RRV) concept has grown rapidly in assessing sustainability in water resources [14,34,35]. Previous studies of water sustainability based on RRV have focused on assessing current water sustainability. No attempt has been made to date to use the concept to assess future changes in water sustainability due to climate change. Future projections of climate, rainfall, and temperature by GCMs provide opportunities for simulating future changes in water resources. Despite the future abstraction rates of water and population growth are not clear, and the uncertainties associated with climate models which can be reduced through the appropriate selection of GCMs or an aggregation of a multi-model ensemble (MME), projecting changes in water resources due to climate change may be invaluable in sustainable water resources planning and management.
This study aimed to project water availability and sustainability in Nigeria due to climate change. Historical GRACE TWS and climate data were used to develop water storage estimation models from rainfall and temperature. Projected MME rainfall and temperature by the selected GCMs were used for simulating the future changes in TWS for selected GCMs under four RCPs. The projected climate was used to evaluate the annual changes in water resources and sustainability for three future periods: 2010–2039; 2040–2069; and 2070–2099.
2. Study Area and Data
2.1. Study Area
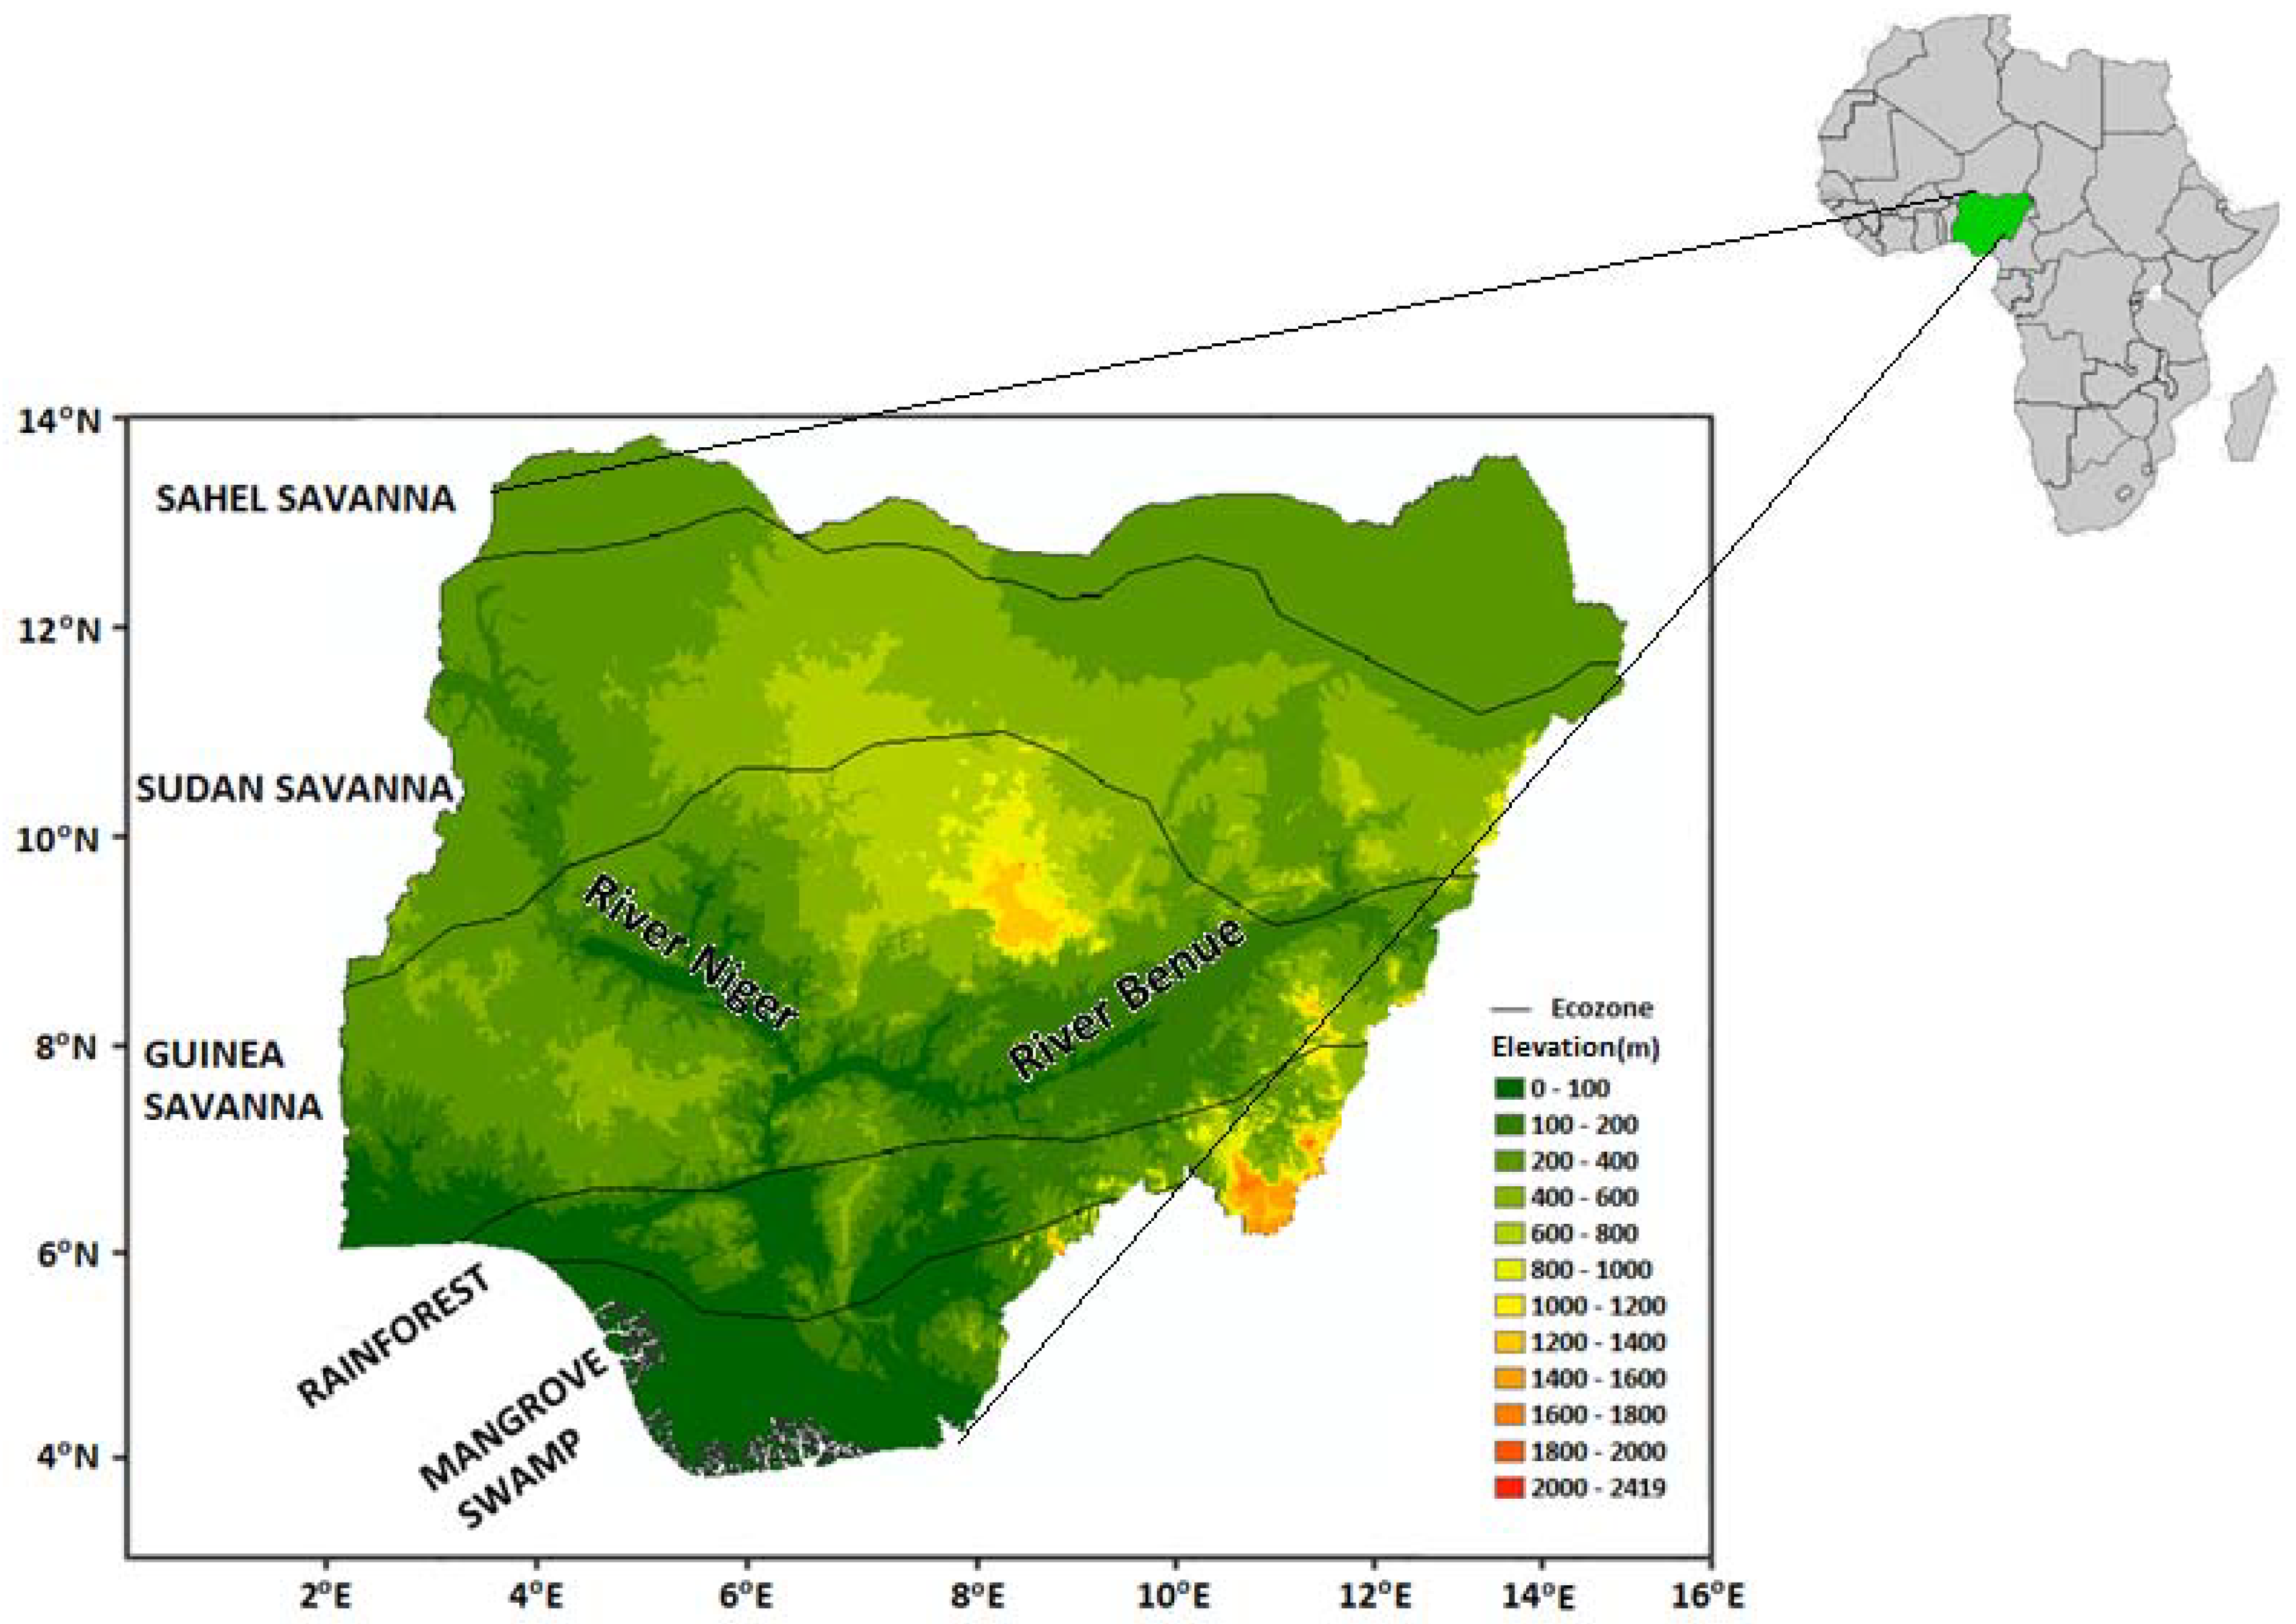
Nigeria is located at latitude: 4°15′–13°55′ N and longitude: 2°40′–14°45′ E and has an area of 923,000 km2 (Figure 1). Elevation varies between 0 m around the Atlantic Ocean in the southern parts and 2419 m at Chappal Waddi in the northeast of the country. The wet/rainy and the dry seasons are the two main seasons in the country. There is variation in the climate from the south to the north of the country, with precipitation mostly concentrated form April to October in the central and southern parts and from June to September in the arid and semi-arid northern regions.
While annual average precipitation is more than 2000 mm in some southern parts, it is less than 800 mm in the arid northern parts [36] where daily maximum temperatures are higher and can reach 45 °C in summer [37]. In the southern part, daily temperatures are between 30 °C and 37 °C. Temperatures reach a minimum of 12 °C in the northern parts and between 17 °C and 24 °C in the southern parts during dry cold seasons. The average temperature is lower than 22 °C in the high elevation areas but can be more than 28 °C in other parts of the country.
Nigeria is climatologically divided into four zones: warm desert climate, warm semi-arid climate, monsoon climate, and tropical savanna climate from the north to the south. Different ecological zones also exist in the country, namely the Sahel Savanna, Sudan Savanna, Guinea Savanna, rainforest, and mangrove swamp types from the north to the south (Figure 1).
Water resources are relatively available in Nigeria compared to other countries in arid and semi-arid regions like Afghanistan, Iraq, and Syria, which receive much less rainfall in many parts of the country than the arid northern part of Nigeria [38,39,40]. However, this resource is experiencing many threats from pollution, over-abstraction, mismanagement and the impacts of climate change. Nigeria is drained by a network of streams and rivers of Precambrian basement complex sources that flows over the sediment at lower reaches [41]. The country’s drainage system is dominated by the largest rivers, River Niger and River Benue (Figure 1).
2.2. Data and Sources
2.2.1. Gridded Data
The GRACE satellites’ monthly gridded groundwater data of the Jet Propulsion Laboratory (JPL) of the National Aeronautics and Space Administration (NASA) [42], the rainfall data of the Global Precipitation Climatology Center (GPCC) full data reanalysis product of the Deutscher Wetterdienst [43], and the temperature data of the Climatic Research Unit (CRU) [44] of the University of East Anglia, all at 1.0° × 1.0° during the period 2002–2016 at 80 grid points covering Nigeria, were used.
GRACE has its basis on the gravity phenomenon, which has the advantages of (1) direct linkage between mass storage and gravity giving independence of lithology and non-requirement of calibration, and (2) the satellite’s distant effects, which allow for deep penetration into the earth and mass storage recording of the groundwater systems [45]. Though not widely used in Nigeria, the monthly gridded GRACE water data have found use among groundwater assessment across the globe, including in Africa [28,46,47].
The precipitation product of the GPCC has the advantages of (1) being of good quality for hydrological studies; (2) availability spanning a longer period; (3) development from the highest number of collected precipitation records; and (4) time series completeness after 1951 [48]. The GPCC has been found to be suitable and has been used in Africa for many hydro-climatic studies [49,50,51].
The development of the CRU was based on gauge measurements from about 4000 weather stations distributed across the globe. All data collected for the development of the CRU database are taken through a two-stage extensive manual and semi-automatic quality control. First, data are checked for consistency, and second, the months or the stations having large errors during the interpolation process are deleted. Many studies have found the CRU suitable for climate studies in Africa [37,52,53].
2.2.2. General Circulation Models
The precipitation and temperature simulation of GCMs of the Coupled Model Intercomparison Project 5 (CMIP5) were used for the future assessment of the impacts of climate change on water availability and sustainability. The CMIP5 constitutes a set of globally coordinated GCM of historical and future simulations produced by different modeling groups [54]. Historical and future projections of 20 GCMs were obtained from the CMIP5 database during the periods 1961–2005 and 2006–2099, respectively. The availability of all representative concentration pathways (RCPs) and the period of availability of the models were considered for the initial selection of GCMs. Among the selected 20 GCMs, four were found to simulate the observed climate of Nigeria more reliably [10] and therefore, used in this study. The basic information on selected GCMs is presented in Table 1.
3. Methodology
Modeling Climate Influences on Water Storage
Data-driven models: random forest (RF) and support vector machine (SVM) were employed in the modeling of climatic influence on TWS due to climate change. Projected changes in TWS were used for the assessment of water availability and sustainability. The procedure used was as follows:
- (1)
- Use of historical GPCC and CRU data to calibrate and validate TWS prediction models using SVM and RF and selecting the better performing model;
- (2)
- Use of the selected GCM simulated rainfall and temperature for the four RCPs in the best TWS model for the projection of TWS for different RCPs;
- (3)
- Projection of changes in TWS under all RCPs for the selected GCMs and the generation of ensemble TWS projection for each RCP from the selected GCMs and comparison of the projections with the observed TWS in all climatic zones of Nigeria during the periods 2010–2039, 2040–2069, and 2070–2099;
- (4)
- Assessment of spatial changes in water availability for all RCPs for the future periods 2010–2039, 2040–2069, and 2070–2099 compared to the observed period;
- (5)
- Estimation of sustainability in water resources during the periods 2010–2039, 2040–2069, and 2070–2099 to assess climate change impacts on water sustainability.
The performances of the bias correction methods: LS, GAQM, PT, GEQM was evaluated based on their ability to correct bias in GPCC rainfall and CRU temperature. Their performances were compared using five indices: normalized root mean square error (NRMSE), percentage of bias (PBIAS), Nash–Sutcliff efficiency (NSE), relative of standard deviation (RSD) and modified coefficient of agreement (MD). GCM projections were downscaled and bias-corrected for their uses in the projection of TWS using the best bias correction method. GCMs simulating rainfall and temperature were first interpolated to GRACE grid locations using the bilinear interpolation method, and then the interpolated rainfall and temperature were compared with GPCC rainfall and CRU temperature to correct the bias in GCM simulations. Current methods of bias correction include linear scaling (LS) [55], gamma quantile mapping (GQM) [56], power transformation (PT) [57], analogue methods [58], generalized quantile mapping (GEQM) [59], local intensity scaling [60], multiple linear regression [61] and delta change [62]. Due to their simplicity, the scaling, quantile mapping, and power transformation methods were widely employed. Therefore, these methods were compared, and the best method in terms of performance was applied in the downscaling of the future climate of the study area at 80 GRACE grid points.
Downscaled simulations of different GCMs were merged to generate an MME mean for each climate variable. RF was used for this purpose. RF has its basis on the analysis of classification and regression trees (CART) [63]. It is a non-parametric statistical regression algorithm that generates several independent trees to attain a final decision through two randomizations: training samples selection and variables selection at an individual node of a tree. The problems of overfitting and sensitivity to the configuration of the training sample, which are the CART’s drawbacks, are eliminated by the randomness [64]. Applying out-of-bag (OOB) data from random selection, the RF method allows for internal cross-validation and each variable’s relative importance when samples are held in OOB [65].
In RRV, sustainability () is defined as a function of the resiliency, reliability, and vulnerability of water resources. It can be calculated as follows [35]:
Reliability, resiliency, and vulnerability can be assessed by the use of standardized TWS anomaly data. This study considered the threshold to define the declination of water storage below one standard deviation from the mean.
The reliability of water resources relative to water storage is determined by how frequently it falls below the normal condition [66]. The resiliency of water resources is the possibility of regaining its normal level after a drop in level. The magnitude of an event extent is termed as the water resources’ vulnerability. The dimensionless vulnerability is obtained by the division of the vulnerability by the demand. The calculations of the reliability, resiliency, and vulnerability are based on these concepts, as follows:
where denotes the total number of water storage negative changes, d is the event’s duration, T is the number of time intervals, and v is the vulnerability. This study considered the demand as −1, and it is expected that the total water availability should not decline below one standard deviation from the mean. Details of RRV can be found in Ahmed et al. [14].
4. Results
4.1. Climate Downscaling
Obtained results in downscaling rainfall are presented in Table 2. There is overall better performance of the LS for the selected GCMs though the GAQM showed higher performance for CSIRO-Mk3.6.0. Similar results were obtained for temperature. As the best performing downscaling method, the LS was applied in the downscaling of the selected GCMs for Nigeria. The downscaled rainfall and temperature of different GCMs were used to generate MME mean rainfall and temperature for different RCPs using RF.
4.2. Modeling Changes in Water Storage
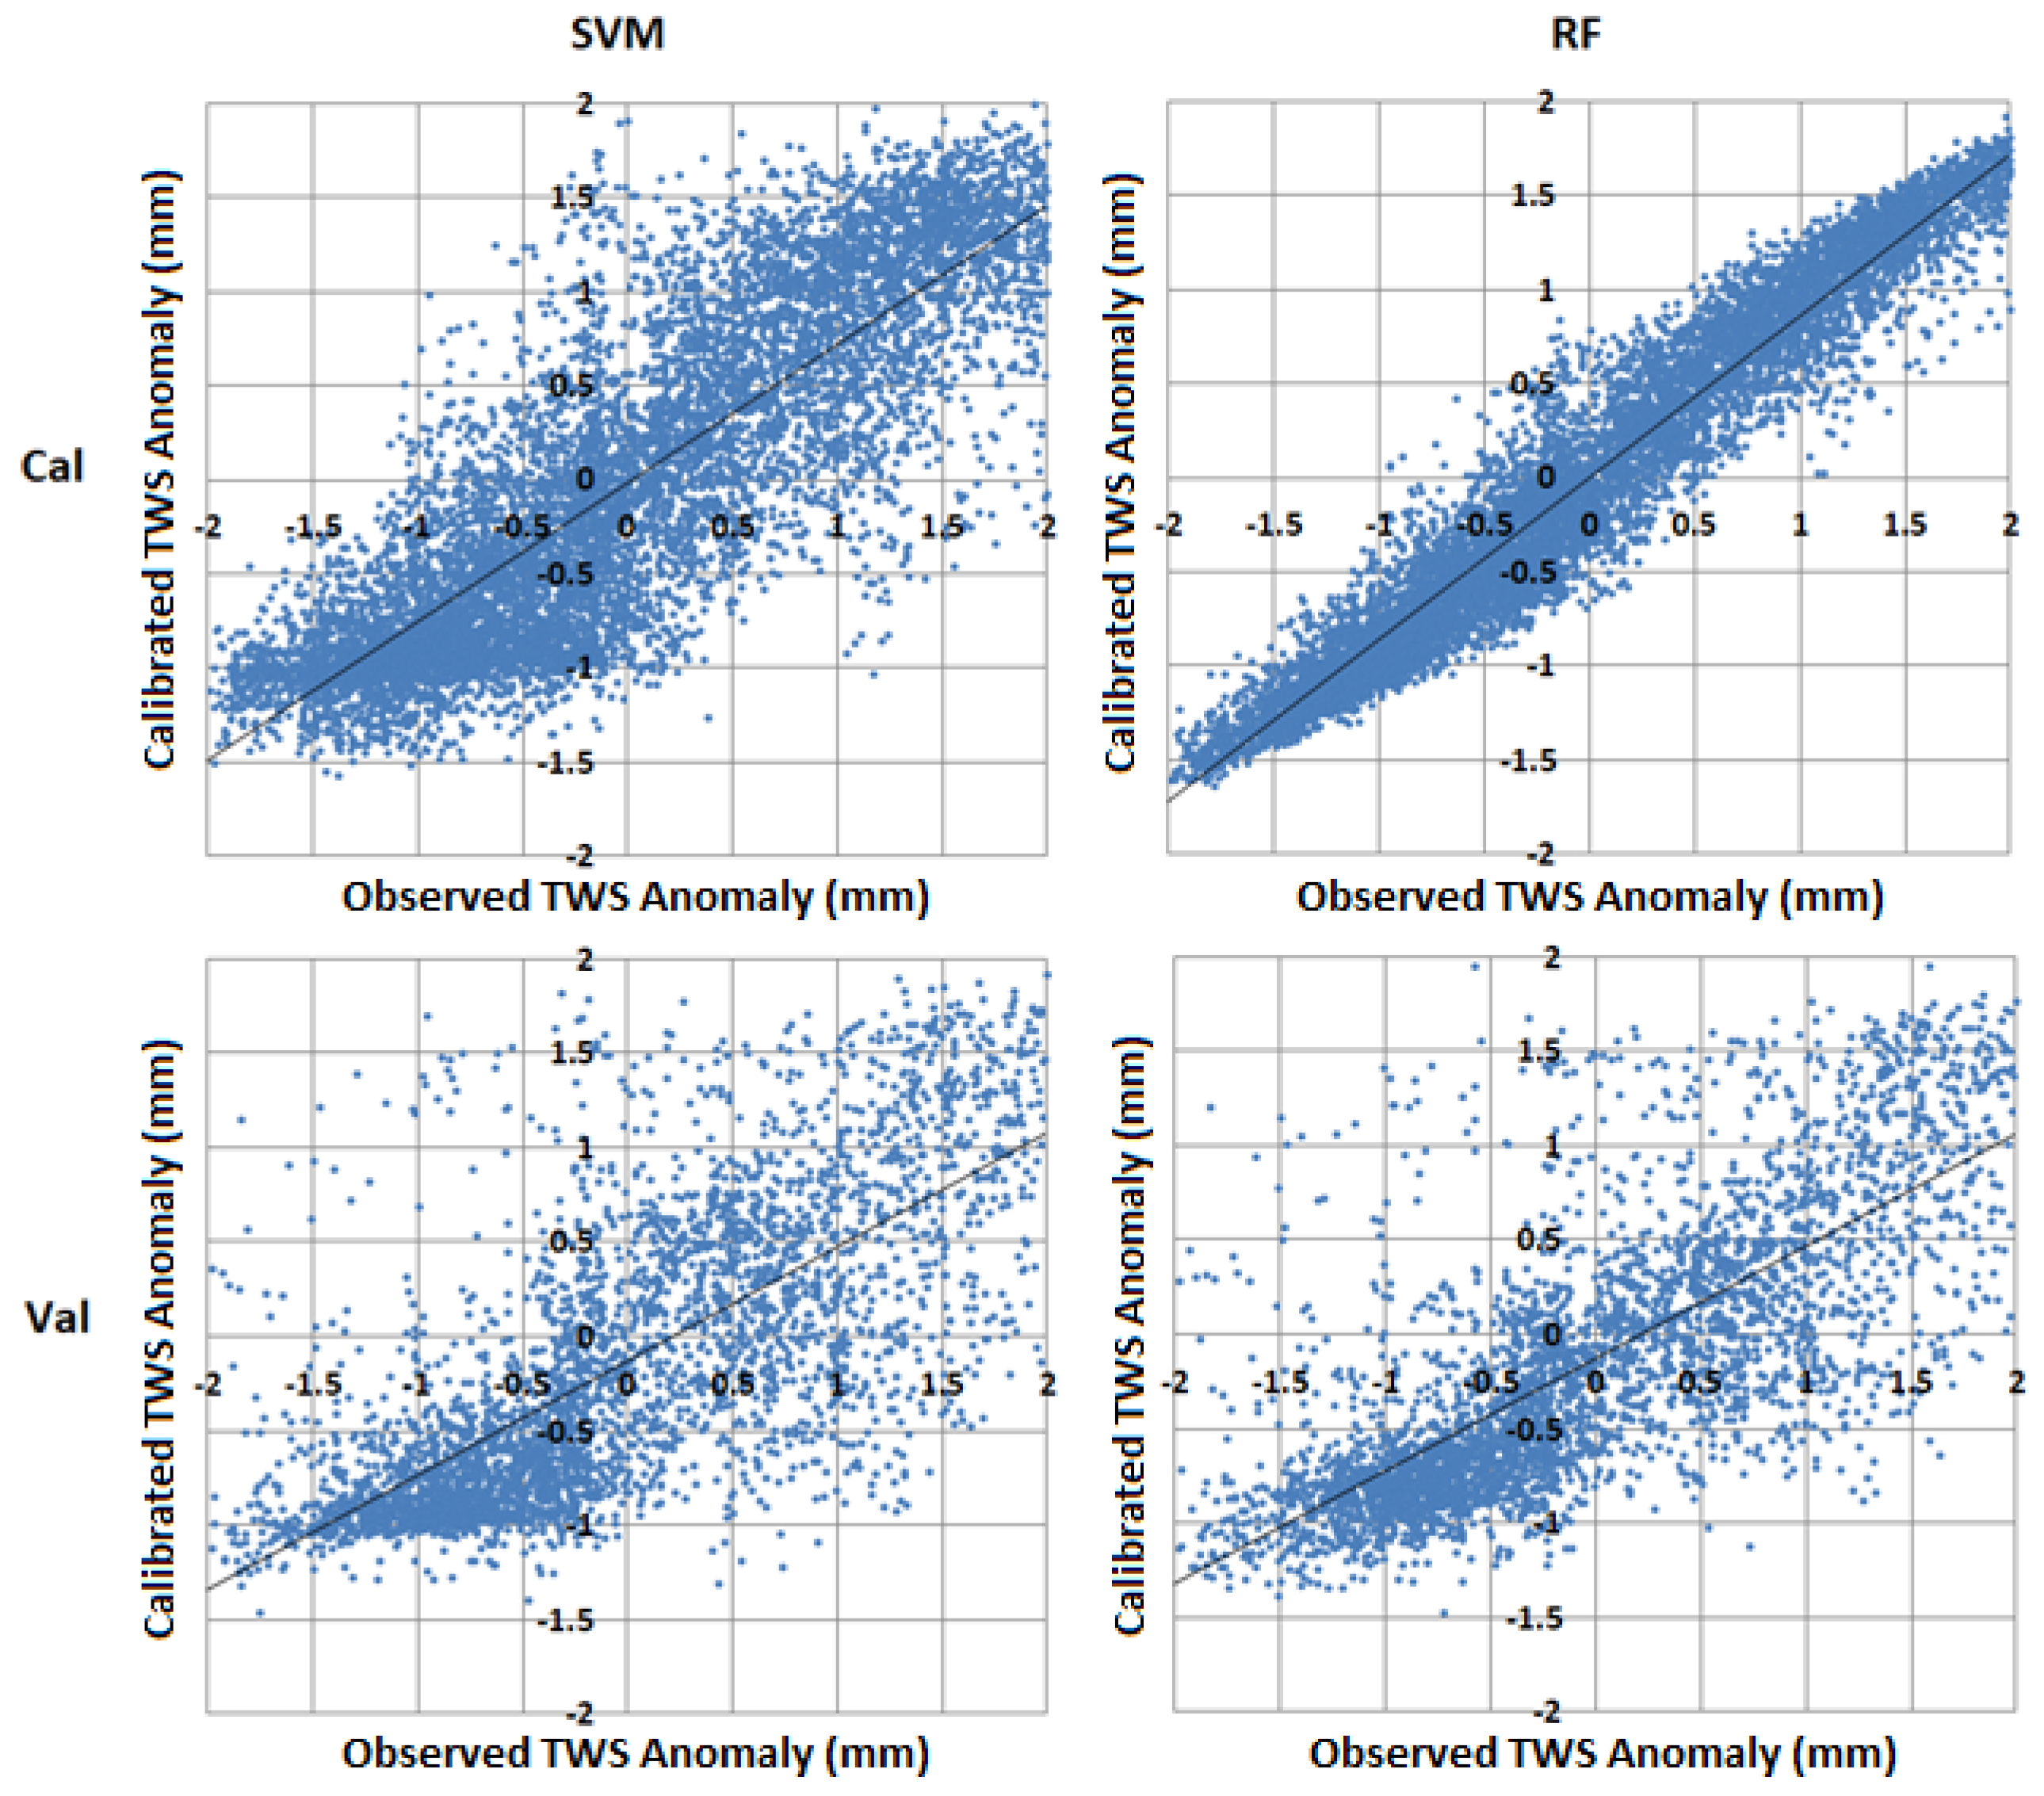
The results of the model development for GRACE water storage simulation from CRU temperature and GPCC rainfall using SVM and RF were adequate. Out of 80 GRACE grid points, the data of 70% (56 grid points) were used to develop the model, and the remaining 30% (24 grid points) were used for model validation. The models were then used for the projection of water storage changes using projected MME rainfall and temperature for different RCP scenarios. Obtained results for the calibration are presented in Section 4.2.1.
4.2.1. Model Calibration and Validation
Figure 2 presents the scatter plots of the observed and simulated water storage anomalies during model calibration and validation. The models show a better performance of the RF than the SVM. Therefore, the RF was chosen for modeling climate change impacts on water resources of the study area.
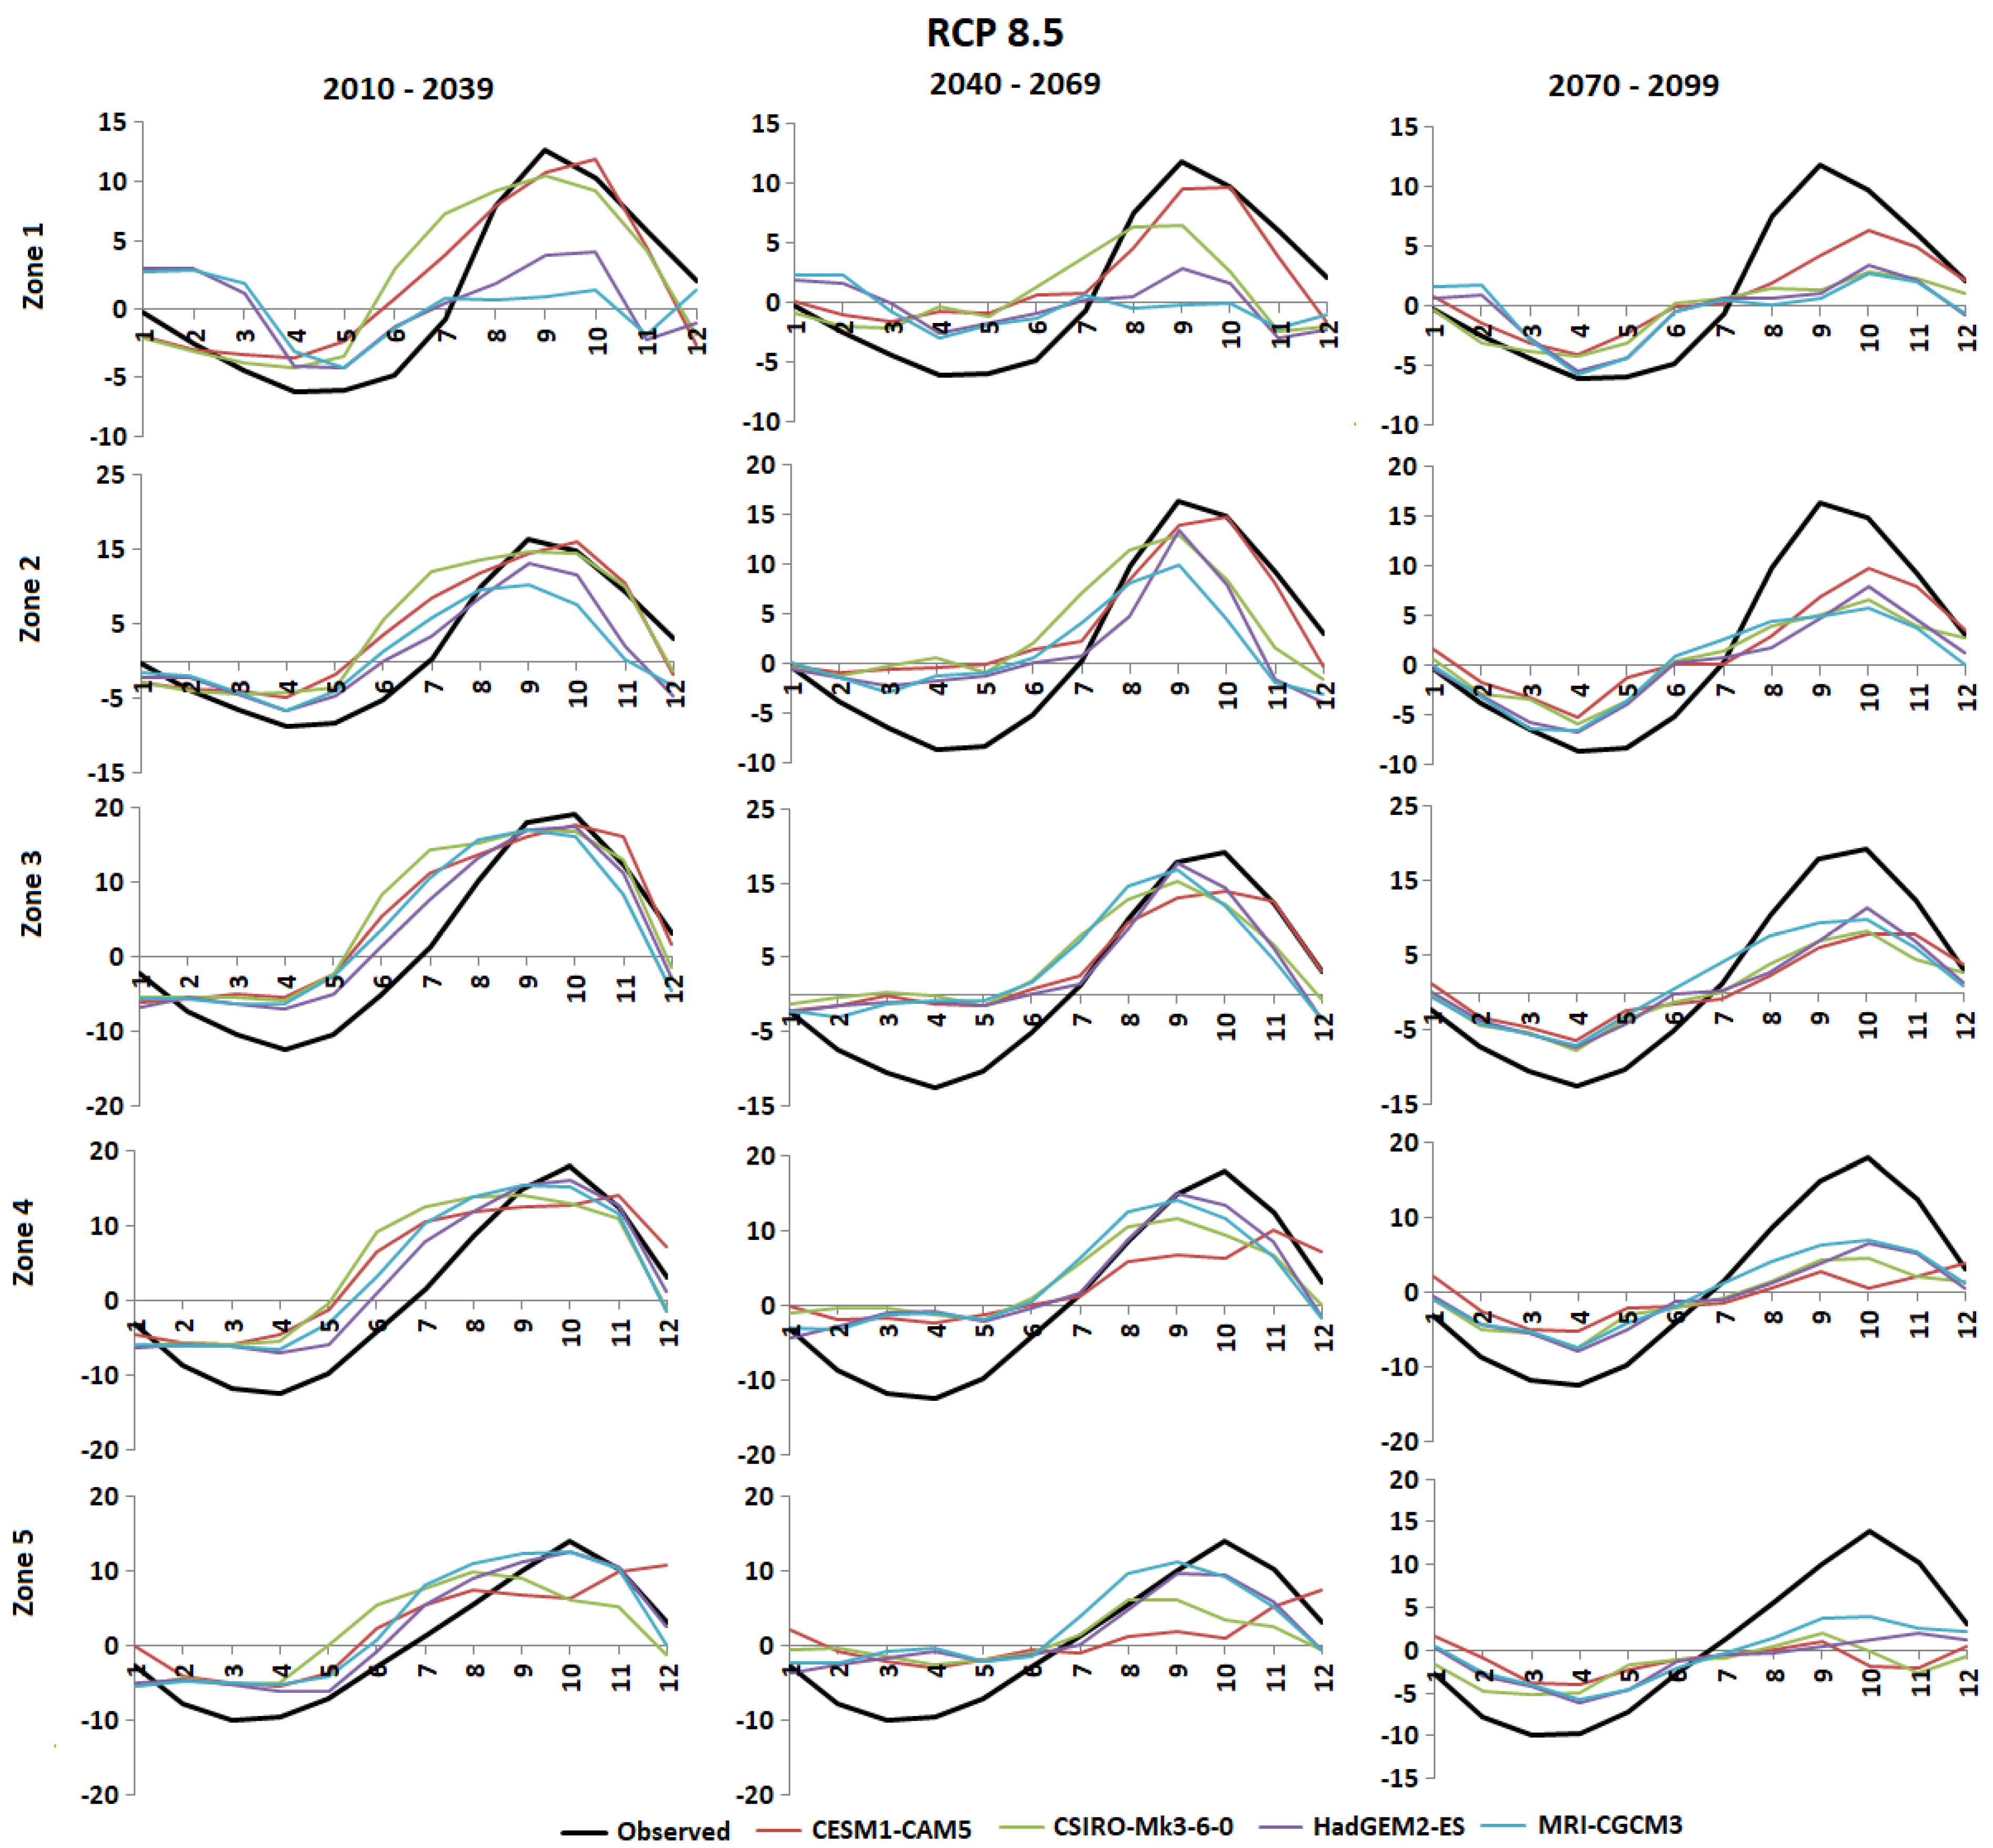
4.2.2. Seasonal Changes in Water Storage under Projected Climate
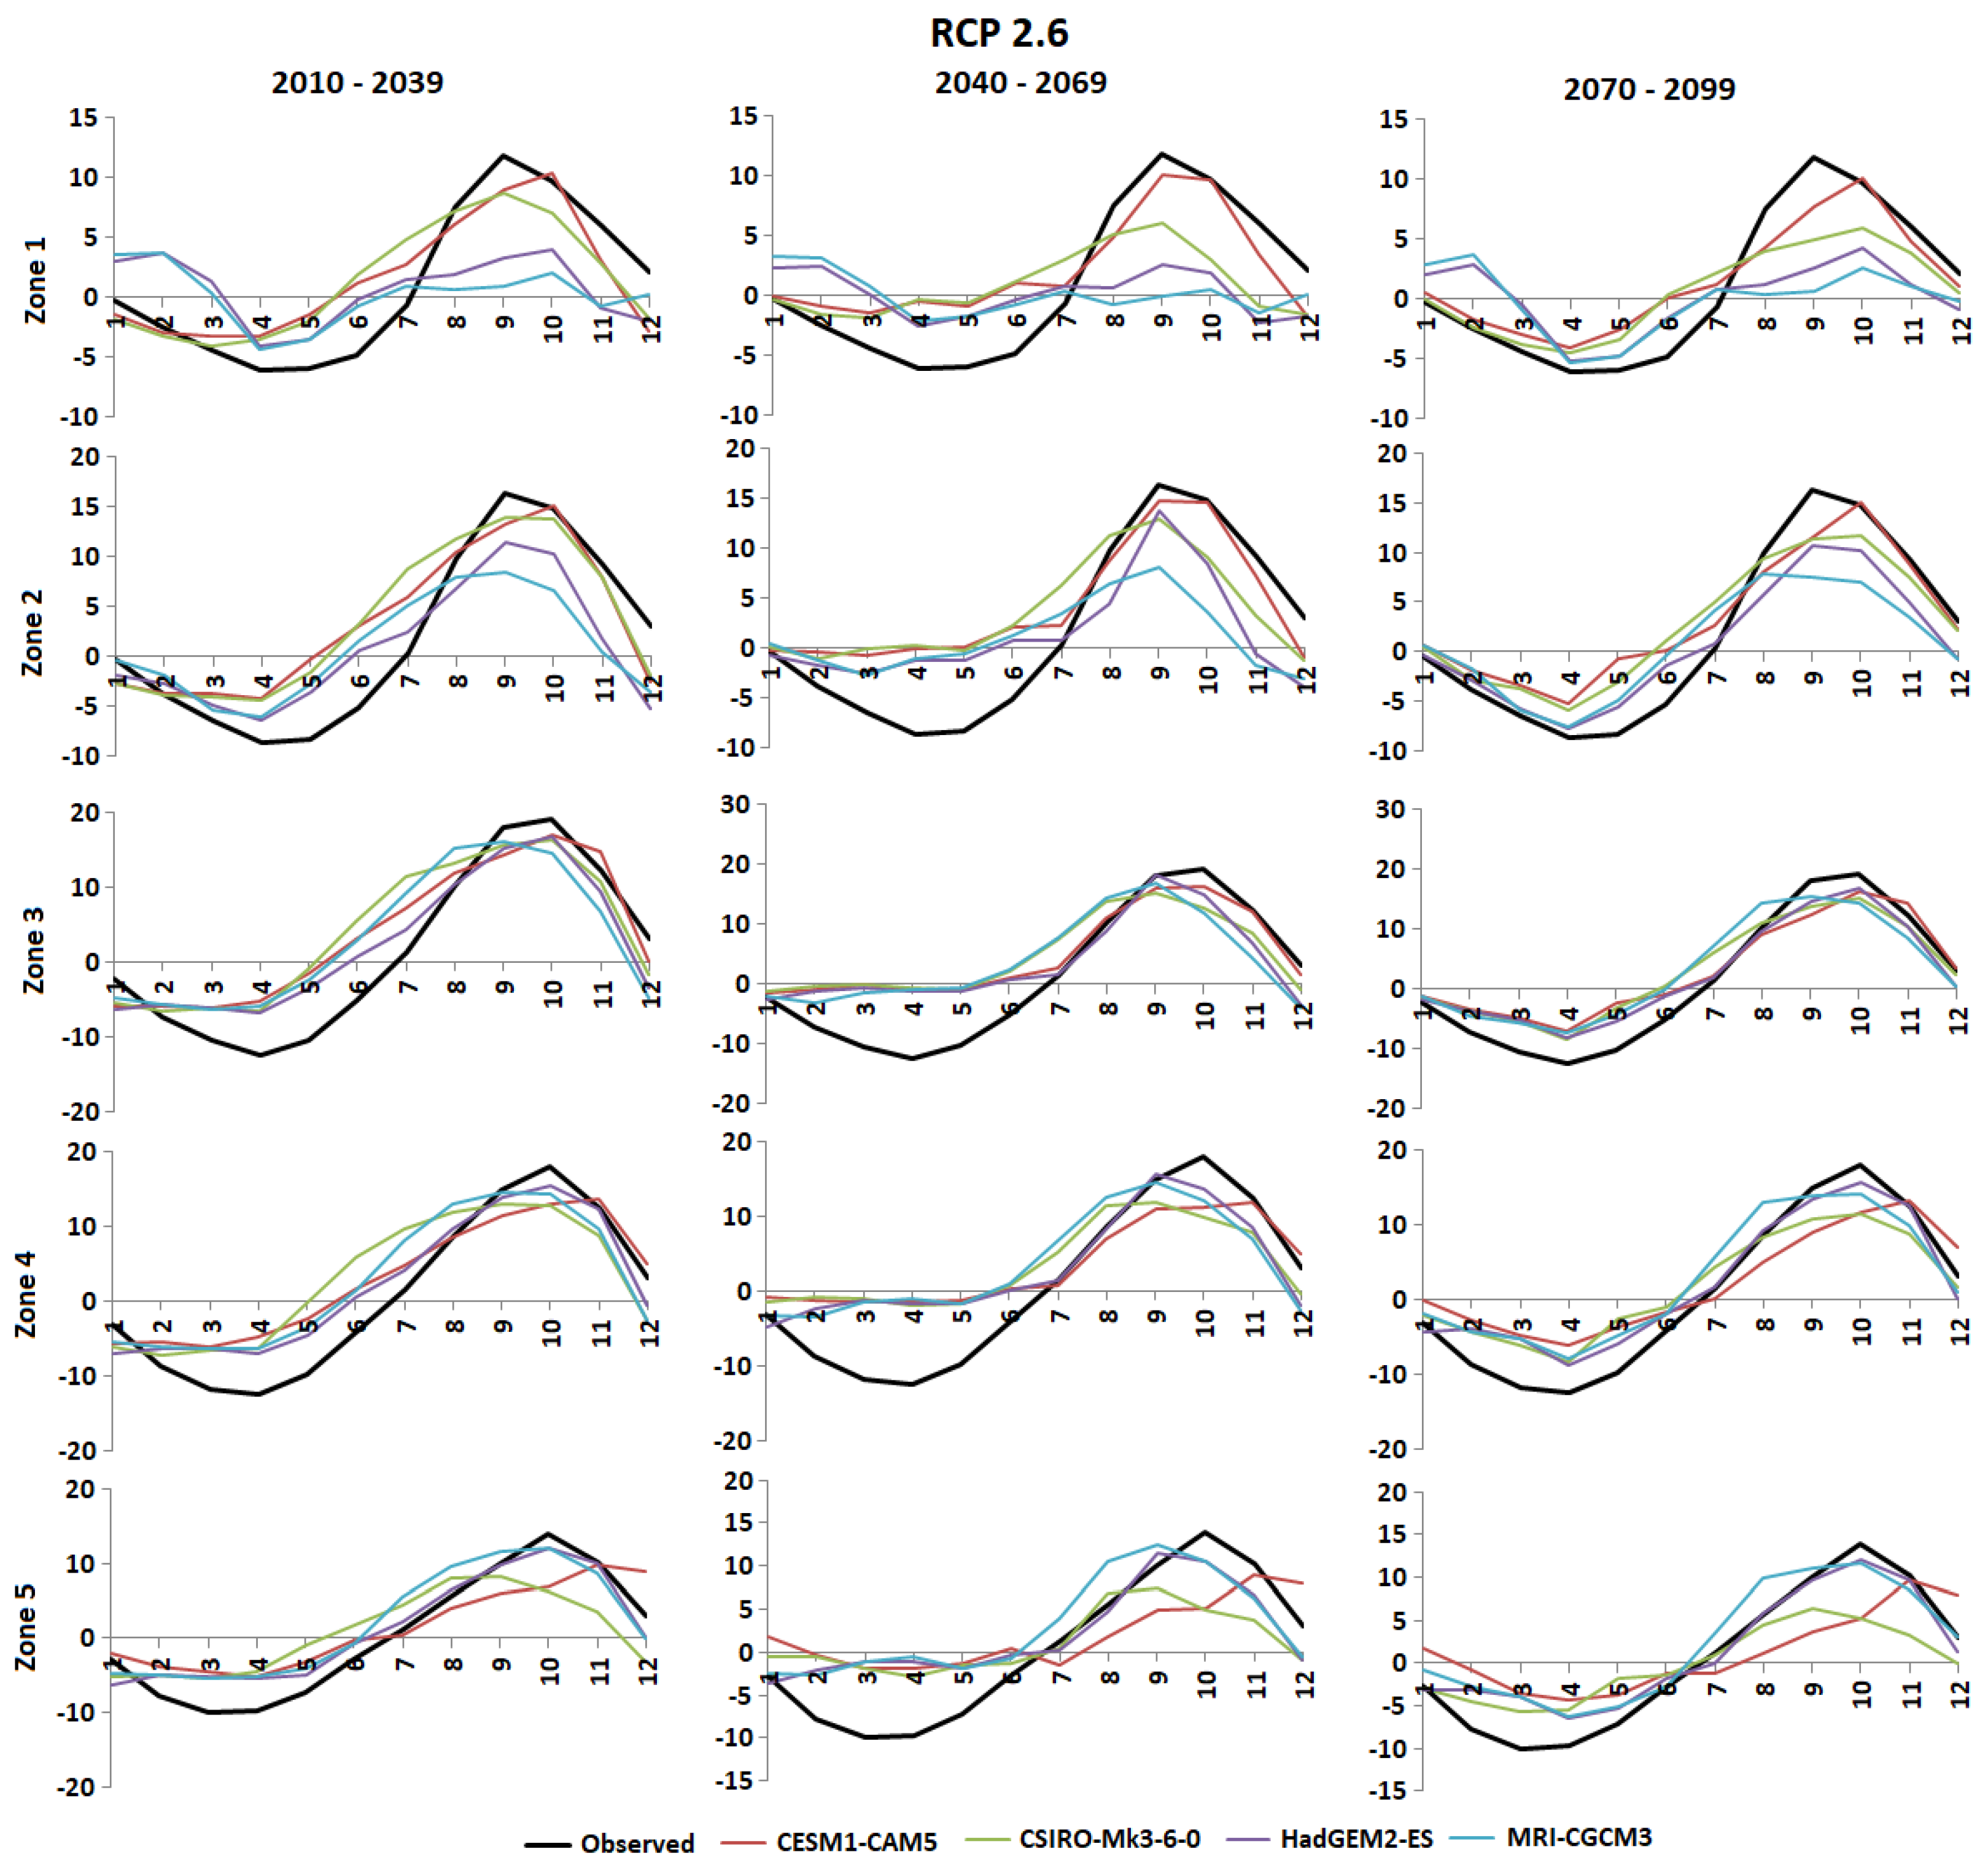
The projections of the seasonal changes in water storage during the periods 2010–2039, 2040–2069, and 2070–2099 are presented in Figure 4 and Figure 5 for RCPs 2.6 and 8.5, respectively. The changes in water storage are different for GCMs, the RCPs, the periods, and the zones.
Under RCP 2.6, it is expected that water storage will decrease for the three periods in the range of 0–12 mm in zone 1 from projections by HadGEM2-ES and MRI-CGCM3 during the wet season (June–September). CSIRO-Mk3-6-0 and CESM1-CAM5 also showed decreases but to a lesser extent than those of the other GCMs. During the peak of the wet season, decreases in water storage are expected to be 8, 5, 4, and 5 mm in zones 2, 3, 4, and 5, respectively, during the period 2010–2039. A high decline in water storage is also expected during the periods 2040–2069 and 2070–2099 in zones 1 and 2 but expected changes are lower in zone 3.
For RCP 8.5, water storage is expected to decrease for the three periods in the range of 0–17 mm. The highest decreases are expected in zone 4 during the period 2070–2099 based on all GCMs. The least expected decrease was in zone 3.
Similar results showing decreases in water storage during the wet season were obtained for RCP 4.5 and 6.0. These projections show that water storage is generally expected to increase during the dry season for all GCMs and under all RCPs. Storage increases for the dry season are expected to be higher during the period 2040–2069.
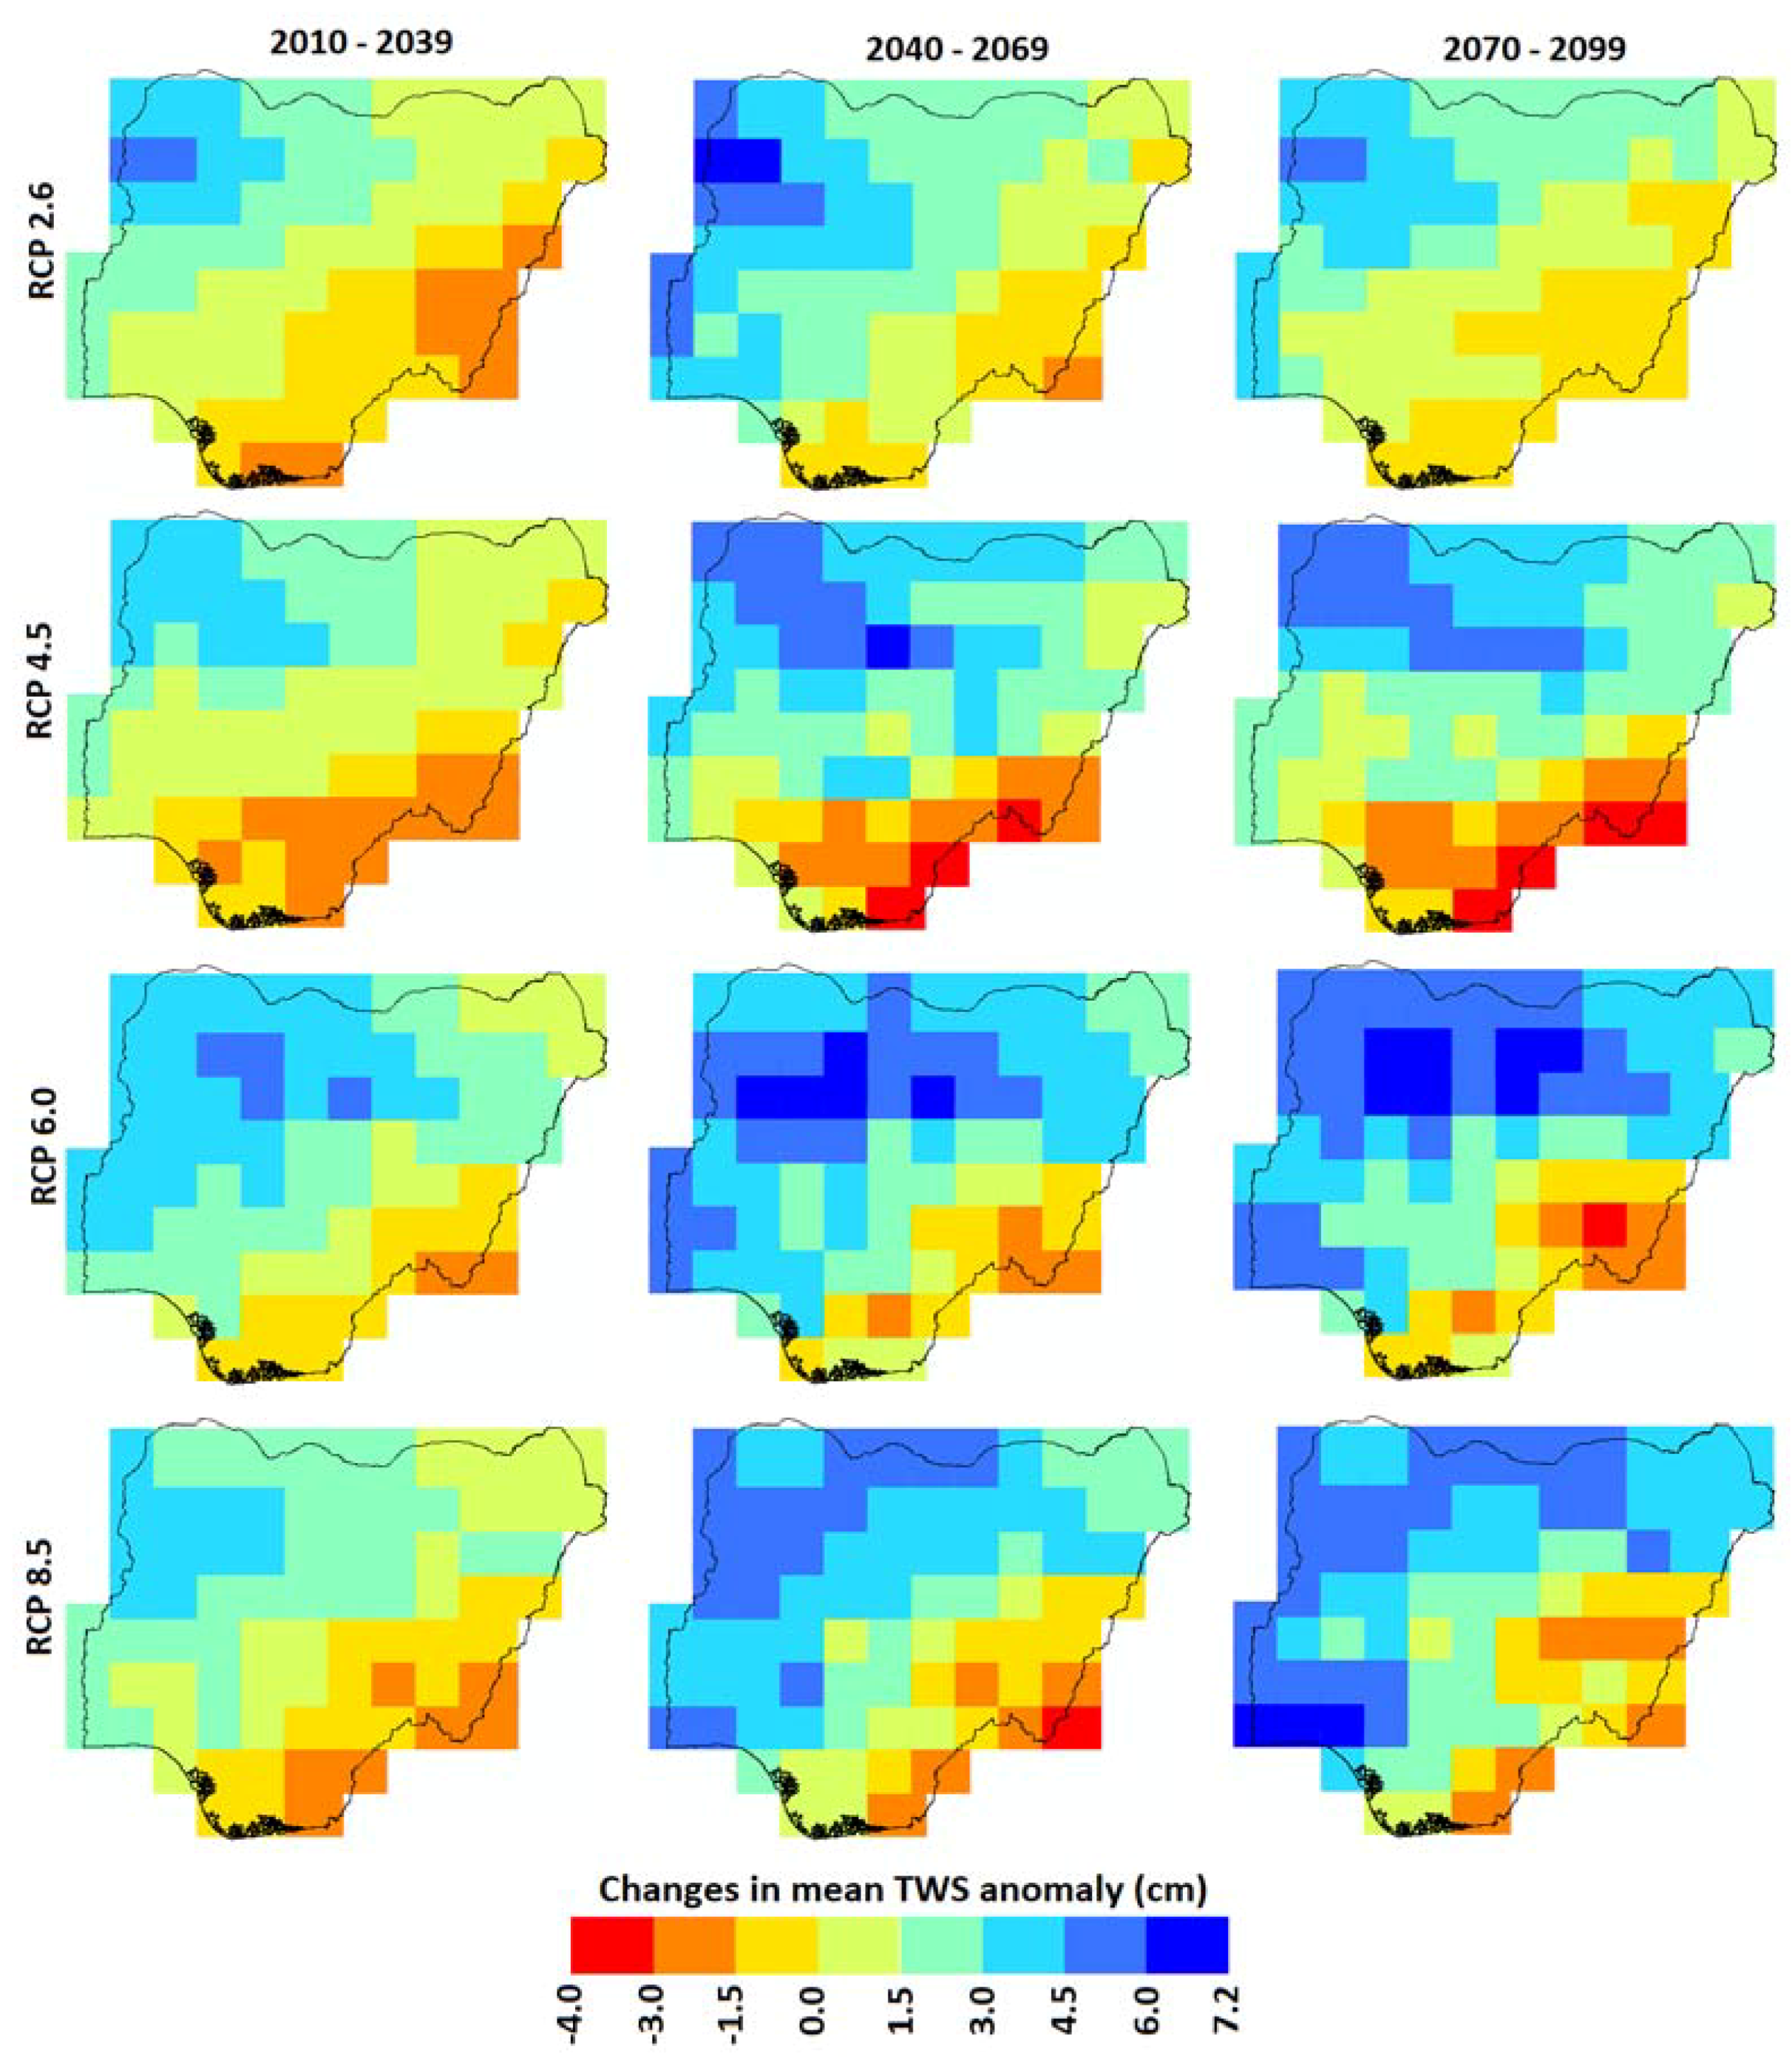
4.2.3. Annual Changes in Water Storage
The spatial projections of annual average of expected changes in water storage during the periods 2010–2039, 2040–2069, and 2070–2099 are presented in Figure 6. Projections show decreases in water storage of −3.0–0.0 mm during the period 2010–2039 in the northeast, southeast, and south-south areas of the country under RCP 2.6, 4.5, and 8.5, while the same range was in the same areas for RCP 6.0 except in the northeast area. Other parts of the country are expected to have an increase in water storage at different ranges during this period.
Expected changes in water storage during the period 2040–2069 show that decreases will be highest reaching −4.0 mm under RCPs 4.5 and 8.5 at the southeast of the country. During this period, some locations are expected to have storage increases reaching up to 7.2 mm. During the period 2070–2099, the decreases in water storage will be up to −1.5 mm under RCPs 2.6 and 8.5, while they will be up to −3.0 mm under RCPs 4.5 and 6.0. Decreases will be more pronounced at the southeast and south–south areas. It is expected that water storage will increase in most parts of the north of the country.
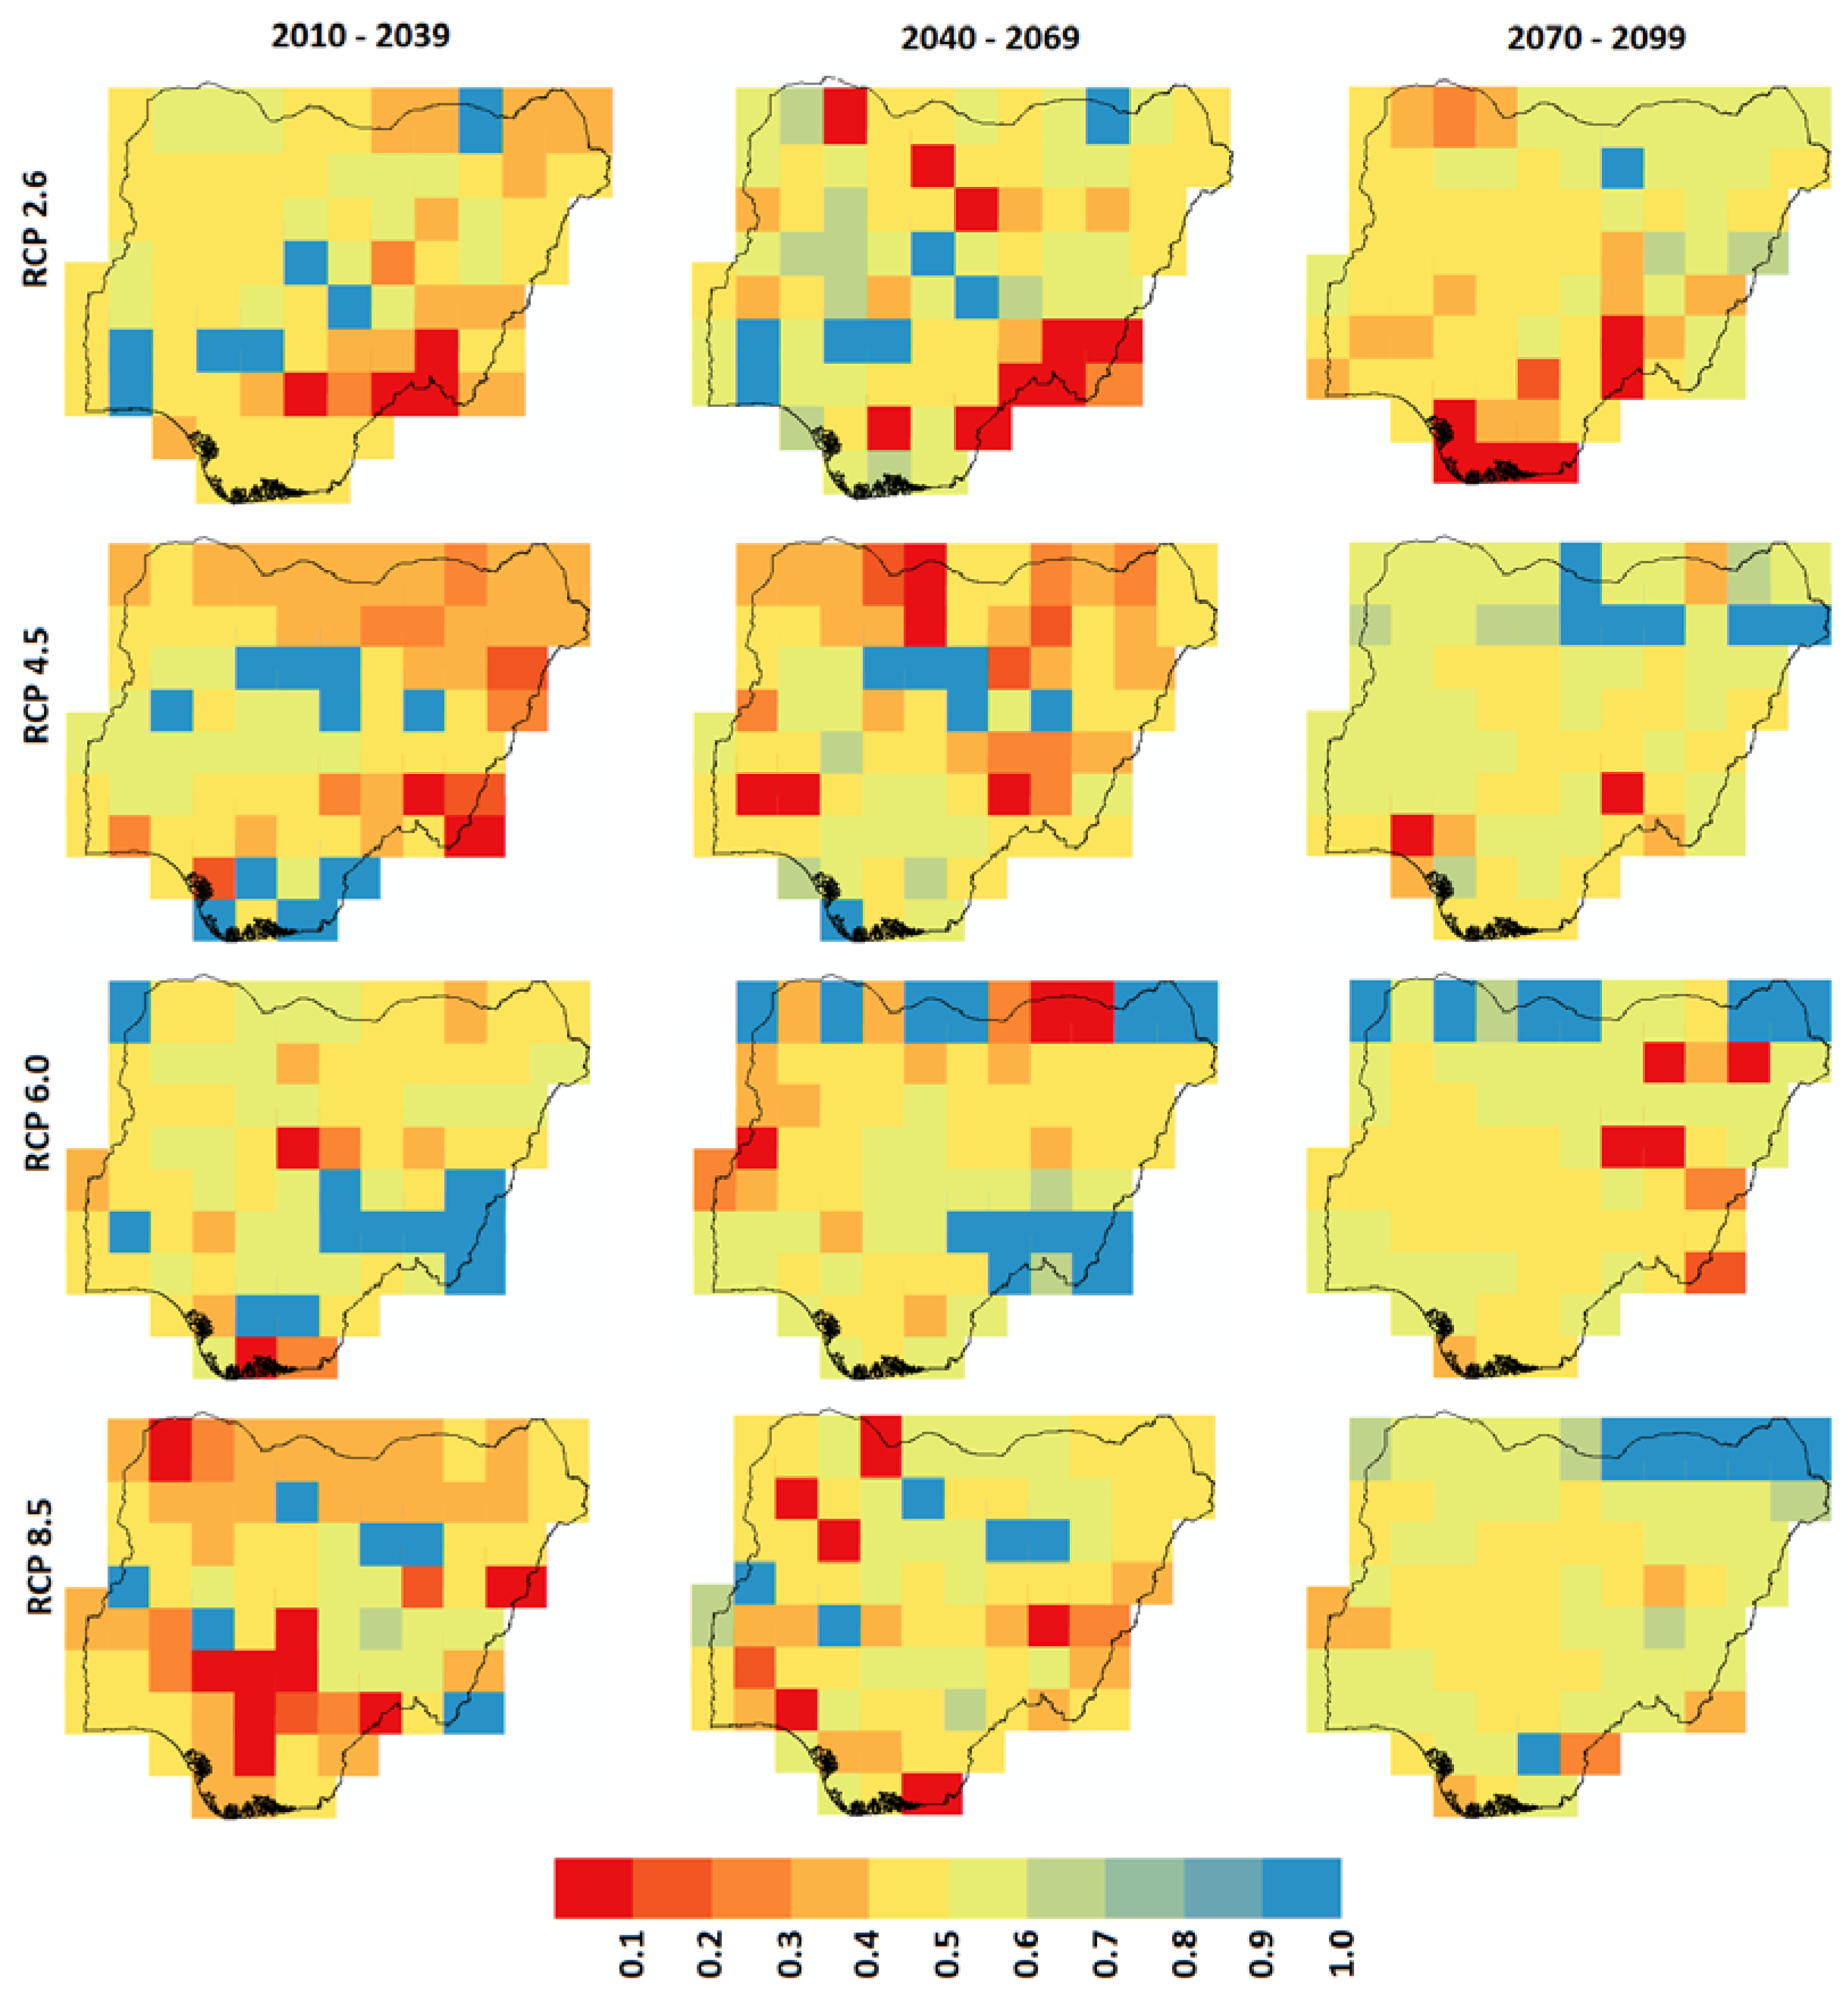
4.2.4. Spatial Assessment of Changes in Future Sustainability in Water Resources
The spatial distributions of water sustainability for the periods 2010–2039, 2040–2069, and 2070–2099 for all RCPs are presented in Figure 7. There are variations in the sustainability in water resources for the three periods and RCPs. During the period 2010–2039, sustainability in water resources expected to range from 0 to 1.0, with higher groundwater sustainability in the north under RCP4.5 than under other RCPs. Water resources will also be more sustainable under RCP 4.5 in the southern area than the other RCPs during this period. More variability is expected in sustainability during the period 2040–2069. The least sustainability during this period is expected in the north under RCP 4.5 and in the south under RCP 2.6. The highest sustainability in water resources is expected during 2070–2099. This period is expected to have the highest increases in precipitation [67]. Water resources sustainability will be higher in the northeast of the country for all RCPs during this period. However, under RCP 6.0, sustainability will be low (0–0.1) in some parts of the north. RCP 8.5 shows the highest sustainability in water resources during the period 2070–2099.
4.2.5. Mean Water Storage under Different RCPs
The mean water storages during the periods 2010–2039, 2040–2069, and 2070–2099 under all RCPs are presented in Table 3. Mean water storage is expected to be the highest under RCP 6.0 during the period 2010–2039, while the lowest will be under RCP 4.5. Similarly, during the period 2040–2069, mean water storage will be highest for RCP 6.0 and the lowest for RCP 4.5. The mean water storage during the period 2070–2099 will be highest under RCP 6.0 and the lowest under RCP 2.6.
5. Discussion
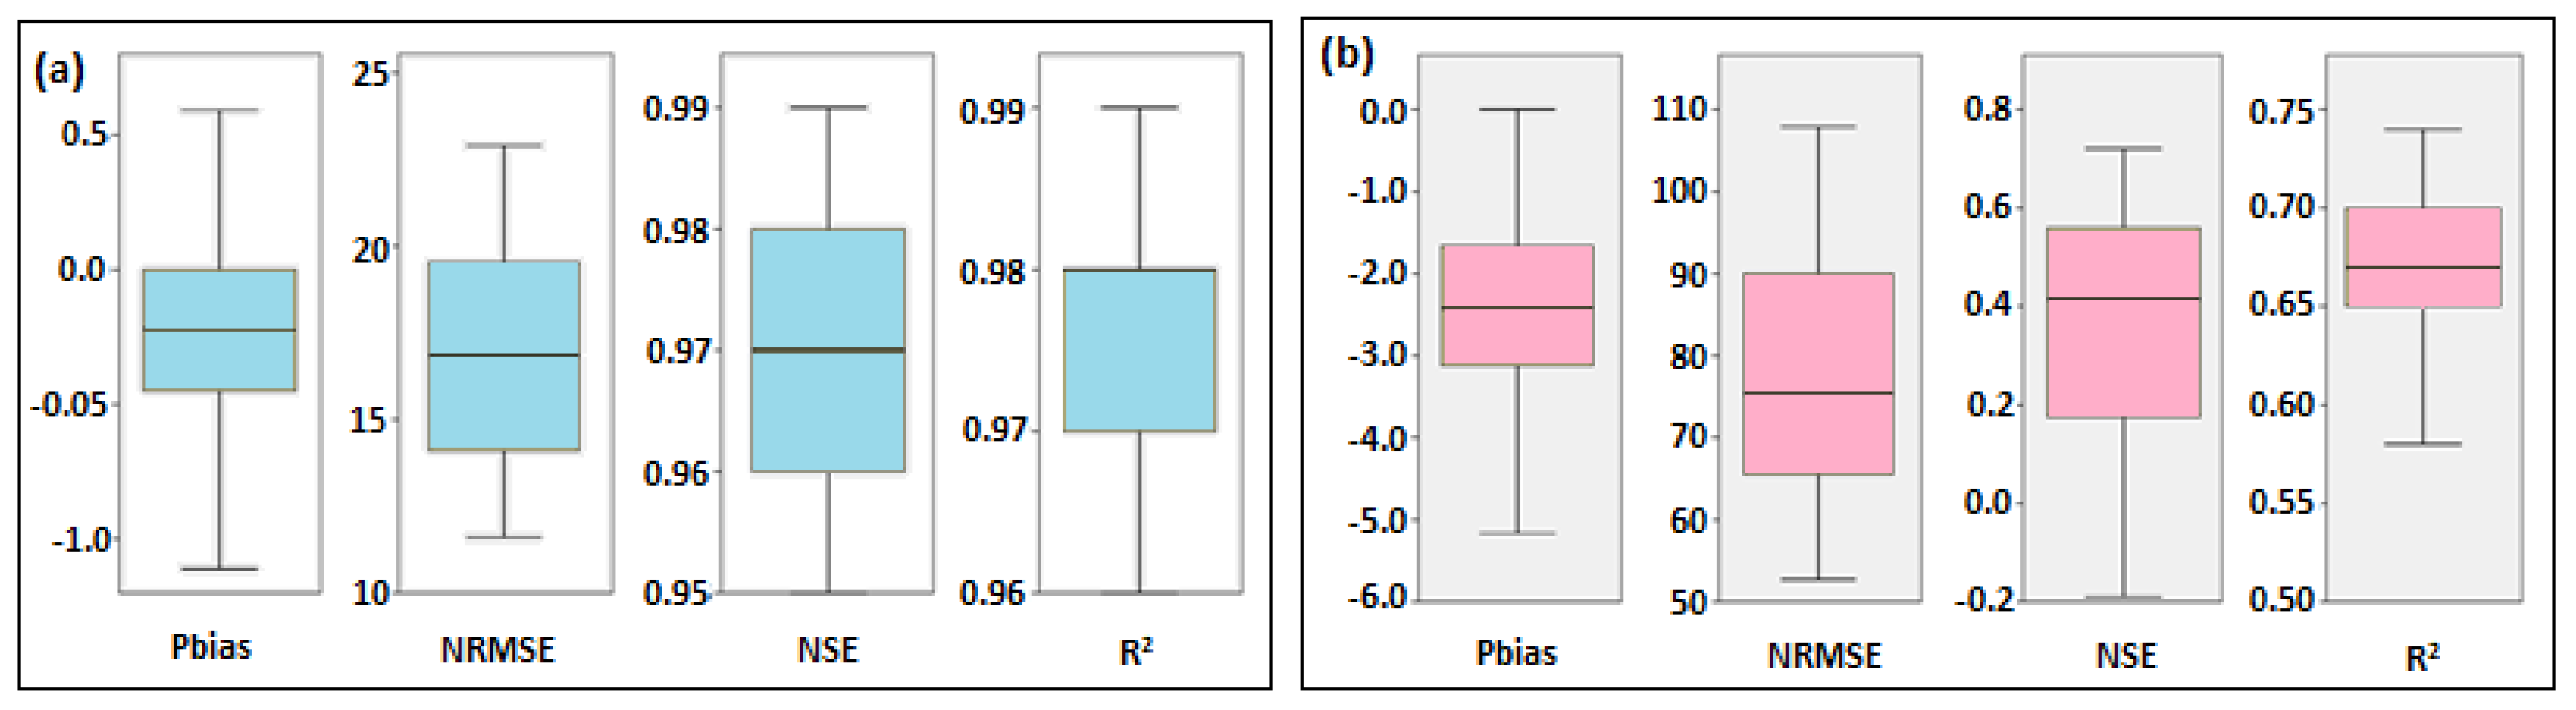
The historical GRACE TWS and climate data were used to develop water storage estimation models from rainfall and temperature using two ML models, SVM and RF. The relative model performance revealed the better performance of RF compared to SVM. The RF could estimate TWS with rainfall and temperature data with reasonable accuracy. The mean NSE of the model at different GRACE grid points during calibration and validation were 0.97 and 0.42, the coefficients of determinations (R2) were 0.98 and 0.67, the bias (%) were −0.02 and 02.4%, and NRMSE (%) of 17.2 and 74%, respectively. Studies relating to the application of machine learning (ML) in the estimation or prediction of TWS from climate data are limited.
Sun et al. [68] used an automated ML for the prediction of GRACE TWS data from different combinations of meteorological and climatic variables to fill the missing values of TWS data. They obtained a mean NSE of nearly 0.85, an R2 of about 0.95, and an NRMSE (%) equal to 9%. However, the better performance in their study was mainly due to the use of sea surface temperature (SST) and atmospheric oscillation indices, considering the long-term influence of climate variability on water availability. In addition, they used a higher amount of data for model training (85%) compared to that used in the present study (70%). The major aim of the present study was to project TWS under future climate change scenarios. Therefore, the predictor selection here was limited to only the variables that have GCM simulations for future periods. Therefore, SST and large-scale oscillation indices like El Niño and the Southern Oscillation could not be considered predictors. Nevertheless, the RF model was able to predict the TWS with reasonable accuracy. Therefore, the model was used to predict TWS with projected rainfall and temperature for different RCP scenarios.
TWS was projected for four RCP scenarios in this study. Only a few studies have been conducted in recent years for the future projection and prediction of TWS in different regions of the globe [69,70,71]. Jia et al. [69] used the MME of GCMs for the projection of TWS in China until 2050 for two RCP scenarios, RCP 2.6 and RCP 6.0. They reported a decrease in TWS over China during the period 2021–2050, with a larger rate than the historical period. They also reported a higher decrease in TWS for RCP6.0 than RCP4.5. They blamed both global warming and anthropogenic activities for declining TWS and growing water stress in the country. Hasan et al. [71] projected TWS over the Nile River Basin. They showed an increase in TWS in the basin during the rainy season for the period 2021–2050. During the dry season, they showed minor changes in TWS. Overall, they suggested a reduction in TWS by 20–30%.
The present study revealed a large heterogeneity in the trends in TWS in Nigeria. It would decrease the water stress in the north and decrease its abundance in the south, particularly the southwest. This corresponds to the previous study [36], which showed expected increases and decreases in precipitation in the north and south over Nigeria, respectively. Contrary to the Nile river basin, TWS would increase in the dry season and decrease in the wet season. This indicates a better spatial and seasonal distribution of water availability in Nigeria for all climate change scenarios.
The RCP scenarios used in this study considered future emission scenarios and socioeconomic changes, including land use change, to predict the future climate [72,73,74]. For example, RCP4.5 considers a reduction in cultivated land and an increase in forest cover. In contrast, RCP2.6 and RCP8.5 consider an increase in agriculture and a decrease in forest cover [73]. However, it should be noted that GCM considers land use changes at a coarse resolution (~200 km). Generally, urbanizations occur over a small spatial extent, which is not appropriately reflected in the land use change data considered by GCMs in climate change simulation. However, urbanization has a significant impact on the water resources of a region [75,76]. Increased imperviousness due to urbanization reduces groundwater recharge, increases surface overflow, and alters the water cycle [77]. In addition, the high consumption of water in the urban area significantly affects water resources. Those small scales changes are not considered in RCP. Therefore, the effect of urbanization or any local changes in water use or hydrological cycles is not reflected in the results presented in this study. In the future, high-resolution RCM projections can be used to evaluate such changes.
6. Conclusions
This study applied machine learning to simulate terrestrial water storage and water sustainability over Nigeria due to climate change. GRACE TWS anomaly and gridded climate data were used in the development of a water storage simulation model. The projected MME mean for rainfall and temperature of selected GCMs were used for simulating the water storage for RCP 2.6, 4.5, 6.0, and 8.5. Annual changes in water anomaly and water sustainability were assessed for three periods: 2010–2039, 2040–2069, and 2070–2099. LS was the best for downscaling GCM simulations over Nigeria, and RF was found to have better performance than SVM in modeling water storage. There was an expected decrease in water storage during the wet season (June–September) while increasing water storage during the dry season (January–May). Spatially, annual changes in water storage are expected to increase in the north and to decrease in the south, particularly in the southeast of the country. Sustainability in water resources is projected to be higher during the period 2070–2099 for all RCPs compared to the other periods and can be attributed to expected increases in rainfall during this period. The increase in water storage during the dry season and the decrease in the wet season would make the water resources more reliable. The higher reliability of water resources would make the water resources of Nigeria more sustainable if the unendurable human intervention can be avoided. It is anticipated that these results can be of importance in the planning and management of water resources in the country with a changing climate. In the future, other drivers of water sustainability such as population density, agricultural activities and water uses by different sectors can be incorporated to develop a much more reliable model. In addition, other machine learning algorithms can be employed, and their results can be compared with the results presented here.
Author Contributions
Conceptualization, M.S.S. and S.S.; Data Curation, M.S.S.; Formal Analysis, M.S.S.; Funding Acquisition, I.P.; Investigation, M.S.S. and S.S.; Methodology, M.S.S. and S.S.; Project Administration, I.P.; Resources, I.P.; Software, M.S.S.; Validation, M.S.S.; Visualization, M.S.S.; Writing—Original Draft, M.S.S.; Writing—Review and Editing, M.S.S. and S.S. All authors have read and agreed to the published version of the manuscript.
Funding
This research was funded by Seoul National University of Science and Technology.
Institutional Review Board Statement
Not applicable.
Informed Consent Statement
Not applicable.
Data Availability Statement
Data available on request.
Acknowledgments
This study was financially supported by Seoul National University of Science and Technology.
Conflicts of Interest
The authors declare no conflict of interest.
References
- Kummu, M.; Guillaume, J.H.; de Moel, H.; Eisner, S.; Flörke, M.; Porkka, M.; Siebert, S.; Veldkamp, T.I.E.; Ward, P.J. The world’s road to water scarcity: Shortage and stress in the 20th century and pathways towards sustainability. Sci. Rep. 2016, 6, 38495. [Google Scholar] [CrossRef] [Green Version]
- Rodell, M.; Famiglietti, J.S.; Wiese, D.N.; Reager, J.T.; Beaudoing, H.K.; Landerer, F.W.; Lo, M.-H. Emerging trends in global freshwater availability. Nature 2018, 557, 651–659. [Google Scholar] [CrossRef]
- Van Oel, P.R.; Mulatu, D.W.; Odongo, V.O.; Meins, F.M.; Hogeboom, R.J.; Becht, R.; Stein, A.; Onyando, J.O.; van der Veen, A. The effects of groundwater and surface water use on total water availability and implications for water management: The case of Lake Naivasha, Kenya. Water Resour. Manag. 2013, 27, 3477–3492. [Google Scholar] [CrossRef]
- Ahmed, K.; Shahid, S.; Chung, E.-S.; Ismail, T.; Wang, X.J. Spatial distribution of secular trends in annual and seasonal precipitation over Pakistan. Clim. Res. 2017, 74, 95–107. [Google Scholar] [CrossRef]
- Shiru, M.; Shahid, S.; Alias, N.; Chung, E.-S. Trend analysis of droughts during crop growing seasons of Nigeria. Sustainability 2018, 10, 871. [Google Scholar] [CrossRef] [Green Version]
- Thomas, V.; Ramón, L. Global increase in climate-related disasters. Asian Dev. Bank Econ. Working Paper Ser. 2015, 466. [Google Scholar] [CrossRef] [Green Version]
- Iqbal, Z.; Shahid, S.; Ahmed, K.; Ismail, T.; Nawaz, N. Spatial distribution of the trends in precipitation and precipitation extremes in the sub-Himalayan region of Pakistan. Theor. Appl. Climatol. 2019, 137, 2755–2769. [Google Scholar] [CrossRef]
- Salman, S.A.; Shahid, S.; Ismail, T.; Chung, E.-S.; Al-Abadi, A.M. Long-term trends in daily temperature extremes in Iraq. Atm. Res. 2017, 198, 97–107. [Google Scholar] [CrossRef]
- Khan, N.; Shahid, S.; bin Ismail, T.; Wang, X.J. Spatial distribution of unidirectional trends in temperature and temperature extremes in Pakistan. Theor. Appl. Climatol. 2019, 136, 899–913. [Google Scholar] [CrossRef]
- Shiru, M.S.; Shahid, S.; Chung, E.-S.; Alias, N. Changing characteristics of meteorological droughts in Nigeria during 1901–2010. Atm. Res. 2019, 223, 60–73. [Google Scholar] [CrossRef]
- Chen, Y.; Zong, Y.; Li, B.; Li, S.; Aitchison, J.C. Shrinking lakes in Tibet linked to the weakening Asian monsoon in the past 8.2 ka. Quat. Res. 2013, 80, 189–198. [Google Scholar] [CrossRef]
- Onamuti, O.Y.; Okogbue, E.C.; Orimoloye, I.R. Remote sensing appraisal of Lake Chad shrinkage connotes severe impacts on green economics and socio-economics of the catchment area. R. Soc. Open Sci. 2017, 4, 171120. [Google Scholar] [CrossRef] [Green Version]
- Field, C.B. Climate Change 2014–Impacts, Adaptation and Vulnerability: Regional Aspects; Cambridge University Press: Cambridge, UK, 2014. [Google Scholar]
- Ahmed, K.; Shahid, S.; Demirel, M.C.; Nawaz, N.; Khan, N. The changing characteristics of groundwater sustainability in Pakistan from 2002 to 2016. Hydrogeol. J. 2019, 27, 2485–2496. [Google Scholar] [CrossRef]
- Nistor, M.-M.; Mîndrescu, M. Climate change effect on groundwater resources in Emilia-Romagna region: An improved assessment through NISTOR-CEGW method. Quat. Int. 2019, 504, 214–228. [Google Scholar] [CrossRef]
- Le Brocque, A.F.; Kath, J.; Reardon-Smith, K. Chronic groundwater decline: A multi-decadal analysis of groundwater trends under extreme climate cycles. J. Hydrol. 2018, 561, 976–986. [Google Scholar] [CrossRef]
- Sapriza-Azuri, G.; Jódar, J.; Carrera, J.; Gupta, H.V. Toward a comprehensive assessment of the combined impacts of climate change and groundwater pumping on catchment dynamics. J. Hydrol. 2015, 529, 1701–1712. [Google Scholar] [CrossRef]
- Salem, G.S.A.; Kazama, S.; Shahid, S.; Dey, N.C. Impacts of climate change on groundwater level and irrigation cost in a groundwater dependent irrigated region. Agric. Water Manag. 2018, 208, 33–42. [Google Scholar] [CrossRef]
- Carter, R.C.; Parker, A. Climate change, population trends and groundwater in Africa. Hydrol. Sci. J. 2009, 54, 676–689. [Google Scholar] [CrossRef] [Green Version]
- Population Division of the Department of Economic and Social Affairs of the United Nations Secretariat. World Population Prospects: The 2006 Revision and World Urbanization Prospects: The 2005 Revision. Available online: https://population.un.org/wpp/ (accessed on 1 April 2021).
- Taylor, R.G.; Koussis, A.D.; Tindimugaya, C. Groundwater and climate in Africa—A review. Hydrol. Sci. J. 2009, 54, 655–664. [Google Scholar] [CrossRef]
- Al-Gamal, S.A.; Sokona, Y.; Dodo, A.-K. Climatic changes and groundwater resources in Africa. Int. J. Clim. Chang. Strat. Manag. 2009, 1, 133–145. [Google Scholar] [CrossRef]
- Boughariou, E.; Allouche, N.; Jmal, I.; Mokadem, N.; Ayed, B.; Hajji, S.; Khanfir, H.; Bouri, S. Modeling aquifer behaviour under climate change and high consumption: Case study of the Sfax region, southeast Tunisia. J. Afr. Earth Sci. 2018, 141, 118–129. [Google Scholar] [CrossRef]
- Salem, G.S.A.; Kazama, S.; Komori, D.; Shahid, S.; Dey, N.C. Optimum abstraction of groundwater for sustaining groundwater level and reducing irrigation cost. Water Resour. Manag. 2017, 31, 1947–1959. [Google Scholar] [CrossRef]
- MacDonald, A.M.; Cobbing, J.; Davies, J. Developing Groundwater for Rural Water Supply in Nigeria: A Report of the May 2005 Training Course and Summary of Groundwater Issues in the Eight Focus States; British Geological Survey Commissioned Report, CR/05/219N; British Geological Survey: Keyworth, UK, 2005; pp. 1–32. [Google Scholar]
- Adelana, S.M.A.; Olasehinde, P.I.; Vrbka, P. A quantitative estimation of groundwater recharge in parts of Sokoto Basin, Nigeria. J. Environ. Hydrol. 2006, 14, 1–16. [Google Scholar]
- Rodell, M.; Velicogna, I.; Famiglietti, J.S. Satellite-based estimates of groundwater depletion in India. Nature 2009, 460, 999–1002. [Google Scholar] [CrossRef] [Green Version]
- Sediqi, M.N.; Shiru, M.S.; Nashwan, M.S.; Ali, R.; Wang, S.A.X.; Ahmed, K.; Shahid, S.; Asaduzzaman, M.; Manawi, S.M.A. Spatio-Temporal Pattern in the Changes in Availability and Sustainability of Water Resources in Afghanistan. Sustainability 2019, 11, 5836. [Google Scholar] [CrossRef] [Green Version]
- Xu, M.; Ye, B.S.; Zhao, Q.D. Terrestrial Water storge changes in the Tangnaihai Basin measured by GRACE during 2003-2008, China. Appl. Mech. Mater. 2013, 316, 520–526. [Google Scholar] [CrossRef]
- Thomas, B.F.; Caineta, J.; Nanteza, J. Global assessment of groundwater sustainability based on storage anomalies. Geophy. Res. Lett. 2017, 44, 11–445. [Google Scholar] [CrossRef] [Green Version]
- Zhang, D.; Liu, X.; Bai, P. Assessment of hydrological drought and its recovery time for eight tributaries of the Yangtze River (China) based on downscaled GRACE data. J. Hydrol. 2019, 568, 592–603. [Google Scholar] [CrossRef]
- Loucks, D.P. Sustainable water resources management. Water Int. 2000, 25, 3–10. [Google Scholar] [CrossRef]
- Jia, Z.; Cai, Y.; Chen, Y.; Zeng, W. Regionalization of water environmental carrying capacity for supporting the sustainable water resources management and development in China. Resour. Conserv. Recycl. 2018, 134, 282–293. [Google Scholar] [CrossRef]
- Asefa, T.; Clayton, J.; Adams, A.; Anderson, D. Performance evaluation of a water resources system under varying climatic conditions: Reliability, Resilience, Vulnerability and beyond. J. Hydrol. 2014, 508, 53–65. [Google Scholar] [CrossRef]
- Sung, J.; Chung, E.-S.; Shahid, S. Reliability–Resiliency–Vulnerability approach for drought analysis in South Korea using 28 GCMs. Sustainability 2018, 10, 3043. [Google Scholar] [CrossRef] [Green Version]
- Shiru, M.S.; Shahid, S.; Chung, E.-S.; Alias, N.; Scherer, L. A MCDM-based framework for selection of general circulation models and projection of spatio-temporal rainfall changes: A case study of Nigeria. Atm. Res. 2019, 225, 1–16. [Google Scholar] [CrossRef]
- Shiru, M.S.; Chung, E.-S.; Shahid, S.; Alias, N. GCM selection and temperature projection of Nigeria under different RCPs of the CMIP5 GCMS. Theor. Appl. Clim. 2020, 141, 1611–1627. [Google Scholar] [CrossRef]
- Homsi, R.; Shiru, M.S.; Shahid, S.; Tarmizi Ismail, S.B.H.; Al-Ansari, N.; Chau, K.-W.; Yaseen, Z.M. Precipitation projection using a CMIP5 GCM ensemble model: A regional investigation of Syria. Eng. Appl. Comp. Fluid Mech. 2020, 14, 90–106. [Google Scholar] [CrossRef]
- Salman, S.A.; Shahid, S.; Afan, H.A.; Shiru, M.S.; Al-Ansari, N.; Yaseen, Z.M. Changes in Climatic Water Availability and Crop Water Demand for Iraq Region. Sustainability 2020, 12, 3437. [Google Scholar] [CrossRef] [Green Version]
- Manawi, S.M.A.; Nasir, K.A.M.; Shiru, M.S.; Hotaki, S.F.; Sediqi, M.N. Urban Flooding in the Northern Part of Kabul City: Causes and Mitigation. Earth Sys. Environ. 2020, 4, 1–12. [Google Scholar] [CrossRef]
- Oteze, G.E. Water resources in Nigeria. Environ. Geol. 1981, 3, 177–184. [Google Scholar] [CrossRef]
- Swenson, S.C. GRACE Monthly Land Water Mass Grids NETCDF Release 5.0; The Physical Oceanography Distributed Active Archive Center: Pasadena, CA, USA, 2012.
- Becker, A.; Finger, P.; Meyer-Christoffer, A.; Rudolf, B.; Schamm, K.; Schneider, U.; Ziese, M. A description of the global land-surface precipitation data products of the Global Precipitation Climatology Centre with sample applications including centennial (trend) analysis from 1901–present. Earth Syst. Sci. Data 2013, 5, 71–99. [Google Scholar] [CrossRef] [Green Version]
- Harris, I.P.D.J.; Jones, P.D.; Osborn, T.J.; Lister, D.H. Updated high-resolution grids of monthly climatic observations—The CRU TS3. 10 Dataset. Int. J. Clim. 2014, 34, 623–642. [Google Scholar] [CrossRef] [Green Version]
- Castellazzi, P.; Martel, R.; Galloway, D.L.; Longuevergne, L.; Rivera, A. Assessing groundwater depletion and dynamics using GRACE and InSAR: Potential and limitations. Groundwater 2016, 54, 768–780. [Google Scholar] [CrossRef] [Green Version]
- Bonsor, H.C.; Shamsudduha, M.; Marchant, B.P.; Macdonald, A.M.; Taylor, R.G. Seasonal and decadal groundwater changes in African sedimentary aquifers estimated using GRACE products and LSMs. Remote Sens. 2018, 10, 904. [Google Scholar] [CrossRef] [Green Version]
- Hassan, A.; Jin, S. Water storage changes and balances in Africa observed by GRACE and hydrologic models. Geod. Geodyn. 2016, 7, 39–49. [Google Scholar] [CrossRef] [Green Version]
- Spinoni, J.; Naumann, G.; Carrao, H.; Barbosa, P.; Vogt, J. World drought frequency, duration, and severity for 1951–2010. Int. J. Clim. 2014, 34, 2792–2804. [Google Scholar] [CrossRef] [Green Version]
- Dinku, T.; Connor, S.J.; Ceccato, P.; Ropelewski, C.F. Comparison of global gridded precipitation products over a mountainous region of Africa. Int. J. Clim. 2008, 28, 1627–1638. [Google Scholar] [CrossRef]
- Yang, W.; Seager, R.; Cane, M.A.; Lyon, B. The East African long rains in observations and models. J. Clim. 2014, 27, 7185–7202. [Google Scholar] [CrossRef]
- Shiru, M.S.; Shahid, S.; Dewan, A.; Chung, E.-S.; Alias, N.; Ahmed, K.; Hassan, Q.K. Projection of meteorological droughts in Nigeria during growing seasons under climate change scenarios. Sci. Rep. 2020, 10, 1–18. [Google Scholar]
- Wolski, P.; Todd, M.C.; Murray-Hudson, M.A.; Tadross, M. Multi-decadal oscillations in the hydro-climate of the Okavango River system during the past and under a changing climate. J. Hydrol. 2012, 475, 294–305. [Google Scholar] [CrossRef] [Green Version]
- Omondi, P.A.; Awange, J.L.; Forootan, E.; Ogallo, L.A.; Barakiza, R.; Girmaw, G.B.; Fesseha, I.; Kululetera, V.; Kilembe, C.; Mbati, M.M. Changes in temperature and precipitation extremes over the Greater Horn of Africa region from 1961 to 2010. Int. J. Clim. 2014, 34, 1262–1277. [Google Scholar] [CrossRef]
- Taylor, K.E.; Stouffer, R.J.; Meehl, G.A. An overview of CMIP5 and the experiment design. Bull. Am. Meteorol. Soc. 2012, 93, 485–498. [Google Scholar] [CrossRef] [Green Version]
- Teutschbein, C.; Seibert, J. Bias correction of regional climate model simulations for hydrological climate-change impact studies: Review and evaluation of different methods. J. Hydrol. 2012, 456, 12–29. [Google Scholar] [CrossRef]
- Piani, C.; Haerter, J.O.; Coppola, E. Statistical bias correction for daily precipitation in regional climate models over Europe. Theor. Appl. Clim. 2010, 99, 187–192. [Google Scholar] [CrossRef] [Green Version]
- Leander, R.; Buishand, T.A. Resampling of regional climate model output for the simulation of extreme river flows. J. Hydrol. 2007, 332, 487–496. [Google Scholar] [CrossRef]
- Moron, V.; Robertson, A.W.; Ward, M.N.; Ndiaye, O. Weather types and rainfall over Senegal. Part II: Downscaling of GCM simulations. J. Clim. 2008, 21, 288–307. [Google Scholar] [CrossRef]
- Leander, R.; Buishand, T.A.; van den Hurk, B.J.J.M.; de Wit, M.J.M. Estimated changes in flood quantiles of the river Meuse from resampling of regional climate model output. J. Hydrol. 2008, 351, 331–343. [Google Scholar] [CrossRef]
- Schmidli, J.; Frei, C.; Vidale, P.L. Downscaling from GCM precipitation: A benchmark for dynamical and statistical downscaling methods. Int. J. Clim. 2006, 26, 679–689. [Google Scholar] [CrossRef]
- Hay, L.E.; Clark, M.P. Use of statistically and dynamically downscaled atmospheric model output for hydrologic simulations in three mountainous basins in the western United States. J. Hydrol. 2003, 282, 56–75. [Google Scholar] [CrossRef]
- Hay, L.E.; Wilby, R.L.; Leavesley, G.H. A comparison of delta change and downscaled GCM scenarios for three mountainous basins in the United States 1. JAWRA J. Am. Water Resour. Assoc. 2000, 36, 387–397. [Google Scholar] [CrossRef]
- Breiman, L.; Friedman, J.; Stone, C.J.; Olshen, R.A. Classification and Regression Trees; CRC Press: Boca Raton, FL, USA, 1984. [Google Scholar]
- Breiman, L. Random forests. Mach. Learn. 2001, 45, 5–32. [Google Scholar] [CrossRef] [Green Version]
- Stumpf, A.; Kerle, N. Object-oriented mapping of landslides using Random Forests. Remote Sens. Environ. 2011, 115, 2564–2577. [Google Scholar] [CrossRef]
- Thomas, B.F.; Famiglietti, J.S.; Landerer, F.W.; Wiese, D.N.; Molotch, N.P.; Argus, D.F. GRACE groundwater drought index: Evaluation of California Central Valley groundwater drought. Remote Sens. Environ. 2017, 198, 384–392. [Google Scholar] [CrossRef]
- Shiru, M.S.; Shahid, S.; Shiru, S.; Chung, E.-S.; Alias, N.; Ahmed, K.; Dioha, E.C.; Sa’adi, Z.; Salman, S.; Noor, M. Challenges in water resources of Lagos mega city of Nigeria in the context of climate change. J. Water Clim. Chang. 2020, 11, 1067–1083. [Google Scholar] [CrossRef]
- Sun, A.Y.; Scanlon, B.R.; Save, H.; Rateb, A. Reconstruction of GRACE total water storage through automated machine learning. Water Resour. Res. 2020, 57, e2020WR028666. [Google Scholar]
- Jia, B.; Cai, X.; Zhao, F.; Liu, J.; Chen, S.; Luo, X.; Xie, Z.; Xu, J. Potential future changes of terrestrial water storage based on climate projections by ensemble model simulations. Adv. Water Resour. 2020, 142, 103635. [Google Scholar] [CrossRef]
- Ahi, G.O.; Cekim, H.O. Long-term temporal prediction of terrestrial water storage changes over global basins using GRACE and limited GRACE-FO data. Acta Geod. Geophys. 2021, 1–24. [Google Scholar] [CrossRef]
- Hasan, E.; Tarhule, A.; Kirstetter, P.E. Twentieth and Twenty-First Century Water Storage Changes in the Nile River Basin from GRACE/GRACE-FO and Modeling. Remote Sens. 2021, 13, 953. [Google Scholar] [CrossRef]
- Davies-Barnard, T.; Valdes, P.J.; Singarayer, J.S.; Pacifico, F.M.; Jones, C.D. Full effects of land use change in the representative concentration pathways. Environ. Res. Lett. 2014, 9, 114014. [Google Scholar] [CrossRef] [Green Version]
- Hurtt, G.C.; Chini, L.P.; Frolking, S.; Betts, R.A.; Feddema, J.; Fischer, G.; Fisk, J.P.; Hibbard, K.; Houghton, R.A.; Janetos, A.; et al. Harmonization of land-use scenarios for the period 1500–2100: 600 years of global gridded annual land-use transitions, wood harvest, and resulting secondary lands. Clim. Chang. 2011, 109, 117–161. [Google Scholar] [CrossRef] [Green Version]
- Van Vuuren, D.P.; Edmonds, J.; Kainuma, M.; Riahi, K.; Thomson, A.; Hibbard, K.; Hurtt, G.C.; Kram, T.; Krey, V.; Lamarque, J.F.; et al. The representative concentration pathways: An overview. Clim. Chang. 2011, 109, 5–31. [Google Scholar] [CrossRef]
- Donaldson, S. The Effects of Urbanization on the Water Cycle; Nevada Cooperative Extension: Reno, NV, USA, 2004; pp. 4–43. [Google Scholar]
- Welty, C. The Water Environment of Cities: The Urban Water Budget; Springer: Boston, MA, USA, 2009; pp. 17–28. [Google Scholar]
- Pour, S.H.; Abd Wahab, A.K.; Shahid, S.; Dewan, A. Low impact development techniques to mitigate the impacts of climate-change-induced urban floods: Current trends, issues and challenges. Sustain. Cities Soc. 2020, 62, 102373. [Google Scholar] [CrossRef]
Figure 1.
Ecological zones and topography of Nigeria.

Figure 2.
Scatter plots of observed and simulated water storage during RF and SVM model calibration and validation.
Figure 2.
Scatter plots of observed and simulated water storage during RF and SVM model calibration and validation.

Figure 3.
Boxplots of performance metrics of the models during (a) calibration and (b) validation.

Figure 4.
Projection of water storage (meters) (y axis) in different months (x axis) during the periods 2010–2039, 2040–2069, and 2070–2099 under RCP 2.6 using selected GCMs.
Figure 4.
Projection of water storage (meters) (y axis) in different months (x axis) during the periods 2010–2039, 2040–2069, and 2070–2099 under RCP 2.6 using selected GCMs.

Figure 5.
Projection of water storage (meters) (y axis) in different months (x axis) during the periods 2010–2039, 2040–2069, and 2070–2099 under RCP 8.5 using selected GCMs.
Figure 5.
Projection of water storage (meters) (y axis) in different months (x axis) during the periods 2010–2039, 2040–2069, and 2070–2099 under RCP 8.5 using selected GCMs.

Figure 6.
Changes in water storage during the periods 2010–2039, 2040–2069, and 2070–2099 for different RCPs.
Figure 6.
Changes in water storage during the periods 2010–2039, 2040–2069, and 2070–2099 for different RCPs.

Figure 7.
Spatial patterns of sustainability in water resources during the periods 2010–2039, 2040–2069, and 2070–2099.
Figure 7.
Spatial patterns of sustainability in water resources during the periods 2010–2039, 2040–2069, and 2070–2099.


Table 1.
Information about the global climate models considered in this study.
| No | Institution | Model Name | Resolution (Lon × Lat) |
|---|---|---|---|
| 1 | National Center for Atmospheric Research, USA | CESM1-CAM5 | 1.25 × 0.95 |
| 2 | Commonwealth Scientific and Industrial Research Organization, Australia | CSIRO-Mk3-6-0 | 1.875 × 1.875 |
| 3 | Met Office Hadley Centre, UK | HadGEM2-ES | 1.875 × 1.25 |
| 4 | Meteorological Research Institute | MRI-CGCM3 | 1.25 × 1.25 |
Table 2.
Results of performance metrics of the selected bias correction methods for downscaling.
| GCM | Bias Correction Method | NRMSE | PBIAS | NSE | RSD | MD |
|---|---|---|---|---|---|---|
| CESM1-CAM5 | Linear Scaling | 38.5 | 0 | 0.85 | 0.99 | 0.84 |
| General Quantile Mapping | 100.2 | −100 | −0.01 | 0 | 0.66 | |
| Power Transform | 53.2 | 0 | 0.72 | 1.04 | 0.76 | |
| Gamma Quantile Mapping | 45.8 | 0.4 | 0.79 | 0.97 | 0.82 | |
| GCM | 79.6 | −18.1 | 0.36 | 1.14 | 0.68 | |
| CSIRO-Mk3.6.0 | Linear Scaling | 44 | 0 | 0.81 | 0.95 | 0.82 |
| General Quantile Mapping | 100 | −100 | 0 | 0 | 0.66 | |
| Power Transform | 47.5 | 0 | 0.77 | 1.06 | 0.79 | |
| Gamma Quantile Mapping | 40.6 | 0.8 | 0.83 | 0.98 | 0.84 | |
| GCM | 82.1 | −42.9 | 0.33 | 0.65 | 0.65 | |
| HadGEM2-ES | Linear Scaling | 34.6 | 0 | 0.88 | 1 | 0.86 |
| General Quantile Mapping | 100 | −100 | 0 | 0 | 0.67 | |
| Power Transform | 0 | 0 | 0.73 | 1.04 | 0.77 | |
| Gamma Quantile Mapping | 44.7 | 1.2 | 0.8 | 0.97 | 0.82 | |
| GCM | 42.9 | −7 | 0.82 | 1.06 | 0.83 | |
| MRI-CGCM3 | Linear Scaling | 30.7 | 0 | 0.91 | 1.01 | 0.88 |
| General Quantile Mapping | 100 | −100 | 0 | 0 | 0.66 | |
| Power Transform | 48.8 | 0 | 0.76 | 1.06 | 0.78 | |
| Gamma Quantile Mapping | 41.1 | 4.3 | 0.83 | 0.95 | 0.83 | |
| GCM | 59 | 23 | 0.65 | 1.2 | 0.8 |
Table 3.
Mean water storages (mm) during the period 2010–2039, 2040–2069, 2070–2099 for different RCPs.
Table 3.
Mean water storages (mm) during the period 2010–2039, 2040–2069, 2070–2099 for different RCPs.
| 2010–2039 | 2040–2069 | 2070–2099 | |
|---|---|---|---|
| RCP 2.6 | 0.876 | 2.099 | 1.367 |
| RCP 4.5 | 0.759 | 1.895 | 1.628 |
| RCP 6.0 | 2.166 | 3.121 | 3.131 |
| RCP 8.5 | 1.165 | 2.583 | 2.798 |
Publisher’s Note: MDPI stays neutral with regard to jurisdictional claims in published maps and institutional affiliations. |
© 2021 by the authors. Licensee MDPI, Basel, Switzerland. This article is an open access article distributed under the terms and conditions of the Creative Commons Attribution (CC BY) license (https://creativecommons.org/licenses/by/4.0/).
Share and Cite
MDPI and ACS Style
Shiru, M.S.; Shahid, S.; Park, I. Projection of Water Availability and Sustainability in Nigeria Due to Climate Change. Sustainability 2021, 13, 6284. https://0-doi-org.brum.beds.ac.uk/10.3390/su13116284
AMA Style
Shiru MS, Shahid S, Park I. Projection of Water Availability and Sustainability in Nigeria Due to Climate Change. Sustainability. 2021; 13(11):6284. https://0-doi-org.brum.beds.ac.uk/10.3390/su13116284
Chicago/Turabian StyleShiru, Mohammed Sanusi, Shamsuddin Shahid, and Inhwan Park. 2021. "Projection of Water Availability and Sustainability in Nigeria Due to Climate Change" Sustainability 13, no. 11: 6284. https://0-doi-org.brum.beds.ac.uk/10.3390/su13116284
Note that from the first issue of 2016, this journal uses article numbers instead of page numbers. See further details here.