Article

Benthic Community Assessment of Commercial Oyster (Crassostrea virginica) Gear in Delaware Inland Bays

by
Melanie Fuoco
1,
Scott Borsum
1,
Zohreh Mazaheri Kouhanestani
2 and
Gulnihal Ozbay
1,*
1
Department of Agriculture and Natural Resources, Delaware State University, Dover, DE 19901, USA
2
Department of Fisheries and Environmental Sciences, Gorgan University of Agricultural Science and Natural Resources, Gorgan, Golestan 49189-43464, Iran
*
Author to whom correspondence should be addressed.
Sustainability 2021, 13(11), 6480; https://0-doi-org.brum.beds.ac.uk/10.3390/su13116480
Submission received: 1 May 2021 / Revised: 27 May 2021 / Accepted: 28 May 2021 / Published: 7 June 2021
(This article belongs to the Collection Aquaculture and Environmental Impacts)

Abstract

:
Oyster aquaculture is one of several methods for the restoration of Delaware Inland Bays; however, little is known about its potential impacts on the benthic community of the bays. In this study, water quality parameters were measured and polychaetes were collected from 24 sampling locations at Rehoboth, Indian River, and Little Assawoman Bays from July to October 2016 and 2017. We aimed to assess the impact of Eastern oyster farming under different stocking densities (50 and 250 oysters/gear) and distances away from the sites where the off-bottom gears are implemented (under gears, one meter, and five meters away). No significant impact was detected on polychaetes’ abundance and richness in regard to the presence of oyster gears. The number of polychaetes and species richness was significantly higher in Little Assawoman Bay in comparison to the Indian River and Rehoboth Bays. Results showed that the Ulva lactuca bloom that happened in 2016 could negatively impact the low abundance and richness observed in the polychaetes community. Similarly, the values of polychaetes abundance and species richness did not change significantly in samples that were taken far from the oyster gears. Dominant polychaetes families were Capitellidae and Glyceridae contributing to more than 70% of polychaetes’ number of individuals. Our results help to understand the role of oyster aquaculture in restoring the viability in the natural habitat of the Delaware Inland Bays.

1. Introduction

The Delaware Inland Bays (DIBs) have been experiencing severe habitat and water quality degradation as a consequence of chronic eutrophication and sediment erosion resulting from anthropogenic non-point source pollutions [1,2,3,4,5]. Indian River, for example, experienced nitrogen loading greater than six times the healthy limit, which ultimately accumulated in the bays [4]. Since the DIBs are shallow and poorly flushed [6], the accumulated pollutants in water and sediments have been associated with disturbances happening including nutrient enrichment, high turbidity, sedimentation, hypoxic/anoxic condition, harmful algal bloom, and annual fish kills [7,8,9,10]. The cumulative impacts of these disturbances decreased the diversity and abundance of submerged vegetation [11] and various aquatic species [5,12], especially benthic communities in DIBs [13]. Therefore, there is an urgent need to mitigate the negative impact of the declined water quality [14,15,16,17].
One prospective method for the restoration of DIBs is the introduction of oyster gardening [18] to restore the wild population and to take advantage of the ecological services oysters provide such as enhancing the water quality and supporting other species in terms of habitat and grazing ground [13,17,19,20,21]. The recent implementation of commercial-scale aquaculture could greatly increase oyster abundance [15]; however, the introduction of large densities of oysters in off-bottom cultures may cause changes in the bed’s geochemistry in the farming sites and increase the organic matter due to oyster’s deposition [22,23,24,25]. The resultant effects on the benthic communities are highly variable according to previous reports depends on site and cultural characteristics [26,27,28]. Therefore, there is a critical need for baseline data to better understand how it potentially impacts the local macrobenthic communities before implementing oyster gardening as a restoration solution.
Several studies have found that the implementation of oyster aquaculture has less or no dramatic impacts on benthic community population dynamics [29,30]. Having been filter feeders, oyster farming does not rely on external food input [31]. In this regard, negligible effects were detected on the abundance, diversity, and richness of benthic macroinvertebrates in studies by [32,33,34]. Conversely, increased biomass, abundance, and the number of macrofauna species have been documented in sites of oyster cultivation, eastern Canada, in association with oyster biodeposition [35]. Oyster aquaculture can alter the benthic community composition [36]; increasing opportunistic polychaetes [37,38], which reflects the habitat disturbance [39].
Characteristics of the surrounding environment [40], farming intensity [41], and proximity of the oyster gardens to valuable habitats define the extent of oyster aquaculture’s impacts [31,42]. While the beds exposed to currents and wave action experience fewer impacts [43], water bodies with high flushing time or nutrient-enriched ecosystems are more susceptible [44]. Moreover, the benthic community is negatively influenced by shellfish culture at high stocking density because farming intensity increases the rate of organic matter deposition and hence the frequency of the anoxic condition [44,45]. Although, the effects are diluted with the increasing distance from oyster gardens and tend to be subtle at 20–80 m [46]. According to Kaiser et al. [47], using a proper farming plan could ensure the least environmental impacts of intensive shellfish culture.
Polychaetes are often utilized to reveal the effect of poor environmental conditions and pollutions [48,49,50]. Polychaetes are widely distributed in all marine environments [51] and exhibit diverse morphological and life history characteristics [52]. Not only do these characteristics make polychaetes a good candidate to be bioindicators [53], but also they can be an excellent representative of total marine biodiversity [54,55]. Previous studies have confirmed that they are able to reflect the impact of aquaculture on the benthic communities [56,57,58]. Therefore, this project aims to 1- collect and identify polychaetes, 2-evaluate the impact of the presence of oyster gear on the polychaetes community, and 3-evaluate the extent of farming impacts associated with different stocking densities and distance from the oyster gears. The results will help to understand the role of oyster aquaculture in restoring the natural habitat of DIBs.

2. Materials and Methods
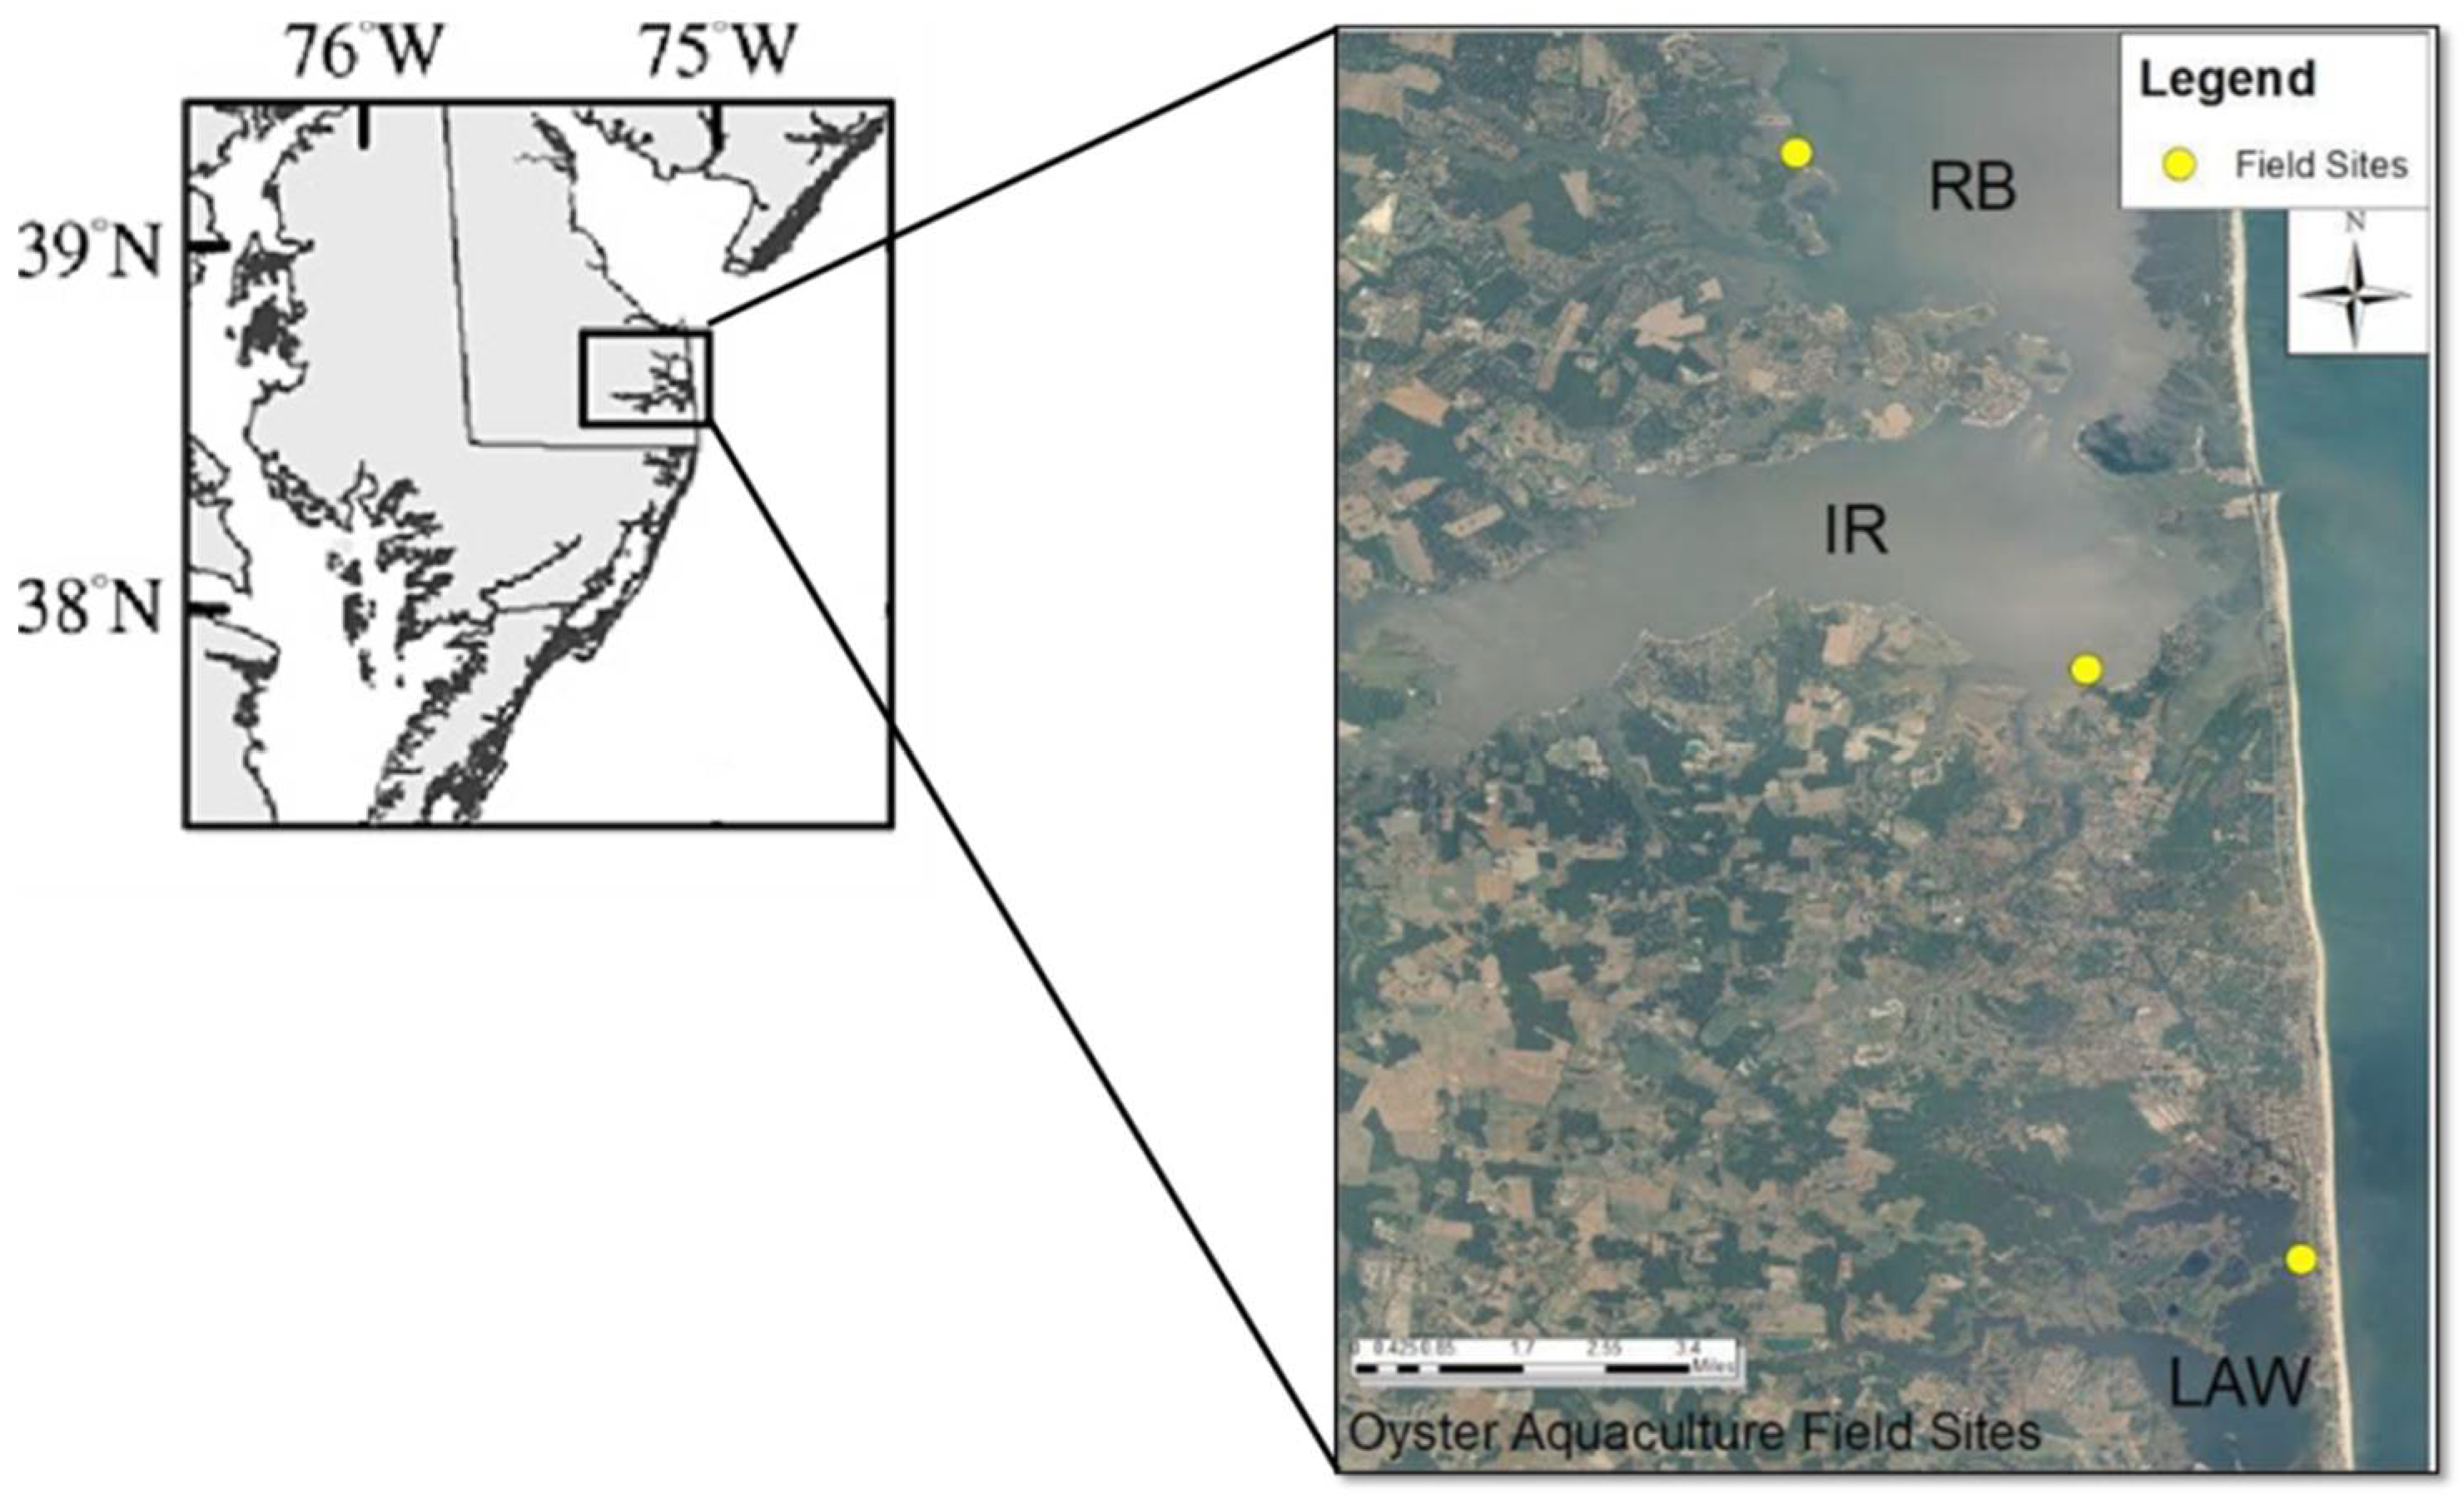
2.1. Study Area

The study was comprised of a series of coastal bays, Rehoboth Bay (RB), Indian River Bay (IR), and Little Assawoman (LAW) Bay, collectively known as the DIBs in southern Delaware (Figure 1). The RB is a shallow bar-built estuarine lagoon with a surface area of 35 km2, a mean depth of 1.3 m, and a tidal range of about 1 m [1,59,60,61]. The bay receives marine waters from the Indian River Inlet (south) and Lewes-Rehoboth Canal (north, [62]) Freshwater discharge comes from several small creeks (White Oak Creek, Love Creek, Herring Creek, and Guinea Creek), groundwater drainage, and surface runoff [60,61]. Since the RB is poorly flushed, the residence time is estimated at 80 days [63]. The sedimentation rates vary from 0.3 cm/yr in the north part to 1.5 cm/yr in the south [61,63]. The sediment texture in the RB is mainly classified as mud with approximately 25% sand, as the distribution of sediments changes from sand in the south part to silty clay in the north [60]. According to Lee [64], the mean total organic carbon (TOC) of sediments ranges from 0.37% to 5.65% in the open water, 4.69% to 8.20% in the channel, and 1.88% to 6.49% in the shorelines in September 2011. The mean concentration of chlorophyll-a in water and sediments are 13.31 µg/L and 22.1 µg/g, respectively [1].
The IR Bay is also an estuarine lagoon enclosed by the RB from the north and LAW from the south. The bay is oriented in the east-west direction and exchanges water with the Atlantic Ocean via the Indian River Inlet on the east and is fed mainly by freshwater of Indian River on the west part [5,66,67]. The surface area is about 38 km2 with a mean depth of 1.5 m and a mean tide range of 1.25 m at the inlet [1,63,68,69]. According to Weston [70], the flushing time is estimated at about 90–100 days for the bay. However, the flushing occurs unevenly in different parts of the bay depending on how closely be connected with the Atlantic Ocean [71]. The sedimentation rate ranges from 0.57 cm/yr to 1.47 cm/yr [72]. Similar to the RB, the major proportion of the sediment texture in the IR Bay is comprised of mud on the west and mud-sand on the east side [60]. The distribution of the TOC in the sediments varies spatially, as it changes from 0.33% to 3.64% in the open water, 2.91–3.04% in the channel, and 0.53–3.15% in the shorelines in September 2011 [64]. Water and sediments in the IR Bay contain 20.68 µg/L and 9.71 µg/g chlorophyll-a, respectively [1].
The LAW Bay is a lagoon in the southernmost part of the DIBs system, connected to the IR Bay through the Assawoman Canal from the north and to Assawoman via The Ditch from the south [5,73]. Freshwater discharges into the bay mostly from Miller Creek and Dirickson Creek [73]. The bay covers an area of approximately 6 km2 with an average depth of 1.4 m and a tide range of 0.6–0.9 m in the Ditch [1,74,75,76]. It takes 1–7 days for the water to be replaced completely [1,77]. While the sediment texture in the eastern part is mainly sand, the central and western part is covered with silty clay sediments [78]. The mean TOC in the sediments collected from the channel and shorelines was reported to be 55.4% and 3.34%, respectively, in September 2011 [64]. The mean concentration of chlorophyll-a is recorded as 15.78 µg/L and 6.22 µg/g in the water and sediments [1].

2.2. Water Quality Monitoring

Water samples were collected from three locations in DIBs (Figure 1) and monitored weekly from 24 June to 25 October 2016 and from 1 June to 10 October 2017. A handheld multiparameter water quality instrument YSI 556 (YSI Inc., Yellow Springs, OH, USA) was used to measure temperature (°C), salinity (ppt), pH, and dissolved oxygen (mg/L). The concentration of chlorophyll-a (mg/L) was measured using a portable Aquaflour Flourmeter, version 1.00 (Turner Designs, Inc., San Jose, CA, USA). Water turbidity (NTU) was recorded by Turbidity Meter WQ770 (Global Water Instrumentation, College Station, TX, USA).

2.3. Set Up Oyster Gears and Trays

Three aquaculture pilot projects, one in each bay, were used as the sampling locations in DIBs. Each location contained two off-bottom gear types: one set of metal aquaculture cages (Ketchum Triple Stack cage, 0.61 m × 0.91 m × 0.76 m, mesh size 12.7 mm × 12.7 mm mesh) and one set of double-stacked aquaculture trays with lids (Aqua Trays 0.91 m × 0.91 m, mesh size 12 mm × 12 mm). The trays were suspended approximately 10 cm from the bottom and were anchored using PVC pipes placed in each corner of the gear. The cages were anchored using one anchor at either end of the gear. Oyster density in the first year of the experiment (2016) was 50 oysters/gear and increased to 250 oysters/gear in the second year (2017). As a control, a gear was placed in the sampling location in IR Bay with no oysters in the second year.

2.4. Benthic Community Assessment

Polychaetes were sampled as a surrogate for the benthic community regarding their ability to reveal the environmental condition and pollution. Sediment core samples were collected monthly using a PVC pipe and cap with an approximate volume of 47.88 cm3. A total number of 24 samples were taken from each bay; including four samples under the cages, four samples under the trays, eight samples one meter away from the gear, and eight samples five meters away from the gear. Sediment samples were sieved through a 1 mm sieve, and all polychaetes were preserved in series of fixative solutions; a 15% ethanol solution for 15 min, 10% Formalin Rose Bengal solution for several days, and 70% ethanol solution. Polychaetes were then identified using a polychaetes identification guide from the Virginia Institute of Marine Science [79]. The number of specimens was enumerated, and species richness (d) was calculated according to [80]. It was assumed that polychaetes were randomly distributed in our study area [81].
d = ( S 1 ) LogN
where S indicates the number of taxa identified in each sampling location and N stands for the number of organisms present.

2.5. Statistical Analysis

The statistical analysis was performed using R statistical software version 3.6.2 [82]. Normality and homoscedasticity were tested prior to statistical analysis using Shapiro–Wilk and Levene tests. The spatial and temporal variation of water quality data were analyzed using ANOVA, where sampling location (bays) and time (month or year) were used as factors [83]. If needed, data were log10 transferred to normalize the skewness prior to the statistical analysis. Having violated the normality assumptions, the abundance of polychaetes and richness index were compared between the control groups and farming locations at different distance levels from the oyster gears using a Mann–Whitney U test. A rank MANOVA test was performed on the polychaetes richness index and total abundance in response to farming location, density, and sampling distance from the gear [84]. The bootstrap resampling method was applied with 1000 iterators. The significant differences were assessed using a Tukey Post-hoc test (p < 0.05).

3. Results

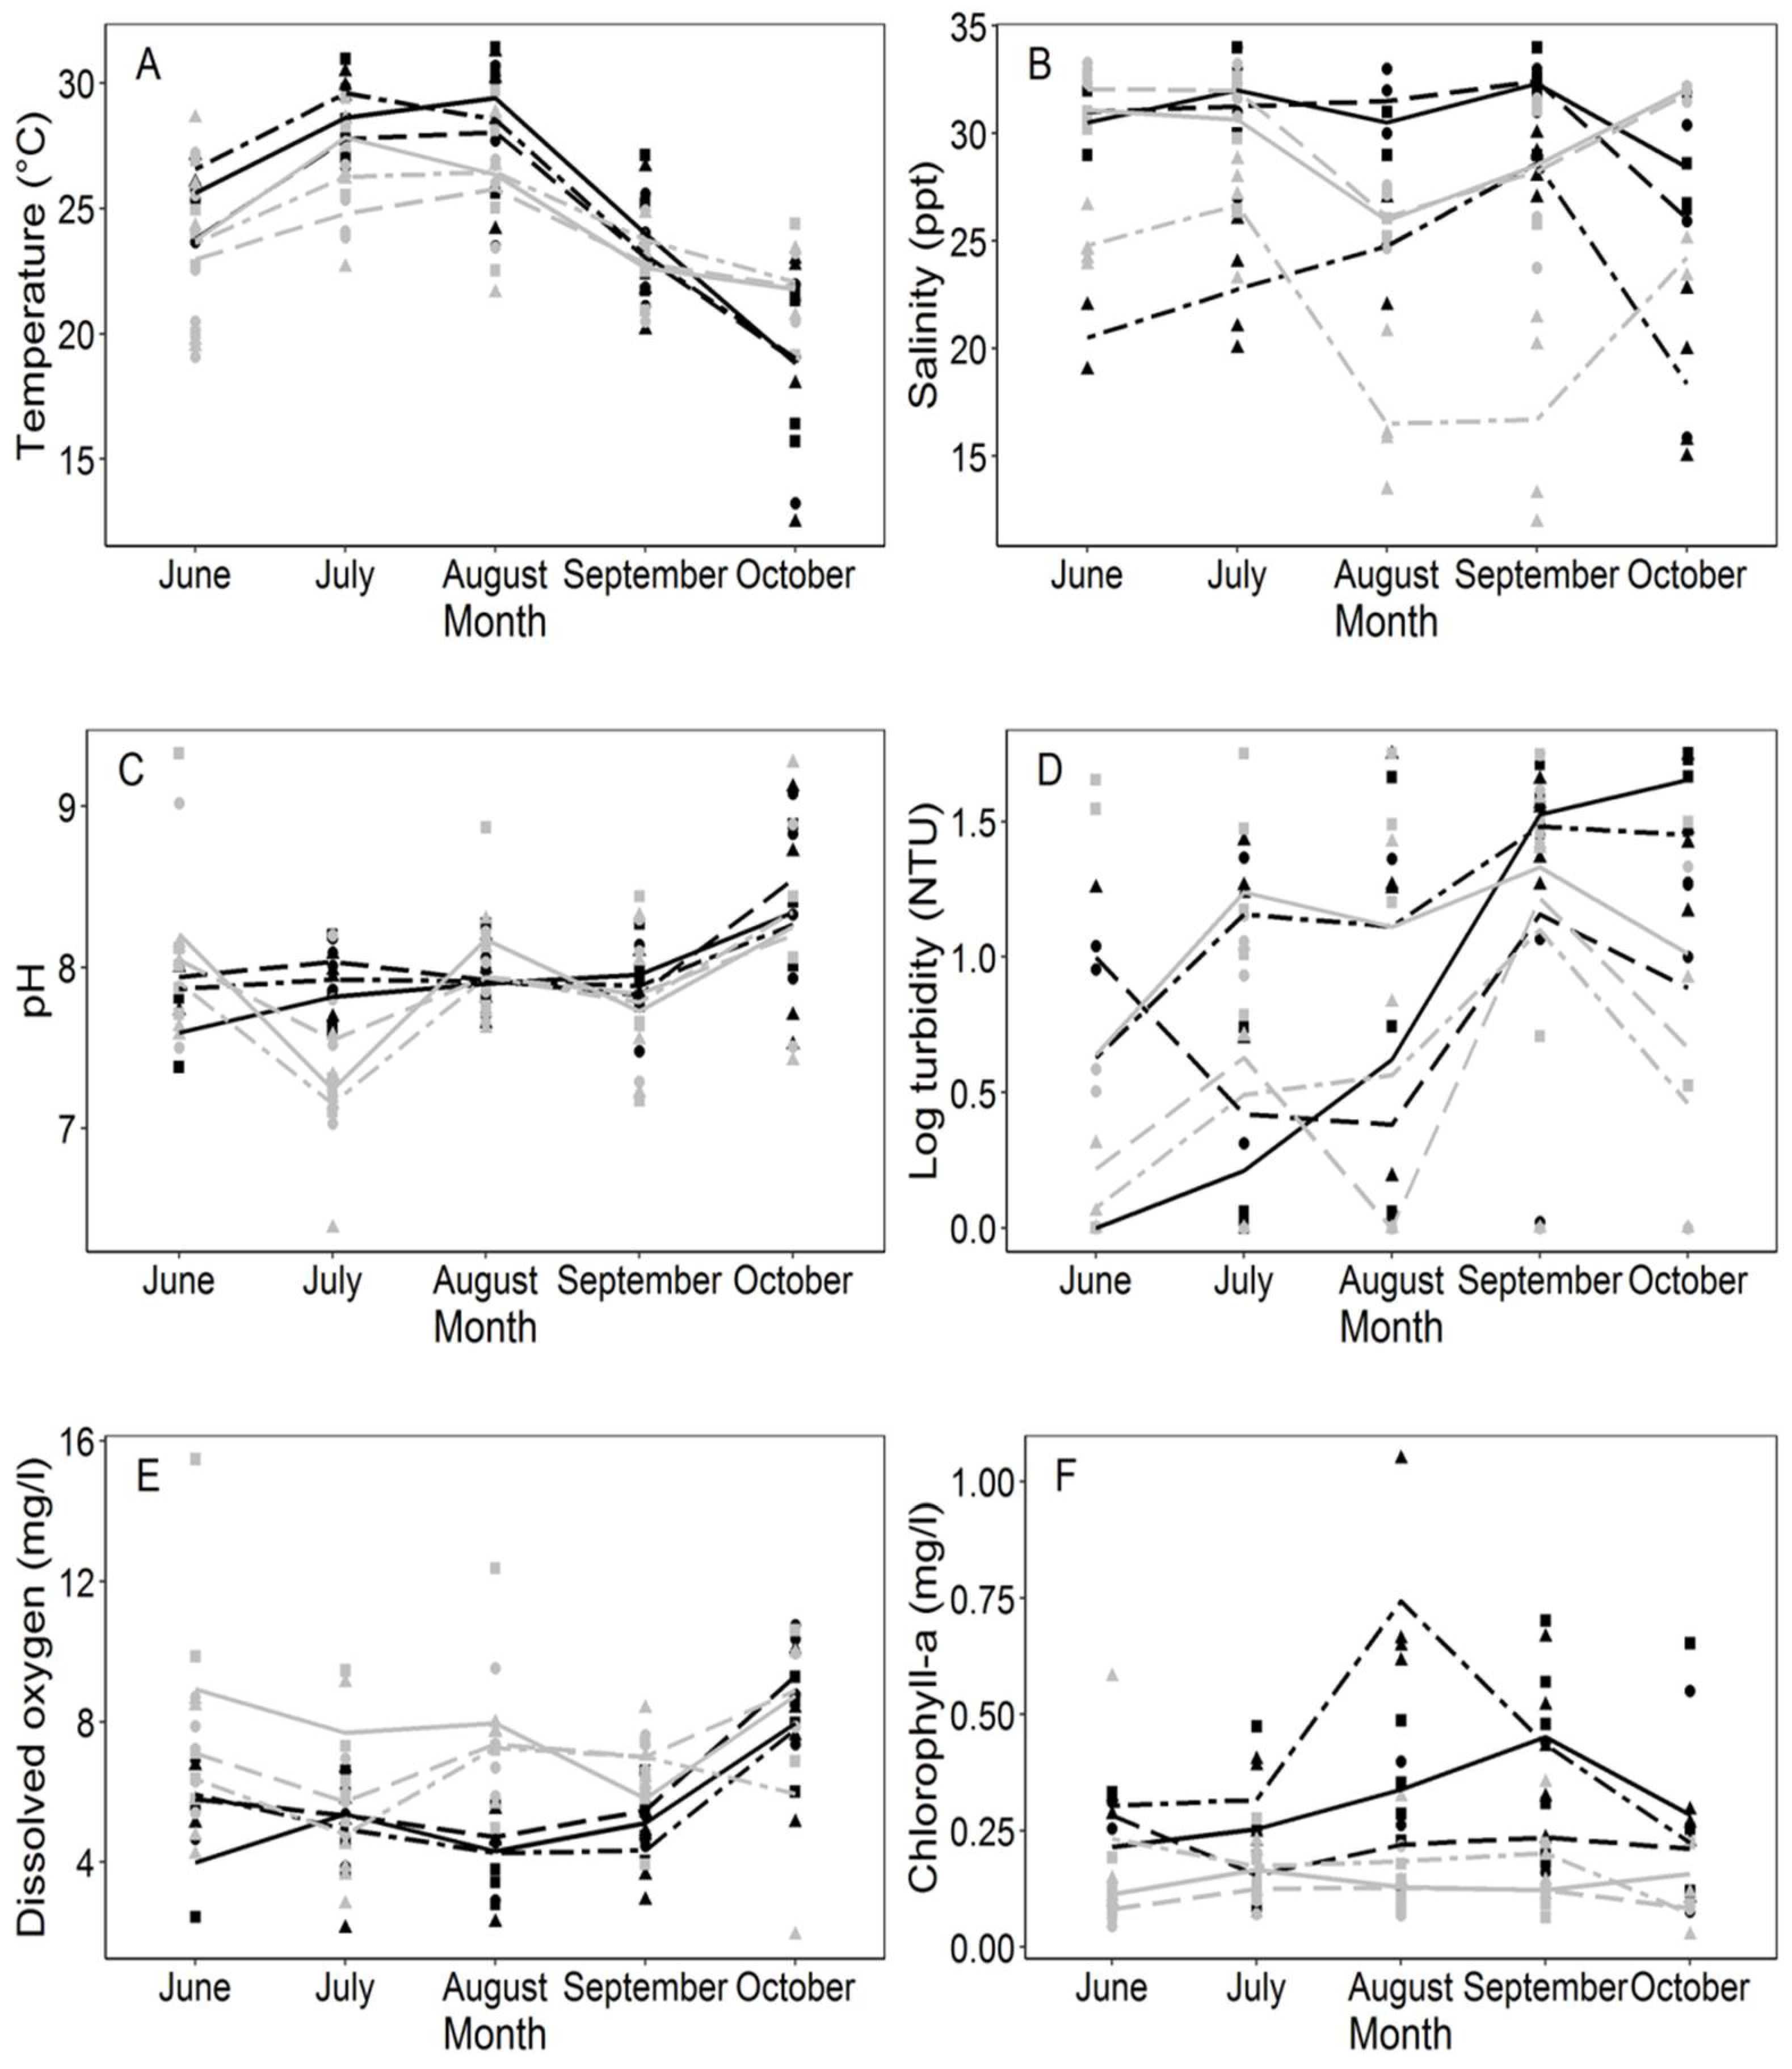
3.1. Physicochemical Parameters in Water Samples

Surface water temperature varied from 12.5 °C to 31.4 °C in the first sampling year and from 19.1 °C to 29.7 °C in the second year (Figure 2A). The mean water temperature was 24.9 ± 4.2 °C, 24.5 ± 3.7 °C, and 24.6 ± 3.4 °C in RB, IR, and LAW, respectively. There was a significant difference in water temperature between sampling months (Table 1). A uniform temporal trend was observed in all the inland bays, as mean water temperature increased from June to August, started decreasing since then, and reached its minimum in October (Figure 2A). Tukey-test showed that the mean temperature was significant between all the pairs except for September-June and August-July.
Although mean surface salinity was not significantly different between the two sampling years, it was lower in the second year (27.2 ± 5.3 ppt) in comparison to the first year (28.3 ± 5 ppt) (Table 1, Figure 2B). The inland bays showed a significant difference in terms of surface salinity; the mean salinity was lower in LAW (24.5 ± 3.4 ppt) as compared to RB (28.6 ± 4.5 ppt) and IR (28.4 ± 4.5 ppt) (Table 1, Figure 2B). Similarly, the mean salinity significantly changed during the sampling months (Table 1). In all the inland bays, the mean surface salinity was significantly decreased from August to October and reached its minimum in October (RB; 27.7± 4.7 ppt, IR; 27.9± 4.7 ppt, LAW; 26.6± 5.6 ppt) (Figure 2B).
Sampling location has no significant effect on the value of pH (Table 1), and it ranges from 7.1 to 9.3 in RB, 7 to 9.1 in IR, and 6.4 to 9.3 in LAW (Figure 2C). Water was slightly alkaline in the first year (8 ± 0.4) compared to the first year (7.8 ± 0.4), and the pH value fluctuated in the second year more (Table 1, Figure 2C). The value of pH showed significant differences among sampling months (Table 1).
The minimum (0 NTU) and maximum (45.5 ± 12.2 NTU) mean turbidity were measured in June (RB, 2016), August (IR, 2016), and October (RB, 2016), respectively (Figure 2D). Turbidity showed significant variations in response to year and month of sampling in all the inland bays (Table 1).
The sampling year resulted in a significant difference in the concentration of dissolved oxygen (Table 1); the mean concentration of dissolved oxygen was higher in the second year (7 ± 2.3 mg/L) in comparison to the first year (5.6 ± 2 mg/L). Tukey-test showed that the mean concentration of oxygen was significantly higher in October (6.6 ± 2.2 mg/L, Figure 2E).
The mean concentration of chlorophyll-a was influenced by both sampling location (bays) and time (years/ months) (Table 1). The minimum (0.07 ± 0.06 mg/L) and maximum (0.74±0.2 mg/L) mean chlorophyll-a were measured in October in LAW (2017), August (IR, 2016), and August in LAW (2016), respectively (Figure 2F). It was higher in first sampling year (0.32 ± 0.2 mg/L vs 0.14 ± 0.09 mg/L in the second year) and in RB (0.27 ± 0.19 mg/L vs 0.22 ± 0.18 mg/L in IR and 0.21 ± 0.18 mg/L in LAW) (Table 1).

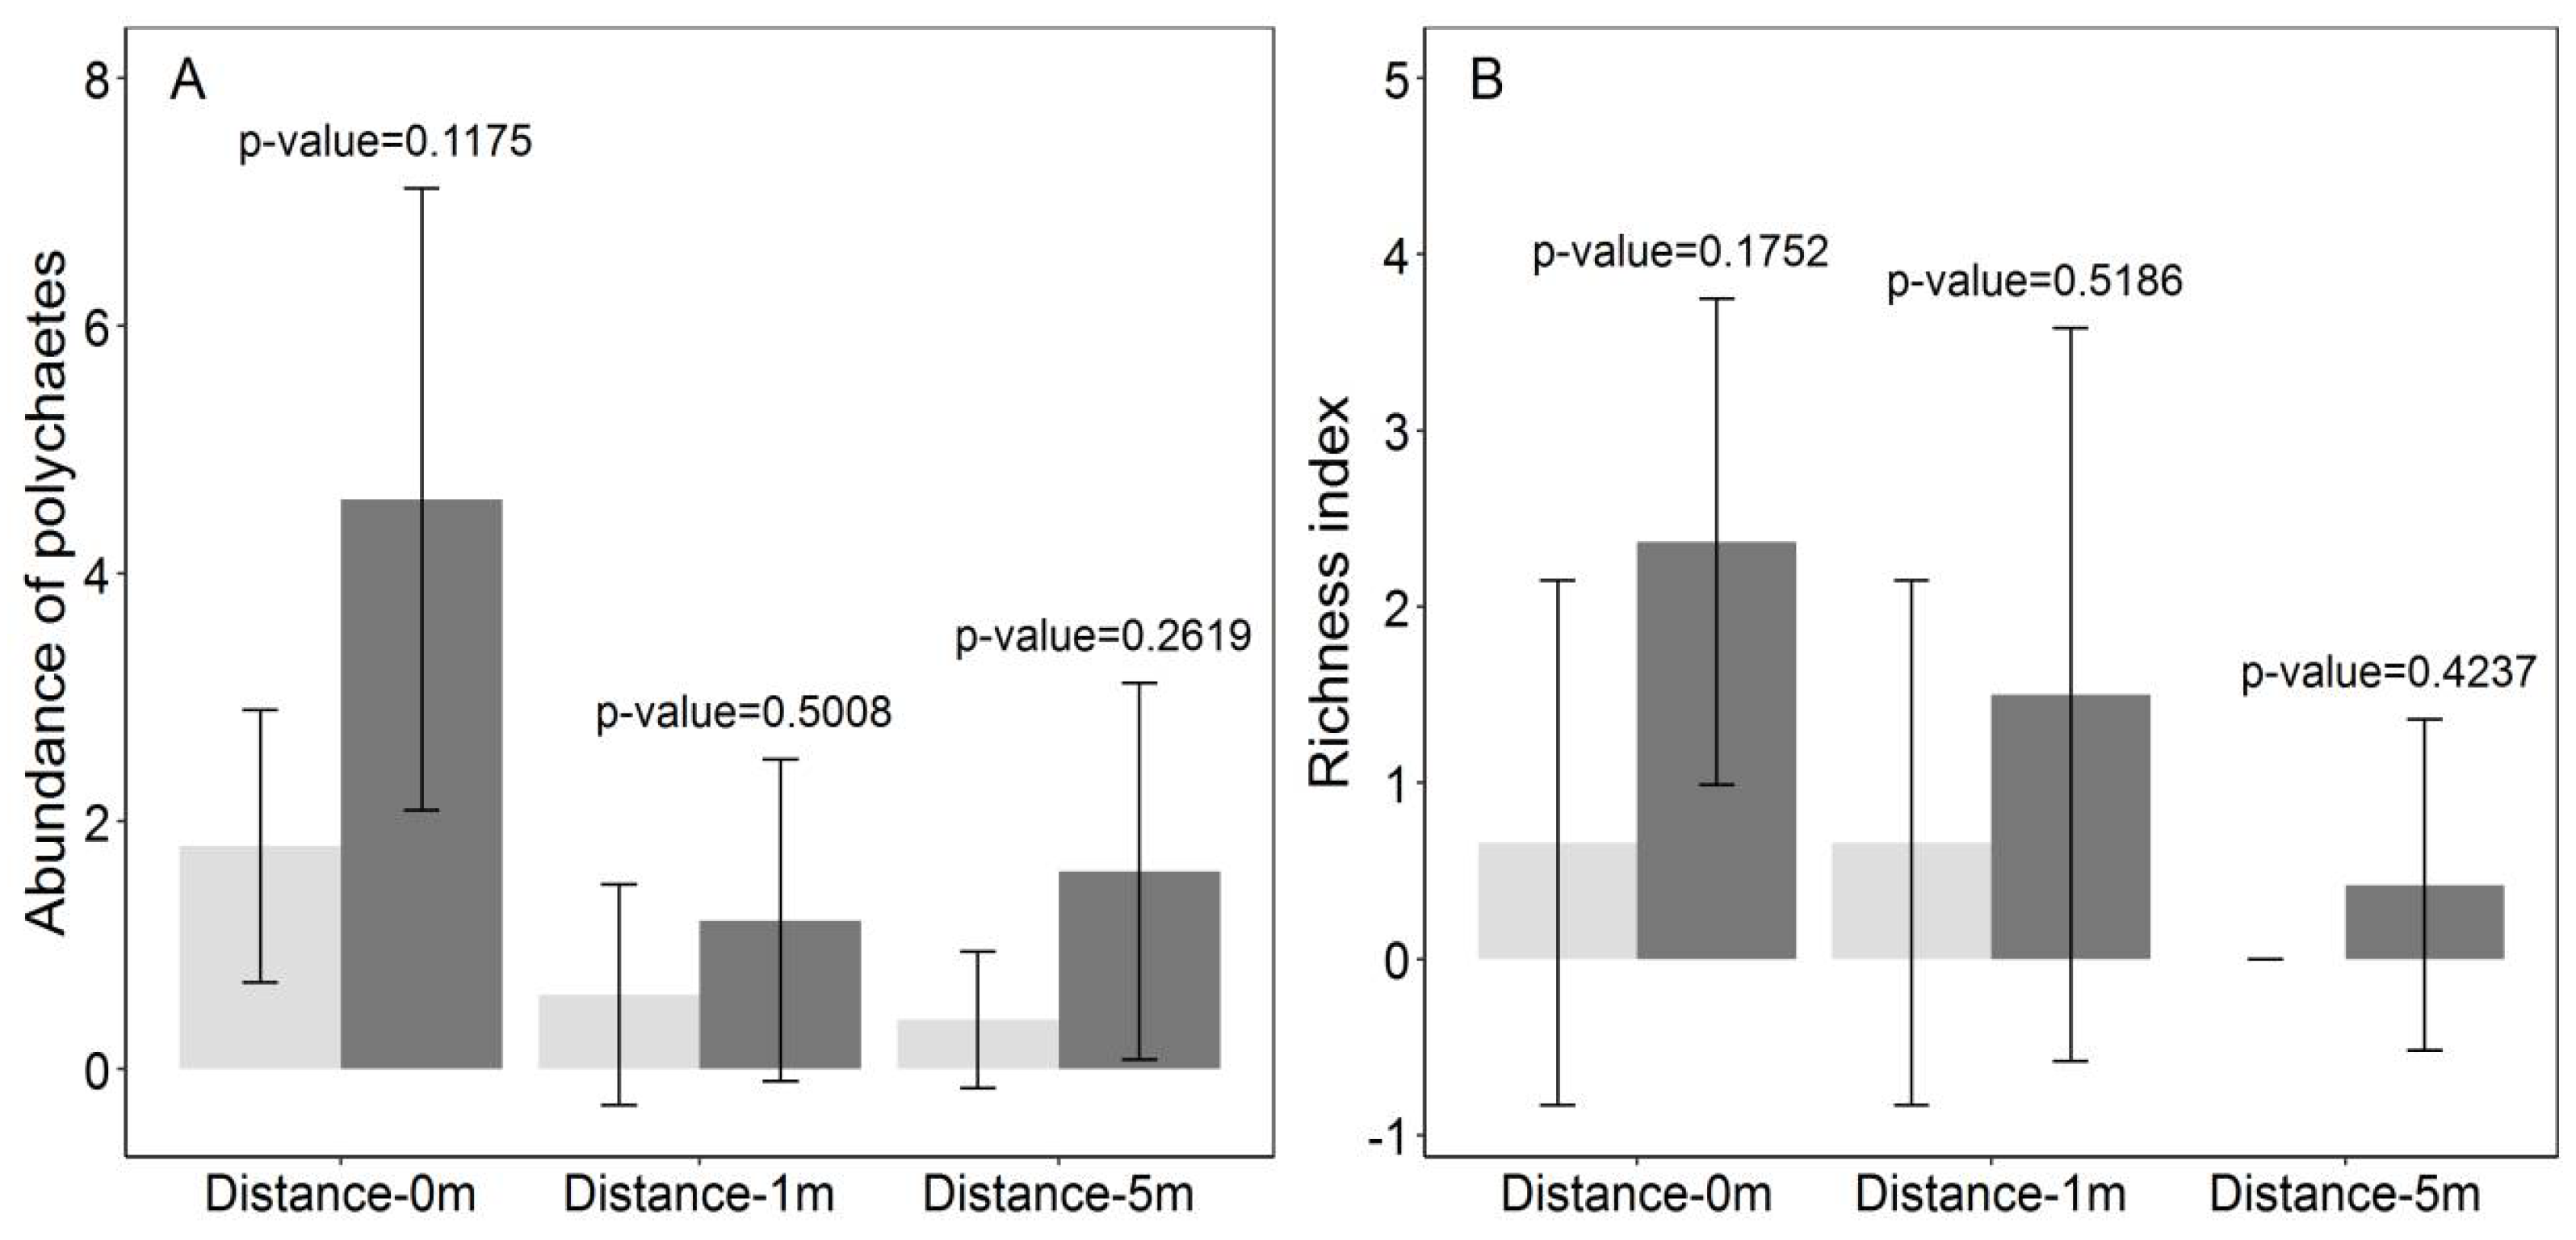
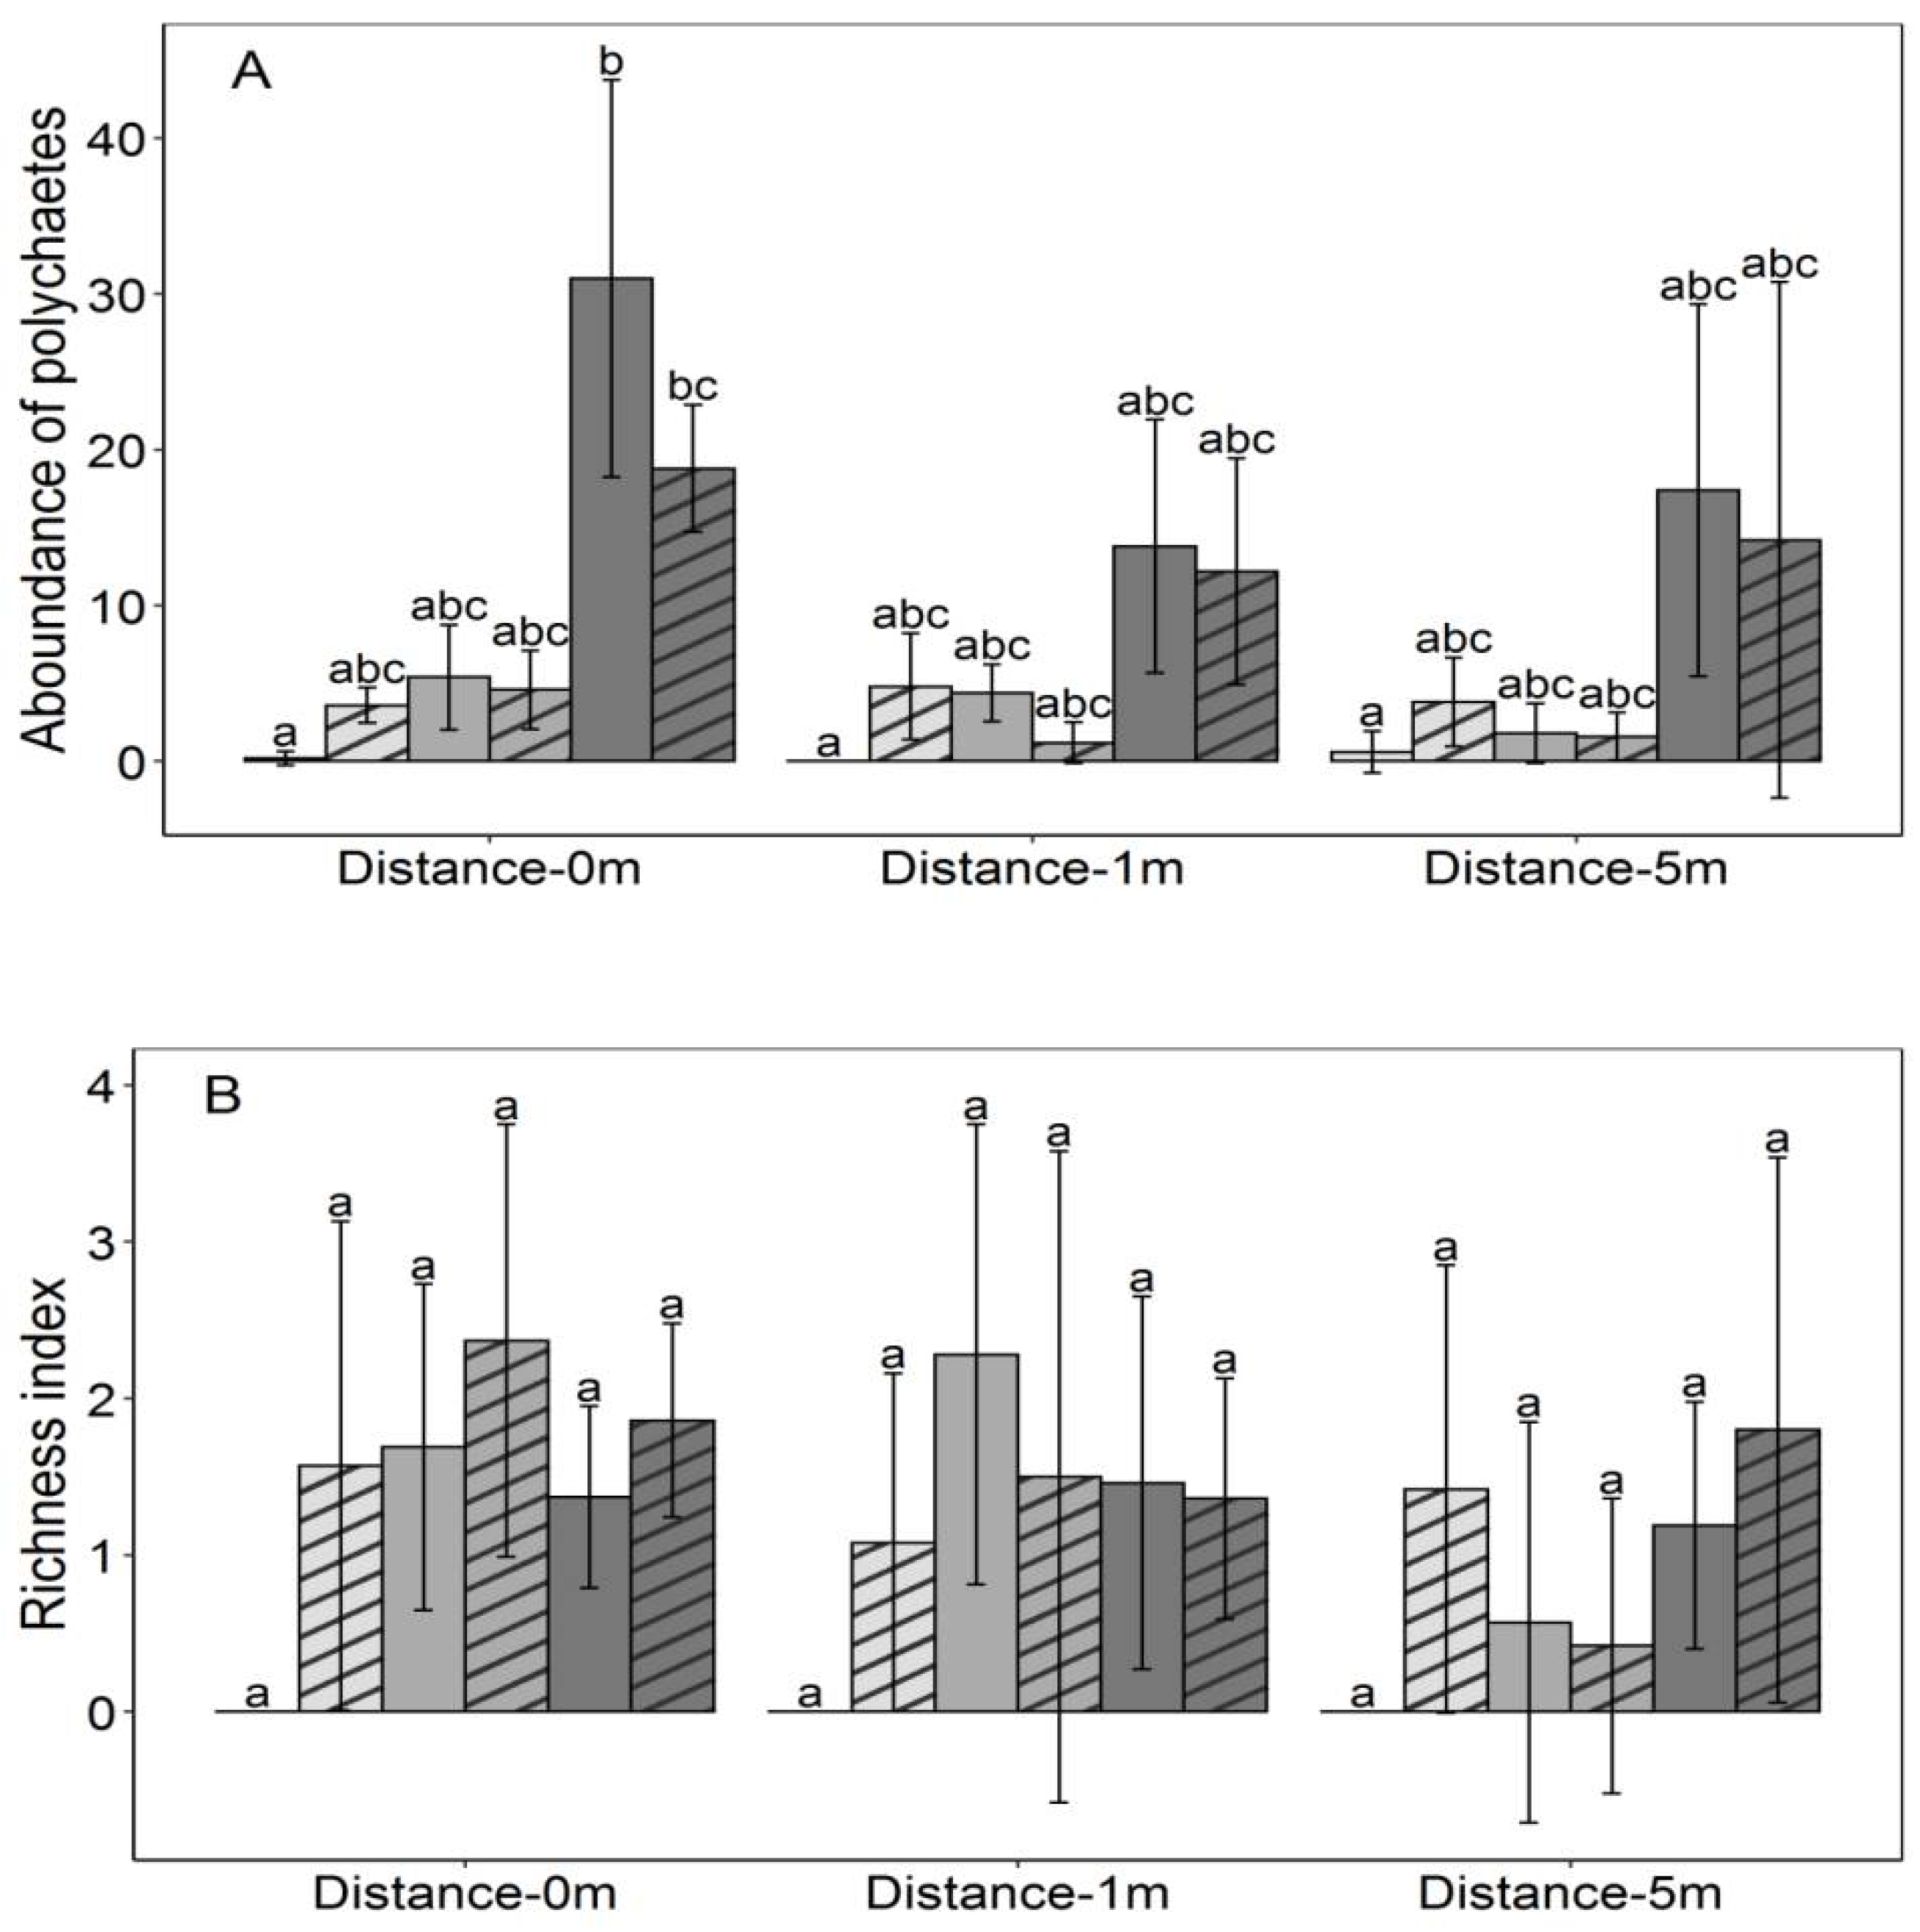
3.2. Polychaetes Abundance and Richness

A total number of 710 specimens were collected, representing 12 families (Table 2). Almost 98% of the polychaetes’ population is comprised of Capitellidae (~42.1%), Glyceridae (~31.3%), Orbiniidae (~8.5%), Spionidae (~6.5%), Not identified (~5.5%), and Oweniidae (~4.1%).
The richness indexes varied from 0 to 4.19 in this study (1.08 ± 1.24) as it was calculated between 0–3.55 (0.95 ± 1.14) in the first year of sampling with the oyster density of 50 oysters/gear and between 0–4.19 (1.18 ± 1.31) in the second year in which oysters were cultured with the density of 250 oysters/gear. In RB, the index was in a narrow range (0–3.32) in comparison to the other sampling sites. The same pattern was observed for the samples collected under the gears (0–3.32) compared to those were taken from sites one meter or five meters away.
In IR Bay, the mean abundance of polychaetes was higher in sampling locations: under oyster gear (4.29 ± 0.39), one meter away (0.69 ± 0.64), and five meters away (0.95 ± 0.81) compared to those for the controls (1.43 ± 0.47, 0.23 ± 0.46, and 0.16 ± 0.30) (Figure 3A). The same results were obtained for the richness index (Figure 3B). However, the differences were not statistically significant for both the abundance and richness index.
According to the rankMANOVA, sampling location, including bay and distance from the oyster gears, oyster density, and the interaction effect of oyster density and distance from the gears, had significant effects on polychaetes’ richness index in DIBs during our sampling time (Table 3). The abundance of polychaetes was influenced by a combination of oyster density, distance from the gears, and interaction of oyster density and distance from the gears (Table 3). For both abundance and richness index, no significant effect was detected for the interaction of sampling location in the bay and oyster density and the interaction of sampling location in the bay, oyster density, and distance from the gears (Table 3).

4. Discussion

Water physicochemical parameters revealed spatial and temporal heterogeneity in the water quality of DIBs. The range of water temperature, salinity, the concentration of dissolved oxygen, and chlorophyll-a measured in this study was in accordance with the historical ranges reported by the previous studies. Eichler et al. [61] reported the corresponding ranges for RB to be 24–31 °C, 14.8–28.6 ppt, and 4.57–11.9 mg/L in August 2005. Erbland and Ozbay [14] observed that the water temperature changed from 18 °C to 24 °C, salinity varied from 28 ppt to 32 ppt, and concentration of dissolved oxygen ranged from 7 mg/L to 12.6 mg/L during June–October 2006 in IR. The mean temperature, salinity, concentration of dissolved oxygen, and chlorophyll-a ranged from 19.7 °C to 27.5 °C, from 22.3 ppt to 28.4 ppt, from 3.6 mg/L to 6 mg/L, and from 64.2 µg/L to 173 µg/L during June–October 2007 in LAW, respectively [16]. The mean concentration of chlorophyll-a was reported to be 13.31 ± 2.85 µg/L (RB), 20.68 ± 4.21 µg/L (IR), and 17.78 ± 1.52 µg/L (LAW) between June and September by Chaillou et al. [1]
Almost all water quality parameters had higher mean values in the first sampling year, except for the concentration of dissolved oxygen which showed an inverse trend. At the beginning of the 2016 field season, there was an Ulva Lactuca bloom in RB [65]. One of the reasons that promote macroalgae growth might be the elevated water temperature, salinity, and pH in the region. In general, large biomass of Ulva sp. has been observed in spring and during warm summer months due to the long length of days and high water temperature [85]. Many studies have reported the bloom of Ulva sp. in response to elevated water temperature and pH in marine habitats [86,87]. Ryback and Gabka [88] reported that water temperature, pH, and sulfate concentration are the most important environmental variables triggering the bloom of U. flexuosa. The authors suggested that a higher pH value stimulates the carbon uptake (CO2) from ambient water [88]. We observed an increase in the values of water turbidity and concentration of chlorophyll-a and a decline in the concentration of dissolved oxygen in the same sampling year. In RB, these variations could be partly the consequence of U. lactuca bloom and decaying vegetation. It has been accepted that the death and decomposition of macroalgal biomass can deoxygenate water and cause hypoxia and anoxia conditions [89].
In our study, the mean richness index of polychaetes was 1.08 for all the sampling locations throughout the two-year study. As polychaetes are wide-ranging constituents of benthic communities and mirror the general health of the benthic community [52,90], these results suggest poor benthic communities in DIBs. Previous studies have confirmed that benthic communities are severely degraded in DIBs [1]. According to Marenghi et al. [11], siltation as a result of sediment erosion and bed destruction due to overfishing has declined the benthic condition in DIBs. The bays also suffer from nutrient enrichment, meaning excess inputs of nitrogen and phosphorus caused by poor land-use practices in the watershed [4,5,91,92]. The collaboration of eutrophication and the occurrence of algal bloom have led to the accumulation of high-level organic matter and the anoxic situation in sediments, decreasing the benthic community richness and biomass [6]. Our results on polychaetes richness suggesting a poor benthic community are consistent with the previous findings that confirmed the degradation of the benthic communities in DIBs.
Additionally, the dominant polychaetes families in terms of abundance and occurrence in the present study were Capitellidae, Glyceridae, Orbiniidae, Spionidae, and Oweniidae. Polychaetes are considered to be bio-indicators of environmental alternations, given that they respond to both natural and anthropogenic stressors [53]. Species belonging to Capitellids and Spionids are considered indicators of pollution and usually occur in organically enriched sediments [37,38,53,93,94,95,96]. Some genera from Capitellids (Capitata sp.) are believed to be signs of environmental degradation [51,52]. Levin et al. [97] reported that Spionids have physical features and behaviors adapted to inhabit unstable muddy sediments and survive in permanent hypoxia conditions. Similarly, Glyceridae occurs in beds with a high percentage of organic carbon [98]. Many studies have named Glyceridae (Glycera sp.) as an indicator of organic enrichment and found an association between sediment organic carbon and its occurrence [98,99]. Kruse et al. [100] observed that some specific taxa of Orbiniidae (Scoloplos sp.) are able to resist hypoxic and sulphidic conditions in the intertidal zone because they take advantage of the anaerobic pathway to obtain energy. Bellan et al. [101] assigned Orbiniidae as one of the pollution indicators in the annelid pollution index to characterize the Mediterranean benthic condition with regard to pollution and disturbance. Although it is suggested not to generalize the benthic condition only based on a particular Polychaete species [52], the community structure of polychaetes in favor of concurring pollution indicators can be a sign of pollution in DIBs. Likewise, the dominant polychaetes in our study were similar to those were identified in beds under fish farms by Martinez-Garcia et al. [50]; Capitellidae, Dorvilleidae, Glyceridae, Nereididae, Oweniidae, and Spionidae and Gao et al. [102]; Capitellidae, Glyceridae, and Spionidae and were categorized as tolerant to aquaculture-influenced habitats.
A significant difference was detected in both the number of species and the number of organisms collected from the bays. One factor that may have contributed to the significant difference is the variations in the characteristics of bottom substrates. Generally, bottom type, sedimentation rate, depth, sediment temperature, total organic matter, oxygen level, and pollution are named to be key local factors explaining the spatiotemporal distribution of benthic fauna, including polychaetes [103]. Sediment texture and organic matter content are akin in RB and IR, mostly consisting of thick mud [60] enriched with a high level of organic matter [64]. Due to the high sedimentation rate [61,63,72] and over 80 days of water residency time [63,71], the anoxic condition is frequently observed in the beds. Our results showed that the mean total abundance of polychaetes was roughly the same and significantly lower than LAW in which the sediment condition is distinctive. In LAW, a higher abundance of polychaetes was attributed to a more favorable condition resulting from a low flushing rate [1,77] and receiving relatively fewer nutrients and other contaminants from a point source [77] and non-point source pollutants [4,5,13].
Although control groups had lower values of polychaetes abundance and richness, our results revealed that oyster farming has no significant impact on the community. Previous studies have shown that oysters enhance the benthic condition by releasing the pile of nutrients enclosed in the biodeposit or providing a habitat for lower trophic level residents to occupy [11,13,17,104]. Some studies, however, suggested that oyster culture has less impact on the benthic community because they are mostly filter feeders grazing on phytoplankton, and there is no need for food or chemical supplements [105]. Conversely, Beadman et al. [46] observed that the presence of mussels significantly decreased the number of individuals and species in infaunal communities. It seems that the effects varied from site to site [28,106,107]. Liao et al. [31] observed that despite a little enhancement in the values of macrobenthic abundance and Shannon–Wiener diversity index, oyster culture has less impact on the macrobenthic abundance and Shannon–Wiener diversity index, and there was no significant difference from the control sites. Similar results have been observed by [29,32,33,108]. According to our results, oyster gardening had fewer impacts on the benthic life of DIBs and could be implemented as a restoration solution, specifically in LAW which has better general health of the benthic community.
An augment in oyster density increases the load of biodeposit and can cause nutrient enrichment and hypoxia [109,110,111]. According to Rice [112], the high level of stocking density adds an excessive amount of nitrogen, alters the nitrogen cycle, and inhibits denitrification. This may increase the anoxic incidences depends on the original sediment texture and current chemical profile; hence it influences the macroinvertebrate community negatively. Yet, observations regarding the effect of oyster density on the benthic infauna have been contradictory. Dubois et al. [108] found no significant enrichment in the nutrient profile of the sediment of sampling site under high stocking density (2000 oysters·m−2), and the increase in infauna abundance in favor of opportunistic species and deposit feeders was not statistically significant. In our study, polychaetes abundance and richness increased in RB when the stocking density increased. One reason associated with a really low number of polychaetes species and organisms in 2016 (stocking density of 50 oysters/gear) is the event of U. lactuca bloom covering the sampling site with decaying sea lettuce almost all over the sampling months. The detritus developed an anoxic condition and inhibited polychaetes from establishing a diverse community. Our finding is in accordance with the previous findings in which oxygen depletion and eutrophication led to a decrease in species richness and abundance of microbenthic species in Chesapeake Bay [113]. The following year, the decaying vegetation was washed out and sediment condition improved, and there were fewer anoxic clay patches. Since the values increased in all the sampling locations in RB regarding how far they were from the gears, the enhancement could attribute to the general improvement in benthic conditions. The number of polychaetes in IR and LAW was influenced negatively by increasing the stocking density; however, it was not statistically significant. The results were consistent with the findings of Beadman et al. [46], in which the species richness and abundance declined with an increased stocking density of mussels. The authors suggested that reducing the stocking density could mitigate the negative effect of bivalve farming on benthic communities in marine beds. Our results confirmed that keeping the stocking density up to 250 oysters/gear can meet the target and can be considered as a proper farming practice.
Our results suggested that neither the number of polychaetes nor richness index was significantly changed in sediment samples farm from the oyster gear (1 m and 5 m). A similar study on the impact of mussel farming on infauna indicated that the effect of mussels on benthic communities declined with increasing distance from the mussel bed, and the effect is not detectable at a distance of 20 m and 80 m from the farm bed [46]. Our result was in agreement with Crawford et al. [29], in which there was no significant difference between benthic organisms in and around the shellfish farms studied. Callier et al. [28] suggested that the abundance and number of benthic species increased with increasing distance from mussel farms. The observation was in association with a decline in organic matter which was the result of decreasing biodeposition far from the culture. They reported the greatest density at intermediate distances (3 to 30 m) from the farming sites. Since we only studied the effect of oyster gears within the buffer of 5 m, we suggest evaluating the effects at multiple distances over 5 m to have an accurate interpretation of the variations in polychaetes abundance and richness. Considering the variations between and within the cultures [22,25] would help managers to choose the right distance at which oyster gears can be implemented in order to minimize the impacts, support the diversity of benthic communities, and meet the restoration targets. It was our intention that our findings will be helpful for our overall understanding of the role of oyster aquaculture in restoring the viability in the natural habitat of the Delaware Inland Bays.

Author Contributions

Designed, supervised the study, trained students, and provided advice for data analysis and project outcome discussion, G.O.; conducted the data analysis, visualized analyzed data, and wrote the manuscript, Z.M.K.; collected samples and carried out laboratory work, M.F. and S.B.; prepared a Master thesis including this research project, M.F. All authors have read and agreed to the published version of the manuscript.

Funding

Funding for this project was provided by NSF MADE-CLEAR Award# 1239758 and NSF Delaware EPSCOR Award# 1757353, and USDA NIFA CBG Award# 2017-38821-26439.

Institutional Review Board Statement

According to the Institutional Animal Care and Use Committee (IACUC), invertebrate species we worked with in our study do not require IACUC approval.

Data Availability Statement

The raw data supporting the conclusions of this article will be made available by the authors without undue reservation.

Acknowledgments

We would like to thank John Ewart for his technical assistance, and undergraduate research interns, fellow graduate students, and research technicians Jillian Bradley, Ashley Tabibian, Jackie Myers, Brian Galvez, Keith Leonard, Amanda Abbott, and Laurieann Phalen for their assistance during the field sampling and analyzing the samples. We also would like to thank Camp Arrowhead Director and Science Staff for their support and assistance throughout the field sampling season. Thanks to the Delaware Center for the Inland Bays for their partnerships and data assessments.

Conflicts of Interest

The authors declare that the research was conducted in the absence of any commercial or financial relationships that could be construed as a potential conflict of interest.

References

  1. Chaillou, J.; Weisberg, S.; Kutz, F.; DeMoss, T.; Mangiaracina, L.; Magnien, R.; Eskin, R.; Maxted, J.; Price, K.; Summers, J. Assessment of the Ecological Condition of the Delaware and Maryland Coastal Bays; U.S. Environmental Protection Agency: Washington, DC, USA, 1994.
  2. Sallade, Y.; Sims, J. Phosphorus transformations in the sediments of Delaware’s agricultural drainageways: I. phosphorus forms and sorption. J. Environ. Qual. 1997, 26, 1571–1579. [Google Scholar] [CrossRef]
  3. Price, K. A framework for a Delaware inland bays environmental classification. Environ. Monit. Assess. 1998, 51, 285–298. [Google Scholar] [CrossRef]
  4. EPA. State of the Delaware Inland Bays; U.S. Environmental Protection Agency: Washington, DC, USA, 2011.
  5. Walch, M.; Seldomridge, E.; Mcgowan, A.; Boswell, S.; Bason, C. 2016 State of the Delaware Inland Bays; Delaware Center for the Inland Bays: Rehoboth Beach, DE, USA, 2016. [Google Scholar]
  6. Ma, S.; Whereat, E.B.; Luther, G.W. Shift of algal community structure in dead end lagoons of the Delaware Inland Bays during seasonal anoxia. Aquat. Microb. Ecol. 2006, 44, 279–290. [Google Scholar] [CrossRef] [Green Version]
  7. Kiddon, J.A.; Paul, J.F.; Buffum, H.W.; Strobel, C.S.; Hale, S.S.; Cobb, D.; Brown, B.S. Ecological condition of US Mid-Atlantic estuaries, 1997–1998. Mar. Pollut. Bull. 2003, 46, 1224–1244. [Google Scholar] [CrossRef]
  8. Bricker, S.B.; Longstaff, B.; Dennison, W.; Jones, A.; Boicourt, K.; Wicks, C.; Woerner, J. Effects of nutrient enrichment in the nation’ s estuaries: A decade of change. Harmful Algae 2008, 8, 21–32. [Google Scholar] [CrossRef]
  9. Handy, S.M.; Demir, E.; Hutchins, D.A.; Portune, K.J.; Whereat, E.B.; Hare, C.E.; Rose, J.M.; Warner, M.; Farestad, M.; Cary, S.C.; et al. Using quantitative real-time PCR to study competition and community dynamics among Delaware Inland Bays harmful algae in field and laboratory studies. Harmful Algae 2008, 7, 599–613. [Google Scholar] [CrossRef]
  10. Ozbay, G.; Smith, S.L. Are aquaculture practices sustaining our goal to restore oysters (Crassostrea virginica)? In Aquaculture—Plants and Invertebrates; Diarte-Plata, G., Escamilla-Montes, R., Eds.; IntechOpen: London, UK, 2018; p. 32. ISBN 978-1-83881-778-7. [Google Scholar]
  11. Marenghi, F.; Ozbay, G.; Rossi-snook, K.; Chalabala, E.J. Restoration program in Inland Bays improves ecosystems as oyster populations recover. Glob. Aquac. Advocate 2009, 16–17. Available online: https://www.aquaculturealliance.org/advocate/restoration-program-in-inland-bays-improves-ecosystems-as-oyster-populations-recover/ (accessed on 15 November 2020).
  12. Zimmerman, R.; Minello, T.; Baumer, T.; Castiglione, M. Oyster Reef as Habitat for Estuarine Macrofauna; NOAA Technical Memorandum NMFS-SEFC-249; National Oceanic and Atmospheric Administration: Washington, DC, USA, 1989; p. 19.
  13. Grabowski, J.H.; Brumbaugh, R.D.; Conrad, R.F.; Keeler, A.G.; James, J.; Peterson, C.H.; Piehler, M.F.; Sean, P.; Smyth, A.R. Economic valuation of ecosystem services provided by oyster reefs. Bioscience 2012, 62, 900–909. [Google Scholar] [CrossRef] [Green Version]
  14. Erbland, P.J.; Ozbay, G. A comparison of the macrofaunal communities inhabiting a Crassostrea virginica oyster reef and oyster aquaculture gear in Indian River Bay, Delaware. BioOne 2008, 27, 757–768. [Google Scholar] [CrossRef]
  15. Marenghi, F.; Ozbay, G. Preliminary habitat assessment of floating oyster (Crassostrea virginica) gardens (Delaware). Ecol. Restor. 2010, 28, 254–257. [Google Scholar] [CrossRef]
  16. Marenghi, F.; Ozbay, G. Floating oyster, Crassostrea virginica Gmelin 1791, aquaculture as habitat for fishes and macroinvertebrates in Delaware Inland Bays: The comparative value of oyster clusters and loose shell. BioOne 2010, 29, 889–904. [Google Scholar] [CrossRef]
  17. Rossi-snook, K.; Ozbay, G.; Marenghi, F. Oyster (Crassostrea virginica) gardening program for restoration in Delaware’s Inland Bays, USA. Aquac. Int. 2010, 18, 61–67. [Google Scholar] [CrossRef]
  18. DNREC. DNREC’s Division of Fish & Wildlife Announces Shellfish Aquaculture Leasing Lottery for Inland Bays; Department of Natural Resources and Environmental Conservation: Dover, DE, USA, 2017.
  19. Gutierrez, J.L.; Jones, C.G.; Strayer, D.L.; Iribarne, O.O. Mollusks as ecosystem engineers: The role of shell production in aquatic habitats. OIKOS 2003, 101, 79–90. [Google Scholar] [CrossRef]
  20. O’Beirn, F.; Ross, P.; Luckenbach, M. Organisms associated with oysters cultured in floating systems in Virginia, USA. J. Shellfish Res. 2004, 23, 825–829. [Google Scholar] [CrossRef]
  21. Ruesink, J.L.; Lenihan, H.S.; Trimble, A.C.; Heiman, K.W.; Micheli, F.; Byers, J.E.; Kay, M.C. Introduction of non-native oysters: Ecosystem effects and restoration implications. Annu. Rev. Ecol. Evol. Syst. 2005, 36, 643–689. [Google Scholar] [CrossRef] [Green Version]
  22. Chamberlain, J.; Fernandes, T.F.; Read, P.; Nickell, T.D.; Davies, I.M. Impacts of biodeposits from suspended mussel (Mytilus edulis L.) culture on the surrounding surficial sediments. ICES J. Mar. Sci. 2001, 58, 411–416. [Google Scholar] [CrossRef] [Green Version]
  23. Christensen, P.B.; Glud, R.N.; Dalsgaard, T.; Gillespie, P. Impacts of longline mussel farming on oxygen and nitrogen dynamics and biological communities of coastal sediments. Aquaculture 2003, 218, 567–588. [Google Scholar] [CrossRef]
  24. Hartstein, N.D.; Rowden, A.A. Effect of biodeposits from mussel culture on macroinvertebrate assemblages at sites of different hydrodynamic regime. Mar. Environ. Res. 2004, 57, 339–357. [Google Scholar] [CrossRef] [PubMed]
  25. Callier, M.D.; McKindsey, C.W.; Desrosiers, G. Multi-scale spatial variations in benthic sediment geochemistry and macrofaunal communities under a suspended mussel culture. Mar. Ecol. Prog. Ser. 2007, 348, 103–115. [Google Scholar] [CrossRef]
  26. Forrest, B.M.; Keeley, N.B.; Hopkins, G.A.; Webb, S.C.; Clement, D.M. Bivalve aquaculture in estuaries: Review and synthesis of oyster cultivation effects. Aquaculture 2009, 298, 1–15. [Google Scholar] [CrossRef]
  27. Coe, H.C. Effects of Longline Oyster Aquaculture on Benthic Invertebrate Communities in Humboldt Bay, California; Humboldt State University: Arcata, CA, USA, 2019. [Google Scholar]
  28. Callier, M.D.; McKindsey, C.W.; Desrosiers, G. Evaluation of indicators used to detect mussel farm influence on the benthos: Two case studies in the Magdalen Islands, Eastern Canada. Aquaculture 2008, 278, 77–88. [Google Scholar] [CrossRef]
  29. Crawford, C.M.; Macleod, C.K.A.; Mitchell, I.M. Effects of shellfish farming on the benthic environment. Aquaculture 2003, 224, 117–140. [Google Scholar] [CrossRef] [Green Version]
  30. Gallardi, D. Effects of bivalve aquaculture on the environment and their possible mitigation: A review. Fish. Aquac. J. 2014, 5, 1000105. [Google Scholar] [CrossRef] [Green Version]
  31. Liao, Y.; Shou, L.; Jiang, Z.; Tang, Y.; Du, P.; Zeng, J.; Chen, Q.; Yan, X.; Chen, J. Effects of fish cage culture and suspended oyster culture on macrobenthic communities in Xiangshan Bay, a semi-enclosed subtropical bay in eastern China. Mar. Pollut. Bull. 2019, 142, 475–483. [Google Scholar] [CrossRef]
  32. Mirto, S.; Rosa, T.; Danovaro, R.; Mazzola, A. Microbial and meiofaunal response to intensive mussel-farm biodeposition in coastal sediments of the Western Mediterranean. Mar. Pollut. Bull. 2000, 40, 244–252. [Google Scholar] [CrossRef]
  33. Han, Q.; Wang, Y.; Zhang, Y.; Keesing, J.; Dongyan, L. Effects of intensive scallop mariculture on macrobenthic assemblages in Sishili Bay, the northern Yellow Sea of China. Hydrobiologia 2013, 718, 1–15. [Google Scholar] [CrossRef]
  34. Pezy, J.; Delecrin, C.; Ba, A.; Basuyaux, O.; Dauvin, J. Anthropogenic impact of oyster farming on macrofauna biodiversity in an eelgrass (Zostera marina) ecosystem of the English Channel. Ecol. Indic. 2019, 106, 1–10. [Google Scholar] [CrossRef]
  35. Mallet, A.L.; Carver, C.E.; Landry, T. Impact of suspended and off-bottom Eastern oyster culture on the benthic environment in eastern Canada. Aquaculture 2006, 255, 362–373. [Google Scholar] [CrossRef]
  36. van der Zee, E.M.; Tielens, E.; Holthuijsen, S.; Donadi, S.; Erikson, B.K.; van der Veer, H.W.; Piersma, T.; Olff, H.; van der Heide, T. Habitat modification drives benthic trophic diversity in an intertidal soft-bottom ecosystem. J. Exp. Mar. Biol. Ecol. 2015, 465, 41–48. [Google Scholar] [CrossRef] [Green Version]
  37. Mendez, N.; Linke-Gamenick, I.; Forbes, V.E.; Balrd, D.J. Sediment processing in Capitella spp. (Polychaeta: Capitellidae): Strain-specic differences and effects of the organic toxicant fluoranthene. Mar. Biol. 2001, 138, 311–319. [Google Scholar] [CrossRef]
  38. Silva, C.F.; Shimabukuro, M.; Alfaro-Lucas, J.M.; Fujiwara, Y.; Sumida, P.YG; Amaral, A.C.Z. A new Capitella polychaete worms (Annelida: Capitellidae) living inside whale bones in the abyssal South Atlantic. Deep Sea Res. Part I Oceanogr. Res. Pap. 2015, 108, 23–31. [Google Scholar] [CrossRef]
  39. Forrest, B.M.; Creese, R.G. Benthic impacts of intertidal oyster culture, with consideration of taxonomic sufficiency. Environ. Monit. Assess. 2006, 112, 159–176. [Google Scholar] [CrossRef]
  40. Sarà, G.; Scilipoti, D.; Milazzo, M.; Modica, A. Use of stable isotopes to investigate dispersal of waste from fish farms as a function of hydrodynamics. Mar. Ecol. Prog. Ser. 2006, 313, 261–270. [Google Scholar] [CrossRef] [Green Version]
  41. Miron, G.; Landry, T.; Archambault, P.; Frenette, B. Effects of mussel culture husbandry practices on various benthic characteristics. Aquaculture 2005, 250, 138–154. [Google Scholar] [CrossRef]
  42. Heffernan, M. A Review of the Ecological Implications of Mariculture and Intertidal Harvesting in Ireland; Irish Wildlife Manuals: Dublin, Ireland, 1999. [Google Scholar]
  43. Solomon, O.O.; Ahmed, O.O. Ecological consequences of oysters culture: A review. Int. J. Fish. Aquat. Stud. 2016, 4, 1–6. [Google Scholar]
  44. Cranford, P.J.; Strain, P.M.; Dowd, M.; Hargrave, B.T.; Grant, J.; Archambault, M. Influence of mussel aquaculture on nitrogen dynamics in a nutrient enriched coastal embayment. Mar. Ecol. Prog. Ser. 2007, 347, 61–78. [Google Scholar] [CrossRef]
  45. Ferreira, J.G.; Corner, R.A.; Moore, H.; Service, M.; Bricker, S.B.; Rheault, R.; Nova, U.; Quinta, D.L.; Street, W.; Ecv, L.; et al. Ecological carrying capacity for shellfish aquaculture-sustainability of naturally occurring filter-feeders and cultivated bivalves. J. Shellfish Res. 2018, 37, 1–18. [Google Scholar] [CrossRef]
  46. Beadman, H.; Kaiser, M.; Galandi, M.; Shucksmith, R.; Willows, R. Changes in species richness with stocking density of marine bivalves. J. Appl. Ecol. 2004, 41, 464–475. [Google Scholar] [CrossRef]
  47. Kaiser, M.; Laing, I.; Utting, S.; GM, B. Environmental impacts of bivalve mariculture. J. Shellfish Res. 1998, 17, 59–66. [Google Scholar]
  48. Giangrande, A.; Cavallo, A.; Licciano, M.; Mola, E.; Pierri, C.; Trianni, L. Utilization of the filter feeder polychaete Sabella spallanzanii Gmelin (Sabellidae) as bioremediator in aquaculture. Aquac. Int. 2005, 13, 129–136. [Google Scholar] [CrossRef]
  49. Tomassetti, P.; Porrello, S. Polychaetes as indicators of marine fish farm organic enrichment. Aquac. Int. 2005, 13, 109–128. [Google Scholar] [CrossRef]
  50. Martinez-garcia, E.; Sanchez-jerez, P.; Aguado-giménez, F.; Ávila, P.; Guerrero, A.; Sánchez-lizaso, J.L.; Fernandez-gonzalez, V.; González, N.; Ignasi, J.; Carballeira, C.; et al. A meta-analysis approach to the effects of fish farming on soft bottom polychaeta assemblages in temperate regions. Mar. Pollut. Bull. 2013, 69, 165–171. [Google Scholar] [CrossRef] [PubMed]
  51. Prabakaran, J.; Vibin, A.; Deivakumari, M.; Muruganantham, M.; Ramasubburayam, R.; Palavesam, A.; Immanuel, G. Comparison of polychaete diversity and distribution along the south Tamilnadu coast (Lat. 8.08° to 10.79° N), India Jesudoss. Reg. Stud. Mar. Sci. 2019, 28, 100654. [Google Scholar] [CrossRef]
  52. Dean, H.K. The use of polychaetes (Annelida) as indicator species of marine pollution: A review. Int. J. Trop. Biol. 2008, 56, 11–38. [Google Scholar] [CrossRef]
  53. Diaz-Castaneda, V.; Reish, D. Part IV: Environmental and ecological studies. In Annelids in Modern Biology; Shain, D.H., Ed.; Wiley-Blackwell: Hoboken, NJ, USA, 2009; pp. 203–227. ISBN 9780470455203. [Google Scholar]
  54. Olsgard, F.; Brattegard, T.; Holthe, T. Polychaetes as surrogates for marine biodiversity: Lower taxonomic resolution and indicator groups. Biodivers. Conserv. 2003, 12, 1033–1049. [Google Scholar] [CrossRef]
  55. Wlodarska-Kowalczuk, M.; Kedra, M. Surrogacy in natural patterns of benthic distribution and diversity: Selected taxa versus lower taxonomic resolution. Mar. Ecol. Prog. Ser. 2007, 351, 53–63. [Google Scholar] [CrossRef] [Green Version]
  56. Errera, R.M.; Yvon-lewis, S.; Kessler, J.D.; Campbell, L. Reponses of the dinoflagellate Karenia brevis to climate change: pCO2 and sea surface temperatures. Harmful Algae 2014, 37, 110–116. [Google Scholar] [CrossRef]
  57. Aguado-Giméneza, F.; Gairínb, J.; Martinez-Garciac, E.; Fernandez-Gonzalez, V.; Ballester Moltó, M.; Cerezo-Valverde, J.; Sanchez-Jerez, P. Application of “taxocene surrogation” and “taxonomic sufficiency” concepts to fish farming environmental monitoring. Comparison of BOPA index versus polychaete assemblage structure. Mar. Environ. Res. 2014, 103, 27–35. [Google Scholar] [CrossRef] [Green Version]
  58. Mangion, M.; Borg, J.A.; Schembri, P.J.; Scanchez-Jerez, P. Assessment of benthic biological indicators for evaluating the environmental impact of tuna farming. Aquac. Res. 2017, 48, 5797–5811. [Google Scholar] [CrossRef]
  59. DNREC. Inland Bays/Alantic Ocean Basin Assessment Report; Department of Natural Resources and Environmental Conservation: Dover, DE, USA, 2001.
  60. DNREC. Sediment Management Plan, Rehoboth Bay, Sussex County, Delaware; Department of Natural Resources and Environmental Conservation: Dover, DE, USA, 2007.
  61. Eichler, P.P.; Billups, K.; Velez, C.C.; Cardona, V. Investigating faunal and geochemical methods for tracing salinity in an Atlantic coastal Lagoon, Delaware, USA. J. Foraminifer. Res. 2010, 40, 16–35. [Google Scholar] [CrossRef]
  62. Wang, L.T.; Mckenna, T.E.; Deliberty, T.L. Locating Ground-Water Discharge Areas in Rehoboth, Indian River Bays, and Indian River, Delaware Using Landsat 7 Imagery; University of Delaware: Newark, DE, USA, 2008. [Google Scholar]
  63. Karpas, R. The Hydrography of Indian River and Rehoboth-Delaware’s Small Bays; University of Delaware: Newark, DE, USA, 1978. [Google Scholar]
  64. Lee, K. Molecular Assessment of Benthic Diatom Assemblages in Delaware’s Inland Bays; University of Delaware: Newark, DE, USA, 2012. [Google Scholar]
  65. Fuoco, M. Nitrogen Source Tracking and Benthic Community Assessment in Relation to Oyster Aquaculture in the Delaware Inland Bays; Delaware State University: Dover, DE, USA, 2018. [Google Scholar]
  66. Cerco, C.F.; Seitzinger, S.P. Measured and modeled effects of benthic algae on eutrophication in Indian River-Rehoboth Bay, Delaware. Estuaries 1997, 20, 231–248. [Google Scholar] [CrossRef]
  67. Wong, K. On the wind-induced exchange between Indian River Bay, Delaware and the adjacent continental shelf. Cont. Shelf Res. 2002, 22, 1651–1668. [Google Scholar] [CrossRef]
  68. Wong, K.-C. The effect of coastal sea level forcing on Indian River Bay and Rehoboth Bay, Delaware. Estuar. Coast. Shelf Sci. 1991, 32, 213–229. [Google Scholar] [CrossRef]
  69. Smullen, J. Water Quality of Inland Bays; Roy F. Weston Inc.: West Chester, PA, USA, 1992. [Google Scholar]
  70. Weston, R.F. Inc. Report to the Delaware Inland Bays National Estuary Program; Delaware Department of Natural Resources and Environmental Control: Dover, DE, USA, 1993.
  71. Xu, L.; Ditroro, D.; Kirby, J. Numerical Study in Delaware Inland Bays; University of Delaware: Newark, DE, USA, 2006. [Google Scholar]
  72. Chrzastowski, M.J. Stratigraphy and Geologic History of a Holocene Lagoon: Rehoboth Bay and Indian River Bay, Delaware; University of Delaware: Newark, DE, USA, 1986. [Google Scholar]
  73. DNREC. Total Maximum Daily Loads for the Little Assawomn Bay and Tributaries and Ponds of the Indian River, Indian River Bay, and Reboth Bay; Department of Natural Resources and Environmental Conservation: Dover, DE, USA, 2004.
  74. Allison, J. Maryland Coastal Basin Existing Water Quality Conditions: Water Resources Administration; Maryland Department of Natural Resources: Annapolis, MD, USA, 1975.
  75. Wells, D.; Ortt, R. Bathymetric Survey of Assawoman Bay, St.Martin River, Sinepuxent Bay and Newport Bay; Maryland Department of Natural Resources: Annapolis, MD, USA, 2001.
  76. MDE. Priority Areas for Wetland Restoration, Preservation, and Mitigation in Maryland’s Coastal Bays; Maryland Department of the Environment: Baltimore, MD, USA, 2004.
  77. DIBEP. Delaware Inland Bays Estuary: Technical Appendix; Delaware Center for the Inland Bays: Rehoboth Beach, DE, USA, 1993. [Google Scholar]
  78. DIBEP. A day in the Life of Delaware’s Forgotten Bay: A Scientific Survey of Little Assawoman Bay; Delaware Center for the Inland Bays: Rehoboth Beach, DE, USA, 1991. [Google Scholar]
  79. VIMS. Polychaete Key for Chesapeake Bay and Coastal Virginia; College of William & Mary: Gloucester Point, VA, USA, 2001. [Google Scholar]
  80. Margalef, R. Information Theory in Ecology. Gen. Syst. 1957, 3, 36–71. [Google Scholar]
  81. He, F.; Gaston, K.J. Occupancy-abundance relationships and sampling scales. Ecography 2000, 23, 503–511. [Google Scholar] [CrossRef]
  82. R Development Core Team: A Language and Environment for Statistical Computing. Available online: https://cran.r-project.org/bin/windows/base/old/3.6.2/ (accessed on 12 December 2019).
  83. Nazeer, S.; Khan, M.U.; Malik, R.N. Phytoplankton spatio-temporal dynamics and its relation to nutrients and water retention time in multi-trophic system of Soan River, Pakistan. Environ. Technol. Innov. 2018, 9, 38–50. [Google Scholar] [CrossRef]
  84. Dobler, D.; Friedrich, S.; Pauly, M. Nonparametric MANOVA in meaningful effects. Ann. Inst. Stat. Math. 2019, 72, 997–1022. [Google Scholar] [CrossRef]
  85. Herna, I.; Pe, A.; Mateo, J.J.; Megina, C.; Vergara, J.J.; Steentoft, G.; Farnham, L.M.I. Growth dynamic of Ulva rotundata (Chlorophyta) in a fish farm: Implications for biomitigation at a large scale. J. Phycol. 2008, 1089, 1080–1089. [Google Scholar] [CrossRef]
  86. Beer, S.; Israel, A. Photosynthesis of Ulva fasciata. IV. pH, carbonic anhydrase and inorganic carbon conversions in the unstirred layer. Plant Cell Environ. 1990, 13, 555–560. [Google Scholar] [CrossRef]
  87. Björk, M.; Axelsson, L.; Beer, S. Why is Ulva intestinalis the only macroalga inhabiting isolated rockpools along the Swedish Atlantic coast ? Mrine Ecol. Prog. Ser. 2004, 284, 109–116. [Google Scholar] [CrossRef]
  88. Rybak, A.S.; Gabka, M. The influence of abiotic factors on the bloom-forming alga Ulva flexuosa (Ulvaceae, Chlorophyta): Possibilities for the control of the green tides in freshwater ecosystems. J. Appl. Phycol. 2018, 30, 1405–1416. [Google Scholar] [CrossRef] [Green Version]
  89. Castaldelli, G.; Welsh, D.; Flachi, G.; Zucchini, G.; Colombo, G.; Rossi, R.; Fano, E. Decomposition dynamics of the bloom forming macroalga Ulva rigida determined using a 14C-carbon radio-tracer technique. Aquat. Bot. 2003, 75, 111–122. [Google Scholar] [CrossRef]
  90. Papageorgiou, N.; Arvanitidis, C.; Eleftheriou, A. Multicausal environmental severity: A flexible framework for microtidal sandy beaches and the role of polychaetes as an indicator taxon. Estuar. Coast. Mar. Sci. 2006, 70, 643–653. [Google Scholar] [CrossRef]
  91. CIB. About the Bays: Issues Affecting the Bays; Delaware Center for the Inland Bays: Rehoboth Beach, DE, USA, 2014. [Google Scholar]
  92. MacKenzie, J.; Martin, J.; Pintea, L.; Boonmee, B.; Gedamu, N.; Thomas, T. Delaware Inland Bays Watershed Nutrient Management Project; University of Delaware: Newark, DE, USA, 2016. [Google Scholar]
  93. Vallarino, E.A.; Rivero, M.S.; Gravina, M.C.; Elías, R. The community-level response to sewage impact in intertidal mytilid beds of the Southwestern Atlantic, and the use of the Shannon index to assess pollution. Rev. Biol. Mar. Oceanogr. 2002, 37, 25–33. [Google Scholar] [CrossRef] [Green Version]
  94. Belan, T.A. Benthos abundance pattern and species composition in conditions of pollution in Amursky Bay (the Peter the Great Bay, the Sea of Japan). Mar. Pollut. Bull. 2003, 46, 1111–1119. [Google Scholar] [CrossRef]
  95. Rivero, M.S.; Elias, R.; Vallarino, E.A. First survey of macroinfauna in the Mar del Plata Harbor (Argentina), and the use of polychaetes as pollution indicators. Rev. Biol. Mar. Oceanogr. 2005, 40, 101–108. [Google Scholar] [CrossRef]
  96. Dix, T.; Karlen, D.; Grabe, S.; Goetting, B.; Holden, S.; Markahm, C. Spionid polychaetes as environmental indicators: An example from Tampa Bay, Florida. In Estuarine Indicators; Bortone, S.A., Ed.; CRC Press: Boca Raton, FL, USA, 2004; p. 20. ISBN 9780429122231. [Google Scholar]
  97. Levin, L.A.; Gage, J.D.; Martin, C.; Lamont, P.A. Macrobenthic community structure within and beneath the oxygen minimum zone, NW Arabian Sea. Deep Sea Res. II 2000, 47, 189–226. [Google Scholar] [CrossRef]
  98. Jose, J.J.; Udayakumar, P.; Deepak, M.P.; Rajesh, B.R.; Babu, K.N.; Chandran, A. Assemblages of marine polychaete genus Glycera (Phyllodocida: Glyceridae) along the Kerala Coast as an indicator of organic enrichment. Nat. Environ. Pollut. Technol. 2011, 10, 395–398. [Google Scholar]
  99. Bailey-brock, J.H.; Paavo, B.; Barrett, B.M.; Dreyer, J. Polychaetes associated with a tropical ocean outfall: Synthesis of a biomonitoring program off O’ahu, Hawaii. Pac. Sci. 2002, 56, 459–479. [Google Scholar] [CrossRef] [Green Version]
  100. Kruse, I.; Strasser, M.; Thiermann, F. The role of ecological divergence in speciation between intertidal and subtidal Scoloplos armiger (Polychaeta, Orbiniidae). J. Sea Res. 2004, 51, 53–62. [Google Scholar] [CrossRef]
  101. Bellan, G.; Desrosierst, G.; Willsie, A. Use of an annelid pollution index for monitoring a moderately polluted littoral zone. Mar. Pollut. Bull. 1988, 19, 662–665. [Google Scholar] [CrossRef]
  102. Gao, Q.F.; Cheung, K.L.; Cheung, S.G.; Shin, P.K.S. Effects of nutrient enrichment derived from fish farming activities on macroinvertebrate assemblages in a subtropical region of Hong Kong. Mar. Pollut. Bull. 2005, 51, 994–1002. [Google Scholar] [CrossRef]
  103. Hernández-Alcántara, P.; Solís-Weiss, V. Distribution of the polychaete assemblages on the continental shelf of the Northern Gulf of California, Eastern Pacific. Ital. J. Zool. 2011, 78, 280–289. [Google Scholar] [CrossRef]
  104. Newell, R. Ecosystem influences of natural and cultivated populations of suspension-feeding bivalve molluscs: A review. J. Shellfish Res. 2004, 23, 51–61. [Google Scholar]
  105. Fabi, G.; Manoukian, S.; Spagnolo, A. Impact of an open-sea suspended mussel culture on macrobenthic community (Western Adriatic Sea). Aquaculture 2009, 289, 54–63. [Google Scholar] [CrossRef]
  106. Wu, R.; Lam, K.; MacKay, D.; Lau, T.; Yam, V. Impact of marine fish farming on water quality and bottom sediment: A case study in the sub-tropical environment. Mar. Environ. Res. 1994, 38, 115–145. [Google Scholar] [CrossRef]
  107. Duball, C.E. Environmental Impacts of Oyster Aquaculture on the Coastal Lagoons of Southern Rhode Island; University of Rhode Island: Kingstown, RI, USA, 2017. [Google Scholar]
  108. Dubois, S.; Marin-Léal, J.C.; Ropert, M.; Lefebvre, S. Effects of oyster farming on macrofaunal assemblages associated with Lanice conchilega tubeworm populations: A trophic analysis using natural stable isotopes. Aquaculture 2007, 271, 336–349. [Google Scholar] [CrossRef]
  109. Prins, T.C.; Smaal, A.C.; Dame, R.F. A review of the feedbacks between bivalve grazing and ecosystem processes. Aquat. Ecol. 1997, 31, 349–359. [Google Scholar] [CrossRef]
  110. Black, K. Environmental Impacts of Aquaculture; CRC Press: Boca Raton, FL, USA, 2001. [Google Scholar]
  111. Magill, S.H.; Thetmeyer, H.; Cromey, C.J. Settling velocity of faecal pellets of gilthead sea bream (Sparus aurata L.) and sea bass (Dicentrarchus labrax L.) and sensitivity analysis using measured data in a deposition model. Aquaculture 2006, 251, 295–305. [Google Scholar] [CrossRef]
  112. Rice, M. Environmental impacts of shellfish aquaculture: Filter feeding to control eutrophication. In Proceedings of the Marine Aquaculture and the Marine Environment: A Meeting for the Stakeholders in the Northeast, Boston, MA, USA, 11–13 January 2001; Tlusty, M., Bengtson, D., Halvorson, H., Oktay, S., Pearce, J., Rheualt, R., Eds.; Cape Cod Press: Falmouth, MA, USA, 2001; pp. 77–86. [Google Scholar]
  113. Sturdivant, S.K.; Díaz, R.J.; Llansó, R.; Dauer, D.M. Relationship between Hypoxia and Macrobenthic Production in Chesapeake Bay. Estuaries Coasts 2014, 37, 1219–1232. [Google Scholar] [CrossRef]
Figure 1. Sampling sites in the Delaware Inland Bays. The RB, IR, and LAW indicate Rehoboth Bay, Indian River Bay, and Little Assawoman Bay (Map Credit: [65]).
Sustainability 13 06480 g001
Figure 2. Spatial and temporal variation in water quality parameters of Delaware Inland Bays; (A) temperature, (B) salinity, (C) pH, (D) turbidity, (E) dissolved oxygen, and (F) chlorophyll-a during the first (2016, black dots and lines) and second year of sampling (2017, gray dots and lines). Sampling locations at Rehoboth Bay, Indian River Bay, and Little Assawoman Bay are indicated as squares, circles, and triangles, respectively.
Sustainability 13 06480 g002
Figure 3. Mean (A) abundance and (B) richness index of polychaetes collected from sampling locations in Indian River Bay in 2017. Data collected from control gears are shown in light gray, and dark grays indicate sampling sites in which oysters were farmed with a density of 250 oysters/gear. Errors denote the standard deviations of five sampling data.
Sustainability 13 06480 g003
Figure 4. Mean total abundance (A) and richness index (B) of polychaetes in Delaware Inland Bays. The gray shade represents sampling location; Rehoboth Bay, Indian River Bay, and Little Assawoman Bay, respectively, from light to dark. The bars with and without the stripe pattern indicate the farming density of 250 oysters/gear and 50 oysters/gear. Different letters show a significant difference. Errors indicate the standard deviations of five samples.
Sustainability 13 06480 g004
Table 1. ANOVA on water quality parameters of Delaware Inland Bays during June to October 2016, 2017.
ParameterLocation EffectYear EffectMonth Effect
F2, 109p-ValueF1, 109p-ValueF4, 109p-Value
Surface temperature1.6410.1990 n.s0.6920.4070 n.s33.575<2.2−16 ***
Surface salinity59.981<2.2−16 ***3.0180.0852 n.s5.3810.0006 ***
pH0.6050.5481 n.s4.5810.0345 *8.6814.03 × 10−6 ***
Turbidity3.7840.0258 *6.6760.0111 *8.9712.66 × 10−6 ***
Dissolved oxygen2.3580.0994 n.s14.6670.0002 ***7.3033−05 ***
Chlorophyll a8.9590.0003 ***47.4113.85−10 ***2.8750.0262 *
Significant level: *** 0.001 ** 0.01 * 0.05. n.s shows non-significant difference.
Table 2. Polychaetes collected from Delaware Inland Bays from June to October 2016, 2017. Plus sign indicates the occurrence of the given family at different sampling locations (bays and distance) and time (month and year). Oster density was 50 and 250 oysters/gear in 2016 and 2017, respectively 1.
FamilyNumber of
Specimens
MonthDistanceBayYear 1
JuneJulyAugustSeptemberOctoberUnder gearOne MeterFive MetersRBIRLAW20162017
Arenicolidae3 + ++ ++ +
Capitellidae299+++++++++++++
Chaetopteridae 4 + + + + +
Eunicidae1 + + ++
Glyceridae19 +++++++ ++++
2++ + + + +
2 + + + +
199 ++++++++++++
Orbiniidae60+++++++++++++
Oweniidae29+++++++++++++
Phyllodocidae3 + + ++ + +
Spionidae46+++++++++++++
Spirobidae3 +++ + ++
Not identified39 +++++++ + +
Polycladida1 ++ + +
Table 3. Summary of rankMANOVA on polychaetes abundance and richness in Delaware Inland Bays during June to October 2016, 2017.
SourcedfMultivariateAbundanceRichness
F-Valuep-ValueF-Valuep-ValueF-Valuep-Value
Bay2.7212.0690.009 **6.7320.020 *5.3360.042 *
Density1.726.2390.034 *0.8540.053 n.s5.3850.021 *
Distance2.7260.855<0.001 ***48.709<0.001 ***12.146<0.001 ***
Bay × Density2.722.4000.494 n.s0.1710.642 n.s2.2290.304 n.s
Bay × Distance4.7211.4040.090 n.s3.6840.160 n.s7.7190.082 n.s
Density × Distance2.7223.512<0.001 ***14.915<0.001***8.5970.010***
Bay × Density × Distance4.722.7920.824 n.s1.9420.931 n.s0.8500.914 n.s
Significant level: *** 0.001 ** 0.01 * 0.05. n.s shows non-significant difference.
Publisher’s Note: MDPI stays neutral with regard to jurisdictional claims in published maps and institutional affiliations.

