
Assessment of the Results and Methodology of the Sustainable Development Index for Spanish Cities

 , ,
, ,  ,
,
Abstract
:1. Introduction
2. Materials and Methods
- Description and analysis of the indicatorsThe objective is to identify potentially problematic indicators that could bias the overall index results. The authors used the same JRC rule to analyze the distributions [52]. An indicator should be considered for mathematical treatment if it has an absolute skewness more significant than 2.0 and a kurtosis greater than 3.5. In those cases, further analysis of their data distribution would be developed [53].The formula for skewness is referred to as the Fisher-Pearson coefficient of skewness:The authors use the following definition of kurtosis:
- Alternatives for calculating the index, assumptionsThese methodological alternatives are collected in the assumptions listed below. The analysis results are intended to demonstrate how the choice of indicators and the methodology affect the position of cities in the ranking. The selection of indicators and their targets can be considered two central points for defining the SDGs’ performance metric [54]. This proves the sensitivity of rankings by comparing an Initial set (Is) versus an Alternative set (As) of the SCR indicators. The assumptions raised in this study are the following:
- i.
- Aggregation: arithmetic mean and geometric meanThe geometric mean is usually used to aggregate heterogeneous variables and when the focus of the analysis is on percentage changes rather than absolute changes. For example, this method is used in the Human Development Index [55]. Its three-dimensional aggregation method for the arithmetic mean was changed to the geometric mean in 2010. Compared with the geometric mean, the arithmetic average has the advantage of the simplicity of interpretation: an index score between 0 and 100 reflects the average initial placement of the country between worst and best on the average of the 17 goals [51]. The study proposes the calculation of geometric mean for the Alternative set (As).
- ii.
- Weighting of the SDGsThe method for aggregating and weighting different variables into a single index can profoundly impact the overall ranking [56]. In the Initial set (Is), each indicator was weighted equally. As a result, the relative weight of each indicator in a goal was inversely proportional to the number of indicators considered under that goal [51]. Different weightings of individual SDGs can have important implications on a city’s performance and relative ranking in the composite index [57]. For this reason, the authors propose to use for the Alternative set (As) as the expert weight approach at the goal level [51], taking advantage of the survey on municipal competencies carried out by sustainability experts and members of local Spanish entities included in the report.
- iii.
- Reduction of the indicator setTo evaluate the statistical consistency of SCR indicators, a cross-sectional analysis is employed. The correspondence between the SCR index and real-world phenomena needs to be analyzed because correlations do not necessarily represent the real influence of the individual indicators on the phenomenon being measured [58]. The correlation aims to quantify the strength of the link joining two different indicators or goals [59]. Non-parametric correlation methods are commonly applied to those pairs of variables whose distribution is unknown a priori. This is the case of Spearman’s analysis [60]. In contrast to Pearson’s, the most commonly used correlation coefficient, Spearman’s does not assume normally distributed and same-scaled variables [61]. This is why Pearson’s rank has been used in several disciplines and previous studies [62,63]. The authors propose using the cross-correlation analysis to preliminary address the extent to which the data supports the conceptual framework [51]. The 1% significance level is used to determine whether the correlation between two variables is statistically significant [58]. To optimize and reduce the number of indicators, the Alternative set (As) will not include the correlated ones.
- Analysis of the impact of assumptions:
- iv.
- Principal component analysisPrincipal Component Analysis (PCA) is commonly used to assign weights to individual variables correlated and measured by a common underlying factor. In addition, PCA reduces the effects of multicollinearity by using a subset of the principal components in the model [51]. To analyze the impact of the previous assumptions using the Alternative set, the authors propose to use principal component analysis (PCA) to summarize each goal and interactions in the SCR. Applying PCA allows mapping trends, synergies and trade-offs at the level of goals for all SDGs while using all available information on each indicator [64].
- v.
- Analysis of the variation of positionsThis analysis aims to evaluate the shifts in the positions between the Initial set (Is) and the Alternative set (As). Cities shifts under three positions cannot be considered significant, whereas differences of 10 places can show a meaningful difference [52]. The variation in the rankings, considering the previous assumptions, allows us to identify which cities show a particular sensitivity to changes.
3. Results
3.1. Description and Analysis of the Indicators
3.2. Alternatives for Calculating the Index, Assumptions
3.2.1. Aggregation: Arithmetic vs. Geometric Average
3.2.2. Weighting of the SDGs
3.2.3. Reduction of the Set of Indicators
3.3. Analysis of the Impact of Assumptions
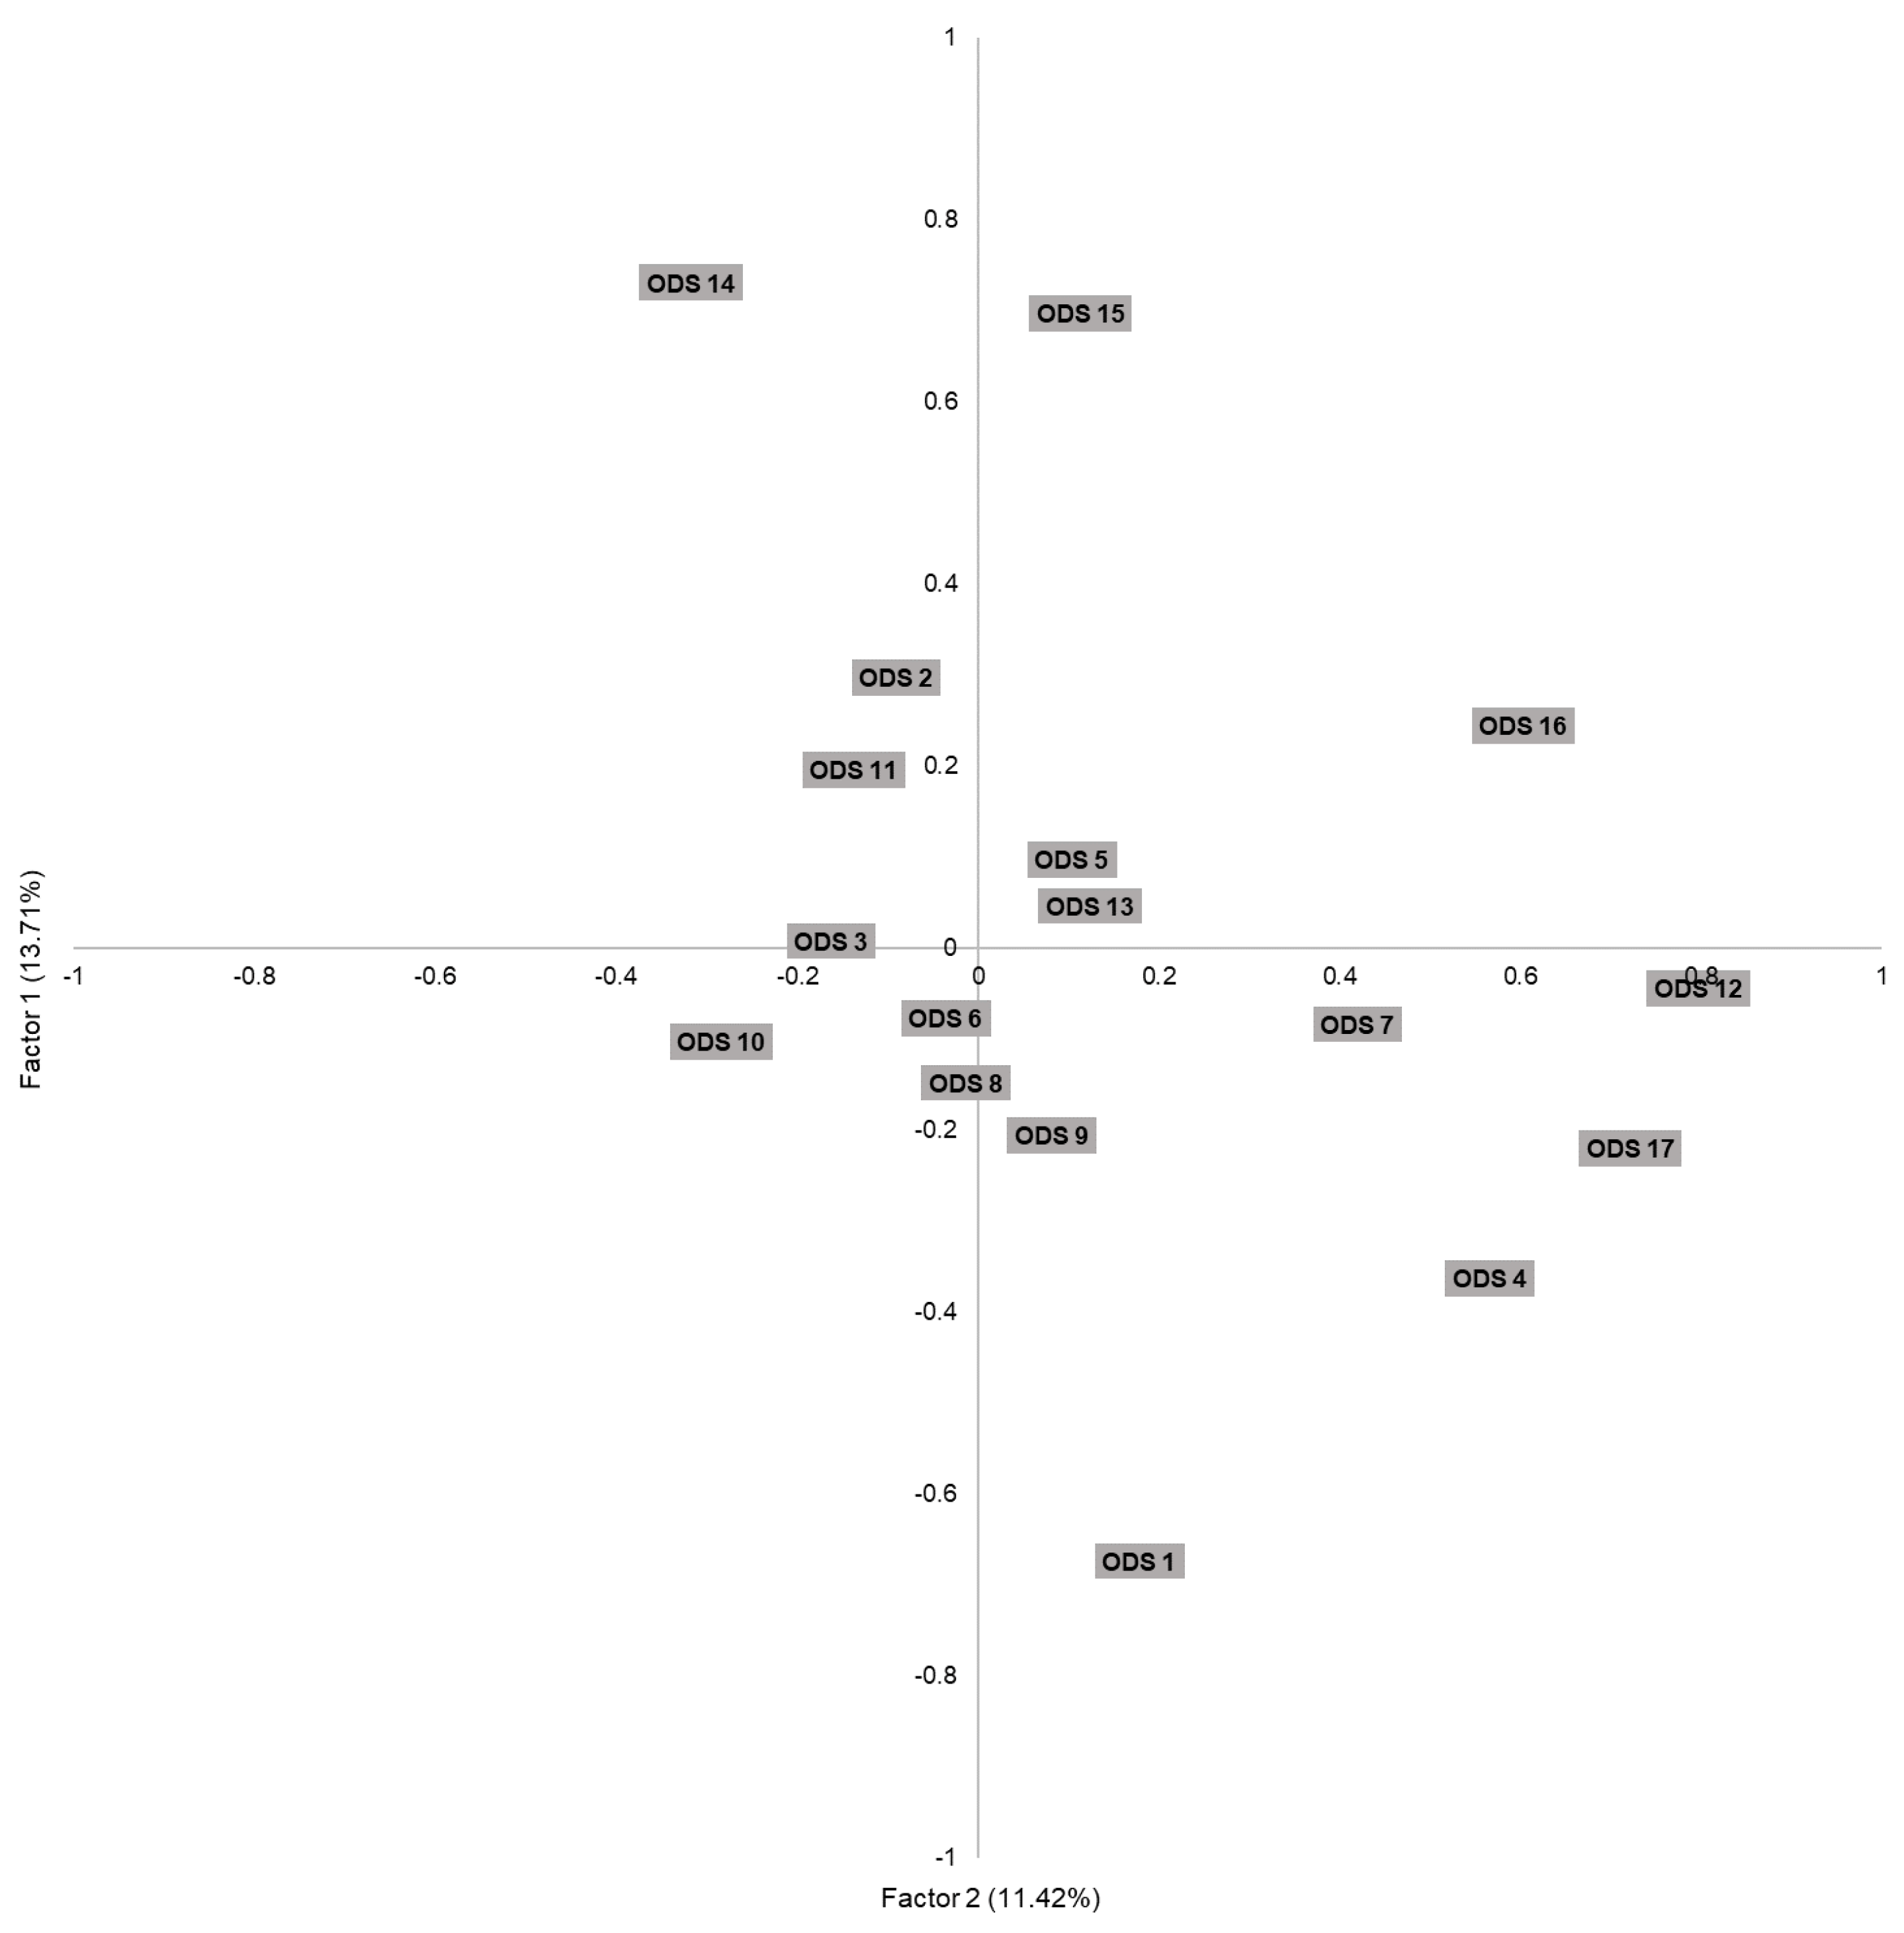
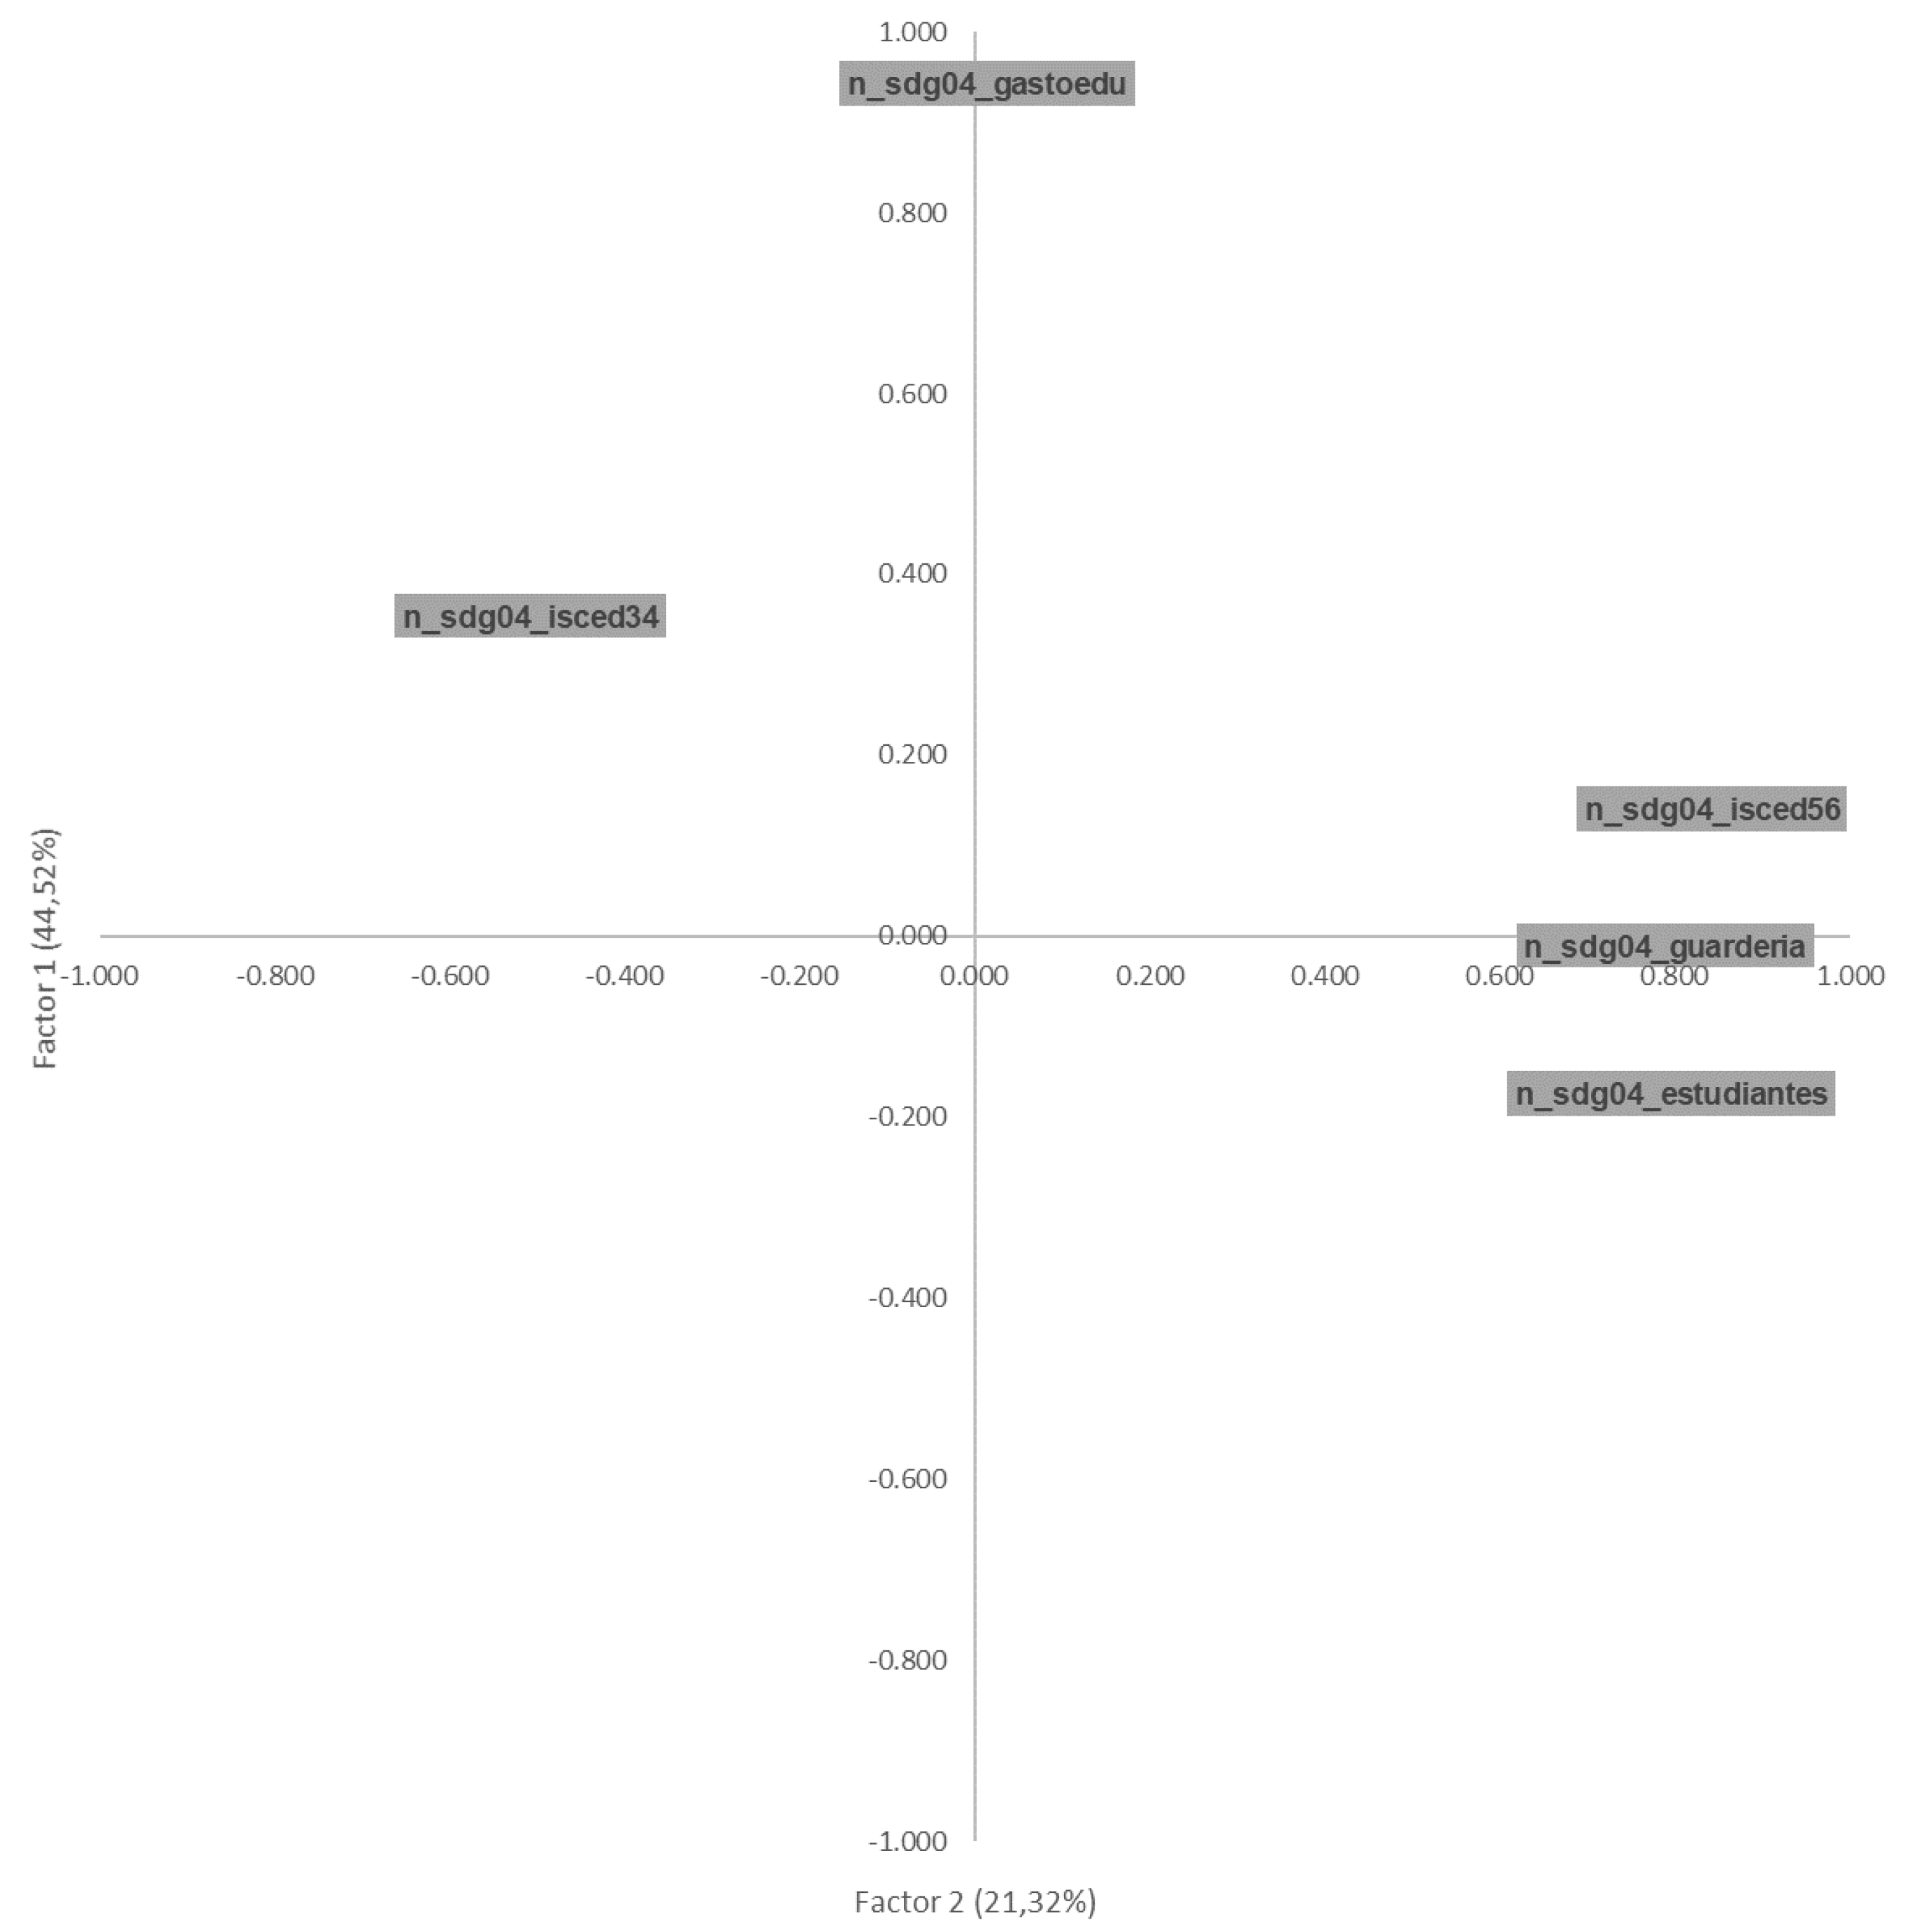
3.3.1. Principal Component Analysis
3.3.2. Index Position Shifts Analysis
4. Final Conclusions and Discussions
Author Contributions
Funding
Data Availability Statement
Acknowledgments
Conflicts of Interest
Appendix A

| Goal | Id | Indicator | Description | Scale |
|---|---|---|---|---|
| SDG 1—No poverty | ||||
| 1 | 1a | sdg01_2020ratio | 20:20 ratio. Income inequality metric | Municipal |
| 1 | 1b | sdg01_gastosocial | Social Welfare spending per capita | Municipal |
| 1 | 1c | sdg01_pobreza | Population with income per consumption unit below 40% | Municipal |
| 1 | 1d | sdg01_pobrezamenores | Child poverty rate | Municipal |
| 1 | 1e | sdg01_riesgopobreza | Risk of poverty rate | Municipal |
| SDG 2—Zero hunger | ||||
| 2 | 2a | sdg02_agricultura | Organic farming rate | Provincial |
| 2 | 2b | sdg02_consumo | Food consumption prices index | Provincial |
| 2 | 2c | sdg02_empagri | Employment rate in agriculture and fishery | Municipal |
| 2 | 2d | sdg02_expagrariasurbano | Agricultural and Forestry Operations | Municipal |
| 2 | 2e | sdg02_supcultivos | Share of land of agricultural areas | Municipal |
| SDG 3—Good Health and well-being | ||||
| 3 | 3a | sdg03_adfertility | Adolescent fertility rate | Municipal |
| 3 | 3b | sdg03_alcohol | Alcohol and drugs death rate | Municipal |
| 3 | 3c | sdg03_gripe | Infectious disease of the respiratory system death rate | Municipal |
| 3 | 3d | sdg03_hepatitis | Viral hepatitis-related deaths rate | Municipal |
| 3 | 3e | sdg03_infantil | Infant mortality | Municipal |
| 3 | 3f | sdg03_ncd | Non-communicable diseases death rate | Municipal |
| 3 | 3g | sdg03_prematuras | Premature mortality (under 65 years) | Municipal |
| 3 | 3h | sdg03_suicidios | Suicide death rate | Municipal |
| 3 | 3i | sdg03_trafico | Road traffic death rate | Municipal |
| 3 | 3j | sdg03_tuberculosis | Tuberculosis death rate | Municipal |
| 3 | 3k | sdg03_tumores | Respiratory system tumours death rate | Municipal |
| 3 | 3l | sdg03_vida | Life expectancy | Municipal |
| 3 | 3m | sdg03_vih | HIV and AIDS death rate | Municipal |
| SDG 4—Quality education | ||||
| 4 | 4a | sdg04_estudiantes | Students enrolled in higher education | Municipal |
| 4 | 4b | sdg04_gastoedu | Education spending per capita | Municipal |
| 4 | 4c | sdg04_guarderia | Children 0–4 in day care or school | Municipal |
| 4 | 4d | sdg04_isced012 | Adults with primary education (ISCED level 0,1–2) | Municipal |
| 4 | 4e | sdg04_isced34 | Adults with secondary education (ISCED level 3–4) | Municipal |
| 4 | 4f | sdg04_isced56 | Adults with higher education (ISCED level 5–8) | Municipal |
| SDG 5—Gender equality | ||||
| 5 | 5a | sdg05_brechapension | Gender subsidy gap | Provincial |
| 5 | 5b | sdg05_brechasalarial | Gender salary gap | Provincial |
| 5 | 5c | sdg05_delitossex | Violence and sexual exploitation rate | Municipal |
| 5 | 5d | sdg05_denuncias | Gender violence rate | Municipal |
| 5 | 5e | sdg05_paridad | Seats held by women in municipal governments | Municipal |
| SDG 6—Clean water and sanitation | ||||
| 6 | 6a | sdg06_balanceagua | Balance in budgets for water service | Municipal |
| 6 | 6b | sdg06_canon | Fee for water supply and sanitation rate | Municipal |
| 6 | 6c | sdg06_esfuerzo | Financial exertion for water supply | Municipal |
| 6 | 6d | sdg06_litros | Volume of water distributed per day | Municipal |
| 6 | 6e | sdg06_precioabasteci | Water supply price | Provincial |
| 6 | 6f | sdg06_preciosaneamiento | Water sanitation price | Provincial |
| SDG 7—Affordable and clean energy | ||||
| 7 | 7a | sdg07_eficiencia | Reduction in spending on street lighting since 2012 | Municipal |
| 7 | 7b | sdg07_facturaelectr | Impact of electricity costs on average household income | Municipal |
| 7 | 7c | sdg07_renovable | Renewable energy rate | Provincial |
| 7 | 7d | sdg07_suministro | Power supply quality index | Provincial |
| SDG 8—Decent work and economic growth | ||||
| 8 | 8a | sdg08_accidentes | Accidents at Work | Provincial |
| 8 | 8b | sdg08_desempleo | Unemployment rate | Municipal |
| 8 | 8c | sdg08_desempleocovid | Impact of COVID-19 on unemployment rate | Municipal |
| 8 | 8d | sdg08_desempleojovenes | Youth unemployment rate | Municipal |
| 8 | 8e | sdg08_desempleolarga | Long term unemployed | Provincial |
| 8 | 8f | sdg08_diversidad | Sector-dependency job index | Municipal |
| 8 | 8g | sdg08_pibcapitamun | GDP annual growth rate | Municipal |
| 8 | 8h | sdg08_productividad | Annual productivity growth rate | Municipal |
| SDG 9—Industry, Innovation and Infrastructure | ||||
| 9 | 9a | sdg09_3g4g | 3G and 4G networks access index | Provincial |
| 9 | 9b | sdg09_bandaancha | Broadband penetration rate | Provincial |
| 9 | 9c | sdg09_empindus | Employees in Industry rate | Municipal |
| 9 | 9d | sdg09_gastoidi | R&D spending per capita | Municipal |
| 9 | 9e | sdg09_patentes | Patent applications local rate | Municipal |
| 9 | 9f | sdg09_sueloactecon | Land area planned for economic activities | Municipal |
| SDG 10—Reduced inequality | ||||
| 10 | 10a | sdg10_mediana | Population under poverty line | Municipal |
| 10 | 10b | sdg10_discapacitados | People with disabilities in labor market | Provincial |
| 10 | 10c | sdg10_extranjeros | Foreign employment rate | Provincial |
| 10 | 10d | sdg10_igini | Gini index | Municipal |
| 10 | 10e | sdg10_indicedependencia | Child and elderly dependency ratio | Municipal |
| 10 | 10f | sdg10_top1 | Top 1%. Income inequality metric | Municipal |
| SDG 11—Sustainable cities and communities | ||||
| 11 | 11a | sdg11_no2 | NO2 concentration. Air Quality indicator | Municipal |
| 11 | 11b | sdg11_o3 | Ozone concentration. Air Quality indicator | Municipal |
| 11 | 11c | sdg11_pm10 | PM10 concentration. Air Quality indicator | Municipal |
| 11 | 11d | sdg11_pm10dias | Days that exceed PM10 limits | Municipal |
| 11 | 11e | sdg11_pm10media | PM10 annual average | Municipal |
| 11 | 11f | sdg11_preciovivienda | Housing access index | Municipal |
| 11 | 11g | sdg11_residencias | Nursing home places | Provincial |
| 11 | 11h | sdg11_resiliencia | Urban resilience index | Municipal |
| 11 | 11i | sdg11_suptrans | Access to public transport index | Municipal |
| 11 | 11j | sdg11_viviendaprotegida | Access to protected housing | Provincial |
| 11 | 11k | sdg11_vulnerables | Urban vulnerability index | Municipal |
| SDG 12—Responsible consumption and production | ||||
| 12 | 12a | sdg12_envases | Plastic recycling and packaging rate | Municipal |
| 12 | 12b | sdg12_impropios | Improper waste rate | Municipal |
| 12 | 12c | sdg12_papel | Paper recycling rate | Municipal |
| 12 | 12d | sdg12_turismo | Sustainable tourism | Municipal |
| 12 | 12e | sdg12_vidrio | Glass recycling rate | Municipal |
| SDG 13—Climate action | ||||
| 13 | 13a | sdg13_CO2buildings | Buildings and industry CO2 emissions per capita | Municipal |
| 13 | 13b | sdg13_CO2capita | CO2 emissions per capita | Municipal |
| 13 | 13c | sdg13_CO2transport | Transportation CO2 emissions per capita | Municipal |
| 13 | 13d | sdg13_medicion | Covenant of mayors for climate and energy network | Municipal |
| SDG 14—Life below water | ||||
| 14 | 14a | sdg14_banderaazul | Blue flags index for coastal areas | Municipal |
| 14 | 14b | sdg14_calidad | Bathing sites with excellent water quality | Municipal |
| 14 | 14c | sdg14_costamun | Land built on the coastal strip of the first 500 m | Municipal |
| 14 | 14d | sdg14_dpmt | Protected public land–maritime domain | Municipal |
| 14 | 14e | sdg14_habitatsmun | Coastal and marine protected natural habitats | Municipal |
| SDG 15—Life on land | ||||
| 15 | 15a | sdg15_cobartificial | Territory and habitat diversity. Artificial cover | Municipal |
| 15 | 15b | sdg15_enp | Protection of Natural Areas | Municipal |
| 15 | 15c | sdg15_zonaforestal | Forest areas | Municipal |
| 15 | 15d | sdg15_zonasverdes | Tree Cover Density | Municipal |
| SDG 16—Peace, justice and strong institutions | ||||
| 16 | 16a | sdg16_blanqueo | Drug traffic crime rate | Municipal |
| 16 | 16b | sdg16_criminalidad | Crime rate | Municipal |
| 16 | 16c | sdg16_homicidios | Murders and violent deaths | Municipal |
| 16 | 16d | sdg16_participa | Voter turnout in municipal elections | Municipal |
| 16 | 16e | sdg16_participacion | Citizen participation and collaboration index | Municipal |
| 16 | 16f | sdg16_solidez | Strength and autonomy of the municipal institution | Municipal |
| 16 | 16g | sdg16_transparencia | Municipal transparency index | Municipal |
| 16 | 16h | sdg16_transparenciaeco | Economic and financial transparency index | Municipal |
| 16 | 16i | sdg16_violencia | Violence against children (under 13 years) | Provincial |
| SDG 17—Partnership for the goals | ||||
| 17 | 17a | sdg17_coop | Cooperation and development projects | Municipal |
| 17 | 17b | sdg17_opendata | Open data index | Municipal |
| 17 | 17c | sdg17_redes | National networks to achieve the SDGs | Municipal |
| 17 | 17d | sdg17_zonasblancas | White NGA areas | Municipal |
Appendix B
| Goal | Indicator | Number of Cities | Missing Data (%) | Mean | Skewness | Kurtosis | Deviation | Variance |
|---|---|---|---|---|---|---|---|---|
| 1 | 1a | 98 | 4.85 | 13.32 | 1.44 | 1.27 | 18.1 | 327.55 |
| 1 | 1b | 101 | 1.94 | 22.8 | 1.6 | 3.23 | 19.91 | 396.25 |
| 1 | 1c | 98 | 4.85 | 50.72 | −1.04 | 0.56 | 18.44 | 340.08 |
| 1 | 1d | 98 | 4.85 | 40.38 | −0.24 | 0.27 | 16.9 | 285.75 |
| 1 | 1e | 98 | 4,85 | 43.54 | −0.64 | −0.28 | 18.36 | 336.94 |
| 2 | 2a | 103 | 0 | 54.01 | −0.2 | −0.54 | 25.21 | 635.29 |
| 2 | 2b | 94 | 8.74 | 13.1 | 2.84 | 8.52 | 20.41 | 416.69 |
| 2 | 2c | 103 | 0 | 11.58 | 2.94 | 9.32 | 19.62 | 384.77 |
| 2 | 2d | 103 | 0 | 37.71 | 0.44 | −0.85 | 29.36 | 861.83 |
| 3 | 3a | 103 | 0 | 56.08 | 0.1 | 0.05 | 22.92 | 525.29 |
| 3 | 3b | 103 | 0 | 79.61 | −1.23 | 1.04 | 24.91 | 620.35 |
| 3 | 3c | 103 | 0 | 58.62 | −0.4 | −0.34 | 24.76 | 612.91 |
| 3 | 3d | 103 | 0 | 71.14 | −1.08 | 0.78 | 25.09 | 629.3 |
| 3 | 3e | 94 | 8.74 | 67.42 | −0.94 | 0.54 | 21.85 | 477.43 |
| 3 | 3f | 103 | 0 | 60.5 | −0.28 | −0.48 | 24.25 | 588.1 |
| 3 | 3g | 103 | 0 | 56.98 | −0.19 | −0.8 | 26.08 | 680.26 |
| 3 | 3h | 103 | 0 | 50.7 | 0.17 | −0.55 | 22.97 | 527.68 |
| 3 | 3i | 102 | 0.97 | 98.71 | −1.57 | 2.49 | 1.16 | 1.34 |
| 3 | 3j | 103 | 0 | 76.63 | −1.22 | 0.95 | 26.42 | 698.21 |
| 3 | 3k | 103 | 0 | 57.3 | −0.23 | −0.66 | 25.97 | 674.5 |
| 3 | 3l | 103 | 0 | 90.34 | −0.16 | −0.4 | 4.58 | 20.98 |
| 3 | 3m | 103 | 0 | 67.04 | −0.52 | −0.7 | 29.32 | 859.45 |
| 4 | 4a | 92 | 10.68 | 27.24 | 1.2 | 1.87 | 22.78 | 518.9 |
| 4 | 4b | 101 | 1.94 | 41.91 | 0.71 | −0.62 | 30.33 | 919.66 |
| 4 | 4c | 94 | 8.74 | 29.63 | 0.68 | 1.96 | 14.39 | 207.02 |
| 4 | 4d | 89 | 13.59 | 35.84 | 0.34 | 0.55 | 17.09 | 292.18 |
| 4 | 4e | 94 | 8.74 | 85.23 | −0.27 | −0.42 | 10.41 | 108.41 |
| 4 | 4f | 94 | 8.74 | 49.04 | 0.3 | 0.2 | 19.39 | 375.97 |
| 5 | 5a | 98 | 4.85 | 26.77 | −0.1 | 0.14 | 10.19 | 103.84 |
| 5 | 5b | 98 | 4.85 | 24.23 | 0.5 | −0.44 | 15.43 | 237.98 |
| 5 | 5c | 103 | 0 | 45.36 | −0.48 | −0.19 | 18.18 | 330.47 |
| 5 | 5d | 97 | 5.83 | 54.59 | −0.9 | 0.23 | 21.17 | 448.17 |
| 5 | 5e | 103 | 0 | 84.73 | −1.02 | 1.21 | 15.02 | 225.51 |
| 6 | 6a | 72 | 30.1 | 79.41 | −1.6 | 1.88 | 27.2 | 739.7 |
| 6 | 6b | 77 | 25.24 | 82.76 | −1.53 | 1.59 | 25.81 | 666.34 |
| 6 | 6c | 79 | 23.3 | 68.93 | −0.72 | 0.02 | 22.09 | 488.12 |
| 6 | 6d | 95 | 7.77 | 67.82 | −1.01 | 1.42 | 21.7 | 470.73 |
| 6 | 6e | 77 | 25.24 | 62.39 | −0.92 | 0.11 | 27.71 | 768.05 |
| 6 | 6f | 77 | 25.24 | 59.84 | −0.38 | −0.27 | 24.64 | 607.23 |
| 7 | 7a | 87 | 15.53 | 46.59 | −0.42 | 0.25 | 22.81 | 520.27 |
| 7 | 7b | 103 | 0 | 47.9 | −0.1 | 0.3 | 21.67 | 469.46 |
| 7 | 7c | 103 | 0 | 35.72 | 1.02 | −0.28 | 28.9 | 835.08 |
| 7 | 7d | 103 | 0 | 70.82 | −1.72 | 6.17 | 15.83 | 250.6 |
| 8 | 8a | 103 | 0 | 63.83 | −0.39 | −0.77 | 26.41 | 697.39 |
| 8 | 8b | 89 | 13.59 | 48.88 | −0.53 | −0.66 | 24.32 | 591.4 |
| 8 | 8c | 103 | 0 | 55.9 | −1.01 | 2.05 | 17.88 | 319.67 |
| 8 | 8d | 103 | 0 | 39.95 | −0.66 | 1.14 | 14.28 | 203.96 |
| 8 | 8e | 103 | 0 | 68.87 | −1.18 | 0.87 | 23.6 | 556.74 |
| 8 | 8f | 94 | 8.74 | 72.62 | −1.59 | 2.29 | 23.68 | 560.74 |
| 8 | 8g | 103 | 0 | 65.17 | −0.44 | 0.54 | 23.16 | 536.35 |
| 8 | 8h | 103 | 0 | 81.86 | −2.42 | 6.62 | 19.8 | 391.92 |
| 9 | 9a | 103 | 0 | 24.44 | 1.78 | 3.12 | 21.93 | 481.03 |
| 9 | 9b | 103 | 0 | 44.52 | 0.58 | −1.02 | 32.53 | 1058.11 |
| 9 | 9c | 94 | 8.74 | 37.18 | 0.76 | −0.29 | 26.2 | 686.43 |
| 9 | 9d | 101 | 1.94 | 12.26 | 2.28 | 5.16 | 20.05 | 402 |
| 9 | 9e | 103 | 0 | 23.75 | 1.25 | 1.21 | 23.21 | 538.58 |
| 9 | 9f | 95 | 7.77 | 32.61 | 1.07 | −0.11 | 31.89 | 1016.87 |
| 10 | 10a | 103 | 0 | 32.83 | 1.26 | 2.41 | 18.85 | 355.25 |
| 10 | 10b | 103 | 0 | 30.47 | 0.53 | 1.69 | 17.66 | 311.88 |
| 10 | 10e | 98 | 4.85 | 55.33 | −0.15 | 0.02 | 20.43 | 417.2 |
| 10 | 10d | 103 | 0 | 43.57 | 0.52 | 0.39 | 21.84 | 477.2 |
| 10 | 10e | 98 | 4.85 | 62.43 | −0.86 | 0.04 | 25.05 | 627.39 |
| 10 | 10f | 98 | 4.85 | 78.17 | −2.09 | 6.07 | 18.06 | 326.22 |
| 11 | 11a | 94 | 8.74 | 61.48 | −0.5 | −0.46 | 24.44 | 597.29 |
| 11 | 11b | 90 | 12.62 | 50.9 | 0.09 | −1.03 | 26.95 | 726.34 |
| 11 | 11c | 92 | 10.68 | 86.86 | −2.87 | 11.18 | 16.26 | 264.35 |
| 11 | 11d | 38 | 63.11 | 83.43 | −2.84 | 8.41 | 20.53 | 421.44 |
| 11 | 11e | 92 | 10.68 | 50.03 | −0.36 | −0.11 | 12.05 | 145.26 |
| 11 | 11f | 103 | 0 | 68.44 | −1.22 | 1.46 | 22.45 | 504.1 |
| 11 | 11g | 103 | 0 | 48.99 | 0.25 | −0.64 | 25.86 | 668.82 |
| 11 | 11h | 84 | 18.45 | 9.11 | 3.43 | 12.93 | 17.23 | 296.8 |
| 11 | 11i | 103 | 0 | 21.74 | 1.98 | 4.85 | 19.66 | 386.44 |
| 11 | 11j | 103 | 0 | 34.68 | 0.51 | −0.7 | 24.69 | 609.64 |
| 11 | 11k | 98 | 4.85 | 79.59 | −1.93 | 3.49 | 22.51 | 506.89 |
| 12 | 12a | 103 | 0 | 38.77 | 0.76 | −0.03 | 23.8 | 566.67 |
| 12 | 12b | 100 | 2.91 | 42.36 | 0.46 | 1.05 | 20.45 | 418.03 |
| 12 | 12c | 103 | 0 | 34.59 | 0.78 | 0.28 | 23.31 | 543.24 |
| 12 | 12d | 63 | 38.83 | 91.96 | −4.45 | 24.85 | 14.71 | 216.42 |
| 12 | 12e | 103 | 0 | 32.94 | 1.14 | 1.25 | 22.18 | 491.75 |
| 13 | 13a | 58 | 43.69 | 76.55 | −2.44 | 7.78 | 14.05 | 197.49 |
| 13 | 13b | 62 | 39.81 | 54.64 | −0.24 | −0.31 | 15 | 224.95 |
| 13 | 13c | 58 | 43.69 | 58.81 | −0.38 | 0.32 | 18.05 | 325.79 |
| 13 | 13d | 103 | 0 | 57.93 | −0.33 | −1.42 | 39.6 | 1567.79 |
| 14 | 14a | 45 | 56.31 | 41.18 | 0.17 | −1.26 | 34.52 | 1191.4 |
| 14 | 14b | 46 | 55.34 | 92.96 | −3.5 | 13.39 | 19.22 | 369.6 |
| 14 | 14c | 43 | 58.25 | 50.08 | −0.02 | −1.13 | 30.35 | 921.03 |
| 14 | 14d | 47 | 54.37 | 17.81 | 1.53 | 2.45 | 22.92 | 525.21 |
| 14 | 14e | 43 | 58.25 | 26.55 | 1.11 | 0 | 31.46 | 989.43 |
| 15 | 15a | 103 | 0 | 67.09 | −0.72 | −0.2 | 26.17 | 684.94 |
| 15 | 15b | 103 | 0 | 11.34 | 1.87 | 2.61 | 18.09 | 327.34 |
| 15 | 15c | 103 | 0 | 38.52 | 0.45 | −0.42 | 25.45 | 647.68 |
| 15 | 15d | 103 | 0 | 26.84 | 1.7 | 2.93 | 22.41 | 502.19 |
| 16 | 16a | 103 | 0 | 82.61 | −3.1 | 12.81 | 16.04 | 257.27 |
| 16 | 16b | 103 | 0 | 44.33 | −0.81 | 0.31 | 16.83 | 283.39 |
| 16 | 16c | 103 | 0 | 74.87 | −1.17 | 0.63 | 28.83 | 831.13 |
| 16 | 16d | 103 | 0 | 52.45 | −0.35 | −0.36 | 24.08 | 579.73 |
| 16 | 16e | 103 | 0 | 52.84 | −0.61 | −0.21 | 25.89 | 670.35 |
| 16 | 16f | 101 | 1.94 | 52.97 | −0.51 | 0.13 | 22.4 | 501.66 |
| 16 | 16g | 103 | 0 | 50.84 | −0.97 | 0.5 | 22.38 | 500.78 |
| 16 | 16h | 103 | 0 | 56.96 | −0.5 | −0.66 | 29.88 | 892.78 |
| 16 | 16i | 85 | 17.48 | 50.82 | −1.96 | 6.31 | 12.33 | 152.08 |
| 17 | 17a | 103 | 0 | 13.98 | 2.19 | 4.37 | 23.22 | 539 |
| 17 | 17b | 103 | 0 | 32.52 | 0.76 | −1.41 | 46.29 | 2142.59 |
| 17 | 17c | 103 | 0 | 41.05 | 0.42 | −0.32 | 23.71 | 562.08 |
| 17 | 17d | 103 | 0 | 86.58 | −2.25 | 4.68 | 22.66 | 513.64 |
Appendix C
| Goal | Assessment Value | Normalized Value |
|---|---|---|
| 1 | 2.08 | 1.09 |
| 2 | 1.80 | 0.94 |
| 3 | 1.72 | 0.89 |
| 4 | 1.54 | 0.80 |
| 5 | 2.29 | 1.20 |
| 6 | 2.80 | 1.47 |
| 7 | 1.76 | 0.91 |
| 8 | 1.95 | 1.02 |
| 9 | 1.97 | 1.03 |
| 10 | 2.28 | 1.19 |
| 11 | 2.85 | 1.50 |
| 12 | 2.29 | 1.20 |
| 13 | 2.18 | 1.14 |
| 14 | 0.99 | 0.50 |
| 15 | 1.38 | 0.71 |
| 16 | 2.18 | 1.14 |
| 17 | 2.35 | 1.23 |
| Respective SDG | General Index | |||
|---|---|---|---|---|
| Id | Coefficients | Indicator | Coefficients | Indicator |
| 1a | 0.51 | 0.00 | 0.01 | 0.92 |
| 1b | 0.27 | 0.01 | 0.04 | 0.70 |
| 1c | 0.90 | 0.00 | 0.66 | 0.00 |
| 1d | 0.87 | 0.00 | 0.64 | 0.00 |
| 1e | 0.92 | 0.00 | 0.65 | 0.00 |
| 2a | 0.39 | 0.00 | 0.04 | 0.63 |
| 2b | 0.43 | 0.00 | 0.05 | 0.65 |
| 2c | 0.66 | 0.00 | 0.02 | 0.83 |
| 2d | 0.78 | 0.00 | 0.16 | 0.11 |
| 2e | 0.76 | 0.00 | 0.12 | 0.25 |
| 3a | 0.28 | 0.00 | 0.03 | 0.80 |
| 3b | 0.46 | 0.00 | 0.10 | 0.32 |
| 3c | 0.72 | 0.00 | −0.07 | 0.49 |
| 3d | 0.58 | 0.00 | 0.05 | 0.59 |
| 3e | 0.09 | 0.40 | 0.10 | 0.36 |
| 3f | 0.90 | 0.00 | −0.10 | 0.32 |
| 3g | 0.92 | 0.00 | 0.01 | 0.96 |
| 3h | 0.56 | 0.00 | −0.01 | 0.93 |
| 3i | 0.10 | 0.31 | 0.07 | 0.46 |
| 3j | 0.56 | 0.00 | −0.11 | 0.26 |
| 3k | 0.88 | 0.00 | −0.06 | 0.56 |
| 3l | 0.23 | 0.02 | 0.51 | 0.00 |
| 3m | 0.67 | 0.00 | 0.07 | 0.45 |
| 4a | 0.58 | 0.00 | 0.29 | 0.01 |
| 4b | 0.49 | 0.00 | 0.14 | 0.18 |
| 4c | 0.62 | 0.00 | 0.22 | 0.03 |
| 4d | 0.83 | 0.00 | 0.53 | 0.00 |
| 4e | −0.05 | 0.65 | −0.06 | 0.56 |
| 4f | 0.82 | 0.00 | 0.53 | 0.00 |
| 5a | 0.42 | 0.00 | −0.01 | 0.95 |
| 5b | 0.38 | 0.00 | −0.10 | 0.32 |
| 5c | 0.46 | 0.00 | 0.26 | 0.01 |
| 5d | 0.58 | 0.00 | 0.28 | 0.01 |
| 5e | 0.51 | 0.00 | 0.19 | 0.05 |
| 6a | 0.49 | 0.00 | −0.01 | 0.91 |
| 6b | 0.35 | 0.00 | 0.06 | 0.58 |
| 6c | 0.67 | 0.00 | 0.41 | 0.00 |
| 6d | 0.46 | 0.00 | 0.11 | 0.29 |
| 6e | 0.53 | 0.00 | 0.41 | 0.00 |
| 6f | 0.18 | 0.12 | −0.02 | 0.85 |
| 7a | 0.40 | 0.00 | 0.18 | 0.09 |
| 7b | 0.48 | 0.00 | 0.43 | 0.00 |
| 7c | 0.58 | 0.00 | 0.23 | 0.02 |
| 7d | 0.63 | 0.00 | 0.39 | 0.00 |
| 8a | 0.64 | 0.00 | 0.25 | 0.01 |
| 8b | 0.61 | 0.00 | 0.48 | 0.00 |
| 8c | 0.21 | 0.03 | 0.19 | 0.05 |
| 8d | 0.26 | 0.01 | 0.12 | 0.21 |
| 8e | 0.61 | 0.00 | 0.46 | 0.00 |
| 8f | 0.37 | 0.00 | −0.03 | 0.75 |
| 8g | 0.23 | 0.02 | −0.26 | 0.01 |
| 8h | 0.48 | 0.00 | 0.15 | 0.14 |
| 9a | 0.06 | 0.53 | 0.22 | 0.03 |
| 9b | 0.38 | 0.00 | 0.03 | 0.77 |
| 9c | 0.56 | 0.00 | 0.22 | 0.03 |
| 9d | 0.23 | 0.02 | −0.22 | 0.03 |
| 9e | 0.33 | 0.00 | 0.35 | 0.00 |
| 9f | 0.52 | 0.00 | 0.01 | 0.90 |
| 10a | 0.41 | 0.00 | 0.12 | 0.21 |
| 10b | 0.50 | 0.00 | 0.21 | 0.03 |
| 10e | 0.82 | 0.00 | 0.07 | 0.52 |
| 10d | 0.14 | 0.17 | −0.26 | 0.01 |
| 10e | 0.54 | 0.00 | 0.66 | 0.00 |
| 10f | 0.53 | 0.00 | −0.07 | 0.47 |
| 11a | 0.37 | 0.00 | −0.05 | 0.63 |
| 11b | 0.35 | 0.00 | 0.13 | 0.23 |
| 11c | 0.40 | 0.00 | 0.33 | 0.00 |
| 11d | 0.35 | 0.03 | 0.24 | 0.15 |
| 11e | 0.36 | 0.00 | 0.38 | 0.00 |
| 11f | 0.44 | 0.00 | 0.20 | 0.05 |
| 11g | 0.18 | 0.06 | −0.15 | 0.14 |
| 11h | 0.17 | 0.12 | 0.15 | 0.19 |
| 11i | −0.004 | 0.97 | 0.01 | 0.94 |
| 11j | 0.30 | 0.00 | 0.15 | 0.12 |
| 11k | 0.24 | 0.02 | 0.09 | 0.40 |
| 12a | 0.60 | 0.00 | 0.33 | 0.00 |
| 12b | 0.37 | 0.00 | 0.14 | 0.16 |
| 12c | 0.74 | 0.00 | 0.46 | 0.00 |
| 12d | 0.11 | 0.37 | 0.38 | 0.00 |
| 12e | 0.70 | 0.00 | 0.11 | 0.27 |
| 13a | 0.59 | 0.00 | −0.12 | 0.37 |
| 13b | 0.77 | 0.00 | 0.17 | 0.18 |
| 13c | 0.65 | 0.00 | 0.35 | 0.01 |
| 13d | 0.95 | 0.00 | 0.30 | 0.00 |
| 14a | 0.56 | 0.00 | −0.19 | 0.21 |
| 14b | 0.61 | 0.00 | −0.13 | 0.38 |
| 14c | 0.70 | 0.00 | 0.21 | 0.19 |
| 14d | 0.61 | 0.00 | 0.08 | 0.60 |
| 14e | 0.84 | 0.00 | 0.25 | 0.11 |
| 15a | 0.72 | 0.00 | 0.13 | 0.20 |
| 15b | 0.48 | 0.00 | 0.03 | 0.74 |
| 15c | 0.78 | 0.00 | 0.09 | 0.37 |
| 15d | 0.51 | 0.00 | 0.17 | 0.09 |
| 16a | 0.48 | 0.00 | 0.49 | 0.00 |
| 16b | 0.35 | 0.00 | 0.27 | 0.01 |
| 16c | 0.52 | 0.00 | 0.44 | 0.00 |
| 16d | 0.53 | 0.00 | 0.55 | 0.00 |
| 16e | 0.68 | 0.00 | 0.25 | 0.01 |
| 16f | 0.36 | 0.00 | 0.09 | 0.36 |
| 16g | 0.72 | 0.00 | 0.21 | 0.03 |
| 16h | 0.66 | 0.00 | 0.18 | 0.06 |
| 16i | 0.64 | 0.00 | 0.43 | 0.00 |
| 17a | 0.67 | 0.00 | 0.51 | 0.00 |
| 17b | 0.82 | 0.00 | 0.38 | 0.00 |
| 17c | 0.72 | 0.00 | 0.56 | 0.00 |
| 17d | 0.48 | 0.00 | 0.14 | 0.16 |
| SDG | Index | 1 | 2 | 3 | 4 | 5 | 6 | 7 | 8 | 9 | 10 | 11 | 12 | 13 | 14 | 15 | 16 | 17 | |
|---|---|---|---|---|---|---|---|---|---|---|---|---|---|---|---|---|---|---|---|
| Index | Pearson’s corr. | 1.00 | |||||||||||||||||
| Significance coef. | |||||||||||||||||||
| Goal 1 | Pearson’s corr. | 0.54 | 1.00 | ||||||||||||||||
| Significance coef. | 0.00 | ||||||||||||||||||
| Goal 2 | Pearson’s corr. | 0.12 | −0.21 | 1.00 | |||||||||||||||
| Significance coef. | 0.25 | 0.04 | |||||||||||||||||
| Goal 3 | Pearson’s corr. | 0.01 | 0.01 | −0.15 | 1.00 | ||||||||||||||
| Significance coef. | 0.91 | 0.93 | 0.14 | ||||||||||||||||
| Goal 4 | Pearson’s corr. | 0.47 | 0.58 | −0.23 | −0.14 | 1.00 | |||||||||||||
| Significance coef. | 0.00 | 0.00 | 0.02 | 0.17 | |||||||||||||||
| Goal 5 | Pearson’s corr. | 0.35 | 0.13 | 0.09 | −0.21 | 0.09 | 1.00 | ||||||||||||
| Significance coef. | 0.00 | 0.20 | 0.38 | 0.04 | 0.38 | ||||||||||||||
| Goal 6 | Pearson’s corr. | 0.27 | 0.16 | 0.10 | 0.01 | −0.01 | 0.19 | 1.00 | |||||||||||
| Significance coef. | 0.01 | 0.12 | 0.31 | 0.95 | 0.91 | 0.05 | |||||||||||||
| Goal 7 | Pearson’s corr. | 0.58 | 0.43 | −0.02 | −0.16 | 0.42 | 0.34 | 0.31 | 1.00 | ||||||||||
| Significance coef. | 0.00 | 0.00 | 0.87 | 0.10 | 0.00 | 0.00 | 0.00 | ||||||||||||
| Goal 8 | Pearson’s corr. | 0.38 | 0.42 | −0.15 | 0.04 | 0.19 | −0.05 | 0.24 | 0.31 | 1.00 | |||||||||
| Significance coef. | 0.00 | 0.00 | 0.14 | 0.70 | 0.05 | 0.60 | 0.01 | 0.00 | |||||||||||
| Goal 9 | Pearson’s corr. | 0.31 | 0.38 | 0.04 | 0.26 | 0.10 | −0.06 | 0.05 | 0.11 | 0.26 | 1.00 | ||||||||
| Significance coef. | 0.00 | 0.00 | 0.68 | 0.01 | 0.31 | 0.57 | 0.58 | 0.27 | 0.01 | ||||||||||
| Goal 10 | Pearson’s corr. | 0.19 | 0.47 | 0.20 | 0.07 | −0.02 | −0.01 | 0.09 | 0.14 | 0.23 | 0.34 | 1.00 | |||||||
| Significance coef. | 0.05 | 0.00 | 0.05 | 0.51 | 0.88 | 0.90 | 0.36 | 0.17 | 0.02 | 0.00 | |||||||||
| Goal 11 | Pearson’s corr. | 0.29 | −0.02 | 0.36 | −0.16 | 0.06 | 0.12 | 0.11 | 0.10 | −0.13 | −0.07 | 0.11 | 1.00 | ||||||
| Significance coef. | 0.00 | 0.85 | 0.00 | 0.10 | 0.55 | 0.22 | 0.29 | 0.31 | 0.18 | 0.48 | 0.25 | ||||||||
| Goal 12 | Pearson’s corr. | 0.47 | 0.26 | −0.11 | −0.14 | 0.39 | 0.12 | −0.16 | 0.31 | 0.05 | 0.10 | −0.18 | −0.12 | 1.00 | |||||
| Significance coef. | 0.00 | 0.01 | 0.28 | 0.15 | 0.00 | 0.25 | 0.10 | 0.00 | 0.65 | 0.29 | 0.06 | 0.21 | |||||||
| Goal 13 | Pearson’s corr. | 0.37 | −0.01 | −0.24 | −0.01 | 0.05 | 0.04 | −0.17 | −0.18 | 0.04 | −0.01 | −0.19 | 0.10 | 0.16 | 1.00 | ||||
| Significance coef. | 0.00 | 0.89 | 0.01 | 0.91 | 0.65 | 0.68 | 0.09 | 0.07 | 0.69 | 0.93 | 0.06 | 0.33 | 0.11 | ||||||
| Goal 14 | Pearson’s corr. | 0.08 | −0.38 | 0.28 | 0.04 | −0.30 | 0.02 | 0.05 | −0.14 | −0.22 | −0.16 | 0.04 | 0.27 | −0.21 | 0.05 | 1.00 | |||
| Significance coef. | 0.43 | 0.00 | 0.00 | 0.68 | 0.00 | 0.81 | 0.61 | 0.17 | 0.03 | 0.10 | 0.66 | 0.01 | 0.03 | 0.62 | |||||
| Goal 15 | Pearson’s corr. | 0.17 | −0.21 | 0.24 | −0.19 | −0.10 | 0.27 | −0.13 | 0.18 | −0.22 | −0.20 | −0.10 | 0.12 | 0.03 | −0.02 | 0.31 | 1.00 | ||
| Significance coef. | 0.09 | 0.03 | 0.01 | 0.06 | 0.31 | 0.01 | 0.18 | 0.07 | 0.03 | 0.04 | 0.32 | 0.25 | 0.74 | 0.81 | 0.00 | ||||
| Goal 16 | Pearson’s corr. | 0.57 | 0.31 | 0.12 | −0.14 | 0.35 | 0.23 | 0.25 | 0.56 | 0.37 | 0.03 | −0.01 | −0.01 | 0.30 | −0.12 | −0.03 | 0.13 | 1.00 | |
| Significance coef. | 0.00 | 0.00 | 0.24 | 0.17 | 0.00 | 0.02 | 0.01 | 0.00 | 0.00 | 0.74 | 0.94 | 0.90 | 0.00 | 0.21 | 0.78 | 0.20 | |||
| Goal 17 | Pearson’s corr. | 0.56 | 0.32 | −0.26 | −0.04 | 0.42 | 0.03 | 0.04 | 0.28 | 0.22 | 0.06 | −0.22 | 0.08 | 0.53 | 0.32 | −0.30 | −0.17 | 0.30 | 1.00 |
| Significance coef. | 0.00 | 0.00 | 0.01 | 0.70 | 0.00 | 0.75 | 0.66 | 0.00 | 0.02 | 0.54 | 0.03 | 0.44 | 0.00 | 0.00 | 0.00 | 0.08 | 0.00 |
| Indicators Id | Pearson Coef. | Indicators Id | Pearson Coef. | Indicators Id | Pearson Coef. | Indicators Id | Pearson Coef. |
|---|---|---|---|---|---|---|---|
| 15a/11j | −0.78 | 16h/1e | 0.89 | 3g/3d | 0.77 | 7b/1d | 0.74 |
| 10a/1e | 0.99 | 8b/8e | 0.81 | 3m/1d | 0.77 | 7b/1c | 0.74 |
| 10a/1c | 0.99 | 16d/3m | 0.81 | 6e/6a | 0.77 | 8c/1d | 0.74 |
| 1c/1e | 0.98 | 10d/1a | 0.8 | 16d/1d | 0.77 | 3m/1e | 0.73 |
| 1c/1d | 0.97 | 16h/16e | 0.8 | 16d/10a | 0.77 | 4g/1d | 0.73 |
| 10a/1d | 0.96 | 16g/16h | 0.79 | 16d/1e | 0.76 | 8c/1e | 0.73 |
| 1d/1c | 0.95 | 4d/1d | 0.78 | 16g/1e | 0.76 | 10f/10d | 0.73 |
| 4d/4g | 0.95 | 5a/5b | 0.78 | 3m/1c | 0.75 | 8e/3m | 0.71 |
| 3g/3l | 0.92 | 8c/1c | 0.78 | 10a/3m | 0.75 | 11c/11d | 0.71 |
| 3h/3i | 0.91 | 8b/3m | 0.78 | 10a/8b | 0.75 | 16a/1c | 0.71 |
| 3h/3g | 0.91 | 16d/1c | 0.78 | 4d/1c | 0.74 | 4d/1c | 0.69 |
| Component | Initial Set (Is) | Alternative Set (As) | ||||
|---|---|---|---|---|---|---|
| Eigenvalue | % Variance | % Accumulated | Eigenvalue | % Variance | % Accumulated | |
| 1 | 3.634 | 21.37 | 21.37 | 3.183 | 18.72 | 18.72 |
| 2 | 2.238 | 13.16 | 34.54 | 2.234 | 13.14 | 18.72 |
| 3 | 2.068 | 12.16 | 46.70 | 1.854 | 10.90 | 31.86 |
| 4 | 1.280 | 7.53 | 54.23 | 1.442 | 8.48 | 42.77 |
| 5 | 1.147 | 6.74 | 60.98 | 1.151 | 6.77 | 51.25 |
| 6 | 1.013 | 5.95 | 66.93 | 1.131 | 6.65 | 58.02 |
| 7 | 0.904 | 5.31 | 72.25 | 1.088 | 6.40 | 64.67 |
| 8 | 0.852 | 5.01 | 77.20 | 0.870 | 5.12 | 71.07 |
| 9 | 0.756 | 4.44 | 81.71 | 0.751 | 4.42 | 76.19 |
| 10 | 0.553 | 3.25 | 84.96 | 0.623 | 3.66 | 80.61 |
| 11 | 0.548 | 3.22 | 88.18 | 0.551 | 3.24 | 84.28 |
| 12 | 0.484 | 2.85 | 91.03 | 0.545 | 3.20 | 87.52 |
| 13 | 0.435 | 2.55 | 93.59 | 0.477 | 2.80 | 90.73 |
| 14 | 0.324 | 1.90 | 95.50 | 0.316 | 1.85 | 93.53 |
| 15 | 0.320 | 1.88 | 97.38 | 0.287 | 1.68 | 95.39 |
| 16 | 0.256 | 1.50 | 98.89 | 0.270 | 1.59 | 97.08 |
| 17 | 0.188 | 1.10 | 100 | 0.225 | 1.32 | 98.67 |
| SDG | Initial Set (Is) | Alternative Set (As) | ||||||
|---|---|---|---|---|---|---|---|---|
| 1 | 2 | 3 | 4 | 1 | 2 | 3 | 4 | |
| 1 | 0.787 | −0.674 | 0.471 | |||||
| 2 | 0.698 | |||||||
| 3 | ||||||||
| 4 | −0.309 | 0.442 | 0.385 | 0.567 | −0.363 | |||
| 5 | 0.616 | 0.742 | ||||||
| 6 | 0.708 | |||||||
| 7 | 0.310 | 0.678 | 0.420 | 0.371 | ||||
| 8 | 0.330 | 0.763 | ||||||
| 9 | 0.590 | 0.336 | ||||||
| 10 | 0.771 | −0.332 | 0.565 | 0.392 | ||||
| 11 | 0.734 | 0.308 | ||||||
| 12 | −0.426 | 0.470 | 0.452 | 0.797 | −0.304 | |||
| 13 | 0.765 | |||||||
| 14 | 0.698 | −0.317 | 0.731 | |||||
| 15 | 0.308 | 0.648 | 0.697 | |||||
| 16 | 0.652 | 0.603 | 0.497 | |||||
| 17 | 0.770 | 0.721 | ||||||

| SDG | Initial Set (Is) | Alternative Set (As) | Variance Difference | ||||
|---|---|---|---|---|---|---|---|
| Factors | Indicators | % Variance | Factors | Indicators | % Variance | ||
| 1 | 1 | 5 | 60.75 | 1 | 3 | 43.82 | −27.87 |
| 2 | 2 | 5 | 64.00 | 1 | 3 | 63.56 | −0.69 |
| 3 | 4 | 13 | 66.49 | 4 | 12 | 64.48 | −3.02 |
| 4 | 2 | 6 | 66.95 | 2 | 5 | 65.84 | −1.66 |
| 5 | 2 | 5 | 64.43 | 1 | 3 | 46.63 | −27.63 |
| 6 | 3 | 6 | 69.82 | 2 | 4 | 55.27 | −20.84 |
| 7 | 2 | 4 | 61.97 | 1 | 2 | 50.58 | −18.38 |
| 8 | 3 | 8 | 63.90 | 3 | 6 | 68.04 | 6.48 |
| 9 | 3 | 6 | 69.03 | 2 | 4 | 59.89 | −13.24 |
| 10 | 3 | 6 | 77.13 | 1 | 3 | 50.82 | −34.11 |
| 11 | 4 | 11 | 61.56 | 3 | 8 | 61.49 | −0.11 |
| 12 | 2 | 5 | 67.04 | ||||
| 13 | 2 | 4 | 66.83 | ||||
| 14 | 1 | 5 | 44.54 | ||||
| 15 | 1 | 4 | 41.13 | ||||
| 16 | 3 | 9 | 69.50 | 2 | 7 | 57.81 | −16.82 |
| 17 | 1 | 4 | 48.49 | ||||
| Indicators | 1 | 2 | 3 | 4 |
|---|---|---|---|---|
| n_sdg03_adfertility | 0.794 | |||
| n_sdg03_alcohol | 0.432 | |||
| n_sdg03_gripe | 0.668 | −0.308 | 0.365 | |
| n_sdg03_hepatitis | 0.672 | 0.323 | ||
| n_sdg03_infantil | 0.703 | |||
| n_sdg03_prematuras | 0.891 | |||
| n_sdg03_suicidios | 0.403 | 0.486 | ||
| n_sdg03_trafico | 0.839 | |||
| n_sdg03_tuberculosis | 0.339 | 0.441 | −0.383 | 0.404 |
| n_sdg03_tumores | 0.883 | |||
| n_sdg03_vida | 0.595 | 0.594 | ||
| n_sdg03_vih | 0.811 |

| Indicators | 1 | 2 | 3 |
|---|---|---|---|
| n_sdg08_desempleo | 0.762 | ||
| n_sdg08_desempleocovid | 0.833 | ||
| n_sdg08_desempleojovenes | 0.761 | ||
| n_sdg08_diversidad | 0.710 | −0.327 | |
| n_sdg08_pibcapitamun | 0.454 | −0.663 | |
| n_sdg08_productividad | 0.821 |
| Indicators | 1 | 2 | 3 |
|---|---|---|---|
| n_sdg11_no2 | 0.76 | ||
| n_sdg11_o3 | −0.77 | ||
| n_sdg11_pm10 | 0.88 | ||
| n_sdg11_pm10media | 0.85 | ||
| n_sdg11_preciovivienda | 0.64 | ||
| n_sdg11_resiliencia | 0.59 | 0.49 | |
| n_sdg11_suptrans | −0.79 | ||
| n_sdg11_vulnerables | 0.55 |
Appendix D
| Position | Initial Set (Is) | Alternative Set (As) | ||
|---|---|---|---|---|
| City | Index Score | City | Index Score | |
| 1 | Vitoria-Gasteiz | 61.05 | Vitoria-Gasteiz | 68.33 |
| 2 | Zaragoza | 58.72 | Zaragoza | 66.60 |
| 3 | Logroño | 57.23 | Logroño | 63.60 |
| 4 | Soria | 56.15 | Getafe | 62.53 |
| 5 | Getafe | 55.04 | Soria | 61.31 |
| 6 | Lleida | 53.47 | Burgos | 60.90 |
| 7 | Palencia | 53.47 | Rivas-Vaciamadrid | 60.73 |
| 8 | Cáceres | 53.46 | Palencia | 60.72 |
| 9 | Madrid | 53.36 | Cáceres | 59.98 |
| 10 | Donostia-San Sebastián | 53.19 | Móstoles | 59.93 |
| Position | Initial Set (Is) | Alternative Set (As) | ||
|---|---|---|---|---|
| City | Index Score | City | Index Score | |
| 1 | Barakaldo | 41.11 | Teruel | 45.13 |
| 2 | Arona | 41.03 | Barakaldo | 44.69 |
| 3 | Talavera de la Reina | 40.60 | Melilla | 44.63 |
| 4 | Melilla | 40.47 | Vélez-Málaga | 42.74 |
| 5 | Marbella | 39.86 | Arona | 42.06 |
| 6 | Vélez-Málaga | 39.82 | El Ejido | 41.85 |
| 7 | El Ejido | 38.67 | Marbella | 41.19 |
| 8 | Fuengirola | 38.07 | Ceuta | 40.35 |
| 9 | Ceuta | 35.75 | Fuengirola | 40.04 |
| 10 | Torrevieja | 35.50 | Torrevieja | 36.60 |
| Initial Set (Is) | Alternative Set (As) | ||||
|---|---|---|---|---|---|
| City | Position | Index Score | Position | Index Score | Shifts |
| Albacete | 44 | 48.96 | 31 | 56.61 | 13 |
| Alcalá de Henares | 28 | 50.95 | 22 | 58.09 | 6 |
| Alcobendas | 27 | 51.06 | 25 | 57.83 | 2 |
| Alcorcón | 20 | 51.72 | 14 | 59.08 | 6 |
| Algeciras | 85 | 43.34 | 91 | 45.68 | −6 |
| Alicante | 64 | 46.47 | 78 | 48.62 | −14 |
| Almería | 83 | 43.56 | 86 | 47.12 | −3 |
| Arona | 95 | 41.03 | 98 | 42.06 | −3 |
| Ávila | 24 | 51.51 | 26 | 57.23 | −2 |
| Avilés | 89 | 42.69 | 81 | 48.38 | 8 |
| Badajoz | 59 | 47.29 | 62 | 51.77 | −3 |
| Badalona | 77 | 44.35 | 66 | 51.27 | 11 |
| Barakaldo | 94 | 41.11 | 95 | 44.69 | −1 |
| Barcelona | 23 | 51.63 | 23 | 57.88 | 0 |
| Bilbao | 43 | 49.10 | 41 | 54.87 | 2 |
| Burgos | 15 | 52.63 | 6 | 60.90 | 9 |
| Cáceres | 8 | 53.46 | 9 | 59.98 | −1 |
| Cádiz | 58 | 47.30 | 47 | 53.53 | 11 |
| Cartagena | 52 | 47.82 | 56 | 52.13 | −4 |
| Castellón de la Planta | 53 | 47.64 | 49 | 53.22 | 4 |
| Ceuta | 102 | 35.75 | 101 | 40.35 | 1 |
| Chiclana de la Frontera | 61 | 46.83 | 80 | 48.46 | −19 |
| Ciudad Real | 66 | 46.22 | 55 | 52.64 | 11 |
| Córdoba | 22 | 51.67 | 19 | 58.66 | 3 |
| Cornellá de Llobregat | 42 | 49.23 | 16 | 58.90 | 26 |
| Coslada | 88 | 42.93 | 75 | 49.02 | 13 |
| Cuenca | 16 | 52.02 | 44 | 54.38 | −28 |
| Donostia-San Sebastián | 10 | 53.19 | 45 | 54.05 | −35 |
| Dos Hermanas | 90 | 42.45 | 88 | 46.78 | 2 |
| El Ejido | 100 | 38.67 | 99 | 41.85 | 1 |
| El Puerto de Santa María | 51 | 47.92 | 67 | 51.23 | −16 |
| Elche | 46 | 48.57 | 58 | 51.92 | −12 |
| Fuengirola | 101 | 38.07 | 102 | 40.04 | −1 |
| Fuenlabrada | 49 | 48.24 | 34 | 56.14 | 15 |
| Getafe | 5 | 55.04 | 4 | 62.53 | 1 |
| Gijón | 14 | 52.63 | 18 | 58.70 | −4 |
| Girona | 12 | 53.06 | 12 | 59.23 | 0 |
| Granada | 65 | 46.31 | 65 | 51.30 | 0 |
| Guadalajara | 38 | 49.85 | 28 | 56.82 | 10 |
| L’Hospitalet de Llobregat | 93 | 41.81 | 83 | 48.18 | 10 |
| Huelva | 80 | 44.15 | 84 | 47.45 | −4 |
| Huesca | 26 | 51.33 | 35 | 56.01 | −9 |
| Jaén | 62 | 46.55 | 46 | 53.66 | 16 |
| Jerez de la Frontera | 79 | 44.23 | 82 | 48.28 | −3 |
| A Coruña | 39 | 49.72 | 43 | 54.63 | −4 |
| Las Palmas de GC | 68 | 45.47 | 59 | 51.82 | 9 |
| Las Rozas de Madrid | 36 | 49.89 | 40 | 55.14 | −4 |
| Leganés | 70 | 45.04 | 64 | 51.54 | 6 |
| León | 35 | 50.09 | 30 | 56.72 | 5 |
| Lleida | 6 | 53.47 | 17 | 58.82 | −11 |
| Logroño | 3 | 57.23 | 3 | 63.60 | 0 |
| Lorca | 13 | 52.76 | 13 | 59.09 | 0 |
| Lugo | 31 | 50.62 | 52 | 52.87 | −21 |
| Madrid | 9 | 53.36 | 11 | 59.77 | −2 |
| Málaga | 54 | 47.63 | 51 | 53.01 | 3 |
| Marbella | 98 | 39.86 | 100 | 41.19 | −2 |
| Mataró | 72 | 44.85 | 74 | 49.36 | −2 |
| Melilla | 97 | 40.47 | 96 | 44.63 | 1 |
| Mérida | 75 | 44.66 | 87 | 46.90 | −12 |
| Mijas | 69 | 45.45 | 90 | 46.62 | −21 |
| Móstoles | 17 | 51.88 | 10 | 59.93 | 7 |
| Murcia | 60 | 46.92 | 63 | 51.66 | −3 |
| Ourense | 57 | 47.34 | 71 | 50.09 | −14 |
| Oviedo | 41 | 49.49 | 32 | 56.61 | 9 |
| Palencia | 7 | 53.47 | 8 | 60.72 | −1 |
| Palma de Mallorca | 71 | 44.87 | 85 | 47.30 | −14 |
| Pamplona | 25 | 51.40 | 38 | 55.50 | −13 |
| Parla | 78 | 44.31 | 68 | 50.89 | 10 |
| Pontevedra | 67 | 45.68 | 77 | 48.93 | −10 |
| Pozuelo de Alarcón | 29 | 50.90 | 37 | 55.55 | −8 |
| Reus | 81 | 44.05 | 70 | 50.53 | 11 |
| Rivas-Vaciamadrid | 11 | 53.08 | 7 | 60.73 | 4 |
| Roquetas de Mar | 92 | 41.98 | 93 | 45.23 | −1 |
| Sabadell | 40 | 49.61 | 15 | 59.08 | 25 |
| Salamanca | 55 | 47.60 | 48 | 53.46 | 7 |
| San Boi de Llobregat | 56 | 47.48 | 29 | 56.82 | 27 |
| San Cristobal La Laguna | 50 | 48.04 | 61 | 51.78 | −11 |
| Sant Cugat del Vallès | 18 | 51.76 | 21 | 58.12 | −3 |
| San Fernando | 47 | 48.40 | 57 | 52.10 | −10 |
| San Sebastián de los Reyes | 63 | 46.51 | 54 | 52.75 | 9 |
| Santa Coloma de Gramenet | 87 | 43.05 | 76 | 48.97 | 11 |
| Santa Cruz de Tenerife | 32 | 50.35 | 39 | 55.49 | −7 |
| Santander | 21 | 51.68 | 27 | 57.21 | −6 |
| Santiago de Compostela | 37 | 49.85 | 33 | 56.36 | 4 |
| Segovia | 76 | 44.62 | 73 | 49.52 | 3 |
| Sevilla | 82 | 43.81 | 79 | 48.61 | 3 |
| Soria | 4 | 56.15 | 5 | 61.31 | −1 |
| Talavera de la Reina | 96 | 40.60 | 89 | 46.75 | 7 |
| Tarragona | 48 | 48.38 | 50 | 53.14 | −2 |
| Terrasa | 30 | 50.79 | 20 | 58.53 | 10 |
| Telde | 91 | 42.39 | 92 | 45.43 | −1 |
| Teruel | 86 | 43.06 | 94 | 45.13 | −8 |
| Toledo | 84 | 43.49 | 69 | 50.68 | 15 |
| Torrejón de Ardoz | 74 | 44.69 | 60 | 51.78 | 14 |
| Torrent | 45 | 48.92 | 36 | 55.67 | 9 |
| Torrevieja | 103 | 35.50 | 103 | 36.60 | 0 |
| Valencia | 34 | 50.10 | 53 | 52.85 | −19 |
| Valladolid | 19 | 51.75 | 24 | 57.86 | −5 |
| Vélez-Málaga | 99 | 39.82 | 97 | 42.74 | 2 |
| Vigo | 33 | 50.27 | 42 | 54.73 | −9 |
| Vitoria-Gasteiz | 1 | 61.05 | 1 | 68.33 | 0 |
| Zamora | 73 | 44.82 | 72 | 49.61 | 1 |
| Zaragoza | 2 | 58.72 | 2 | 66.60 | 0 |
References
- Kumar, S.; Kumar, N.; Vivekadhish, S. Millennium development goals (MDGS) to sustainable development goals (SDGS): Addressing unfinished agenda and strengthening sustainable development and partnership. Indian J. Community Med. 2016, 41, 1–4. [Google Scholar] [CrossRef] [PubMed]
- Le Blanc, D. Towards Integration at Last? The Sustainable Development Goals as a Network of Targets. Sustain. Dev. 2015, 23, 176–187. [Google Scholar] [CrossRef]
- United Nations General Assembly. Transforming Our World: The 2030 Agenda for Sustainable Development. A/RES/70/1. 2015. Available online: https://www.un.org/ga/search/view_doc.asp?symbol=A/RES/70/1&Lang=E (accessed on 15 October 2020).
- Bossel, H. Indicators for Sustainable Development: Theory, Method, Applications, 1st ed.; International Institute for Sustainable Development: Winnipeg, MB, Canada, 1999; ISBN 1-895536-13-8. [Google Scholar]
- Janoušková, S.; Hák, T.; Moldan, B. Global SDGs assessments: Helping or confusing indicators? Sustainability 2018, 10, 1540. [Google Scholar] [CrossRef] [Green Version]
- Slager, R.; Gond, J.-P.; Crilly, D. Reactivity to Sustainability Metrics: A Configurational Study of Motivation and Capacity. Bus. Ethics Q. 2020, 31, 275–307. [Google Scholar] [CrossRef]
- United Nations. Report of the Inter-Agency and Expert Group on SDG Indicators. In Proceedings of the Economic and Social Council, New York, NY, USA, 6–9 March 2018. E/CN.3/2018/2, 2018. [Google Scholar]
- van der Waal, J.W.H.; Thijssens, T. Corporate involvement in Sustainable Development Goals: Exploring the territory. J. Clean. Prod. 2020, 252, 119625. [Google Scholar] [CrossRef]
- Rubio-Mozos, E.; García-Muiña, F.E.; Fuentes-Moraleda, L. Sustainable strategic management model for hotel companies: A multi-stakeholder proposal to “walk the talk” toward SDGS. Sustainability 2020, 12, 8652. [Google Scholar] [CrossRef]
- Morin, J.-F.; Orsini, A.; Abbott, K.W.; Bernstein, S. High-Level Political Forum on Sustainable Development. In Essential Concepts of Global Environmental Governance; Routledge: Abingdon, UK, 2020. [Google Scholar] [CrossRef]
- United Nations. Department of Economic and Social Affairs, Population Division. World Urbanization Prospects: The 2019 Revision; United Nations: New York, NY, USA, 2019. [Google Scholar]
- Woosnam, K.M. Emerald cities: Urban sustainability and economic development. Community Dev. 2017, 48, 157–158. [Google Scholar] [CrossRef]
- Klopp, J.M.; Petretta, D.L. The urban sustainable development goal: Indicators, complexity and the politics of measuring cities. Cities 2017, 63, 92–97. [Google Scholar] [CrossRef]
- Uittenbroek, C.J. The very hungry city—Urban energy efficiency and the economic fate of cities, by Austin Troy. Urban Res. Prac. 2013, 6, 240–241. [Google Scholar] [CrossRef]
- Hoornweg, D.; Sugar, L.; Gómez, C.L.T. Cities and greenhouse gas emissions: Moving forward. Environ. Urban. 2011, 23, 207–227. [Google Scholar] [CrossRef]
- Giles-Corti, B.; Lowe, M.; Arundel, J. Achieving the SDGs: Evaluating indicators to be used to benchmark and monitor progress towards creating healthy and sustainable cities. Health Policy 2020, 124, 581–590. [Google Scholar] [CrossRef]
- United Nations General Assembly. Habitat III. New Urban Agenda: Quito Declaration on Sustainable Cities and Human Settlements for All; United Nations: Quito, Ecuador, 2016. [Google Scholar]
- Rozhenkova, V.; Allmang, S.; Ly, S.; Franken, D.; Heymann, J. The role of comparative city policy data in assessing progress toward the urban SDG targets. Cities 2019, 95, 102357. [Google Scholar] [CrossRef]
- Valencia, S.C.; Simon, D.; Croese, S.; Nordqvist, J.; Oloko, M.; Sharma, T.; Taylor Buck, N.; Versace, I. Adapting the Sustainable Development Goals and the New Urban Agenda to the city level: Initial reflections from a comparative research project. Int. J. Urban Sustain. Dev. 2019, 11, 4–23. [Google Scholar] [CrossRef] [Green Version]
- Graute, U. Local Authorities Acting Globally for Sustainable Development. Reg. Stud. 2016, 50, 1931–1942. [Google Scholar] [CrossRef]
- Corbett, J.; Mellouli, S. Winning the SDG battle in cities: How an integrated information ecosystem can contribute to the achievement of the 2030 sustainable development goals. Inf. Syst. J. 2017, 27, 427–461. [Google Scholar] [CrossRef]
- Kanuri, C.; Revi, A.; Espey, J.; Kuhle, H. Getting Started with the SDGs in Cities; Sustainable Development Solutions Network: New York, NY, USA, 2016; Available online: https://faud.unc.edu.ar/files/Cities-SDG-Guide.pdf (accessed on 15 December 2020).
- Chen, K.H.; Wang, J.S.; Wang, J.S. Environmental performance assessment of city sustainable development. J. Environ. Prot. Ecol. 2020, 21, 2202–2209. [Google Scholar]
- Bell, S.; Morse, S. Measuring Sustainability—Learning from doing. Manag. Environ. Qual. An. Int. J. 2003, 14, 426–427. [Google Scholar] [CrossRef]
- Cohen, M. A systematic review of urban sustainability assessment literature. Sustainability 2017, 9, 2048. [Google Scholar] [CrossRef] [Green Version]
- Dickens, C.; Smakhtin, V.; McCartney, M.; O’Brien, G.; Dahir, L. Defining and quantifying national-level targets, indicators and benchmarks for management of natural resources to achieve the sustainable development goals. Sustainability 2019, 11, 462. [Google Scholar] [CrossRef] [Green Version]
- Sisto, R.; García López, J.; Quintanilla, A.; de Juanes, Á.; Mendoza, D.; Lumbreras, J.; Mataix, C. Quantitative Analysis of the Impact of Public Policies on the Sustainable Development Goals through Budget Allocation and Indicators. Sustainability 2020, 12, 10583. [Google Scholar] [CrossRef]
- Sachs, J.; Schmidt-Traub, G.; Kroll, C.; Durand-Delacre, D.; Teksoz, K. SDG Index & Dashboards, a Global Report; Bertelsmann Stiftung: Gutersloh, Germany; Sustainable Development Solutions Network: New York, NY, USA, 2016. [Google Scholar]
- Sachs, J.; Schmidt-Traub, G.; Kroll, C.; Lafortune, G.; Fuller, G.; Woelm, F. The Sustainable Development Goals and COVID-19. Sustainable Development Report 2020; Cambridge University Press: Cambridge, UK, 2020. [Google Scholar]
- United Nations. Africa SDG Index and Dashboards Report 2018; United Nations: New York, NY, USA; The Sustainable Development Goals Center for Africa and Sustainable Development Solutions Network: Kigali, Rwanda, 2018. [Google Scholar]
- CODS. Índice ODS 2019 para América Latina y el Caribe; Centro De Los Objetivos de Desarrollo Sostenible para America Latina: Bogota, Colombia, 2020. [Google Scholar]
- Sachs, J.; Schmidt-Traub, G.; Kroll, C.; Lafortune, G.; Fuller, G. Sustainable Development Report 2019; Bertelsmann Stiftung: Gutersloh, Germany; Sustainable Development Solutions Network: New York, NY, USA, 2019. [Google Scholar]
- Luomi, M.; Fuller, G.; Dahan, L.; Lisboa Båsund, K.; de la Mothe Karoubi, E.; Lafortune, G. Arab Region SDG Index and Dashboards Report 2019; SDG Centre of Excellence for the Arab Region/Emirates Diplomatic Academy: Abu Dhabi, United Arab Emirates; Sustainable Development Solutions Network: New York, NY, USA, 2019. [Google Scholar]
- SDSN; IEEP. The 2019 Europe Sustainable Development Report; Sustainable Development Solutions Network: Paris, France; Institute for European Environmental Policy: Brussels, Belgium, 2019. [Google Scholar]
- SDSN; IEEP. The 2020 Europe Sustainable Development Report: Meeting the Sustainable Development Goals in the Face of the COVID-19 Pandemic; Sustainable Development Solutions Network: Paris, France; Institute for European Environmental Policy: Brussels, Belgium, 2020. [Google Scholar]
- Sachs, J.; Schmidt-traub, G.; Kroll, C.; Durand-Delacre, D.; Teksoz, K. SDG Index and Dashboards Report 2017; Bertelsmann Stiftung: Gutersloh, Germany; Sustainable Development Solutions Network: New York, NY, USA, 2017. [Google Scholar]
- Sachs, J.; Schmidt-Traub, G.; Kroll, C.; Lafortune, G.; Fuller, G. SDG Index and Dashboards Report 2018: Global Responsibilities Implementing the Goals; Bertelsmann Stiftung and Sustainable Development Solutions Network: New York, NY, USA, 2018. [Google Scholar]
- De Geus, A.; Sachs, J. Sustainable Development Report 2019: Transformations to Achieve the Sustainable Development Goals Includes the SDG Index and Dashboards; Bertelsmann Stiftung and Sustainable Development Solutions Network: New York, NY, USA, 2019. [Google Scholar]
- Sachs, J.D.; Fox, C. Sustainable Development Report of the United States 2018; Bertelsmann Stiftung and Sustainable Development Solutions Network: New York, NY, USA, 2018. [Google Scholar]
- Cavalli, L.; Farnia, L. Per un’Italia Sostenibile: l’SDSN Italia SDGs City Index 2018; Fondazione Eni Enrico Mattei: Milan, Italy, 2018. [Google Scholar]
- Cavalli, L.; Farnia, L.; Lizzi, G.; Romani, I.; Alibegovic, M. Per un’Italia Sostenibile: L’SDSN Italia SDGs City Index per un’Italia Sostenibile: Report di Aggiornamento; Fondazione Eni Enrico Mattei: Milan, Italy, 2020. [Google Scholar]
- Sánchez de Madariaga, I.; García López, J.; Sisto, R. Los Objetivos de Desarrollo Sostenible en 100 Ciudades Españolas; Red Española para el Desarrollo Sostenible: Madrid, Spain, 2018. [Google Scholar]
- Prakash, M.; Teksoz, K.; Espey, J.; Sachs, J.; Shank, M.; Schmidt-Traub, G. The 2017 US Cities Sustainable Development Report; Sustainable Development Solutions Network: New York, NY, USA, 2017. [Google Scholar]
- Espey, J.; Dahmm, H.; Manderino, L. The 2018 US Cities Sustainable Development Report; Sustainable Development Solutions Network: New York, NY, USA, 2018. [Google Scholar]
- Lynch, A.; LoPresti, A.; Fox, C. The 2019 US Cities Sustainable Development Report; Sustainable Development Solutions Network: New York, NY, USA, 2019. [Google Scholar]
- Lafortune, G.; Zoeteman, K.; Fuller, G.; Mulder, R.; Dagevos, J.; Schmidt-Traub, G. The 2019 SDG Index and Dashboards Report for European Cities (Prototype Version); Sustainable Development Solutions Network: New York, NY, USA; The Brabant Center for Sustainable Development (Telos): Tilburg, The Netherlands, 2019. [Google Scholar]
- Andersen, L.E.; Canelas, S.; Gonzales, A.; Peñaranda, L. Atlas Municipal de los Objetivos de Desarrollo Sostenible en Bolivia 2020; Sustainable Development Solutions Network Bolivia: La Paz, Bolivia; Universidad Privada Boliviana: La Paz, Bolivia, 2020. [Google Scholar]
- ICS; SDSN. O Índice de Desenvolvimento Sustentável das Cidades—Brasil (IDSC-BR); Instituto Cidades Sustentáveis: São Paulo, Brazil; Sustainable Development Solutions Network: Paris, France, 2021. [Google Scholar]
- Sánchez de Madariaga, I.; del Álamo, J.B.; García López, J.; Sisto, R.; Urquijo, J. Los Objetivos de Desarrollo Sostenible en 100 Ciudades Españolas, 2nd ed.; REDS: Madrid, Spain, 2020; ISBN 978-84-09-25763-8. [Google Scholar]
- Zinkernagel, R.; Evans, J.; Neij, L. Applying the SDGs to cities: Business as usual or a new dawn? Sustainability 2018, 10, 3201. [Google Scholar] [CrossRef] [Green Version]
- Lafortune, G.; Fuller, G.; Moreno, J.; Schmidt-Traub, C.K.G. SDG Index and Dashboards Detailed Methodological Paper. Sustain. Dev. Solut. Netw. 2018, 1, 1–476. [Google Scholar]
- Papadimitriou, E.; Neves, A.R.; Becker, W. JRC Statistical Audit of the Sustainable Development Goals Index and Dashboards; European Commission: Brussels, Belgium, 2019. [Google Scholar]
- Darren, G.; Paul, M. SPSS for Windows Step by Step: A Simple Guide and Reference; Boston Pearson Education, Inc.: London, UK, 1999. [Google Scholar]
- Miola, A.; Schiltz, F. Measuring sustainable development goals performance: How to monitor policy action in the 2030 Agenda implementation? Ecol. Econ. 2019, 164, 106373. [Google Scholar] [CrossRef] [PubMed]
- United Nations Development Programme. 2015 Human Development Report; United Nations: New York, NY, USA, 2015. [Google Scholar]
- Rickels, W.; Dovern, J.; Hoffmann, J.; Quaas, M.F.; Schmidt, J.O.; Visbeck, M. Indicators for monitoring sustainable development goals: An application to oceanic development in the European Union. Earth’s Future 2016, 4, 252–267. [Google Scholar] [CrossRef] [Green Version]
- Booysen, F. An overview and evaluation of composite indices of development. Soc. Indic. Res. 2002, 59, 115–151. [Google Scholar] [CrossRef]
- Nardo, M.; Saisana, M.; Saltelli, A.; Tarantola, S.; Hoffman, A.; Giovannini, E. Handbook on Constructing Composite Indicators: Methodology and User Guide; OECD Publishing: Paris, France, 2008. [Google Scholar]
- Pradhan, P.; Costa, L.; Rybski, D.; Lucht, W.; Kropp, J.P. A Systematic Study of Sustainable Development Goal (SDG) Interactions. Earth’s Future 2017, 5, 1169–1179. [Google Scholar] [CrossRef] [Green Version]
- Spearman, C. The proof and measurement of association between two things. Int. J. Epidemiol. 2010, 39, 1137–1150. [Google Scholar] [CrossRef] [Green Version]
- Hauke, J.; Kossowski, T. Comparison of values of pearson’s and spearman’s correlation coefficients on the same sets of data. Quaest. Geogr. 2011, 30, 87–93. [Google Scholar] [CrossRef] [Green Version]
- Mainali, B.; Luukkanen, J.; Silveira, S.; Kaivo-Oja, J. Evaluating synergies and trade-offs among Sustainable Development Goals (SDGs): Explorative analyses of development paths in South Asia and Sub-Saharan Africa. Sustainability 2018, 10, 815. [Google Scholar] [CrossRef] [Green Version]
- Kroll, C.; Warchold, A.; Pradhan, P. Sustainable Development Goals (SDGs): Are we successful in turning trade-offs into synergies? Palgrave Commun. 2019, 5, 140. [Google Scholar] [CrossRef] [Green Version]
- Hegre, H.; Petrova, K.; von Uexkull, N. Synergies and Trade-Offs in Reaching the Sustainable Development Goals. Sustainability 2020, 12, 8729. [Google Scholar] [CrossRef]
- UN Statistics Division. Global Indicator Framework for the SDG and Targets of the 2030 Agenda for Sustainable Development; United Nations: New York, NY, USA, 2017. [Google Scholar]
- Becker, W.; Saisana, M.; Paruolo, P.; Vandecasteele, I. Weights and importance in composite indicators: Closing the gap. Ecol. Indic. 2017, 80, 12–22. [Google Scholar] [CrossRef] [PubMed]
- Drastichová, M.; Filzmoser, P. Assessment of Sustainable Development Using Cluster Analysis and Principal Component Analysis. Probl. Ekorozwoju 2019, 14, 7–24. [Google Scholar]
- Bryant, F.B.; Yarnold, P.R. Principal-Components Analysis and Exploratory and Confirmatory Factor Analysis. In Reading and Understanding Multivariate Statistics; American Psychological Association: Washington, DC, USA, 1995; pp. 99–136. [Google Scholar]
- Härdle, W.K.; Simar, L. Applied Multivariate Statistical Analysis; Springer: Berlin/Heidelberg, Germany, 2013. [Google Scholar]
- Kaiser, H.F. Coefficient Alpha for a Principal Component and the Kaiser-Guttman Rule. Psychol. Rep. 1991, 68, 855–858. [Google Scholar] [CrossRef]
- Hák, T.; Janoušková, S.; Moldan, B. Sustainable Development Goals: A need for relevant indicators. Ecol. Indic. 2016, 60, 565–573. [Google Scholar] [CrossRef]
- Alberti, M. Measuring urban sustainability. Environ. Impact Assess. Rev. 1996, 16, 381–424. [Google Scholar] [CrossRef]
- Berardi, U. Sustainability assessments of buildings, communities, and cities. In Assessing and Measuring Environmental Impact and Sustainability; Elsevier: Amsterdam, The Netherlands, 2015. [Google Scholar]
- Somogyi, Z. A framework for quantifying environmental sustainability. Ecol. Indic. 2015, 61, 338–345. [Google Scholar] [CrossRef]
- Dizdaroglu, D. The role of indicator-based sustainability assessment in policy and the decision-making process: A review and outlook. Sustainability 2017, 9, 1018. [Google Scholar] [CrossRef] [Green Version]
- Rama, M.; Andrade, E.; Moreira, M.T.; Feijoo, G.; González-García, S. Defining a procedure to identify key sustainability indicators in Spanish urban systems: Development and application. Sustain. Cities Soc. 2021, 70, 102919. [Google Scholar] [CrossRef]
- Rama, M.; González-García, S.; Andrade, E.; Moreira, M.T.; Feijoo, G. Assessing the sustainability dimension at local scale: Case study of Spanish cities. Ecol. Indic. 2020, 117, 106687. [Google Scholar] [CrossRef]
- de Miguel Ramos, C.; Laurenti, R. Synergies and Trade-offs among Sustainable Development Goals: The Case of Spain. Sustainability 2020, 12, 10506. [Google Scholar] [CrossRef]
| SDSN Report | Spatial Scope | SDG 1 | SDG 2 | SDG 3 | SDG 4 | SDG 5 | SDG 6 | SDG 7 | SDG 8 | SDG 9 | SDG 10 | SDG 11 | SDG 12 | SDG 13 | SDG 14 | SDG 15 | SDG 16 | SDG 17 |
|---|---|---|---|---|---|---|---|---|---|---|---|---|---|---|---|---|---|---|
| [30] | N | 4 | 6 | 18 | 3 | 7 | 4 | 4 | 5 | 6 | 1 | 4 | 6 | 4 | 7 | 4 | 9 | 5 |
| [31] | N | 3 | 7 | 16 | 5 | 7 | 4 | 4 | 6 | 7 | 2 | 4 | 3 | 4 | 6 | 5 | 9 | 4 |
| [32] | N | 3 | 6 | 18 | 4 | 7 | 5 | 4 | 5 | 6 | 2 | 4 | 5 | 4 | 5 | 4 | 10 | 5 |
| [33] | N | 3 | 7 | 16 | 6 | 8 | 7 | 5 | 8 | 6 | 1 | 2 | 8 | 4 | 4 | 3 | 14 | 3 |
| [34] | N | 4 | 5 | 20 | 9 | 6 | 6 | 3 | 8 | 9 | 3 | 7 | 5 | 4 | 4 | 6 | 11 | 3 |
| [35] | N | 3 | 6 | 20 | 9 | 6 | 6 | 3 | 8 | 9 | 3 | 7 | 6 | 3 | 6 | 6 | 10 | 3 |
| [28] | N | 2 | 6 | 11 | 6 | 5 | 3 | 4 | 6 | 7 | 3 | 3 | 3 | 2 | 5 | 3 | 7 | 3 |
| [36] | N | 3 | 6 | 15 | 5 | 5 | 4 | 4 | 6 | 9 | 3 | 3 | 8 | 4 | 5 | 5 | 9 | 5 |
| [37] | N | 3 | 6 | 17 | 8 | 5 | 6 | 4 | 6 | 11 | 3 | 4 | 8 | 5 | 6 | 5 | 9 | 5 |
| [38] | N | 3 | 8 | 17 | 9 | 6 | 7 | 4 | 7 | 10 | 3 | 4 | 7 | 5 | 4 | 5 | 10 | 5 |
| [29] | N | 3 | 8 | 17 | 9 | 6 | 7 | 4 | 7 | 10 | 3 | 4 | 7 | 4 | 5 | 5 | 10 | 6 |
| [39] | N | 7 | 7 | 14 | 6 | 7 | 4 | 5 | 8 | 8 | 6 | 5 | 6 | 9 | 0 | 4 | 7 | 0 |
| [40] | C | 2 | 2 | 5 | 7 | 2 | 3 | 1 | 3 | 1 | 1 | 3 | 2 | 1 | 0 | 2 | 2 | 2 |
| [41] | C | 2 | 2 | 5 | 6 | 3 | 3 | 2 | 3 | 1 | 2 | 7 | 2 | 2 | 0 | 2 | 2 | 2 |
| [42] | C | 3 | 3 | 12 | 5 | 6 | 3 | 5 | 5 | 5 | 6 | 10 | 4 | 3 | 4 | 3 | 5 | 3 |
| [43] | C | 3 | 3 | 7 | 4 | 2 | 2 | 2 | 3 | 2 | 3 | 10 | 1 | 1 | 0 | 2 | 3 | 1 |
| [44] | C | 3 | 2 | 8 | 4 | 3 | 1 | 1 | 4 | 2 | 3 | 7 | 1 | 1 | 0 | 2 | 2 | 0 |
| [45] | C | 5 | 3 | 7 | 4 | 3 | 3 | 3 | 3 | 3 | 5 | 5 | 3 | 3 | 0 | 3 | 4 | 0 |
| [46] | C | 2 | 1 | 6 | 7 | 3 | 2 | 1 | 3 | 6 | 1 | 10 | 4 | 1 | 0 | 4 | 5 | 0 |
| [47] | C | 4 | 4 | 9 | 6 | 4 | 3 | 4 | 7 | 5 | 3 | 3 | 0 | 3 | 0 | 2 | 3 | 2 |
| [48] | C | 2 | 5 | 19 | 21 | 5 | 5 | 1 | 6 | 2 | 6 | 3 | 2 | 2 | 1 | 1 | 4 | 2 |
| [49] | C | 5 | 5 | 13 | 6 | 5 | 6 | 4 | 8 | 6 | 6 | 11 | 5 | 4 | 5 | 4 | 9 | 4 |
| Average | 3.21 | 4.95 | 13.11 | 6.11 | 5.11 | 4.21 | 3.32 | 5.47 | 6.21 | 2.84 | 5.42 | 4.68 | 3.37 | 3.21 | 3.84 | 7.26 | 2.89 | |
| Aggregation Method Shifts in the Index | Number of Cities | Percentage of Cities |
|---|---|---|
| 0 | 25 | 24.27% |
| 1 | 27 | 26.21% |
| 2 | 22 | 21.36% |
| 3 | 7 | 6.80% |
| 4 | 11 | 10.68% |
| 5 | 5 | 4.85% |
| 6 | 1 | 0.97% |
| 7 | 1 | 0.97% |
| 8 | 2 | 1.94% |
| 9 | 0 | 0.00% |
| >10 | 2 | 1.94% |
| Weighting Method Shifts in the Index | Number of Cities | Percentage of Cities |
|---|---|---|
| 0 | 7 | 6.80% |
| 1 | 12 | 11.65% |
| 2 | 20 | 19.42% |
| 3 | 7 | 6.80% |
| 4 | 13 | 12.62% |
| 5 | 6 | 5.83% |
| 6 | 3 | 2.91% |
| 7 | 8 | 7.77% |
| 8 | 9 | 8.74% |
| 9 | 5 | 4.85% |
| >10 | 13 | 12.62% |
| Assumption | Alternatives for Is/As |
|---|---|
| 1. Aggregation method (SDG level) | Arithmetic average/Geometric average |
| 2. Weighting method (SDG level) | SDG equal valuation/SDG valuation by experts |
| 3. Indicator set | Complete set/Reduced set |
| Shifts in the index Is to As | Number of Cities | Percentage of Cities |
|---|---|---|
| 0 to 5 | 17 | 16.50% |
| 6 to 10 | 25 | 24.27% |
| 11 to 15 | 36 | 34.5% |
| 16 to 20 | 10 | 9.71% |
| >21 | 15 | 14.56% |
Publisher’s Note: MDPI stays neutral with regard to jurisdictional claims in published maps and institutional affiliations. |
© 2021 by the authors. Licensee MDPI, Basel, Switzerland. This article is an open access article distributed under the terms and conditions of the Creative Commons Attribution (CC BY) license (https://creativecommons.org/licenses/by/4.0/).
Share and Cite
García López, J.; Sisto, R.; Benayas, J.; de Juanes, Á.; Lumbreras, J.; Mataix, C. Assessment of the Results and Methodology of the Sustainable Development Index for Spanish Cities. Sustainability 2021, 13, 6487. https://0-doi-org.brum.beds.ac.uk/10.3390/su13116487
García López J, Sisto R, Benayas J, de Juanes Á, Lumbreras J, Mataix C. Assessment of the Results and Methodology of the Sustainable Development Index for Spanish Cities. Sustainability. 2021; 13(11):6487. https://0-doi-org.brum.beds.ac.uk/10.3390/su13116487
Chicago/Turabian StyleGarcía López, Javier, Raffaele Sisto, Javier Benayas, Álvaro de Juanes, Julio Lumbreras, and Carlos Mataix. 2021. "Assessment of the Results and Methodology of the Sustainable Development Index for Spanish Cities" Sustainability 13, no. 11: 6487. https://0-doi-org.brum.beds.ac.uk/10.3390/su13116487