Article

Exploring Climate-Change Impacts on Energy Efficiency and Overheating Vulnerability of Bioclimatic Residential Buildings under Central European Climate

Faculty of Civil and Geodetic Engineering, University of Ljubljana, 1000 Ljubljana, Slovenia
*
Author to whom correspondence should be addressed.
Sustainability 2021, 13(12), 6791; https://0-doi-org.brum.beds.ac.uk/10.3390/su13126791
Submission received: 24 May 2021 / Revised: 11 June 2021 / Accepted: 12 June 2021 / Published: 16 June 2021

Abstract

:
Climate change is expected to expose the locked-in overheating risk concerning bioclimatic buildings adapted to a specific past climate state. The study aims to find energy-efficient building designs which are most resilient to overheating and increased cooling energy demands that will result from ongoing climate change. Therefore, a comprehensive parametric study of various passive building design measures was implemented, simulating the energy use of each combination for a temperate climate of Ljubljana, Slovenia. The approach to overheating vulnerability assessment was devised and applied using the increase in cooling energy demand as a performance indicator. The results showed that a B1 heating energy efficiency class according to the Slovenian Energy Performance Certificate classification was the highest attainable using the selected passive design parameters, while the energy demand for heating is projected to decrease over time. In contrast, the energy use for cooling is in general projected to increase. Furthermore, it was found that, in building models with higher heating energy use, low overheating vulnerability is easier to achieve. However, in models with high heating energy efficiency, very high overheating vulnerability is not expected. Accordingly, buildings should be designed for current heating energy efficiency and low vulnerability to future overheating. The paper shows a novel approach to bioclimatic building design with global warming adaptation integrated into the design process. It delivers recommendations for the energy-efficient, robust bioclimatic design of residential buildings in the Central European context, which are intended to guide designers and policymakers towards a resilient and sustainable built environment.

1. Introduction

Since Neolithic times, the building of homes has provided people with a higher degree of flexibility and independence in terms of climate and consequential habitability. Shelters and houses offered their occupants protection from the environment, predators and intruders [1]. Moreover, people were no longer forced to migrate towards flourishing regions with pleasant weather as the seasons passed and the climate changed. Thus, many relatively inhospitable environments were settled. Alongside the habitation of diverse climates, the struggle of builders to either utilise or fight the climatic characteristics of a location had begun. Only the best performing building design ideas were passed on, and thus, the knowledge on climate-adapted buildings was passed on intrinsically from generation to generation. Climate opportunities, together with the occupants’ and society’s needs and expectations, and the technological know-how about building, form the so-called triquetra of bioclimatic building design [1]. Therefore, the concept of bioclimatic building design is often associated with the harmonisation of climate, comfort, and energy efficiency [2]. The closer the building can follow and respond to the external dynamics, such as temperature, solar radiation and relative humidity, the more efficient it is [3].
Bioclimatic design is an engineering practice usually described through the building’s ability to utilise climatic conditions and resources in a particular location to advance its performance. Hence, the goal is that a building and its elements should facilitate occupant’s comfort through an energy- and resource-efficient approach by adapting to the location’s climatic conditions to the highest reasonable degree [4,5]. In professional circles, the general opinion is that vernacular (i.e., traditional) architecture is perfectly adapted to the climatic characteristics of a specific location, as it is presumed that it has “evolutionarily” adapted to the given climate over the centuries. Therefore, vernacular architecture is often a source of bioclimatic strategies and corresponding passive design measures incorporated into new buildings [1,6,7]. Nowadays, in building design, bioclimatic strategies are regularly accompanied by sophisticated and expensive active systems that can dynamically reduce energy use and increase thermal comfort [8,9].
As indicated above, climate plays a crucial role in bioclimatic building design. While there are large parts of continents with the same climate type, in some parts of the Earth, such as the Alpine-Adriatic region in Europe, many climate types are found in a relatively small area [10]. According to Köppen–Geiger climate classification [11], the prevailing climates in Central Europe are warm temperate (i.e., C) and boreal (i.e., D), fully humid (i.e., f) climates with warm (i.e., b) or cool (i.e., c) summers. Such climate diversity results in specific bioclimatic architecture [12]. In these climates, a residential building designed according to the bioclimatic design paradigm should mainly facilitate passive solar gains, reduce thermal losses during the colder part of the year, and allow heat storage through high thermal mass of the envelope [1]. Furthermore, the thermal response of residential buildings under temperate and boreal climates is typically envelope dominated [13]. Therefore, implementing bioclimatic (i.e., passive) measures on the level of the building envelope might be highly efficient in optimising building heating energy use.
During the last century, evident changes in climate have been noted [14,15,16,17,18], and by the end of the twenty-first century, global temperature is projected to rise by up to 4 °C [19]. In the times of hunter-gatherer societies, people had the option of migrating to other, more pleasant regions in the event of significant climatic changes. Once buildings were added to the equation, migratory behaviour was no longer an attractive option as a climate adaptation strategy because one would leave behind the result of one’s hard work—a building. Hence, climate-adapted buildings carry a possible built-in risk concerning climate change. However, according to the Migration and Climate Change Report [20], over 1 billion people are expected to face displacement by 2050 due to climate warming and related ecological threats. In particular, sub-Saharan Africa, South Asia, the Middle East, and North Africa face the most significant number of threats, such as lack of access to food and water and increased natural disasters occurrence [21]. On the other hand, developed regions in Europe and North America are expected to face fewer ecological threats [21]. Nevertheless, not giving them the immunity to broader implications of climate change, such as the impact on urbanised environments and buildings.
A warmer climate will inevitably affect the thermal performance of buildings, even bioclimatic buildings adapted to the current or past climate. Wang et al. [22] warned that there is an increasing need to clarify the challenges posed by climate warming to limit potential thermal discomfort by applying passive building measures. In climates present in Central Europe, the bioclimatic design measures integrated into buildings are based primarily on heating need to achieve comfort during the winter months. Namely, south-oriented windows for passive solar heating, building envelopes with low thermal conductivity and compact building shapes are commonly used in building design [23]. Nevertheless, the projected effects of a warming climate will lead to a risk of overheating for such buildings, especially if the line between a thermally comfortable and a hot environment is thin. Therefore, bioclimatic strategies used in buildings in such locations must be re-evaluated, as emphasised by Pajek and Košir [24]. Numerous studies have been conducted in order to assess the effects of climate change on building energy performance. Berardi and Jafarpur [25] in Toronto, Canada, showed an average decrease of 18–33% for heating and an average increase of 15–126% for cooling energy use by 2070, depending on climate file and building typology. Furthermore, Rodrigues and Fernandes [26] stated that, in residential buildings, a general increase in cooling demand (up to 137%) and a smaller reduction in heating demand (up to 63%) is expected until 2050 in Mediterranean locations, while the current ideal U-values will mainly not cause overheating. Bravo Dias et al. [27] explored climate change implications on passive building design efficiency in 43 most populated cities in the European Union. They concluded that buildings using passive design measures, whose performance is highly climate-dependent, will be particularly affected. For example, in Southern Europe, the shading season will increase by 2.5 months, making shading by overhangs or other fixed elements less effective.
Therefore, the selection of passive design measures should be based on the ability to achieve the highest possible resilience of a building. Martin and Sundley [28] define resilience as a process that involves several criteria, including vulnerability, resistance, robustness, and recoverability. According to Attia et al. [29], overheating vulnerability assessment considering future climate scenarios should be part of the building design process. Such an approach aims to achieve a design solution with less sensitive performance to “noise” in the form of change of the environmental boundary conditions [30]. Even in the animal world, the idea of resilient “building” can be found in ant gardens, which apparently allow the species to be more resilient to climate change than they would be outside of this system [31]. However, to assess the resilience of cities and buildings to climate change, studies of robustness and vulnerability evaluation have been made (see refs. [32,33,34,35,36,37,38]). For instance, Fonseca et al. [32] studied the effects of climate change on the energy use of buildings in the United States. They concluded that additional research is needed to provide more robust estimates of the impact of climate change on the building sector. Similarly, Shen and Lior [33] performed a vulnerability analysis on climate change impacts of present renewable energy systems used in net-zero energy buildings. Different authors, namely Moazami et al. [30], Kotireddy et al. [35], and others, presented workflows and methods for building performance robustness assessment to prevent significant variations in energy use. Given these points, Houghton and Castillo-Salgado [39] recommended using green building programs and certifications to help reduce the vulnerability of buildings to climate change.
Finally, the concept of building resilience concerning building energy use should be discussed, particularly in the context of the EU Energy performance of buildings directive (EPBD) [40]. To help enhance the energy performance of buildings, the EPBD also introduced building energy performance certification (EPC). However, in most countries, more than half of all existing residential buildings with registered EPCs have energy class D or lower [41]. On the other hand, the share of newly constructed nearly Zero-Energy Buildings (nZEB), also introduced through EPBD and characterised by high energy efficiency, is increasing. Furthermore, in 2020, the EU Commission presented its strategy to boost the energy renovation for climate neutrality of buildings in the EU [42]. For this reason, the vulnerability of buildings to climate change must be considered.
Bioclimatic principles are often associated with energy-efficient buildings, especially in temperate climates where buildings are primarily heating-dominated but have considerable potential for passive solar heating. Under such climatic conditions, buildings are usually designed to address the heating energy efficiency while overlooking the potential overheating risk during the warmer part of the year. Therefore, passive design measures, such as large equatorially oriented windows, compact building shapes, and highly thermally insulated envelopes, are commonly applied [43]. Nevertheless, it is unclear to what extent such design practices pose a potential lock-in overheating risk under projected climate scenarios. The paper aims at investigating potential solutions to simultaneously achieve high energy efficiency for the heating of bioclimatically designed buildings while at the same time maintaining low vulnerability to a warming climate. The study was conducted for Ljubljana, Slovenia, as a representative of a location with a temperate Central European climate. Energy models of bioclimatic buildings were evaluated against heating and cooling energy use, applying a comprehensive parametric analysis of passive design measures. The study’s main objective was to demonstrate a novel approach to the bioclimatic design of buildings, where the adaptation and resistance to a warming climate are integrated into the design process. Hence, the paper presents recommendations for the adoption of resilient bioclimatic building design into practice and legislation.

2. Materials and Methods

The study’s methodology was developed to enable the reaching of the above-stated objective of the paper. Thus, in principle, the applied methods can be split into four basic steps:
  • Sourcing historical climate data for the location of Ljubljana and preparing future climate data according to climate change projections using the morphing technique (Section 2.1).
  • Building energy model definition with corresponding variable parameters for the conducted parametric analysis (Section 2.2).
  • Definition of the methodology for energy performance evaluation based on the current Slovenian legislation (Section 2.3).
  • Definition of the methodology applied for overheating vulnerability analysis (Section 2.4).

2.1. Location and Climate

The study was performed for a Central European climate. As a representative of such climate, the location of Ljubljana (N 46.22, E 14.48, 385 m above sea level) in Slovenia was selected. This location is characterised by a warm temperate, fully humid climate with warm summers (Cfb according to Köppen–Geiger climate classification). The EPW climate file needed for building energy analysis was sourced from the International Weather for Energy Calculation (IWEC) database representing weather data measured between 1982 and 1999. In the paper, this climate data period was labelled as 1981–2010. Furthermore, the EPW of Ljubljana was used to generate projected EPW climate files for the periods 2011–2040, 2041–2070, and 2071–2100. The projected EPW files were generated using the morphing technique (i.e., time series adjustment method) according to the Intergovernmental Panel on Climate Change (IPCC) Special Report on Emissions Scenarios (SRES) A2 climate change scenario [44] and CCWorldWeatherGen tool [45]. The applied morphing technique uses historical climate data based on representative meteorological measurements in conjunction with projected global climate change patterns derived through numerical computer modelling to generate a new set of future projected climate. The use of recorded climate data as a starting point for future projected climate results in temporal continuity and spatial downscaling. The latter might be an issue for building energy simulations if only projections from global climate models are used.

2.2. Parametric Analysis

An extensive parametric analysis was carried out in order to study a vast pool of differently designed residential buildings. A single-family house with 162 m2 of net floor area and a volume of 486 m3 was chosen as the groundwork for the analysed energy models. Several building-related input parameters were fixed as constant for all the models considering the EN 16798-1 standard [46], meaningfully limiting the number of total possible combinations. Accordingly, the heating and cooling set-points were set to 21 °C and 26 °C, respectively, while the indoor temperature was controlled via the operative temperature. The summation of infiltration and natural ventilation was set to 0.60 h−1 (April till October) and to 0.375 h−1 (November till March). Internal heat gains and occupancy schedules were set according to EN 16798-1, Annex C [46]. Our previous analyses [47] have shown that external window shading is a crucial element of high energy performing bioclimatic buildings and was therefore not parametrised. It was set to block direct solar beams from April till October when incident solar radiation on the window was higher than 130 W/m2 and external air temperature higher than 16 °C. The external thermal emissivity of all opaque building elements was set to 0.80.
The following variable input parameters were selected: opaque envelope thermal transmittance (UO), window thermal transmittance (UW) and the paired solar heat gain coefficient (SHGC), window to floor ratio (WFR), window distribution (Wdis), building shape expressed through shape factor (f0), diurnal heat storage capacity (DHC) of load-bearing construction, external surface solar absorptivity (αsol), and summer natural ventilation cooling rate (NVC) (see Table 1).
Given the above-presented constant and variable building parameters, building energy models were formed in EnergyPlus [49]. Each model was divided into four thermal zones according to each cardinal axis. The jEPlus [50] software was used to conduct the parametric analysis. The annual building energy use for heating (QNH) and cooling (QNC) per square meter of floor area was calculated to evaluate the performance of each building model. Both QNH and QNC values represent the necessary thermal energy that needs to be delivered (or extracted in the case of cooling) to the thermodynamic system of a building in order to reach the specified internal thermal conditions. Therefore, these values do not reflect the effects of heating and cooling systems or specific fuels that would be used for running them. For a detailed explanation of the definition of building models, see the paper by Pajek and Košir [51], where the same methodology was used.

2.3. Energy Performance Evaluation

The annual energy use for heating (QNH) and cooling (QNC) of each building model was evaluated in relation to the Slovenian Rules on the efficient use of energy in buildings [52], which implements the EPBD requirements at the national level. These rules apply to all new buildings and all buildings being renovated or retrofitted, where at least 25% of the thermal envelope surface is retrofitted. The rules provide the highest allowed QNH of a residential building per square meter of conditioned floor area, given by Equation (1):
Q NH 45 + 60 × f 0 4.4 × T L
where QNH is annual building energy use for heating in kWh/m2, f0 is the ratio between the area of the thermal envelope of the building and the net heated volume of the building in m−1 (i.e., building shape factor), and TL is the average annual outdoor air temperature at the location in °C. TL for Ljubljana (1981–2010) is 10.7 °C [53].
Although the maximum allowed energy for heating depends on the building shape and location, the Rules on the efficient use of energy in buildings [52] limit the QNC per square meter of the cooled area to 50 kWh/m2, regardless of building shape and location. Table 2 shows the energy use limits, given the three different building shapes used in the study. The compliance of the building energy use with these rules was evaluated for the climate data, representing the period 1981–2010, since these are the climate data used in current energy efficiency analyses in practice.
Furthermore, building models were classified into energy efficiency classes. They were given labels based on the Slovenian EPC classification (Rules on the methodology of production and issuance of energy performance certificates for buildings [54]). According to Slovenian rules, the EPC labels are based only on QNH value. However, in the conducted study, each model was also labelled according to the QNC value using the same methodology and criteria as for the QNH. The EPC labels, colour markings, and corresponding building energy use ranges are presented in Table 3.

2.4. Overheating Vulnerability Analysis

The vulnerability of building models to overheating was assessed by conducting a robustness analysis presented by Kotireddy et al. [34] using a minimax regret method. In this method, the performance regret for each climate scenario is the difference in performance between a building design and the best performing design in a given scenario. The maximum performance regret of a design across all scenarios is the measure of its robustness. Thus, the most robust design is the design with the lowest maximum performance regret. The minimax regret method can be explained through Equations (2)–(4).
R max , i = max ( R i 1 ,   R i 2 , ,   R ij )
R ij =   PI ij A j
A j = min ( PI 1 j , PI 2 j , , PI ij )
where Rmax,i is the maximum performance regret of the i-th building model, Rij is the performance regret of the i-th building model in climate scenario j, Aj is the minimum value of the performance indicator in climate scenario j, and PIij is the performance indicator of the i-th building model in climate scenario j. Here, i = 1–496,800 and j = 1–4 since the performed parametric analysis resulted in 496,800 individual building models simulated through four different climate scenarios. As a performance indicator (i.e., PI), the increase in energy use for cooling (i.e., ∆QNC) vis-à-vis the QNC in the 1981–2010 climate was selected and was calculated for each building model in each future climate scenario, namely 2011–2040, 2041–2070, and 2071–2100 climate (see Section 2.1. Location and climate). Then, the building model with the highest climate change vulnerability, and thus the lowest robustness, was identified through Equation (5):
V max = max ( R max , i )
where Vmax is the most vulnerable design.
Furthermore, the overheating vulnerability score (OV score) was calculated by normalising the performance regret of each building model with the performance regret of the most vulnerable building model. The building model with the lowest OV score (i.e., equal to 0) is the least vulnerable (i.e., the most robust), and the building model with the highest OV score (i.e., equal to 1) is the most vulnerable to climate change in terms of overheating vulnerability.

3. Results

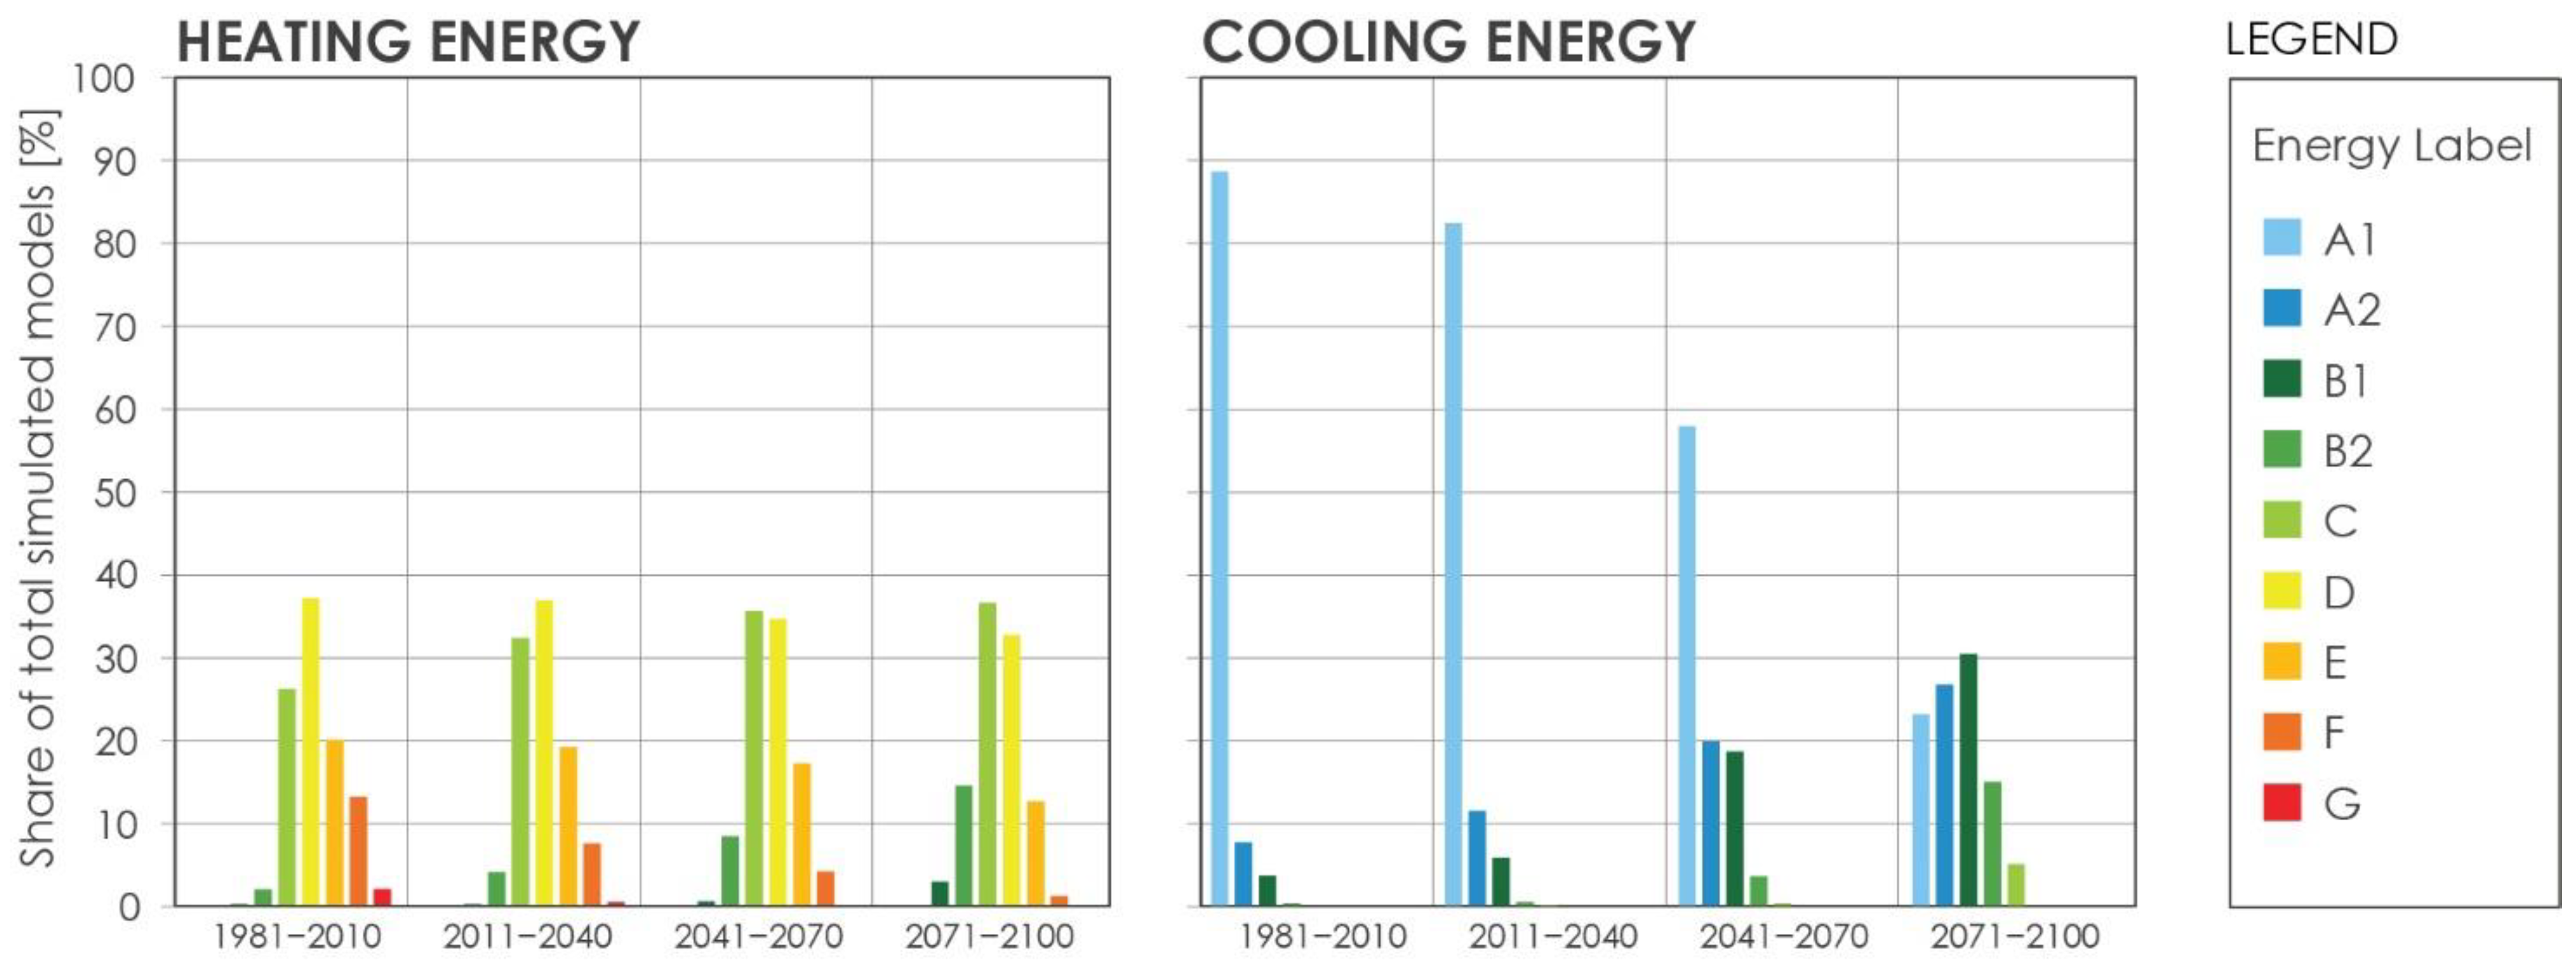
3.1. Energy Efficiency

The parametrically simulated building energy models were evaluated concerning the compliance with the Slovenian Rules on the efficient use of energy in buildings. This was done to assess the possibility of meeting the requirements of these rules using exclusively the analysed bioclimatic (i.e., passive) design measures without using any active measures, such as mechanical heat recovery ventilation. The conformity with the rules was evaluated for the 1981–2010 period since these are the climate data used in current energy efficiency compliance assessments in Slovenia. The results showed that 15.7% of simulated building models were compliant with the maximum permissible heating energy use (i.e., QNH) criteria (see Table 2). The median QNH of the energy-rule-compliant building models was 42.7 kWh/m2, and the absolute best-performing model had a QNH equal to 24.1 kWh/m2. However, the QNH threshold is related to f0 of a particular building (see Table 2), which resulted in the fact that compliance with the QNH criteria was easier achieved in the case of a less compact building design. Namely, the criteria were met in 22.5%, 13.5%, and 11.8% of building models with a non-compact (i.e., f0 = 1.08), a semi-compact (i.e., f0 = 0.80), and a compact (i.e., f0 = 0.78) shape, respectively. At this point, caution should be exercised in generalizing the above-stated results. The described phenomenon is a consequence of the methodology used to determine the threshold QNH (see Equation (1)) given in the Slovenian Rules on the efficient use of energy in buildings and not of better energy response of such building shape. In general, all the models meeting or surpassing the criteria of QNH have an equal or lower value of UO than 0.25 W/m2K. The other parameters are normally distributed. The cooling energy use (QNC) criterion (see Table 2) was achieved in all the analysed models since the highest QNC of simulated models for the 1981–2010 period was 34.1 kWh/m2. The QNC of the analysed building models is projected to exceed the limit of 50 kWh/m2 for the first time in the 2041–2070 period.
Furthermore, in order to gain a better insight into energy efficiency, the simulated building models in each of the analysed climate periods were classified according to the Slovenian Rules on the methodology of production and issuance of energy performance certificates for buildings (Figure 1). In general, the results in Figure 1 show that using the selected passive design measures results in building models with relatively satisfactory energy efficiency. Although none of the analysed building models was classified into heating energy efficiency classes A1 (i.e., QNH < 10 kWh/m2) and A2 (i.e., 10 < QNH > 15 kWh/m2), either under the current or the future climate file, all the other classes (i.e., B1 through G) are represented (Figure 1). Under the influence of the projected climate change, the heating energy efficiency of the analysed buildings is projected to increase over time. The share of building models with higher heating energy efficiency (i.e., classes B1, B2 and C) is increasing. Accordingly, the share of less energy-efficient models is decreasing (i.e., classes D, E, F and G). This means that during the 1981–2010 period, roughly 28% of building models were in class C or higher (QNH < 60 kWh/m2), while for the 2071–2100 period, this share almost doubled to 54%, an increase of 26 percentage points (p.p.). Furthermore, in the 1981–2010 period, only 37 (i.e., 0.01%) building models can be classified under heating energy efficiency label B1 (i.e., 15 < QNH > 25 kWh/m2), while this number increases to 13,740 (i.e., 2.77%) cases in the 2071–2100 period. In general, the most extensive changes in the shares of building models in individual heating energy efficiency classes between the 1981–2010 and 2071–2100 periods can be observed for class B2 and class F, an increase of 13 p.p. in the former and a decrease of 12 p.p. in the latter. Moreover, concerning the analysed building model population, it is projected that there will be no more models with a G heating energy efficiency label in the 2041–2070 period and beyond (Figure 1).
Taking the 1981–2010 period as a starting point, the QNH is expected to decrease by 24–39% until the end of the century, with an average decrease of 32%. Table 4 presents the limits (i.e., variance) of building model parameters necessary for achieving a specific heating energy efficiency label. It can be considered that in order to classify one of the analysed building models under the B1 heating energy efficiency label during the 1981–2010 climate, one may choose from a relatively limited pool of choices (i.e., min-max range of a specific parameter). The latter applies to the range of all investigated variable parameters (see Table 4, B1). The other heating energy classes offer more “freedom of choice” concerning the variance of analysed passive design measures.
Furthermore, concerning the cooling energy use of the analysed building models, good cooling energy efficiency can be achieved using passive design measures under the Ljubljana climate. For the 1981–2010 period, the majority (i.e., 89%) of building models can be classified into the A1 cooling energy-efficient label, while the remaining 11% fall at least in class B2 (i.e., 25 < QNC > 35 kWh/m2). However, the cooling energy efficiency of the analysed buildings is projected to decrease significantly over time. The share of the most energy-efficient building models (i.e., label A1) is projected to decrease by 66 p.p. between 1981–2010 and 2071–2100 periods with the A2, B1, B2 and C cooling energy efficiency labels increasing proportionally (Figure 1). After the 2041–2070 period, building models classified under labels C (5% in 2071–2100 period) and D (0.01% in 2071–2100 period) appear, which were not present before. Therefore, by the end of the 21st century, the QNC of each building model is expected to increase by at least 59%, compared to the 1981–2010 period. For some instances, the QNC increased from zero in 1981–2010 to up to 10 kWh/m2 by the end of the 21st century. Table 5 presents the limits (i.e., variance) of building model parameters necessary for achieving a specific cooling energy efficiency label under the 2071–2100 climate file. In order to maintain the A1 cooling energy efficiency label in the future, the “freedom of choice” (i.e., min-max range) for the values of the varied parameters is not as limited as for heating energy use. Nevertheless, lower than the entire sample average UW, WFR, and αsol, and higher than average DHC and NVC should be used.

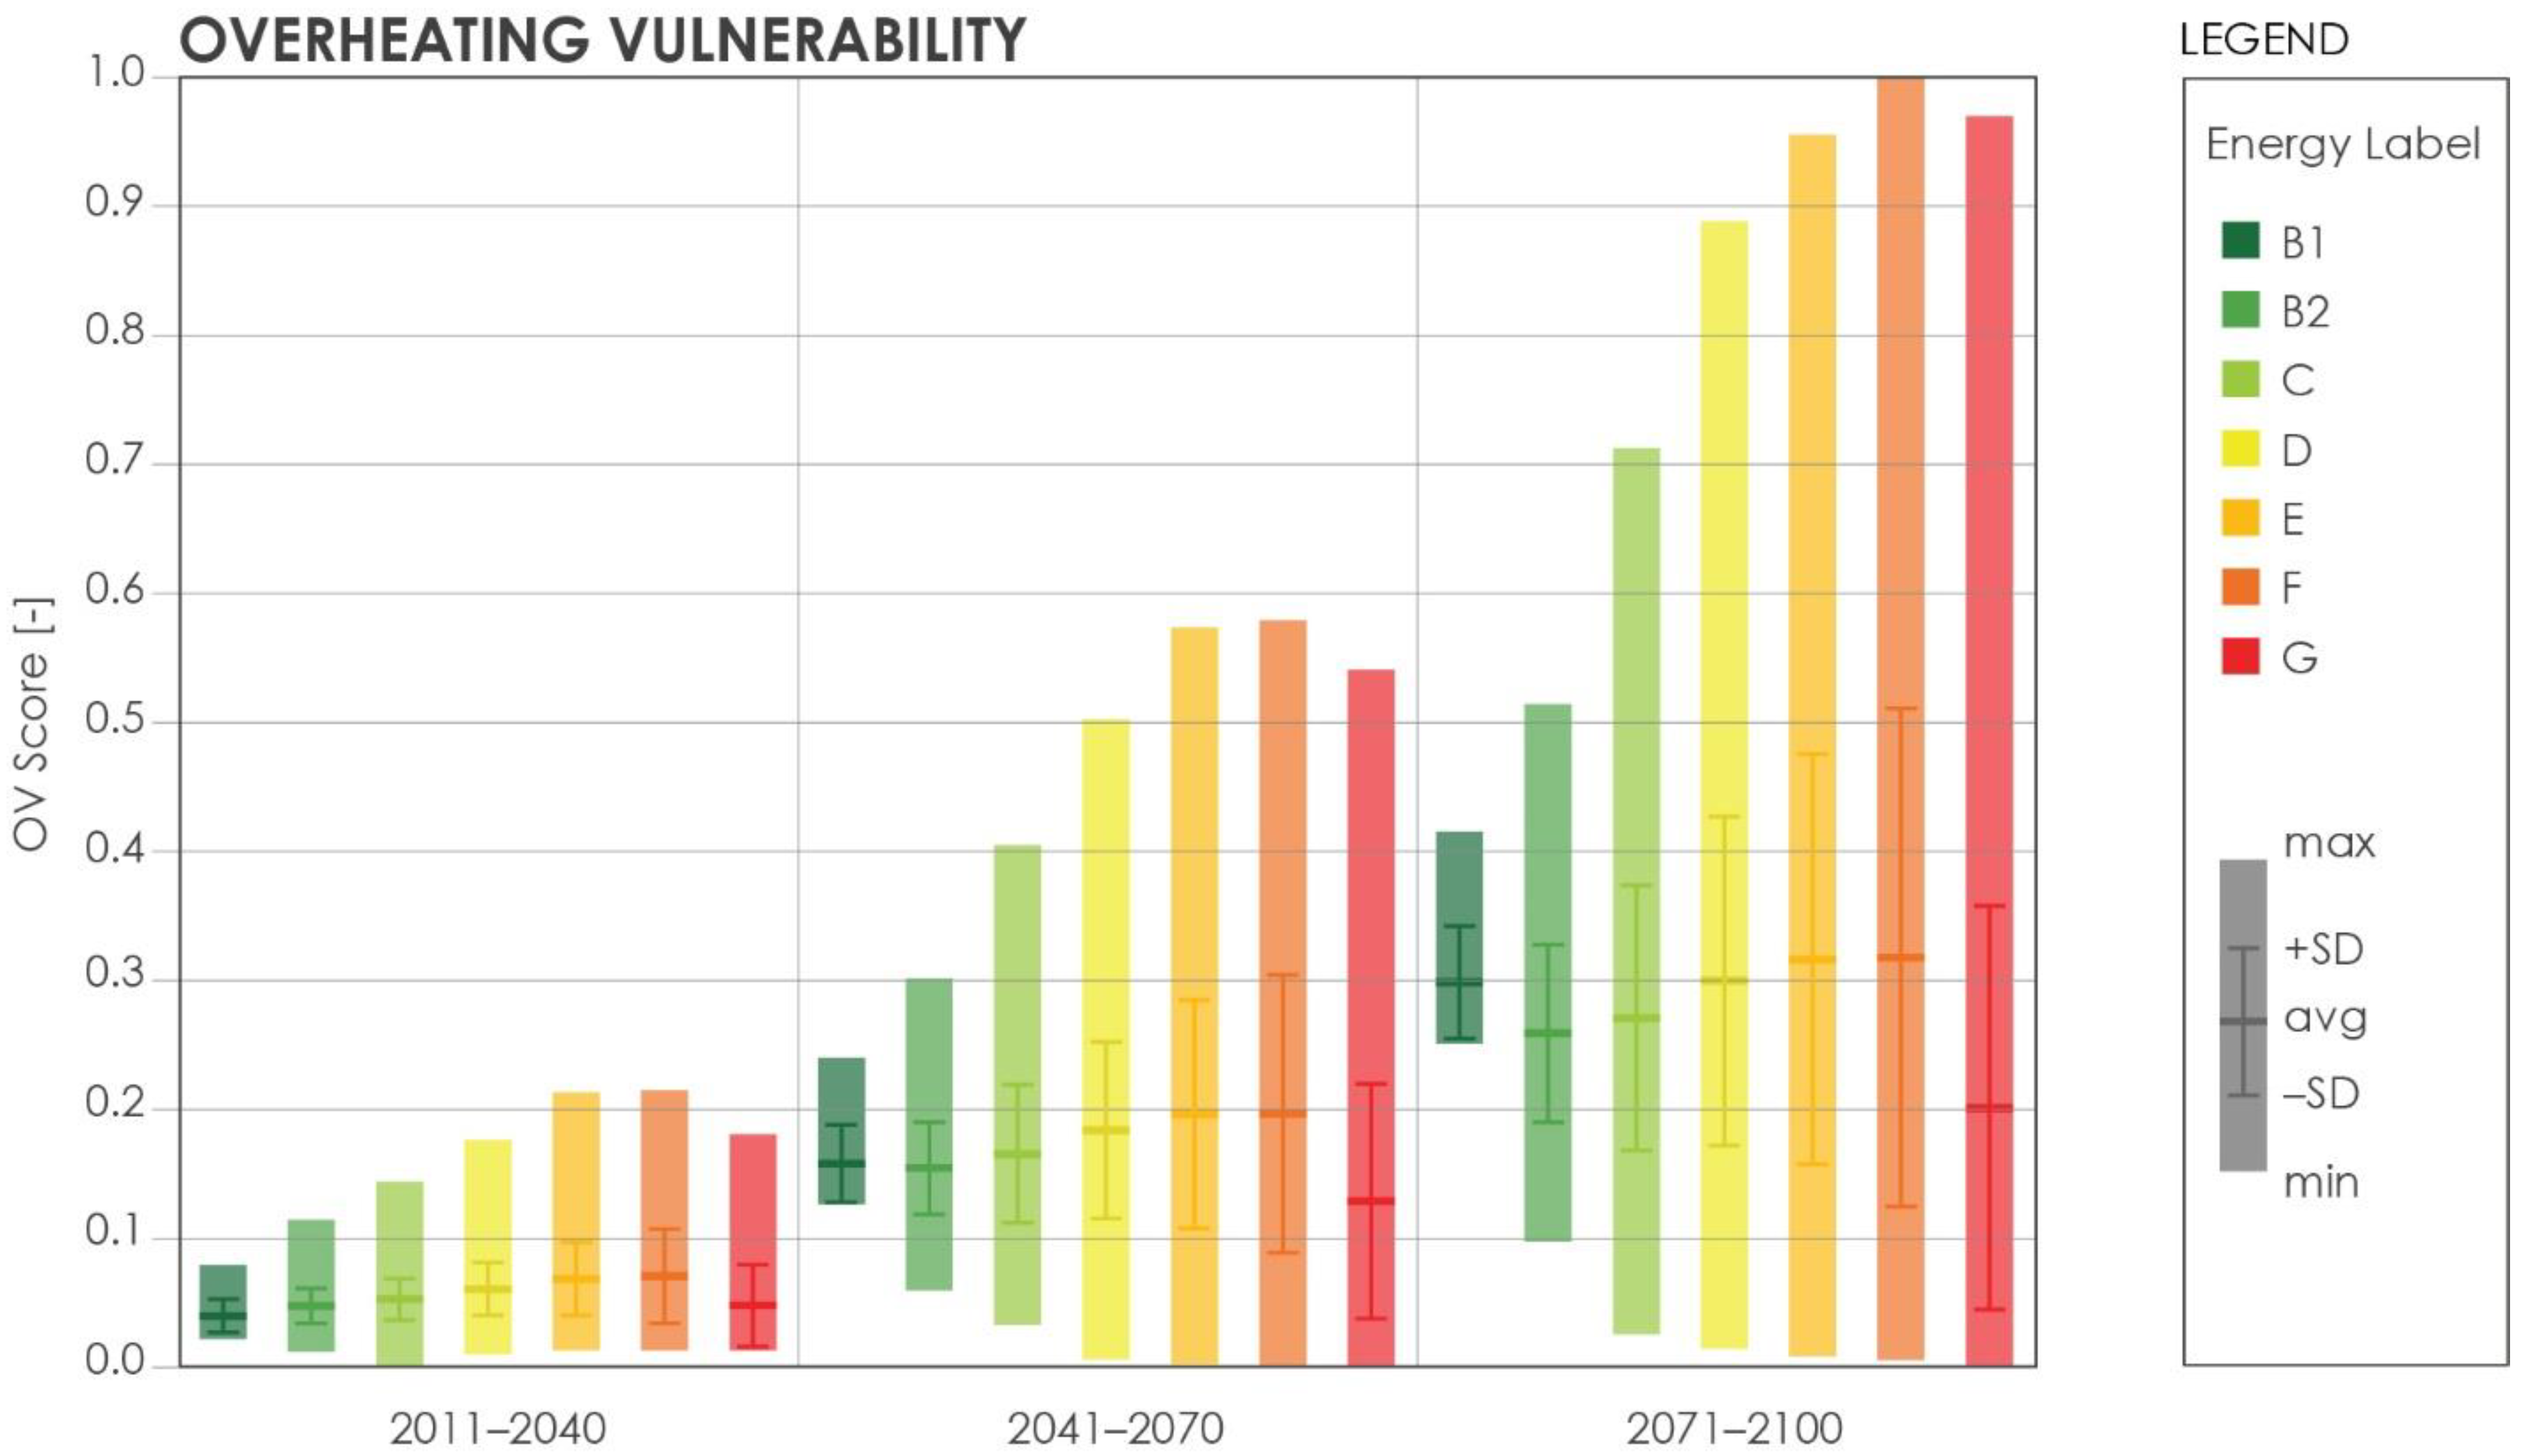
3.2. Climate-Change Vulnerability

The above-presented results indicate that heating energy efficiency is projected to improve over time under the projected climate change scenario. Therefore, the overheating vulnerability analysis for each building model was made according to the heating energy efficiency label attainted under the 1981–2010 climate, as explained in Section 2.3. Figure 2 shows that models with different heating energy efficiency labels also have different overheating vulnerability score (OV score). However, since radiative forcing and global average temperatures are projected to increase over time due to climate change, the overheating risk of buildings is expected to follow that pattern. Consequently, the OV score is highest for buildings evaluated under the 2071–2100 climate (Figure 2).
The average OV score is projected to increase similarly for all the energy labels. Building models classified under the B2 and C heating energy efficiency labels display on average the lowest susceptibility to increasing overheating vulnerability over the studied period. In particular, the average OV score of the B2 label buildings increases by 0.213 from 0.041 in 2011–2040 to 0.256 in 2071–2100. Simultaneously, the min-max range increases substantially from 0.093 in 2011–2040 to 0.413 in 2071–2100. Although the lower average OV score in 2041–2070 and 271–2100 periods are reached for the G labelled buildings, these buildings are also characterised by one of the highest min-max ranges (i.e., 0.971 in 2071–2100). Consequentially, this indicates that they have on average a low overheating risk, although individual building configurations can be very susceptible to it. The OV score min-max range is the narrowest in most heating energy-efficient buildings (i.e., B1 label), meaning that the overheating vulnerability is easier to control for highly heating energy-efficient buildings. Nevertheless, it should be stressed that buildings with the highest heating energy efficiency are generally not characterised by the lowest OV scores. Although in the 2011–2040 period, the B1 label buildings actually have the lowest average OV score (i.e., 0.034), the reached minimum score (i.e., 0.025) is higher than in the case of all other heating energy efficiency labels. The described situation is projected to escalate in the second part of the 21st century when the OV score of the B1 label buildings increases substantially (Figure 2). So much so that in the 2041–2070 period, the B2 and G labelled buildings have a lower average OV score, while in the 2071–2100 period, the B2, C, and G labelled buildings have lower average scores. This indicates that highly heating energy-efficient bioclimatic buildings (i.e., B1 label) are also characterised by substantial locked-in overheating risk. The main reason is that these models have south-concentrated large window areas (i.e., WFR higher than 35%, see Table 4). On the other hand, the maximum OV score of the B1 labelled buildings is the lowest in all periods (Figure 2). Therefore, when using passive design measures for high heating energy efficiency, an overall lower maximum OV score can be expected than in other designs (i.e., B2 to G labelled buildings).
The overall lowest overheating vulnerability score was achieved by a building model having poor thermal insulation (UO = 1.0 W/m2K, namely 2 cm of thermal insulation), highly thermally insulated windows (UW = 0.6 W/m2K, SHGC = 0.45), minimal window areas (WFR = 5%), a non-compact shape (f0 = 1.08), high thermal mass (DHC = 146 kJ/m2K), light-coloured external surfaces (αsol = 0.20) and high rates of natural ventilation cooling (NVC = 8 h−1). Its QNC is projected to increase from 0.0 kWh/m2 in the 1981–2010 period to 3.2 kWh/m2 in 2071–2100. However, the building model is highly energy inefficient from the aspect of heating energy use (i.e., G heating energy efficiency label). On the other hand, the most overheating vulnerable building model is characterised by poor thermal insulation (UO = 1.0 W/m2K), low thermally insulated windows (UW = 2.2 W/m2K, SHGC = 0.75), equally distributed extremely large window area (WFR = 45%), a compact shape (f0 = 0.78), high thermal mass (DHC = 146 kJ/m2K), dark-coloured external surfaces (αsol = 0.80) and without natural ventilation cooling (NVC = 0 h−1). Its heating energy efficiency is classified under the F label, while its QNC is projected to increase by 37.7 kWh/m2, from 12.7 kWh/m2 in the 1981–2010 period to 50.4 kWh/m2 in 2071–2100, an increase of 297%. Table 6 shows typical values of building parameters by OV score percentiles. It can be concluded that, in general, the least prone to overheating (i.e., p05 in Table 6) were building models with above-average UO, Wdis, f0, DHC, and NVC, and below-average UW, WFR, and αsol.

4. Discussion

In the bioclimatic design of buildings, the decision-making conditions are diverse, with several design objectives and criteria to be considered, particularly occupant comfort, energy efficiency, and daylighting [55,56,57]. In practice, trade-offs between these goals are very common, which need to be addressed appropriately. Only the energy efficiency aspect for providing thermal comfort was undertaken as a central part of this study, while occupant thermal comfort, indoor air quality and daylighting were not directly addressed. Therefore, the presented results should be interpreted in the exposed context. Similarly, the results should be understood in the framework of the applied passive design parameters and their value ranges. At the same time, several other design measures, such as evaporative cooling, fixed shading, sunspace, ground heat exchanger cooling, etc., were excluded from the analysis. Their exclusion from the analysis was based on the fact that they are either not common in the design practice (e.g., ground heat exchanger cooling) or ineffective (e.g., evaporative cooling) in the studied climatic context. Under these circumstances, the paper aimed to analyse the energy efficiency and overheating vulnerability of bioclimatic single-family houses in the Central European climate of Slovenia, Ljubljana. The energy efficiency was evaluated according to the annual energy use for heating (QNH) and cooling (QNC) per m2 of building floor area. According to the Slovenian building energy efficiency rules, a B1 heating energy efficiency class was the highest achievable using the selected passive design parameters under the currently applicable climate file (i.e., 1981–2010 period) and the projected future climate scenarios. Nevertheless, a much warmer future climate is projected to improve the heating energy efficiency of such buildings because the energy needed for heating is projected to decrease.
Furthermore, it was highlighted that given the uncertainties of future climate, it is advisable to design buildings for current heating energy efficiency while aiming for low vulnerability to future overheating. Accordingly, Figure 3 displays three conceptual examples of a bioclimatic building designed for the analysed Central European temperate climate of Ljubljana. These three concepts were proposed after the interpretation of the study results. The first building (Figure 3a) corresponds to the B1 label heating energy efficiency with simultaneously the lowest overheating vulnerability score (OV score) of the buildings in the B1 energy label. Next, Figure 3b shows the building design, which meets the B2 label heating energy efficiency with the lowest OV score of the buildings in the B2 energy label. The last building (Figure 3c) is the least overheating vulnerable building design of the buildings that fall into the C label according to the heating energy efficiency. The QNH value of each exposed building example intensifies from 24.7 kWh/m2 (building B1) to 49.0 kWh/m2 (building C) according to the 1981–2010 climate. At the same time, the QNC follows the reverse trend. Namely, according to the 2071–2100 climate, the QNC is highest for building B1 (18.6 kWh/m2) and lowest for building C (4.1 kWh/m2).
Although the best performing concept concerning the heating energy efficiency is the B1 building design (Figure 3a), it has several drawbacks regarding bioclimatic design. According to Potočnik and Košir [58], window size and glazing transmissivity are the dominant parameters to achieve adequate visual and non-visual indoor comfort. Therefore, vast south-concentrated window areas present a significant daylighting related drawback since they would be mainly shaded during summer. In contrast, during the rest of the year, glare might occur while utilising solar gains. On the other hand, building C, shown in Figure 3c, has minimal windows, resulting in potentially inadequate daylighting. It is also less heating energy-efficient than the other two presented design alternatives. Moreover, while using the WFR of 35% (Figure 3a), a natural summer ventilation rate (i.e., NVC) above 4 h−1 is recommended to achieve lower overheating vulnerability, which is, in reality, very hard and rarely achievable in residential buildings [59]. Although high-intensity natural ventilation is also preferred in the case of building B2 (Figure 3b), it is not as crucial. The reason is that building B2 has a smaller WFR, and thus solar heat gains and indoor surface temperatures are more governable. In all the best performing three cases, the lowest analysed UO and UW were used.
Another fact worth noting is that the difference in QNH between different examples in Figure 3 is projected to halve by the end of the century, while the difference in QNC is projected to double or triple. Assume both heating and cooling energy use (i.e., QNH + QNC) of the three buildings are taken together. In this case, it becomes evident that building B1 (QNH + QNC = 31.4 kWh/m2) is the best performing in the 1981–2010 period, while building B2 (QNH + QNC = 28.7 kWh/m2) is the best performing and building B1 is the worst performing (QNH + QNC = 35.6 kWh/m2) in the 2071–2100 period. Furthermore, of the three, building B1 is the only one with higher cumulative heating and cooling energy use in the 2071–2100 period compared to the 1981–2010 period. Therefore, to achieve adequate heating energy efficiency, assure low overheating vulnerability, and at the same time create conditions for adequate daylighting, the combination of passive design measures presented in the case of building B2 (Figure 3b) or similar should be used. Of course, the highlighted findings are limited to the building geometries and envelope configurations considered. Therefore, substantially differently configured buildings may be designed while being aware of their effects on energy use.
Accordingly, it is recommended to use highly thermally insulated building envelopes, especially windows. Furthermore, not too large window areas should be adopted, e.g., WFRs in the range of 10–25%. The windows can be concentrated on the south façade (e.g., window to wall ratio (WWR) between 20 and 60%) for autumn–spring solar harvesting. South concentrated windows also prevent unwanted solar gains in the forenoon and the afternoon during summer. Accordingly, fixed overhangs on the south façade can be used for partial shading. However, in the case of south-concentrated windows, external shading (e.g., blinds) of the entire glazed surface for overheating prevention should be applied. Furthermore, shading operation should be automatically controlled since the overheating risk would be higher if shading devices were manually controlled by occupants [60]. Concerning the building shape, a more compact design is recommended. It is also suggested to use massive construction materials to increase the thermal capacity of the building. Otherwise, the thermal mass should be added in other forms, such as capacitive furniture [61] or phase change materials [62]. Although the B1 heating energy efficiency class can only be achieved using dark coloured external surfaces, it is recommended to use lighter colours (e.g., αsol = 0.40–0.60) that reduce overheating vulnerability. Alternatively, vegetated surfaces (see Figure 3c) [63] or “cool” surface finishes [64] may be used to act as an effective overheating prevention measure. It is advisable to cool spaces using natural ventilation in summer when conditions allow, typically during the night. To this end, cross ventilation or stack ventilation of the building should be made possible by the appropriate arrangement of rooms and openings.
In addition to the presented and proposed passive design measures, additional either active or passive measures could be applied to reduce the energy use of a building. In particular, heating energy efficiency can be further improved by applying the heat recovery mechanical ventilation, improving the airtightness of the envelope, optimising occupant behaviour and similar. Besides, renewable energy sources, such as solar energy through PV or BIPV systems or solar collectors, are advisable [65]. In either case, an emphasis should be placed on long-term overheating vulnerability and not just current heating and cooling energy efficiency. In this way, high resilience and sustainability of the built environment may be achieved, primarily by raising the awareness of designers and policymakers.

5. Conclusions

Our civilisation faces the same frustration as the first humans—a struggle to build homes that provide safety and climate independence. As the presented research has demonstrated, the effort continues, while we still have a lot to learn about global warming and its implications for the (energy) performance of the built environment, especially with a limited amount of natural resources. The study successfully demonstrated a novel approach to the bioclimatic design of buildings by attaining current and future energy efficiency while also addressing climate adaptation and overheating resistance. The results of this paper clarify the overall picture concerning the design of bioclimatic residential buildings in the Central European climate. The main conclusions and novelty of the paper can be summarised as:
  • The paper demonstrates how to assess overheating vulnerability of bioclimatic buildings. In Central Europe, overheating vulnerability is a significant but often overlooked concern in building design, as designers and policymakers focus primarily on heating energy efficiency. However, overheating vulnerability assessment is required since climate change is projected to negatively affect the cooling energy need of buildings, especially those designed for passive solar energy harvesting during the colder part of the year.
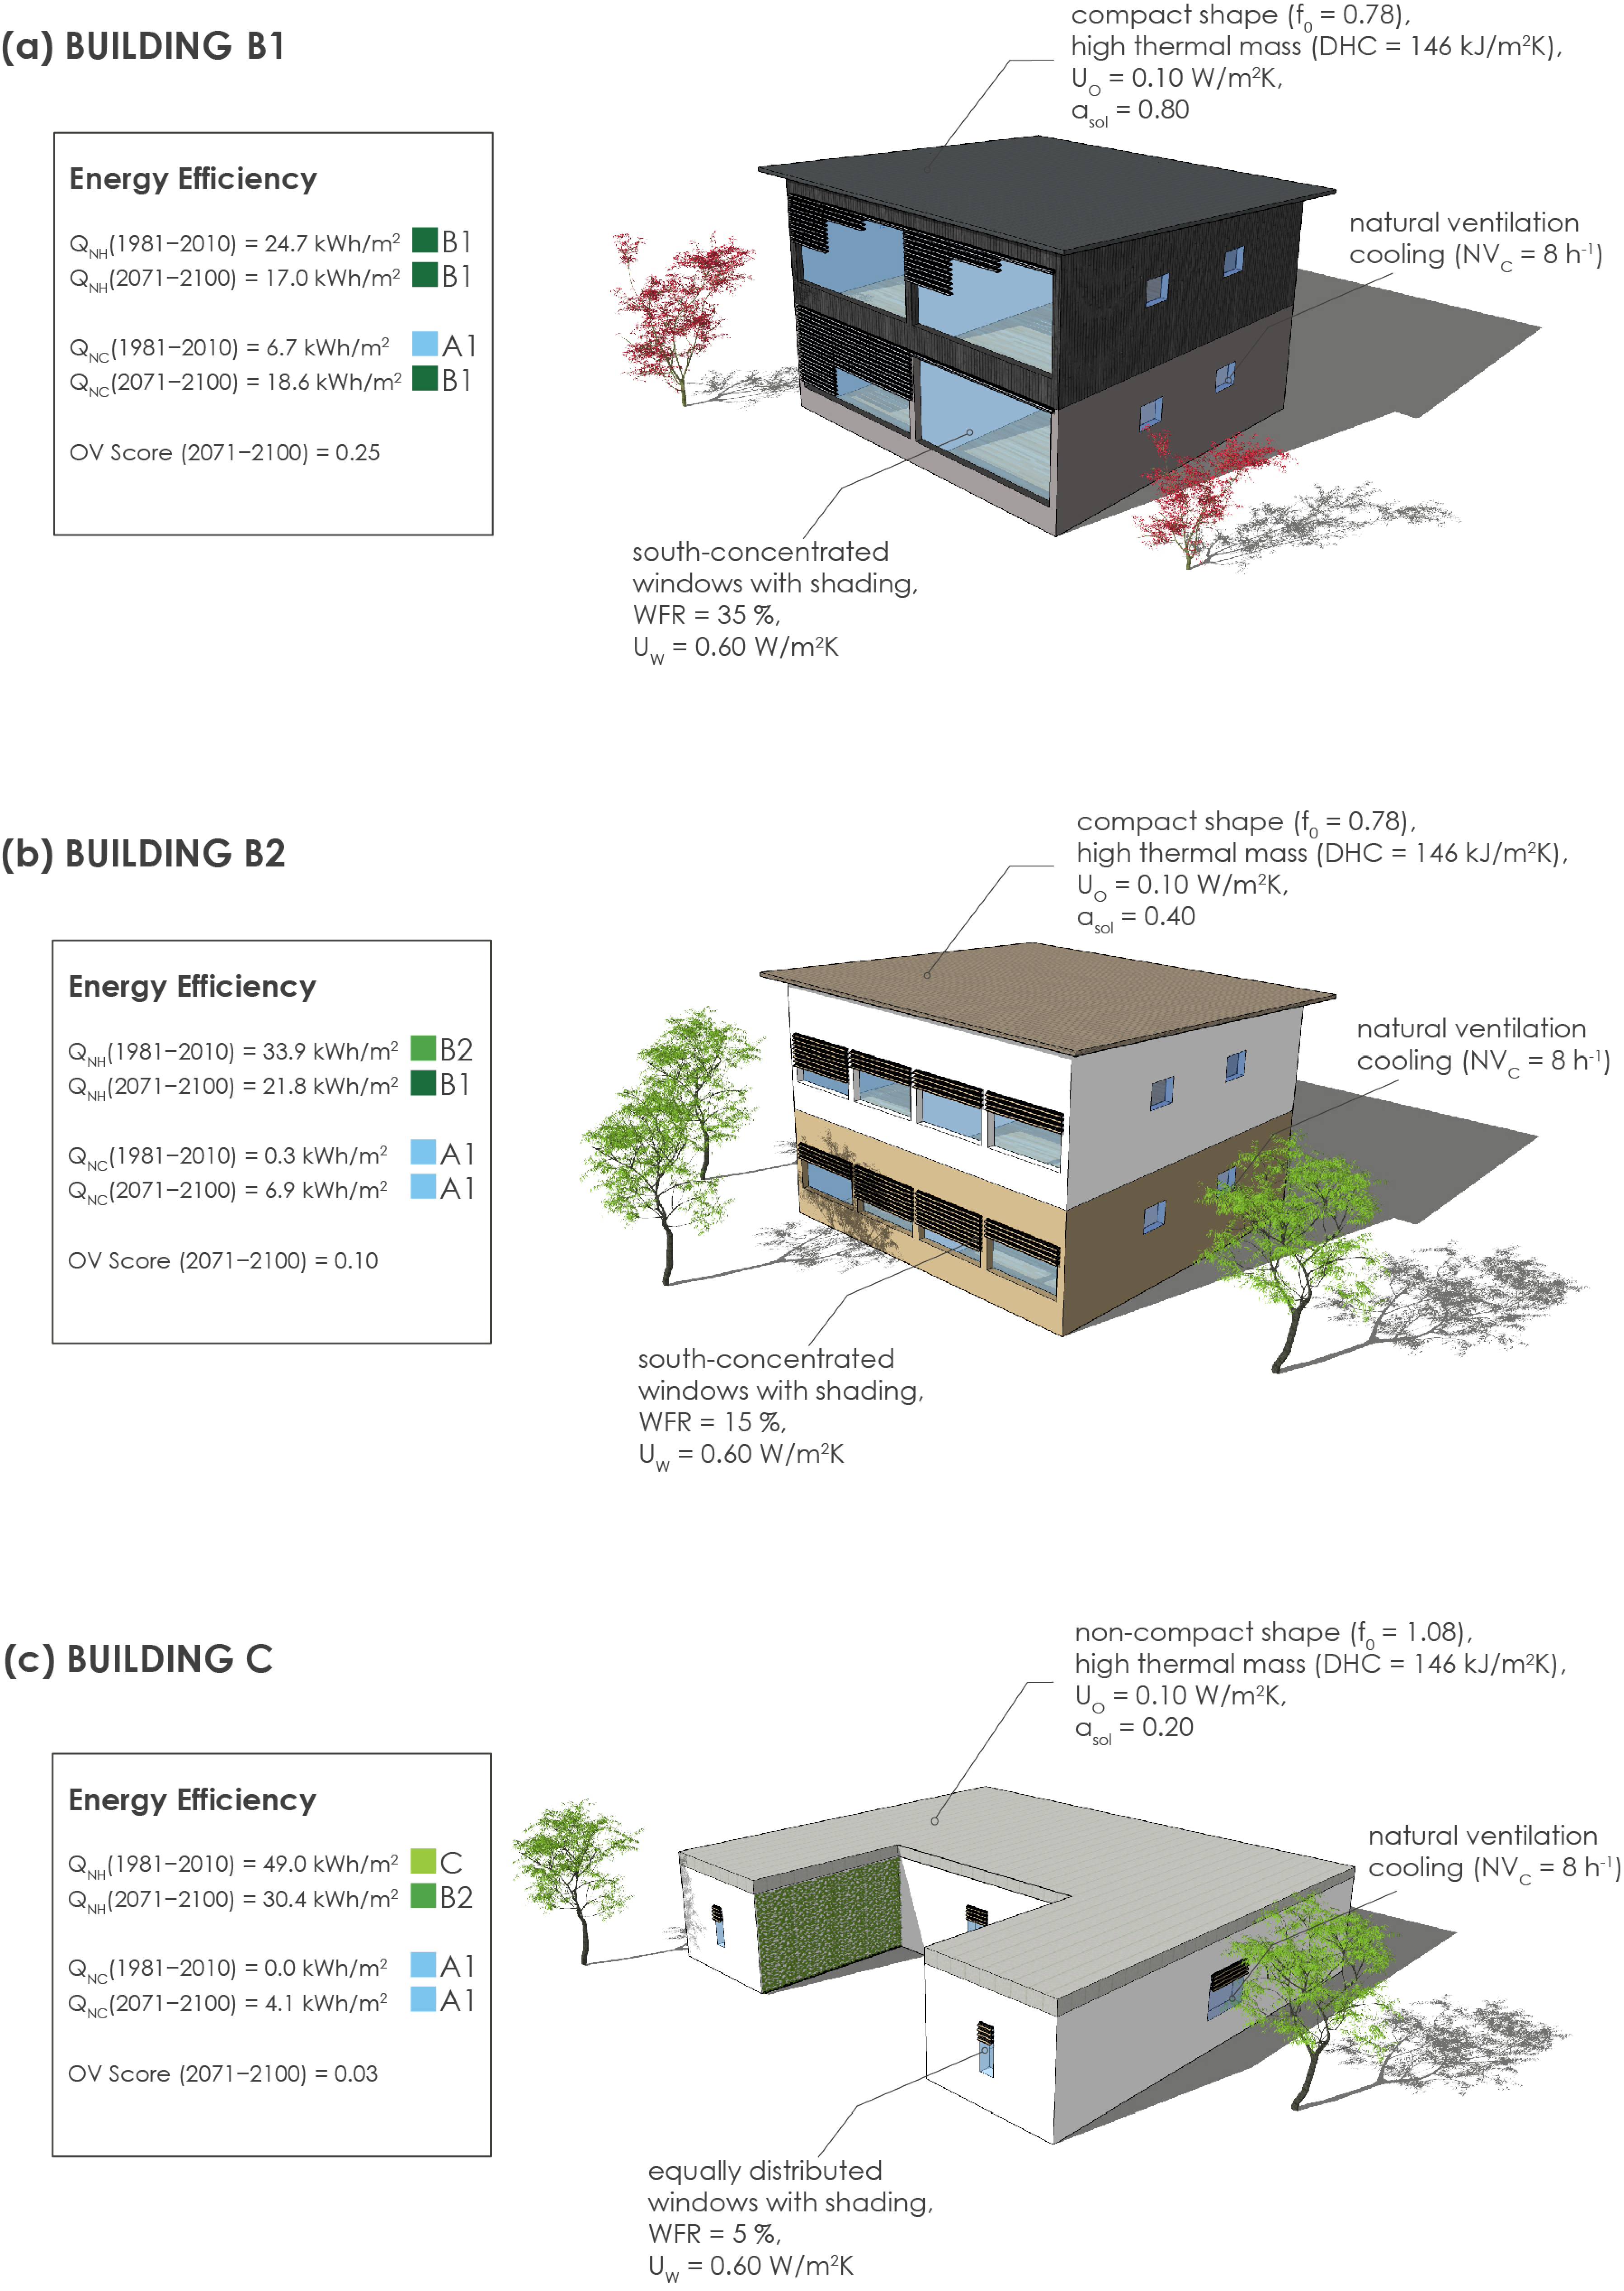
  • Recommendations for the energy-efficient resilient bioclimatic building design in Central European temperate climate are given. Such recommendations are needed because residential buildings under this climate are heating-dominated, and with a warming climate comes the risk of overheating. Nevertheless, adapting buildings to current heating energy efficiency requirements while aiming for low vulnerability to future overheating can be achieved with reasonable trade-offs presented in the paper.
  • Lastly, the results provide designers and policymakers with information to adopt a resilient bioclimatic building design approach into practice and regulations. A clear path towards the resilience and sustainability of buildings should be defined according to the study findings to preserve resources and mitigate climate change.

Author Contributions

Conceptualization, L.P. and M.K.; methodology, L.P. and M.K.; software, L.P.; validation, L.P. and M.K.; formal analysis, L.P.; investigation, L.P.; resources, M.K.; data curation, L.P.; writing—original draft preparation, L.P.; writing—review and editing, M.K.; visualization, L.P.; supervision, M.K. Both authors have read and agreed to the published version of the manuscript.

Funding

This research was funded by the Slovenian Research Agency (research core funding No. P2—0158).

Institutional Review Board Statement

Not applicable.

Informed Consent Statement

Not applicable.

Data Availability Statement

The data presented in this study are available on request from the corresponding author. The data are not publicly available as they are not stored on a publicly accessible repository.

Conflicts of Interest

The authors declare no conflict of interest.

References

  1. Košir, M. Climate Adaptability of Buildings: Bioclimatic Design in the Light of Climate Change; Springer International Publishing: Cham, Switzerland, 2019; ISBN 978-3-030-18455-1. [Google Scholar]
  2. Almusaed, A. Biophilic and Bioclimatic Architecture: Analytical Therapy for the Next Generation of Passive Sustainable Architecture; Springer: London, UK, 2011; ISBN 978-1-84996-533-0. [Google Scholar]
  3. Krainer, A. Passivhaus contra bioclimatic design. Bauphysik 2008, 393–404. [Google Scholar] [CrossRef]
  4. Szokolay, S.V. Introduction to Architectural Science: The Basis of Sustainable Design, 3rd ed.; Routledge: Oxfordshire, UK, 2014; ISBN 978-0-415-82498-9. [Google Scholar]
  5. Maciel, A.A.; Ford, B.; Lamberts, R. Main influences on the design philosophy and knowledge basis to bioclimatic integration into architectural design—The example of best practices. Build. Environ. 2007, 42, 3762–3773. [Google Scholar] [CrossRef]
  6. Desogus, G.; Felice Cannas, L.G.; Sanna, A. Bioclimatic lessons from Mediterranean vernacular architecture: The Sardinian case study. Energy Build. 2016, 129, 574–588. [Google Scholar] [CrossRef]
  7. Oikonomou, A.; Bougiatioti, F. Architectural structure and environmental performance of the traditional buildings in Florina, NW Greece. Build. Environ. 2011, 46, 669–689. [Google Scholar] [CrossRef]
  8. Yang, L.; Yan, H.; Lam, J.C. Thermal comfort and building energy consumption implications–A review. Appl. Energy 2014, 115, 164–173. [Google Scholar] [CrossRef]
  9. Halhoul Merabet, G.; Essaaidi, M.; Ben Haddou, M.; Qolomany, B.; Qadir, J.; Anan, M.; Al-Fuqaha, A.; Abid, M.R.; Benhaddou, D. Intelligent building control systems for thermal comfort and energy-efficiency: A systematic review of artificial intelligence-assisted techniques. Renew. Sustain. Energy Rev. 2021, 144, 110969. [Google Scholar] [CrossRef]
  10. Pajek, L.; Košir, M. Can building energy performance be predicted by a bioclimatic potential analysis? Case study of the alpine-adriatic region. Energy Build. 2017, 139, 160–173. [Google Scholar] [CrossRef]
  11. Kottek, M.; Grieser, J.; Beck, C.; Rudolf, B.; Rubel, F. World map of the Köppen-Geiger climate classification updated. Meteorol. Z. 2006, 15, 259–263. [Google Scholar] [CrossRef]
  12. Krainer, A. Vernacular Buildings in Slovenia; Architectural Association Graduate School: London, UK, 1993; ISBN 978-0-9525703-6-3. [Google Scholar]
  13. Haggard, K.L.; Bainbridge, D.A.; Aljilani, R.; Goswami, D.Y. Passive Solar Architecture Pocket Reference Book; Earthscan: London, UK, 2009; ISBN 978-1-84971-080-0. [Google Scholar]
  14. Houghton, J.T.; Ding, Y.; Griggs, D.J.; Noguer, M.; van der Linden, P.J.; Dai, X.; Maskell, K.; Johnson, C.A. Climate Change 2001: The Scientific Basis: Contribution of Working Group I to the Third Assessment Report of the Intergovernmental Panel on Climate Change; Houghton, J.T., Intergovernmental Panel on Climate Change, Eds.; Cambridge University Press: Cambridge, UK, 2001; ISBN 978-0-521-80767-8. [Google Scholar]
  15. Levitus, S.; Antonov, J.I.; Wang, J.; Delworth, T.L.; Dixon, K.W.; Broccoli, A.J. Anthropogenic warming of Earth’s climate system. Science 2001, 292, 267–270. [Google Scholar] [CrossRef]
  16. Zwiers, F.W. Climate Change: The 20-year forecast. Nature 2002, 416, 690–691. [Google Scholar] [CrossRef]
  17. Houghton, J.T. Global Warming: The Complete Briefing, 5th ed.; Cambridge University Press: Cambridge, UK, 2015; ISBN 978-1-107-09167-2. [Google Scholar]
  18. Rubel, F.; Kottek, M. Observed and projected climate shifts 1901–2100 depicted by world maps of the Köppen-Geiger climate classification. Meteorol. Z. 2010, 19, 135–141. [Google Scholar] [CrossRef] [Green Version]
  19. Collins, M.; Knutti, M.; Arblaster, J.; Dufresne, J.-L.; Fichefet, T.; Friedlingstein, P.; Gao, X.; Gutowski, W.J.; Johns, T.; Krinner, G.; et al. Long-term climate change: Projections, commitments and irreversibility. In Climate Change 2013: The Physical Science Basis. Contribution of Working Group I to the Fifth Assessment Report of the Intergovernmental Panel on Climate Change; Climate Change 2013: The Physical Science Basis. Contribution of Working Group I to the Fifth Assessment Report of the Intergovernmental Panel on Climate Change; Cambridge University Press: Cambride, UK; New York, NY, USA, 2013. [Google Scholar]
  20. Brown, O. IOM Migration Research Series No. 31: Migration and Climate Change; International Organization for Migration (IOM): Geneva, Switzerland, 2008. [Google Scholar]
  21. IEP. Institute for Economics & Peace Ecological Threat Register 2020: Understanding Ecological Threats, Resilience and Peace; Institute for Economics & Peace (IEP): Sydney, Australia, 2020. [Google Scholar]
  22. Wang, S.; Liu, Y.; Cao, Q.; Li, H.; Yu, Y.; Yang, L. Applicability of passive design strategies in China promoted under global warming in past half century. Build. Environ. 2021, 195, 107777. [Google Scholar] [CrossRef]
  23. La Roche, P. Carbon-Neutral Architectural Design, 2nd ed.; CRC Press, Taylor & Francis Group: Boca Raton, FL, USA, 2017; ISBN 978-1-4987-1429-7. [Google Scholar]
  24. Pajek, L.; Košir, M. Implications of present and upcoming changes in bioclimatic potential for energy performance of residential buildings. Build. Environ. 2018, 127, 157–172. [Google Scholar] [CrossRef]
  25. Berardi, U.; Jafarpur, P. Assessing the impact of climate change on building heating and cooling energy demand in Canada. Renew. Sustain. Energy Rev. 2020, 121, 109681. [Google Scholar] [CrossRef]
  26. Rodrigues, E.; Fernandes, M.S. Overheating risk in Mediterranean residential buildings: Comparison of current and future climate scenarios. Appl. Energy 2020, 259, 114110. [Google Scholar] [CrossRef]
  27. Bravo Dias, J.; Soares, P.M.M.; Carrilho da Graça, G. The shape of days to come: Effects of climate change on low energy buildings. Build. Environ. 2020, 181, 107125. [Google Scholar] [CrossRef]
  28. Martin, R.; Sunley, P. On the notion of regional economic resilience: Conceptualization and explanation. J. Econ. Geogr. 2015, 15, 1–42. [Google Scholar] [CrossRef] [Green Version]
  29. Attia, S.; Levinson, R.; Ndongo, E.; Holzer, P.; Berk Kazanci, O.; Homaei, S.; Zhang, C.; Olesen, B.W.; Qi, D.; Hamdy, M.; et al. Resilient cooling of buildings to protect against heat waves and power outages: Key concepts and definition. Energy Build. 2021, 239, 110869. [Google Scholar] [CrossRef]
  30. Moazami, A.; Carlucci, S.; Nik, V.M.; Geving, S. Towards climate robust buildings: An innovative method for designing buildings with robust energy performance under climate change. Energy Build. 2019, 202, 109378. [Google Scholar] [CrossRef]
  31. Morales-Linares, J.; Corona-López, A.M.; Toledo-Hernández, V.H.; Flores-Palacios, A. Ant-gardens: A specialized ant-epiphyte mutualism capable of facing the effects of climate change. Biodivers. Conserv. 2021, 30, 1165–1187. [Google Scholar] [CrossRef]
  32. Fonseca, J.A.; Nevat, I.; Peters, G.W. Quantifying the uncertain effects of climate change on building energy consumption across the United States. Appl. Energy 2020, 277, 115556. [Google Scholar] [CrossRef]
  33. Shen, P.; Lior, N. Vulnerability to climate change impacts of present renewable energy systems designed for achieving net-zero energy buildings. Energy 2016, 114, 1288–1305. [Google Scholar] [CrossRef]
  34. Kotireddy, R.; Hoes, P.-J.; Hensen, J.L.M. A methodology for performance robustness assessment of low-energy buildings using scenario analysis. Appl. Energy 2018, 212, 428–442. [Google Scholar] [CrossRef]
  35. Kotireddy, R.; Loonen, R.; Hoes, P.-J.; Hensen, J.L.M. Building performance robustness assessment: Comparative study and demonstration using scenario analysis. Energy Build. 2019, 202, 109362. [Google Scholar] [CrossRef]
  36. Kotireddy, R.; Hoes, P.-J.; Hensen, J.L.M. Integrating robustness indicators into multi-objective optimization to find robust optimal low-energy building designs. J. Build. Perform. Simul. 2019, 12, 546–565. [Google Scholar] [CrossRef] [Green Version]
  37. Picard, T.; Hong, T.; Luo, N.; Lee, S.H.; Sun, K. Robustness of energy performance of zero-net-energy (ZNE) homes. Energy Build. 2020, 224, 110251. [Google Scholar] [CrossRef]
  38. Cantatore, E.; Fatiguso, F. An energy-resilient retrofit methodology to climate change for historic districts. Application in the Mediterranean area. Sustainability 2021, 13, 1422. [Google Scholar] [CrossRef]
  39. Houghton, A.; Castillo-Salgado, C. Analysis of correlations between neighborhood-level vulnerability to climate change and protective green building design strategies: A spatial and ecological analysis. Build. Environ. 2020, 168, 106523. [Google Scholar] [CrossRef]
  40. European Union. EPBD 2018/844/EU Energy Performance of Buildings Directive 2010; European Union: Brussels, Belgium, 2018. [Google Scholar]
  41. European Commission EU Buildings Factsheets. Available online: https://ec.europa.eu/energy/eu-buildings-factsheets_en (accessed on 19 March 2021).
  42. European Commission. COM 2020 662 Final Communication from the Commission to the European Parliament, the Council, the European Economic and Social Committee and the Committee of the Regions: A Renovation Wave for Europe–Greening Our Buildings, Creating Jobs, Improving Lives; European Commission: Brussels, Belgium, 2020. [Google Scholar]
  43. Finocchiaro, L.; Georges, L.; Hestnes, A.G. 6–Passive solar space heating. In Advances in Solar Heating and Cooling; Woodhead Publishing: Sawston, UK, 2016; pp. 95–116. ISBN 978-0-08-100301-5. [Google Scholar]
  44. IPCC Intergovernmental Panel on Climate Change AR4 Report; IPCC: Geneva Switzerland, 2007.
  45. University of Southampton, Energy and Climate Change Division CCWorldWeatherGen–Climate Change World Weather File Generator for World-Wide Weather Data. Available online: http://www.energy.soton.ac.uk/ccworldweathergen/ (accessed on 29 June 2020).
  46. EN CS. 16798-1. Energy performance of buildings—Ventilation for buildings—Part 1: Indoor environmental input parameters for design and assessment of energy performance of buildings addressing indoor air quality. In Thermal Environment, Lighting and Acoustics—Module M1-6; CEN: Brussels, Belgium, 2019. [Google Scholar]
  47. Pajek, L.; Košir, M. Climate change impact on the potential occurrence of overheating in buildings. In Proceedings of the International Conference on Sustainable Built Environment: Smart Building and City for Durability & Sustainability, Seoul, Korea, 12 December 2019; pp. 411–414. [Google Scholar]
  48. Bergman, T.L.; Lavine, A.; DeWitt, D.P.; Incropera, F.P. Incropera’s Principles of Heat and Mass Transfer, 8th ed.; Wiley: Singapore, 2017; ISBN 978-1-119-38291-1. [Google Scholar]
  49. EnergyPlus. Available online: https://energyplus.net/downloads (accessed on 2 October 2020).
  50. JEPlus–An EnergyPlus Simulation Manager for Parametrics. Available online: http://www.jeplus.org/ (accessed on 19 October 2020).
  51. Pajek, L.; Košir, M. Strategy for achieving long-term energy efficiency of European single-family buildings through passive climate adaptation. Appl. Energy 2021, 297, 117116. [Google Scholar] [CrossRef]
  52. Rules on the Efficient Use of Energy in Buildings. Off. Gaz. Repub. Slov. 2017, 52/10. Available online: https://www.uradni-list.si/glasilo-uradni-list-rs/vsebina/2010-01-2856?sop=2010-01-2856 (accessed on 15 May 2021).
  53. Slovenian Environmental Agency Archive–Observed and Measured Meteorological Data in Slovenia. Available online: https://meteo.arso.gov.si/met/sl/archive/ (accessed on 22 March 2021).
  54. Rules on the Methodology of Production and Issuance of Energy Performance Certificates for Buildings. Off. Gaz. Repub. Slov. 2020, 92/14. Available online: https://www.uradni-list.si/glasilo-uradni-list-rs/vsebina/2014-01-3699?sop=2014-01-3699 (accessed on 15 May 2021).
  55. Parsaee, M.; Demers, C.M.H.; Hébert, M.; Lalonde, J.-F.; Potvin, A. A photobiological approach to biophilic design in extreme climates. Build. Environ. 2019, 154, 211–226. [Google Scholar] [CrossRef]
  56. Singh, M.K.; Attia, S.; Mahapatra, S.; Teller, J. Assessment of thermal comfort in existing pre-1945 residential building stock. Energy 2016, 98, 122–134. [Google Scholar] [CrossRef]
  57. da Guarda, E.L.A.; Gabriel, E.; Domingos, R.M.A.; Durante, L.C.; Callejas, I.J.A.; Sanches, J.C.M.; Rosseti, K. de A.C. Adaptive comfort assessment for different thermal insulations for building envelope against the effects of global warming in the Mid-Western Brazil. IOP Conf. Ser. Earth Environ. Sci. 2019, 329, 012057. [Google Scholar] [CrossRef]
  58. Potočnik, J.; Košir, M. Influence of geometrical and optical building parameters on the circadian daylighting of an office. J. Build. Eng. 2021, 42, 102402. [Google Scholar] [CrossRef]
  59. Bekö, G.; Toftum, J.; Clausen, G. Modeling ventilation rates in bedrooms based on building characteristics and occupant behavior. Build. Environ. 2011, 46, 2230–2237. [Google Scholar] [CrossRef]
  60. Mahdavi, A.; Berger, C.; Amin, H.; Ampatzi, E.; Andersen, R.K.; Azar, E.; Barthelmes, V.M.; Favero, M.; Hahn, J.; Khovalyg, D.; et al. The role of occupants in buildings’ energy performance gap: Myth or reality? Sustainability 2021, 13, 3146. [Google Scholar] [CrossRef]
  61. Chen, Y.; Chen, Z.; Xu, P.; Li, W.; Sha, H.; Yang, Z.; Li, G.; Hu, C. Quantification of electricity flexibility in demand response: Office Building case study. Energy 2019, 188, 116054. [Google Scholar] [CrossRef]
  62. Zavrl, E.; Zupanc, G.; Stritih, U.; Dovjak, M. Overheating reduction in lightweight framed buildings with application of phase change materials. Stroj. Vestn. J. Mech. Eng. 2019, 3–14. [Google Scholar] [CrossRef]
  63. Lesjak, V.; Pajek, L.; Košir, M. Indirect green façade as an overheating prevention measure. Građevinar 2020, 72, 569–583. [Google Scholar] [CrossRef]
  64. Fabiani, C.; Pisello, A.L. Cool materials for passive cooling in buildings. In Urban Microclimate Modelling for Comfort and Energy Studies; Palme, M., Salvati, A., Eds.; Springer International Publishing: Cham, Switzerland, 2021; pp. 505–537. ISBN 978-3-030-65421-4. [Google Scholar]
  65. Domjan, S.; Arkar, C.; Begelj, Ž.; Medved, S. Evolution of all-glass nearly zero energy buildings with respect to the local climate and free-cooling techniques. Build. Environ. 2019, 160, 106183. [Google Scholar] [CrossRef]
Figure 1. Share of total simulated models by heating and cooling energy label for each period.
Sustainability 13 06791 g001
Figure 2. Overheating vulnerability score (OV score) of single-family houses in each future climate period. Building models are classified by heating energy label attained according to the 1981–2010 climate file, namely “current” heating energy label.
Sustainability 13 06791 g002
Figure 3. Three conceptual examples of bioclimatic building design for the analysed location. Examples represent a building of the most overheating resilient combination of passive measures for a building in: (a) B1 heating energy efficiency class; (b) B2 heating energy efficiency class; (c) C heating energy efficiency class. Each building has a useful floor area equal to 162 m2.
Sustainability 13 06791 g003
Table 1. Variable input parameters.
ParameterParameter Range
UO [W/m2K] 0.10–1.00
UW [W/m2K] (paired SHGC [-]) 0.60 (0.45)–2.40 (0.75)
WFR [%]5.0–45.0
Wdis [-]0.00, 1.00 a
f0 [m−1]0.78 (compact), 0.80 (semi-compact), 1.08 (non-compact)
DHC [kJ/m2K] b63 (cross laminated timber), 98 (brick), 146 (concrete/stone)
αsol [-]0.20–0.80
NVC [h−1] c0.0–8.0
total number of models496,800
a 0.00 = equal area of windows at all orientations, 1.00 = south-concentrated windows (3.75% of WFR is distributed among all other orientations); b DHC is determined according to the principles presented by Bergman et al. [48]; c NVC is applied between April and October when the following conditions are met: internal air temperature is > 24 °C, external air temperature is between 16 and 30 °C, and temperature difference between internal and external air is ≤4 K.
Table 2. Building energy use upper limit according to the Slovenian Rules on the efficient use of energy in buildings by building shape [52] for the location of Ljubljana, Slovenia.
f0QNH LimitQNC Limit
0.78 (compact)≤44.7 kWh/m2≤50.0 kWh/m2
0.80 (semi-compact)≤45.9 kWh/m2
1.08 (non-compact)≤62.7 kWh/m2
Table 3. Energy Performance Certificate efficiency classification [54].
LabelEnergy Use [kWh/m2]Label Colour
A1Q ≤ 10
A210 < Q ≤ 15
B115 < Q ≤ 25
B225 < Q ≤ 35
C35 < Q ≤ 60
D60 < Q ≤ 105
E105 < Q ≤ 150
F150 < Q ≤ 210
GQ > 210
Table 4. Typical building parameter values by heating energy label using the 1981–2010 climate file (i.e., “current” label).
Variable
Parameter
Heating Energy Label in the 1981–2010 Period
(i.e., “Current” Label)
B1B2CDEFGEntire Sample Average
UO [W/m2K]mean0.100.100.160.340.630.900.990.43
min0.100.100.100.100.300.500.800.10
max0.100.150.400.801.001.001.001.00
UW [W/m2K]mean0.600.861.401.561.541.571.601.50
min0.600.600.600.600.600.600.600.60
max0.601.802.402.402.402.402.402.40
WFR [%]mean41.229.424.525.224.622.819.724.6
min35.010.05.05.05.05.05.05.0
max45.045.045.045.045.045.045.045.0
Wdis [-]mean1.000.750.480.420.430.450.390.45
min1.000.000.000.000.000.000.000.00
max1.001.001.001.001.001.001.001.00
f0 [m−1]mean0.790.810.850.870.880.901.070.88
min0.780.780.780.780.780.780.800.78
max0.801.081.081.081.081.081.081.08
DHC [kJ/m2K]mean146109104102102101100102
min14663636363636363
max146146146146146146146146
αsol [-]mean0.750.550.520.510.500.460.340.50
min0.600.200.200.200.200.200.200.20
max0.800.800.800.800.800.800.800.80
Table 5. Typical building parameter values by cooling energy label using the 2071–2100 climate file.
Variable
Parameter
Cooling Energy Label in the 2071–2100 Period
(i.e., Projected Label)
A1A2B1B2CDEntire Sample Average
UO [W/m2K]mean0.440.420.410.440.570.990.43
min0.100.100.100.100.100.800.10
max1.001.001.001.001.001.001.00
UW [W/m2K]mean1.361.431.511.691.862.271.50
min0.600.600.600.600.601.800.60
max2.402.402.402.402.402.402.40
WFR [%]mean13.220.429.535.038.244.624.6
min5.05.05.05.05.040.05.0
max45.045.045.045.045.045.045.0
Wdis [-]mean0.490.460.370.460.520.920.45
min0.000.000.000.000.000.000.00
max1.001.001.001.001.001.001.00
f0 [m−1]mean0.900.890.880.840.830.790.88
min0.780.780.780.780.780.780.78
max1.081.081.081.081.080.801.08
DHC [kJ/m2K]mean110106102937963102
min63636363636363
max14614614614614663146
αsol [-]mean0.350.490.540.610.690.800.50
min0.200.200.200.200.200.800.20
max0.800.800.800.800.800.800.80
NVC [h−1]mean4.64.03.93.63.12.84.0
min0.00.00.00.00.00.00.0
max8.08.08.08.08.08.08.0
Table 6. Typical building parameter values by long-term (2071–2100) overheating vulnerability score (OV score) percentiles.
Variable
Parameter
Long-Term (2071–2100) OV Score Percentiles
p05Q1Q2Q3Q4p95Entire Sample Average
UO [W/m2K]mean0.490.420.410.380.510.740.43
min0.100.100.100.100.100.100.10
max1.001.001.001.001.001.001.00
UW [W/m2K]mean1.301.351.401.511.741.781.50
min0.600.600.600.600.600.600.60
max2.402.402.402.402.402.402.40
WFR [%]mean9.613.820.829.634.034.224.6
min5.05.05.05.05.05.05.0
max40.045.045.045.045.045.045.0
Wdis [-]mean0.490.520.460.420.380.260.45
min0.000.000.000.000.000.000.00
max1.001.001.001.001.001.001.00
f0 [m−1]mean0.940.890.890.870.850.850.88
min0.780.780.780.780.780.780.78
max1.081.081.081.081.080.801.08
DHC [kJ/m2K]mean1141081061009585102
min63636363636363
max14614614614614663146
αsol [-]mean0.240.350.490.510.640.740.50
min0.200.200.200.200.200.800.20
max0.800.800.800.800.800.800.80
NVC [h−1]mean4.74.74.03.93.43.34.0
min0.00.00.00.00.00.00.0
max8.08.08.08.08.08.08.0
Publisher’s Note: MDPI stays neutral with regard to jurisdictional claims in published maps and institutional affiliations.

