
Economic Value of Terminal Aerodrome Forecasts at Incheon Airport, South Korea


1
Planning and Finance Division, National Institute of Meteorological Sciences, Seogwipo-si 63568, Korea
2
Earthquake and Volcano Policy Division, Korea Meteorological Administration, Seoul 07062, Korea
*
Author to whom correspondence should be addressed.
Sustainability 2021, 13(12), 6965; https://0-doi-org.brum.beds.ac.uk/10.3390/su13126965
Submission received: 15 April 2021
/
Revised: 4 June 2021
/
Accepted: 18 June 2021
/
Published: 21 June 2021
(This article belongs to the Collection Sustainable Transport Economics, Behaviour and Policy)
Abstract
:Meteorological information at an arrival airport is one of the primary variables used to determine refueling of discretionary fuel. This study evaluated the economic value of terminal aerodrome forecasts (TAF), which has not been previously quantitatively analyzed in Korea. The analysis data included 374,716 international flights that arrived at Incheon airport during 2017–2019. A cost–loss model was used for the analysis, which is a methodology to evaluate forecast value by considering the cost and loss that users can expect, considering the decision-making result based on forecast utilization. The value was divided in terms of improving fuel efficiency and reducing CO2 emissions. The results of the analysis indicate that the annual average TAF value for Incheon Airport was approximately 2.2 M–20.1 M USD under two hypothetical rules of refueling of discretionary fuel. This value is up to 26.2% higher than the total budget of 16.3 M USD set for the production of aviation meteorological forecasts by the Korea Meteorological Administration (KMA). Further, it is up to 10 times greater than the 2 M USD spent on aviation meteorological information fees collected by the KMA in 2018.
1. Introduction
Weather has a significant effect on aircraft operations management [1]. A flight manager strongly considers the weather condition of the destination airport when loading aviation fuel prior to the aircraft’s departure [2]. To reduce fuel costs, accounting for more than 25% of the airline’s operating costs [3], meteorological information, which strongly affects the fuel payload, is vital for optimizing airlines’ operations and flight route and planning decisions. However, despite the importance of the information, some factors, such as users’ perceptions of meteorological information as public goods and lack of standards for appropriate prices, make it difficult to increase or adjust the charge.
When information from public institutions is concentrated on a small number of users, paid use of public information is implemented to realize its benefit principle and to use it as a resource for rapid provision and quality improvement [4]. The Korea Meteorological Administration (KMA) has been providing terminal aerodrome forecasts (TAF) and collecting charges for international flights’ domestic airport landings and foreign airlines passing through the Korean airspace since 2005 in accordance with the Weather Act of Korea and recommendations by the International Civil Aviation Organization (ICAO). The charges collected in 2017 from airlines were 1.2 M USD (1 USD = 1165.51 KRW, average exchange rate in 2019). However, at 7.6% of the TAF production cost (16 M USD), this amount was very low. In response, the KMA raised the 2018 TAF usage fee by 84.8% (4.5 USD) per landing and 118.1% (2 USD) per airspace passage [5]. Although the KMA increased the TAF price, the production cost match collection ratio was still 12.1% in 2018. The low payback rate might trigger future attempts by the KMA to realize appropriate information charges. Understanding the private sector is essential to improve the government’s policy performance [6]. Therefore, increasing the airline industry’s willingness to pay for aviation meteorological information to favorably increase the KMA price is necessary [7]. To do so, first, knowing the value in Korea of the information that has not been properly evaluated up to now is important.
Methodologies for assessing the value of meteorological information can be distinguished as empirical research and an analytical approach. Empirical research is conducted by examining general users’ perceptions of the information by asking questions of respondents. Researchers ask closed- or open-ended questions about users’ recognition of the existence and accuracy of information, when or how information is utilized, and how much they are willing to pay for improving the information. The data collected from the respondents are proposed policies that can either improve the value of weather information or be utilized as base data for non-market valuation methods, such as the conjoint valuation method (CVM) [8,9,10,11,12,13]. Empirical research is performed to analyze the value of the general public or overall weather information, while the analytical approach considers specific situations wherein costs and losses occur depending on the users’ decision-making. The cost–loss model assumes situations in which forecast users determine to take protective action depending on the likelihood of severe weather. Forecast users can mitigate losses from severe weather through protective action and might only spend on costs because of no events. However, no protective action can result in losses from severe weather events [14,15,16,17,18,19]. Empirical research is appropriate for assessing future services and accuracy improvements in meteorological information or conducting surveys of the public. An analytical approach might apply when considering the value of the information currently being provided or the stakeholder’s decision-making situation. In this study, we used the analytical method to assess the current degree of information value provided to the airline. If the KMA can prove cost-effectiveness, it can help airlines understand the price set. In precedent studies, the TAF values at Sydney Airport and Zurich Airport, which were evaluated using the analytical approach—a cost–loss model—is 6.9 M AUD and 15 M USD per year, respectively [20,21].
This study aims to enhance the perception toward aviation meteorological information by evaluating the economic benefits of TAF used for aircraft operations. To this end, we attempted to evaluate the TAF value that the captain and dispatcher of international flights arriving at Incheon Airport, the largest airport in Korea, used before departure. As additional fuel is reduced, the aircraft’s weight decreases, which can improve fuel efficiency during a flight. Considering the possibility of deviations at the arrival airport, precedent studies only examined how much fuel efficiency could be improved by utilizing TAF. In contrast, the increase in aircraft weight, from an increase in the payload of additional fuel, results in excess fuel combustion, thus resulting in the aircraft emitting more CO2 gases. The aviation sector is subject to the allocation of emission rights and must purchase them in the market if the previously assigned emission rights are being used. If some airlines have emission rights to spare, they can be sold to other companies. In other words, a reduction in CO2 emissions might be considered a potential benefit for the aviation industry. Therefore, by setting the aspect of improvement to fuel efficiency presented in preceding studies, as well as the aspect of reducing CO2 emissions, we attempted to evaluate the TAF value with a focus on Incheon Airport. Detailed explanations are provided in the data acquisition and description and the methodology sections.
2. Decision Model to Evaluate TAF
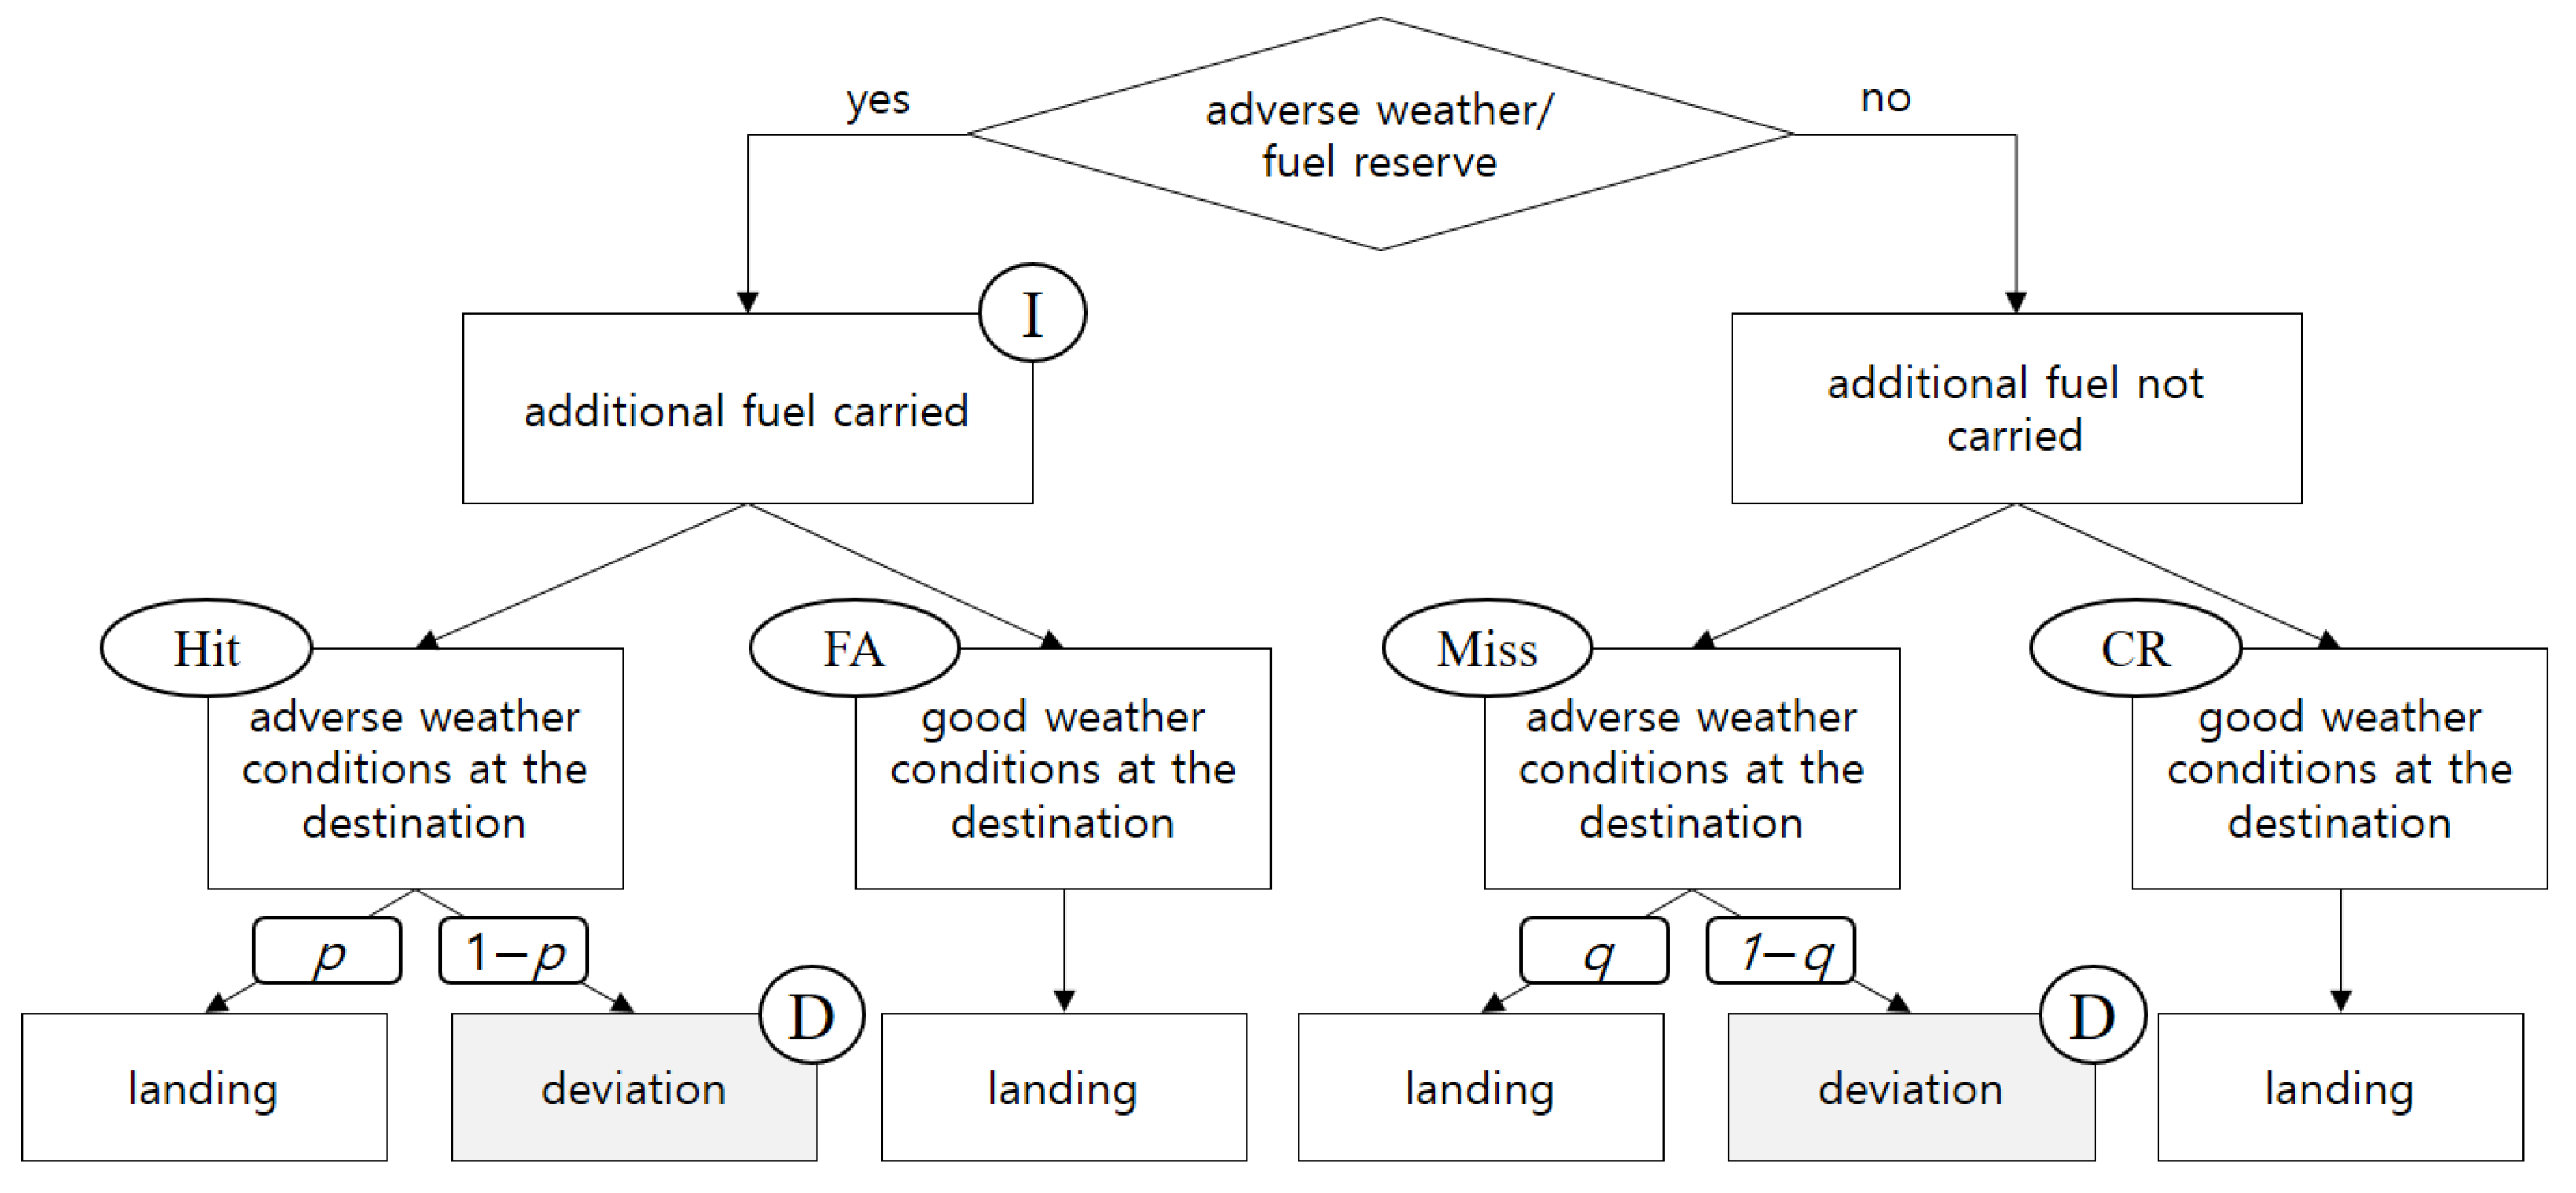
The decision-making process that determines the discretionary fuel load is based on the model in Gruenigen et al.’s work [21]. Using TAF allows the airline to overload fuel that was not needed because of inaccurate forecasts or to properly load fuel that was inevitably needed because of accurate forecasts. Figure 1 provides a schematic of the decision to load additional fuel using TAF and the landing or deviation occurrence at the arrival airport. Severe weather occurred with additional fuel on board, and the landing rate is p. The landing rate without additional fuel is allocated as q.
Costs and losses associated with the combination of forecasts and weather events and the relative frequency of each case are defined in Table 1. In Table 1, C2 is equal to the insurance cost because no event occurs. Insurance costs refer to fuel costs that are unnecessarily burned because of additional fuel loaded to prepare for adverse weather. L is the loss from being unprepared for severe weather. If additional fuel was not loaded, the cost was assumed to be zero when a weather event did not occur. Fnn refers to the relative frequency between severe weather forecasts and actual occurrences. D is the deviation cost.
The economic value (EV) is defined as the difference between the expected cost of not using TAF (ECNT) and the expected cost of using TAF (ECT). Each expected cost can be calculated using variables defined in Table 1 as follows:
Because aircraft fuel consumption is affected by flight distance (t) and aircraft size (a), the TAF value can be considered separately for each flight, t, and a. The value used by the airline is defined as follows:
3. Data Acquisition and Description
Actual aviation data from airlines could not be collected, which is difficult to value using a cost–loss model. Generally, private companies treat internal information related to costs-losses, deviations, and cancellations as management secrets; therefore, they tend to be reluctant to disclose such information to competitors or the public. Thus, this study collected the available data listed in Table 2 and attempted a generalized analysis.
Arrival data for international flights were collected during 2017–2019. Of 374,716 flights, 254 deviated during the three-year period, 160 of which returned because of meteorological factors. Aircraft arrived at Incheon Airport from 229 departure airports. Data included arrival time, departure airport, number of passengers, aircraft type, arrival/deviation status, and reasons for deviation, but not departure time. To estimate departure time, we collected the flight time between the departure airport and Incheon Airport using web crawling. Departure time is calculated as flight time subtracted from arrival time. Fuel economy by aircraft type considers fuel-tank capacity (gallons) and maximum flight range (km) as provided by aircraft manufacturers. Table 3 presents flight distance, fuel-tank capacity, and fuel economy calculated using the two variables. Major model types were used because the level of categorized aircraft types varies by source. For example, the value of fuel economy of A220 aircraft in Table 3 is 0.92, which is an average fuel economy of A220-100 and A220-300. This method was applied to all aircraft data.
Meteorological data were downloaded from COMIS4. The data collection period was 31 December 2016–31 December 2019, considering that dispatchers use TAF prior to aircraft departure. The total number of TAFs, including original and amended forecasts, is 5195. Annual average fuel prices per gallon for 2017, 2018, and 2019 were 1.5 USD, 1.90 USD, and 1.88 USD, respectively, with a maximum value of 2.18 USD and a minimum value of 1.25 USD [22]. Cost of fuel purchased by the airline was assumed to be the average monthly fuel price at the time of aircraft departure. Energy Information Administration (EIA) (2016) indicated that CO2 emissions per gallon of aviation fuel are 21.1 lbs. [23]. The average monthly carbon emission price for 2017–2019 was downloaded from the KRX ETS market information platform [24]. Annual average prices per ton were 17.7 USD, 19.5 USD, and 25.3 USD for 2017, 2018, and 2019, respectively.
4. Methodology
This study defined some conditions because actual airline flight data could not be used. The captain and dispatcher consider the weather at the arrival airport before departure and decide on the payload and whether to load discretionary fuel as preparation for deviations and delays. Interviews with airline staff led us to set their decision-making time to six hours before aircraft departure. Contingency fuel is prescribed under the following condition: “it shall not be less than a 5-min of flight at 450 m (1500 ft) altitude above the destination airport in standard atmosphere” [25]. Additionally, in 2012, ICAO announced a plan to adopt a 5% contingency fuel rule by revising its aircraft fuel requirements; Korean airliners are operating flights with 5% contingency fuel after gaining approval from the Minister of Land, Infrastructure and Transport [26]. There are no current criteria for the minimum discretionary fuel payload. It is assumed to be identical to two contingency fuel rules (hereafter the “5-min rule” and “5% rule”). The amount of fuel consumed during a five-minute flight was calculated based on the distance traveled at the speed of 425 km/h, regardless of the type of aircraft. The speed of 425 km/h is the conversion of 230 knots indicated in air speed (KIAS) to ground speed, and 230 KIAS is the maximum airspeed at altitudes lower than 14,000 ft, as set by ICAO. The visibility criterion for determining the discretionary fuel payload was set at 400 m, the low-visibility alert standard for Incheon Airport. A 5% rule is established for the amount of 5% of trip fuel.
Decision-makers who disregard TAF information increase the volume of discretionary fuel payloads in consideration of safety because they do not know the weather at the arrival airport. Additionally, aircrafts become heavier proportional to the increase in discretionary fuel. An increase in aircraft weight erodes fuel efficiency and over-burning of fuel in proportion to the decline in fuel economy. Over-burning increases greenhouse gas emissions. The TAF value considered the lower fuel economy and higher greenhouse gas emissions. Consequently, the increase in combustion (b) from additional fuel (β) is calculated by considering each aircraft category (a), the weight (m) of a particular flight (i), and the distance (d) shown, as presented in Table 4. Aircraft in the second column in Table 4 are from Ryerson et al., who modeled fuel consumption for some range of aircraft types using Piano 5—an aircraft performance analysis software [26]. The first column in Table 4 provides simplified aircraft types for analysis. Results showed that if A220 and A320 flights operating at 2000 mil add 10 lbs. of fuel, the additional fuel burn can be calculated as 0.019 × 10 + 4.644 × 10−5 × 2000 × 10 = 1.12 (lbs.).
Aircrafts that were not analyzed by the precedent study were grouped by size, and aircrafts within the same category were assumed to have the same fuel economy [27]. Aircraft sizes refer to the ICAO classification of sizes. Table 5 presents the ICAO airfield reference code, classified by aircraft width [28].
Airline emissions are important to the discussion of environmental problems and operational cost savings because domestic aviation is subject to allocation of emission rights, and a quota of approximately 6 million Korean allowance units (KAUs) was allocated during the second planned period (2018–2020) in Korea. A KAU represents the amount of greenhouse gas emissions allowed to be allocated to individual greenhouse gas emitters within the scope of total greenhouse gas emissions allowed to achieve the national greenhouse gas reduction target. Moreover, ICAO determined the Carbon Offsetting and Reduction Scheme for International Aviation in 2016, which will be implemented in 2021. In this case, airlines exceeding emission standards must purchase and offset emissions rights in the carbon market. Measures such as buying eco-friendly aircraft and reducing loads might be considered for reducing emissions; however, these methods add to an airline’s expenses [29]. In other words, greenhouse gas emissions that can be reduced by TAF utilization represent the hidden value of TAF information. Therefore, we calculated the TAF value based on the price of greenhouse gas emissions rights per unit considering the CO2 emitted by over-burned fuel, which results from the additional fuel weight increase. The equation is as follows:
where famount is the amount of excess fuel (gallon.), 21.1 is CO2 conversion factor (lbs.) from aviation fuel (gallon.), and PKAU is the monthly price of KAU.
5. Results and Discussion
5.1. Fuel Efficiency
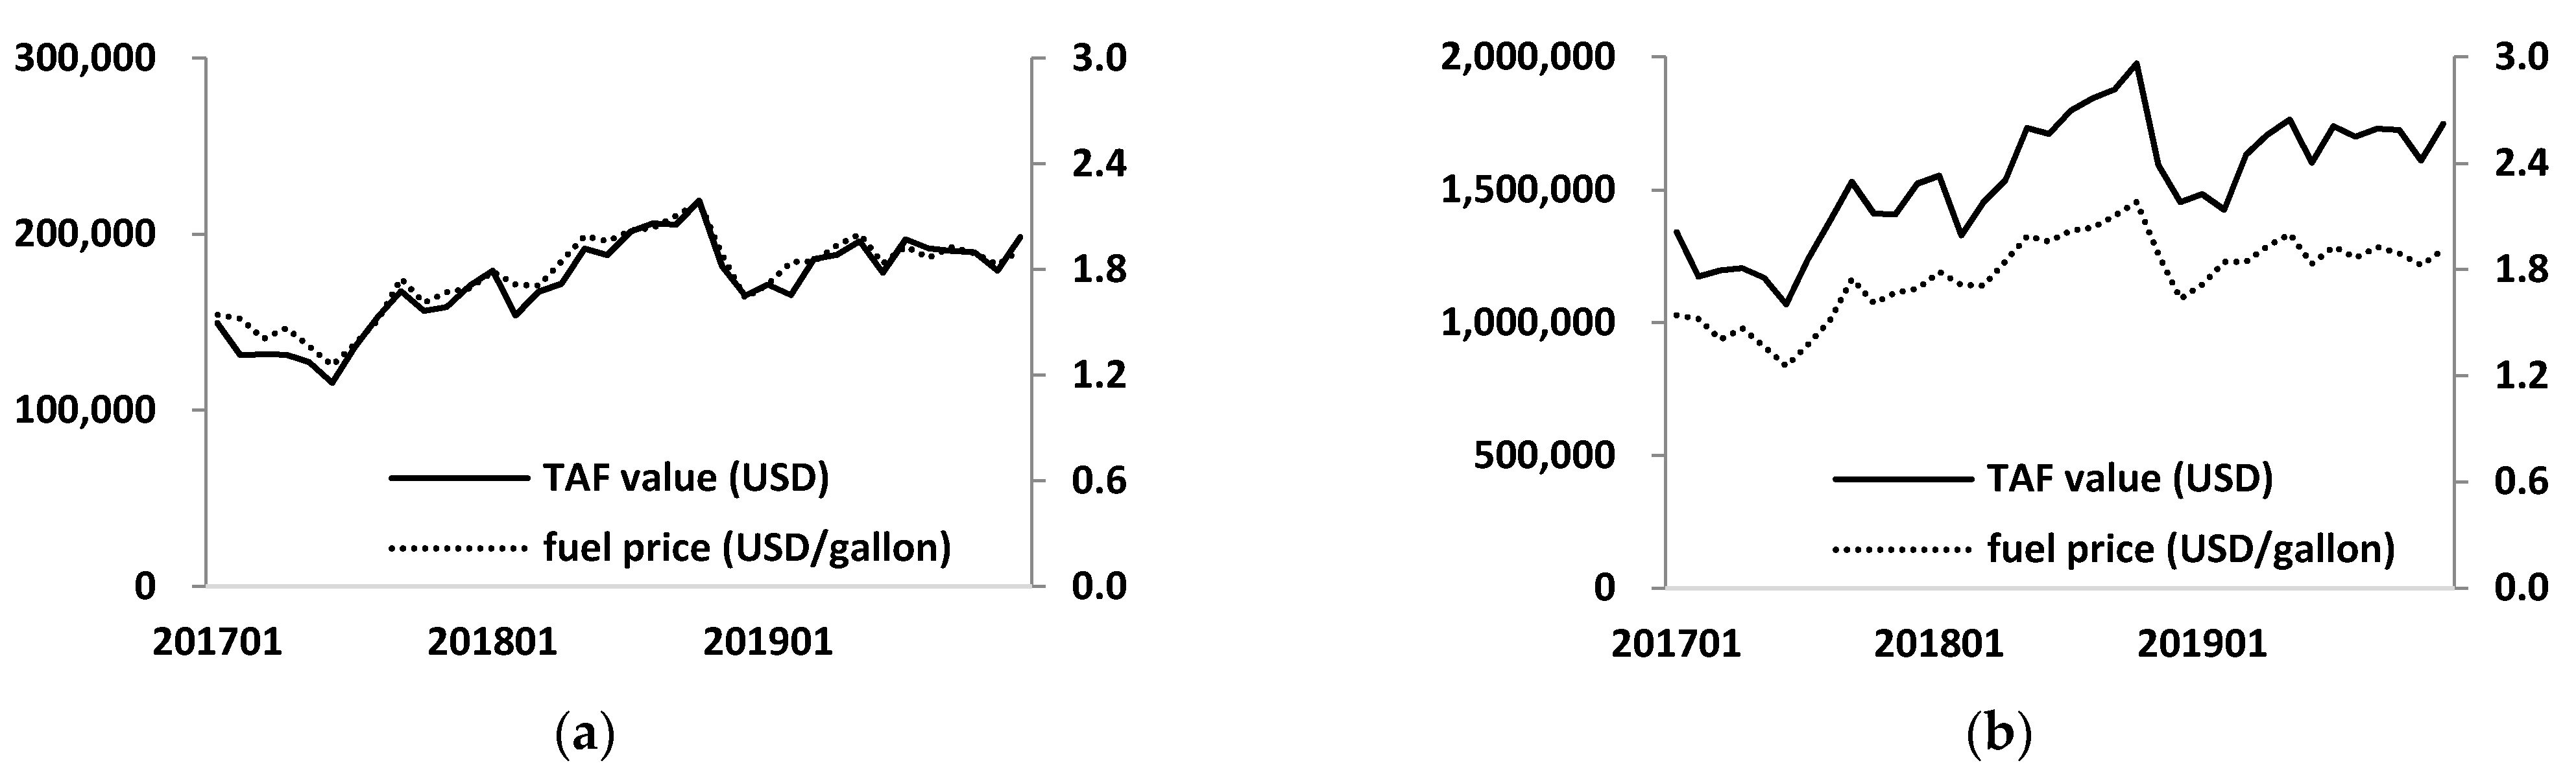
The TAF value used by national airlines arriving at Incheon Airport was calculated as approximately 6.2 M USD (5-min rule) and 55 M USD (5% rule), respectively, for 2017, 2018, and 2019. The case of Incheon Airport alone confirms that the KMA has provided airlines a value exceeding 13% of their annual budgets for TAF production in the 5% rule case, which is considered to provide an average of 148 USD per flight and 0.8 USD per passenger (67,497,168 passengers over three years). Figure 2 shows the monthly changes in TAF values. The Pearson’s correlation between the TAF value and the price of aviation fuel are higher than 0.96, in line with the results in Gruenigen et al.’s (2014) work [21]. The result refers to the linear relationship between the two variables and shows that the TAF value varies considerably depending on fuel prices.
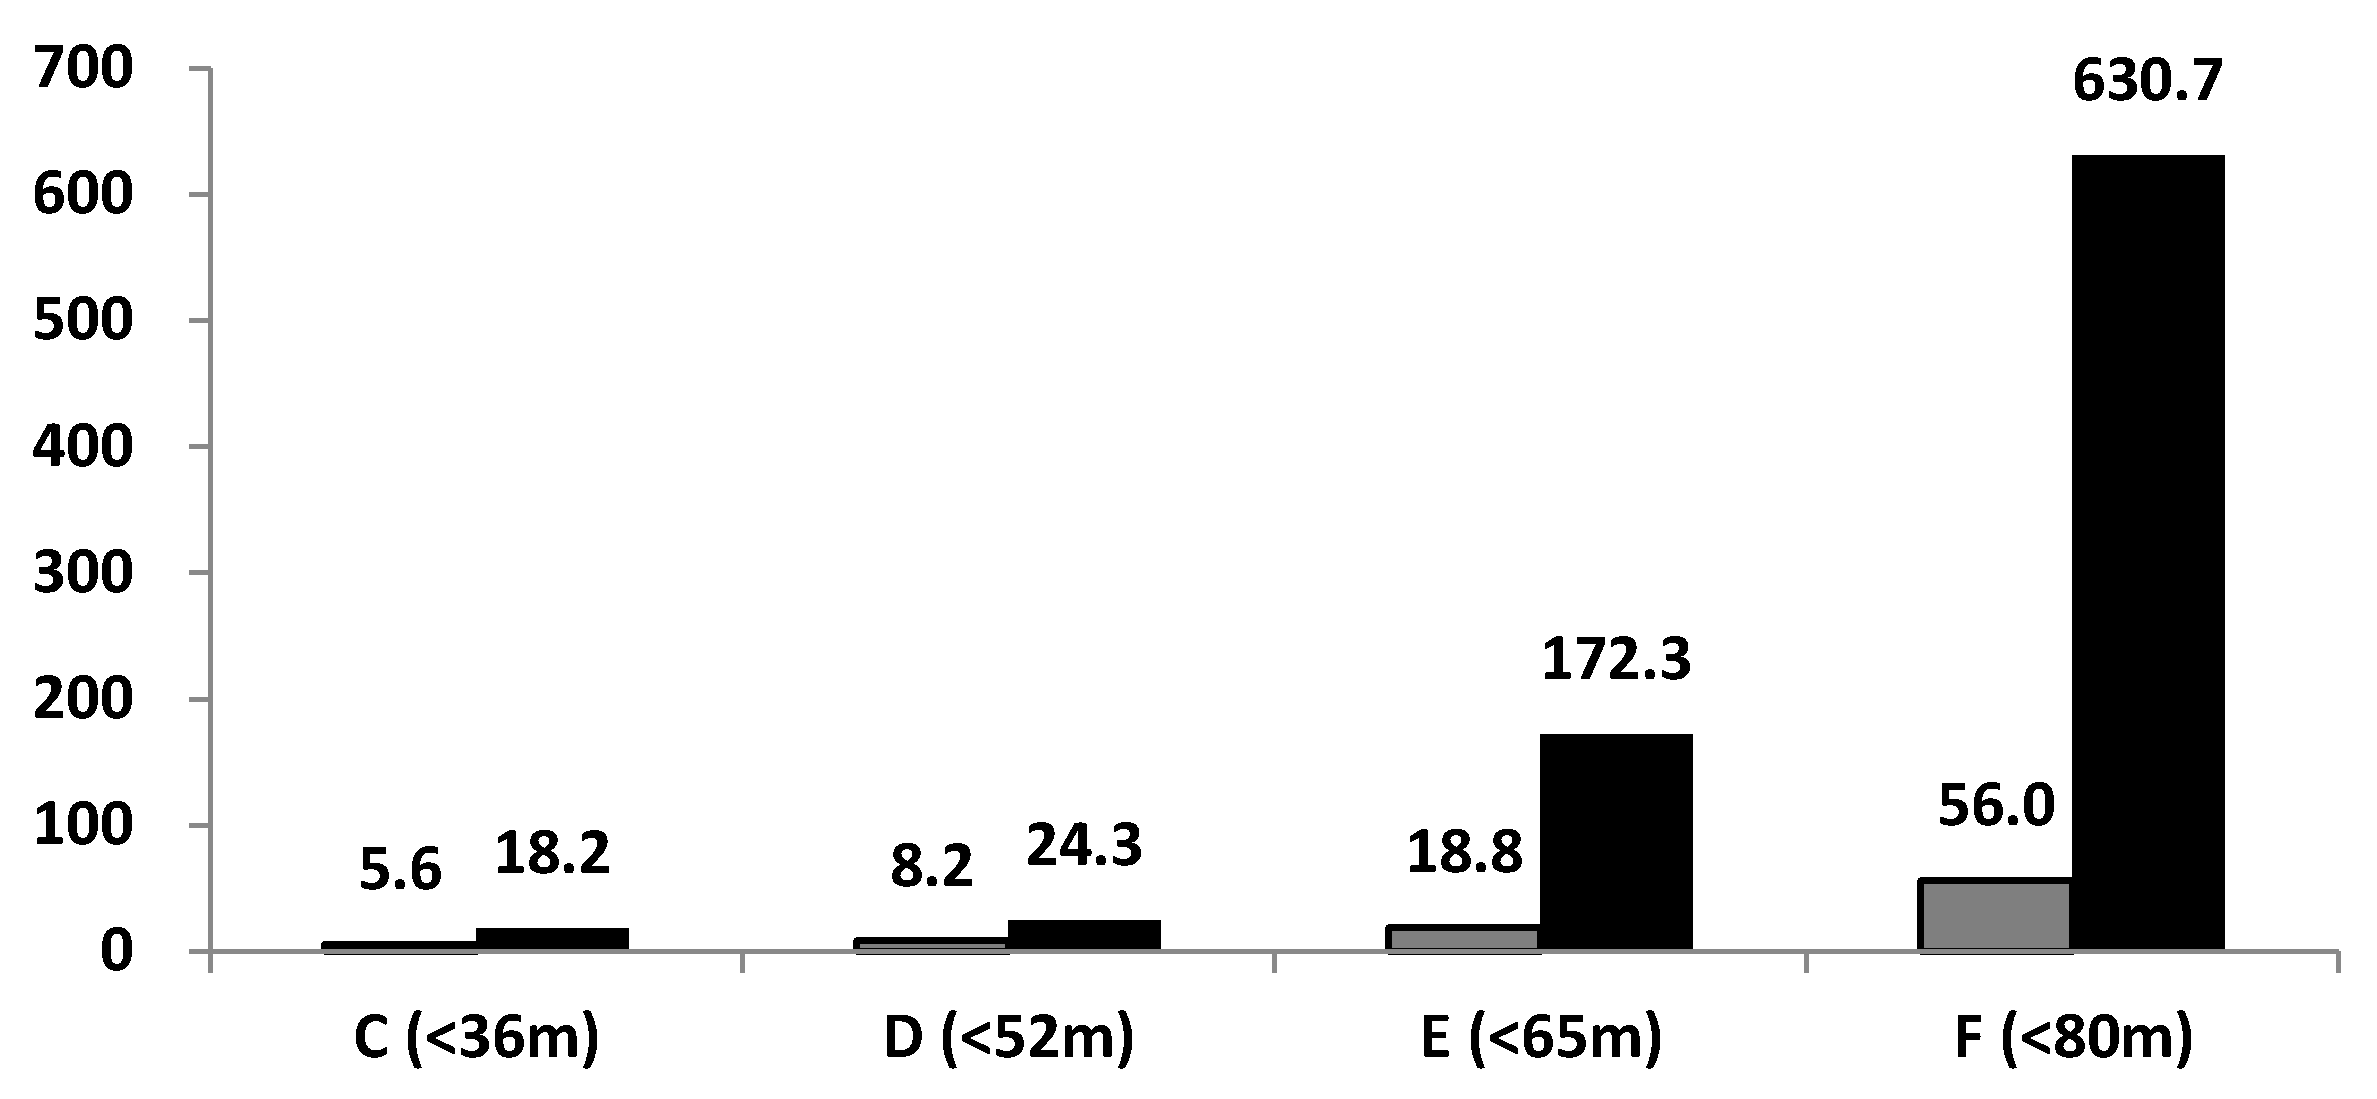
Figure 3 shows the average TAF value for the aircraft sizes presented in Table 5. In Figure 3, the TAF value of C-group aircrafts is 5.6 and 18.2 USD and that of F-group aircraft is 56 and 630.7 USD. This indicates that the use of TAF resulted in large aircrafts gaining 34 times more value than small aircrafts. F-group aircrafts are large, such as B747s and A380s, and the amount of discretionary fuel required to be loaded exceeds that of small aircrafts in the absence of TAF. Adding more discretionary fuel means decreased fuel efficiency, which contributed to improving the TAF value (Equation (3)).
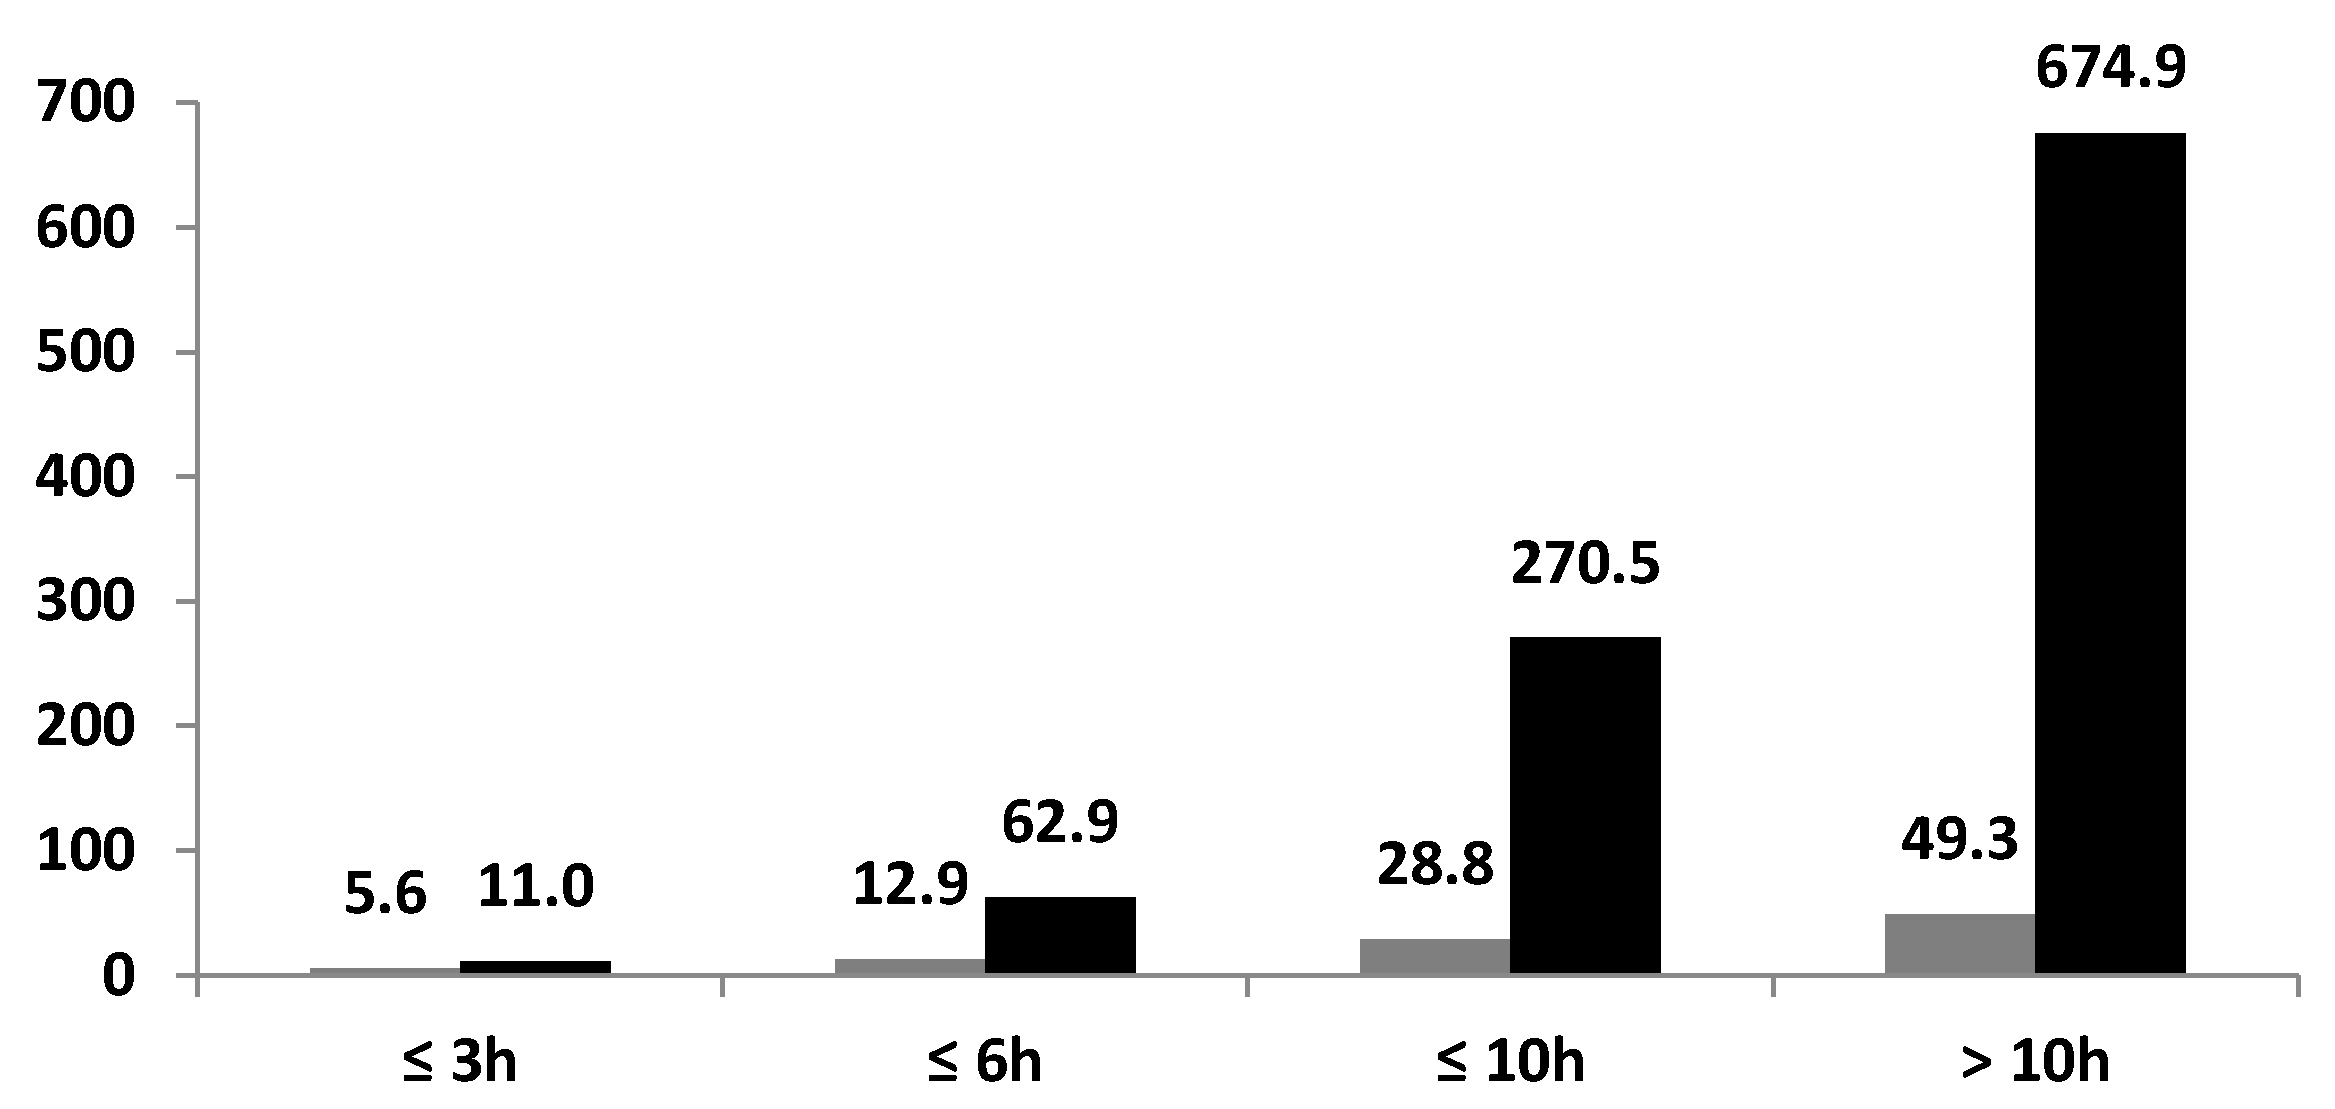
Figure 4 provides results classifying TAF values by flight time. In Figure 4, the TAF value of short-haul flights under three hours averaged 5.6 and 11.0 USD, and the value for long-haul flights exceeding 10 h was 49.3 and 674.9 USD. Changes in TAF values over flight time are associated with TAF values by aircraft size in Figure 3 because long-haul flights often use relatively large aircrafts, and the amount of discretionary fuel that must be loaded equals the increased weight of the aircraft.
The TAF value of 148 USD per flight was applied to the number of international flights arriving at all international airports in Korea (except Incheon Airport). A total of 173,300 international flights arrived in Korea during 2017–2019 at Gimhae (93,007), Gimpo (30,495), Jeju (19,918), Daegu (20,902), Muan (43,397), Cheongju (41,187), Yangyang (391), Ulsan (2), and Pohang (1) airports. A simple extrapolation of the overall TAF value to an international flight at domestic airports is 26 M USD, and the TAF value at all airports in Korea, combined with Incheon, is estimated to be 81 M USD, with an average of 27 M USD per year. However, this assessment is not accurate because it does not consider the reason for deviations and the weather conditions of each airport. A more detailed analysis requires using aviation and meteorological data at each airport.
The TAF value depends linearly on the price of aviation fuel, but that is not all. The performance of the TAF itself affects the benefit. We assumed the “pessimistic” forecast to observe the change in the value using the result of the TAF skill. The pessimistic forecast announces a more low-visibility forecast, even at the risk of an increase in false alarms. The virtual pessimistic forecast could be made by increasing F12 in Table 1. At this time, the maximum value of the pessimistic forecast is the sum of F12 and F22, which means that low visibility is announced every day, even though it does not occur. Table 6 shows how much the TAF value changes relative to the original forecast. Excessive forecasting of low visibility by increasing pessimistic forecasts allows airlines to load more fuel that originally would have been unnecessary, thereby leading to a decline in the TAF value. Excessively optimistic forecasts could also be made as opposed to pessimistic forecasts. Optimistic forecasts help save costs by reducing airlines’ additional fuel payloads. However, if low visibility actually occurs, a loss will also occur. The optimistic forecast can be developed by increasing F21; however, the values of F11 (0.000029) and F21 (0.005076) were so small that significantly analyzing the overall TAF value changes were not possible. However, Gruenigen et al. (2014) explained that airlines do not use overly optimistic forecasts because of safety regulations, even if the use of optimistic forecasts improves TAF values [21].
5.2. CO2 Reduction
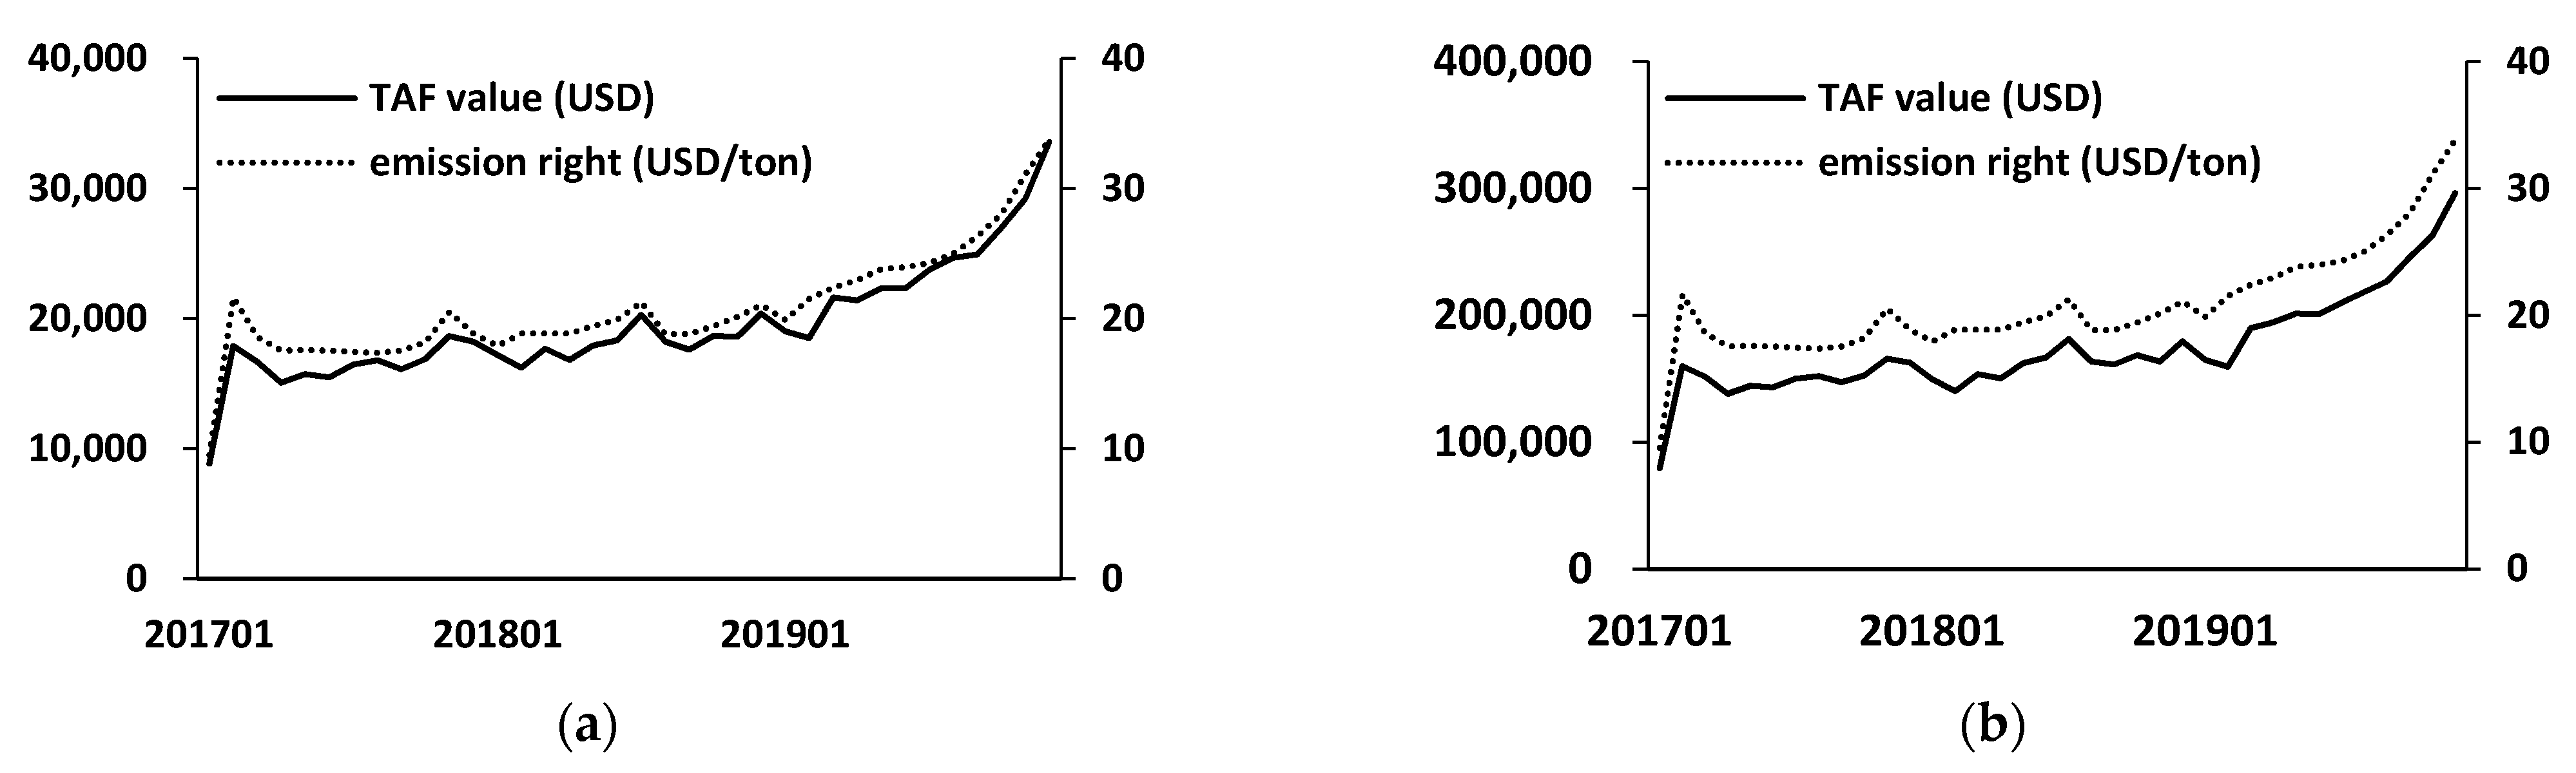
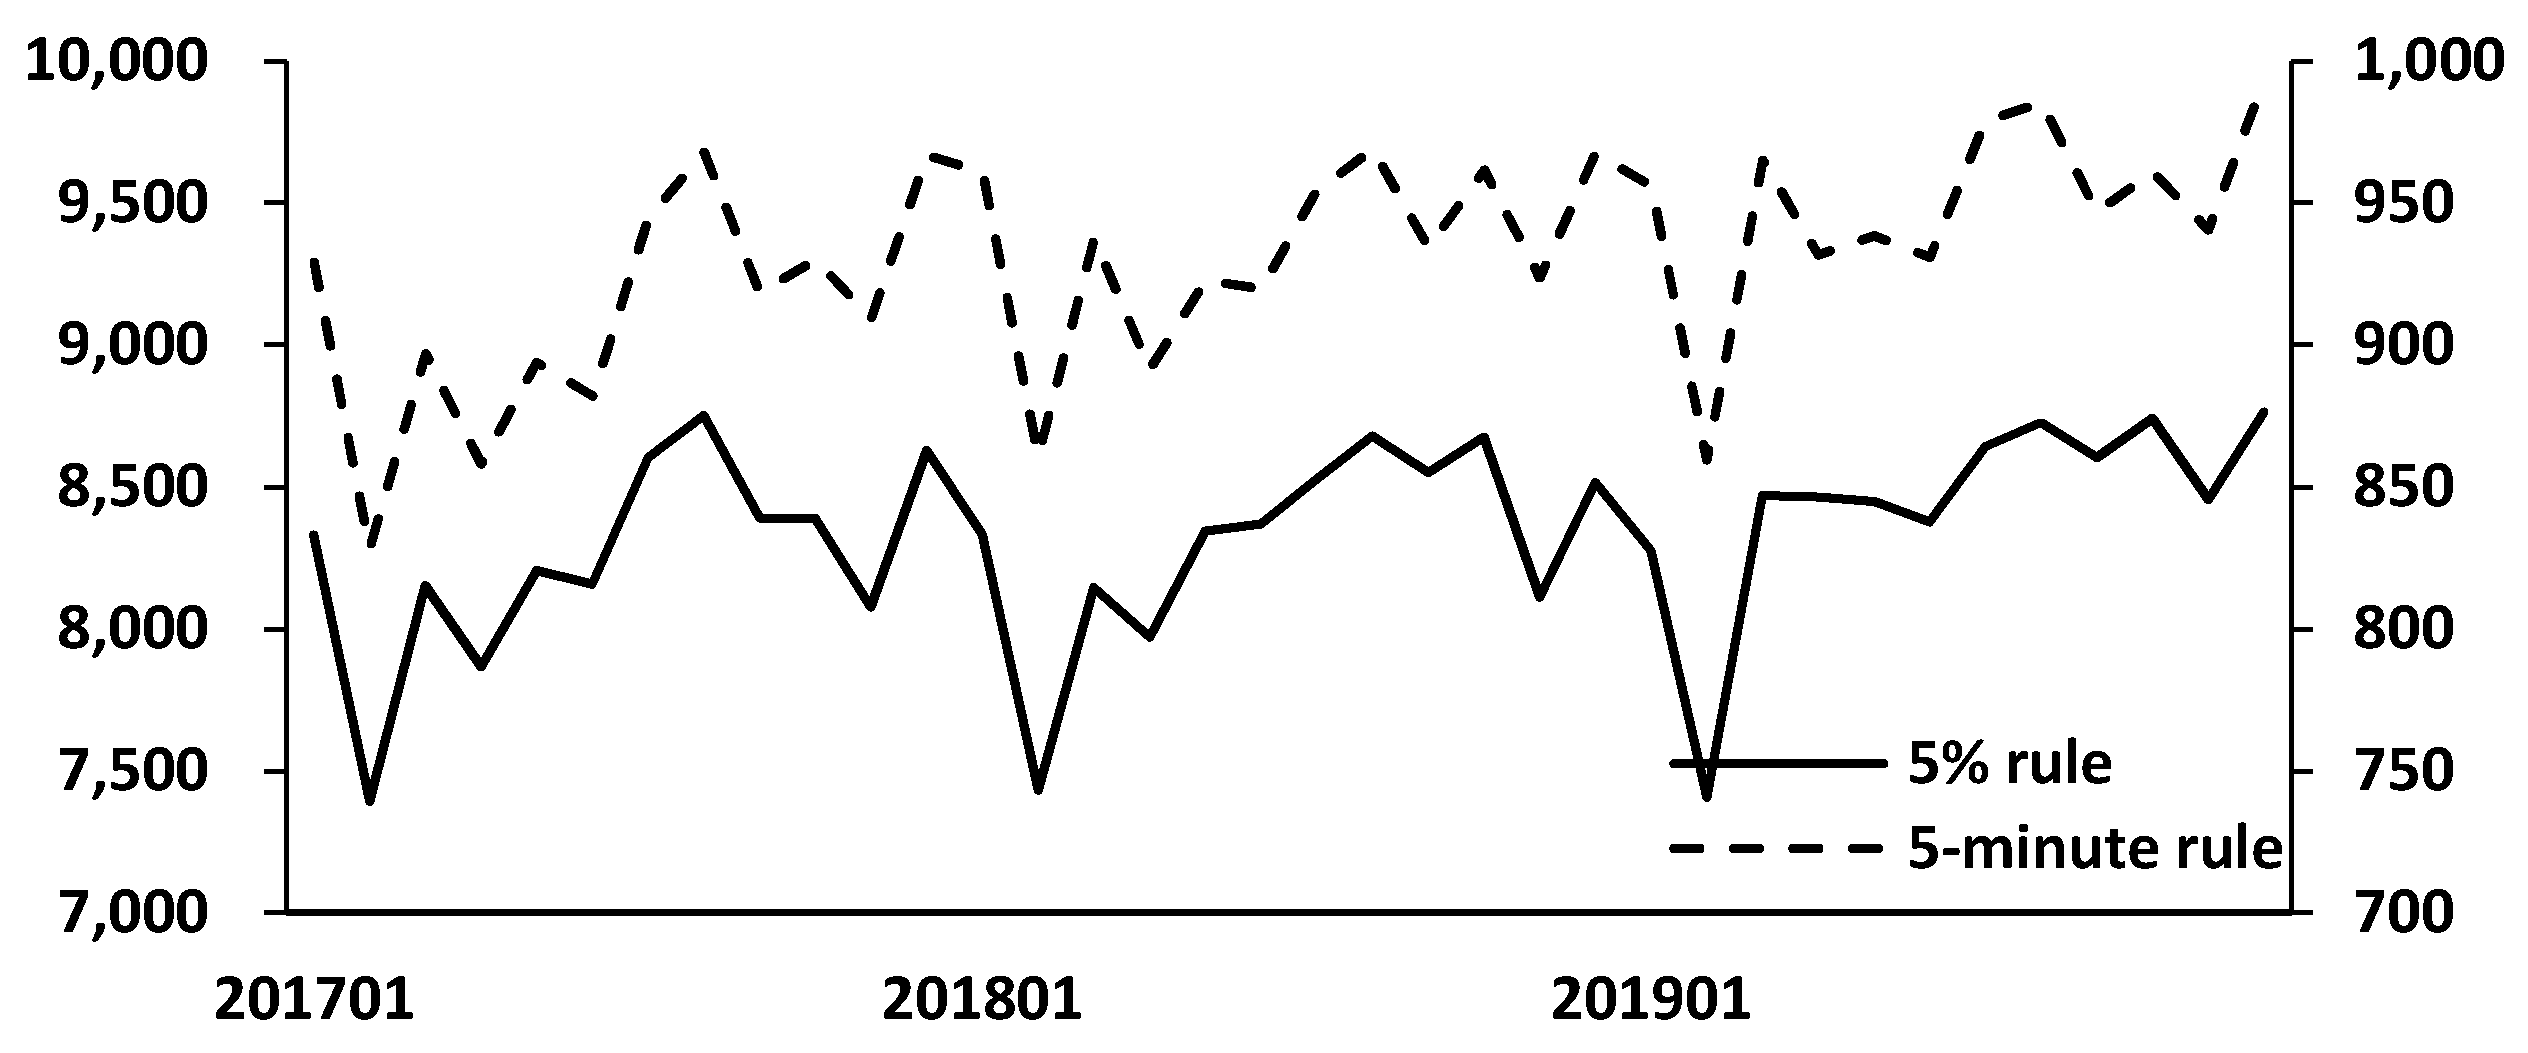
The solid line in Figure 5 shows monthly changes in the value of fuel economy resulting from the use of TAF during 2017–2019. The value of the increased fuel efficiency is 0.7 M USD (5-min rule) and 6.3 M USD (5% rule) during the 2017–2019 period, as much as the reduced discretionary fuel from the utilization of the TAF. This amount represents maximum 2.1 M USD annually, 16 USD per flight and 9 cents per passenger. The value of reduced CO2 emissions was calculated by multiplying the price of emission rights and the monthly amount of emissions. The additional CO2 emissions when TAF is not utilized for three years totaled 33,518 tons (5-min rule) and 299,989 tons (5% rule), and the monthly change is indicated by the dashed line in Figure 6.
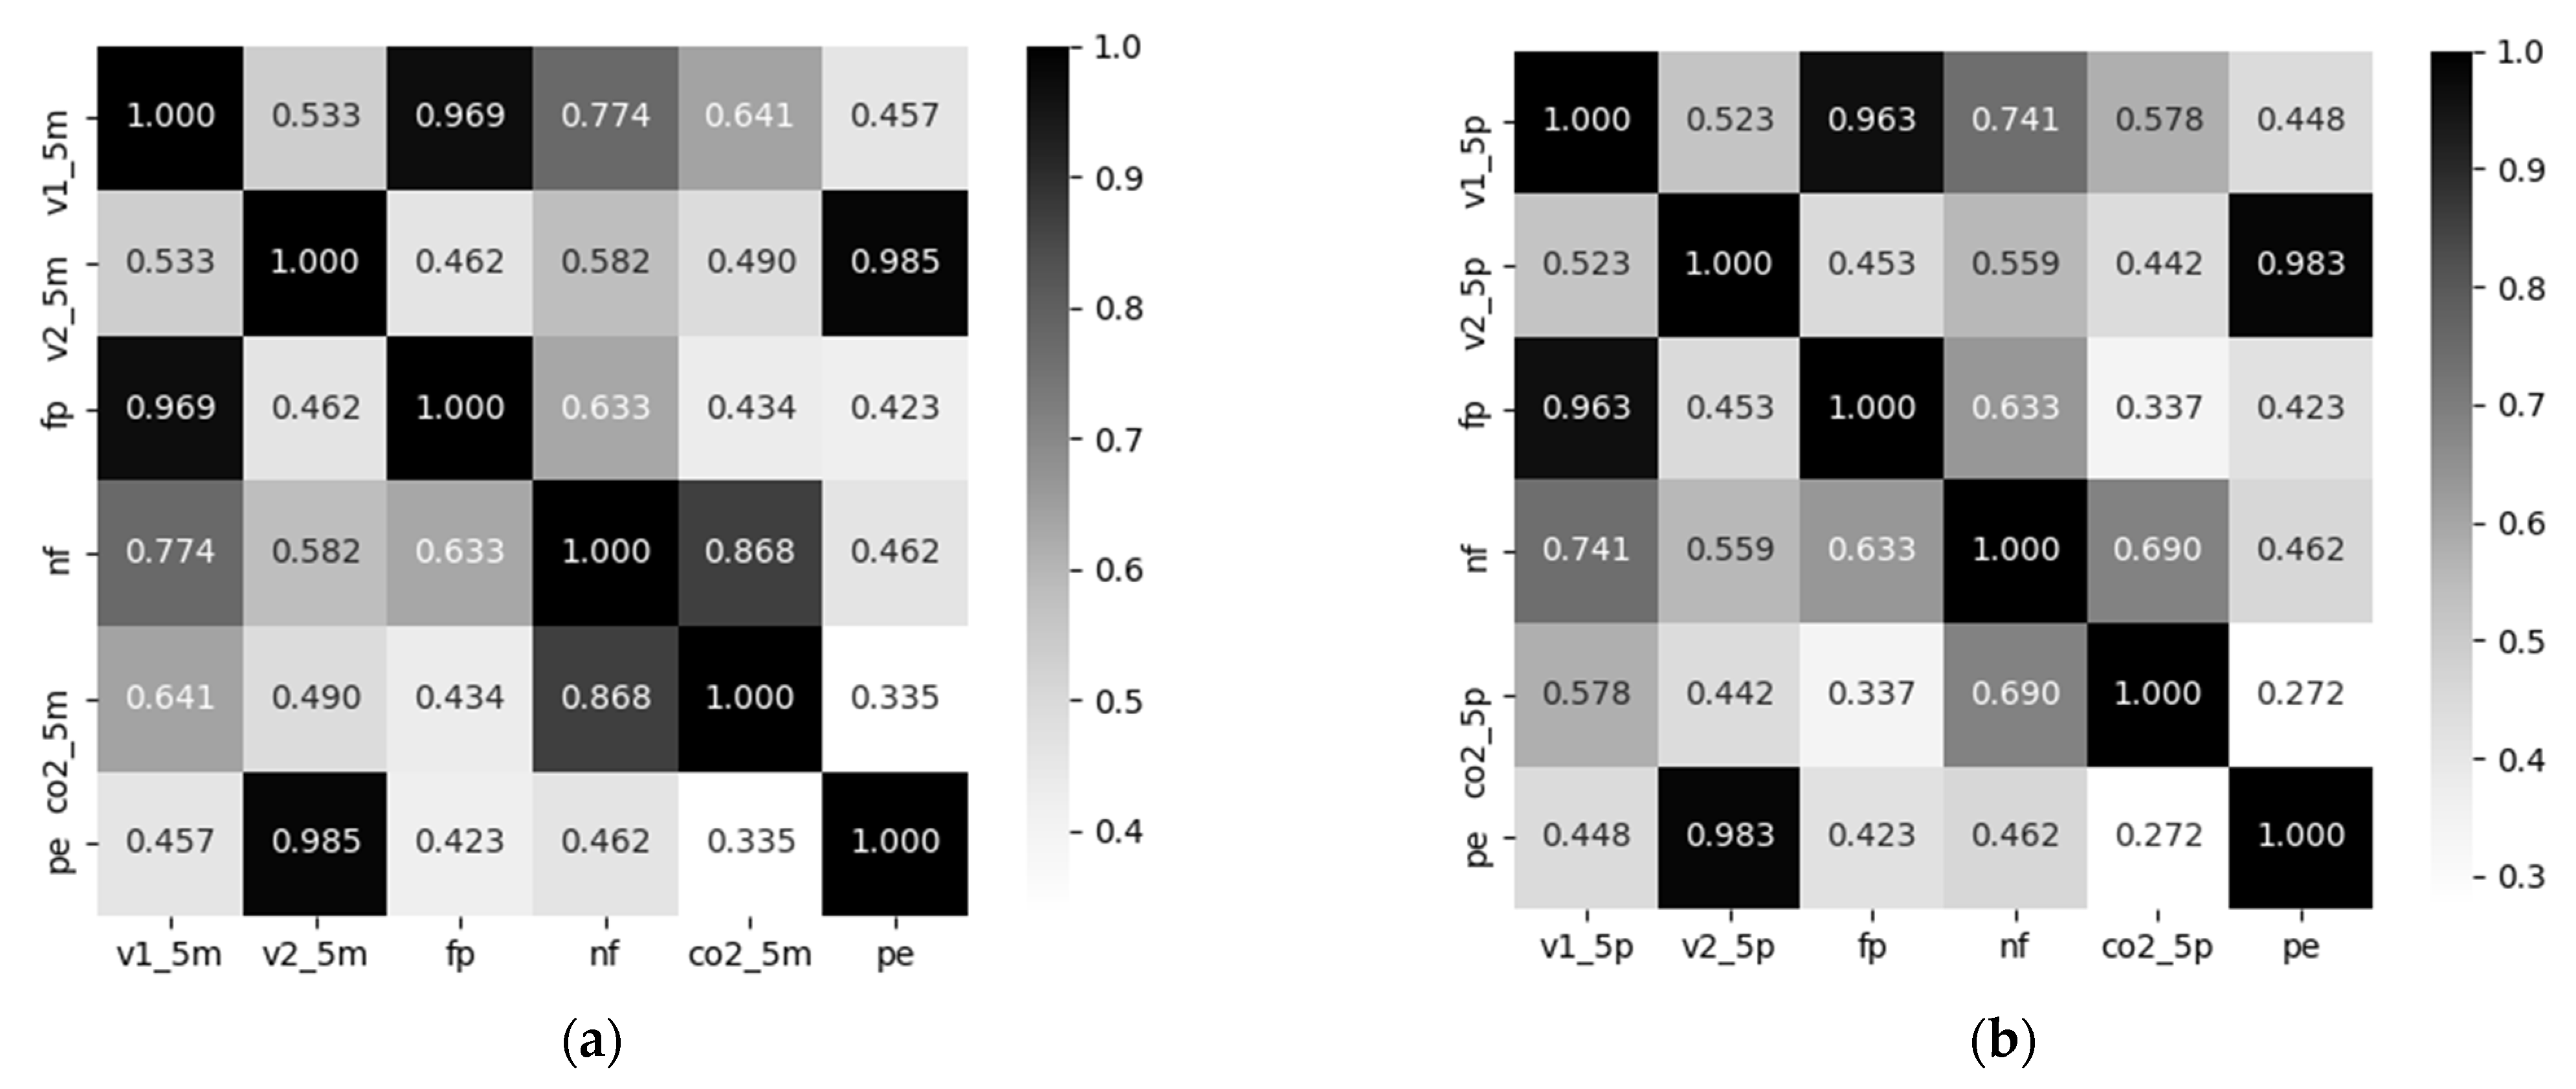
Figure 7 shows the results of correlation analysis between the main variables and TAF value. Fuel price shows a high correlation with the values of fuel economy (>0.96). Additionally, the values in terms of reduced CO2 emissions and the price of emission allowances correlated highly (>0.98). Various benefits were strongly sensitive to “price”. The TAF value can be estimated as being heavily influenced by two price factors—fuel or emission right prices—without dramatic changes in number of flights and CO2 emissions. All correlation coefficients between “value” and “variables” are significant at 99% confidence.
In this study, the variables were generalized. In reality, each flight would have been equipped with discretionary fuel that took into consideration distance, aircraft type, weight, weather conditions, and airline policies. However, the lack of actual flight (planning) data resulted in a collective calculation of discretionary fuel loads based on the aircraft’s fuel economy. The fuel volume required for a five-minute flight was used as basic data for valuations (Table 7).
6. Conclusions
This study quantitatively assessed the economic value that the captain or dispatcher arriving at Incheon Airport could expect by using TAF to predict weather at the airport before departure. The TAF value of fuel efficiency analyzed using a cost–loss model was shown to be 2 M USD and 18 M USD per year. In the result of the 5% rule, the value of flights arriving at Incheon Airport from using the TAF was assessed somewhat higher than that of the precedent study. Gruenigen et al. (2014) estimated the value of TAF utilization by national airlines at 15 M USD at Zurich Airport [21]. One reason might be that the annual average of arrival flights at Incheon Airport (≒125 K) is more than that for Zurich Airport’s arrival flights (≒110 K). However, the difference in TAF values between the two airports could be compounded by various factors, including flight distance, aircraft type and fuel economy, low-visibility criteria, fuel prices, and so on. Therefore, in this study, simple comparisons between the results are not appropriate because of the absence of the airline’s actual operational data, which might be considered the most important. The value of the CO2 emission reduction incurred as a result of overloaded discretionary fuel were assessed at an annual average of 233.2 K USD and 2.1 M USD each. In total, the profits earned from using TAF by all international flights arriving at Incheon Airport between 2017 and 2019 are 2.2 M or 20.1 M USD per year (Table 8).
The charge for using TAF for international aircraft arriving at airports across the country was 1.8 M USD in 2018. This is less than the value of the TAF evaluate based on the 5-min rule. In other words, even if assessed conservatively, the KMA is contributing significantly to the reduction of potential cost expenditure by airlines by providing TAFs. Bade et al. [30] surveyed key stakeholders about using weather information, including airline captains, dispatchers, air traffic managers, and airport maintenance managers. Respondents provided the potential benefits of using weather information to reduce costs through optimal flight route selection and effective handling of diversions/resolutions, reduced winter airport management operating costs (employees, snow removal, and others), and increased air traffic management efficiency through airport overspace optimization [30]. Regardless of the value associated with reducing discretionary fuel information derived from this study, the potential benefits that the respondents provided suggest that TAF can be used as critical data for improving the aviation industry’s safety and profitability. The TAF value can be significantly greater than the annual average of 20.1 M USD, considering that the airspace and foreign national aircraft are excluded from this study and other domestic airports. The meteorological community should use TAF’s economic value information to properly inform the aviation industry of the value of weather information to enhance its understanding of policies, such as fare hikes.
We evaluated TAF values only for Incheon Airport, and a limit exists of not utilizing actual airline flight and flight plan data. An overall value estimation is required by expanding to all domestic airports using airlines’ actual flight plan data. Since the total economic value of TAF covers a considerable range of outcomes (from $2.2 M to $20.1 M), it is necessary to show the form of distribution about potential discretionary fuel-mounted by flight to produce more accurate results. It can be expected that the 5-min rule will apply for short-haul flights and the 5% rule for long-haul flights; however, unfortunately, the relevant data are held by the airlines and generally not disclosed, making analysis difficult. If airlines’ data could be collected, it would be possible to estimate the value of each airline and airport separately for various weather types of meteorological information (e.g., wind) as well as visibility. Nevertheless, the results of this study are meaningful because we derived TAF values where no quantitative assessments were made in Korea; therefore, the results could be utilized as a source to improve awareness of aviation weather information.
Author Contributions
Conceptualization, I.-G.K. and H.-C.L.; data curation, D.-G.L.; formal analysis, I.-G.K.; funding acquisition, B.L.; investigation, H.-M.K. and D.-G.L.; methodology, I.-G.K.; project administration, I.-G.K.; resources, H.-C.L.; software, H.-M.K.; supervision, I.-G.K.; visualization, H.-M.K.; writing—original draft, I.-G.K. All authors have read and agreed to the published version of the manuscript.
Funding
This work was funded by the Korea Meteorological Administration Research and Development Program “Support to Use of Meteorological Information and Value Creation” under Grant (KMA2018-00122).
Institutional Review Board Statement
Not applicable.
Informed Consent Statement
Not applicable.
Data Availability Statement
Data sharing not applicable.
Conflicts of Interest
The authors declare no conflict of interest.
References
- Lee, J.-W.; Ko, K.-K.; Kwon, T.-S.; Lee, K.-K. A Study on the Critical Meteorological Factors Influencing the Flight Cancelation and Delay: Focusing on Domestic Airports. J. Korean Soc. Aviat. Aeronaut. 2011, 19, 29–37. [Google Scholar]
- Lee, J.; Yoo, K.E. Study on Reasonable Discretionary Fuel Management for Aviation. J. Korean Soc. Transp. 2019, 37, 387–398. [Google Scholar] [CrossRef]
- Lee, J.; Jeon, J.-H.; Park, J. A Study on Fuel Saving Measure by Fuel Efficiency Analysis Associated with Weight. J. Korean Soc. Aviat. Aeronaut. 2018, 26, 142–148. [Google Scholar] [CrossRef] [Green Version]
- Lee, E. Thesis on the policy for usage fees for national statistics: Mainly the possibility and ways to be realized. J. Korean Off. Stat. 2000, 5, 82–120. [Google Scholar]
- KMA. Introduction an Aviation Weather Information; [Press Release 8 August 2019]. Available online: http://www.kma.go.kr/notify/press/kma_list.jsp?bid=press&mode=view&num=1193766 (accessed on 16 September 2020).
- Im, T.; Jung, H.J.; Kang, E.Y. The Effects of Policy Understanding on the Perception of Policy Performance by the General Public. Korean Gov. Rev. 2012, 27, 1–30. [Google Scholar]
- Jeong, D.Y. Factors Influencing the Price Acceptability and Cognitive Dissonance for the Purchaser of Digital Knowledge Goods. J. Inf. Syst. 2013, 22, 85–115. [Google Scholar]
- Morss, R.E.; Demuth, J.L.; Lazo, J.K. Communicating Uncertainty in Weather Forecasts: A Survey of the US Public. Weather Forecast. 2008, 23, 974–991. [Google Scholar] [CrossRef]
- Zabini, F.; Grasso, V.; Magno, R.; Meneguzzo, F.; Gozzini, B. Communication and Interpretation of Regional Weather Forecasts: A Survey of the Italian Public. Meteorol. Appl. 2015, 22, 495–504. [Google Scholar] [CrossRef] [Green Version]
- Drobot, S.; Anderson, A.R.S.; Burghardt, C.; Pisano, U.S. Public Preferences for Weather and Road Condition Information. Bull. Am. Meteorol. Soc. 2014, 95, 849–859. [Google Scholar] [CrossRef]
- Hoss, F.; Fischbeck, P. Increasing the Value of Uncertain Weather and River Forecasts for Emergency Managers. Bull. Am. Meteorol. Soc. 2016, 97, 85–97. [Google Scholar] [CrossRef]
- Park, S.Y.; Lim, S.Y.; Yoo, S.H. The Economic Value of the National Meteorological Service in the Korean Household Sector: A Contingent Valuation Study. Sustainability 2016, 8, 834. [Google Scholar] [CrossRef] [Green Version]
- Lin, H.-I.; Liou, J.-L.; Hsu, H.-H. Economic Valuation of Public Meteorological Information Services. A Case Study of Agricultural Producers in Taiwan. Atmosphere 2019, 10, 753. [Google Scholar] [CrossRef] [Green Version]
- Murphy, A.H. Decision-Making Models in the Cost–Loss Ratio Situation and Measures of the Value of Probability Forecasts. Mon. Weather Rev. 1976, 104, 1058–1065. [Google Scholar] [CrossRef] [Green Version]
- Katz, R.W.; Murphy, A.H. Economic Value of Weather and Climate Forecasts; Cambridge University Press: Cambridge, UK, 1997. [Google Scholar]
- Richardson, D.S. Skill and Relative Economic Value of the ECMWF Ensemble Prediction System. Q. J. R. Meteorol. Soc. 2000, 126, 649–667. [Google Scholar] [CrossRef]
- Thornes, J.E.; Stephenson, D.B. How to Judge the Quality and Value of Weather Forecast Products. Meteorol. Appl. 2001, 8, 307–314. [Google Scholar] [CrossRef] [Green Version]
- Mylne, K.R. Decision-Making from Probability Forecasts Based on Forecast Value. Meteorol. Appl. 2002, 9, 307–315. [Google Scholar] [CrossRef]
- Stewart, T.R.; Pielke, R.; Nath, R. Understanding User Decision Making and the Value of Improved Precipitation Forecasts: Lessons from a Case Study. Am. Meteorol. Soc. 2004, 85, 223–236. [Google Scholar] [CrossRef] [Green Version]
- Leigh, R.J. Economic Benefits of Terminal Aerodrome Forecasts (TAFs) for Sydney Airport, Australia. Meteorol. Appl. 1995, 2, 239–247. [Google Scholar] [CrossRef]
- Von Gruenigen, S.V.; Willemse, S.; Frei, T. Economic Value of Meteorological Services to Switzerland’s Airlines: The Case of TAF at Zurich Airport. Weather Clim. Soc. 2014, 6, 264–272. [Google Scholar] [CrossRef]
- Indexmundi. Jet Fuel Monthly Price. Available online: https://www.indexmundi.com (accessed on 1 September 2020).
- EIA. Carbon Dioxide Emissions Coefficients by Fuel. Available online: https://www.eia.gov/environment/emissions/co2_vol_mass.php (accessed on 12 August 2020).
- KRX. ETS Market Information Platform. Available online: https://ets.krx.co.kr/contents/ETS/03/03010000/ETS03010000.jsp (accessed on 12 August 2020).
- MOLIT Flight Safety Regulations for Aeroplanes 8.1.9.15—Minimum Fuel Supply for IFT Flights; Korean Law Information Center: Sejong, Korea, 2016.
- KOTI. Korea’s Aviation Policies; The Korea Transport Institute: Sejong, Korea, 2015. [Google Scholar]
- Ryerson, M.S.; Hansen, M.; Hao, L.; Seelhorst, M. Landing on Empty: Estimating the Benefits from Reducing Fuel Uplift in US Civil Aviation. Environ. Res. Lett. 2015, 10, 1–11. [Google Scholar] [CrossRef] [Green Version]
- ICAO Annex 14. Aerodromes—Volume I; Aerodromes Design and Operations; International Civil Aviation Organization: Montreal, QC, Canada, 2018. [Google Scholar]
- Ku, S. The Related Issues for Introducing Carbon Offsetting and Reduction Scheme for International Aviation; National Assembly Research Service: Seoul, Korea, 2020. [Google Scholar]
- Bade, S.; Grunigen, S.; Ott, W. Der volkswirtschaftliche Nutzen von Meteorologie in der Schweiz—Verkehr und Energie; MeteoSchweiz: Zurich, Switzerland, 2011. [Google Scholar]
Figure 1.
Conceptual diagram for decision progress to calculate the TAF value.

Figure 2.
Change in monthly TAF value in terms of fuel efficiency (line) and fuel prices (dotted) for 2017–2019; (a) and (b) are the results of 5-min rule and 5% rule, respectively.
Figure 2.
Change in monthly TAF value in terms of fuel efficiency (line) and fuel prices (dotted) for 2017–2019; (a) and (b) are the results of 5-min rule and 5% rule, respectively.

Figure 3.
Economic value of TAF for aircraft size. The gray bar indicates the value of the 5-min rule, and the black bar denotes the value of the 5% rule (unit: USD).
Figure 3.
Economic value of TAF for aircraft size. The gray bar indicates the value of the 5-min rule, and the black bar denotes the value of the 5% rule (unit: USD).

Figure 4.
Economic benefit for flight duration categories. The gray bar indicates the value of the 5-min rule, and the black bar denotes the value of the 5% rule. (unit: USD).
Figure 4.
Economic benefit for flight duration categories. The gray bar indicates the value of the 5-min rule, and the black bar denotes the value of the 5% rule. (unit: USD).

Figure 5.
Change in monthly TAF value in terms of reduction in CO2 emissions (solid) and price of emission right (dotted) for 2017–2019 (unit: USD); (a) and (b) are the results of 5-min rule and 5% rule, respectively.
Figure 5.
Change in monthly TAF value in terms of reduction in CO2 emissions (solid) and price of emission right (dotted) for 2017–2019 (unit: USD); (a) and (b) are the results of 5-min rule and 5% rule, respectively.

Figure 6.
Change in additional monthly CO2 emissions for 2017–2019 (unit: ton).

Figure 7.
Results of Pearson’s correlation analysis for the investigated variables; (a) and (b) are the results of 5-min rule and 5% rule, respectively. (v1 indicates a value of fuel efficiency, v2 = value of CO2 reduction, 5m = result of 5-min rule, 5p = result of 5% rule, fp = fuel price, nf = number of flights, co2 = amount of emission, and pe = price of emission allowances).


Table 1.
2 × 2 contingency table including forecast error type, cost–loss values, and relative frequencies of forecasted and observed weather conditions.
Table 1.
2 × 2 contingency table including forecast error type, cost–loss values, and relative frequencies of forecasted and observed weather conditions.
| Load Additional Fuel/Forecasted Weather Conditions | Total | |||
|---|---|---|---|---|
| Yes/Adverse | No/Good | |||
| Observed severe weather | Yes | Hit, C1, F11 | Miss, L, F21 | F01 |
| No | False Alarm (FA), C2, F12 | Correct Rejection (CR), 0, F22 | F02 | |
| Total | F10 | F20 | 1 | |
Table 2.
Source of row data and contents by elements.
| Data | Source | Contents |
|---|---|---|
| Aviation | SROA (Seoul Regional Office of Aviation) |
|
| ||
| ||
| Naver |
| |
| Boeing, Airbus |
| |
| Meteorology | KMA |
|
| Price | IndexMundi |
|
| KRX (Korea Exchange) |
|
Table 3.
Aircraft specifications collected from Boeing and Airbus official websites.
| ICAO Code | Flight Range (km) | Fuel Capacity (gal) | Fuel Economy (gal/km) | ||
|---|---|---|---|---|---|
| A220 | 100 | 6297 | 5761 | 0.91 | 0.92 |
| 300 | 6204 | 5682 | 0.92 | ||
| A320 | 318 | 5750 | 6396 | 1.11 | 1.11 |
| 319neo | 6850 | 7062 | 1.03 | ||
| 320neo | 6300 | 7062 | 1.12 | ||
| 321neo | 7400 | 8703 | 1.18 | ||
| A330 | 200 | 13,450 | 36,748 | 2.73 | 2.76 |
| 300 | 11,750 | 36,748 | 3.13 | ||
| 800 | 15,094 | 36,748 | 2.43 | ||
| 900 | 13,334 | 36,748 | 2.76 | ||
| A350 | 900 | 15,000 | 37,252 | 2.48 | 1.70 |
| 1000 | 46,100 | 42,008 | 0.91 | ||
| A380 | 380 | 14,800 | 84,544 | 5.71 | 5.71 |
| B737 | 600 | 5990 | 26,020 | 1.15 | 1.18 |
| 700 | 6380 | 26,020 | 1.08 | ||
| 800 | 5710 | 26,020 | 1.20 | ||
| 900ER | 5990 | 29,660 | 1.31 | ||
| B747 | 8F | 7630 | 226,095 | 7.83 | 6.10 |
| 8I | 14,430 | 238,610 | 4.37 | ||
| B767 | 300ER | 11,070 | 90,770 | 2.17 | 2.17 |
| B777 | 300ER | 14,490 | 181,280 | 3.31 | 3.07 |
| 200LR | 17,205 | 202,570 | 3.11 | ||
| B787 | 8 | 13,620 | 126,206 | 2.45 | 2.69 |
| 9 | 14,140 | 126,372 | 2.57 | ||
| 10 | 11,910 | 126,372 | 3.05 | ||
Table 4.
Cost-to-carry factor on fuel consumption of take-off weight and distance by aircraft types.
Table 4.
Cost-to-carry factor on fuel consumption of take-off weight and distance by aircraft types.
| Analyzed Aircraft Type in This Study | Estimated Aircraft Type in the Precedent Study [27] | Variable | |
|---|---|---|---|
| Weight (m) | m × d (Distance) | ||
| A220 | A320 | 0.019 | 4.644 × 10⁻⁵ |
| A320 | |||
| A330 | A330-200 | 0.025 | 2.878 × 10⁻⁵ |
| A350 | B777 | 0.028 | 3.032 × 10⁻⁵ |
| B777 | |||
| B787 | |||
| A380 | B747-400 | 0.027 | 3.327 × 10⁻⁵ |
| B747 | |||
| B737 | B737-800 | 0.021 | 5.476 × 10⁻⁵ |
| B767 | B767-300 | 0.020 | 4.463 × 10⁻⁵ |
Table 5.
Aircraft types of ICAO separated by width.
| Code | Width | Aircraft Type |
|---|---|---|
| A | <15 m | PIPER PA-31/CESSNA 404 Titan |
| B | <24 m | BOMBARDIER Regional Jet CRJ-200/DE HAVILLAND CANADA DHC-6 |
| C | <36 m | BOEING 737-700/A320/EMBRAER ERJ 190-100/A220/A321/CS3/CCX (GL5T, GLEX) |
| D | <52 m | B767 Series/A310 |
| E | <65 m | B777 Series/B787 Series/A330 Family/A350 |
| F | <80 m | BOEING 747-8/A-380-800 |
Table 6.
Relative change in TAF value with hypothetical pessimistic forecasts.
| Relative Frequency of Pessimistic Forecasts (F12) | 0.04% | 10% | 30% | 50% | 70% | 99% |
| Relative TAF Value Compared with Original Benefit | 100.00% | 90.04% | 70.03% | 50.02% | 30.01% | 10.00% |
Table 7.
Amount of fuel during a five-minute flight for a range of aircraft types.
| Type | Fuel Volume (Gallon/5 min) |
|---|---|
| A220 | 32.0 |
| A320 | 38.9 |
| A330 | 96.7 |
| A350 | 59.4 |
| A380 | 199.9 |
| B737 | 41.5 |
| B747 | 213.4 |
| B767 | 75.8 |
| B777 | 107.3 |
| B787 | 94.2 |
Table 8.
Comprehensive summary of economic value of TAF at Incheon Airport.
| 2017–2019 | 5-min Rule | 5% Rule | ||
|---|---|---|---|---|
| Fuel Efficiency | CO2 Reduction | Fuel Efficiency | CO2 Reduction | |
| Annual value | 2 M USD (2.4 B KRW) | 233.2 K USD (271.8 M KRW) | 18 M USD (21.5 B KRW) | 2.1 M USD (2.4 B KRW) |
| Value per flight | 16.5 USD (19.3 K KRW) | 1.9 USD (2.2 K KRW) | 147.8 USD (172 K KRW) | 16.7 USD (19.5 K KRW) |
| Value per passenger | 0.09 USD (106.9 KRW) | 0.01 USD (12.1 KRW) | 0.82 USD (956.2 KRW) | 0.09 USD (108.1 KRW) |
| Total value | 6.2 M USD (7.2 B KRW) | 699.6 K USD (815.3 M KRW) | 55 M USD (64.5 B KRW) | 6.3 M USD (7.3 B KRW) |
Publisher’s Note: MDPI stays neutral with regard to jurisdictional claims in published maps and institutional affiliations. |
© 2021 by the authors. Licensee MDPI, Basel, Switzerland. This article is an open access article distributed under the terms and conditions of the Creative Commons Attribution (CC BY) license (https://creativecommons.org/licenses/by/4.0/).
Share and Cite
MDPI and ACS Style
Kim, I.-G.; Kim, H.-M.; Lee, D.-G.; Lim, B.; Lee, H.-C. Economic Value of Terminal Aerodrome Forecasts at Incheon Airport, South Korea. Sustainability 2021, 13, 6965. https://0-doi-org.brum.beds.ac.uk/10.3390/su13126965
AMA Style
Kim I-G, Kim H-M, Lee D-G, Lim B, Lee H-C. Economic Value of Terminal Aerodrome Forecasts at Incheon Airport, South Korea. Sustainability. 2021; 13(12):6965. https://0-doi-org.brum.beds.ac.uk/10.3390/su13126965
Chicago/Turabian StyleKim, In-Gyum, Hye-Min Kim, Dae-Geun Lee, Byunghwan Lim, and Hee-Choon Lee. 2021. "Economic Value of Terminal Aerodrome Forecasts at Incheon Airport, South Korea" Sustainability 13, no. 12: 6965. https://0-doi-org.brum.beds.ac.uk/10.3390/su13126965
Note that from the first issue of 2016, this journal uses article numbers instead of page numbers. See further details here.