
Indicators of the Tourist Attractiveness of Urban–Rural Communes and Sustainability of Peripheral Areas


Department of Economy Competitiveness, Faculty of Economics, Uniwersytet Warmińsko-Mazurski w Olsztynie, 10-719 Olsztyn, Poland
*
Author to whom correspondence should be addressed.
Sustainability 2021, 13(12), 6968; https://0-doi-org.brum.beds.ac.uk/10.3390/su13126968
Submission received: 23 April 2021
/
Revised: 9 June 2021
/
Accepted: 15 June 2021
/
Published: 21 June 2021
(This article belongs to the Special Issue Micro and Macroeconomic Determinants of Productivity Growth and Long-Term Sustainable Development in Central European Economies)
Abstract
:The elements which determine a peripheral area’s level of tourist attractiveness, such as tourist infrastructure and tourist values, should be developed in urban–rural communes in peripheral areas, where tourism may be one of the forces capable of stimulating sustainable development. This study covered urban–rural communes of the province of Warmia and Mazury in Poland. Urban–rural communes are specific areas where urban–rural linkages are often important. The research was carried out in accordance with Hellwig’s taxonomic development pattern method. The study found no complementary relationship between tourism values and tourism infrastructure with regards to creating tourism attractiveness. Tourism attractiveness was found to be more affected by tourism infrastructure. However, in units with larger urban centers, tourist values were found to significantly contribute to tourist attractiveness. The presented results provide a good basis for further research on the impact of global trends on regional development. At the same time, the analyzed framework provides guidance for ensuring the development of local tourism, and the study’s suggested priorities and measures could lead to the development of tourism in peripheral regions, which should in turn attract new investments, create new jobs, and thus develop the economy and the welfare of the population.
1. Introduction and Literature Review
Peripheral regions, regardless of the methodology adopted for their determination, are defined as marginal, problem regions. The definition of peripherality has constantly evolved as different theoretical discourses have introduced and emphasized different concepts in explaining peripherality [1] (p. 177). From an economic point of view, peripheral areas are characterized by poor economic development. In the European Union’s cohesion policy, the criterion for the economic peripherality of regions is a low level of economic development measured in terms of GDP per capita. Regions which do not reach 75% of the EU average GDP per capita are classified as peripheral. Regions with low levels of economic development are characterized by a traditional economic structure and poor production structure [2] (p. 7).
These are the features of the province of Warmia and Mazury, and according to data provided by Statistics Poland, its GDP per capita in 2018 reached only 69% of the national average per capita [3].
The European Union’s cohesion policy aims to reduce disparities through the implementation of priorities. These include sustainable development, which involves using regional resources as efficiently as possible. One possibility is to support the development of tourism. This study analyzed urban–rural communes located in Warmia and Mazury, in which resources (natural, cultural) are very diverse. These communes usually consist of a small town with a surrounding rural area. The town is the administrative and economic center as well as an educational center, although the schools are at a secondary level, at most. The villages closest to the town form a so-called continuum. Infrastructure from city centers still usually reaches here and the population is partly employed in the city. Outside this area, the mainly agricultural function of the village develops. The continuum has long been described, initially in sociology [4] (pp. 294–308). Currently, it is also found within the scope of interest for economists studying peripheral areas. Theories addressing the promotion of peripheral development include: localization theories [5] (pp. 24–29), Keynesian doctrines [6] (p. 28), the theory of the big push [7] (pp. 359–369), Perroux’s growth poles theory [8] (pp. 181–184), Hirschman’s sector-regional polarization theory [9] (pp. 77–89), and Prebisch’s center-and-periphery theory [10] (pp. 42–72) and sustainable development theory [11] (pp. 101–110). Peripherality is the subject of analysis by economists and geographers interested in regional disparities and the location of economic activity in them [12] (pp. 1–79), [13] (pp. 838–855), [14] (pp. 457–466). All peripheral regions face serious economic challenges, and one of the avenues of improving their economic situation is through the development of tourism in those areas. It should be taken into account, however, that despite the specificity of peripheral areas, it is a global problem occurring all over the world. Economic and social problems in peripheral areas may be similar in some parts or differ depending on the country. In France, Austria, Sweden, Switzerland, and the Netherlands, the population in these areas is aging. In Finland, Norway, and Sweden, for example, the population is decreasing [15] (pp. 1–112). In some countries (e.g., Germany, Sweden, Switzerland, and Poland) it is mainly young people—often women—who leave the peripheral areas, not only in search of work but also for better educational and social opportunities, although in some countries (e.g., France, Norway, and the United Kingdom) some peripheral areas record a migration, often of middle-aged or older people, seeking a better quality of life [15] (pp. 1–112), [16] (pp. 9–84), [17] (pp. 1–40), [18] (pp. 6–146), [19] (pp. 1–64).
Tourism can be one of the development opportunities for such peripheral areas, especially if this peripherality results from special geographic conditions that can be exploited in tourism. In the world literature there are examples of peripheral areas in many economically well developed countries. An example of this is Scotland. The city of Aberdeen and its environs benefit from the influence of a relatively thriving oil industry, while more remote areas to the north and west show many peripheral tendencies. This juxtaposition of two contrasting operating environments in a peripheral area highlights the unique challenges of tourism development in this part of the world [20] (pp. 161–181).
Another example is the city of Mértola in Portugal, which has a peripheral area with few opportunities and a structural crisis. Historical heritage, its conservation, and tourism value have been transformed into a comparative advantage [21] (pp. 1–27).
Without going into the details of the various theories that have emerged throughout history, special attention, in view of contemporary priorities, should be given to the theory of sustainable development, which assumes “development that meets the needs of the present without compromising the ability of future generations to meet their own needs” [22]. The concept of sustainability, in the context of tourism, began to appear in world literature in the late 1980s and early 1990s [23] (pp. 77–92), [24] (pp. 315–326), [25] (p. 528), [26] (pp. 179–181). At the same time, Sustainable Development Goal 8 of the UN 2030 Agenda for Sustainable Development [27] recommends promoting stable, sustainable, and inclusive economic growth, full and productive employment, and decent work for all people. Therefore, tourism in peripheral areas, provided that adequate resources and infrastructure are available, can support sustainable development, leading to better socio-economic development and quality of life. An example of a peripheral area where numerous economic, environmental, and social problems have been identified in relation to tourism development in peripheral regions is Cape York Peninsula (Australia). These include large economic losses due to tourism spending, difficulties in providing and maintaining tourism infrastructure, and managing environmental and social impacts. The social problems identified were mainly due to social conflicts with the indigenous population. This shows how important it is to identify the factors affecting tourism development in an area [28] (pp. 517–534). If the economic benefits of tourism are largely derived outside the region from tourism, and local communities have to endure the negative impact of the industry, reluctance to continue tourism development will be inevitable. In 1986, Cape York became a proposed spaceport location that a consortium of companies, the Cape York Space Agency, promoted with the support of the federal government. In 1992, investor support collapsed and in 2017, the land earmarked for the development was officially given back to the indigenous people. This halted the planned infrastructure development on the one hand, and, on the other, preserved the naturalness of the area and its special character for lovers of camping, hiking, bird watching, and fishing [28] (pp. 517–534)
Tourism is one of the most dynamically developing branches of the tertiary sector of the economy in the world, with the industry accounting for more than 10.4% of the global GDP in 2019 [29,30] (pp. 95–116). Therefore, it deserves to be recognized as a key element of social and economic development in the 21st century. The tourist function can be performed by areas considered to be attractive for tourists, i.e., those characterized by a set of present values contributing to the presence of tourist traffic on their territory. The economic significance of tourism leads to its perception in terms of a phenomenon [31] (pp. 240–248).
Until recently, however, this research has focused on successful core regions, assuming that tourism in peripheral areas is likely to develop on a smaller, insignificant scale. This view is increasingly being challenged, as reflected in the growing number of papers, special issues, and edited volumes devoted to tourism development in peripheral areas away from agglomerations [20] (pp. 161–181), [28] (pp. 517–534). Consequently, this rapidly evolving field requires critical study. Our own research goes beyond well-known examples.
The research problem is to identify urban–rural linkages and their impact on tourism development. They may be more important than otherwise assumed. This paper asks which of two elements, tourism values or tourism infrastructure, has a greater impact on tourism development in urban–rural communes in peripheral areas. This is particularly important considering the specificity of urban–rural communes, which combine two types of areas with a single decision-making center at the local government level. According to the center-periphery theory, urban areas may constitute a source of development for peripheral areas.
Knowledge of the elements determining the volume of tourist traffic in a given area allows these areas to be shaped more consciously and effectively and has a positive impact on developing the tourist potential of an area, and thus its sustainable development.
Depending on the level of development achieved in a given area, the determinants of its tourist attractiveness will vary. These differences also result from the character of a given place. Further, urban areas will have certain determinants of tourist attractiveness that differ from rural areas.
This study analyzed the elements that determine an area’s level of tourist attractiveness (tourist infrastructure or tourist values) to determine which of these should be supported in urban–rural communes in peripheral areas where tourism could be one of the factors enabling sustainable development.
It is important to clarify that the research did not analyze indicators reflecting the development of sustainable tourism [32] (pp. 124–131), [33] (pp. 862–879), although the study used sustainability indicators [34] (pp. 39–47), [35] (pp. 1274–1289), which describe general phenomena and which can be employed for describing tourist values and infrastructure.
Variables characterizing both tourism qualities and the condition of tourist infrastructure present in the commune were identified based on a literature review [36] (pp. 41–45), [37] (pp. 12–23), [38] (pp. 27–59), [3]. The study focused on urban–rural communes of the province of Warmia and Mazury in Poland.
Due to the resources present on its territory, the province of Warmia and Mazury is perceived as attractive for tourists. Numerous authors have studied the tourist potential of the area (see: [39] (pp. 61–73), [40] (pp. 257–286), [41] (pp. 215–225), [42] (pp. 165–172). At the same time, it is a province with one of the lowest levels of social and economic development [43] (pp. 487–507), [44] (pp. 267–287), [45] (pp. 203–224). As indicated by the above-mentioned research, Warmia and Mazury is a peripheral region in economic terms, sparsely populated, at risk of poverty and social exclusion, with poorly developed infrastructure. However, it is rich in tourist attractions arising from the presence of natural areas attractive from the point of view of tourism: forests, surface waters, and large areas of legally protected Natura 2000 sites. Qualified tourism forms related to water activities and hiking, as well as rural tourism, are developing here. The problem lies in seasonality. The development of tourist infrastructure could improve accessibility, not only in terms of territory, but also by extending the tourist season.
Tourist attractiveness constitutes a point of interest for many researchers, both in Europe [46] (pp. 178–194), [47] (pp. 631–637), [48] (pp. 1408–1413) and in individual countries [49] (pp. 27–31), [50] (pp. 306–310), [51] (pp. 84–90), [52] (pp. 67–79) and regions [53] (pp. 44–57), [54] (pp. 81–90). The considerable interest in the subject of tourist attractiveness stems from the importance of tourism as an element of social and economic development. It is important to stress that there are various ways of measuring the level of tourist attractiveness, depending on the methodology used.
Examples of other methods include survey studies based on the satisfaction of tourists visiting a given place. In the opinion of Ghose and Johann [55] (pp. 9–22), tourist attractions, culture, and safety all positively affect both tourists’ satisfaction and recommendations. A statistically significant correlation has also been obtained between tourist attractiveness and the number of tourists who visited the National Parks in Vietnam, using the method of multicriteria decision analysis with the stochastic multicriteria acceptability analysis (SMAA), and the preference ranking organization method for enrichment of evaluations (PROMETHEE) [56] (pp. 51–80).
Tourist attractiveness is one of the determinants of the level of tourism competitiveness of an area [57] (pp. 336–344). Its determinants include: the number and rank of tourist values (natural and cultural), the number and quality of tourist facilities (accommodation and catering and associated facilities), communication facilities, and the condition of the natural environment [58] (pp. 1–21). These factors also shape the image of a given place, interpreted as a set of potential tourists’ opinions on a given place [59] (pp. 58–79). This perception affects the competitiveness of a given place, while the image-shaping strategy of the region constitutes an essential factor in its development [60] (pp. 333–343).
In this article, attractiveness is defined as a combination of tourist values present in a given area and tourist infrastructure, i.e., facilities and services contributing to the volume of tourist traffic in the area.
It should be explained that in the Anglo-Saxon literature, the equivalent of a tourist value is a tourist attraction, understood as anything that “makes tourists leave their homes” [61] (p. 554), [62] (p. 262). However, this study assumes that the concept of attraction is a broader idea than just tourist values themselves [63] (pp. 367–384). Values are a part of tourist attractions. In the study, tourism values were defined after Leiper [64] (pp. 367–384) as the nucleus of the attraction system, which he saw as “any feature or characteristic of a place that a traveler contemplates visiting or actually visits” (e.g., location, view, person, cultural element, or natural resource). In addition to the nucleus, Leiper’s tourist attraction system also included a tourist and an information element.
Infrastructure is defined as physical facilities of direct relevance to tourism and includes recreational facilities which, together with hotels and other forms of accommodation, like spas and restaurants, form the main tourist infrastructure [64] (pp. 41–62).
Peripherality is a concept unambiguously associated with a low level of socio-economic development resulting from the marginality of the studied area. In the cohesion policy of the European Union, peripherality is determined by the level of GDP per capita. The whole province of Warmia and Mazury is characterized by a low level of peripherality. Rural areas are characterized by a much lower level of development and higher peripherality than urban areas. According to the theory of centers and peripheries, urban areas can be a source of development for rural areas. Therefore, it was decided to analyze areas combining both urban and rural areas.
The cohesion policy implemented by the European Union is aimed at reducing development disparities suffered by peripheral regions (mainly rural areas). One of its priorities is sustainable development aimed at the most effective use of the resources of a given area. Therefore, if there are favorable conditions for tourism functions in a given area, they should be developed. This study covered urban–rural communes of Warmia and Mazury, which have undoubted tourist potential. It should be stressed, however, that the tourism attractiveness of peripheral areas is a global problem. There are marginalized, less developed areas all over the world that are rich in resources conducive to the development of tourist functions. Tourism, if it develops in a sustainable manner, can therefore constitute a tool for implementing the cohesion policy. Tourism in peripheral areas supports sustainable development, which in turn influences the socio-economic development of a given area and increases the quality of life of its inhabitants. It is also important to point out the threats resulting from the growing peripherality of areas: the depopulation and ageing of the population. People migrate to improve both economic and social conditions. This does not only concern young people. Older people are leaving peripheral areas in search of a better quality of life. Of course, tourism is not an antidote to the socio-economic problems of every peripheral area. However, when these areas are characterized by unique conditions, tourism allows them to achieve an advantage. Indeed, tourism is one of the fastest growing sectors of the world economy. Knowledge of the elements determining the volume of tourist traffic in a given area allows for its conscious and effective shaping, which positively influences both the development of the tourist potential of the area and its sustainable development.
2. Characteristics of the Studied Object
The province of Warmia and Mazury is located in the north-eastern part of Poland (Figure 1).
The analysis covered all 33 urban–rural communes in Warmia and Mazury (Table 1).
The average population density in the province was 59 people per km2. In urban–rural communes, the population density was 43 people per km2. The highest population density was found in the Olecko commune (83 people per km2), and the lowest in Ruciane-Nida (23 people per km2). The highest population density, both in urban and rural areas, was found in the Morąg Commune (2298 people per km2 and 35 people per km2, respectively) and the lowest, with regards to urban areas, was recorded in Pasym (167 people per km2), and, for rural areas, in Orzysz (10 people per km2) [3].
Urban–rural communes in the province cover an area of 8876 km2, which represents 37% of the province’s area. The largest commune is Pisz (634 km2), and the smallest is Frombork (124 km2). Towns occupy only 3% of the commune area. The lowest share of a town in a commune area was found in the Pasym Commune (10%), and the highest was in the Biała Piska Commune (over 99%) [3].
In 2016, the Warmia and Mazury Province was inhabited by 1,436,367 people, of which 391,460 people (27%) lived in urban–rural communes. About 56% of the population in the urban–rural communes of the province lived in towns. In the period under analysis, the average population of towns in urban–rural communes was 6654 people and ranged from 1805 in Młynary to 19,449 in Pisz. In 20 communes, population numbers were below the average value. In 52% of the urban–rural communes, at least 50% of the population lived in towns. The highest percentage was found in Olecko (75%) and the lowest in Zalewo (31%) [3].
3. Research Methodology
The study analyzed two elements determining the level of tourist attractiveness of the area (tourist infrastructure and tourist values) to determine which of them should be supported in urban–rural communes in peripheral areas, where tourism could be one of the factors enabling sustainable development.
Urban–rural communes are a special group of communes (according to the administrative division, there are urban, rural, and urban–rural communes in Poland) due to the diversity resulting from their combination of rural and urban areas. We can read about the specificity of these areas and the stability of local governments, and which specific conditions must be taken into account, in [65] (pp. 463–487).
The average number of inhabitants in towns was used to divide the analyzed communes into two groups:
A: above average (>6654 people);
B: below average (<6654 people).
The number of town residents indicates the scale of the town’s influence as an administrative and cultural center on the urban–rural communes in its surrounding rural areas [66] (pp. 167–177), [67] (pp. 215–228).
Three hypotheses were put forward in the research:
Hypotheses 1.
In Group A, tourism attractiveness is more affected by tourism infrastructure;
Hypotheses 2.
In Group B, tourism attractiveness is more affected by tourism value;
Hypotheses 3.
In urban–rural communes, owing to their combination of urban and rural areas into one unit, a complementary relationship exists between tourist values and tourist infrastructure in creating tourist attractiveness.
The level of actual tourist attractiveness of communes was determined in the study by calculating the tourist traffic intensity index, on the assumption that a higher number of tourists in a commune means a higher value of tourist attractiveness. The tourist traffic intensity index (Ws) is expressed by the number of tourists staying overnight in a given commune for every 100 inhabitants. Depending on the index value, the communes in question were classified into five groups: no tourist traffic (Ws = 0), low tourist traffic intensity (0 < Ws < 100), moderate tourist traffic intensity (100 ≤ Ws < 166), average tourist traffic intensity (166 ≤ Ws < 500), and high tourist traffic intensity (Ws ≥ 500) [68] (pp. 91–103). It is impossible to quantify the actual volume of tourist traffic precisely. Despite the minor imperfections of the indicator used, it is the most reliable one. The data presented in the study refer to 2016.
To determine which element of tourist attractiveness contributes to its value to a higher degree, variables characterizing both tourist values and the condition of tourism infrastructure in the commune were distinguished (Table 2). In total, 46 indicators were identified: 23 describing the quality of tourist values, and 23 presenting the quality of tourism infrastructure in the commune. The vast majority of the 43 analyzed indicators were stimulants. There were different determinants of tourist attractiveness, depending on the level of development achieved in a specific area.
The status of tourist values was characterized by two synthetic indices: natural attractiveness and cultural attractiveness. The synthetic indicator of natural attractiveness was composed of five sub-indices: topographical relief, the share of surface water in the overall area of the commune, forestation, the synthetic indicator of natural attractions, and synthetic indicator of environmental condition. The topographical relief was described based on data obtained from the Forest Data Bank [69] concerning different types of natural landscapes. The diversity seen in the topography was considered a stimulus, assigning one point to each of the landscape types found throughout the commune (the value of the indicator depended on the number of landscape types present in the area of a given commune, expressed as an appropriate multiple of one. The greater the variety, the higher the attractiveness of the area in this regard). The indicator of the share of surface waters within the commune area was calculated using the share of flowing and standing surface waters in the commune area, while the indicator of forestation rate was calculated using the share of forest area in the total commune area. The indicator of natural attractions is a synthetic indicator consisting of four sub-indices specifying the number of natural monuments, botanical and zoological gardens, beaches, and towns with the status of a health resort with respect to the total area of the municipality. The indicator of the environmental condition is a synthetic indicator consisting of four sub-indices indicating the share of the population benefiting from a sewage treatment plant, the total amount of mixed waste collected annually per capita, population density, and the share of legally protected sites in the area of the commune (nature reserves, landscape parks, protected landscape areas, Natura 2000 areas and sites protected under the Ramsar Convention list). The synthetic indicator of cultural attractiveness consisted of four sub-indices: objects of sacral tourism (describing the number of sanctuaries per 1000 inhabitants), and three synthetic indicators: historical buildings; museum, stage and exhibition activities; cultural events. The synthetic index of historical buildings was calculated using the number of immovable monuments per 1 km2 of the commune’s area, and a score of 0.5 to 10 points was assigned depending on the rank of the monument. The highest score was given to the objects included in the List of Historical Monuments and Cultural Parks. The following weights were assigned: 2 for complexes of monuments, castles and palaces, 1 for spatial assumptions, sacral, residential, and public buildings, and 0.5 for other objects, such as civil, residential, farming and industrial objects, small architecture, memorials, historic landscape designs, and archaeological monuments, among others. The synthetic indicator of museum, stage and exhibition activity determined the number of galleries and art halls, museums (along with their branches), museum collections, theatres, and musical institutions per 1000 inhabitants. The synthetic indicator of cultural events determined the number of events per 1000 inhabitants held by art centers, cultural centers, clubs, and community centers in addition to the number of public events (art and entertainment, interdisciplinary and sports) per 1000 inhabitants.
The current state of tourist infrastructure was characterized by three synthetic indicators: transport accessibility, accommodation, and catering and auxiliary facilities. The synthetic indicator of transport accessibility consisted of three synthetic indicators: accessibility to transport infrastructure facilities, actual physical distance from the adopted reference points, and internal accessibility. The value of the synthetic indicator concerning accessibility to transport infrastructure facilities was determined by assigning weights to specific transport infrastructure facilities located in the commune:
- -
- road category: international or express (weight 5), national (2), provincial (1);
- -
- airfield rank: international airport (5), sports, recreational, military airfield (2);
- -
- type of border crossing point: road (2), railway (1);
- -
- the presence of a train station (3) or train stop (2);
- -
- the presence of a seaport (1).
The value of the weighting factors was multiplied by the number of individual transport infrastructure facilities located in the given commune.
The synthetic indicator of the actual physical distance from the selected reference points was calculated as a sum of the distance between the locality being the center of a given commune and the capital city of the province and the capital cities of the neighboring provinces.
The synthetic indicator of internal accessibility was calculated based on three partial indicators as stimulants: the share of roads in the geodetic structure of the commune area, the share of the railway in the geodetic structure of the commune area, and the length of bicycle paths per 10,000 km2 of the commune area.
The synthetic indicator of accommodation and catering services consisted of seven indicators that were stimulants and which described the density of accommodation facilities, the number of beds (total and those available all year round), the dynamics of beds available throughout the year, and the share of business entities entered in the REGON register under the accommodation and in the accommodation and catering sectors in relation to the total number of entities. The synthetic indicator of auxiliary facilities consisted of 11 indicators that were stimulants. It should be noted that the condition of tourist infrastructure was also characterized by indicators describing the condition of technical infrastructure (transport infrastructure) and social infrastructure (auxiliary facilities).
There are also differences depending on the character of a given place—determinants of an urban area’s tourist attractiveness will differ from those observed in rural locations. Consequently, analyzing the tourist attractiveness of other areas may require the researcher to modify the indices.
The coefficient of variation was calculated and the reversed matrix method was applied to eliminate the disproportionate correlation between the individual indicators. Synthetic indicators of tourist values and tourist infrastructure were calculated for all urban–rural communes. The data collected for the analysis concerned 2016 and came from the Local Data Bank [3], the National Heritage Institute [70], the Forest Data Bank [69], and Google Maps [71].
It was necessary to include numerous different factors in the analysis due to the multidimensionality and comprehensiveness of the concept of tourist attractiveness [72] (pp. 103–117). The study was carried out in accordance with Hellwig’s taxonomic development pattern method, allowing the analyzed urban–rural communes to be ranked according to their tourist attractiveness. This method facilitates comparability of the studied objects in relation to each other and their prioritization. Based on the collected data, an abstract object can be created as a pattern, obtaining maximum values of the indicators which are stimulants and minimum values of those which are destimulants. This argument was the deciding factor for its use in the study. This method is used to study both tourism development [73] (pp. 293–298) and sustainable development [74] (pp. 299–322), [75] (pp. 11–26), [76] (pp. 1–15), [77] (pp. 1–14), [78] (pp. 1–22). The development of synthetic indicators which determine the value of tourist values and tourist infrastructure required the following [79] (pp. 1–22), [80] (p. 74), [81] (pp. 657–688]:
- Creation of the observation matrix:where:
- xij-value of the jth feature for the ith object.
- Standardization of the values of diagnostic variables: where:
- -the standardized value of the xij;
- -output value of the feature;
- -arithmetic mean of xij;
- -standard deviation of xij.
As a result of the standardization process, a matrix of standardized Z values was created:This matrix was used as the basis for determining the so-called development pattern, i.e., an abstract commune. The pattern is a commune whose value for the development indicator estimated by the discussed method is maximum, i.e., one. A commune is abstract because all indicators that are stimulants are assumed to reach maximum values in this unit and all destimulants are assumed to reach minimum values. It provides a benchmark for comparing other communes. - Maximum values for indicators being maximum values of stimulant indicators and minimum values of destimulant indicators were determined to create the so-called development pattern:
- , for variables being stimulants;
- , for variables being destimulants.
- A discrepancy with the pattern was determined for each of the surveyed communes:
- The arithmetic mean and standard deviation were calculated for the sequence of values.
- was calculated:
- The value of the development measure was established. The higher the value of di for the tested object, the higher the degree of its development:
The results allowed the communes to be ranked according to values of the respective indicators and assigned to one of four classes [82] (p. 104), [83] (pp. 80–100), [84]:
- -
- I: communes with high-value tourist values/tourist infrastructure:;
- -
- II: communes with average-value tourist values/tourist infrastructure: ;
- -
- III: communes with moderate-value tourist values/tourist infrastructure: ;
- -
- IV: communes with low-value tourist values/tourist infrastructure where: ;
- -the value of the synthetic measure, calculated using Hellwig’s development pattern method,
- -arithmetic mean of the synthetic measure ,
- -standard deviation of the synthetic measure .
The correlation between the volume of tourist traffic and tourist values and the quality of tourist infrastructure was measured using Pearson’s Correlation Coefficient.
4. Results
For further analysis of the determinants of the tourist attractiveness of urban–rural communes of the province of Warmia and Mazury, indicators characterized by a high coefficient of variation (V > 20) and not correlated (< 10) were selected from the aforementioned set (Table 2). The highest coefficients of variation were characterized by the following indicators (per commune area): the number of botanical and zoological gardens, the number of bathing areas, and the number of localities with spa status. A coefficient of variation below 20 occurred for two indicators: the number of galleries and art halls per 1000 inhabitants, and the number of theatres and music institutions per 1000 inhabitants. The following indicators were also eliminated: accommodation facilities and beds available all year round and in total, accommodation facilities offering spa treatments, activities supervised by an instructor, renting tourist equipment, and swimming pools and saunas per 1000 inhabitants. Elimination was due to over-correlation.
Based on Hellwig’s development pattern method, the urban–rural municipalities of the province were grouped in four classes, from the highest quality of tourist values and tourist infrastructure to the lowest. The Ruciane Nida commune demonstrated the highest tourist values (0.83), significantly exceeding the other communes classified as first class: Lidzbark (0.58), Orzysz (0.51), and Olsztynek (0.5). In terms of tourist infrastructure, the highest scores were achieved by the communes of Mikołajki (0.68), Pasym (0.57), Pasłęk (0.55), and Węgorzewo (0.54) (Table 3).
In terms of the attractiveness of natural areas, the Ruciane-Nida commune was ranked the highest in the analyzed period, obtaining synthetic indicators of 0.71. Since there are no national parks in the province, it was left out of the synthetic indicator of protected areas. There are four sites protected under the Ramsar Convention: the Łuknajno Lake Nature Reserve, the Karaś Lake Nature Reserve, the Seven Islands Lake Nature Reserve, and the Drużno Lake Nature Reserve. There are three Historical Monuments located in the province of Warmia and Mazury: the Frombork Cathedral Complex, the Grunwald Battlefield, and the Elbląg Canal, as well as one Cultural Park: the landscape park surrounding the Gietrzwałd-Woryty Trail. The commune of Pieniężno proved to be the most attractive in terms of culture (0.33). The commune of Biskupiec was determined to be the most attractive in terms of transport bases (0.71), and Mikołajki with regards to accommodation and catering bases (0.57). In terms of the accompanying facilities, the Ruciane-Nida commune was ranked the highest in the analyzed period, obtaining synthetic indicators of 0.33. On the other hand, the lowest values of the synthetic indicators of natural attractiveness—Olecko (0.01), cultural attractiveness—Tolkmicko (0.001), transport infrastructure—Zalewo (0.07), accommodation and catering infrastructure—Pieniężno (0.02), and accompanying facilities—Bisztynek (0.04) were recorded (Table 4).
Intense tourist traffic was observed in two urban–rural communes: Mikołajki (1697) and Ryn (936). Low intensity of tourist traffic predominated (64% of communes). A total of 15% of the communes showed no tourist traffic (Sępopol, Pieniężno, Młynary, Kisielice, Korsze) [3]. Figure 2 shows the intensity of tourist traffic in the communes of Warmia and Mazury. High intensity occurred only in urban–rural communes. Two clusters of communes can be observed, regardless of their status, with moderate and high tourist intensity (hatched areas on the map). The first one is located in the Great Mazurian Lakeland and the surrounding area, which is made up of the urban–rural communes of Mikołajki, Ryn, and Ruciane-Nida, the rural communes of Giżycko, Piecki, and Sorkwity, and the urban commune of Mrągowo. The second cluster covers the area near the urban commune of Olsztyn, the urban–rural commune of Miłomłyn, and the rural communes of Ostróda, Gietrzwałd, and Stawiguda.
An average and moderate level of the development of tourist values (36.4% each) and an average level of tourist infrastructure (42.4% each) dominated. Both in the case of tourist values and tourist infrastructure, an equal number of urban–rural communes were included in Class I (12.1% of communes) and IV (15.2% of communes). The only differences occurred in Classes II and III, which featured a higher level of tourist infrastructure development (Table 4). None of the communes were characterized by a high level of tourist value and infrastructure at the same time, but four of them showed an average level (Gołdap, Ryn, Pisz, Miłomłyn), four showed a moderate level (Młynary, Korsze, Tolkmicko, Morąg), and two demonstrated a low level (Jeziorany, Bisztynek). The greatest difference was observed in the Pasłęk commune, where a high level of tourist infrastructure and a low level of tourist values were found. In the communes of Lidzbark, Pieniężno, and Olecko, the differences were also significant.
Figure 3 and Figure 4 show the level of tourist values and infrastructure in the communes of Warmia and Mazury. All 33 urban–rural communes of the province were examined (shades of blue on the maps), but for a spatial representation of the phenomena under study, the maps also show the status of urban (shades of red) and rural communes (shades of green). It should be noted that each group of communes was analyzed separately.
Good levels of tourism values (Class I and II) were found in the Great Masurian Lakeland and its close surroundings: the urban–rural communes of Węgorzewo, Ryn, Mikołajki, Orzysz, Ruciane Nida, Pisz, and Biała Piska, and the rural communes of Giżycko, Pozezdrze, and Kruklanki. Four communes, together with the urban commune of Olsztyn, formed a cluster of communes with high tourist values: the urban–rural commune of Olsztynek and the rural communes of Gietrzwałd and Stawiguda. The above-described clusters are shown in Figure 3 as hatched areas.
The Great Mazurian Lakelands were also characterized by a good level of tourist infrastructure (class I or II), specifically the urban–rural communes of Węgorzewo, Ryn, Mikołajki, Orzysz, Ruciane-Nida, and Pisz, and the rural and urban communes of Giżycko and Mrągowo. Another area with good tourist infrastructure was in the western part of the province, starting from the rural commune of Iława, where the urban–rural communes of Miłomłyn, Olsztynek, Nidzica, Pasym, Barczewo, and Biskupiec, the rural communes of Ostróda, Łukta, Gietrzwałd, Stawiguda, Purda, and Szczytno, and the urban communes of Iława, Ostróda, and Olsztyn are located. The above-described clusters are shown in Figure 4 as hatched areas.
The average urban population in urban–rural communes (6654 people) was used to classify the analyzed communes into two groups: above average and below average.
In urban–rural communes with urban populations above the average, statistically significant relationships were found between tourist traffic and tourist values (p = 0.05) and tourist infrastructure. The Pearson linear correlation coefficient was 0.31 and 0.38, respectively, which indicates a positive correlation.
In urban–rural communes with a below-average urban population, no statistically significant relationship between tourist traffic and tourist values was found (p = 0.05), although a statistically significant relationship between tourist traffic and tourist infrastructure was observed. The Pearson linear correlation coefficient was 0.61, which indicates a positive correlation.
No statistically significant correlation between tourist traffic and tourist values was noted (p = 0.05), whereas there was a statistically significant correlation between tourist traffic and the available tourist infrastructure (p = 0.05). The Pearson linear correlation coefficient was 0.51, which indicates a positive correlation.
The study analyzed two elements determining the level of tourist attractiveness of the area (tourist infrastructure and tourist values) to determine which of them should be supported in urban–rural communes in peripheral areas where tourism could be one of the factors that enables sustainable development. According to the research conducted, the intensity of tourist traffic in urban–rural communes where the population of their towns is above the average determines the presence of facilities and services related to tourist infrastructure, as well as tourist values, while in urban–rural communes where the population of their towns is below the average, and in urban–rural communes in general, no statistically significant relationship was found between tourist traffic and tourist values. In these areas, the volume of tourist traffic determines the existence of facilities and services related to tourist infrastructure.
5. Discussion
The occurrence of a city in an urban–rural commune determines the weight of the elements influencing its tourist attractiveness.
The hypotheses put forward were verified throughout the study:
Hypotheses 4.
In group A, tourism attractiveness was more affected by tourism infrastructure, but the importance of tourist values was also statistically significant;
Hypotheses 5.
In group B, tourist attractiveness was more affected by tourist infrastructure, not by tourist values;
Hypotheses 6.
In urban–rural communes, a complementary relationship between tourist values and tourist infrastructure in creating tourist attractiveness did not exist. Tourism attractiveness was more affected by tourism infrastructure.
The research made it possible to achieve the declared objective, i.e., to indicate which of the elements determining the level of tourist attractiveness, either tourist infrastructure or tourist values, should be supported in urban–rural communes in peripheral areas, where tourism can be one of the elements that can contribute to sustainable development. Tourist infrastructure needs to be developed in urban–rural communes, since it is the presence of transport, accommodation and catering facilities, as well as accompanying equipment that, to a greater extent, determines the volume of tourist traffic in these areas. The allocation of communal investment funds for these purposes may contribute to the development of a given area, as tourism infrastructure can become a factor in creating conditions for local sustainable development.
The answer to the research question was given: tourism development in urban–rural communes in peripheral areas is more strongly influenced by tourism infrastructure than by tourism values. This knowledge will enable key factors to be supported and the weakest links to be strengthened in lagging areas.
The results indicate that the quality of tourist infrastructure affects the tourist attractiveness of urban–rural communes to a higher degree than tourist values. Tourist values have a significant effect only in communes with a high urban population. The indicator of tourist traffic intensity was used as the actual tourist attractiveness value measured in the study.
Urban–rural communes include both urban and rural areas in their territory.
Fans of rural tourism opt for this type of recreation because of the opportunity to interact with an unpolluted environment and experience the accompanying silence, lack of traffic, peace, and the possibility of enjoying rural life [85], [86] (pp. 1–17), [87] (pp. 252–266). The reasons for urban tourism are completely different. Typically, the natural resources of urban areas are limited. The urban lifestyle is characterized by monotony, rushing, and pollution. Since the cities are artificial and most of them came into existence as a consequence of multidimensional development, there are numerous facilities attracting tourists there. No one decides to come to the city to enjoy wildlife and nature. Nevertheless, urban areas tend to exhibit higher cultural attractiveness than rural areas. Many authors believe that motivations for choosing urban tourism depend exclusively on cultural heritage. However, the current processes do not support this view [88] (pp. 1209–1223). Cultural heritage is no longer the main tourist values in cities. The incentives for urban tourism include accommodation, gastronomy, and entertainment options rather than the city’s heritage [59] (pp. 1–21), [89] (pp. 1–4). Urban tourism can be developed based on an expectation- and needs-oriented tourist infrastructure.
The relevant literature provides for a variety of approaches as to the primacy of the elements of tourist attractiveness that influence its final level [52] (pp. 67–79), [90] (pp. 125–134), [91] (pp. 288–294), [92] (pp. 91–101). The key importance of tourist values is supported by the fact that tourists arrive at a given place because they are interested in the tourist values existing there. They are the main motivation for practicing tourism. This stance is in line with the assumptions of the peripheral theory, according to which the main reason for undertaking a trip is to see tourist values, and not the condition of the tourist infrastructure itself. Only at the later stage of deciding to travel is the region evaluated in terms of the tourist infrastructure available there. The tourist attractiveness of a given place results directly from the tourist values, which are the main reasons for the trip, and indirectly from the tourist infrastructure that meets the needs arising from the visit. There is a complementary correlation between tourist values and tourist infrastructure [64] (pp. 41–62). Tourist attractiveness is determined by the structure and size of the tourist facilities, and its attractiveness is determined by the close proximity of tourist values. The element distinguishing the influence of tourist values and tourist infrastructure on the attractiveness of a given place is temporal changeability. Tourist values can be considered as natural and constant. Attractive settings, the attributes they possess (both natural and anthropogenic), tradition, history, the civilization level of the inhabitants, and the state of the natural environment are values that cannot be modified by humans in a short time. This is not the case for tourist infrastructure. Its elements change in time. They can be easily shaped and modified and they reflect the current readiness of the area to receive tourists. All the considerations above suggest that tourist infrastructure is an element supporting the tourist attractiveness of a given place marked by its tourist values.
Urban–rural communes combine urban and rural areas within their territory. A literature review indicated that the volume of tourist traffic in urban areas determines the condition of tourist infrastructure and, in rural areas, the status of tourist values. The results obtained indicate that tourist infrastructure in urban–rural communes has a greater impact on their tourism attractiveness to a greater extent. Therefore, the existence of a city in these communes, acting as a central hub and pole of growth, determines the weight of elements influencing tourist attractiveness.
The importance of tourism in the socio-economic development of the province has been repeatedly stressed in the ‘Strategy of Socio-Economic Development of the Warmińsko-Mazurskie province until 2025’ [93]. This sector, together with the ICT, food, and furniture sectors, has been classified as “innovative regional specialization”. Many of the province’s communes are among the national leaders with regards to strengthening its tourism function. In the context of the strategic importance of tourism in the socio-economic development of the entire province, it is worrying that nearly 27% of the communes in 2016 saw no tourist traffic. The vast majority of communes are rural. The low intensity of tourist traffic in those communes proves that the Strategy correctly identifies the areas of tourism development in the province—tourist towns functioning as potential holiday resorts. The second area indicated in the Strategy was the so-called recreational space, which, due to the specificity of rural tourism, can be equated with the tourism present in rural areas (in rural communes or rural areas in urban–rural communes).
The outbreak of the COVID-19 pandemic has changed much in the economy. For example, U.S. hotel industry revenue (per available room) fell 11.6%, while in China hotel occupancy fell 89%. Losses to U.S. hotels at the very beginning of the pandemic were estimated at USD 1.5 billion [94] (pp. 1–26), [95] (pp. 185–193), [96] (pp. 1–20). For the time being, the literature mainly shows forecasts, an example of which is the publication [97] (pp. 205–234). Tourism development forecasts can be found in Álvarez-Díaz Gunter et al. [98] (pp. 90–106) and Gunter et al. [99] (pp. 211–229). The first results of this research [100] (pp. 1–13) show that the tourism sector is easily influenced by global crises. Tourism is one of the industries most affected by the consequences resulting from the COVID-19 pandemic. Both positive effects on the sustainability of tourism [101] (pp. 438–445), [102] (pp. 1–14) and negative economic effects can be observed. However, the pandemic will certainly not change two key issues: tourists choose their travel destination, and they need to function (move around, satisfy physiological and higher-order needs) in their chosen location. Thus, the existence of tourist values and tourist infrastructure determines the volume of tourist traffic in a given area. There are already examples of how a pandemic has affected some local communities. An example of this is Algeria. The results of the study [103] (pp. 1–11) showed a high demand for recreation and relaxation to alleviate the psychological stress which has impacted negatively the physical and mental health of all people, including children, during the COVID-19 period. The researchers showed that there was a high need for and awareness of among the re-spondents of the tourism sector, and how it can contribute to the economic recovery in Algeria after the border closure period—domestic tourism is currently the most viable form of tourism.
6. Conclusions
In this study, the urban-rural communes of Warmia and Mazury were analyzed. Rural areas are characterized by a much lower level of development and higher peripherality than urban areas. According to the theory of centers and peripheries, urban areas can be a source of development for rural areas. Therefore, it was decided to analyze areas combining both urban and rural areas.
The study found that the volume of tourist traffic in urban–rural communes determines the existence of facilities and services related to tourist infrastructure. Only in communes where the urban population was above the average did the importance of tourist values also prove significant. Tourist attractiveness is therefore determined by the state of tourist infrastructure. In urban–rural communes, a complementary relationship between tourist values and tourist infrastructure in creating tourist attractiveness does not exist. Tourism attractiveness is more affected by tourism infrastructure.
Depending on the character of a given place, factors determining its tourist attractiveness are different—the determinants of tourist attractiveness in urban areas will be different from those pertaining to rural areas.
In addition, reasons for engaging in tourism may also change. When any study of the determinants of the tourism attractiveness of various areas begins, specific variables must be taken into account (e.g., it is unreasonable to take into account the number of museums or art galleries in rural communes, and when analyzing elements of tourism attractiveness in highly developed countries, there is no point in considering access to roads). A set of indicators describing the condition of both tourist values and tourist infrastructure should be open, modified, and supplemented when necessary. Additionally, some differences depend on the level of development attained by a particular area.
Attention should be paid to the problem of estimating the actual number of tourists to a given area. This figure is difficult to estimate. Indeed, not every tourist uses collective accommodation. A tourist can stay with a family member or friends, or use the increasingly popular “home exchange” option. Therefore, the volume of tourist traffic may not be completely registered.
In recent years, there has been a change in tourist preferences. Trips of type 3S (sun, sea, sand) are slowly giving way to trips of type 3E (entertainment, excitement, education) [104] (pp. 1–20), [105] (pp. 16–25), [106] (pp. 41–52), [107] (pp. 1797–1804). Warmia and Mazury is a place where 3E tourism could develop all year round, owing to its natural values. There are more such areas in Europe and in the world. Moreover, there is a growing interest in resting in less frequented places—in peripheral places. It should be emphasized that some authors even describe contemporary tourism as “the invasion of refugees from the metropolis to the periphery” [108] (pp. 59–71). Undoubtedly, these are places where you can look for relaxation in the bosom of nature, away from the hustle and bustle. Information seems to be important for local communities, which determines tourist attractiveness to a greater extent, or the presence of tourist values or infrastructure that sometimes seems necessary. Such information allows one to focus on the elements that should be developed, and to perhaps even direct development. It indicates elements that perhaps even should be invested in.
One issue that cannot be overlooked today is the impact of the COVID-19 pandemic on tourism. The new conditions of tourism development must be highlighted. The suspension of passenger flights has indicated the need for a different approach to tourist attractiveness. It is no longer appropriate to equate passenger flights with the volume of tourist traffic. Areas which continue to be characterized by high-quality tourist values and tourist infrastructure, due to the restrictions imposed by governments, have seen their tourist traffic came to a halt. This issue may become a subject of future studies.
The presented results are important for the development of science and provide a good basis for further research on the impact of global trends on regional development. At the same time, the analyzed framework provides guidance for ensuring the development of local tourism, and the suggested priorities and measures can lead to the development of tourism in peripheral regions, which should attract new investments, create new jobs, and thus develop the economy and the welfare of the population.
Thus outlining options for decision makers and suggesting directions for future research, the concept of tourism development in peripheral areas requires systematic research and comparison. The perspective of a global approach to peripheral areas and local problems can provide new insights. Future work could look at the benefits the periphery offers for certain types of tourism. Consequently, tourism development opportunities in peripheral areas can contribute to the reduction of poverty and the social exclusion of local people, which is one of the objectives of sustainable development. On the other hand, the identification of factors influencing the development of tourism allows for the identification, at the same time, of barriers to development and dangers related with negative environmental impacts.
However, such research is accompanied by problems. We should consider what criteria should be used to select peripheral areas. Currently, there are several criteria (e.g., population density, economic backwardness). The second problem is the great diversity of peripheral areas, which makes it difficult to use the same research method. Access to statistical data at the level of the smallest administrative units also causes problems.
Author Contributions
For research articles with several authors, the following statements should be used Conceptualization, N.Ś.; methodology, N.Ś. and M.W.-D.; software, N.Ś. and M.W.-D.; validation, N.Ś. and M.W.-D.; formal analysis, N.Ś. and M.W.-D.; investigation, N.Ś. and M.W.-D.; resources, N.Ś. and M.W.-D.; data curation, N.Ś.; writing—review and editing, N.Ś. and M.W.-D.; visualization, N.Ś. and M.W.-D.; supervision, N.Ś.; project administration, N.Ś.; funding acquisition, N.Ś. and M.W.-D. Both authors have read and agreed to the published version of the manuscript.
Funding
This research received no external funding.
Institutional Review Board Statement
Not applicable.
Informed Consent Statement
Not applicable.
Data Availability Statement
Data are contained within the article.
Conflicts of Interest
The authors declare no conflict of interest.
References
- Özdemir, E. Different Definitions of “Periphery” and Different Peripheries in the EU. Master’s Thesis, Graduate School of Natural and Applied Sciences of Middle East Technical University, Ankara, Turkey, 2005; p. 177. [Google Scholar]
- Vaishar, A. Regional periphery: What does it mean. In Regional Periphery in Centraland Eastern Europe; Europa, XXI; Komornicki, T., Czapiewski, Ł., Eds.; Centrum Studiów Europejskich IGiPZ PAN: Warszawa, Poland, 2006; Volume 15, p. 7. [Google Scholar]
- Local Data Bank. Available online: https://bdl.stat.gov.pl/BDL/start (accessed on 1 May 2021).
- Redfield, R. The Folk Society. Am. J. Sociol. 1947, 52, 293–308. [Google Scholar] [CrossRef] [Green Version]
- Weber, A. Theory of the Location of Industry; University of Chicago Press: Chicago, IL, USA, 1929; pp. 24–29. [Google Scholar]
- Keynes, J.M. Ogólna Teoria Zatrudnienia, Procentu i Pieniądza; PWN: Warszawa, Poland, 1956; p. 28. [Google Scholar]
- Rosenstein-Rodan, P.N. Uwagi o teorii wielkiego pchnięcia. Ekonomista 1959, 2, 360–369. [Google Scholar]
- Perroux, F. L’Économie du XX e Siècle; Universitaires de France Vendome Print. of the PUF: Vendome, France, 1964; pp. 181–184. [Google Scholar]
- Hirschman, A.O. The Strategy of Economic Development; Yale University Press: London, UK; Presses Universitaires de France: Paris, France, 1958; pp. 77–89. [Google Scholar] [CrossRef]
- Love, J.L. Raul Prebisch and the Origins of the Doctrine of Unequal Exchange. Lat. Am. Res. Rev. 1980, 15, 45–72. [Google Scholar]
- Barbier, E. The concept of sustainableeconomic development. Environ. Conserv. 1987, 14, 101–110. [Google Scholar] [CrossRef]
- Davies, S.; Michie, R. Peripheral regions: A marginal concern? Eur. Policies Res. Cent. Paper 2011, 11, 1–79. [Google Scholar]
- Young, N. Globalization from the Edge: A Framework for Understanding How Small and Medium-Sized Firms in the Periphery ‘Go Global’. Environ. Plan. A Econ. Space 2010, 42, 838–855. [Google Scholar] [CrossRef]
- Lagendijk, A.; Lorentzen, A. Proximity, Knowledge and Innovation in Peripheral Regions. On the Intersection between Geographical and Organizational Proximity. Eur. Plan. Stud. 2007, 15, 457–466. [Google Scholar] [CrossRef]
- Dax, T.; Favry, E.; Fidlschuster, L.; Oedl-Wieser, T.; Pfefferkorn, W. Neue Handlungsmöglichkeiten für Periphere Ländliche Räume. Stärkung der Sozialen Vielfalt. Ausbau der Interkommunalen Zusammenarbeit, Gestaltung der Landschaftsvielfalt; ÖROK Schriftenreihe: Wien, Austria, 2009; pp. 1–112. [Google Scholar]
- Rural Development Programme for Sweden—The Period 2007–2013; Bundesamt für Statistik: Stockholm, Sweden, 2009; pp. 9–84. Available online: https://www.government.se/ (accessed on 1 May 2021).
- Jeanneret, B.; Goebe, V. Regionale Disparitäten in der Schweiz; Office Fédéral de la Statistique (OFS): Neuchâtel, Switzerland, 2012; pp. 1–40. [Google Scholar]
- Rural Development Programme for 2007–2013; Ministry of Agriculture and Rural Development: Warsaw, Poland, 2007; pp. 6–146.
- Quelle France Rurale Pour 2020? Contribution à une Nouvelle Politique de Développement Rural Durable; DATAR. La Documentation Française; Délégation à L’aménagement du Territoire et à L’action Régionale: Paris, France, 2003; pp. 1–64.
- Nash, R.; Martin, A. Tourism in peripheral areas—The challenges for northeast Scotland. Int. J. Tour. Res. 2003, 5, 161–181. [Google Scholar] [CrossRef]
- García-Delgado, F.; Martínez-Puche, A.; Lois-González, R. Heritage, Tourism and Local Development in Peripheral Rural Spaces: Mértola (Baixo Alentejo, Portugal). Sustainability 2020, 12, 9157. [Google Scholar] [CrossRef]
- EUR-Lex. Baza Uktów Prawnych Unii Europejskiej. Available online: lex.europa.eu/summary/glossary/sustainable_development.html?locale=pl (accessed on 1 May 2021).
- Aronsson, L. Sustainable tourismsystems: The example of sustainable ru-ral tourism in Sweden. J. Sustain. Tour. 1994, 2, 77–92. [Google Scholar] [CrossRef]
- McCool, S.F. Making tourism sustainable, sustainable tourism and what should tourism sustain: Different ques-tions, different indicators. In Proceedings of the International Symposium on Coastal and Marine Tourism, Vancouver, BC, Canada, 26–29 April; 1999; pp. 315–326. Available online: https://nsgl.gso.uri.edu/washu/washuw99003/32-McCool.pdf (accessed on 1 May 2021).
- Innskeep, E. Tourism Planning: An Integrated and Sustainable Development Approach; Routledge: London, UK, 1991; p. 528. ISBN 0442001223. [Google Scholar]
- Manning, T. Indicators of Tourism Sustainability. Tour. Manag. 1999, 20, 179–181. [Google Scholar] [CrossRef]
- Transforming Our World: The 2030 Agenda for Sustainable Development. Available online: https://sdgs.un.org/2030agenda (accessed on 1 May 2021).
- Hohl, A.E.; Tisdell, C.A. Peripheral tourism: Development and management. Ann. Tour. Res. 1995, 22, 517–534. [Google Scholar] [CrossRef]
- Share of GDP Generated by the Travel and Tourism Industry Worldwide from 2000 to 2019. Available online: https://0-www-statista-com.brum.beds.ac.uk/statistics/1099933/travel-and-tourism-share-of-gdp/ (accessed on 1 May 2017).
- Onuferová, E.; Čabinová, V.; Vargová, T.D. Analysis of modern methods for increasing and managing the financial prosperity of businesses in the context of performance: A case study of the tourism sector in Slovakia. Oeconomia Copernic. 2020, 11, 95–116. [Google Scholar] [CrossRef] [Green Version]
- Arionesei, G.; Stanciu, P.; Moroșan, A.; Cosma, M. Tourism Today: Why Is It a Global Phenomenon? In Proceedings of the International Conference Sustainable Development in Conditions of Economic Instability, 3rd ed., Satu-Mare, Romania, 20–21 June 2014; pp. 240–248. Available online: https://www.researchgate.net/publication/267854905_Tourism_Today_Why_Is_It_a_Global_Phenomenon (accessed on 1 May 2021).
- McCool, S.F.; Moisey, R.N.; Nickerson, N.P. What Should Tourism Sustain? The Disconnect with Industry Perceptions of Useful Indicators. J. Travel Res. 2001, 40, 124–131. [Google Scholar] [CrossRef]
- Tanguay, G.A.; Rajaonson, J.; Therrien, M.C. Sustainable tourism indicators: Selection criteria for policy implementation and scientific recognition. J. Sustain. Tour. 2012, 21, 862–879. [Google Scholar] [CrossRef] [Green Version]
- Bossel, H. Indicators for Sustainable Development: Theory, Method, Applications; A Report to the Balaton Group; International Institute for Sustainable Development (IISD): Winnipeg, MB, Canada, 1999; pp. 39–47. ISBN 1-895536-13-8. [Google Scholar]
- Choi, H.C.; Sirakaya, E. Sustainability indicators for managing community tourism. Tour. Manag. 2006, 27, 1274–1289. [Google Scholar] [CrossRef]
- Kyfyak, V.; Kyfyak, O. A methodology for calculating individual indicators of tourism activity. Turyzm 2018, 28, 41–45. [Google Scholar] [CrossRef]
- Woodhouse, P.; Howlett, D.; Rigby, D. Sustainability Indicators for Natural Resource Management & Policy; Working Paper 2A, Framework for Research on Sustainability Indicators for Agriculture and Rural Livelihoods Department for International Development Research Project No. R7076CA. 2000, pp. 12–23, ISBN 1-902518624. Available online: https://www.researchgate.net/profile/Phil-Woodhouse/publication/238083549_A_Framework_for_Research_on_Sustainability_Indicators_for_Agriculture_and_Rural_Livelihoods/links/02e7e5326f6e7e26df000000/A-Framework-for-Research-on-Sustainability-Indicators-for-Agriculture-and-Rural-Livelihoods.pdf (accessed on 1 May 2021).
- Slehat, M.M. Evaluation of Potential Tourism Resources for Developing Different Forms of Tourism: Case Study of Iraq Al-Amir and Its Surrounding Areas-Jordan. Ph.D. Thesis, Katholische Universität Eichstätt-Ingolstadt, Landkreis Eichstätt, Germany, 2018; pp. 27–59. [Google Scholar]
- Szmyt, M.; Witkowska-Dąbrowska, M. Use of the SWOT Analysis for Evaluation of the Tourist Potential of Olsztyn Sub-Region in Warmińsko-Mazurskie Voivodship. Olszt. Econ. J. 2013, 8, 61–73. [Google Scholar] [CrossRef]
- Napiórkowska-Baryła, A.; Witkowska-Dąbrowska, M.T.; de Jesus, I.M. The Role of the Tourist Potential of Predominantly Rural Areas and the Impact of Neighbouring Areas on the Evaluation of Their Tourist and Investment Attractiveness; Èkonomika: Voprosy Agrarnoj, Èkonomiki; Pestisa, V.K., Ed.; GGAU: Grodno, Russia, 2015; pp. 257–286. [Google Scholar]
- Zawadzki, P. The influence of modern hotel infrastructure on the number of hotel guests and the aspect of physical recreation in the local socjety. Geoj. Tour. Geosites 2014, 14, 215–225. [Google Scholar]
- Batyk, I.M. Determinants and Barriers to the Tourism Development in Kaliningrad Oblast of the Russian Federation and Warmia and Mazury Region. EÈkon. Probl. Tur. 2016, 36, 165–172. [Google Scholar] [CrossRef] [Green Version]
- Miłek, D. Spatial differentiation in the social and economic development level in Poland. Equilibrium 2018, 13, 487–507. [Google Scholar] [CrossRef]
- Farelnik, E. Cooperation of slow cities as an opportunity for the development: An example of Polish National Cittaslow Network. Oeconomia Copernic. 2020, 11, 267–287. [Google Scholar] [CrossRef]
- Wierzbicka, W. Socio-economic potential of cities belonging to the Polish National Cittaslow Network. Oeconomia Copernic. 2020, 11, 203–224. [Google Scholar] [CrossRef]
- Valls, J.-F.; Sureda, J.; Valls-Tuñon, G. Attractiveness Analysis of European Tourist Cities. J. Travel Tour. Mark. 2014, 31, 178–194. [Google Scholar] [CrossRef]
- Russo, A.; van der Borg, J. Planning considerations for cultural tourism: A case study of four European cities. Tour. Manag. 2002, 23, 631–637. [Google Scholar] [CrossRef]
- Van der Ark, L.A.; Richards, G. Attractiveness of cultural activities in European cities: A latent class approach. Tour. Manag. 2006, 27, 1408–1413. [Google Scholar] [CrossRef]
- Ivolga, A. Tourism in Russia and Eastern Europe as a contemporary factor of national economic development. Agric. Bull. Stavropol Reg. 2014, S1, 27–31. [Google Scholar]
- Giglio, S.; Bertacchini, F.; Bilotta, E.; Pantano, P. Using social media to identify tourism attractiveness in six Italian cities. Tour. Manag. 2019, 72, 306–312. [Google Scholar] [CrossRef]
- Gârbea, R.V. Tourist attractiveness of the urban environment in Moldavia. Manag. Mark. Craiova 2014, XII, 84–90. [Google Scholar]
- Boivin, M.; Tanguay, G.A. Analysis of the determinants of urban tourism attractiveness: The case of Québec City and Bordeaux. J. Destin. Mark. Manag. 2019, 11, 67–79. [Google Scholar] [CrossRef]
- Pröbstl-Haider, U.; Haider, W.; Wirth, V.; Beardmore, B. Will climate change increase the attractiveness of summer destinations in the European Alps? A survey of German tourists. J. Outdoor Recreat. Tour. 2015, 11, 44–57. [Google Scholar] [CrossRef]
- Katrovsky, A.; Kovalev, Y.; Mazhar, L.; Shcherbakova, S. Tourism in Border Regions: Theoretical Aspects of a Geographical Study. Balt. Reg. 2017, 9, 81–90. [Google Scholar] [CrossRef]
- Ghose, S.; Johann, M. Measuring tourist satisfaction with destination attributes. J. Manag. Financ. Sci. 2019, 9–22. Available online: https://econjournals.sgh.waw.pl/JMFS/article/view/704 (accessed on 1 May 2021).
- An, L.T.; Markowski, J.; Bartos, M.; Rzeńca, A.; Namiecinski, P. An evaluation of destination attractiveness for nature-based tourism: Recommendations for the management of national parks in Vietnam. Nat. Conserv. 2019, 32, 51–80. [Google Scholar] [CrossRef] [Green Version]
- Cracolici, M.F.; Nijkamp, P. The attractiveness and competitiveness of tourist destinations: A study of Southern Italian regions. Tour. Manag. 2009, 30, 336–344. [Google Scholar] [CrossRef]
- Łapko, A.; Panasiuk, A.; Strulak-Wójcikiewicz, R.; Landowski, M. The State of Air Pollution as a Factor Determining the Assessment of a City’s Tourist Attractiveness—Based on the Opinions of Polish Respondents. Sustainability 2020, 12, 1466. [Google Scholar] [CrossRef] [Green Version]
- Muhoho-Minni, P.; Lubbe, B.A. The role of the media in constructing a destination image: The Kenya experience. Communication 2017, 43, 58–79. [Google Scholar] [CrossRef]
- Stanowicka, A. Image Building Strategy on the Example of Selected Polish Regions. Olszt. Econ. J. 2014, 9, 333–343. [Google Scholar] [CrossRef]
- Lew, A.A. A framework of tourist attraction research. Ann. Tour. Res. 1987, 14, 553–575. [Google Scholar] [CrossRef]
- Middleton, V.T.C. Marketing w Turystyce; PAPT: Warszawa, Poland, 1996; p. 262. [Google Scholar]
- Leiper, N. Tourist attraction systems. Ann. Tour. Res. 1990, 17, 367–384. [Google Scholar] [CrossRef]
- Mandić, A.; Mrnjavac, Ž.; Kordić, L. Tourism Infrastructure, Recreational Facilities and Tourism Development. Tour. Hosp. Manag. 2018, 24, 41–62. [Google Scholar] [CrossRef]
- Marks-Bielska, R.; Lizińska, W.; Wojarska, M.; Babuchowska, K. Institutional efficiency versus stability of local governments in basic areas of activity: The case of Poland. Equilibrium 2020, 15, 463–487. [Google Scholar] [CrossRef]
- Panecka-Niepsuj, M. Zróżnicowanie przestrzenne poziomu rozwoju społeczno-gospodarczego miast średniej wielkości w Polsce. Studia Miej. 2015, 20, 167–177. [Google Scholar]
- Siemiński, J.L. Kontinuum miejsko-wiejskie i niektóre jego problemy infrastrukturalne. Infrastrukt. Ekol. Teren. Wiej. 2010, 2, 215–228. [Google Scholar]
- Szromek, A. Pomiar funkcji turystycznej obszarów za pomocą wskaźników funkcji turystycznej na przykładzie obszarów państw europejskich. Studia Ekon. 2013, 132, 91–103. [Google Scholar]
- Forest Data Bank. Available online: https://www.bdl.lasy.gov.pl/portal/ (accessed on 1 May 2021).
- National Institute of Cultural Heritage. Available online: https://www.nid.pl/en/ (accessed on 1 May 2021).
- Google Maps. Available online: https://www.google.pl/maps/preview (accessed on 1 May 2021).
- Pomianek, I.; Chrzanowska, M. A spatial comparison of semi-urban and rural gminas in Poland in terms of their level of socio-economic development using Hellwig’s method. Bull. Geogr. Soc. Econ. Ser. 2016, 33, 103–117. [Google Scholar] [CrossRef] [Green Version]
- Doroż, A.; Litwin, U.; Misiak, K.; Taszakowski, J. Multiple-Valued Method as an Assessment of Tourist Attractiveness of Urban Areas on the Example of Dobczyce. In Proceedings of the 2018 Baltic Geod. Congress (BGC Geomatics), Olsztyn, Poland, 21–23 June 2018; pp. 293–298. [Google Scholar] [CrossRef]
- Roszkowska, E.; Filipowicz-Chomko, M. Measuring Sustainable Development Using an Extended Hellwig Method: A Case Study of Education. Soc. Indic. Res. 2021, 153, 299–322. [Google Scholar] [CrossRef]
- Balcerzak, A.P. Multiple-criteria Evaluation of Quality of Human Capital in the European Union Countries. Econ. Sociol. 2016, 9, 11–26. [Google Scholar] [CrossRef] [Green Version]
- Marona, B.; Beemt-Tjeerdsma, A.V.D. Impact of Public Management Approaches on Municipal Real Estate Management in Poland and The Netherlands. Sustainability 2018, 10, 4291. [Google Scholar] [CrossRef] [Green Version]
- Wowrzeczka, B. City of Waste—Importance of Scale. Sustainability 2021, 13, 3909. [Google Scholar] [CrossRef]
- Liu, H.; Ma, Y.; Liu, Q.; Song, A.Y. Decision-Making of Green Space Utilization and Protection in Urban Fringe Based on Biodiversity Trade-Off. Sustainability 2020, 12, 1373. [Google Scholar] [CrossRef] [Green Version]
- Sadowski, A.; Wojcieszak, M.M. Geographic differentiation of agritourism activities in Poland vs. cultural and natural attractiveness of destinations at district level. PLoS ONE 2019, 14, e0222576. [Google Scholar] [CrossRef] [PubMed]
- Świdyńska, N. The attractiveness for investments of urban municipalities in the warmińsko-mazurskie voivodship. Barom. Regionalny. Anal. Progn. 2018, 16, 71–80. [Google Scholar]
- Roszko-Wójtowicz, E.; Grzelak, M.M. Macroeconomic stability and the level of competitiveness in EU member states: A comparative dynamic approach. Oeconomia Copernic. 2020, 11, 657–688. [Google Scholar] [CrossRef]
- Świdyńska, N. Rola Infrastruktury w Tworzeniu Warunków Lokalnego Rozwoju Społeczno-Gospodarczego na Przykładzie Gmin Wiejskich Województwa Warmińsko-Mazurskiego; Wydawnictwo Uniwersytetu Warmińsko-Mazurskiego: Olsztyn, Poland, 2021; p. 82. [Google Scholar]
- Chrobocińska, K.; Napiórkowska-Baryła, A.; Świdyńska, N.; Witkowska-Dąbrowska, M. Environment and the Competitiveness of Communes on the Exemple of the Warmińsko-Mazurskie Voivodeship; Wydawnictwo Uniwersytetu Warmińsko-Mazurskieg: Olsztyn, Poland, 2021; pp. 80–100. [Google Scholar]
- Wysocki, F. Metody Taksonomiczne w Rozpoznawaniu Typów Ekonomicznych Rolnictwa i Obszarów Wiejskich; Wydawnictwo Uniwersytetu Przyrodniczego w Poznaniu: Poznań, Poland, 2010. [Google Scholar]
- Ristić, D.; Vukoičić, D.; Milinčić, M. Tourism and sustainable development of rural settlements in protected areas—Example NP Kopaonik (Serbia). Land Use Policy 2019, 89, 104231. [Google Scholar] [CrossRef]
- Hjalager, A.-M.; Kwiatkowski, G.; Østervig Larsen, M. Innovation gaps in Scandinavian rural tourism. Scand. J. Hosp. Tour. 2018, 18, 1–17. [Google Scholar] [CrossRef]
- Campón-Cerro, A.M.; Hernández-Mogollón, J.M.; Alves, H. Sustainable improvement of competitiveness in rural tourism destinations: The quest for tourist loyalty in Spain. J. Destin. Mark. Manag. 2017, 6, 252–266. [Google Scholar] [CrossRef]
- Richards, G.; Wilson, J. Developing creativity in tourist experiences: A solution to the serial reproduction of culture? Tour. Manag. 2006, 27, 1209–1223. [Google Scholar] [CrossRef]
- Rani, H.A. Determination of tourism infrastructure development priority in Weh Island–Aceh using location quotien. Int. J. Emerg. Technol. Adv. Eng. 2017, 7. Available online: https://www.ijetae.com (accessed on 1 May 2021).
- Khan, S.A.R.; Qianli, D.; SongBo, W.; Zaman, K.; Zhang, Y. Travel and tourism competitiveness index: The impact of air transportation, railways transportation, travel and transport services on international inbound and outbound tourism. J. Air Transp. Manag. 2017, 58, 125–134. [Google Scholar] [CrossRef]
- Jovanović, S.; Ivana, I. Infrastructure as important determinant of tourism development in the countries of Southeast Europe. Ecoforum J. 2016, 5, 288–294. Available online: http://www.ecoforumjournal.ro/index.php/eco/article/view/329/216 (accessed on 1 May 2021).
- Deenihan, G.; Caulfield, B. Do tourists value different levels of cycling infrastructure? Tour. Manag. 2015, 46, 92–101. [Google Scholar] [CrossRef] [Green Version]
- Strategy of Socio-Economic Development of the Warmińsko-Mazurskie Province until 2025. Available online: http://strategia2025.warmia.mazury.pl/artykuly/72/strategia-2025.html (accessed on 1 August 2020).
- El-Gohary, H. Coronavirus and Halal Tourism and Hospitality Industry: Is It a Journey to the Unknown? Sustainability 2020, 12, 9260. [Google Scholar] [CrossRef]
- Nicola, M.; Alsafi, Z.; Sohrabi, C.; Kerwan, A.; Al-Jabir, A.; Iosifidis, C.; Agha, M.; Agha, R. The socio-economic implications of the coronavirus pandemic (COVID-19): A review. Int. J. Surg. 2020, 78, 185–193. [Google Scholar] [CrossRef]
- Gössling, S.; Scott, D.; Hall, C.M. Pandemics, tourism and global change: A rapid assessment of COVID-19. J. Sustain. Tour. 2020, 29, 1–20. [Google Scholar] [CrossRef]
- Korzeb, Z.; Niedziółka, P. Resistance of commercial banks to the crisis caused by the COVID-19 pandemic: The case of Poland. Equilibrium 2020, 15, 205–234. [Google Scholar] [CrossRef]
- Álvarez-Díaz, M.; González-Gómez, M.; Otero-Giráldez, M.S. Forecasting International Tourism Demand Using a Non-Linear Autoregressive Neural Network and Genetic Programming. Forecasting 2019, 1, 7. [Google Scholar] [CrossRef] [Green Version]
- Gunter, U.; Önder, I.; Smeral, E. Are Combined Tourism Forecasts Better at Minimizing Forecasting Errors? Forecasting 2020, 2, 12. [Google Scholar] [CrossRef]
- Uğur, N.G.; Akbıyık, A. Impacts of COVID-19 on global tourism industry: A cross-regional comparison. Tour. Manag. Perspect. 2020, 36, 100744. [Google Scholar] [CrossRef] [PubMed]
- Polat, N. Technical Innovations in Cruise Tourism and Results of Sustainability. Procedia Soc. Behav. Sci. 2015, 195, 438–445. [Google Scholar] [CrossRef] [Green Version]
- Pérez-Calderón, E.; Prieto-Ballester, J.M.; Miguel-Barrado, V.; Milanés-Montero, P. Perception of Sustainability of Spanish National Parks: Public Use, Tourism and Rural Development. Sustainability 2020, 12, 1333. [Google Scholar] [CrossRef] [Green Version]
- Madani, A.; Boutebal, S.E.; Benhamida, H.; Bryant, C.R. The Impact of Covid-19 Outbreak on the Tourism Needs of the Algerian Population. Sustainability 2020, 12, 8856. [Google Scholar] [CrossRef]
- Żemła, M. Reasons and Consequences of Overtourism in Contemporary Cities—Knowledge Gaps and Future Research. Sustainability 2020, 12, 1729. [Google Scholar] [CrossRef] [Green Version]
- Gračan, D.; Zadel, Z.; Rudančić-Lugarić, A. Strategic management of cultural-tourism resources. Acad. Tur. Tour. Innov. J. 2010, 3, 16–25. [Google Scholar]
- Florek, I.B. The role of tourism in European Union—Selected issues. J. Mod. Sci. 2018, 38, 41–52. [Google Scholar] [CrossRef]
- Apollo, M.; Rettinger, R. Mountaineering in Cuba: Improvement of true accessibility as an opportunity for regional development of communities outside the tourism enclaves. Curr. Issues Tour. 2019, 22, 1797–1804. [Google Scholar] [CrossRef]
- Durydiwka, M. Ruch turystyczny—Z centrum ku peryferiom. Pr. Studia Geogr. 2009, 42, 59–71. [Google Scholar]
Figure 1.
Location of the province of Warmia and Mazury. Source: own study.

Figure 2.
Intense tourist traffic of the province of Warmia and Mazury. Source: own study based on [3].
Figure 2.
Intense tourist traffic of the province of Warmia and Mazury. Source: own study based on [3].

Figure 3.
Tourist values of the province of Warmia and Mazury. Source: own study based on [3,69,70,71].

Figure 4.
Tourist infrastructure of the province of Warmia and Mazury Source: own study based on [3,69,70,71].


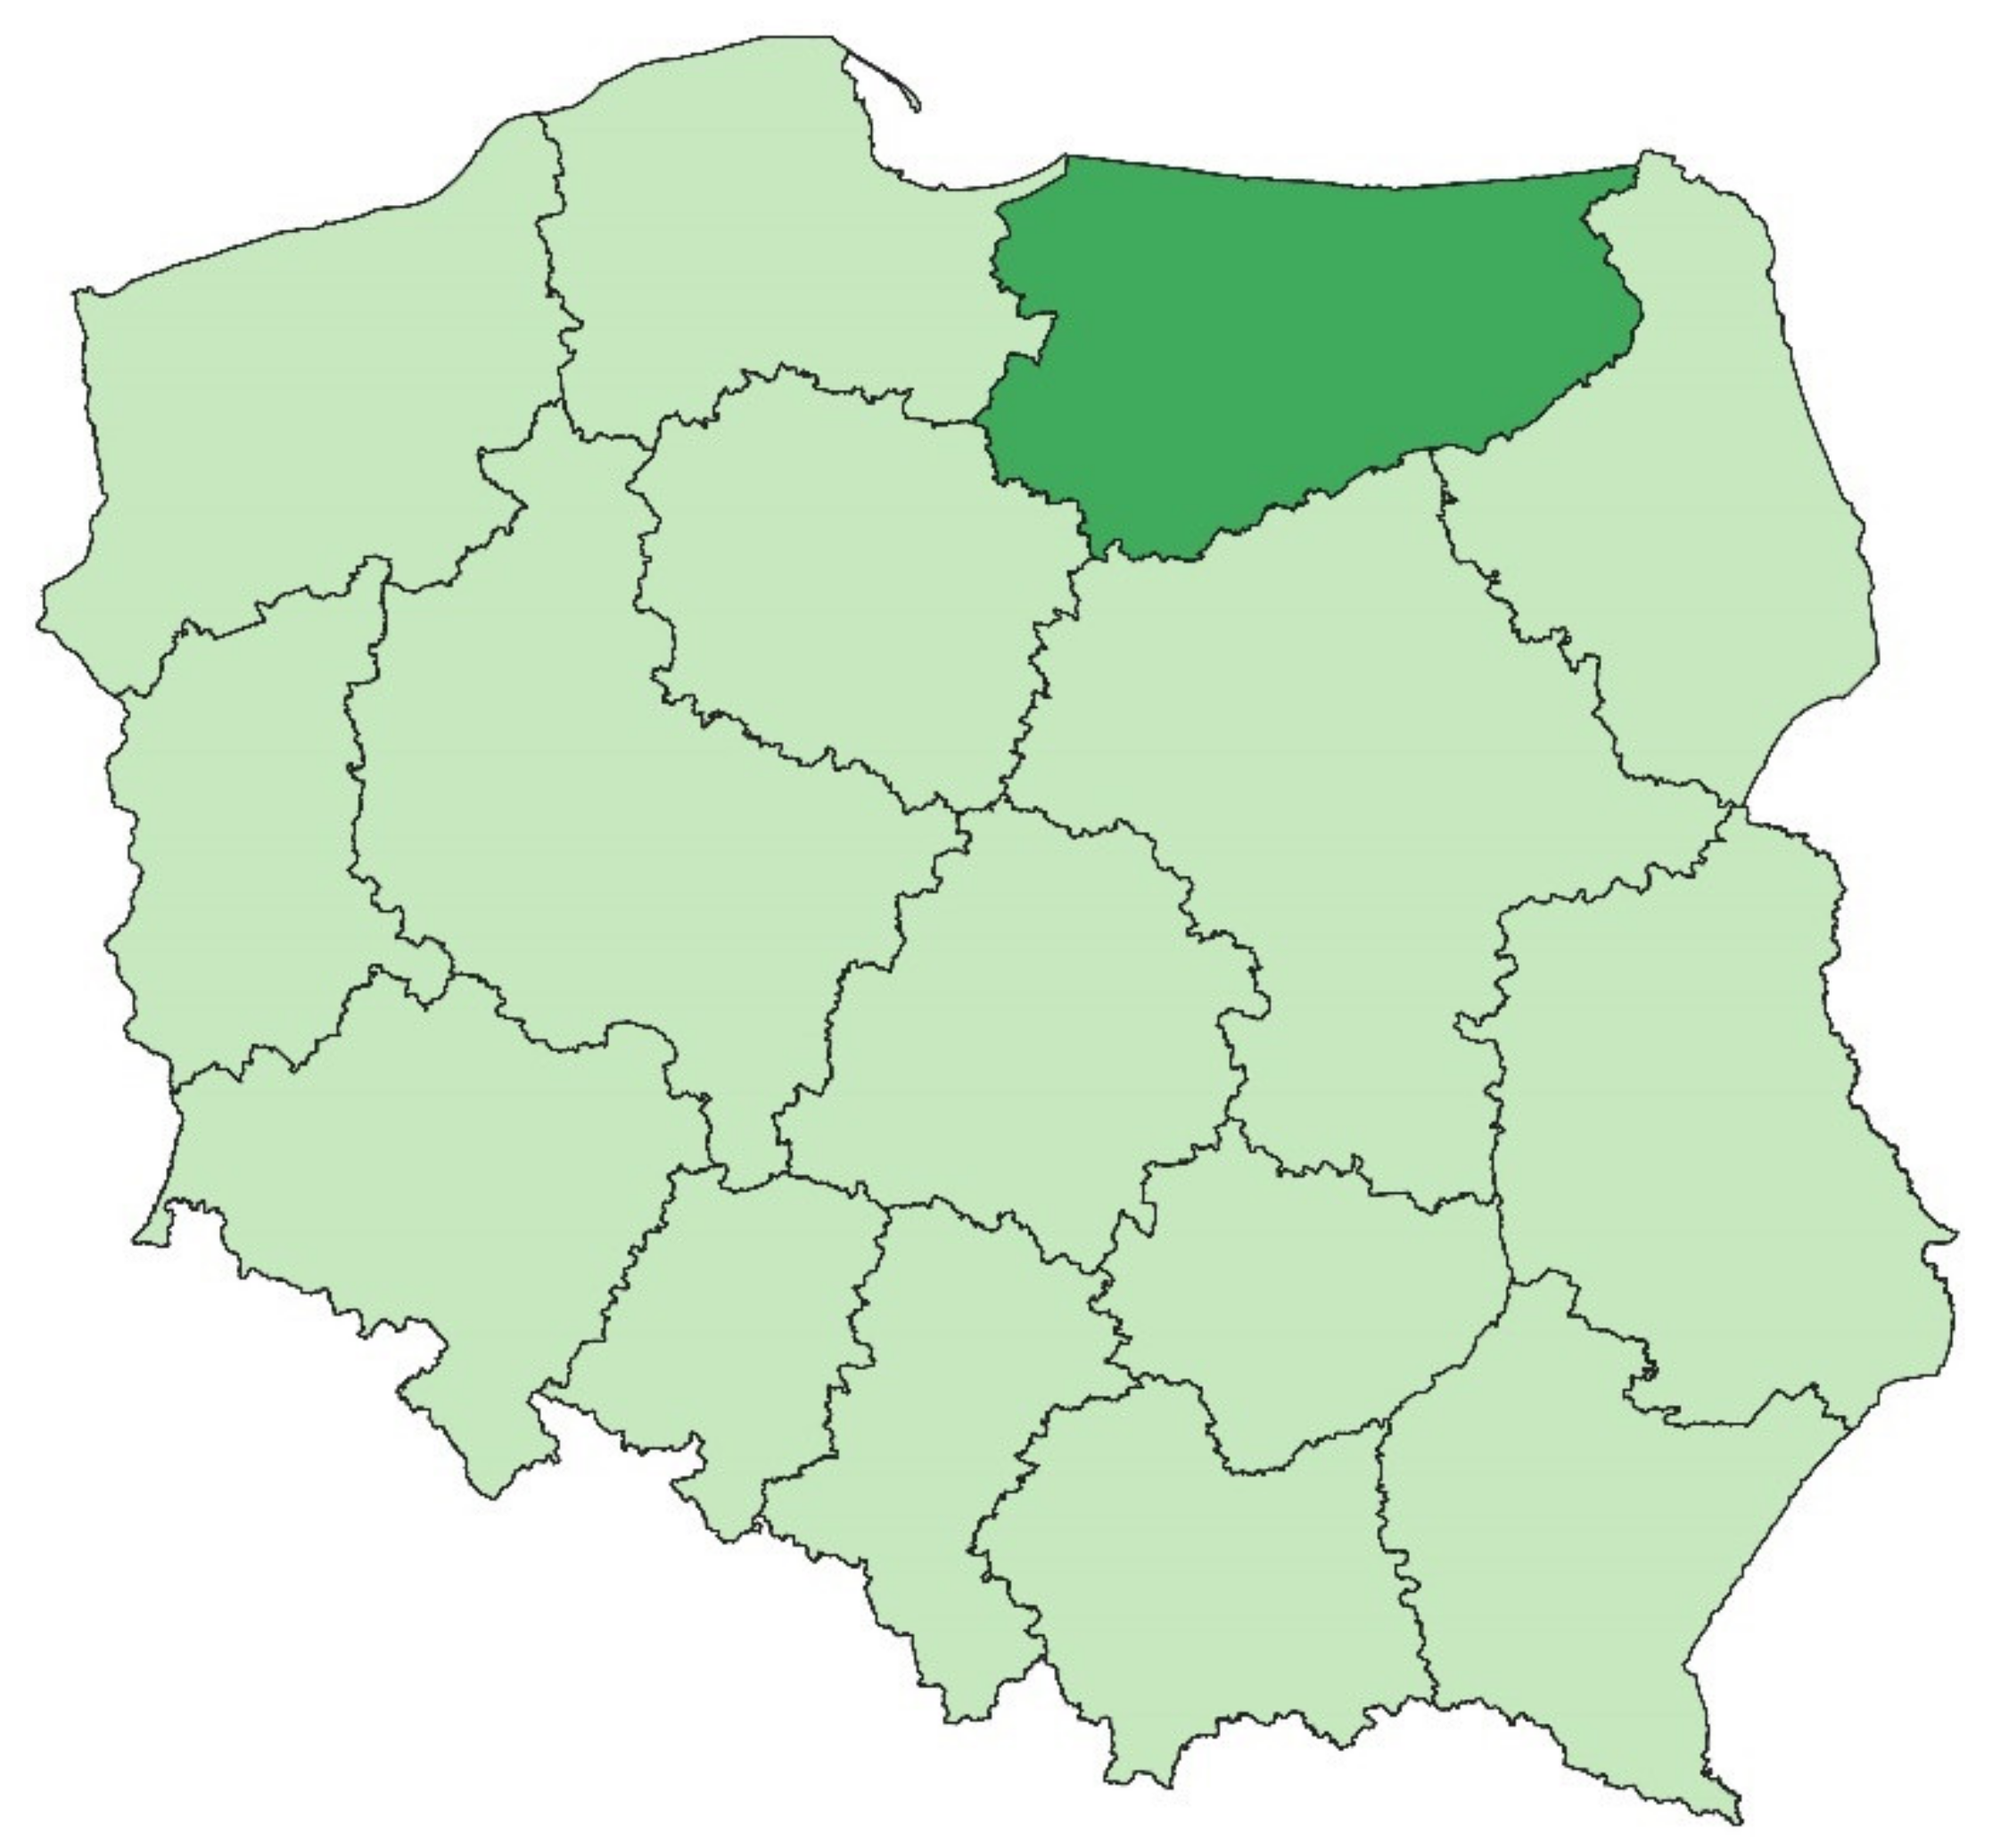
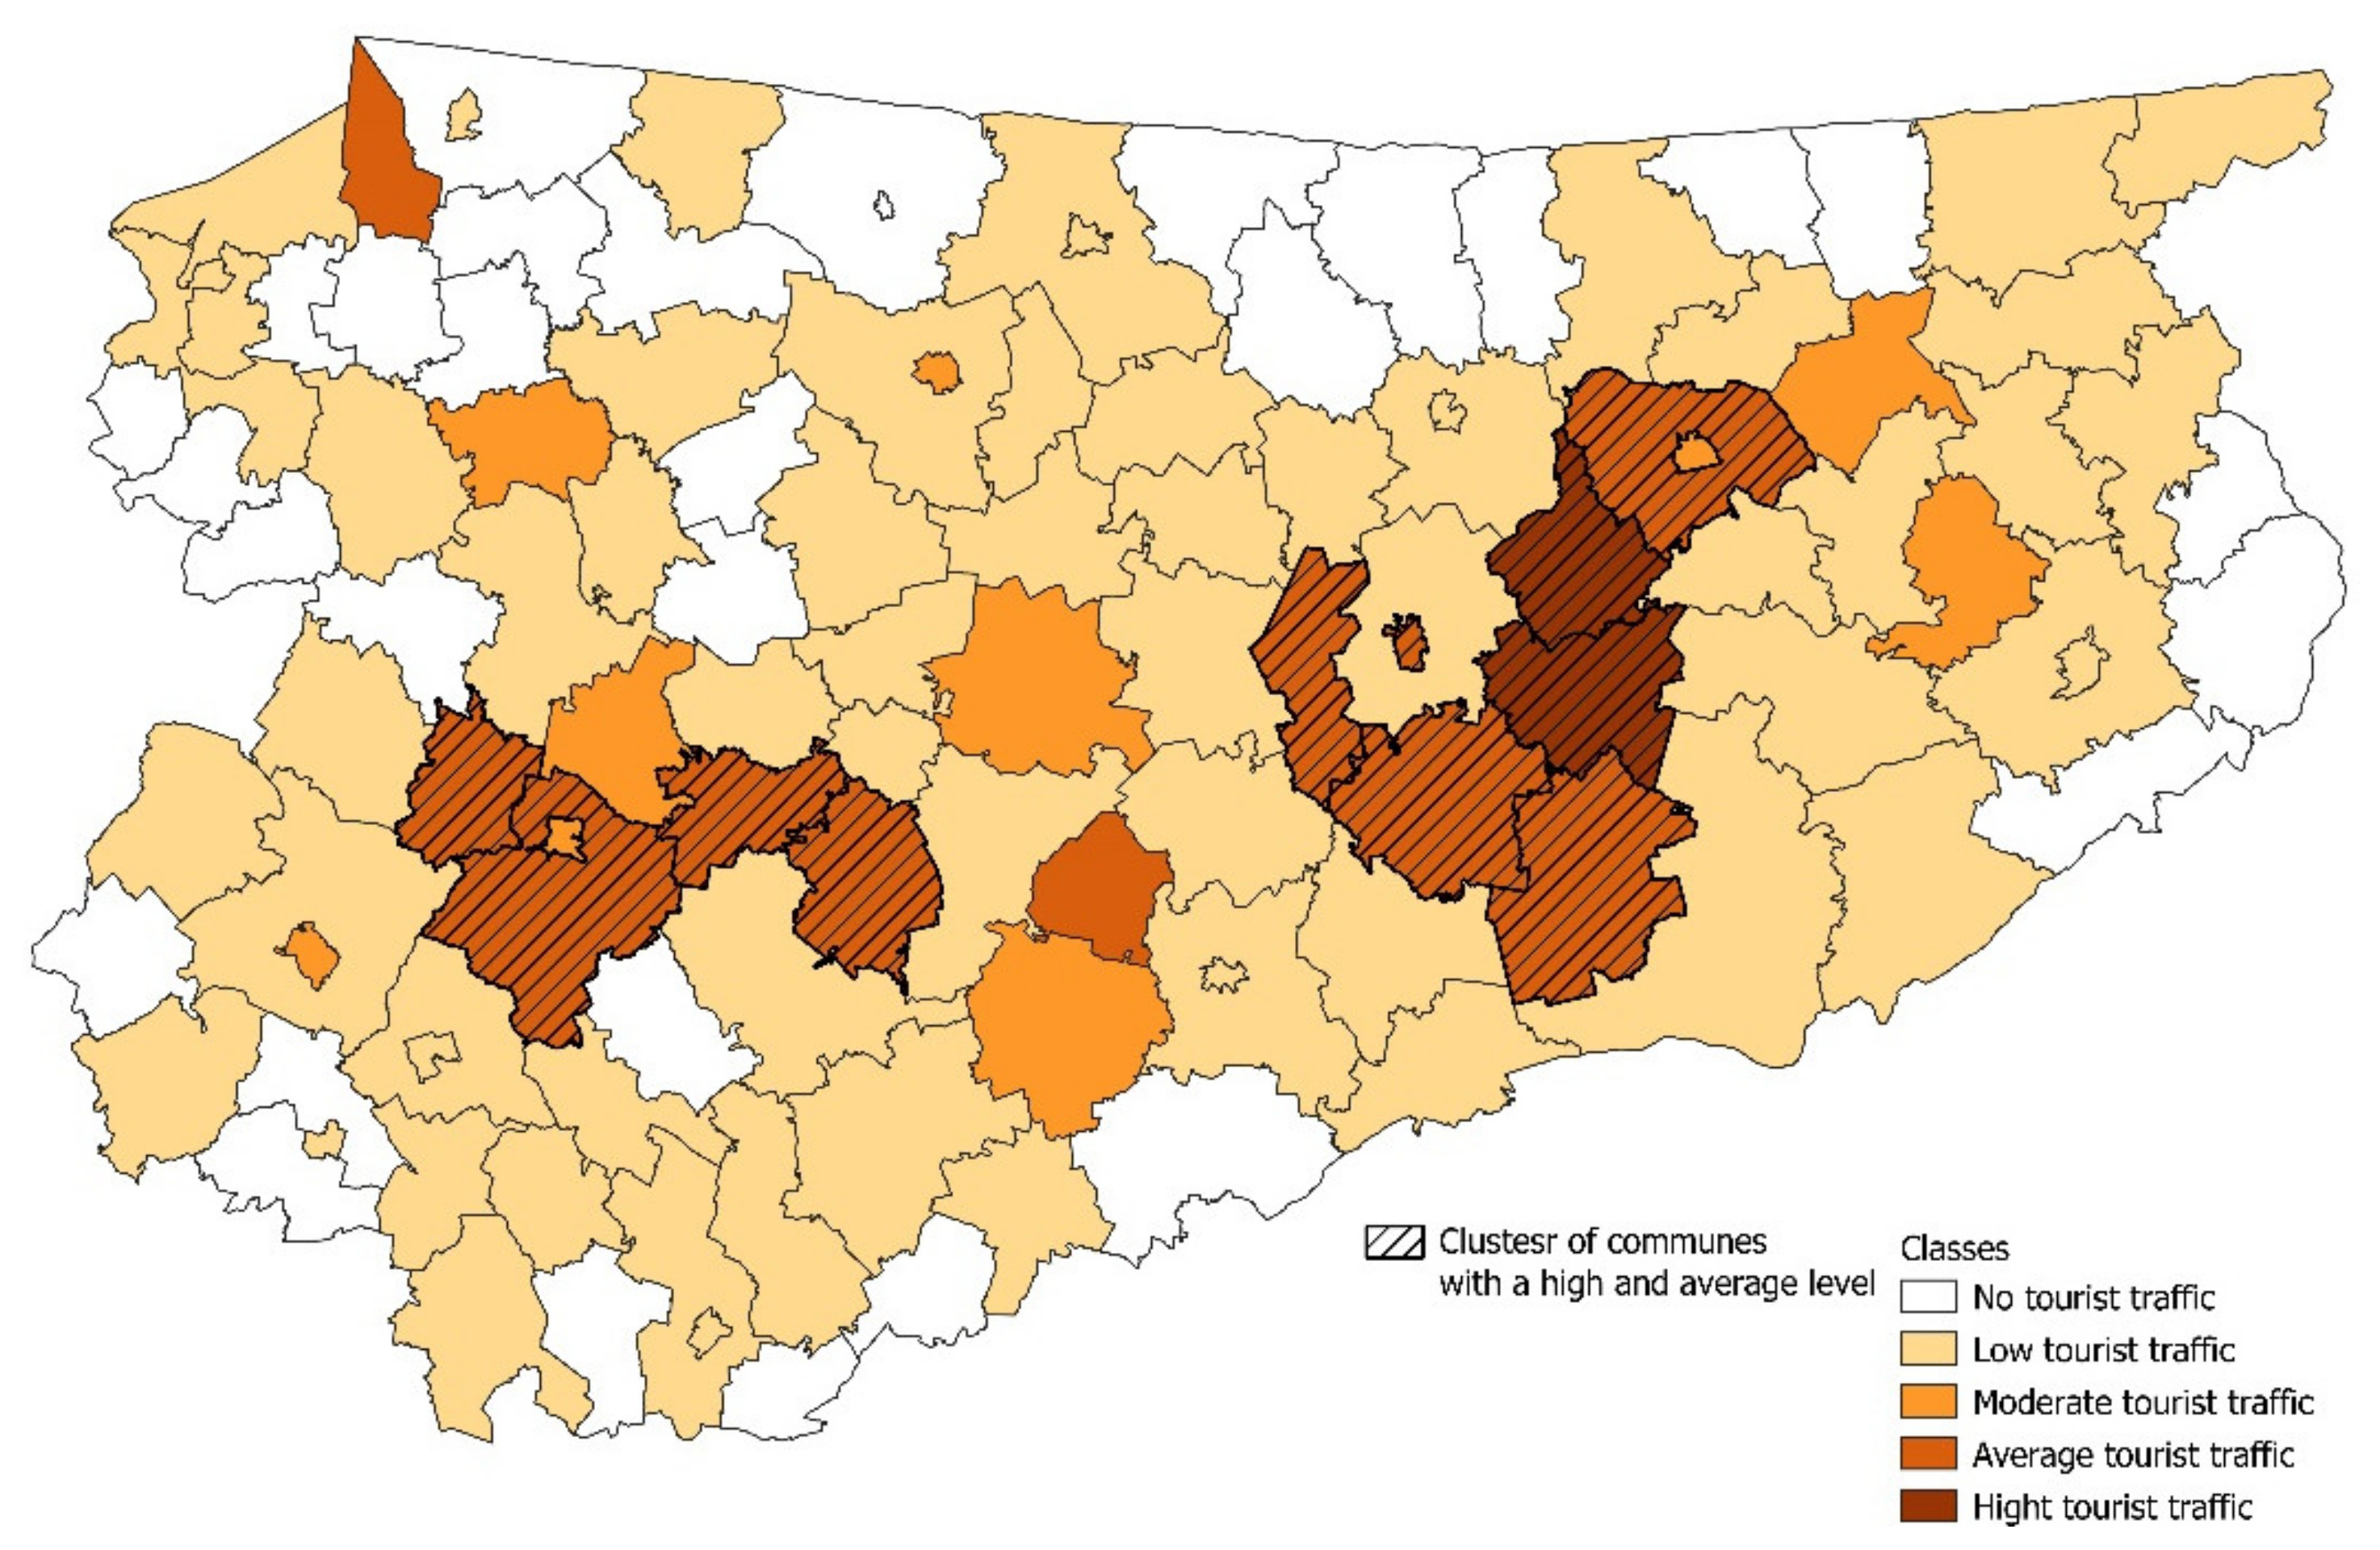
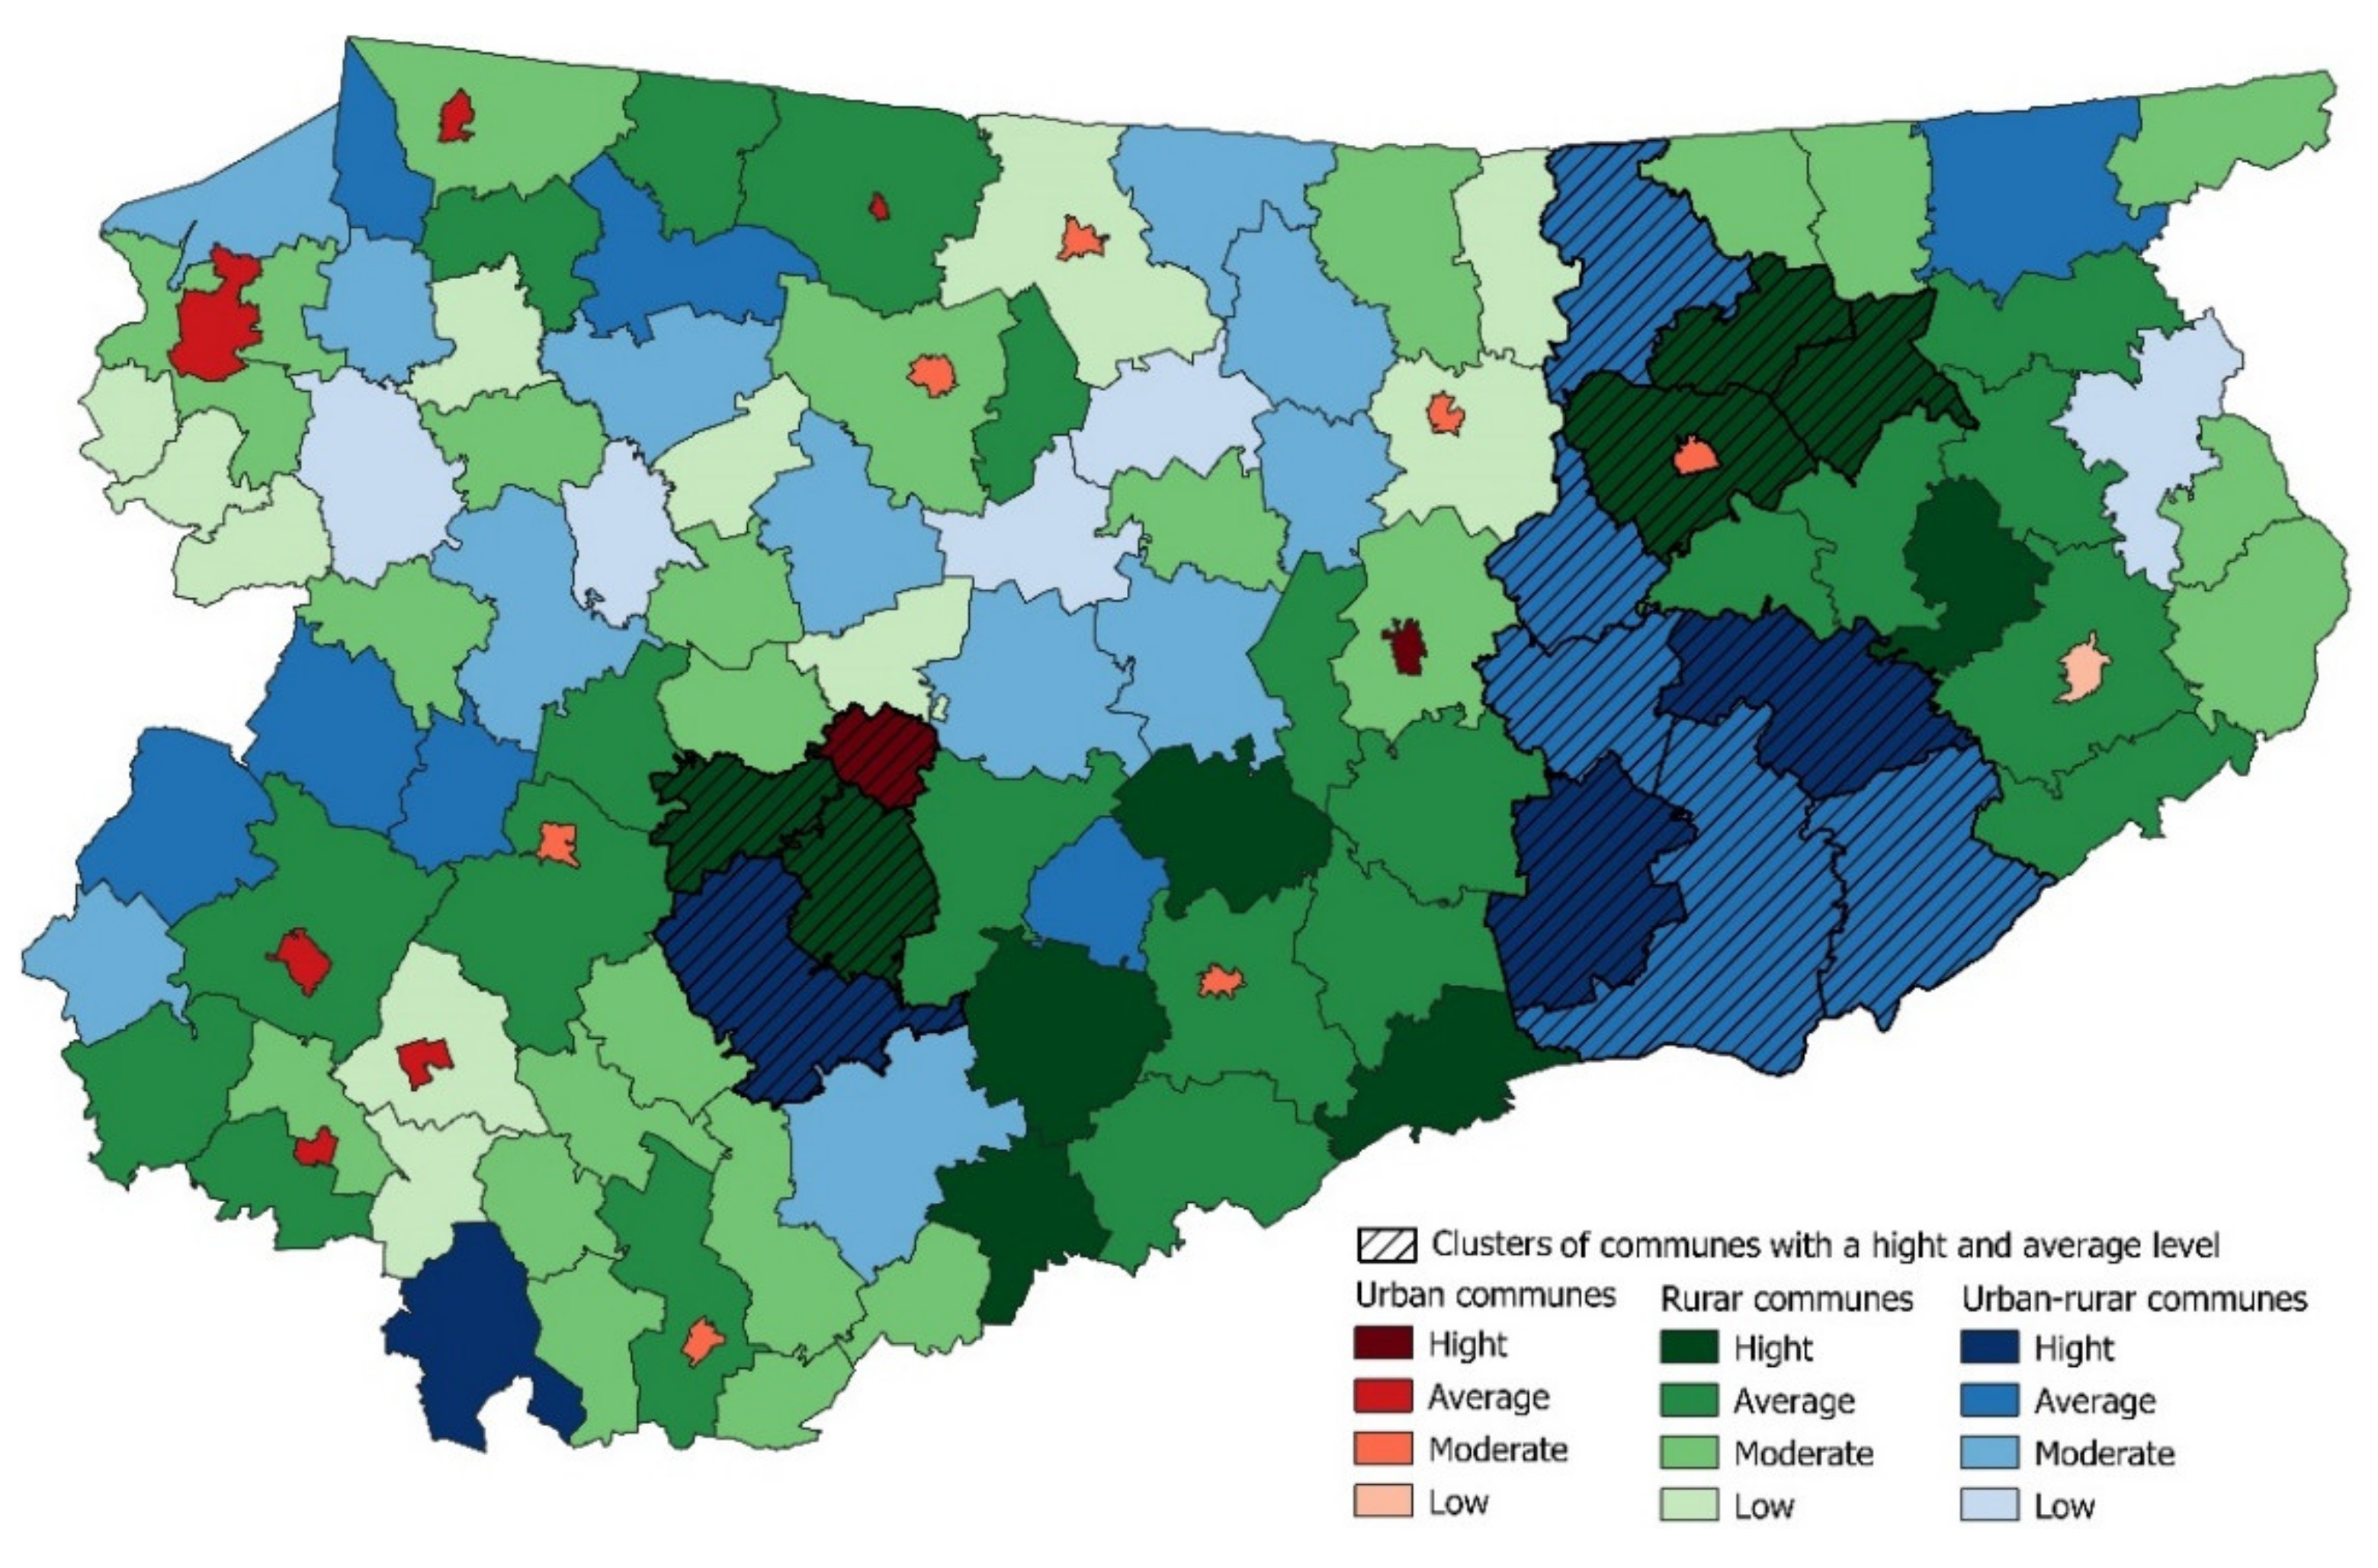
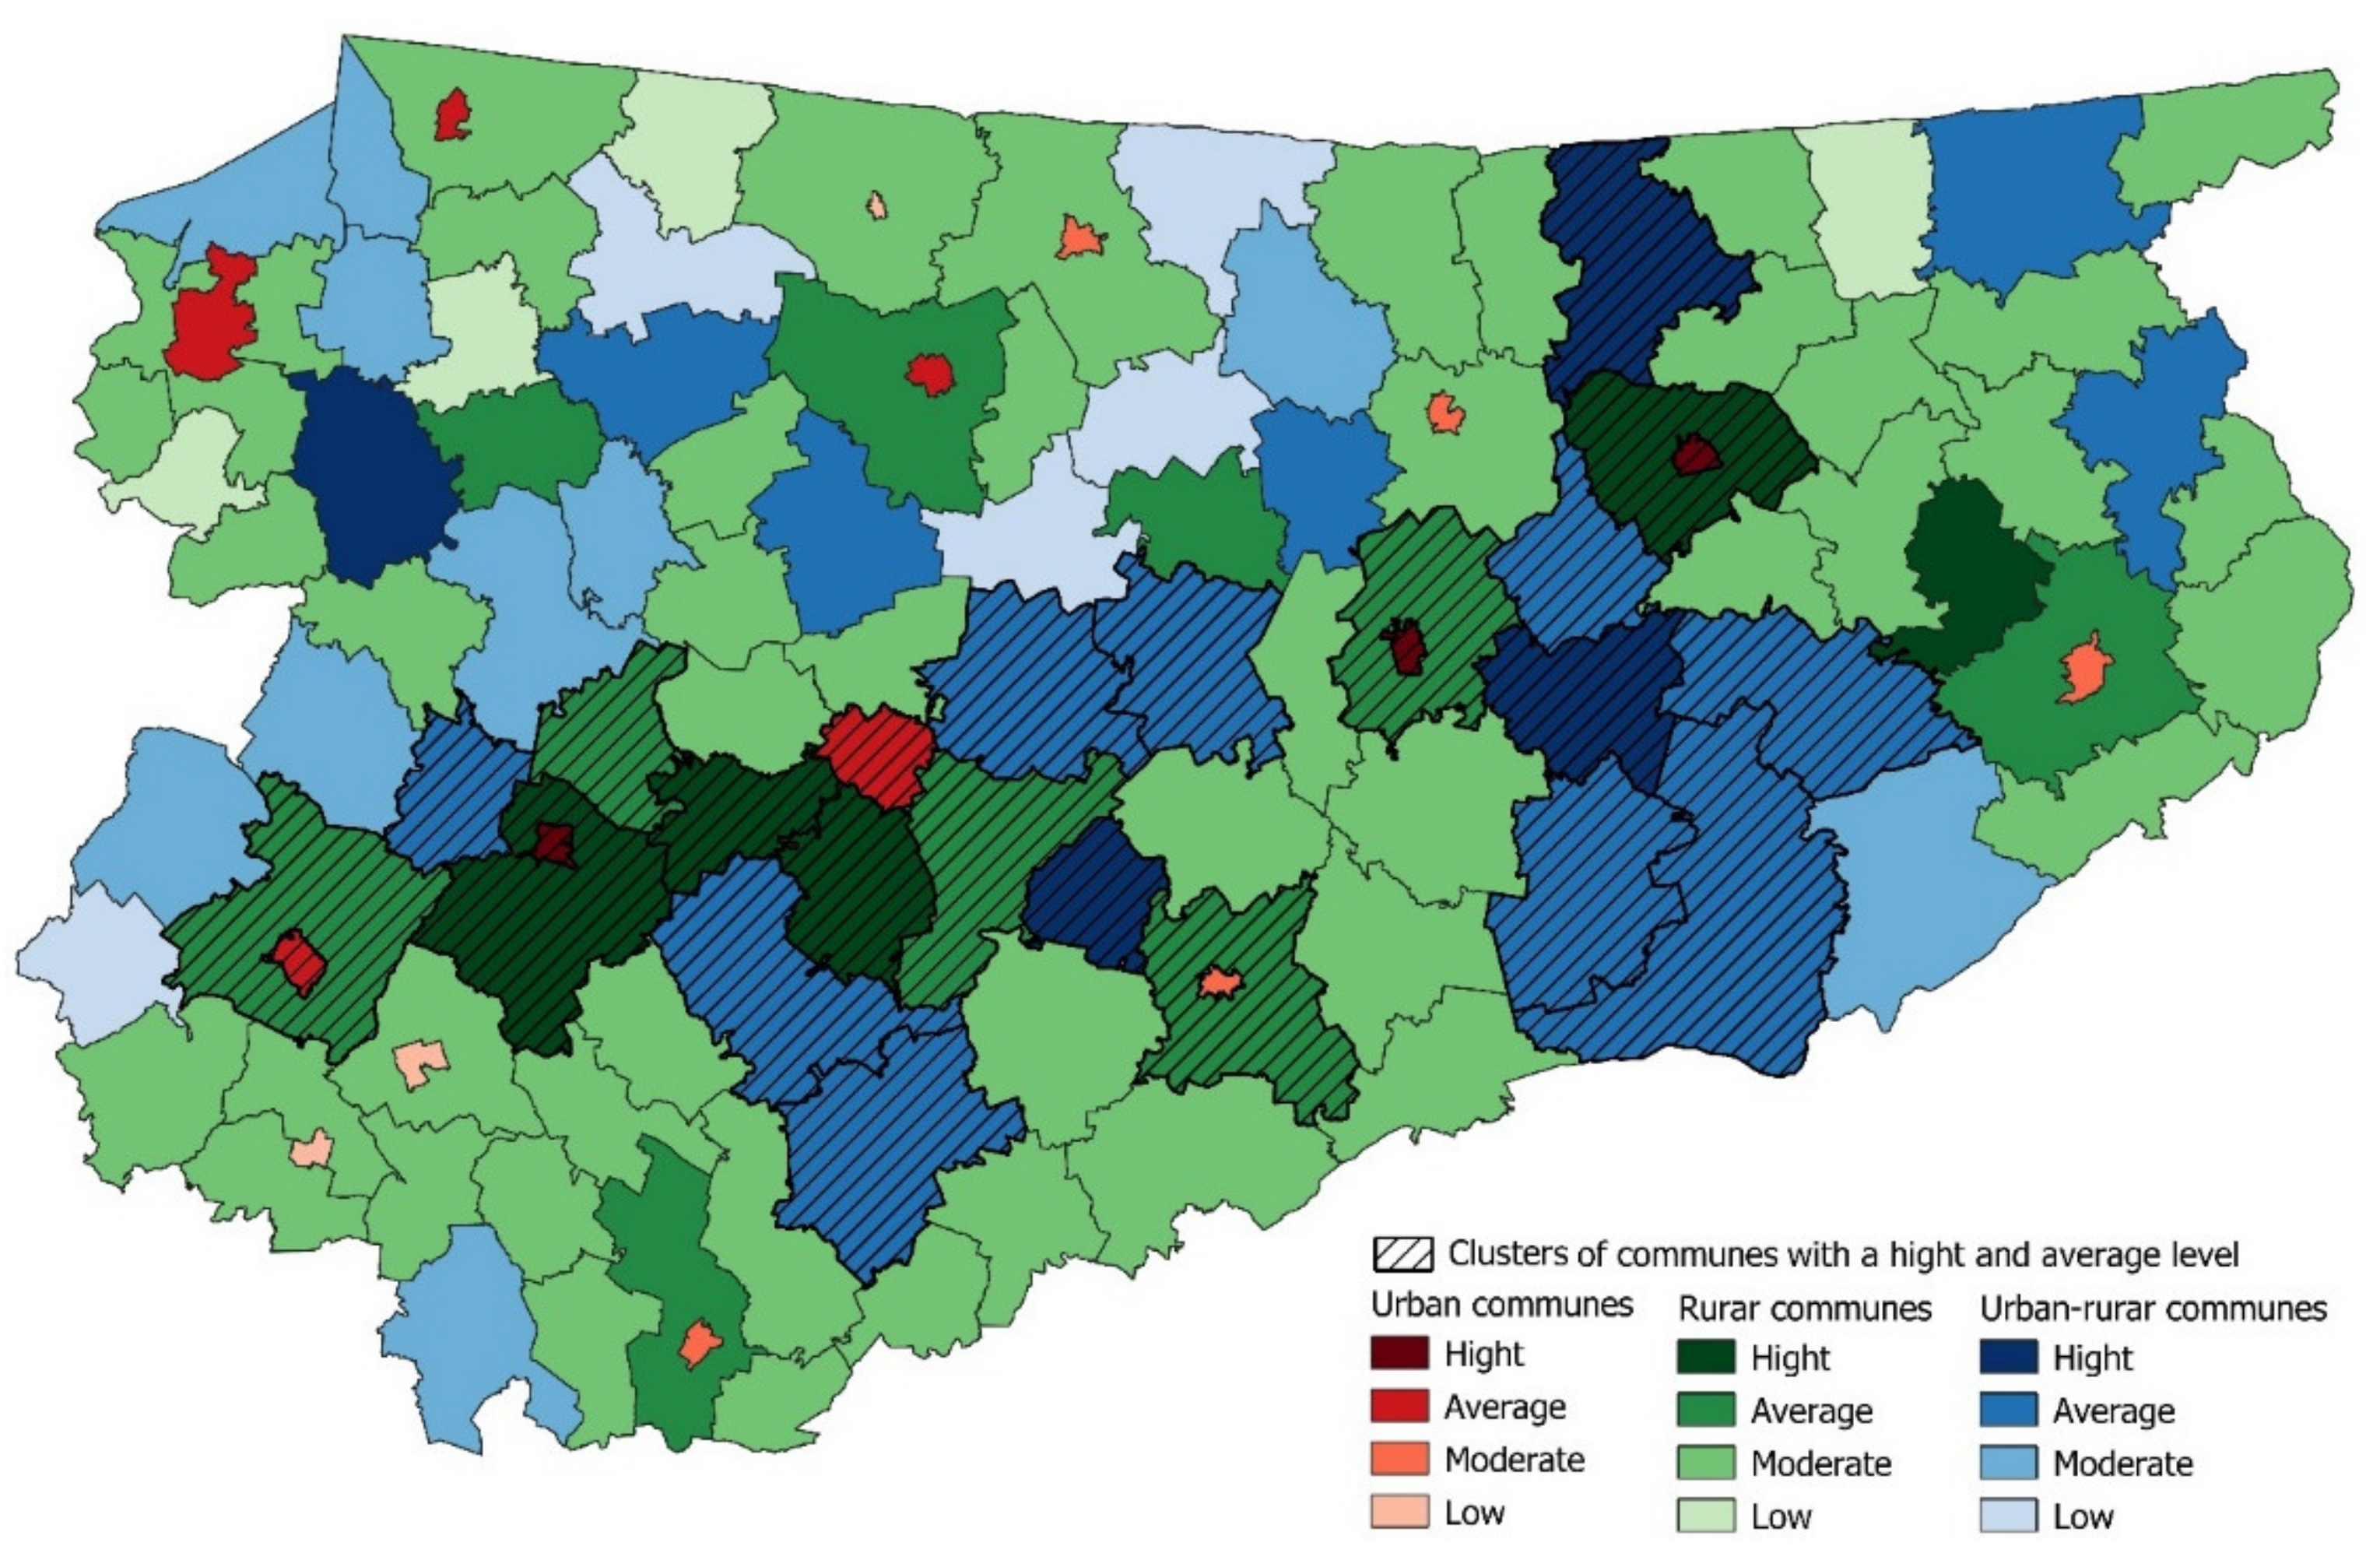
Table 1.
Characteristics of the research area.
| Commune | Population (p.) | Area (km2) | Population Density (p./km2) | ||||||
|---|---|---|---|---|---|---|---|---|---|
| R-U * | T * | RA * | R-U | T | RA | R-U | T | RA | |
| Bisztynek | 6466 | 2418 | 4048 | 203 | 2 | 201 | 32 | 1119 | 20 |
| Sępopol | 6415 | 2005 | 4410 | 246 | 5 | 241 | 26 | 433 | 18 |
| Frombork | 3655 | 2390 | 1265 | 124 | 8 | 116 | 29 | 315 | 11 |
| Pieniężno | 6405 | 2850 | 3555 | 243 | 4 | 239 | 26 | 748 | 15 |
| Lidzbark | 14,438 | 7996 | 6442 | 255 | 6 | 249 | 57 | 1408 | 26 |
| Młynary | 4509 | 1805 | 2704 | 158 | 3 | 155 | 28 | 654 | 17 |
| Pasłęk | 19,516 | 12,292 | 7224 | 264 | 11 | 253 | 74 | 1156 | 29 |
| Tolkmicko | 6829 | 2729 | 4100 | 208 | 2 | 206 | 33 | 1192 | 20 |
| Ryn | 5800 | 2900 | 2900 | 205 | 4 | 201 | 28 | 700 | 14 |
| Kisielice | 6079 | 2130 | 3949 | 173 | 3 | 170 | 35 | 632 | 23 |
| Susz | 12,914 | 5620 | 7294 | 259 | 7 | 252 | 50 | 843 | 29 |
| Zalewo | 6903 | 2165 | 4738 | 254 | 8 | 246 | 27 | 263 | 19 |
| Korsze | 10,016 | 4360 | 5656 | 250 | 4 | 246 | 40 | 1082 | 23 |
| Reszel | 7721 | 4676 | 3045 | 179 | 4 | 175 | 43 | 1224 | 17 |
| Orneta | 12,201 | 8921 | 3280 | 244 | 10 | 234 | 50 | 926 | 14 |
| Mikołajki | 8287 | 3854 | 4433 | 256 | 9 | 247 | 32 | 414 | 18 |
| Nidzica | 21,324 | 14,050 | 7274 | 379 | 7 | 372 | 56 | 2048 | 20 |
| Olecko | 22,037 | 16,448 | 5589 | 267 | 12 | 255 | 83 | 1425 | 22 |
| Barczewo | 17,662 | 7376 | 10,286 | 320 | 5 | 315 | 55 | 1610 | 33 |
| Biskupiec | 19,072 | 10,585 | 8487 | 290 | 5 | 285 | 66 | 2117 | 30 |
| Dobre Miasto | 16,075 | 10,414 | 5661 | 259 | 5 | 254 | 62 | 2143 | 22 |
| Jeziorany | 7852 | 3264 | 4588 | 211 | 3 | 208 | 37 | 957 | 22 |
| Olsztynek | 13,883 | 7656 | 6227 | 372 | 8 | 364 | 37 | 996 | 17 |
| Miłakowo | 5594 | 2596 | 2998 | 158 | 9 | 149 | 35 | 296 | 20 |
| Miłomłyn | 5030 | 2445 | 2585 | 161 | 12 | 149 | 31 | 197 | 17 |
| Morąg | 24,704 | 14,042 | 10,662 | 311 | 6 | 305 | 79 | 2298 | 35 |
| Biała Piska | 11,928 | 4046 | 7882 | 420 | 4 | 416 | 28 | 1249 | 19 |
| Orzysz | 9203 | 5673 | 3530 | 363 | 8 | 355 | 25 | 694 | 10 |
| Pisz | 27,911 | 19,449 | 8462 | 634 | 10 | 624 | 44 | 1929 | 14 |
| Ruciane-Nida | 8253 | 4609 | 3644 | 358 | 17 | 341 | 23 | 270 | 11 |
| Pasym | 5391 | 2542 | 2849 | 149 | 15 | 134 | 36 | 167 | 21 |
| Gołdap | 20,331 | 13,771 | 6560 | 362 | 17 | 345 | 56 | 801 | 19 |
| Węgorzewo | 17,056 | 11,509 | 5547 | 341 | 11 | 330 | 50 | 1058 | 17 |
* U-R–urban–rural commune; T–town in urban–rural commune; RA–rural areas in urban–rural commune. Source: [3].
Table 2.
Determinants of the tourist attractiveness of the communes.
| Sub-Indices | S/D * | |||
| Tourist Values | ||||
| Synthetic indicator of natural attractiveness | 1. Synthetic indicator of the natural attractiveness of the terrain (relief) | S | ||
| 2. Share of surface water in the total area of the commune (%) | S | |||
| 3. Share of forests in the total area of the commune (%) | S | |||
| Synthetic indicator of natural attractions | 4. Number of natural landmarks with respect to commune area (pcs/km2) | S | ||
| 5. Number of botanical and zoological gardens with respect to commune area (pcs/km2) | S | |||
| 6. Number of beaches with respect to commune area (pcs/km2) | S | |||
| 7. Number of towns with the status of a health resort with respect to commune area (pcs/km2) | S | |||
| Synthetic indicator of environmental condition | 8. Share of the population using the sewage treatment plant with respect to the commune population (%) | S | ||
| 9. Total amount of mixed waste collected during the year per 1 inhabitant (kg) | D | |||
| 10. Population density (persons/km2) | D | |||
| Synthetic indicator of protected areas | 11. Share of the nature reserves in the total area of the commune (%) | S | ||
| 12. Share of natural landscape parks in the total area of the commune (%) | S | |||
| 13. Share of protected landscape areas in the total area of the commune (%) | S | |||
| 14. Share of Natura 2000 areas in the total area of the commune (%) | S | |||
| 15. Share of sites protected under the Ramsar Convention in the total area of the commune (%) | S | |||
| Synthetic indicator of cultural attractiveness | 16. Synthetic indicator of historic buildings, number of immovable monuments per 1 km2 of the commune area | S | ||
| Synthetic indicator of museum, stage, and exhibition activities | 17. Galleries and art halls in total per 1000 inhabitants (number) | S | ||
| 18. Museums with branches per 1000 inhabitants (number) | S | |||
| 19. Museums per 1000 inhabitants (number) | S | |||
| 20. Theatres and musical institutions per 1000 inhabitants (number) | S | |||
| Synthetic indicator of cultural events | 21. Number of events per 1000 inhabitants hosted by centers, cultural centers and clubs and community centers (number) | S | ||
| 22. Number of public events (arts and entertainment, interdisciplinary, and sports) per 1000 inhabitants (number) | S | |||
| 23. Index of religious monuments - number of sanctuaries per 1000 inhabitants (number) | S | |||
| Tourist Infrastructure | ||||
| Synthetic indicator of transport accessibility | 24. Synthetic indicator of accessibility to transport infrastructure | S | ||
| 25. Synthetic indicator of the actual physical distance (road) from the adopted reference points (km) | D | |||
| Synthetic indicator of internal accessibility | 26. The percentage of roads in the geodetic structure of the commune area (%) | S | ||
| 27. The percentage of railroads in the geodetic structure of the commune area (%) | S | |||
| 28. Index of the length of bicycle paths per 10,000 km2 of the commune area (km) | S | |||
| Synthetic indicator of accommodation and catering facilities | 29. The availability of year-round accommodation facilities (number /km2) | S | ||
| 30. The availability of accommodation facilities in total (number /km2) | S | |||
| 31. The number of beds available all year round (number/km2) | S | |||
| 32. The total number of beds available (number /km2) | S | |||
| 33. Year-round dynamics of beds (previous year = 100) | S | |||
| 34. Share of business entities entered in the National Business Registry REGON in the accommodation sector in relation to the total number of entities (%) | S | |||
| 35. Share of business entities entered in the National Business Registry REGON register in the catering sector in relation to the total number of entities (%) | S | |||
| Synthetic indicator of auxiliary facilities | 36. Accommodation facilities offering spa treatments per 1000 inhabitants (number) | S | ||
| 37. Accommodation facilities offering activities supervised by an instructor per 1000 inhabitants (number) | S | |||
| 38. Accommodation facilities renting tourist equipment per 1000 inhabitants (number) | S | |||
| 39. Accommodation facilities with a swimming pool per 1000 inhabitants (number) | S | |||
| 40. A golf course per 1000 inhabitants (number) | S | |||
| 41. Length of bicycle paths per 1000 inhabitants (number) | S | |||
| 42. Accommodation facilities with a sauna per 1000 inhabitants (number) | S | |||
| 43. Accommodation facilities renting rowing and paddling equipment per 1000 inhabitants (number) | S | |||
| 44. Accommodation facilities with hippodrome/horse stables in the facility per 1000 inhabitants (number) | S | |||
| 45. Accommodation facilities equipped with a conference room per 1000 inhabitants (number) | S | |||
| 46. Commune budget expenses on tourism in section 630 per capita (PLN/person) | S | |||
Table 3.
Urban–rural communes of the province of Warmia and Mazury belonging to particular classes according to the elements shaping tourist attractiveness.
Table 3.
Urban–rural communes of the province of Warmia and Mazury belonging to particular classes according to the elements shaping tourist attractiveness.
| Studied Aspect | Classes | |||
|---|---|---|---|---|
| I | II | III | IV | |
| Tourist values | Ruciane-Nida (0.83), Lidzbark (0.58), Orzysz (0.51), Olsztynek (0.5) | Gołdap (0.44), Ryn (0.42), Biała Piska (0.41), Węgorzewo (0.4), Susz (0.4), Pisz (0.4), Zalewo (0.39), Frombork (0.38), Pieniężno (0.38), Miłomłyn (0.37), Pasym (0.34), Mikołajki (0.32) | Młynary (0.3), Orneta (0.29), Nidzica (0.27), Dobre Miasto (0.27), Korsze (0.27), Reszel (0.27), Tolkmicko (0.21), Biskupiec (0.21), Barczewo (0.2), Kisielice (0.18), Sępopol (0.17), Morąg (0.17) | Pasłęk (0.15), Jeziorany (0.15), Miłakowo (0.15), Bisztynek (0.14), Olecko (0.01) |
| Tourist infrastructure | Mikołajki (0.68), Pasym (0.57), Pasłęk (0.55), Węgorzewo (0.54) | Orneta (0.49), Ryn (0.48), Nidzica (0.48), Miłomłyn (0.47), Ruciane-Nida (0.45), Orzysz (0.45), Biskupiec (0.41), Gołdap (0.4), Olsztynek (0.39), Pisz (0.38), Olecko (0.36), Reszel (0.34), Barczewo (0.34), Dobre Miasto (0.33) | Frombork (0.3), Lidzbark (0.29), Morąg (0.28), Miłakowo (0.28), Młynary (0.23), Korsze (0.22), Tolkmicko (0.21), Susz (0.21), Zalewo (0.19), Biała Piska (0.17) | Jeziorany (0.16), Bisztynek (0.14), Pieniężno (0.04), Sępopol (0.03), Kisielice (0) |
Source: own study.
Table 4.
Value of indicators of synthetic tourist value and tourist infrastructure.
| Commune | Synthetic Indicator of Natural Attractiveness | Synthetic Indicator of Cultural Attractiveness | Synthetic Indicator of Transport Accessibility | Synthetic Indicator of Accommodation and Catering Facilities | Synthetic Indicator of Auxiliary Facilities |
|---|---|---|---|---|---|
| Barczewo | 0.23 | 0.06 | 0.43 | 0.18 | 0.17 |
| Biała Piska | 0.27 | 0.22 | 0.21 | 0.21 | 0.07 |
| Biskupiec | 0.22 | 0.07 | 0.71 | 0.24 | 0.13 |
| Bisztynek | 0.09 | 0.14 | 0.41 | 0.13 | 0.04 |
| Dobre Miasto | 0.21 | 0.14 | 0.49 | 0.27 | 0.08 |
| Frombork | 0.24 | 0.22 | 0.25 | 0.29 | 0.12 |
| Gołdap | 0.33 | 0.18 | 0.43 | 0.22 | 0.19 |
| Jeziorany | 0.16 | 0.08 | 0.16 | 0.18 | 0.11 |
| Kisielice | 0.14 | 0.12 | 0.15 | 0.05 | 0.07 |
| Korsze | 0.15 | 0.21 | 0.65 | 0.06 | 0.13 |
| Lidzbark | 0.40 | 0.24 | 0.33 | 0.22 | 0.12 |
| Mikołajki | 0.19 | 0.24 | 0.35 | 0.57 | 0.30 |
| Miłakowo | 0.26 | 0.01 | 0.21 | 0.29 | 0.11 |
| Miłomłyn | 0.43 | 0.06 | 0.36 | 0.27 | 0.26 |
| Młynary | 0.21 | 0.17 | 0.43 | 0.18 | 0.07 |
| Morąg | 0.18 | 0.08 | 0.40 | 0.19 | 0.12 |
| Nidzica | 0.21 | 0.14 | 0.71 | 0.31 | 0.13 |
| Olecko | 0.01 | 0.10 | 0.58 | 0.22 | 0.12 |
| Olsztynek | 0.33 | 0.25 | 0.49 | 0.23 | 0.15 |
| Orneta | 0.21 | 0.15 | 0.56 | 0.29 | 0.17 |
| Orzysz | 0.33 | 0.28 | 0.30 | 0.34 | 0.19 |
| Pasłęk | 0.14 | 0.10 | 0.60 | 0.24 | 0.32 |
| Pasym | 0.29 | 0.12 | 0.44 | 0.31 | 0.31 |
| Pieniężno | 0.21 | 0.33 | 0.26 | 0.02 | 0.09 |
| Pisz | 0.32 | 0.15 | 0.31 | 0.29 | 0.15 |
| Reszel | 0.13 | 0.25 | 0.28 | 0.29 | 0.13 |
| Ruciane-Nida | 0.71 | 0.24 | 0.09 | 0.55 | 0.33 |
| Ryn | 0.27 | 0.23 | 0.19 | 0.42 | 0.27 |
| Sępopol | 0.14 | 0.12 | 0.17 | 0.07 | 0.07 |
| Susz | 0.32 | 0.16 | 0.27 | 0.14 | 0.13 |
| Tolkmicko | 0.36 | 0.001 | 0.09 | 018 | 0.21 |
| Węgorzewo | 0.30 | 0.18 | 0.59 | 0.26 | 0.25 |
| Zalewo | 0.32 | 0.14 | 0.07 | 0.26 | 0.13 |
Source: own study.
Publisher’s Note: MDPI stays neutral with regard to jurisdictional claims in published maps and institutional affiliations. |
© 2021 by the authors. Licensee MDPI, Basel, Switzerland. This article is an open access article distributed under the terms and conditions of the Creative Commons Attribution (CC BY) license (https://creativecommons.org/licenses/by/4.0/).
Share and Cite
MDPI and ACS Style
Świdyńska, N.; Witkowska-Dąbrowska, M. Indicators of the Tourist Attractiveness of Urban–Rural Communes and Sustainability of Peripheral Areas. Sustainability 2021, 13, 6968. https://0-doi-org.brum.beds.ac.uk/10.3390/su13126968
AMA Style
Świdyńska N, Witkowska-Dąbrowska M. Indicators of the Tourist Attractiveness of Urban–Rural Communes and Sustainability of Peripheral Areas. Sustainability. 2021; 13(12):6968. https://0-doi-org.brum.beds.ac.uk/10.3390/su13126968
Chicago/Turabian StyleŚwidyńska, Natalia, and Mirosława Witkowska-Dąbrowska. 2021. "Indicators of the Tourist Attractiveness of Urban–Rural Communes and Sustainability of Peripheral Areas" Sustainability 13, no. 12: 6968. https://0-doi-org.brum.beds.ac.uk/10.3390/su13126968
Note that from the first issue of 2016, this journal uses article numbers instead of page numbers. See further details here.