Article

Inventory of Locations of Old Mining Works Using LiDAR Data: A Case Study in Slovakia

1
Institute of Geodesy, Cartography and Geographical Information Systems, Faculty of Mining, Ecology, Process Control and Geotechnology, Technical University of Kosice, 04200 Kosice, Slovakia
2
Department of Geofond, State Geological Institute of Dionýz Štúr, 81704 Bratislava, Slovakia
3
Department of Geodesy and Mine Surveying, Faculty of Mining and Geology, VSB—Technical University of Ostrava, 70833 Ostrava, Czech Republic
*
Author to whom correspondence should be addressed.
Sustainability 2021, 13(12), 6981; https://0-doi-org.brum.beds.ac.uk/10.3390/su13126981
Submission received: 22 April 2021 / Revised: 15 June 2021 / Accepted: 16 June 2021 / Published: 21 June 2021

Abstract

:
The concept of further sustainable development in the area of administration of the register of old mining works and recent mining works in Slovakia requires precise determination of the locations of the objects that constitute it. The objects in this register have their uniqueness linked with the history of mining in Slovakia. The state of positional accuracy in the registration of objects in its current form is unsatisfactory. Different database sources containing the locations of the old mining works are insufficient and show significant locational deviations. For this reason, it is necessary to precisely locate old mining works using modern measuring technologies. The most effective approach to solving this problem is the use of LiDAR data, which at the same time allow determining the position and above-ground shape of old mining works. Two localities with significant mining history were selected for this case study. Positional deviations in the location of old mining works among the selected data were determined from the register of old mining works in Slovakia, global navigation satellite system (GNSS) measurements, multidirectional hill-shading using LiDAR, and accessible data from the open street map. To compare the positions of identical old mining works from the selected database sources, we established differences in the coordinates (ΔX, ΔY) and calculated the positional deviations of the same objects. The average positional deviation in the total count of nineteen objects comparing documents, LiDAR data, and the register was 33.6 m. Comparing the locations of twelve old mining works between the LiDAR data and the open street map, the average positional deviation was 16.3 m. Between the data sources from GNSS and the registry of old mining works, the average positional deviation of four selected objects was 39.17 m.

1. Introduction

The Slovak Republic (SR) is historically known for its intensive mining activity, which has left visible traces—old mining works (OMW). The number of OMW objects located on the earth’s surface is estimated at several tens of thousands. This OMW group is mainly represented by shafts, adit portals (entrances), mine dumps, pings, and tailing ponds. Paragraph 35 of Act No. 44/1988 Coll. on the protection and utilization of mineral resources (the Mining Act), as amended, states that OMW is supposed to mean an underground mining work that is abandoned, and whose original operator or legal successor does not exist. The Ministry for the Environment of the Slovak Republic ensures the identification of OMWs and keeps their register or entrusts it to another organization. It is necessary to gather and analyze data and other information on this knowledge base of mining activity for many objective reasons (especially various changes in the land cover’s original structure). A comprehensive set of information in the documentation about these objects is necessary to manage several processes taking place in the area (e.g., remediation, removal of environmental damage and burdens, construction activities, or minimizing the negative effects of waste on the environment [1]). The State Geological Institute of Dionýz Štúr (SGIDŠ) is an organization authorized through the Department of Geofond to ensure the registration of OMW and keep other specialized registers. Sections 13 and 14 of Decree No. 33/2015 Coll., which implements specific provisions of the Mining Act, define the OMW survey procedure. This law further describes the register of old mining works and recent mining works (hereinafter referred to as the R-OMW). Individual registers are available, for the general public and experts, on the organization’s website in the form of GIS map applications (https://www.geology.sk/geoinfoportal/mapovy-portal/registre-geofondu/, accessed date: 10 March 2021). The application for old and recent mining works (https://apl.geology.sk/geofond/sbd/, accessed date: 10 March 2021), which shows layers of old and more recent mining works, was created based on data from archive materials and final reports [2]. These are point objects of old and more recent mining works protruding on the surface. The application also contains a line layer showing the course of the mining works. The R-OMW in its current form reveals several shortcomings, including the credibility of the location of OMW on the base maps of the Slovak Republic (scale 1:10,000) and the related geolocations of its objects. The great effort of the SGIDŠ Geofond department was to analyze the state of the R-OMW and prepare a proposal to improve its current form.
Based on the R-OMW’s shortcomings, it was necessary for ensuring the sustainability of this register to propose a suitable methodology for specifying the determination of the locations of OMW within the inventory and administration of the R-OMW. The processing is therefore based at the theoretical level of the research work underlying the renovated world databases, which deal with similar topics. From a conceptual point of view, the study is based on methodological approaches in the field of LiDAR point clouds processing [3,4]. The methodology used in this study provides a suitable conceptual basis for the transfer of knowledge to the academic environment. In the ranks of interested groups of experts on old mining works in the conditions of the Slovak Republic, there is a discussion about the topicality of the applicable legislation (the Mining Act), which dates from 1988 and has not undergone significant changes since then. Emphasis needs to be placed on the current methods in spatial data collection, and on updates concerning the registration of old mining works. At the same time, it is necessary to emphasize that the issue of OMW is very particular, so we rely on base knowledge, especially from abandoned areas/heritage in the OMW geolocation.
OMW mapping, mainly in forest areas, is usually based on field surveys by geologists and other stakeholders. This work is very time-consuming, and the field survey carried out in this way, in the mentioned conditions, allows covering only small areas. Detailed mapping of OMW in wooded areas, based on field inspections, is therefore very expensive. The results of such surveys (i.e., OMW geolocations) need to be visualized based on the digital elevation model (DEM). The DEM is a numerical representation of the earth’s surface without any other objects in its plane. The DEM is one of the most critical sets of geospatial information used in various applications. Data for DEM formation in mapping large areas can be obtained by multiple available technologies (mainly terrestrial photogrammetry [5] and remote sensing/contactless data collection). Creating a DEM from satellite/aerial images has been addressed in recent years by several research teams. Images from digital aerial photogrammetry (DAP) [6,7], very high spatial resolution satellite images [8], and interferometric synthetic aperture radar (InSAR) [9] can be used as the input for DEM generation, as well as the light detection and ranging (LiDAR) point cloud from aerial laser scanning (ALS) [10,11].
Currently, ALS is the most widely used tool for data acquisition for DEM generation [12,13]. Many applications of LiDAR data have been published so far [3,4], and this trend is increasing due to better availability, coverage of large areas (including entire countries) and lower costs of LiDAR, or even free availability for scientific purposes. ALS LiDAR has been used for mapping various reliefs, including gullies [14], landslides [15], karst sinkholes [16,17], and coastal landforms [18]. ALS provides a considerable size of cloud point files created from registered data. Two main steps are required to process the ASL data to create a DEM [19]. The first step is the filtering/classification of the ground points, and the second step is the interpolation of the terrain of the relief based on the sets of filtered points. In two studies [13,20], the authors compared interpolation methods and their effect on DEM accuracy, and concluded that linear and natural neighbor interpolators provided the smallest total error ranges. The most accurate DEMs were created based on interpolations in ArcMap and TerraScan [19].
ALS data offer accurate three-dimensional measurements of the terrain surface, and this technology is also used in archaeology [21,22,23,24]. In a study [25] based on a point cloud from ALS with a density of 10 pt/m2, they generated DEM, and after reducing the point cloud to densities of 5 pt/m2 and 1 pt/m2, they generated another two variants of the DEM. The results show that, based on the higher density of the cloud point with a smaller average distance between the points, it is possible to detect the impacts of human activity, i.e., small-scale terrain changes. ALS technology requires the scanned areas to be as sparsely covered with vegetation as possible, and the time and date of the scanning are equally important. The best results are obtained in the spring months, after the snow cover recedes. Good results can also be achieved in the autumn, but freshly fallen leaves can fill depressions [21], contributing to inaccurate results.
To consider selected shortcomings of the current registration of R-OMW objects, their spatial distribution, and contemporary methods of determining their location, selected database sources were evaluated and compared in this study. The proposed solution concept has its basis in using LiDAR point clouds for two chosen areas in the years 2018–2019. With this chosen approach, this study aims to point out the current incompatibility of database sources.
The main contributions of the study include the following:
(1)
Exploration of the current state of R-OMW objects;
(2)
Investigation of the real situation using LiDAR point cloud;
(3)
Comparison of positional coordinates belonging to a specific object in selected database sources;
(4)
Determination of positional deviations and their evaluation.
The sustainability of this study is linked to the area of data infrastructure (access to accurate spatial data), which is closely related to the inventory of spatial distribution of R-OMW objects. Through the correct and precise spatial registration of OMWs, it is possible to predict and eliminate the economic impacts of this group of objects on the environment and national economy [26].

2. Materials and Methods

Our study focused on the inventory of spatial data defining OMW positions in the locality of Banská Štiavnica and the locality of the hamlet called Magurka in the Low Tatra mountains. The starting point for processing the study was analyzing ALS LiDAR files (*.las files). In the processing methodology (Figure 1), we considered determining the locations of mining works from the *.las files. To fulfil the chosen methodology’s main idea, it was necessary to specify OMW into two categories, for which different methodological approaches of processing were selected.

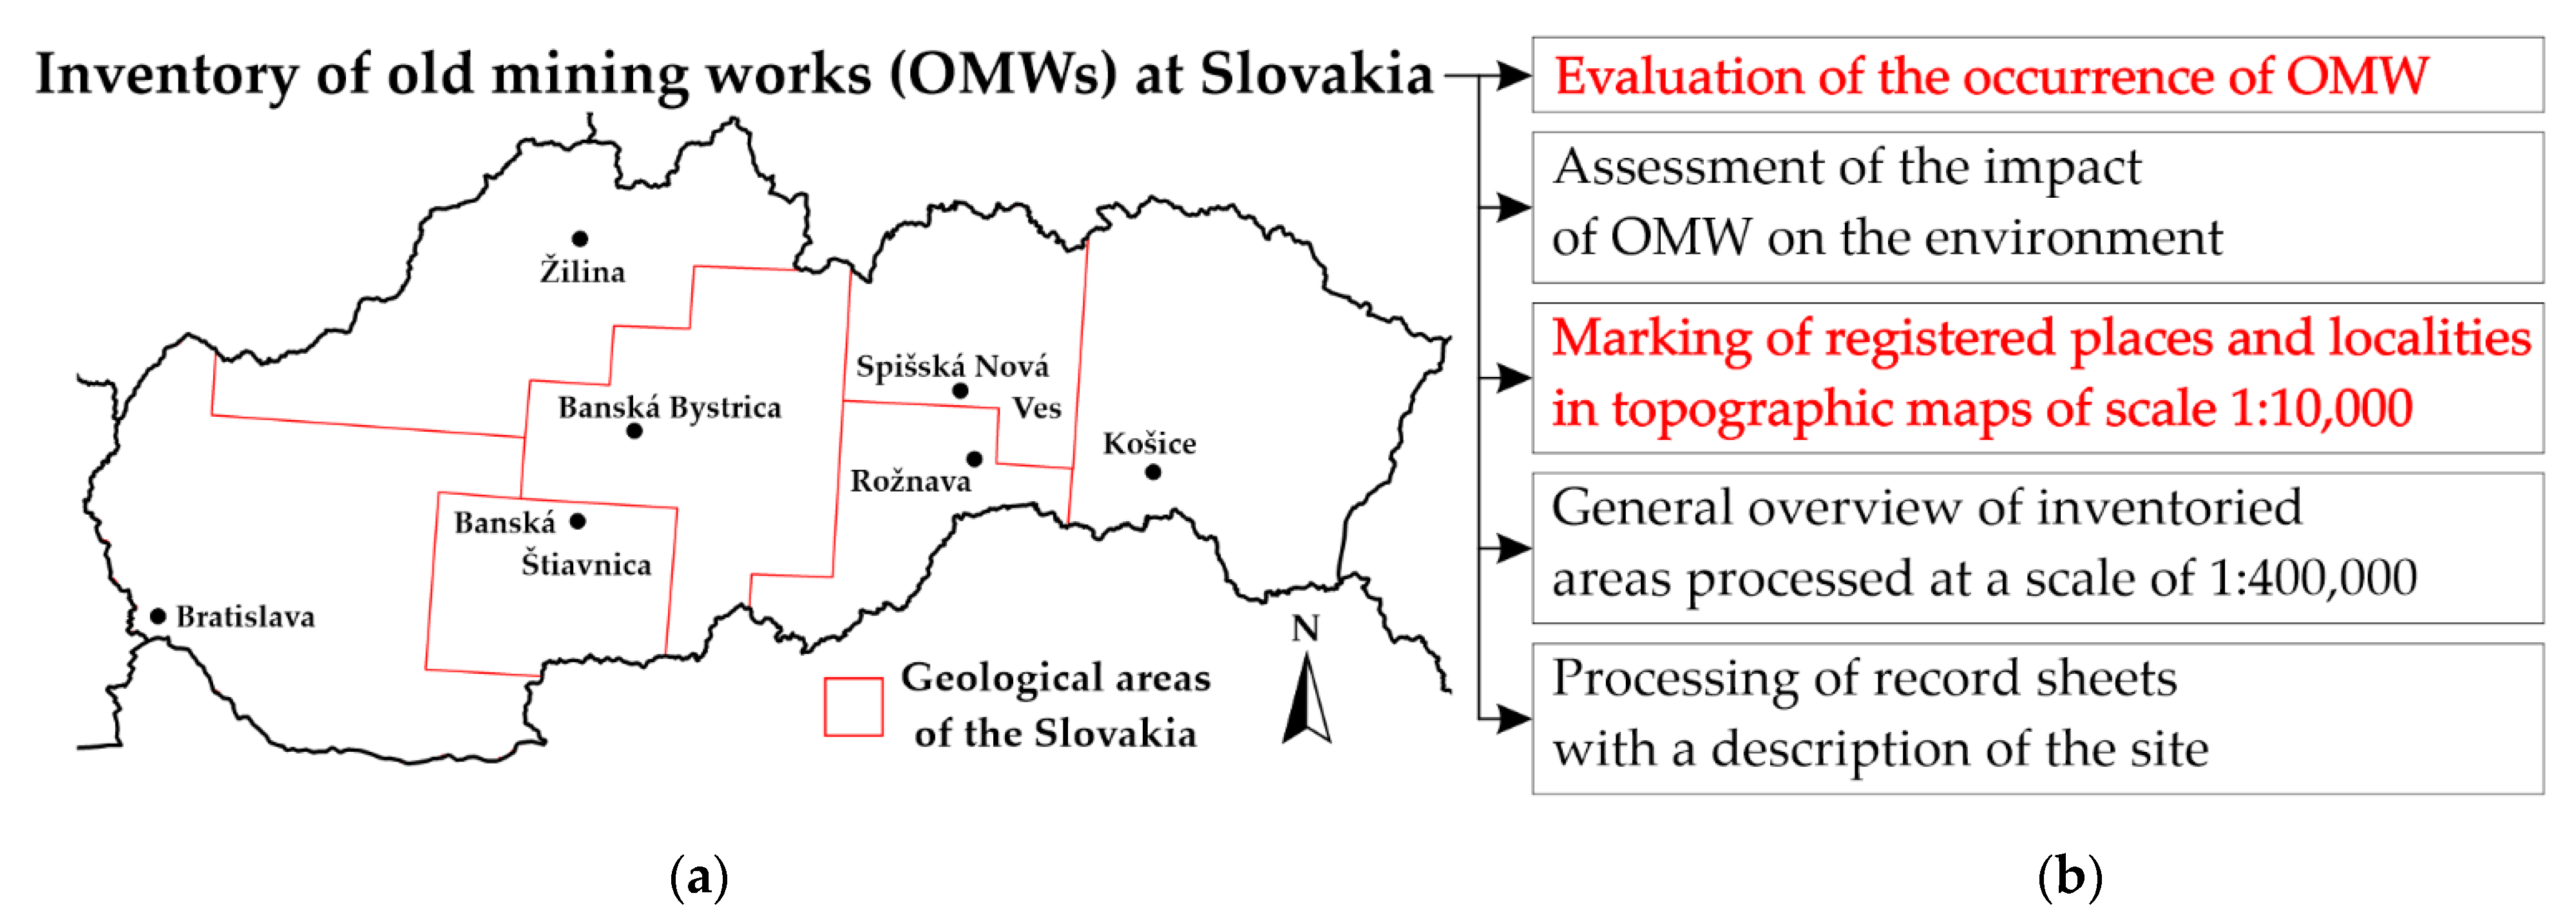
2.1. Localisation of Mining Region

Slovakia is a country known for its rich history of mining (Figure 2). Thus, it was not easy to choose a suitable location from the total count of registered OMWs. The selection of the mining region was therefore preceded by consideration of several criteria (cover of the mining region with ALS data, density of mining clusters, degree of representation of individual OMW categories in built-up areas, as well as in wooded areas). Considering the selected criteria, we selected two localities for the study.
The first focus of this study was on the area of Banská Štiavnica (Figure 2a). The locality was for a long time the richest source of gold and silver in Europe, and is currently a well-known area of mountain geotourism (e.g., Rudná magistrála, Sväto-jakubská trail, Mine Museum). From the total available area of the locality, the territory chosen for the study covered an area of 0.9 km × 0.34 km (48°27′ N, 19°53′ E) with an altitude of 600 to 780 m above mean sea level, and with ALS data coverage as shown in Figure 2b. In terms of the ALS collection plan specification, the location belongs in the area with number 12. Within the geomorphological division, this location belongs in the Inner Western Carpathians, the Slovak Central Highlands area.
The second area is in the Ľupčianska valley south of the hamlet named Magurka in the Low Tatra mountains (Figure 2c), which belongs in the area with assigned collection number 24 for ALS data management and with an area of 1.998 km2. Specifically, it forms part of the northern slopes of the Low Tatras (48°56′ N, 19°25′ E) at an altitude of 1000 to 1500 m above mean sea level (Figure 2d). Within the geomorphological division, this locality belongs in the Inner Western Carpathians, Fatra-Tatra region. The site is also known for its mining activities, especially the mining of gold and antimony, which went on for almost seven centuries. At the end of 2020, they opened the mining nature trail called the “Magurka Gold Trail” (https://magurka-liptov.sk/magursky-zlaty-chodnik/, accessed date: 21 February 2021) with a length of 8.4 km as part of the “Slovak Mining Road” project [27].

2.2. Register of Old Mining Works and Recent Mining Works

This register of the conditions of the Slovak Republic has been in the administration of SGIDŠ since its establishment. The creation of the register was the result of the work carried out by SGIDŠ “Slovakia—Proposal for the remediation of old mining works—Inventory, reconnaissance survey, as of 31 December 1996” [28]. The Department of Geofond at the SGIDŠ was entrusted with the coordination of this activity, which was related to several tasks (design and processing of the database, creation of map outputs). After the organizational changes that took place in the 1990s (merger of several organizations into SGIDŠ), the registration and administration was continued later by the Geofond Department.
R-OMW has undergone several changes since its inception. The changes were associated with innovations in the use of information and communication technology and various technological challenges. The most important step in the R-OMW update was making the register content available to the public through a map application. At present, the register is constantly supplemented with new information not only of a descriptive, but also of a graphic nature. In terms of typological classification of OMW and objects related to mining, the database of mining work objects consists of the following:
  • Shaft—a vertical mining work that descends from the surface and is used for transport, ventilation, and other specific mine requirements. It has a circular or rectangular shape. On the surface it terminates in the mine tower;
  • Adit portal—a horizontal or inclined long mining work usually excavated in sloping terrain, usually a hillside;
  • Tailing pond—is a device for sedimentation of fine-grained mining waste; usually tailings mixed with water originating from the treatment of minerals from the operation, and the purified water is discharged through a drainage trough;
  • Ping—a valley/depression in the terrain caused by shallow underground mining.
  • Mine dump (heap/tip)—is an artificially built body for the storage of solid mining waste on the earth’s surface;
  • Other types of object, e.g., “tajch” artificial water reservoirs—rainwater collection basins in hilly terrain, from which the water drove underground water-powered pumps, ore-crushing hammers and ore-washing plants, and residual water was used to drive grain mills.
Objects in R-OMW are marked with point and line symbol types. The symbols in the R-OMW are presented as points, curves or polygons, giving the meaning of their content. The point type of symbol represents the location of an adit portal to a mining tunnel, i.e., the entrance to the underground. The line type of symbol at the adit portal shows the mining tunnel underground proceeding from the adit portal. The point type of symbol for mine dumps/tailing ponds is used to locate them on small- and medium-scale maps. For localization on large-scale maps, this point type of symbol is no longer sufficient, and the spatial character is displayed as a polygonal object bounded by a line type of symbol. For further use in this study, attention is paid only to OMW point representations. The total number of objects registered in the R-OMW as of 1 January 2021 is 16,709 objects. Each registered object in R-OMW has its unique number. The identification number (ID No.) of registered OMWs consists of ten digits, made up of two parts. The first part is a six-digit number and is determined according to the map sheet designation on the base map of the SR on a scale of 1:10,000, in which the R-OMW object is located. The same six-digit numbers are binding for all OMWs, located in an area of 4 × 5 km belonging to one map sheet at a scale of 1:10,000. The Mining Museum, for instance, has a six-digit number according to the map sheet designation 36-33-09. The hamlet Magurka area has a six-digit number according to the map sheet designation 36-21-12. The second part of the R-OMW ID No. is the four-digit serial number of the OMW on the relevant map sheet of the base map of the SR. The number of individual types of objects registered in R-OMW is described in the following Table 1.
Building on this group/dataset of OMW, two categories of mining objects were created, as follows:
  • Horizontal objects with a predominant area dimension located below or on the earth’s surface (adit portals, mine dumps, tailing ponds);
  • Vertical objects with a predominant depth dimension at or below the earth’s surface or ground level (shaft, ping, other object).

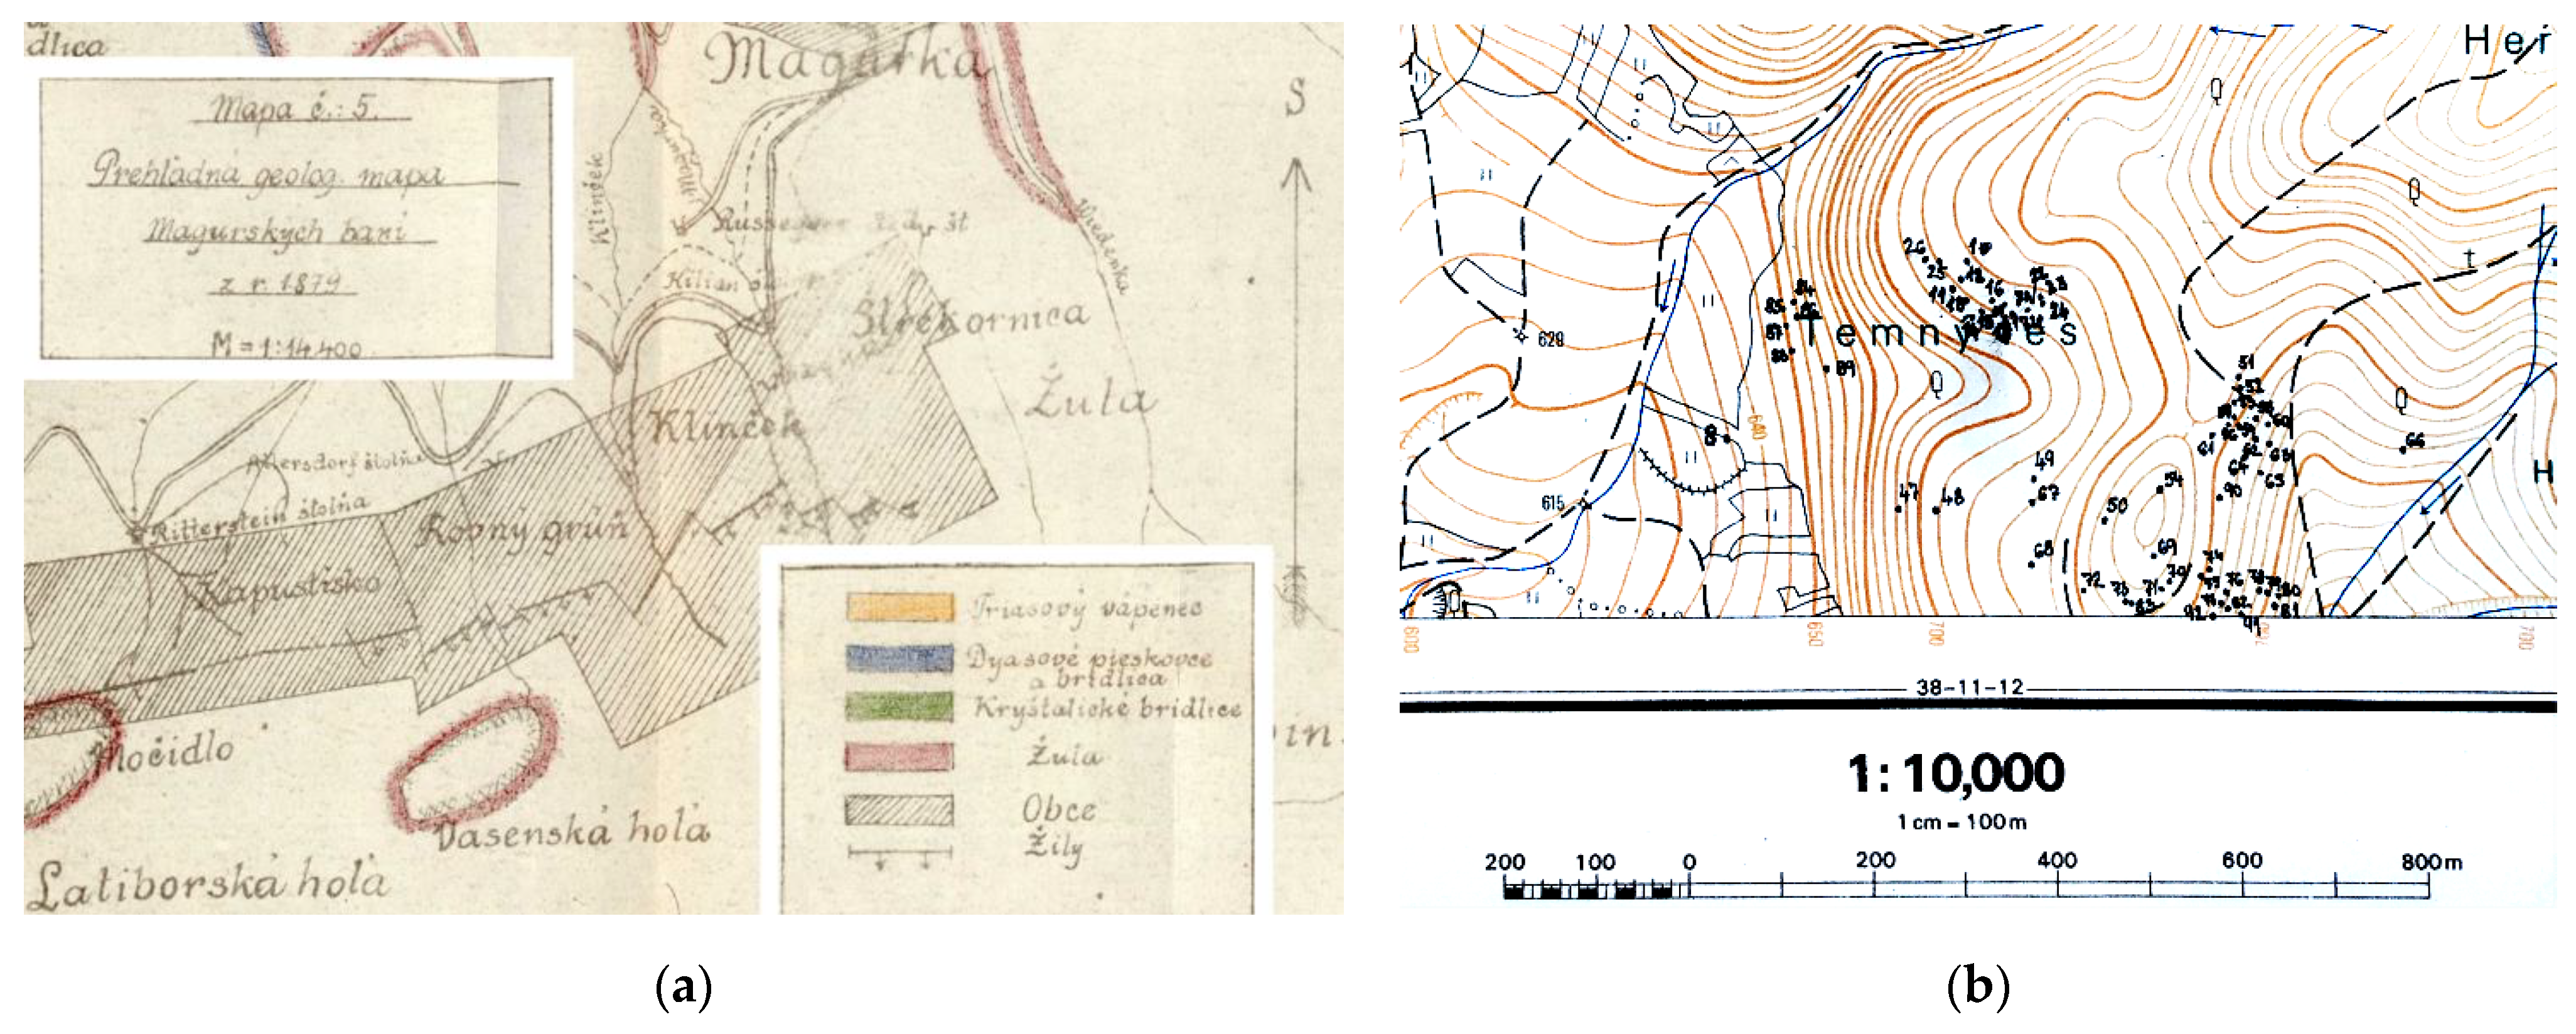
2.3. The Process of Inventorizing Old Mining Works

The inventory process was based on completing the geological task specified in more detail in Section 2.2. The data obtained in the field were transferred to individual topographic maps at a scale of 1:10,000. In the case of identifying OMW in the field, their factual situation was specified in more detail in the form of a written record. The necessary data were recorded in the form of record sheets (passports), which are kept by the SGIDŠ Geofond Department. The preparation and processing of passports were subject to checking, and the content of the field records were gradually transferred to the topographic maps with their subsequent gradual digitization. The passports also included OMW photo documentation. In the case of OMW remediation being ordered, photo documentation was carried out just before completing the fieldwork. The diagram of activities carried out in the OMW inventory itself is presented in the following Figure 3.

2.4. Data Collection for Registry of Old Mining Works and Recent Mining Works

The preparation and processing of input data for determining the spatial distribution of objects were based on the principles of creating R-OMW. Almost all R-OMW objects were obtained by digitizing the underlying maps (old mining maps, base map of the SR). Only a small part of the total representation of registered objects was obtained from field surveys supplemented by results of GNSS measurements. Thus, it is necessary to characterize further the historical data used for the spatial geolocation of R-OMW objects.
The oldest mining maps in the Slovak Republic have been known since the 16th century. However, private miners kept their mining works secret and prevented them from being drawn on maps. The map of the 130 m long hereditary adit “Gottes Gab” in Jarabá is the oldest in Slovakia, dating from 1569. The second known mining map dates from 1591, which shows the Krebsgrund hereditary adit in Banská Štiavnica. The archives of the main chamber—Count Office in the Kammerhof in Banská Štiavnica, according to [29], contain the oldest map in that collection, which dates from 1641. It is a technical map of the leading mining plant in the Banská Štiavnica region, namely, the adit portal to the Horná Bíber in Vindschacht (now Štiavnické Bane), by an unknown surveyor (Figure 4a). In 2007 it was inscribed in UNESCO’s world heritage list, and it shows the entire complex of underground mining works and surface objects. Unfortunately, this historical gem was damaged in the past and has thus become unreadable (Figure 4a above). In 2012, experts managed to restore this map (Figure 4a below). In Slovakia, the development of mining surveying and mapping began in the 1840s, and from the given period (the year 1748), a longitudinal profile of mining works in Banská Štiavnica is preserved (Figure 4b cut-out), which stretches in the direction SW to NE with a length of approx. 2500 m towards Banská Belá (Mikuláš shaft). The longitudinal profile shows 27 shafts with horizontal mining tunnels, including the surrounding terrain behind the profile. The longitudinal profile shows old mining works from the locality of the Mining Museum, which are also shown in Figure 4b. The growing number of mining maps has been dated back to the founding of the Mining Academy in Banská Štiavnica in 1780. By the 1930s, technically perfect maps were gradually being created, which provided accurate data on mining works.
From the available sources of OMW map documentation, old mining maps were used as a basis for documentation of known facts about historical mining activities. From one of the selected localities of this study there is an old mining map from 1879 on a scale of 1:14,400. It contains the drawing of adit portals, veins of minerals and types of rocks and sediments (Figure 5a).
Passports were issued based on the OMW field surveys, including the identification of objects and their position in the field in a location sketch, which was prepared during the survey. Based on the results of the field survey, this information was recorded in the then base map of the SR on a scale of 1:10,000 (the print of the maps used dates from the year 1985, Figure 5b), with map sheet dimensions 38.0 × 48.8 cm. The base map of the SR 1:10,000 in D-UTCN was created by reambulation of the topographic map 1:10,000, issued by the topographic service S-42 coordinate system with preferential use of the method of aerial photogrammetry. The last revision of the known facts of R-OMW was based on the above data presented in Figure 5.
Currently, the SGIDŠ Geofond Department plans to use the available results from the ongoing ALS in the Slovak Republic to analyze the R-OMW status. The Geodesy, Cartography and Cadastre Authority of the Slovak Republic (GCCA SR) has been providing a new digital relief model DMR5.0 of the entire territory of the Slovak Republic since 2017, which is generated from ALS LiDAR data. In this framework, 42 localities of territory (LOT) have been created, in which ALS takes place gradually from west to east over Slovakia (currently 23 LOTs out of total number 42 are finished). For ALS LOT No. 12 and No. 24 (Figure 2), the same Riegl LMS Q780 scanner was used, which ranks among the long-range airborne laser scanners. This scanner can achieve up to 266,000 measurements per second at a maximum operating altitude of 4500 m. It has a high repetition frequency of the laser beam up to 400 kHz with a maximum range of 5800 m, high accuracy of up to 20 mm, wide viewing angle up to 60°. The scanner also provides a measurement of snowy and icy mountainous terrain [32]. ALS data from an area up to 2 km2 are available to users (subject to conditions) available via the web environment (application) “ZBGIS Map Client” in *.las 1.4 format.

3. Results and Discussion

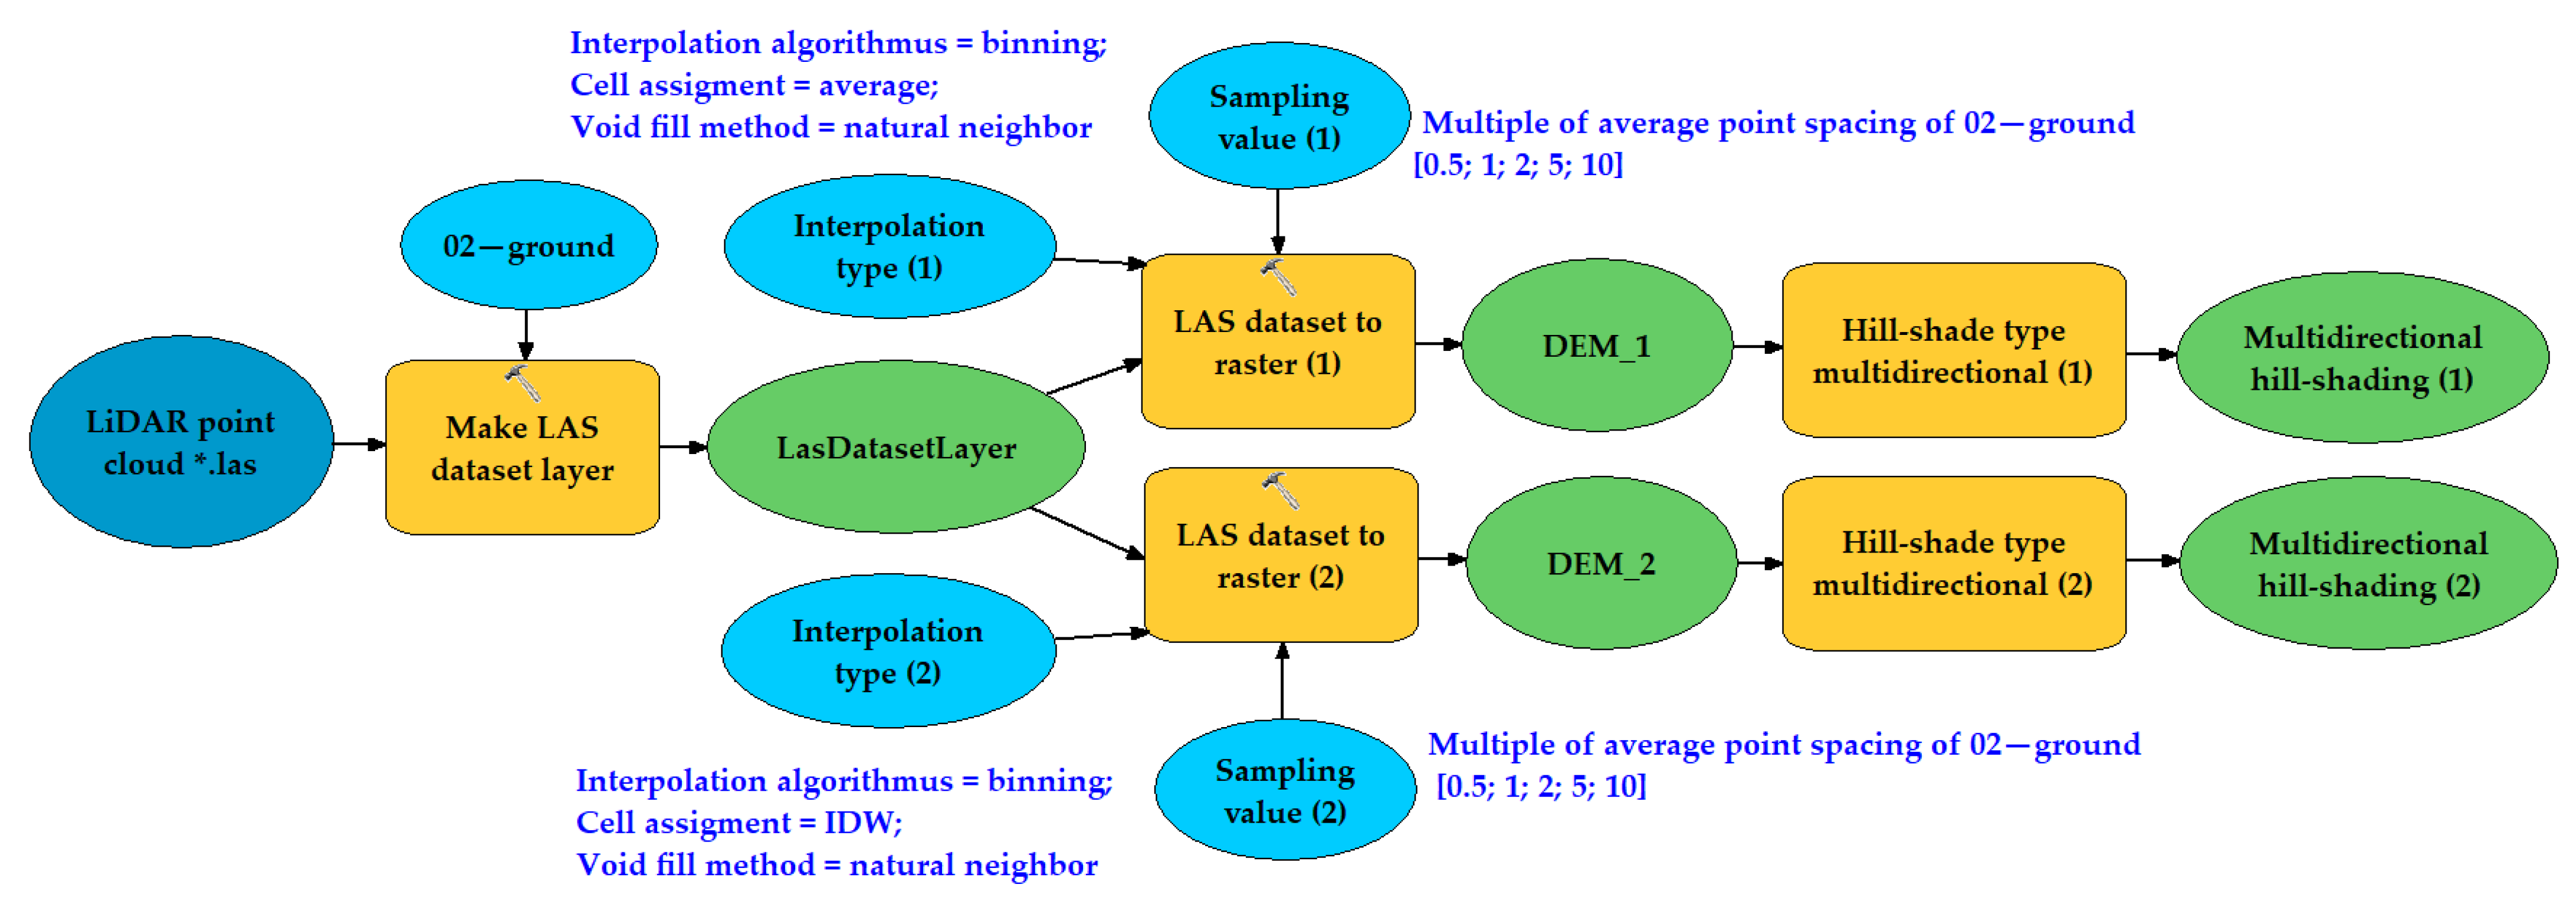
3.1. Processing of LiDAR Data to Inventorize the Spatial Distribution of Old Mining Works

The preparation and processing of the LiDAR point cloud are essential elements of the whole methodological approach in this study (Figure 1). Given the large number of registered OMWs (Table 1), the choice of the area in question is precisely specified in Figure 2 and in more detail in Section 2.1. The selected two areas addressed in this case study have the specifications and parameters listed in Table 2.

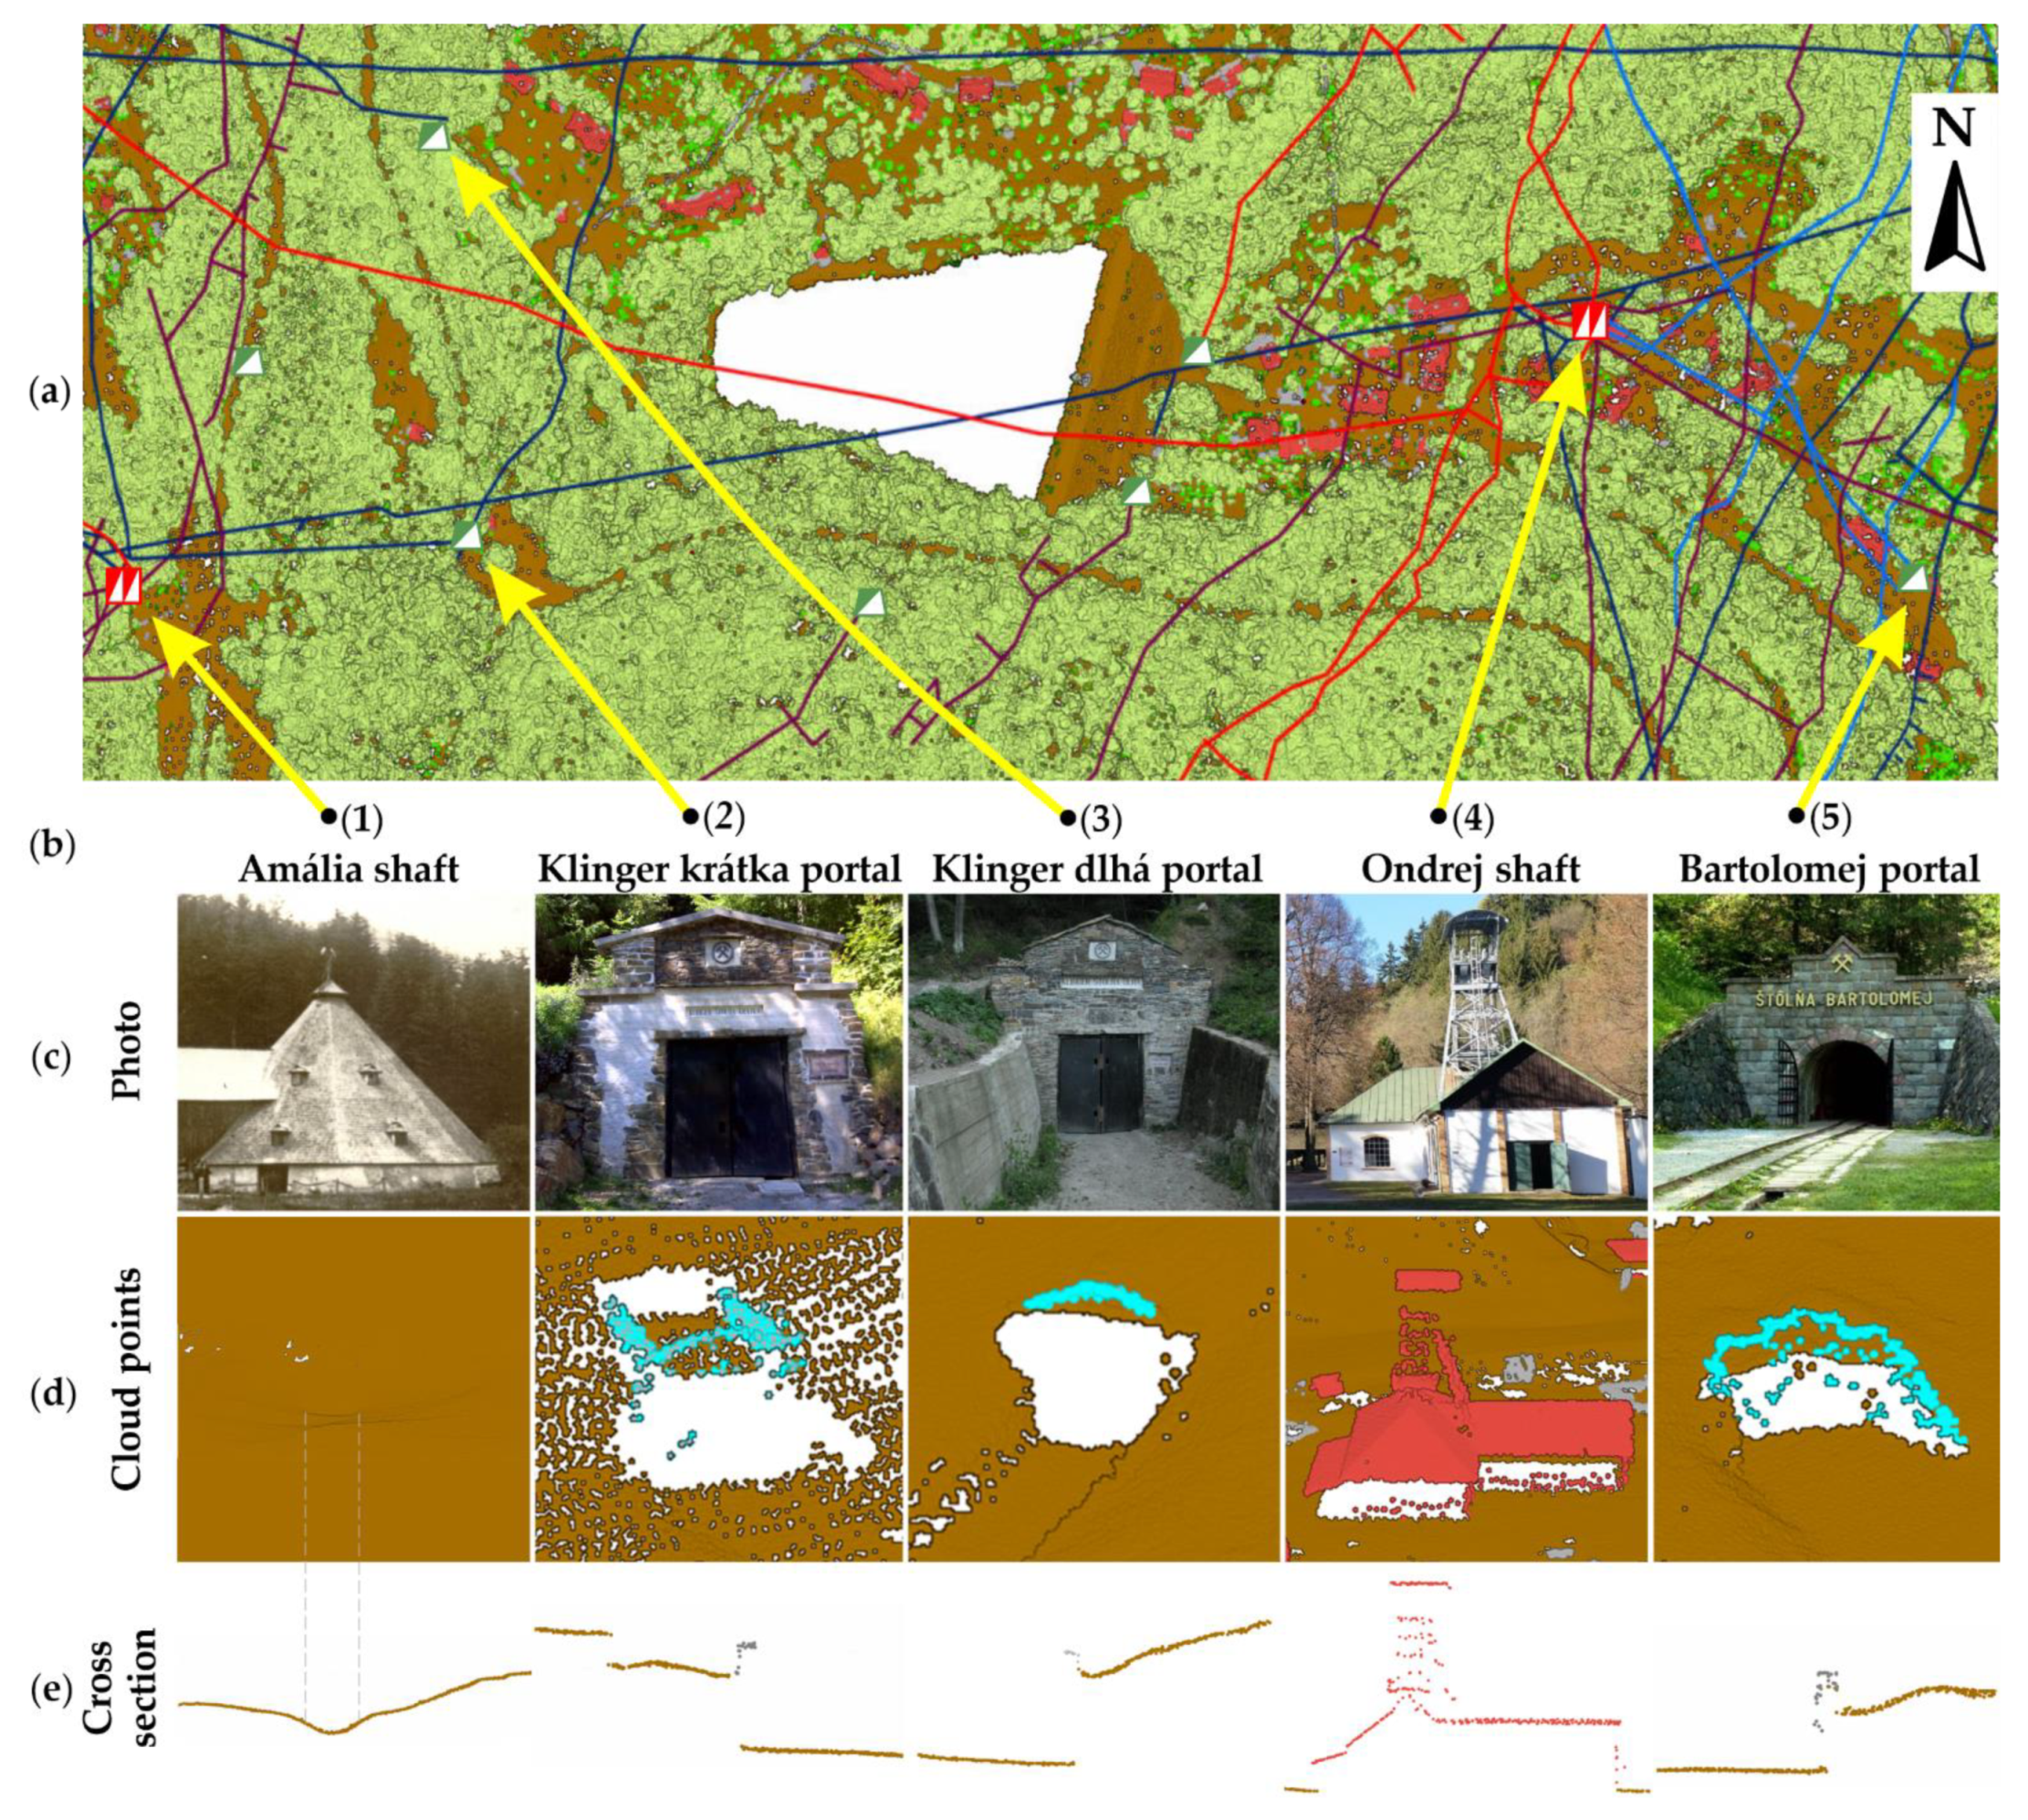
3.1.1. The First Study Area of the Mining Museum

In the study, we used a classified point cloud in *.las format. For selected areas, this input background was symbolized based on the representation of individual LiDAR classes (Figure 6a), with an overlapping vector layer of OMWs showing the course of underground mining tunnels in the ArcGIS Pro 2.7.2 environment.
This study area was digitally cleared of vegetation cover, and ground cloud points showed the mining activity results. Only three LiDAR classes from the *.las file (01—unassigned, 02—ground, 06—building) were the subject of further processing. These LiDAR classes were used to inventorize the spatial distribution of the R-OMW objects. In this part of the study, it is necessary to emphasize the R-OMW’s content and typological structure, which clarifies the filtering of the classes of the LiDAR point cloud. The R-OMW content is described in more detail in Section 2.2, Table 1, and the selected OMW objects are shown in Figure 6b,c. The inventories must be based on the specification of individual OMW types in the above LiDAR classes of the *.las file. Shaft-type OMWs are classified in class 06—building (see Figure 6a (4) Ondrej shaft). In terms of their shape, the shafts’ mining towers are rectangular, with a solid base on the earth’s surface and covered with a roof. From a historical point of view, a shaft tower was a conical object (see Figure 4, Figure 6a (1) showing Amalia shaft, which does not currently exist and only a terrain depression remains). A significant LiDAR class for the OMW inventory is the 02—ground class from the *.las file. This class contains the topographic terrain in which most of the OMWs were found (portal, tailing pond, ping, mine dump, or other type of object).
A very distinct group consists of the LiDAR class 01—unassigned. This class of LiDAR point cloud unites objects on the earth’s surface, which, due to their specificity, cannot be classified into any of the other LiDAR classes, i.e., not in the classes 02—ground, or 06—building selected by us. They find their representation here, e.g., fences, utilities (power lines, poles). By in-depth analysis of the content of LiDAR class 01—unassigned in this study, we found the presence and occurrence of objects belonging in the OMW group. These were mainly the upper parts of adit portals (Figure 6, portals (2), (3), (5)).
For this reason, it was necessary to check the representation of points in the 01—unassigned class, as we found that in the 01—unassigned class in the *.las files there were 88,437 points (0.39% of the whole point cloud), of which a small number of about 1% of class 01—unassigned also consisted of mining objects, as shown in Figure 6d. These objects form an exceptional group, and their shape, cannot be unambiguously classified in either the 02—ground class or the 06—building class. We therefore recommend checking the spatial distribution of the group of points 01—unassigned in the first step. If the group of points represents an OMW of adit portal (entrance) type, it is necessary to reclassify it into the class 02—ground to display the object’s real shape. For the best result of identifying these objects, it is necessary to display them in 3D space, and supplemented with a cross-section of the examined object. Such processing results are shown in the following Figure 6e, which presents the representation of OMW in the Mining Museum.

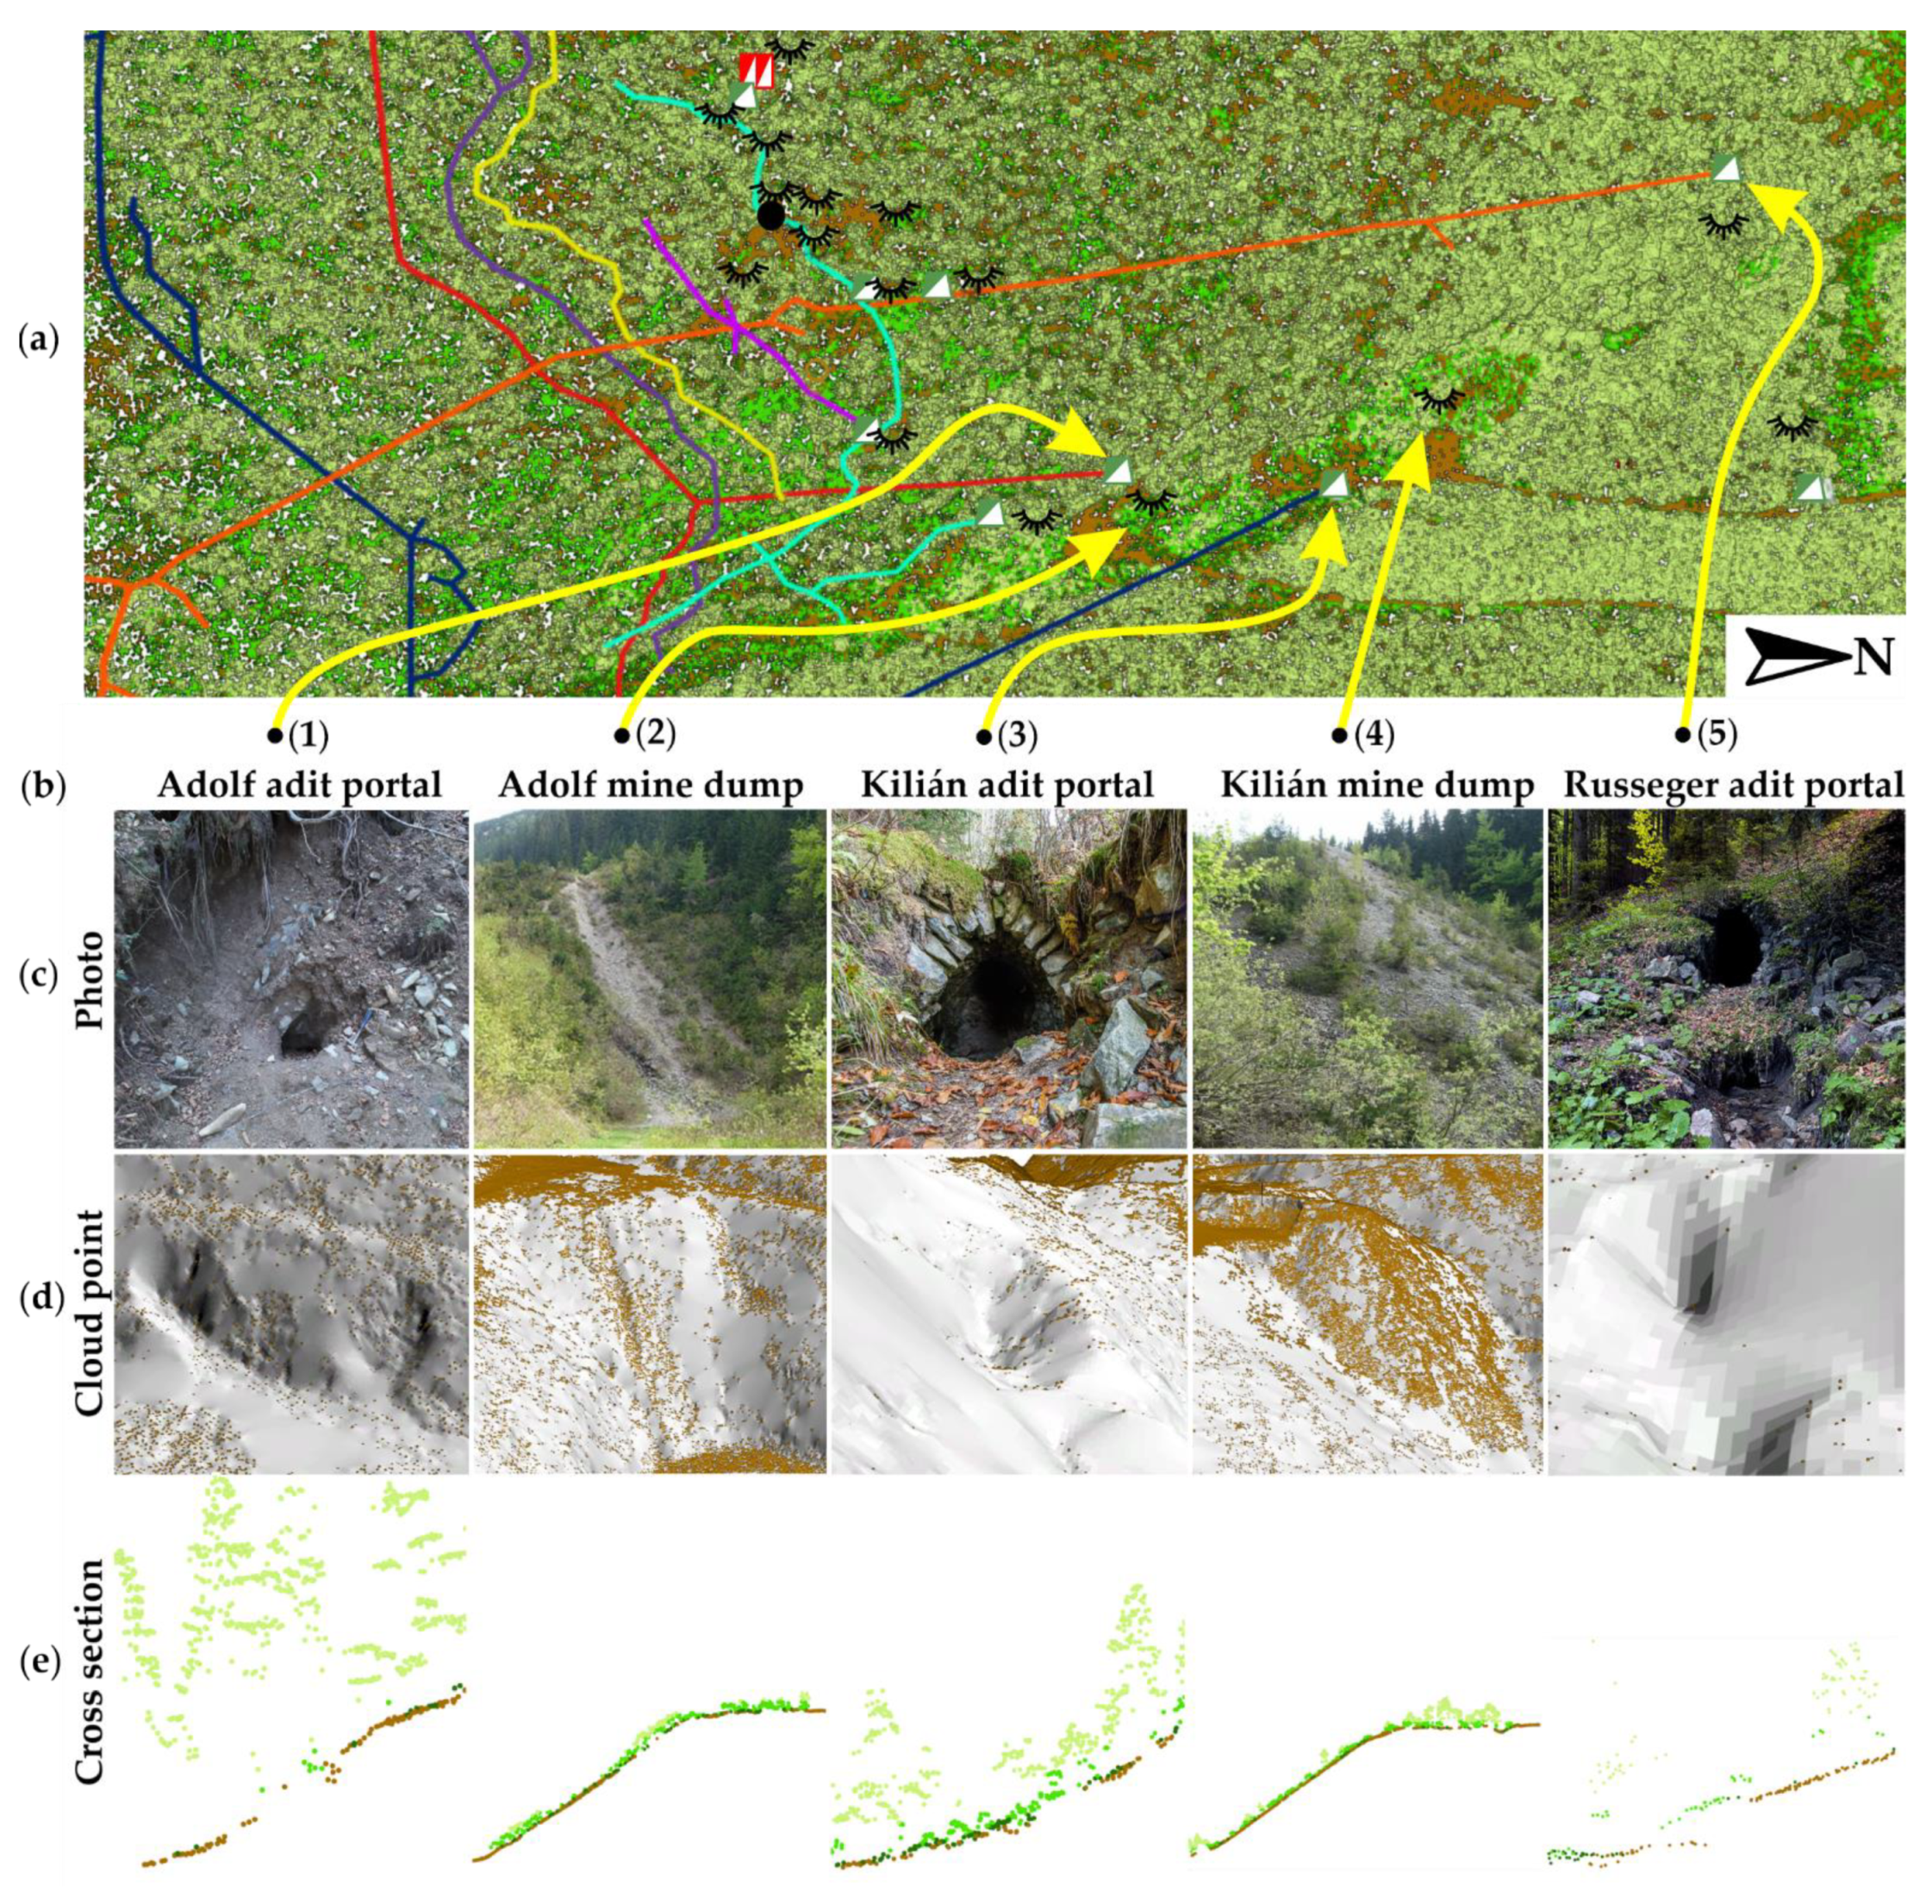
3.1.2. The Second Study Area of the Hamlet Magurka

To capture the diversity and articulation of the terrain in which the R-OMW objects are located, an area located in the Low Tatras alpine environment was chosen for this study. The subject of processing (according to the study’s aim) in the given area was only the *.las file’s class 02—ground. This filtered file was used in the following sections to inventorize the spatial distribution of R-OMW objects (Figure 7a,b). The typologically given area mainly featured objects such as adit portals or mine dumps. To a lesser extent, the locality was supplemented with pings and other types of OMW objects. The terrain conditions (dense vegetation with up to 81.12% of the total number of cloud points) and the state of registration of the R-OMW objects, Figure 7c, involved a combination of several approaches in the processing. The inventories were further based on the specification of the representation of individual types of OMW in the above classes of the *.las file. Thus, a significant class in the inventory of OMWs was the 02—ground class from the *.las file (Figure 7d). There were 12,482,206 points in the LiDAR class 02—ground (18.67% of the total number of cloud points). This class consisted of topographic terrain representing mainly old mining works (adit portal, mine dump, ping, tailing pond, or another type of object). It was necessary to display OMW in 3D and supplement its cross-section to achieve the best possible result for identifying these objects. The results of this processing in the area of the hamlet Magurka are presented in Figure 7e.
In addition to the DEM generated from LiDAR, the results from GNNS measurements and open data from open street maps (OSM) were used to provide the data needed for the inventory of spatial distribution and the determination of positional deviations of R-OMW objects. The flow-chart in Figure 1 identifies all the additional data sources. The contents of the R-OMW file are described in more detail in Section 2.2, and the LiDAR point clouds are characterized in Section 3.1. OSM is one of the most prominent volunteered geographic information sources [33] and the most-used source from the open data category. It is continuously updated by its administrators based on data from established contributors. For the study, the results of the GNSS measurements were based on a set of spatial information obtained by means of field research.

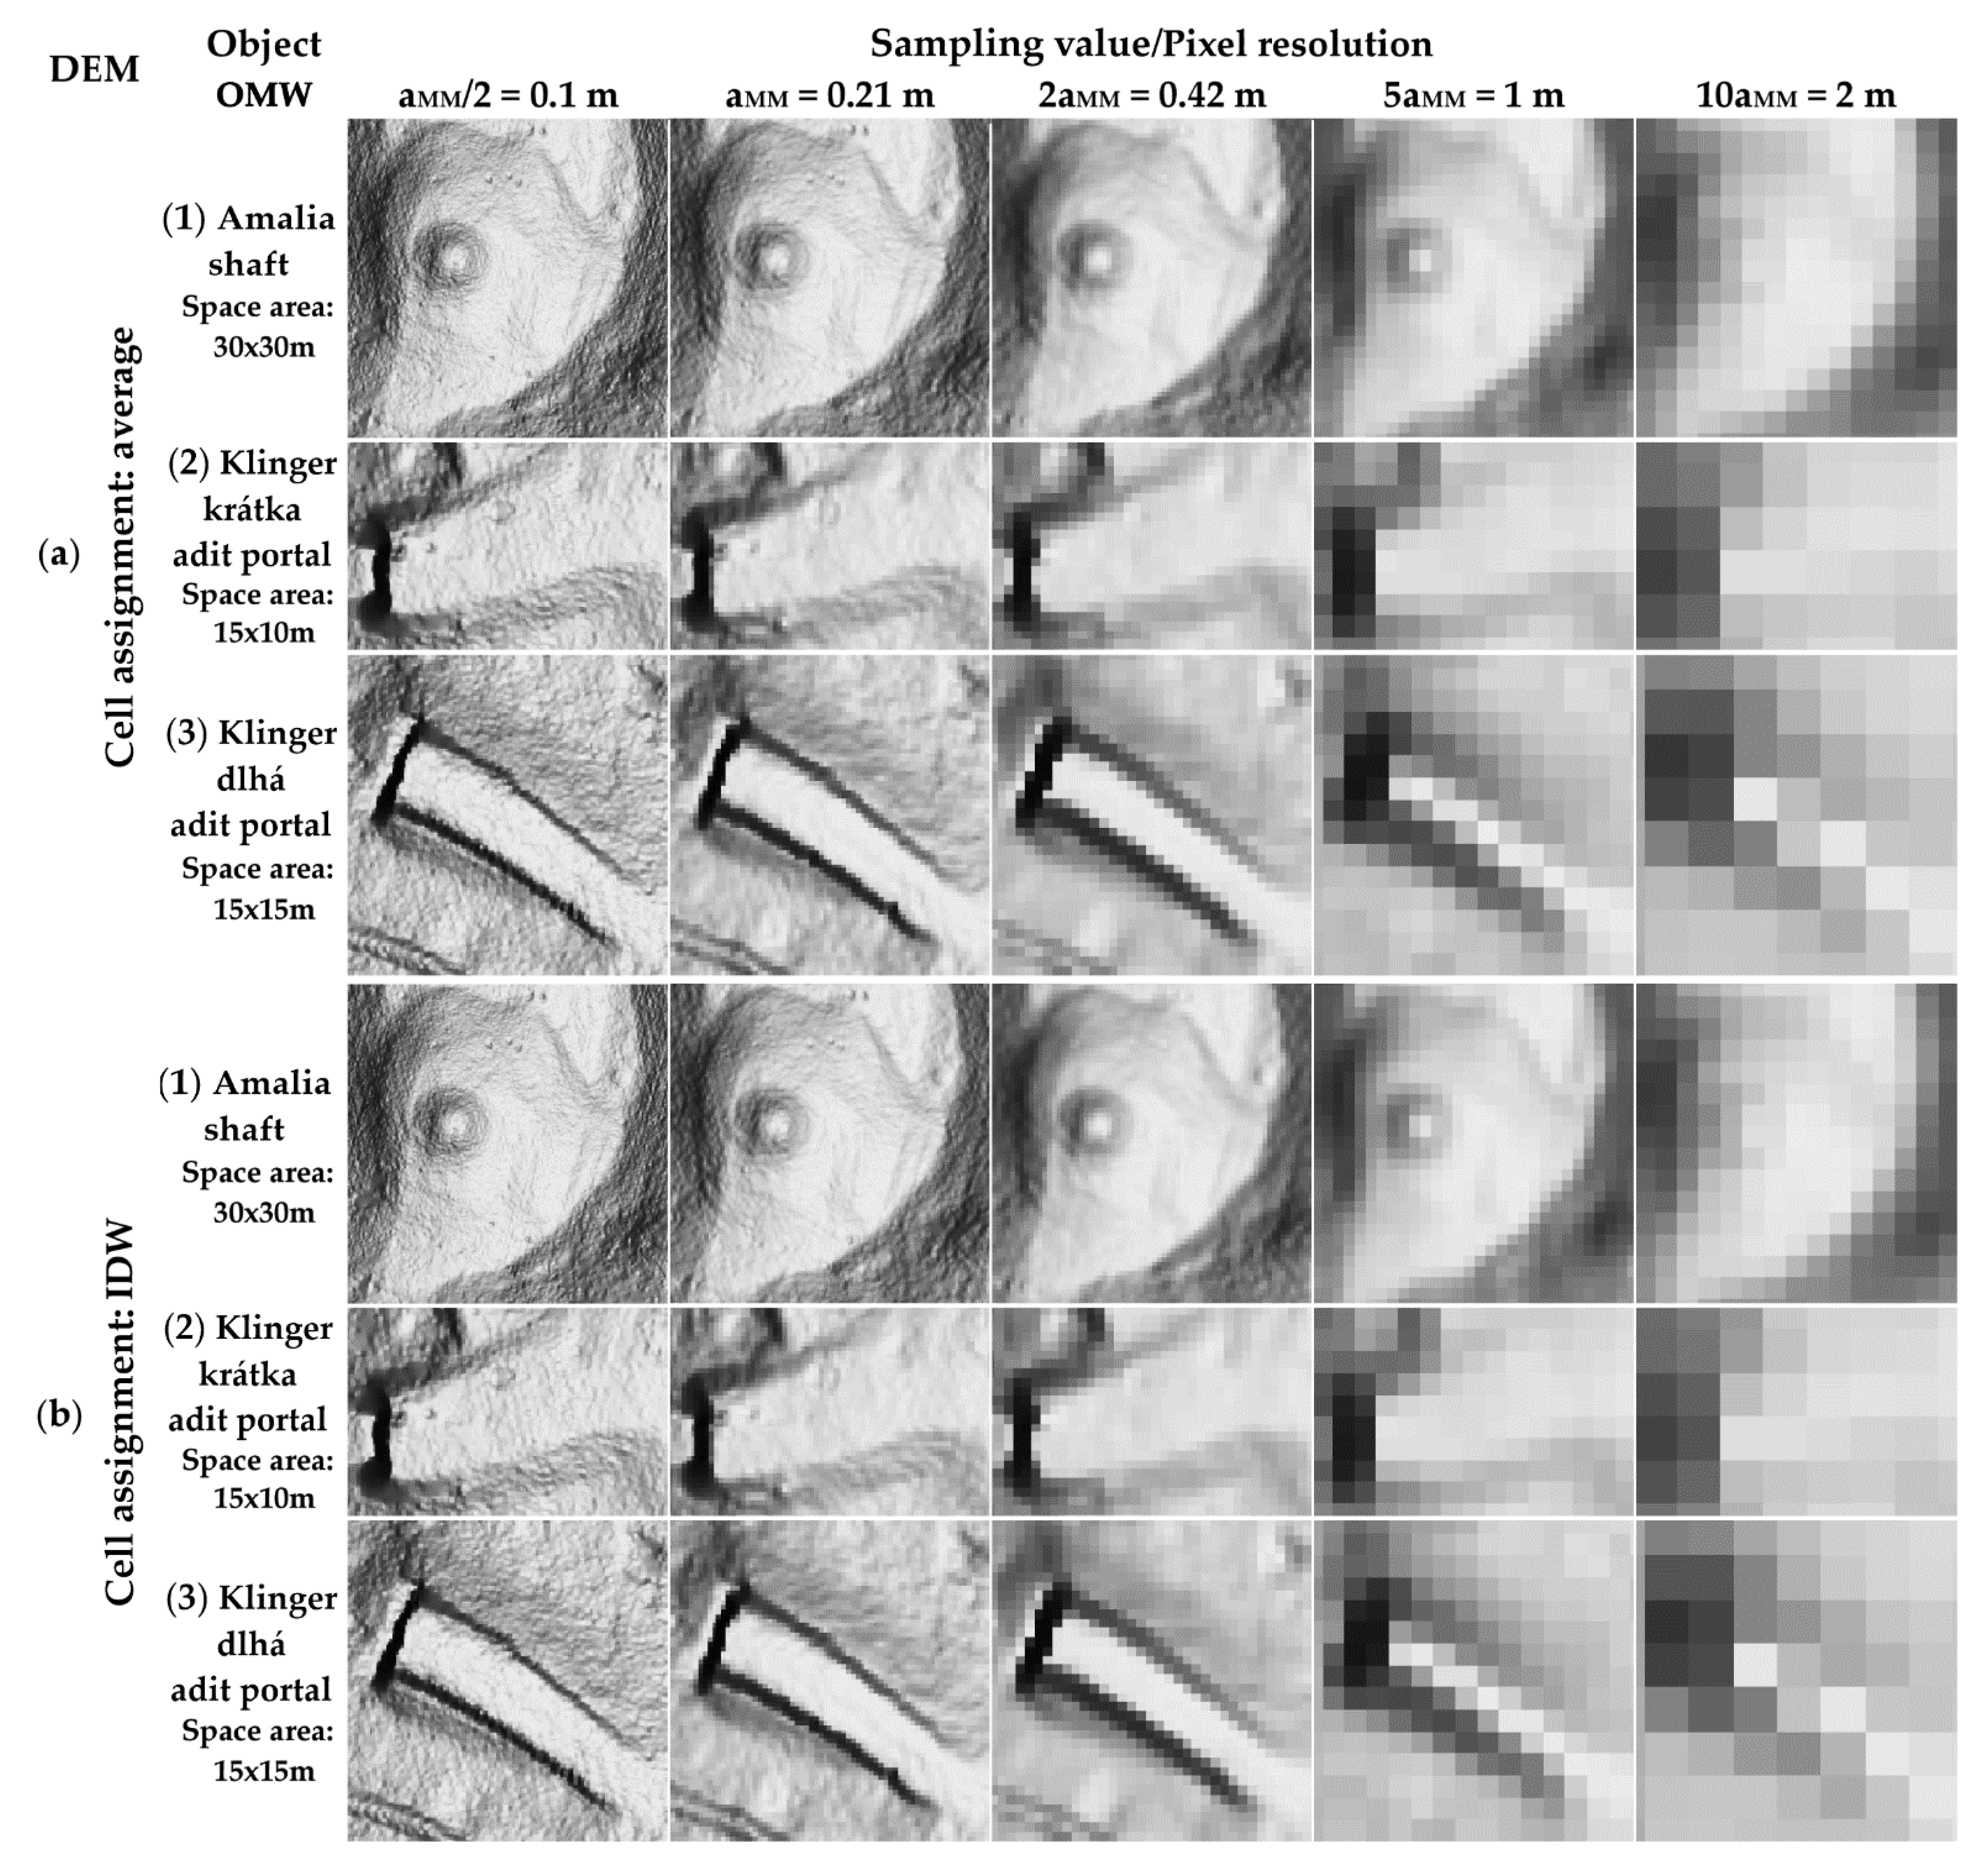
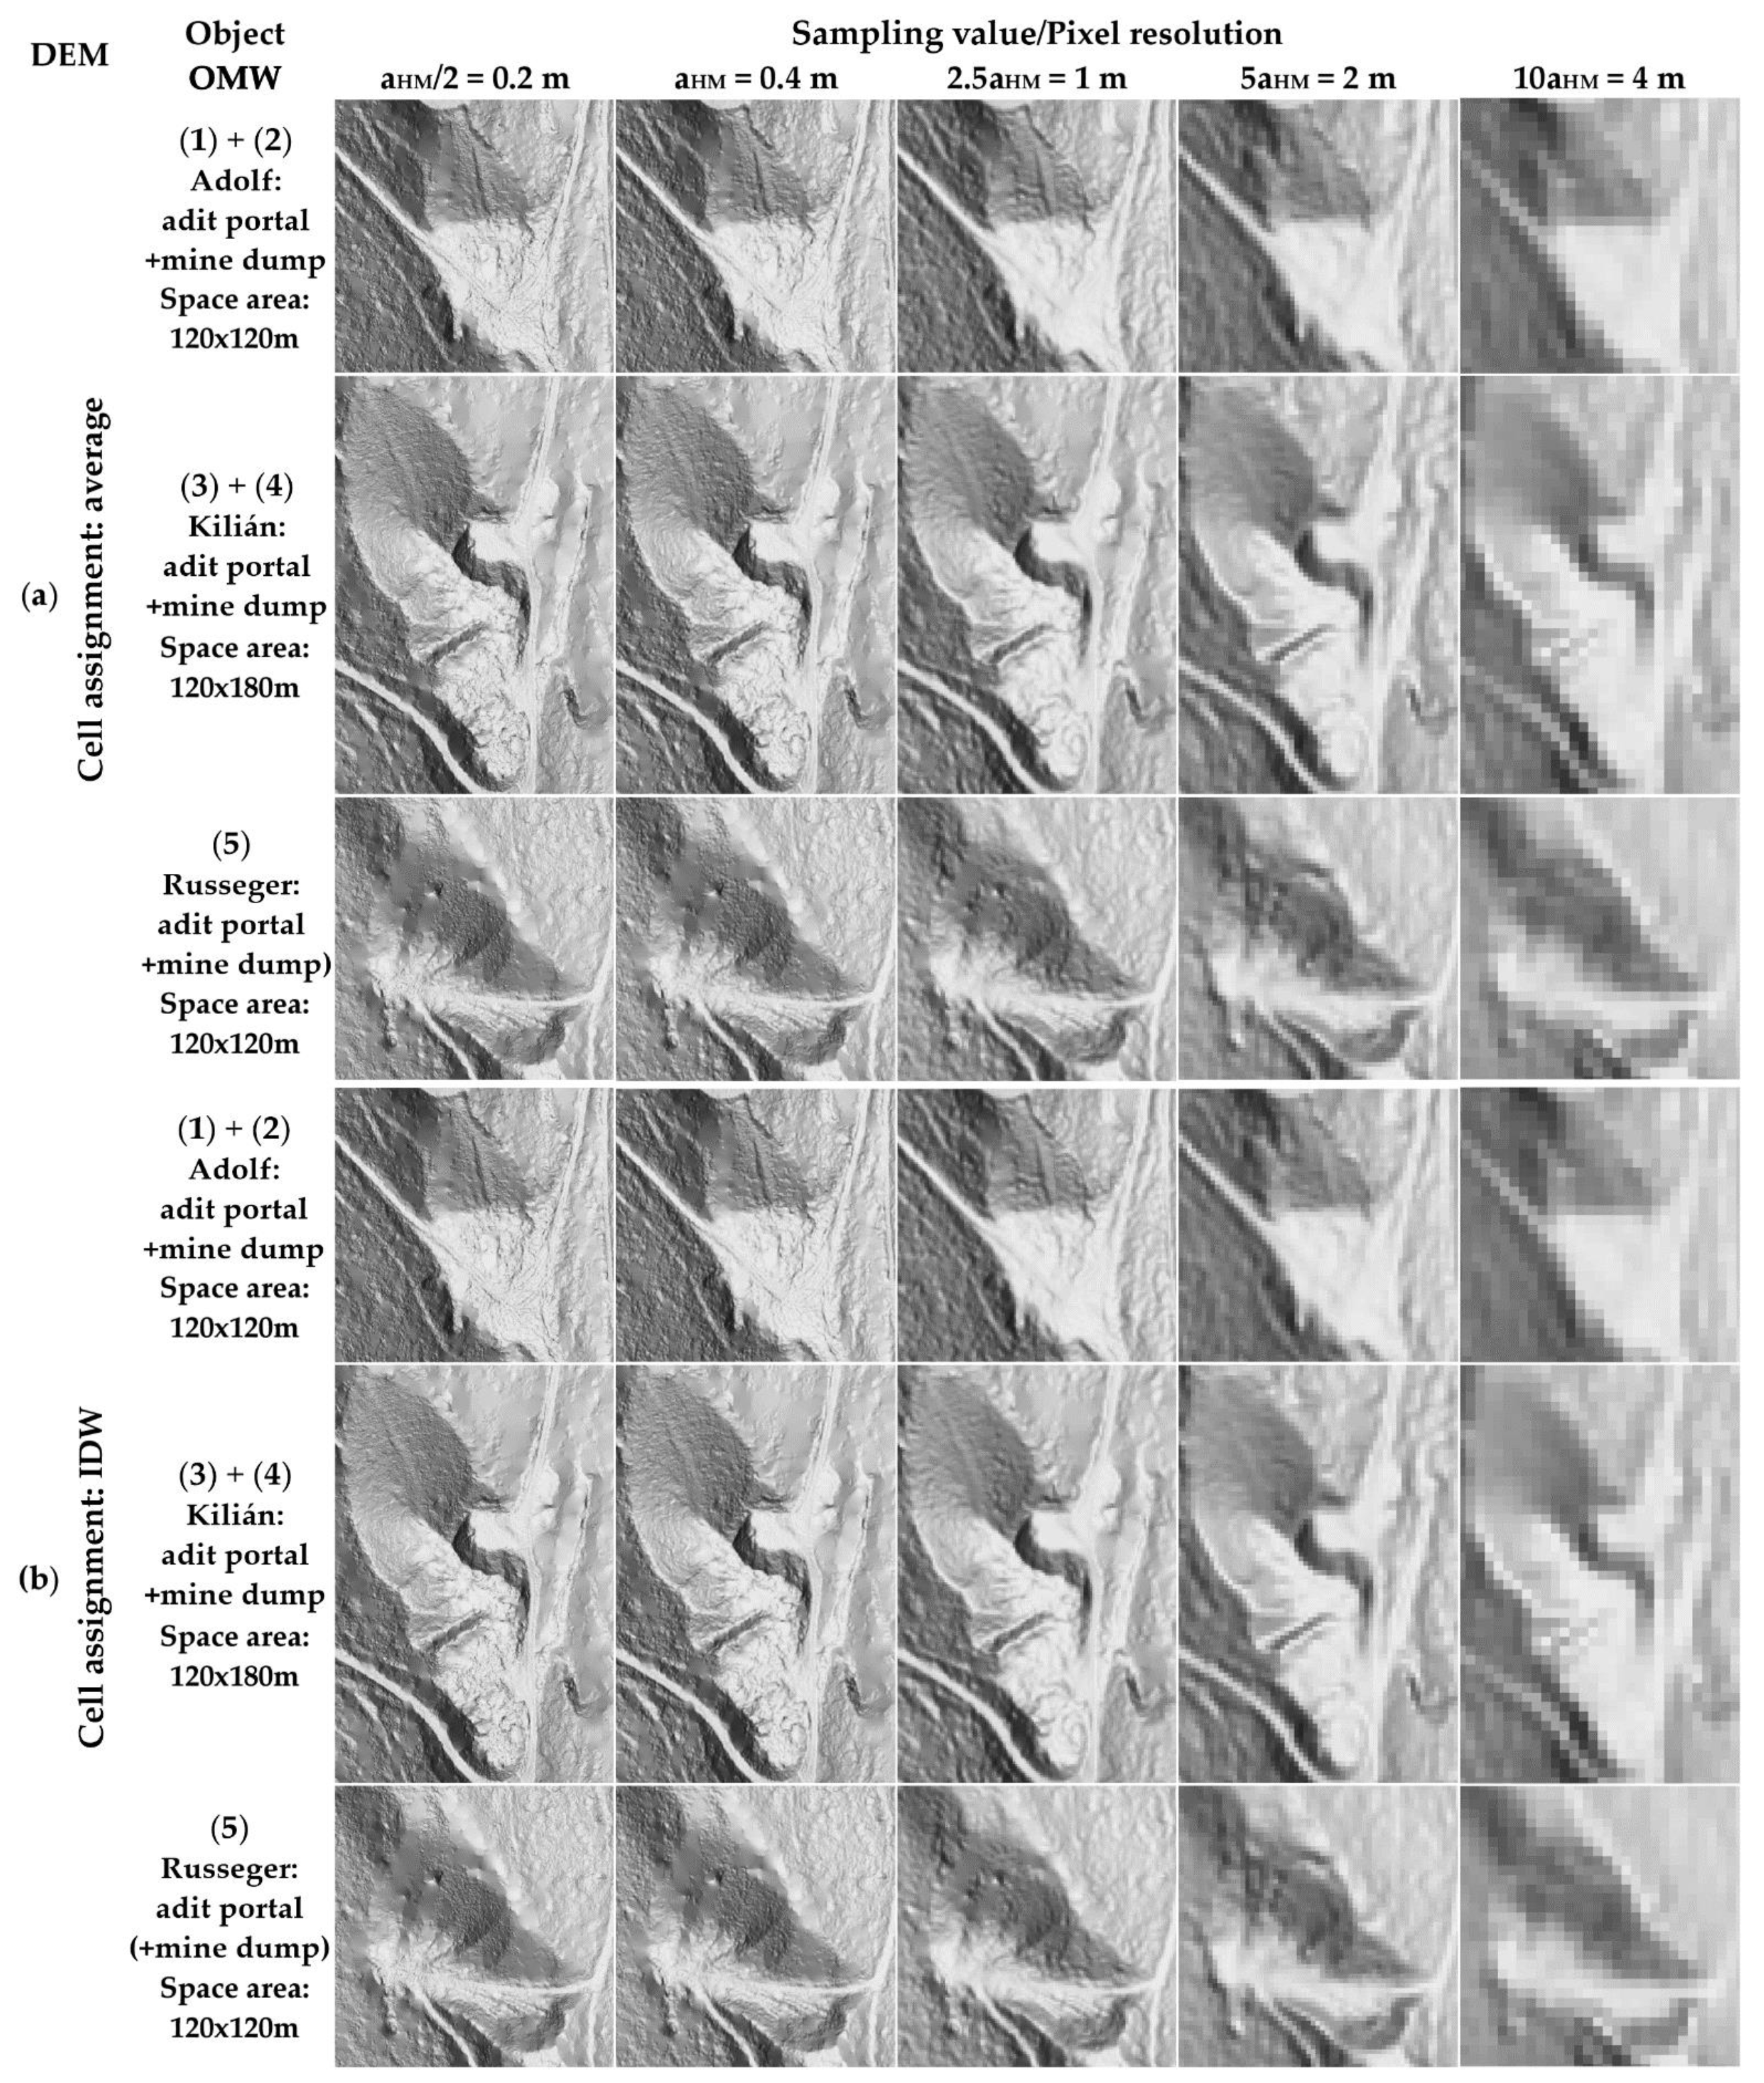
3.2. Analysis of the Presence of OMWs Based on DEM Generated from LiDAR

For the process of inventorizing the spatial distribution of objects in the R-OMW, the DEM represents the bare ground surface without any objects, such as vegetation and buildings. It is the primary input for further processing, and its creation from LiDAR needs to be given sufficient attention.
The solution of this scientific task was based on the first step of creating a topographic terrain. The basis for carrying out this part of the study was the processing of the *.las LiDAR point clouds. We chose two approaches to compare and analyze the results obtained from the processing (see Figure 8). To capture the fragmentation of the terrain relief morphology, we used the choice of the interpolation method and raster cell size. From the total available interpolation algorithms suitable for DEM creation from the LiDAR points cloud, the Binnig interpolation method was selected for choosing the type of cell assignment (average, IDW) and filling in the blanks of the raster (natural neighbor). This interpolation algorithm sets parameters that are recommended for this study [13,34,35].
Other studies [36,37] recommend generating a DEM from the LiDAR point cloud based on the average point spacing.
When generating a DEM from LiDAR, it is generally recommended to generate one cell/pixel of the raster by setting the sampling to 3 × 3, i.e., nine LiDAR points [12]. The recommended minimum is 2 × 2, i.e., four LiDAR points per cell/pixel. In this context, it is necessary to answer the following fundamental question: “Will the value of the raster sampling setting change the relationship between the altitude and the parameters derived from the processes in DEM (geomorphometric characteristics of the terrain)?”. This problem was also dealt with in study [38], which presents a visualization of an object (meteor crater) with a diameter of 1.2 km, based on a DEM with various pixel resolution raster dimensions (0.25 m, 1 m, 10 m, 30 m, and 90 m). We chose the conditions for setting the sampling area for this study regarding the sizes of our monitored objects. It is not possible to omit this fact in solving the problem of inventorizing the locations of objects in R-OMW. In the part of our study regarding the Mining Museum (MM) area, we based our approach on the average spacing of the LiDAR points in class 02—ground (aMM = 0.21 m, see Table 2) and the size of the selected category of the R-OMW objects (adit portals, size approx. 3 × 3 m). For this study we chose values for the pixel resolution in the range 0.1 m (aMM/2), 0.21m (aMM), 0.42m (2aMM), 1 m (5aMM), and 2 m (10aMM). From five selected objects in R-OMW (Figure 6), we analyzed the following: (1) terrain unevenness, due to the already non-existent mining tower of the Amália shaft; and (2) and (3) Klinger adit portals (dlhá and krátka). An overall comparison of the results obtained in this part of the study is presented in Figure 9. Multidirectional hill-shade (MDHS) analysis was used to display the Mining Museum area’s morphology for a more realistic presentation of the actual terrain [39,40].
In the part of this study, dealing with the area of the hamlet Magurka (HM), we based our procedure on the average spacing of the LiDAR points in class 02—ground (aHM = 0.40 m, see Table 2). The size of objects in the selected category of R-OMW meant that the maximum expected size of the adit portals was approx. 2 × 1 m, and the maximum expected area of the mine dumps was 180 × 150 m. Regarding the size of the mine dumps, in the study of values for the pixel resolution, we chose values of 0.2 m (aHM/2), 0.4 m (aHM), 1 m (2.5aHM), 2 m (5aHM), and 4 m (10aHM). From five selected objects in R-OMW (Figure 7), we analyzed the dimensionally significant underground objects. For analyses we chose the following: (1) the Adolf adit portal (adit length, 2.1 km) and (2) the related Adolf mine dump; (3) the Kilián adit portal (adit length, 3.0 km) and (4) the related Kilián mine dump; and (5) the Russeger adit portal (adit length, 1.6 km) and the related Russeger mine dump. The Russeger mine dump’s photo documentation is not attached in Figure 7 because it does not belong among the selected OMWs. An overall comparison of the results from the area of the hamlet Magurka is presented in Figure 10. MDHS analysis was also used in this area for a more realistic representation of the OMWs morphology.

3.3. Assessment of the Suitability of DEM for Identifying Objects from the Register of Old Mining Works and Recent Mining Works

A total of five pixel resolution settings were used to assess the suitability of the DEM, and the cell assignment selection was set for the two most used, which were the average and IDW. At the same time, it was necessary to consider the size of the OMW object in their identification. As already mentioned in Section 3.2, we generated the DEM with the pixel resolution set to a maximum of ten times the average dot spacing (10aMM; 10aHM). Further increases in the pixel resolution value, to ensure satisfactory results, were not necessary and unusable in carrying out this study, due to the low resolution of the objects themselves. However, our specific approach required one type of R-OMW object, namely, the Adolf adit portal, which currently has a collapsed entrance and is difficult to identify in the terrain. This fact did not allow its identification from any generated DEM material (Figure 10, (1) Adolf adit portal). There are several such adit portals in the selected area of the hamlet Magurka, but some of them have the possibility of partial identification through terrain notches visible on the DEM, indicating the collapsed adit portals. The DEM with a pixel resolution of 2 m for smaller objects than an adit portal (Figure 9, (2) Klinger short adit portal and (3) Klinger long adit portal; Figure 10, (3) Kilián adit portal and (5) Russeger adit portal) no longer provides a suitable source for the precise spatial location. For larger objects, this sort of identification problem did not occur on the same basis. Larger objects can be more easily identified from the DEM background with almost all pixel resolution settings. When the pixel resolution is set to 4 m, the area delimitation of the given object’s boundary is endangered (Figure 10, last column with 10 × a = 4 m). Based on the DEM’s MDHS, we evaluated each object’s location, presented through the register’s selected symbolization. Their locations did not correspond to the terrain breakdown from the DEM.
Based on field inspections and the available documentation, we obtained the terrain layout of the OMW environment. OMWs were accurately identified based on a DEM generated from the LiDAR points cloud. Specifically, these were the adit portals, the identification of which, based solely on MDHS analysis, would be quite problematic due to their small size (Figure 10, (3) Kilián adit portal and (5) Russeger adit portal). In the case of collapsed adit portals, the only solution is to locate them using a GNSS receiver directly in the terrain (Figure 10, (1) Adolf adit portal).
Inaccuracies in spatial localization and conflicting information about the dimensions of the R-OMW objects were caused by the following:
  • Localization of the OMW, which was drawn into the vector layer based on the digitization of the underlying map, according to the results of the field survey;
  • Ambiguous access to the location of above-ground objects typologically characterized in R-OMW as a point or area (e.g., location of an adit portal or terrain notch indicating an adit portal; site of mine dump using the nearest point, or its center of gravity, or the center of the top of the embankment cone);
  • Inaccuracy of the base map depending on the display scale used (on the map and in the field);
  • Digitization and transformation of map data into R-OMW.
In this study, we focus on evaluating spatial deviations in OMW positions, which were confirmed by the above facts. For more detailed characteristics, we used the general information given in Section 2.2. Due to the availability of records of R-OMW objects based on OSM, we proceeded to compare their spatial distribution and determine the size of the positional deviations, including their azimuth. With this approach, we wanted to emphasize the differences in the records of the selected R-OMW objects’ locations. The comparison results are presented in Table 3, Table 4 and Table 5, in which both the study areas are considered.
Combinations of map data were selected as comparative aspects, which differed with the choice of area. In the Mining Museum area, positional deviations of OMWs, between different sources of their position data, were assessed, as follows: R-OMW (vector presentation of the geometric type of point objects), MDHS (generated from DEM/LiDAR), and OSM. The coordinates of the OMWs, determined based on the above data, were compared. From their coordinates, positional deviations ΔP in meters, and their azimuth A in degrees were calculated. In our sample of selected objects (five objects, see Table 3), we found incomplete information about their location in the specified types of sources.
For this reason, it was possible to comprehensively evaluate only the two most important objects included in R-OMW (Ondrej shaft, Bartolomej adit portal) from this area. The average positional deviation of these two objects between DEM/LiDAR and OSM was 1.2 m. When comparing R-OMW and OSM, the average positional deviation of these two objects was 26.1 m. The locations of all the selected OMWs could be compared between DEM/LiDAR and R-OMW, with an average positional deviation of 27.5 m. These positional deviations (Table 3) result in the average deviations of R-OMW objects from their actual position, being more than 23 times higher than with OSM.
In the hamlet Magurka area, we assessed the R-OMW objects’ positional deviations on the following bases: R-OMW (vector presentation of the geometric type of point object), GNSS measurements, MDHS (generated from DEM/LiDAR), and OSM.
Based on the above data, we compared the coordinates of the R-OMW objects, and from them the positional deviations of their ΔP and azimuth A were calculated. From all the data, position information was available only for the R-OMW objects presented in Table 4. For this reason, it was possible to comprehensively evaluate only the four most important objects included in the R-OMW (the adit portals Ritterstein, Adolf, Kilián, Russeger) from this area. An exception was the Adolf adit portal, which could not be identified based on MDHS analysis due to the collapsed adit entrance. The average positional deviation of these four objects between GNSS and R-OMW was 39.2 m (Table 4). When comparing GNSS and OSM, the average positional deviation of these four objects was 14.0 m, and in comparison with MDHS, the average positional deviation was 1.1 m. It follows that the average positional deviation of the R-OMW objects compared with OSM is almost three times higher. The positional deviations between GNSS and MDHS are relatively small compared to other position sources, which places the DEM in the group of usable sources for OMWs spatial localization (existing to date).
The following part of the study presents the results of determining the spatial distribution of OMWs without the GNNS measurements. We used the comparison of coordinates from MDHS, R-OMW and OSM. From the available information about the locations of objects in this area, the data presented in Table 5 were created. The average positional deviation of these objects between MDHS and R-OMW was 32.6 m. When comparing MDHS and OSM, the average positional deviation was 22.5 m. Between R-OMW and OSM, the average positional deviation was 43.6 m. It follows that the average positional deviation of the R-OMW objects compared to OSM is almost 1.5 times higher.

4. Conclusions

Historical mining activity in Slovakia has left significant traces. The number of objects registered in the R-OMW, mainly as shafts, adit portals, mine dumps, pings and tailing ponds, is estimated in tens of thousands. Although there are no active mining operations in these objects, they continue to be a significant element of the local economy, environment, and culture. In this context, there are several important reasons for the registration of these objects (with so-called passports) based on historical mining activity, as many of them are abandoned and dilapidated. Further sustainable development in R-OMW administration in Slovakia requires updating and supplementing the missing information (not only the spatial distribution, but also the dimensions of OMWs, which do not correspond to the actual dimensions, see Table 3, Table 4 and Table 5, column “Size”). The positional accuracy of the registered location of the objects in their current form is unsatisfactory in terms of its further use. The bases on which the OMWs were localized were inaccurate compared to the current positioning possibilities, and show significant positional deviations. For this reason, it is necessary to re-localize the OMWs using modern measurement technologies.
In our study, we focus on the inventory of spatial data defining the location of OMWs. To carry out the case study, we selected two significant areas with rich gold mining history, one in the western part of Banská Štiavnica town and the other just south of the hamlet named Magurka on the northern slopes of the Low Tatras. The most effective approach to a comprehensive solution to the selected issue involves using LIDAR data, the processing and analysis of which allows the locations (2D/3D) and the above-ground shapes of OMWs (e.g., mine dumps, tailing ponds) to be determined. In the processing methodology, we considered the approach of determining the spatial distribution of OMWs from the *.las files. To achieve the chosen methodology’s main aim, we needed to specify the OMWs, for which two different methodological approaches of processing were selected (see Section 3.1.1 and Section 3.1.2).
The results of the study are presented, based on data generated from LiDAR (DEM). The conditions for setting up DEM raster sampling for the individual study areas depended on the size of the objects in the R-OMW, which we chose. The setting of the pixel resolution parameter was based on the average point spacing of class 02—ground (LiDAR), the maximum value of which was increased ten times (10 × a) (see Figure 9 and Figure 10). In the chosen areas, we determined positional deviations of OMWs between R-OMW (vector presentation of the geometric type of point objects), GNSS measurements, multidirectional hill-shade (generated from DEM/LiDAR), and OSM. Based on the comparison of the positional deviations in both the selected areas and the same identified OMWs, the following conclusions were reached. When comparing the positions of the nineteen OMWs between MDHS and R-OMW, an average positional deviation of 33.6 m was found. When comparing the locations of the twelve OMWs between MDHS and OSM, we found an average positional deviation of 16.3 m. Between the GNSS measurements and R-OMW, we found an average positional deviation of 39.2 m concerning four OMWs.
These study results can serve as a basis for the creation of a new methodology for updating the R-OMW managed by the State Geological Institute of Dionýz Štúr. Using the DEM/LiDAR data, it should be possible to create a 3D register from the 2D R-OMW, as no altitude information is currently recorded in this register. The implementation of the DEM in the form of multidirectional hill-shading on the application platform should facilitate field research in the future, to quickly search and more accurately locate objects. This implementation should contribute to the efforts of the Geofond Department of the State Geological Institute of Dionýz Štúr to increase data management efficiency in R-OMW. Future research in this area could shift the issue towards contour extraction of OMW surface objects, which plays an essential role in the effective management of R-OMW, especially in assessing the impact of this group of objects on the environment.
The sustainability and impact of this study on future development in the area of R-OMW can be divided into the following two key areas:
  • Environmental (ecological part)—all mining works (historical or current) should be recorded in the register, because they may pose a potential threat to the environment (e.g., contaminated mining waters flowing from underground spaces directly to the Earth’s surface, or the impacts of mining on the land cover/surface—the formation of surface depressions, or collapses of mined areas or mine dumps). Based on the study results, it is possible to add new objects to the R-OMW, which may have been unregistered or abandoned until now.
  • Spatial planning and land use—R-OMW serves as a basis for spatial planning authorities, as enshrined in the legislation (Paragraph 14 of Act. No. 569/2007 Coll.—use of the results of geological work in spatial planning concerning old mining works). For this reason, it is essential to have complete, accurate and reliable information in the register about the objects that constitute it. The importance of regular updating of the register data arises from the need to improve the current state of land use (remediation and monitoring of potential environmental burdens) and further use of objects in the register from the point of view of geotourism (more details in Section 2.1).
Further sustainable development of the register, concerning the application use of current modern technologies of spatial data collection and processing of ICT, requires updating and implementing into the operational processes of the SGIDŠ organization.

Author Contributions

Conceptualization: M.B.G., S.L. and J.M.; methodology: M.B.G. and S.L.; software: M.B.G. and S.L.; validation: M.B.G. and S.L.; formal analysis: M.B.G., S.L., J.M., P.S. and L.L.; investigation: M.B.G. and S.L.; resources: M.B.G. and S.L.; data curation: M.B.G., S.L. and J.M.; writing—original draft preparation: M.B.G. and S.L.; writing—review and editing: M.B.G. and S.L.; visualization: M.B.G. and S.L.; supervision: M.B.G., S.L., J.M., P.S. and L.L. All authors have read and agreed to the published version of the manuscript.

Funding

This research was funded by the Scientific Grant Agency of the Ministry of Education, Science, Research, and Sport of the Slovak Republic, grant number KEGA 004TUKE-4/2019, KEGA 055TUKE-4/2021.

Institutional Review Board Statement

Not applicable.

Informed Consent Statement

Not applicable.

Data Availability Statement

Not applicable.

Acknowledgments

The authors also thank the Geodesy, Cartography, and Cadastre Authority of the Slovak Republic for providing the ALS data. Many thanks belong to the anonymous reviewers and the editor for their useful comments and suggestions.

Conflicts of Interest

The authors declare no conflict of interest. The funders had no role in the design of the study; in the collection, analyses, or interpretation of data; in the writing of the manuscript; or in the decision to publish the results.

References

  1. Taušová, M.; Mihaliková, E.; Čulková, K.; Stehlíková, B.; Tauš, P.; Kudelas, D.; Štrba, L.; Domaracká, L. Analysis of municipal waste development and management in self-governing regions of Slovakia. Sustainability 2020, 12, 5818. [Google Scholar] [CrossRef]
  2. Záviš, V.; Pristašová, Ľ.; Caudt, Ľ.; Hubač, P.; Sandanus, M.; Fodorová, V.; Hudáček, J.; Repčiak, M. Slovakia—Proposal for Remediation of Old Mining Works—Inventory, Reconnaissance Survey, as of 31/12/1996; Geologická Služba SR: Bratislava, Slovakia, 1996; p. 197. [Google Scholar]
  3. Bindzarova Gergelova, M.; Labant, S.; Kuzevic, S.; Kuzevicova, Z.; Pavolova, H. Identification of roof surfaces from LiDAR cloud points by GIS tools: A case study of Lucenec, Slovakia. Sustainability 2020, 12, 6847. [Google Scholar] [CrossRef]
  4. Bindzarova Gergelova, M.; Kuzevicova, Z.; Labant, S.; Kuzevic, S.; Bobikova, D.; Mizak, J. Roof’s Potential and Suitability for PV Systems Based on LiDAR: A Case Study of Komárno, Slovakia. Sustainability 2020, 12, 10018. [Google Scholar] [CrossRef]
  5. Pukanská, K.; Bartoš, K.; Sabová, J. Comparison of survey results of the surface quarry Spišské Tomášovce by the use of photogrammetry and terrestrial laser scanning. Inz. Miner. 2014, 15, 47–54. [Google Scholar]
  6. Zebedin, L.; Klaus, A.; Gruber-Geymayer, B.; Karner, K. Towards 3D map generation from digital aerial images. ISPRS J. Photogramm. Remote Sens. 2006, 60, 413–427. [Google Scholar] [CrossRef]
  7. Tompalski, P.; White, J.C.; Coops, N.C.; Wulder, M.A. Quantifying the contribution of spectral metrics derived from digital aerial photogrammetry to area-based models of forest inventory attributes. Remote Sens. Environ. 2019, 234, 111434. [Google Scholar] [CrossRef]
  8. Pearse, G.D.; Dash, J.P.; Persson, H.J.; Watt, M.S. Comparison of high-density LiDAR and satellite photogrammetry for forest inventory. ISPRS J. Photogramm. Remote Sens. 2018, 142, 257–267. [Google Scholar] [CrossRef]
  9. Zhang, W.; Wang, W.; Chen, L. Constructing DEM Based on InSAR and the Relationship between InSAR DEM’s Precision and Terrain Factors. Energy Procedia 2012, 16, 184–189. [Google Scholar] [CrossRef] [Green Version]
  10. White, J.C.; Woods, M.; Krahn, T.; Papasodoro, C.; Bélanger, D.; Onafrychuk, C.; Sinclair, I. Evaluating the capacity of single photon lidar for terrain characterization under a range of forest conditions. Remote Sens. Environ. 2021, 252, 112169. [Google Scholar] [CrossRef]
  11. Moudrý, V.; Gdulová, K.; Fogl, M.; Klápště, P.; Urban, R.; Komárek, J.; Moudrá, L.; Štroner, M.; Barták, V.; Solský, M. Comparison of leaf-off and leaf-on combined UAV imagery and airborne LiDAR for assessment of a post-mining site terrain and vegetation structure: Prospects for monitoring hazards and restoration success. Appl. Geogr. 2019, 104, 32–41. [Google Scholar] [CrossRef]
  12. Sharma, M.; Garg, R.D.; Badenko, V.; Fedotov, A.; Min, L.; Yao, A. Potential of airborne LiDAR data for terrain parameters extraction. Quat. Int. 2021, 575–576, 317–327. [Google Scholar] [CrossRef]
  13. Guo, Q.; Li, W.; Yu, H.; Alvarez, O. Effects of topographie variability and lidar sampling density on several DEM interpolation methods. Photogramm. Eng. Remote Sens. 2010, 76, 701–712. [Google Scholar] [CrossRef] [Green Version]
  14. Castillo, C.; Taguas, E.V.; Zarco-Tejada, P.; James, M.R.; Gómez, J.A. The normalized topographic method: An automated procedure for gully mapping using GIS. Earth Surf. Process. Landf. 2014, 39, 2002–2015. [Google Scholar] [CrossRef]
  15. Pánek, T.; Břežný, M.; Kapustová, V.; Lenart, J.; Chalupa, V. Large landslides and deep-seated gravitational slope deformations in the Czech Flysch Carpathians: New LiDAR-based inventory. Geomorphology 2019, 346, 106852. [Google Scholar] [CrossRef]
  16. Zhu, J.; Pierskalla, W.P. Applying a weighted random forests method to extract karst sinkholes from LiDAR data. J. Hydrol. 2016, 533, 343–352. [Google Scholar] [CrossRef]
  17. Hofierka, J.; Gallay, M.; Bandura, P.; Šašak, J. Identification of karst sinkholes in a forested karst landscape using airborne laser scanning data and water flow analysis. Geomorphology 2018, 308, 265–277. [Google Scholar] [CrossRef]
  18. Doyle, T.B.; Woodroffe, C.D. The application of LiDAR to investigate foredune morphology and vegetation. Geomorphology 2018, 303, 106–121. [Google Scholar] [CrossRef]
  19. Stereńczak, K.; Ciesielski, M.; Bałazy, R.; Zawiła-Niedźwiecki, T. Comparison of various algorithms for DTM interpolation from LIDAR data in dense mountain forests. Eur. J. Remote Sens. 2016, 49, 599–621. [Google Scholar] [CrossRef]
  20. Bater, C.W.; Coops, N.C. Evaluating error associated with lidar-derived DEM interpolation. Comput. Geosci. 2009, 35, 289–300. [Google Scholar] [CrossRef]
  21. Doneus, M.; Briese, C. Airborne Laser Scanning in forested areas–potential and limitations of an archaeological prospection technique. Remote Sens. Archaeol. Herit. Manag. 2011, 5, 59–76. [Google Scholar]
  22. John, J.; Gojda, M. Principles of airborne laser scanning and its use for archaeological remote survey. In Archaeology and Airborne Laser Scanning of the Landscape; Katedra Archeologie Západočeská Univerzita v Plzni: Plzeň, Czech Republic, 2013; pp. 8–20. [Google Scholar]
  23. Fisher, C.T.; Cohen, A.S.; Fernández-Diaz, J.C.; Leisz, S.J. The application of airborne mapping LiDAR for the documentation of ancient cities and regions in tropical regions. Quat. Int. 2017, 448, 129–138. [Google Scholar] [CrossRef]
  24. Luo, L.; Wang, X.; Guo, H.; Lasaponara, R.; Zong, X.; Masini, N.; Wang, G.; Shi, P.; Khatteli, H.; Chen, F.; et al. Airborne and spaceborne remote sensing for archaeological and cultural heritage applications: A review of the century (1907–2017). Remote Sens. Environ. 2019, 232, 111280. [Google Scholar] [CrossRef]
  25. Bollandsås, O.M.; Risbøl, O.; Ene, L.T.; Nesbakken, A.; Gobakken, T.; Næsset, E. Using airborne small-footprint laser scanner data for detection of cultural remains in forests: An experimental study of the effects of pulse density and DTM smoothing. J. Archaeol. Sci. 2012, 39, 2733–2743. [Google Scholar] [CrossRef]
  26. Gresova, E.; Svetlik, J. Modeling within national economy using industry-oriented indicators: Evidence from Czech Republic. MM Science Journal. 2020, 2020, 3892–3895. [Google Scholar] [CrossRef]
  27. Sombathy, E.; Kúšik, D.; Mižák, J. Slovak Mining Road. Slovak Geol. Mag. 2018, 1, 83–106. [Google Scholar]
  28. Šoltés, S.; Kúšik, D.; Mižák, J. Register of old workings and their web-based application. Miner. Slovaca 2010, 4, 522–524. [Google Scholar]
  29. Kašiarová, E. Banícka a Hutnícka Minulosť Slovenska v Kartografických Pamiatkach, 1st ed.; Ing. Tibor Turčan—Banská Agentúra; Zväz Hutníctva, ťažobného Priemyslu a Geológie Slovenskej Republiky: Košice, Slovakia, 2010; p. 191. [Google Scholar]
  30. Ovesná, G.; Staňková, H.; Plánka, L.; Wlochová, A. The history of mine surveying and mining maps. Geod. Cartogr. 2017, 43, 118–123. [Google Scholar] [CrossRef] [Green Version]
  31. Maková, A. Prieskum a reštaurovanie najstaršej banskej mapy HKG. In Proceedings of the Historické Mapy, Kartografická spoločnosť SR, Bratislava, Slovakia, 24 October 2013; pp. 91–98. [Google Scholar]
  32. RIEGL LMS-Q780. Available online: www.riegl.com/uploads/tx_pxpriegldownloads/DataSheet_LMS-Q780_2015-03-24.pdf (accessed on 11 March 2021).
  33. Juhász, L.; Hochmair, H.H. OSM Data Import as an Outreach Tool to Trigger Community Growth? A Case Study in Miami. ISPRS Int. J. Geo-Inf. 2018, 7, 113. [Google Scholar] [CrossRef] [Green Version]
  34. Li, L.; Nearing, M.A.; Nichols, M.H.; Polyakov, V.O.; Phillip Guertin, D.; Cavanaugh, M.L. The effects of DEM interpolation on quantifying soil surface roughness using terrestrial LiDAR. Soil Tillage Res. 2020, 198, 104520. [Google Scholar] [CrossRef]
  35. Cățeanu, M.; Ciubotaru, A. The effect of lidar sampling density on DTM accuracy for areas with heavy forest cover. Forests 2021, 12, 265. [Google Scholar] [CrossRef]
  36. Langridge, R.M.; Ries, W.F.; Farrier, T.; Barth, N.C.; Khajavi, N.; De Pascale, G.P. Developing sub 5-m LiDAR DEMs for forested sections of the Alpine and Hope faults, South Island, New Zealand: Implications for structural interpretations. J. Struct. Geol. 2014, 64, 53–66. [Google Scholar] [CrossRef]
  37. Shi, W.; Deng, S.; Xu, W. Extraction of multi-scale landslide morphological features based on local Gi* using airborne LiDAR-derived DEM. Geomorphology 2018, 303, 229–242. [Google Scholar] [CrossRef]
  38. Sofia, G. Combining geomorphometry, feature extraction techniques and Earth-surface processes research: The way forward. Geomorphology 2020, 355, 107055. [Google Scholar] [CrossRef]
  39. Veronesi, F.; Hurni, L. A GIS tool to increase the visual quality of relief shading by automatically changing the light direction. Comput. Geosci. 2015, 74, 121–127. [Google Scholar] [CrossRef]
  40. Wang, Y.H.; Tseng, Y.H. Raster mapping of topographic parameters derived from high resolution Digital Elevation Models. In Proceedings of the ACRS 2015—36th Asian Conference on Remote Sensing, Fostering Resilient Growth in Asia, Quezon City, Philippines, 24–28 October 2015. [Google Scholar]
Figure 1. Flow-chart of work using the methodology.
Sustainability 13 06981 g001
Figure 2. Overview of the location of old mining works and localities with accessible ALS point clouds based on the background data of geomorphological division of the SR: (a) graphical representation of locality No. 12 Banská Štiavnica; (b) overview of available ALS point cloud; (c) graphical representation of locality No. 24 Low Tatras; (d) overview of available ALS point cloud.
Sustainability 13 06981 g002
Figure 3. Inventory of old mining works in Slovakia. (a) Division of Slovakia into the fields of inventory; (b) steps of inventorization.
Sustainability 13 06981 g003
Figure 4. An example of depiction of the oldest map in SR. (a) Part of the oldest map kept by main chamber—Count Office in the Kammerhof before reconstruction [30] and after reconstruction [31]; (b) part of the longitudinal profile of mining works in Banskej Štiavnici (Source: http://mek.oszk.hu/06400/06422/html/banyameres/banya4_sl.html/, accessed date: 15 March 2021).
Sustainability 13 06981 g004
Figure 5. Data sources of map documentation of old mining works. (a) Old mining works map (Source: authors); (b) base map of the SR 1:10,000 in D-UTCN (Source: authors).
Sustainability 13 06981 g005
Figure 6. Graphical presentation of the classified points cloud from ALS in the ArcGIS Pro 2.7.2 environment. (a) Spatial localization of the OMW representation with the routes of underground mining tunnels; (b) selected OMWs with the assignment of their geolocation; (c) available photo documentation of selected OMWs; (d) presentation of selected OMWs based on ALS data of classes 01—unassigned, 02—ground, 06—buildings; (e) cross-section of selected OMWs based on ALS data.
Sustainability 13 06981 g006
Figure 7. Graphical presentation of the classified points cloud from ALS with the representation of classes 02—ground, 03—low vegetation and 04—medium vegetation in the ArcGIS Pro 2.7.2 environment. (a) Spatial localization of the OMW representation with the routes of the underground mining tunnels; (b) selected OMWs with the assignment of their geolocation; (c) available photo documentation of selected OMWs; (d) presentation of selected OMWs based on ALS data of class 02—ground; (e) cross-section of selected OMWs based on ALS data of classes 02—ground, 04—medium vegetation, 05—high vegetation.
Sustainability 13 06981 g007
Figure 8. Graphical presentation of algorithm of *.las LiDAR point clouds processing for DEM generation and other spatial analyses based on DEM.
Sustainability 13 06981 g008
Figure 9. Graphical presentation of the results of multidirectional hill-shade analysis in ArcGIS Pro 2.7.2 for selected pixel resolution values on selected objects (1)–(3) from the area of the Mining Museum. (a) Generation of DEM morphology using cell assignment average; (b) generation of DEM morphology using cell assignment IDW.
Sustainability 13 06981 g009
Figure 10. Graphical presentation of the results of multidirectional hill-shade analysis in ArcGIS Pro 2.7.2 for selected pixel resolution values on selected objects (1)–(5) from the area of hamlet Magurka. (a) Generation of DEM morphology using cell assignment average; (b) generation of DEM morphology using cell assignment IDW.
Sustainability 13 06981 g010
Table 1. Structure and number of objects of the register of old mining works and recent mining works.
No.Objects SymbolsType of ObjectClassification CodesNumber of Objects
1 Sustainability 13 06981 i001shaft—mine tower06—buildings525
2adit portal—adit entrance01—unassigned, 02—ground5333
3tailing pond02—ground50
4ping, ping move02—ground3881
5mine dump02—ground6377
6other type of object01—unassigned, 02—ground543
Table 2. Basic characteristics of LiDAR dataset (Source of ALS products: “GCCA SR/ÚGKK SR”).
Selected Areas of the Case StudyIII
LOT number1224
LOT nameBanská ŠtiavnicaMining Museum (MM)Low TatrasHamlet Magurka (HM)
Cadastre unitBanská ŠtiavnicaPartizánska Ľupča
Area1200 km20.303 km21154 km21.998 km2
Total points98,370,602,25622,531,91150,374,348,93566,855,109
Average point density82.074.443.733.5
Average point spacing0.11 m0.12 m0.15 m0.17 m
Number of points class 02—ground40,825,347,8646,859,43612,141,129,16112,481,531
Average point density34.022.610.56.2
Average point spacing0.17 m0.21 m0.310.40 m
Vertical accuracy in ETRS89-h0.04 m0.05 m
Positional accuracy in ETRS89-TM340.13 m0.10 m
Coordinate reference systemD-UTCN implemented by UTCN03/Krovak East North (EPSG: 8353)
Vertical reference systemBaltic vertical datum—after adjustment
Table 3. Overview of selected identified objects from R-OMW for the Mining Museum area with the presentation of calculated positional deviations ΔP and their azimuth A.
No.ID No. R-OMW 36-33-09OMW (Table 1)R-OMWLidar to R-OMWLidar to OSMR-OMW to OSM
SymNameSize [m]ΔP [m]A [°]ΔP [m]A [°]ΔP [m]A [°]
10234 Sustainability 13 06981 i002Klinger Dlhá-6.42227.6----
20238 Sustainability 13 06981 i003Ondrej-16.79250.31.07223.915.8472.0
30242 Sustainability 13 06981 i003Amália-75.05169.1----
40243 Sustainability 13 06981 i002Klinger Krátka-4.4453.2----
50247 Sustainability 13 06981 i002Bartolomej-35.02136.11.32312.236.34316.0
Average27.54 1.20 26.09
Table 4. Overview of selected objects of R-OMW with positioning using GNSS technology for the hamlet Magurka area, presenting calculated positional deviations of ΔP and azimuth A.
No.ID No. R-OMWOMW
(Table 1)
R-OMWGNSS to R-OMWGNSS to OSMGNSS to LiDARLidar to R-OMWLiDAR to OSMR-OMW to OSM
36-21-12SymNameSize [m]ΔP [m]A [°]ΔP [m]A [°]ΔP [m]A [°]ΔP [m]A [°]ΔP [m]A [°]ΔP [m]A [°]
10063 Sustainability 13 06981 i002Ritterstein1 × 895.906.07.64148.01.01152.696.745.76.64147.2102.02183.4
20080 Sustainability 13 06981 i002Adolf4 × 1016.01320.019.4211.5------15.7064.5
30084 Sustainability 13 06981 i002Kilián2 × 223.01213.517.17265.70.87277.322.64211.516.32265.118.45346.1
40191 Sustainability 13 06981 i002Russeger2 × 221.75261.511.72295.61.2956.722.89260.212.41290.713.7352.8
Average39.17 13.99 1.06 47.42 11.84 37.48
Table 5. Overview of selected identified objects from R-OMW for the hamlet Magurka area, presenting calculated positional deviations of ΔP and azimuth A.
No.ID No. R-OMWOMW (Table 1)R-OMWLiDAR to R-OMWLiDAR to OSMR-OMW to OSM
36-21-12SymNameSize [m]ΔP [m]A [°]ΔP [m]A [°]ΔP [m]A [°]
10065 Sustainability 13 06981 i002No name2 × 1070.75319.88.53199.575.41145.4
20082 Sustainability 13 06981 i002Magurka3 × 1570.84333.143.9450.274.53118.0
30097 Sustainability 13 06981 i002No name2 × 224.92122.715.7137.228.41336.2
40127 Sustainability 13 06981 i002No name2 × 518.16190.539.00104.441.8778.8
50144 Sustainability 13 06981 i002No name4 × 716.67189.6----
60156 Sustainability 13 06981 i002No name3 × 315.55196.0----
70158 Sustainability 13 06981 i002No name1 × 1018.65336.9----
80160 Sustainability 13 06981 i002No name2 × 1045.51276.312.92341.741.8280.0
90177 Sustainability 13 06981 i002No name3 × 613.1262.4----
100187 Sustainability 13 06981 i002Frantíšek Dolná2 × 835.92300.729.10339.922.7666.7
110189 Sustainability 13 06981 i002Frantíšek Horná2 × 628.2122.08.0834.720.41197.0
Average32.57 22.47 43.60
Publisher’s Note: MDPI stays neutral with regard to jurisdictional claims in published maps and institutional affiliations.

