1. Introduction
The transformation of the energy system is of high importance to meet the goals of the Paris agreement [
1]. Innovative energy technologies are necessary to make a considerable contribution to this transformation process. Hence, the European Commission proposed the European Green Deal, a concept for Europe to become climate neutral by 2050 and to transform the EU’s economy in a sustainable manner [
2]. Preceding this, the EU published the Hydrogen Roadmap Europe [
3] in 2019. Hydrogen, as a secondary energy carrier, is discussed frequently in energy transformation scenarios, e.g., [
4,
5]. It is easier to store than electricity, can be directly used as feedstock, or can help to electrify several other sectors besides the energy sector, e.g., mobility or industry. However, hydrogen should only be used if a direct electrification is hard to achieve, e.g., large battery demand for heavy-duty vehicles or demand of a very steady heat source in the glass industry, because of the lower efficiency of hydrogen applications compared to direct electrification.
In order to analyze greenhouse gas reduction potentials without losing track of other associated effects, a comprehensive sustainability assessment is necessary. In addition to other environmental impacts, this should also include economic as well as social implications [
6]. The Life Cycle Sustainability Assessment (LCSA) is one approach for a holistic assessment of emerging technologies [
7]. The interpretation phase of an LCSA, however, is challenging, because many different single results are obtained and it is not easy to propose one unambiguous solution. For scientific communities, it might be interesting to discuss them separately in detail and the UNEP/SETAC even recommends to do so [
7]. For decision-making processes and for audiences not too familiar with the single-impact categories, this seems even more challenging. To structure and guide decision-making processes in this context, the Multi-Criteria Decision Analysis (MCDA) has been developed. The MCDA comprises mathematical approaches to cluster the wide number of individual results to fewer but more manageable results [
8,
9]. One well-known method is the weighted sum approach, which is very easily manageable but fails to cover more complex decision-making contexts. In contrast, elaborated MCDA approaches such as the Technique for Order of Preference by Similarity to Ideal Solution (TOPSIS), Preference Ranking Organization METHod for Enrichment Evaluation (PROMETHEE) or Elimination Et Choix Traduisant la REalité (ELECTRE) are able to address complex problems. Regardless of which method is to be used within the MCDA guidance process, fundamental value-based choices have to be made. One mandatory decision is to what extent compensation between indicators is allowed [
10]. One class of non-compensatory methods is based on outranking of the different options assessed, e.g., PROMETHEE.
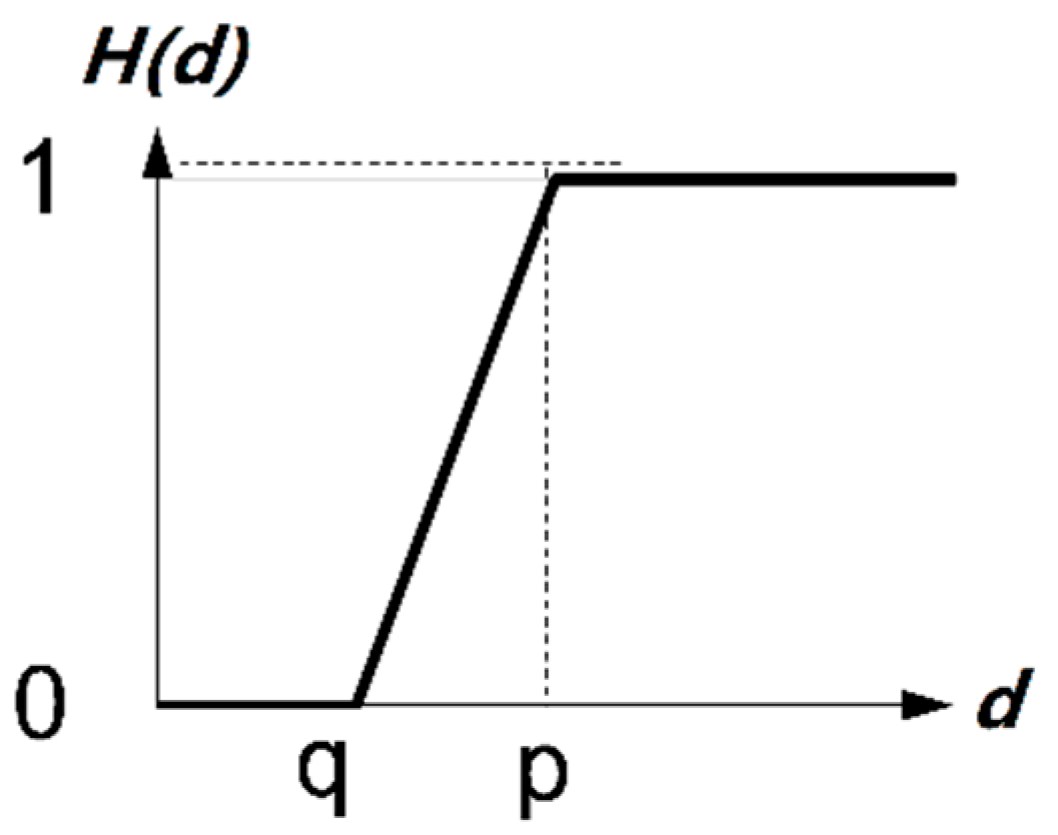
Irrespective of compensations, for options where the indicator results are close to each other, often no definitive statement should be made due to uncertainties. In MCDA, thresholds have been introduced to prevent the overrating of very small indicator deviations, though “very small” is not exactly defined. Bouyssou [
11] even found it of utmost importance to use thresholds when applying non-compensatory methods. For the determination of these thresholds, different approaches are available [
12], based, for example, on the decision-makers’ uncertainty about their preferences [
13]. How reasonable thresholds can be defined in the context of LCSA is discussed in this paper. The focus here is on the uncertainty of impact categories in LCSA.
Some methodological aspects of LCSA are discussed beforehand in this paper, which are necessary for the determination of thresholds based on the applied indicators/impact categories. Furthermore, outranking in general and the chosen MCDA method is presented in more detail. Subsequently, our newly developed approach to derive indicator thresholds for LCSA is introduced based on Life Cycle Impact Assessment (LCIA).
To secure that a climate-friendly and cost-effective technology does not deteriorate other environmental impacts and social conditions, LCSA is applied to the industrial production of hydrogen with alkaline water electrolysis (AEL) in the European context. Up to now, only a few LCSAs for hydrogen have been conducted [
14,
15,
16]. Here, the current situation of AEL is assessed. Three European countries (Austria, Germany and Spain) are compared as potential production locations based on earlier publications by the authors [
17,
18,
19]. To find unambiguous statements about the preferential location in three selected Western European countries, we integrate MCDA in the interpretation phase of the LCSA without allowing compensation. The aim is to strengthen the validity of the conclusions obtained for the three quite similar systems. In particular, the question of which deviation of indicator results for two options is large enough to prefer one option to the other or if these indicator results have to be considered as indifferent is addressed. With the approach developed in this paper, LCSA practitioners will be able to integrate uncertainty in particular derived from the impact assessment methodology in a simple and practical manner.
3. Case Study of Industrial Hydrogen Production by Alkaline Water Electrolysis
The object of this LCSA is the hydrogen production by an advanced AEL in three European countries. First, a description of the technical system is provided, followed by a short presentation and discussion of the indicator results, i.e., the LCA, LCC and S-LCA. In these results, uncertainty is not considered at this point and will be discussed in the results for PROMETHEE (
Section 4).
3.1. System Description
It is assumed that the mature technology of AEL is manufactured in Switzerland using technical input data from a local AEL supplier. The assembled electrolyzer is then transported to operation sites in either Germany, Austria or Spain. All three countries represent advanced Western European countries but differ with respect to important parameters, such as electricity supply, integration into international trade or social framework. However, other parameters might be quite similar, which emphasizes the use of indifference and preference thresholds to distinguish differences.
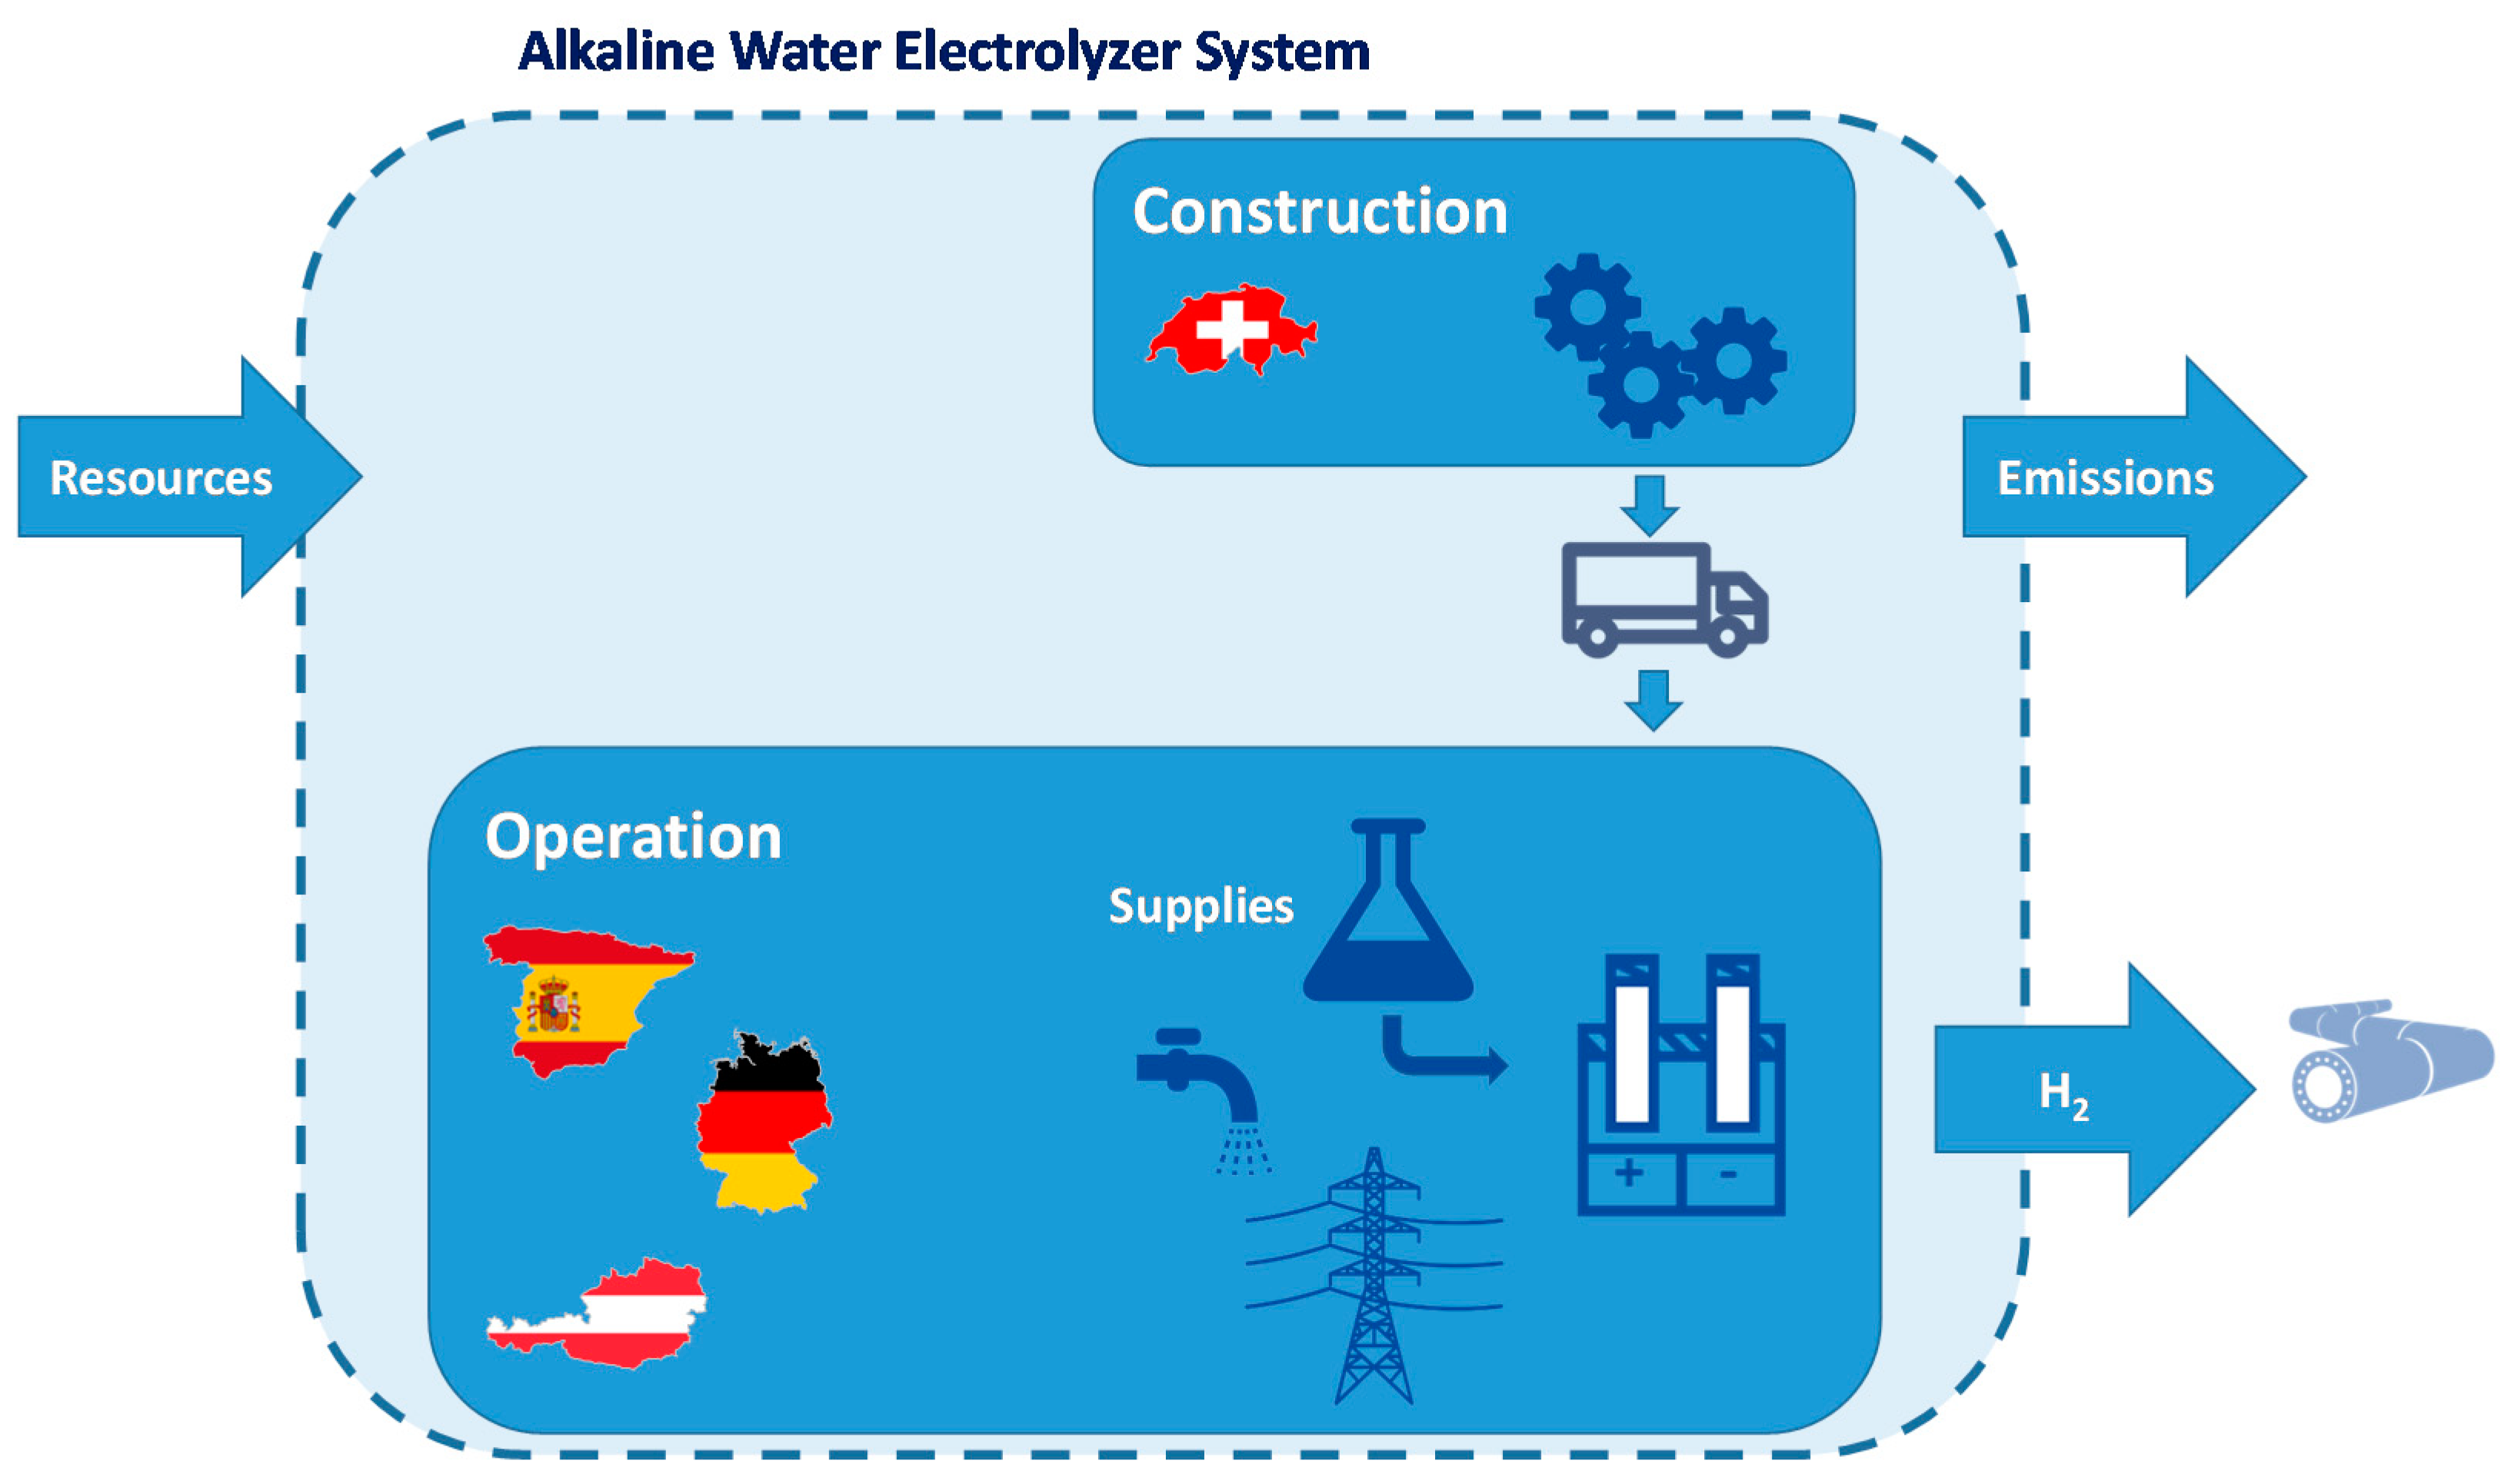
Figure 2 outlines the components considered in the assessments from cradle-to-gate.
The core element is the construction and operation of a pressurized 6 MW AEL, which contains four cell stacks consisting of 139 cells each within a stack framework embedded in the balance of plant (BOP). Electrolysis cells consist of a membrane, electrodes, a cell frame and a gasket. The BOP comprises tanks, heat exchangers, pumps, power electronics/inverter and a potassium hydroxide filter. A detailed elaboration of the structure and materials used for the AEL unit as well as an extensive description of the system boundaries are given in Koj et al. [
17].
The technical lifetime of the unit is expected to be 20 years, with a replacement of cell stacks necessary after ten years. Assuming a yearly operation time of 8300 h/year, the hydrogen output of the 6 MW AEL unit (118.25 kg H
2/h) has a production rate of 980 t/a (based on scaled-up data for a commercial AEL unit from the EU R&D project ELYGRID [
65]). In addition to large amounts of electricity, further operation inputs include de-ionized water, potassium hydroxide solution (KOH), process steam and nitrogen. While electricity, de-ionized water and KOH are relevant for the electrolysis process constantly, process steam and nitrogen are required for the run-up phases only.
The functional unit is the production of 1 kg of hydrogen at 33 bar and 40 °C. Hydrogen compression, storage, transport and further use are not considered. Due to the lack of data availability, the end-of-life treatment was not integrated. The utilization/selling of the by-product oxygen is not taken into account, as large-scale deployment of electrolysis capacities may go along with market saturation for oxygen and strongly decrease prices [
66]. Consequently, no allocation is necessary.
The specific material and energy inputs of the 6 MW AEL corresponding with the production of 1 kg of hydrogen are summarized in
Table 5. The table additionally includes the industrial sectors used for these inputs in the modelling with of the S-LCA with PSILCA.
While the technology parameters are identical for all countries under consideration, the supply of inputs is country-specific. The electricity supply reflects the national gross production mixes (see also [
17]). For investment as well as operation and maintenance, costs correspond to the country specific markets and regulatory conditions.
3.2. Indicator Results
The LCSA of the hydrogen production is based on three different already existing assessments: the LCA [
17], LCC [
18] and S-LCA [
19]. The previous LCA [
17] compared the environmental effects considering nine impact categories. In a subsequent assessment, a further six categories were added [
15]. The results emphasize the almost exclusive dependence of most environmental effects on the operation phase caused by the site-specific electricity mix. For most impacts, its share amounts to 80% in the case of Austria and even 90% in the cases of Spain and Germany. Austria shows the lowest environmental impacts in 13 out of 15 categories. Only for ‘Eutrophication, freshwater’, mainly caused by phosphorous compounds from bioenergy in the electricity mix, does Austria perform the worst. For ‘Human toxicity’, specifically concerning cancer effects, Spain shows lower impacts (
Table 6).
Considering ‘Resource depletion—water’, hydrogen production in Spain has the highest impact due to its water scarcity. However, the highest ‘Resource depletion—Water’ impact was the electrolyzer production, which is the same for all three process chains. It is almost exclusively caused by the upstream chain of nickel, which is crucial for the anode, cathode and cell frame. In addition, ‘Ozone depletion’ is almost completely dominated by nickel and the polytetrafluoroethylene used for cell manufacturing. For all other impact categories, construction of system components and the replacement of cell stacks have minor contributions.
Overall, from the environmental perspective, hydrogen production in Austria is by far the best option. Between Spain and Germany, the ranking is almost even, with Germany scoring the worst in eight categories and the best in one and Spain scoring the worst in seven and the best twice.
For the evaluation of the economic impacts of the system [
15,
18] country specific investment and operational costs (O&M), labor cost and, in particular, electricity costs were taken into account. The electricity costs differ widely in the countries considered due to national regulations for electricity generation and the transformation towards sustainable electricity systems with a high penetration of renewable and carbon-free energy sources. Again, the results are dominated by the need of electricity. In contrast to the environmental impacts, the German hydrogen production performs best in all financial metrics, due to a beneficial regulatory status of energy-intensive industries within the financial support of renewable energy sources. Although investment cost is slightly lower and labor cost is significantly lower in Spain, the difference cannot outweigh the higher electricity cost compared to Germany. Austria is always between Germany and Spain.
The S-LCA [
15] complements the environmental and economic assessment. In Werker et al. [
19], a deeper analysis of 5 out of 26 indicators was conducted to address the working conditions under which industrial hydrogen production takes place in the EU. The results showed that hydrogen production in Austria entails the highest risks in four out of five categories, followed by Spain and Germany. It also showed that with respect to ‘Trade union density’ and ‘Fair salary’, other upstream locations, such as India and China, negatively affect the Austrian and German process chain. ‘Gender wage gap’ and ‘Weekly hours of work per employee’ are mainly caused within the countries Austria and Spain. Considering the remaining 21 social indicators, Austria scores the worst 15 times, while Spain has the lowest risks in 13 impact categories [
15]. Overall, the risks associated stem mainly from the water (ø 60%) and electricity (ø 40%) sector as well as their upstream chains. Other sectors only exert marginal impact. All indicator results are summarized in
Table 6.
Summarizing the results of the three dimensions of sustainability, there is no clear winner. While Austria most often has the lowest environmental impacts, Germany has the lowest costs and Spain most often has the lowest social risks. This emphasizes the use of the MCDA to combine the different outcomes. The question of uncertainties and thresholds comes on top.
4. PROMETHEE for Integrating LCSA of Industrial Hydrogen Production
As each type of analysis, i.e., LCA, LCC, S-LCA, leads to a different preferred location for hydrogen production, an outranking becomes necessary. In order to make a decision on the best location for sustainable hydrogen production, PROMETHEE is applied. As the previous studies also indicated that several impacts are in a quite similar range, the application of thresholds seems reasonable. Here, first the results of PROMETHEE with relative common default thresholds of QDef = 5% and PDef = 10% of the minimal indicator result are presented. In a second section, the influence of specifying the thresholds (q′Spec, p′Spec) to LCIA methods is discussed.
4.1. PROMETHEE Results with Common Default Thresholds for Uncertainty in General
Using the common threshold concept with default values, quantifying the absolute thresholds leads to individual absolute q
Def and p
Def values for each indicator. These absolute thresholds are listed in
Table 7 for the discussed default approach. For a better understanding of the procedure in PROMETHEE as well as the deviations between two options, i.e., pairwise country comparisons, based on the results presented in
Table 6 are listed in
Table 7. If indicator values result in indifference for two countries, this is indicated with italic writing of the indicator; italic writing of the deviation shows which country pairing has indifferent results for this indicator.
The different dimensions of the LCSA are unequally affected by the application of thresholds. From the 15 LCA indicators, only ‘Resource depletion—Water’ shows results that can be considered equal between Germany and Austria. For all other LCA indicators, a clear distinction can be made which option to prefer. Weak preference is represented three times between Germany and Spain (‘Cumulative energy demand’, ‘Eutrophication, marine’ and ‘Eutrophication, terrestrial’) and once for ‘Eutrophication, freshwater’ between Germany and Austria.
The matter is different for LCC, as three out of four indicators of indifference between Austria and Spain can be identified, and for the fourth indicator, only a weak preference between those countries applies. Thus, a more detailed analysis is advised. For example, in Austria the connection to the grid level has a strong influence on the electricity prices (7.64 to 10.13 €
2015c/kWh) [
18] and prices for electricity for industrial customers rose by 23% from 2017 to 2020 (excluding VAT, deductible taxes and other levies) [
67].
Six out of 26 S-LCA indicators show indifference between two options, which is always between Germany and Austria. Additionally, there were five times when only a weak preference between the indicator results applied. However, this is evenly distributed between the country parings and never are all three options of one indicator affected by weak preference.
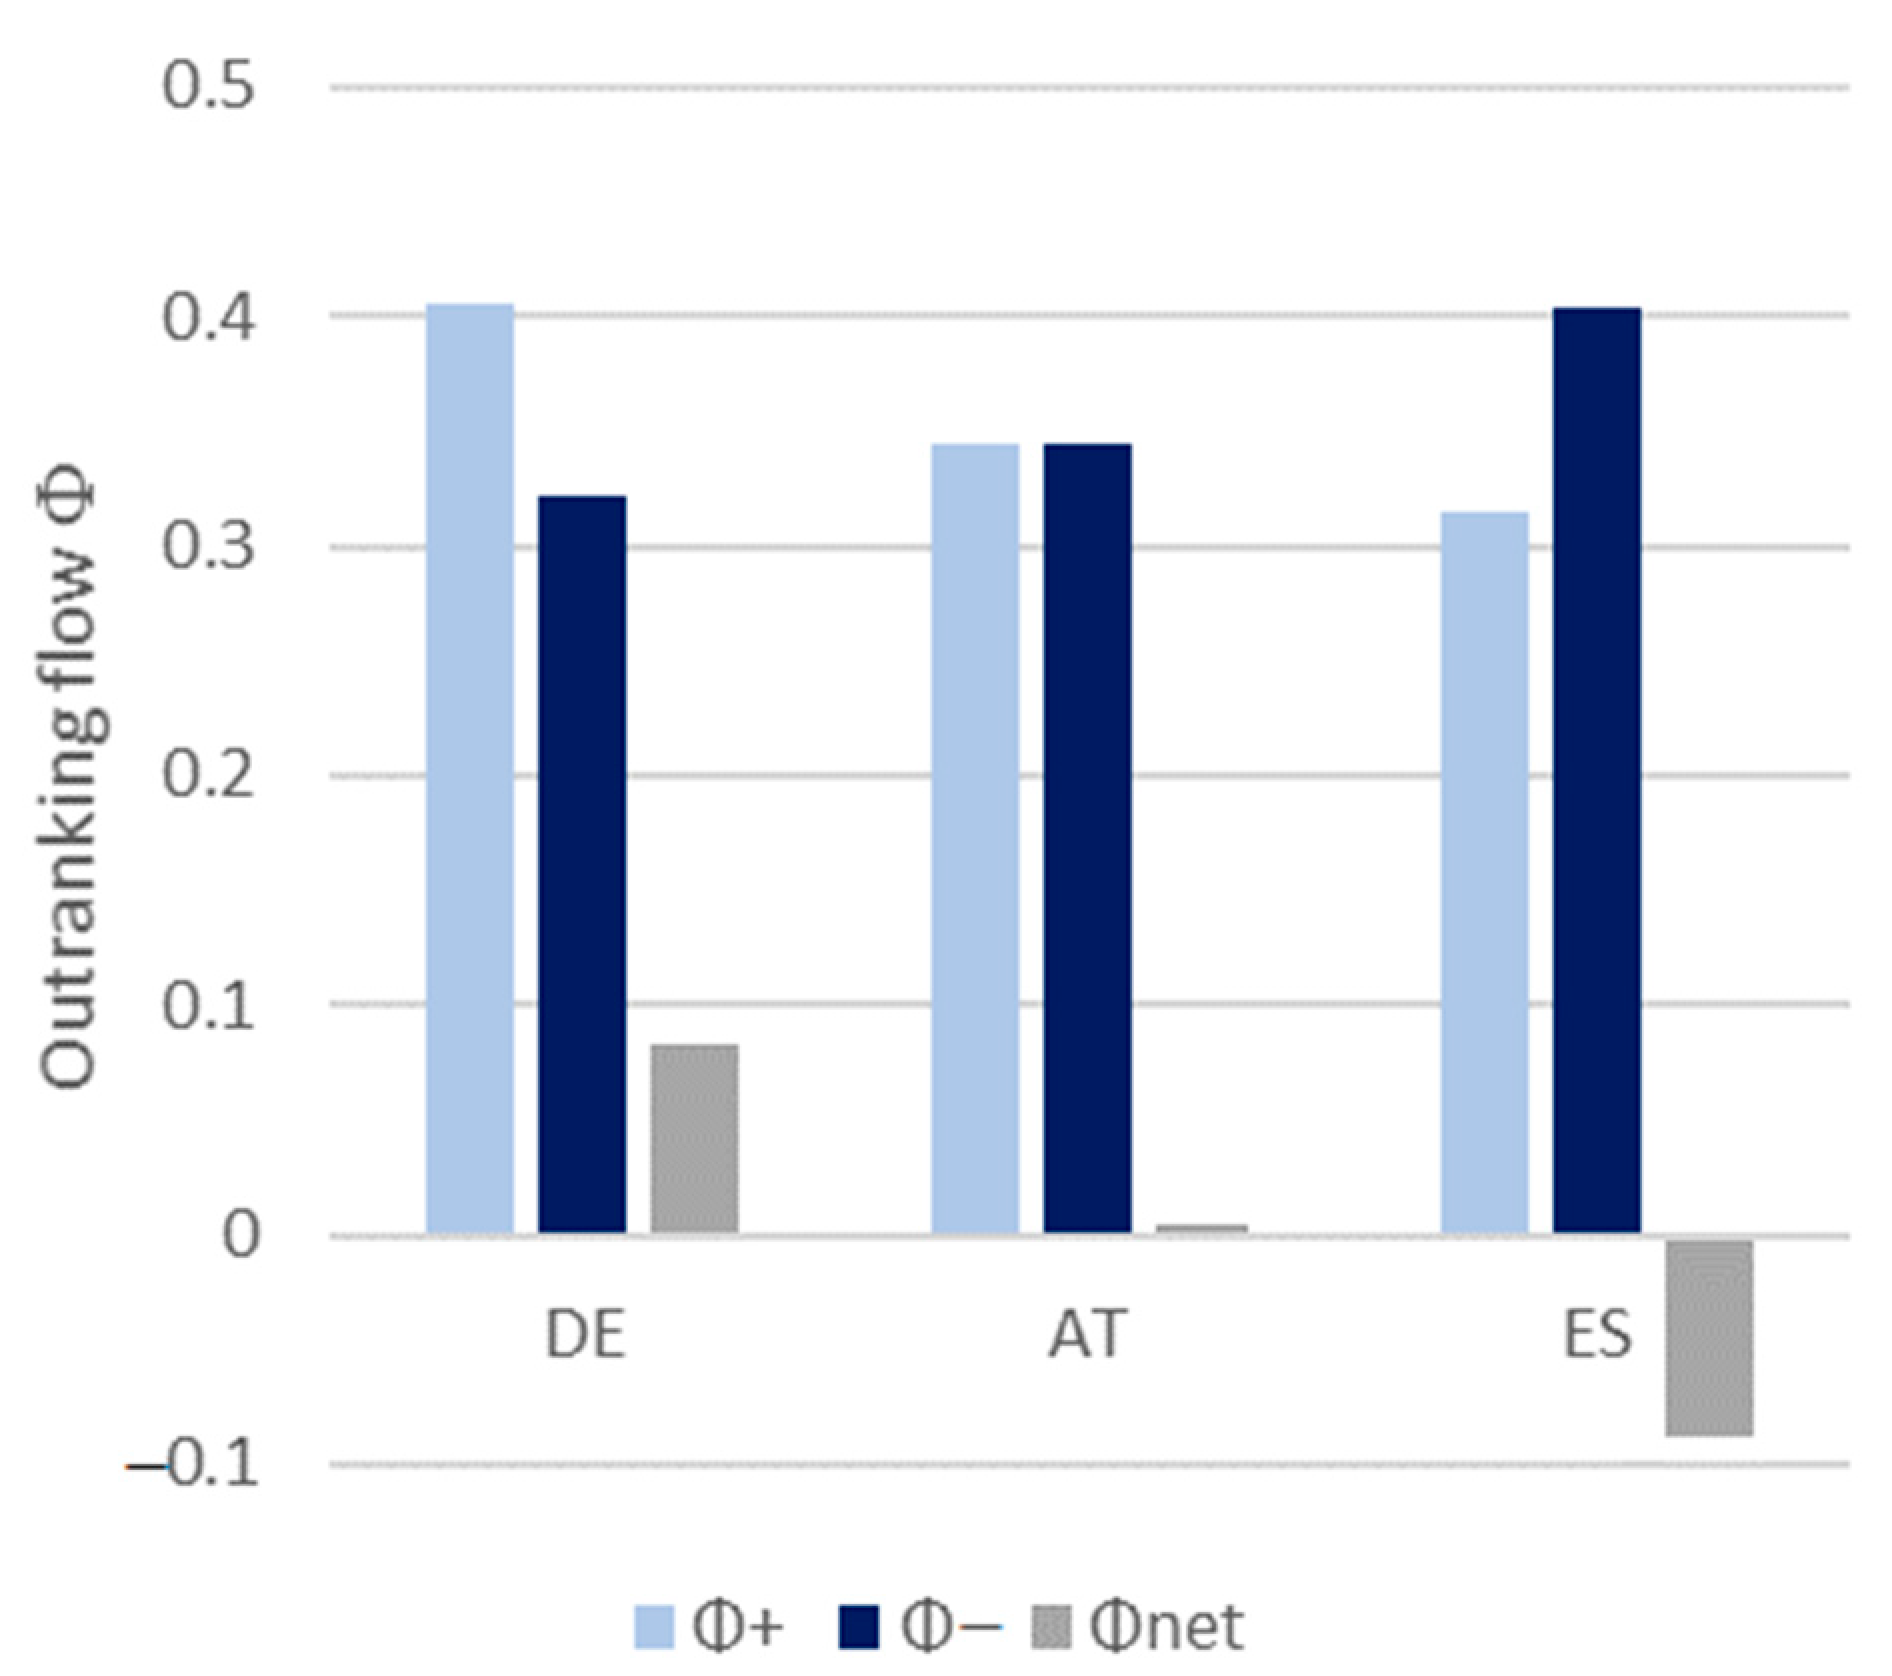
These absolute thresholds are used to calculate the PROMETHEE I and II results for the selection of location for industrial hydrogen production in Europe. In
Figure 3, the corresponding outranking flows are shown in a bar chart.
The two outranking flows of PROMETHEE I (Φ+ and Φ−) as well as the outranking flow of PROMETHEE II (Φnet) show the same tendency in their results. Hydrogen production in Germany is more sustainable than in Austria or Spain and production in Spain is in the selection of these countries always the least sustainable option. Thus, no incomparabilities occur and PROMETHEE I and II come to the same conclusions.
4.2. PROMETHEE Results with Specified Thresholds Based on Uncertainty in Life Cycle Impact Assessment
In the second analysis, the thresholds do not address uncertainty in general but are specified to the LCIA. As presented in
Section 2.3 specified absolute thresholds (q′
Spec and p′
Spec) for each indicator are derived based on the different uncertainties of their characterization models and reference values. These specified thresholds are compared with default thresholds (Q′
Def = 5% and P′
Def = 10% again as a practical approximation). In
Table 8, relative thresholds (Q′ and P′) are converted to absolute numbers (q′ and p′) based on the hydrogen production case study. It has to be stressed that even though here the same default values are taken as in
Table 7 they only represent uncertainty due to the impact assessment. The LCC is not listed here because, as described above, it does not use an impact characterization model in the life cycle thinking sense. The LCC indicators are included in the PROMETHEE analysis without thresholds. Similar to
Table 7, italic writing of an indicator indicates indifference based on the specified thresholds for two options. Moreover, bold writing indicates indifference for all three options. For deviations between the different hydrogen production options refer to
Table 7.
As done for the common default thresholds addressing uncertainty in general, it is discussed whether the new specified thresholds lead to indifference between two options or even whether an indicator cannot be used at all to find a more sustainable option.
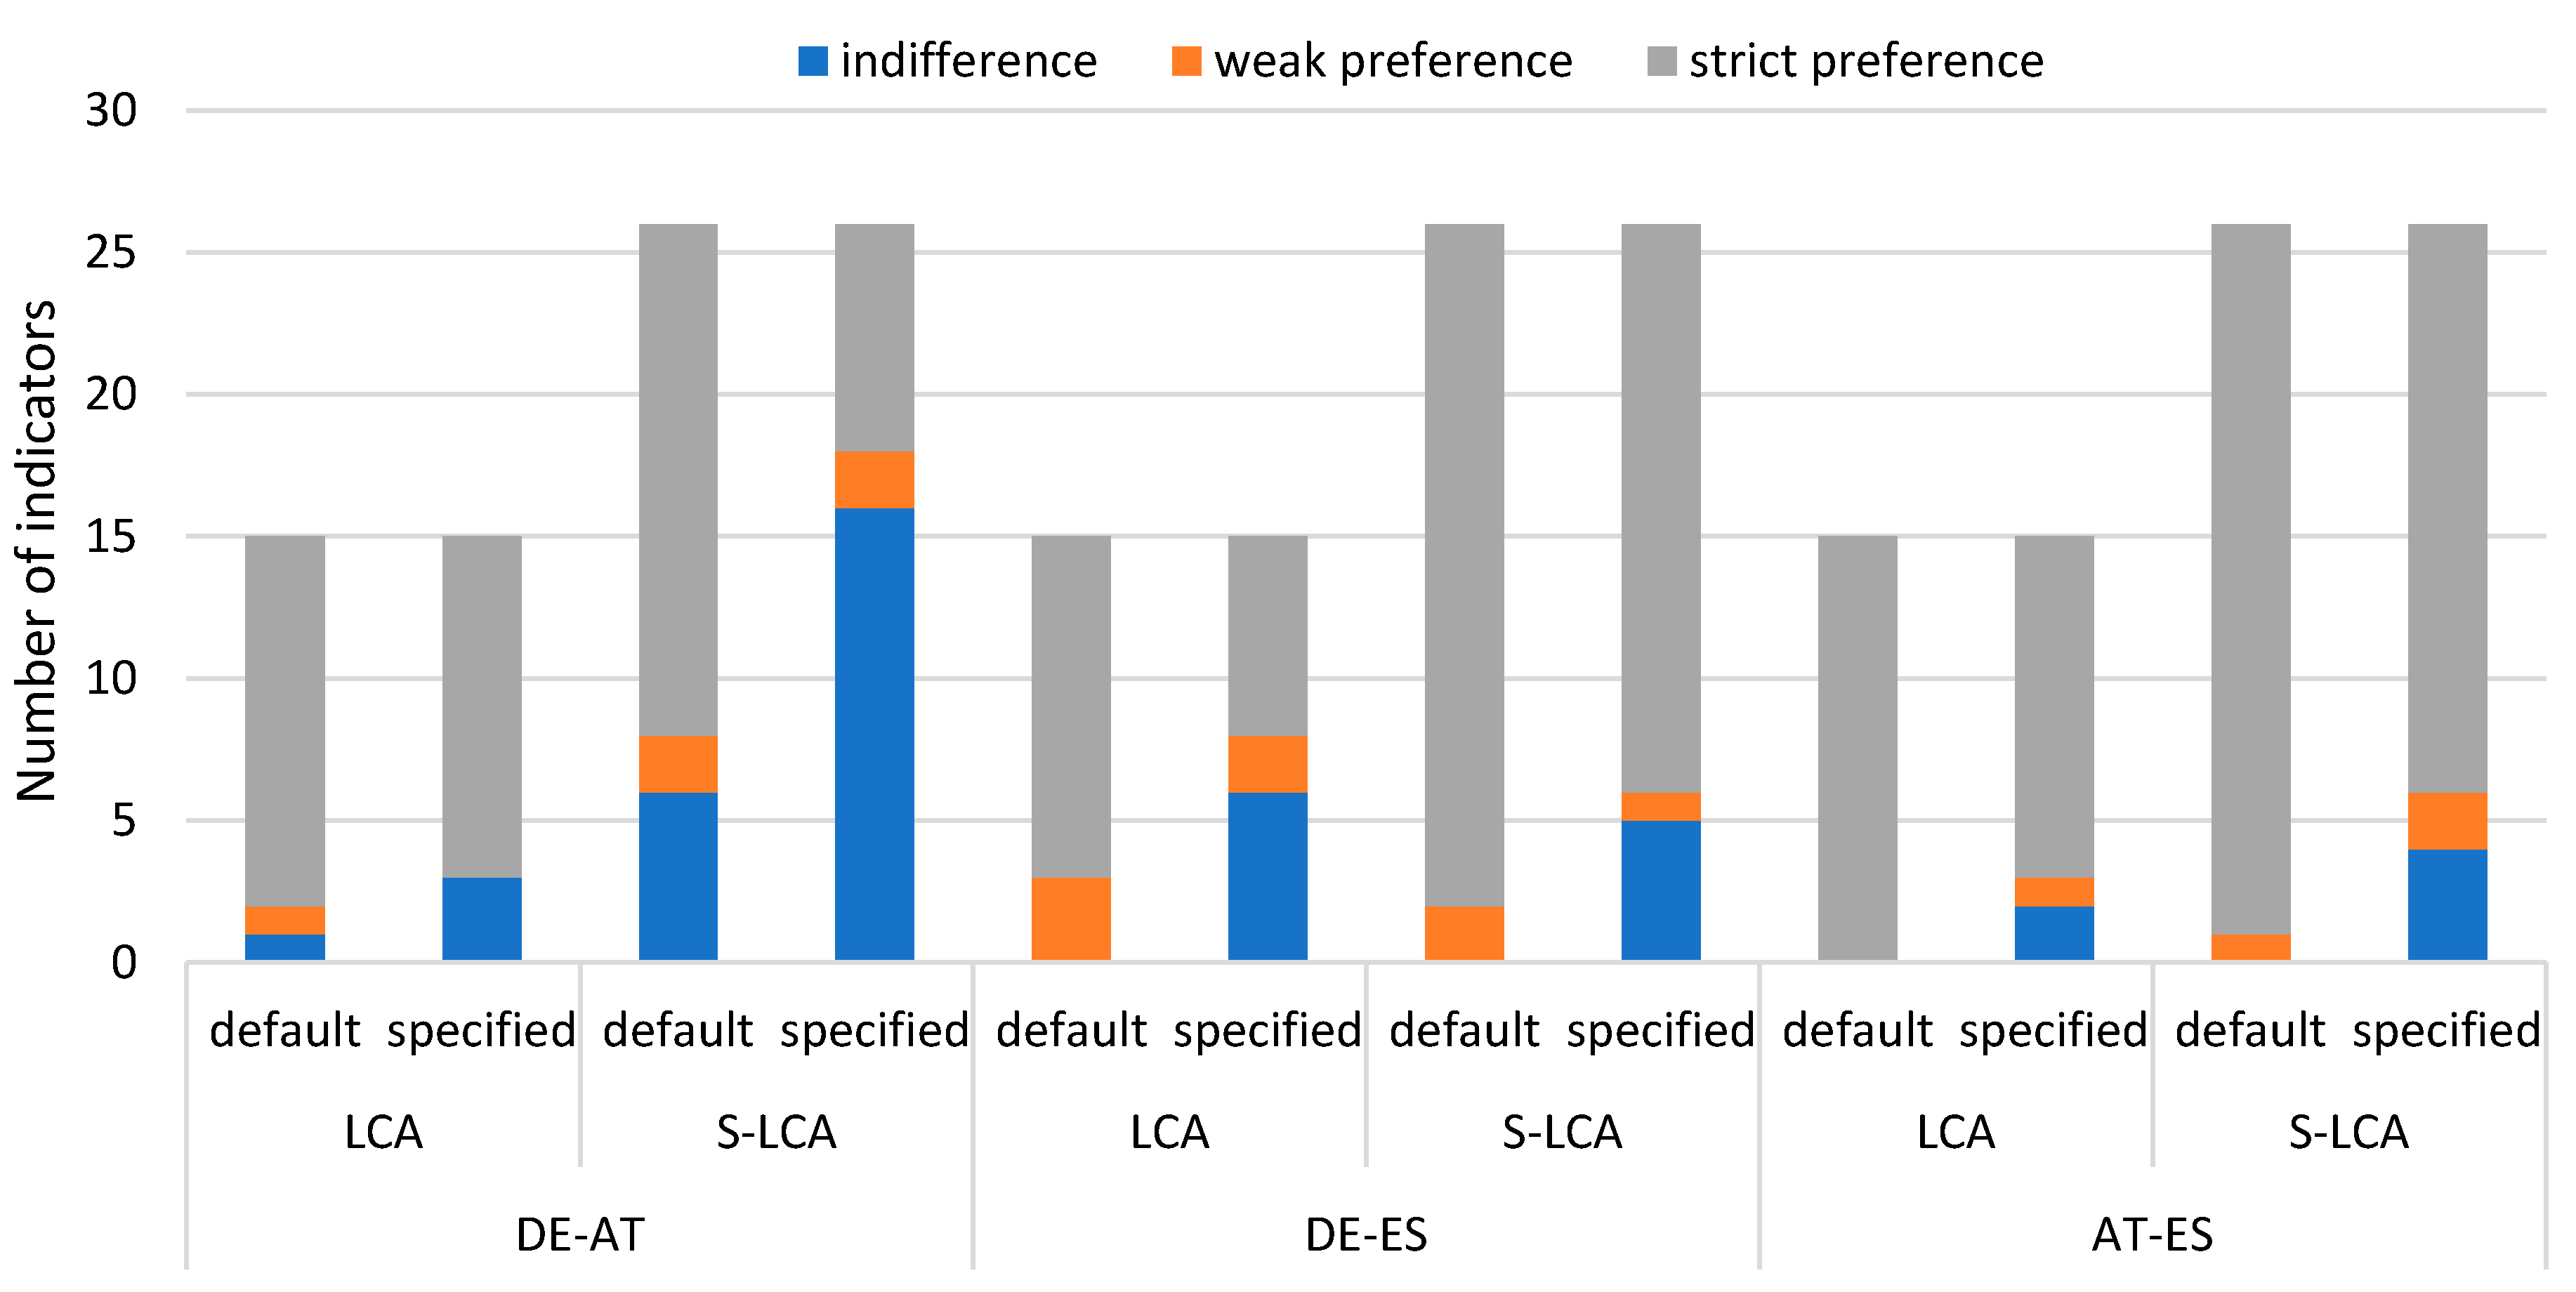
Compared to using default thresholds for impact assessment, in the LCA, more indicators show indifference between at least two options. The numbers are compared between the two threshold options (default and specified) based on impact assessment uncertainty in
Figure 4. In particular, the specified comparison between hydrogen production in Germany and Spain must do without six indicators due to indifference and two more indicators fall into the category weak preference. In total, these are more than half of all proposed environmental indicators. The indicators in question come from very diverse backgrounds. For example, ‘Cumulative energy demand’ has the best uncertainty classification (uncertainty class 1, cf.
Table 3), but the result for hydrogen production in Germany is only 4% higher than for hydrogen production in Spain (cf.
Table 6). In contrast, the result for ‘Ecosystem toxicity, freshwater’ in Germany is roughly 50% higher (cf.
Table 6) than for that in Spain, but this indicator is classified as 3 (cf.
Table 3) and thus even a difference of more than 50% does not lead to a clear preference. Within the LCA, ‘Ecosystem toxicity, freshwater’ is the only indicator which shows indifference for all discussed hydrogen production locations. The similarity of the LCA results might be explained by similar structures of electricity generation in Spain and Germany (cf. [
17]). In both countries, the electricity mix of the investigated year depends on a mix of fossil and nuclear power plants as well as some renewable energy sources, whereas in Austria, a high share of electricity is generated by hydropower.
For S-LCA, the number of indicators showing specified indifference between at least two discussed options rises significantly, too. However, here, the proximity of indicator results is the highest for Germany and Austria. The number of indicators with indifference rises from six for the default thresholds to 16 for the specified thresholds. Including the number of indicators with weak preference, only eight indicators are left with strict preference (
Figure 4) out of the 26 initial S-LCA indicators. The proximity of the S-LCA results for hydrogen in Germany and Austria might be explained by the similarity of the social systems, the regulations and the international supply chains. For the other two pairwise comparisons there are fewer effects, i.e., Germany–Spain and Austria–Spain comparisons still have 20 S-LCA indicators to lean on. In S-LCA, some indicators do not allow to prefer one option to the other two options at all. In total, four indicators—indicated with bold writing in
Table 8—fall into this category. The indicators ‘Violations of employment laws and regulations’ and ‘Goods produced by forced labour’ suffer from high uncertainty, whereas for the other two indicators the options actually have very close absolute results.
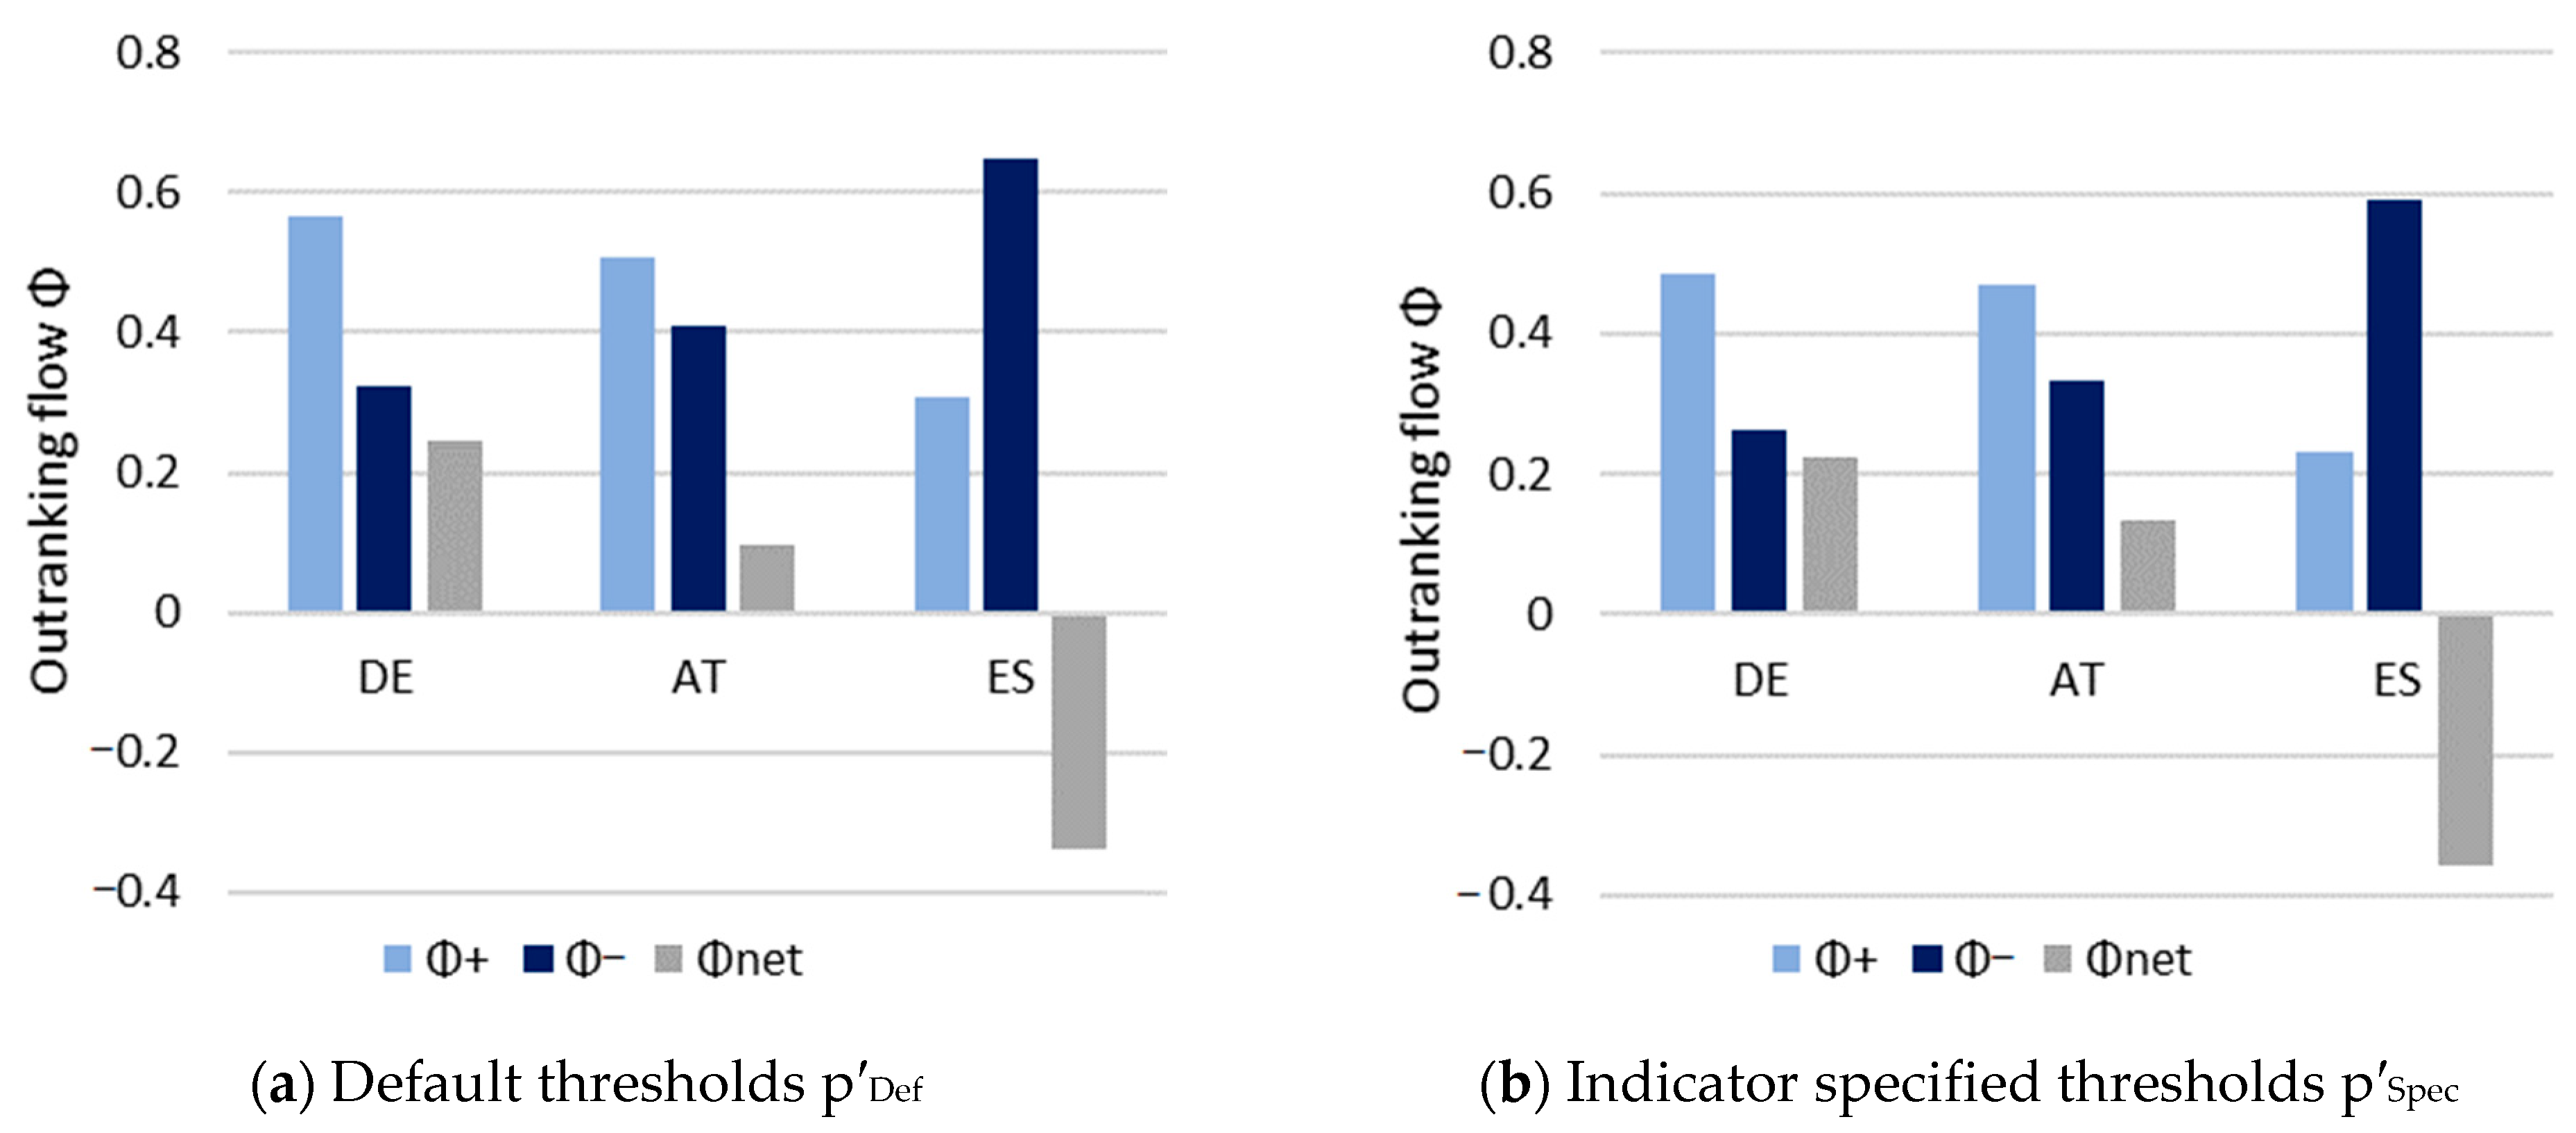
In
Figure 5, the PROMETHEE results of the case study are depicted for the default threshold (a) and the specified threshold (b) cases based on uncertainty of the impact assessment. In both versions, Germany is the best location for hydrogen production according to PROMETHEE I (Φ
+ and Φ
−) and II (Φ
net). The ranking is not affected by the stricter thresholds. However, the results for the German and Austrian outranking flows are moving closer together, indicating a closer proximity of the hydrogen production in Germany and Austria compared to hydrogen production in Spain.
5. Conclusions
Former assessments on electricity-intensive industrial hydrogen production by AEL in Spain, Germany and Austria showed different preferences with regard to the LCA, LCC and S-LCA, which advised the application of the MCDA. At the same time, the three western European countries are quite similar, making the use of an outranking method reasonable. Therefore, this case study was chosen to test the implementation of thresholds in PROMETHEE. When using PROMETHEE as an MCDA method, the implementation of thresholds has proven to be an easy and effective way for integrating uncertainty aspects. However, identifying and quantifying uncertainty is still challenging. Often, common default thresholds are used, which subsume different aspects of uncertainty. In this article, a new approach to integrate uncertainty of LCIA into LCSA studies was presented because uncertainty of LCIA is, in contrast to input data, seldom addressed in LCSA.
Within LCA, several publications already dealt with the topic of quantifying uncertainties on an impact level and have been used here for defining thresholds. For S-LCA, less information is available, and in this paper, the quantification of uncertainty is based on expert knowledge. As for the LCC, no impact assessment is used and no uncertainty for LCIA is considered. Based on this framework, we were able to identify and quantify specified thresholds to be used within PROMETHEE besides commonly used default thresholds.
The goal of the analyses was the comparison of both approaches. In a first analysis, common default thresholds were applied, which address uncertainty in general. In a second analysis, the default and specified thresholds were applied, which exclusively addressed the uncertainty of LCIA. In all analyses, a clear preference of hydrogen production in Germany compared to Austria and Spain can be found.
The common default thresholds for general uncertainties indicated that based on the economic indicators, a prioritization of Austria or Spain can rely only on one indicator. For three out of four economic indicators, indifference between those two countries was observed. The fourth indicator shows only weak preferences. Regarding these indicators, a more detailed analysis is advised.
The second analysis with thresholds for LCIA highlighted the indifference of several S-LCA indicators for the comparison between Germany and Austria when utilizing specified thresholds. A clear preference can be determined between Germany and Austria for only 8 out of the 26 S-LCA indicators. The default thresholds for social LCIA show a comparable amount to the general results. Since by using the PSILCA database only a hotspot analysis can be performed, a more detailed analysis is needed for indicators of high interest when comparing hydrogen production in Germany and Austria. For LCA, the specified thresholds also show a decrease in indicators with clear preferences, however to a smaller degree. Especially the environmental comparison between Germany and Spain becomes less diverse, relying on seven instead of twelve indicators.
Even though both assessments came to the same result in the end, the whole process brought deeper knowledge about the results of the case study and it was proven that the obtained ranking of the three countries for industrial hydrogen production is robust, given system boundaries and inventory. Incorporating uncertainties in the LCIA methodology, however, reduces indicators showing clear preferences between all three countries down to 16 out of the 41 initial indicators. This confirms the underlying assumption of similar countries to be compared.
Still, the detailed examination of thresholds, uncertainty of LCIA and PROMETHEE helped to identify crucial points of the whole MCDA process and has shown where more detailed analyses are needed to pursue LCSA of industrial hydrogen production further.
However, relying only on the uncertainty of the LCIA is often not sufficient. Thus, an additional assessment of uncertainty and variability regarding the input data, for example, with a Monte Carlo analysis, could be helpful. Regarding the identification of uncertainty of LCIA by defining specified thresholds, more research is needed. In particular, with the identified thresholds for social LCIA we stimulate the discussion. Next, information on data quality regarding LCIA in PSILCA should be integrated.
For the validation of the new LCIA based approach, testing it on other case studies and transferring these thresholds to other MCDA methods, e.g., TOPSIS, is needed. We are confident that the approach can be transferred to other MCDA studies. Overall, this proposed approach will help to gain knowledge about the whole decision problem as well as to find robust results.


