
Environmental and Energy Implications of Meat Consumption Pathways in Sub-Saharan Africa


1
Fondazione Eni Enrico Mattei (FEEM), Corso Magenta 63, 20123 Milan, Italy
2
Faculty of Econmics and Management, Free University of Bozen-Bolzano, Piazza Università 1, 39100 Bozen-Bolzano, Italy
3
Department of Energy-Politecnico di Milano, Via Lambruschini 4, 20156 Milan, Italy
*
Author to whom correspondence should be addressed.
Sustainability 2021, 13(13), 7075; https://0-doi-org.brum.beds.ac.uk/10.3390/su13137075
Submission received: 13 May 2021
/
Revised: 16 June 2021
/
Accepted: 16 June 2021
/
Published: 23 June 2021
(This article belongs to the Collection Feature Papers in Sustainable Use of the Environment and Resources)
Abstract
:In sub-Saharan Africa (SSA), diets are largely based on cereal or root staple crops. Together with socio-cultural change, economic and demographic growth could boost the demand for meat, with significant environmental repercussions. We model meat consumption pathways to 2050 for SSA based on several scenarios calibrated on historical demand drivers. To assess the consequent environmental impact, we adopt an environmentally-extended input-output (EEIO) framework and apply it on the EXIOBASE 3.3 hybrid tables. We find that, depending on the interplay of resources efficiency and demand growth, by 2050 the growth in meat consumption in SSA could cause a growth in greenhouse gases emissions of 1.4 [0.9–1.9] Gt CO2e/yr (~175% of current regional agriculture-related emissions), which is an extension of cropping and grazing-related land of 15 [12.5–21] · 106 km2 (one quarter of today’s global agricultural land), the consumption of an additional 36 [29–47] Gm3/yr of blue water (nearly doubling the current regional agricultural consumption), an eutrophication potential growth of 7.6 [4.9–9.5] t PO4e/yr, and the consumption of additional 0.9 [0.5–1.4] EJ/yr of fossil fuels and 49 [32–73] TWh/yr of electricity. These results suggest that—in the absence of significant improvements in the regional sectoral resource efficiency—meat demand growth in SSA is bound to become a major global sustainability challenge. In addition, we show that a partial substitution of the protein intake from the expected growth in meat consumption with plant-based alternatives carries additional significant potential for mitigating environmental impacts. The policies affecting both farming practices and dietary choices will thus have a significant impact on the SSA and global environmental flows.
1. Introduction
Food, diets, and nutrition—together with a steeply growing human population—are determining the escalation of several grand environmental challenges [1,2,3]. In response to these growing issues, numerous global assessments of the future of food systems and the sectoral environmental footprint have been carried out [4,5], including initiatives such as the EAT-Lancet Commission [2]. Among all agri-food segments, the meat and dairy industry have the highest resource and energy intensities [6,7]. The livestock supply chain occupies 83% of total farmland and results in 60% of global greenhouse gases (GHGs) emissions from the agricultural sector [6]—i.e., 14.5% of the total GHGs emissions [8].
The agri-food sector is also responsible for other major environmental impacts [9,10,11], including land use change and degradation [12], biodiversity loss [13], and water consumption and contamination [14]. In addition, farming and grazing-related activities require a significant input of energy throughout their supply-chains [15]. The projected increase in the global food demand [16] coupled with a growing share of animal-based products [17] might put the global ecosystem equilibrium under pressure, and its related impact must be carefully accounted. Indeed, it poses a significant challenge to the achievement of several sustainable development goals (and primarily SDGs 2, 3, 6, 7, 13, 14, and 15).
While trends have been heterogeneous across regions, in most countries, meat consumption has grown steadily together with economic development (see Supplementary Materials for an account of historical trends in a global perspective). During the 20th century, the global demand for all meat types has in fact grown from 28.5 kg/capita/year in 1961 to 51 kg/capita/year in 2013, the latest year available in FAOSTAT statistics [18].
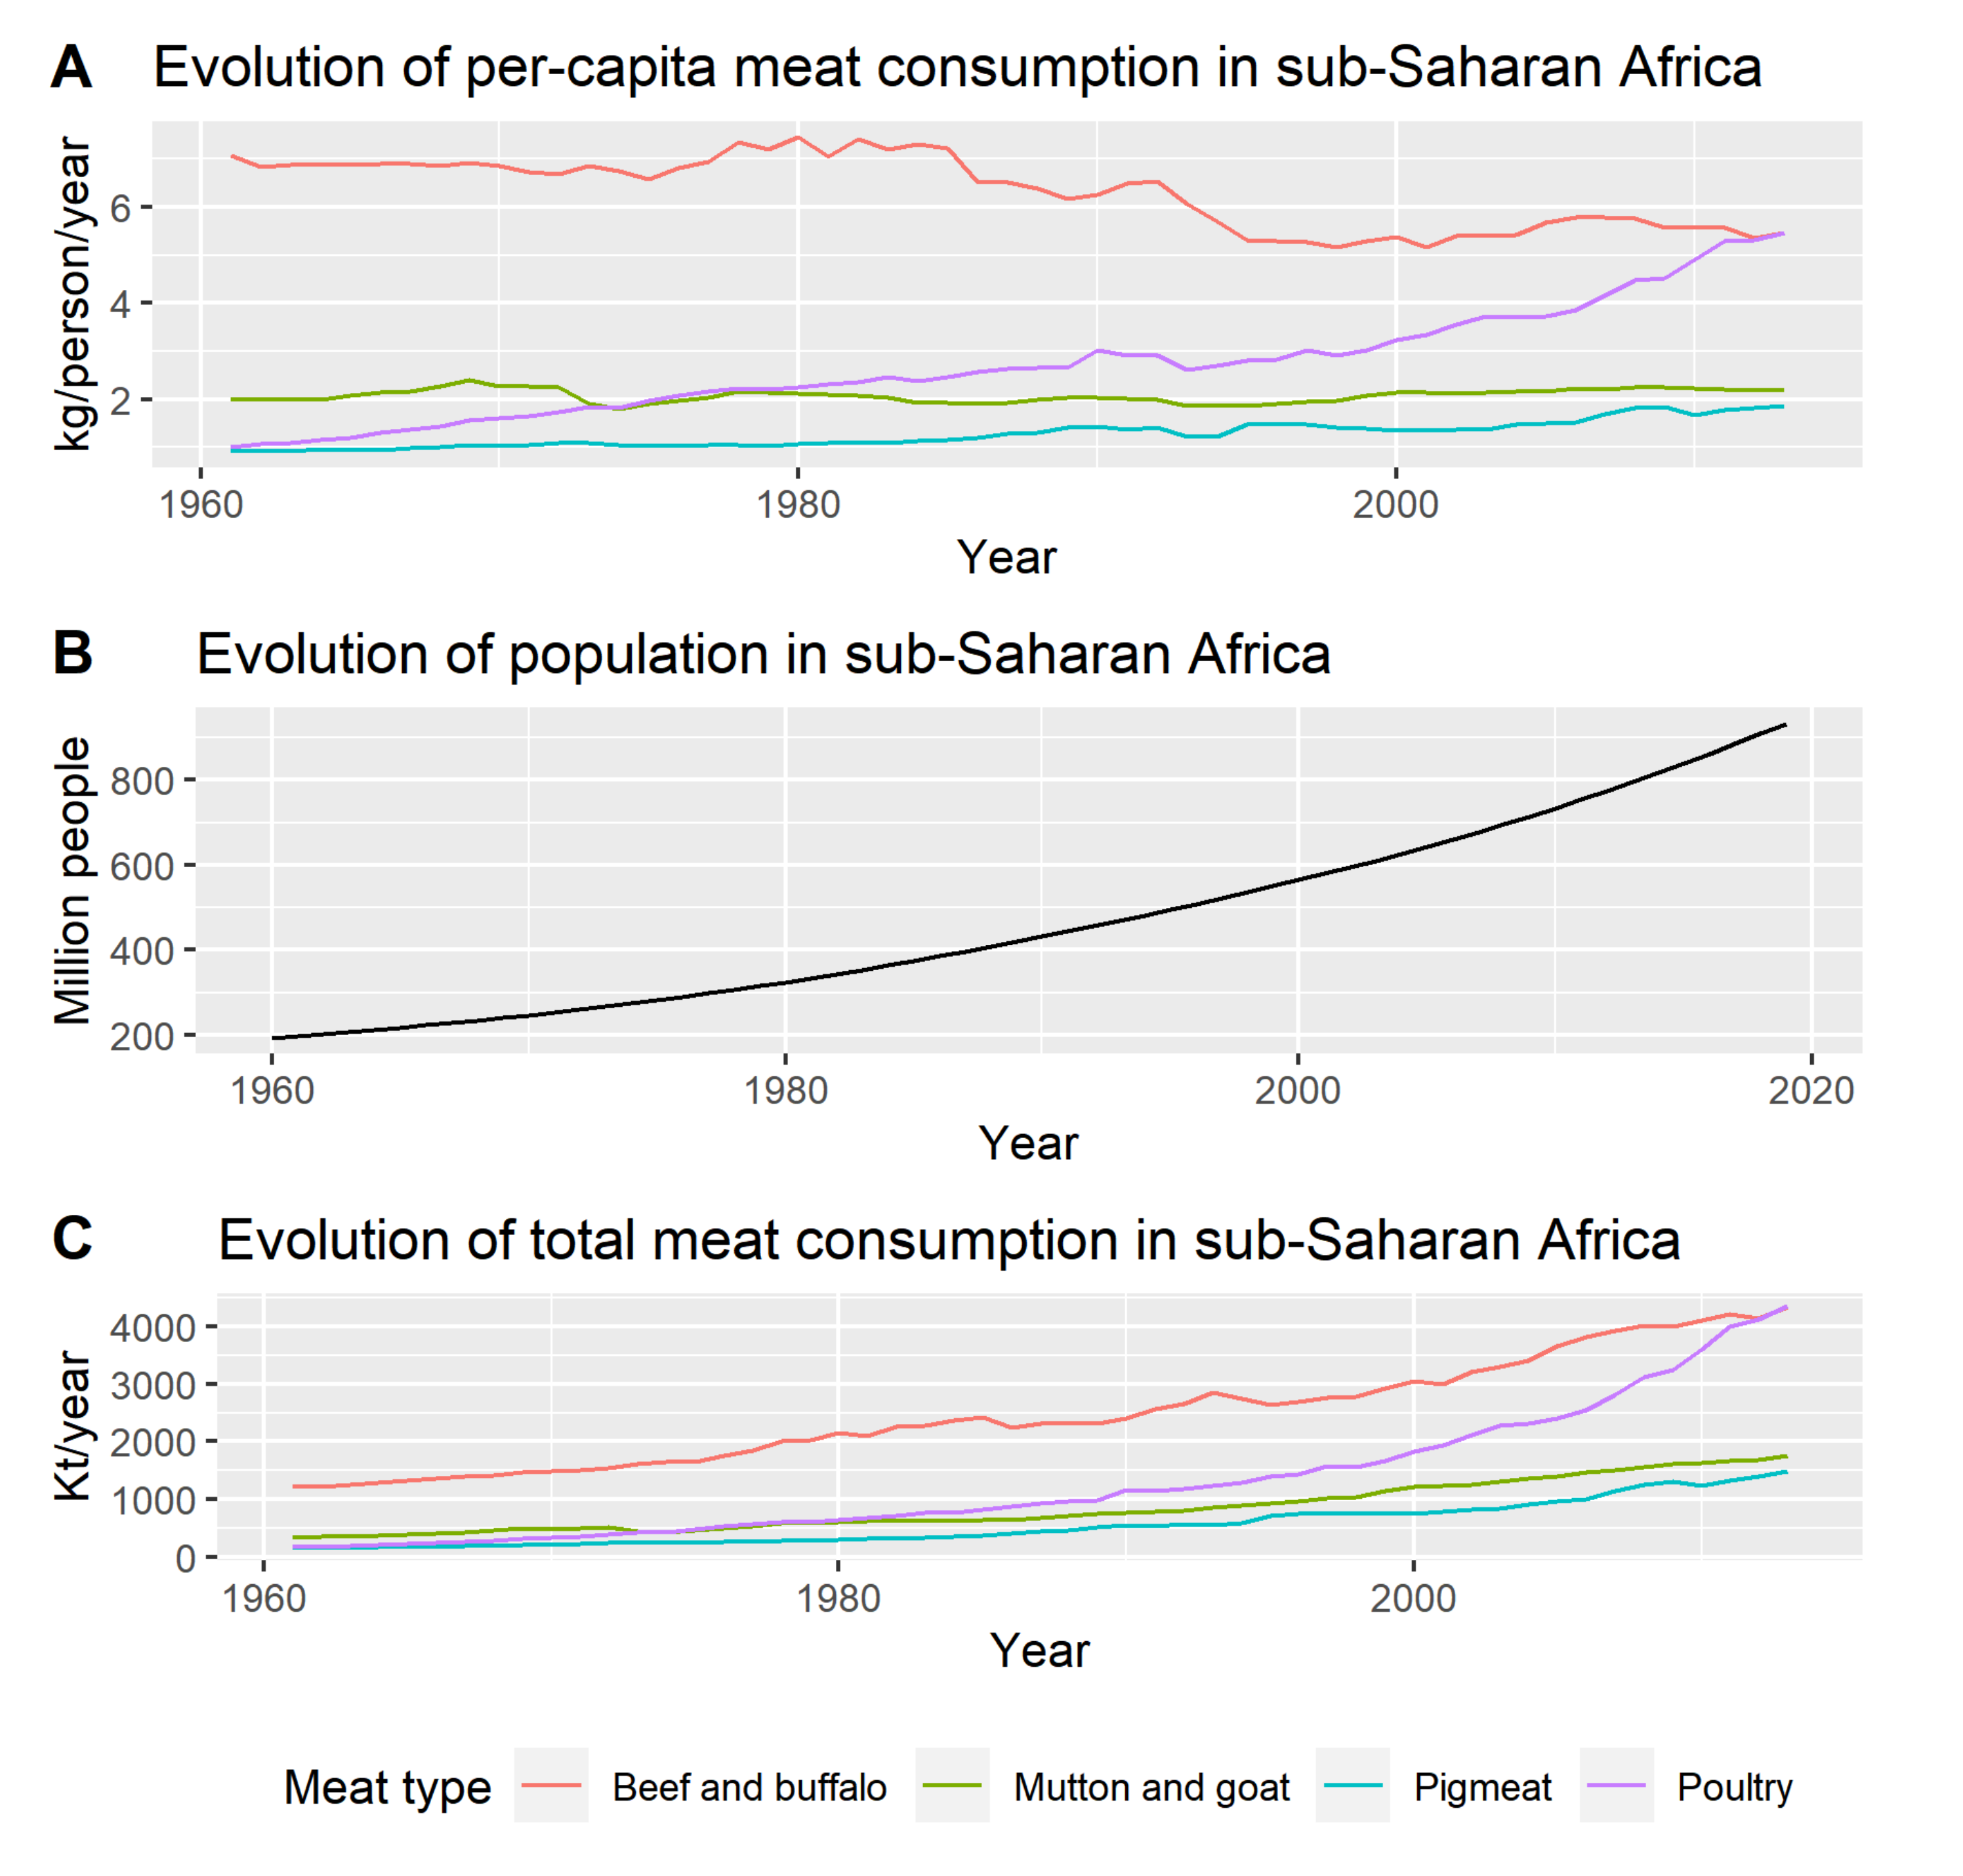
Yet, when restricting the analysis for sub-Saharan Africa (excluding the Republic of South Africa, from now on SSA throughout the paper), it can be observed (Figure 1) that the consumption of all meat types in the region stood at an average of 11.5 kg/capita in 2013 [18] with little change from the 9.5 kg/capita in 1960. A stronger growth rate has characterized the region in the first decade of the 21st century, mostly driven by demand for poultry. The first key open question is thus what consumption levels can be expected to be reached during the 21st century in the region, both in per-capita and in total terms.
Moreover, irrespective of current low meat consumption levels, SSA is the first region in the world by grazeland and cropland areas [19], with 24 and 16% of the global total, respectively. This is both the result of large and growing populations, of major agricultural exports, and of low efficiency of mostly extensive farming and grazing activities. On top of current agricultural land, it is estimated that in the region there are still 2 million squared km of arable land [20], about half of the world’s total. A growing meat demand is likely to strongly exacerbate pressure on the environment both on the intensive (input of resources) and on the extensive (land use) margins, with both local and global repercussions. A second major open question thus relates to the significance of these potential impacts.
In this context, this paper develops a modelling framework to investigate the expected magnitude of the growth in the demand for different meat types in SSA by 2050. This allows us to calibrate a multi-regional environmentally-extended input-output (EEIO) framework and quantify both the derived impacts on the regional environment and energy system, and the implications for global environmental change. Our analysis is supplemented by an assessment of different scenarios over the adoption of several meat substitutes and the relative change in the total environmental impact. We conclude discussing the role of policy and technology in defining both demand and supply-related environmental impacts.
Literature Gap
Previous studies have evaluated the relationship between the demand for meat and socio-economic and cultural factors at both a global scale [21,22,23,24] and in developing countries [25,26]. Most commonly, researchers have estimated long-run income elasticities of demand for meat [27,28,29], the coefficients linking income growth with the demand response, and shown that, historically, economic development has been largely associated with an increased demand for meat, albeit with meat-type and regional heterogeneity.
Among others, Clonan et al. [21] explored how consumption of red and processed meat (RPM) differs with age, gender, socioeconomic status, and in different global contexts. They show that in low- and middle-income countries RPM consumption is rising, especially in urban areas. Eker et al. [22] modelled the drivers of a widespread shift to sustainable diets. Their analysis links a behavioral diet shift model to an integrated assessment model to identify the main drivers of global diet change and its implications for the food system. The study reveals very large interactions between behavioral and socio-economic factors in determining meat demand outcomes. Revell [23] discussed problems associated with many published meat demand elasticities of different factors (income, prices, etc.) suitable for incorporation into a market model. Their rigorous review and modelling analysis revealed that economic and population growth to 2050 without any mitigation measures will lead to a 21% increase in per capita meat consumption and a 63% increase in total consumption by 2050.
Based on these studies, research has thus concluded that the current and projected sustained economic and demographic growth in SSA is therefore likely to significantly boost the demand for meat [30,31].
Irrespective of this literature background, few systematic meat demand projection studies for SSA have been carried out, besides the global assessment inclusive of Africa by [32] and the analysis on seven SSA countries of [33]. A rigorous, meat-focused analysis of the future of meat in SSA based on an explicit modelling of future demand under different scenarios encompassing economic, demographic, and socio-cultural dimensions is thus missing in the existing literature. Moreover, an analysis of the potential local and global environmental impacts from such growing appetite for meat in SSA cannot be found in the existing literature. This is irrespective of the multi-regional environmentally-extended input-output analysis (MRIO EEIO) having been used extensively in large-scales life cycle assessments (LCA) of the environmental footprint of food, diets, and nutrition (e.g., see [4,34,35,36,37]). Other relevant aspects that we could not find in published studies include an evaluation of the potential role of meat substitutes. Such comprehensive picture (future demand; environmental impact; substitutes adoption) is however crucial for understanding the role that transformations in SSA could affect global environmental flows.
2. Materials and Methods
2.1. Scope of the Analysis
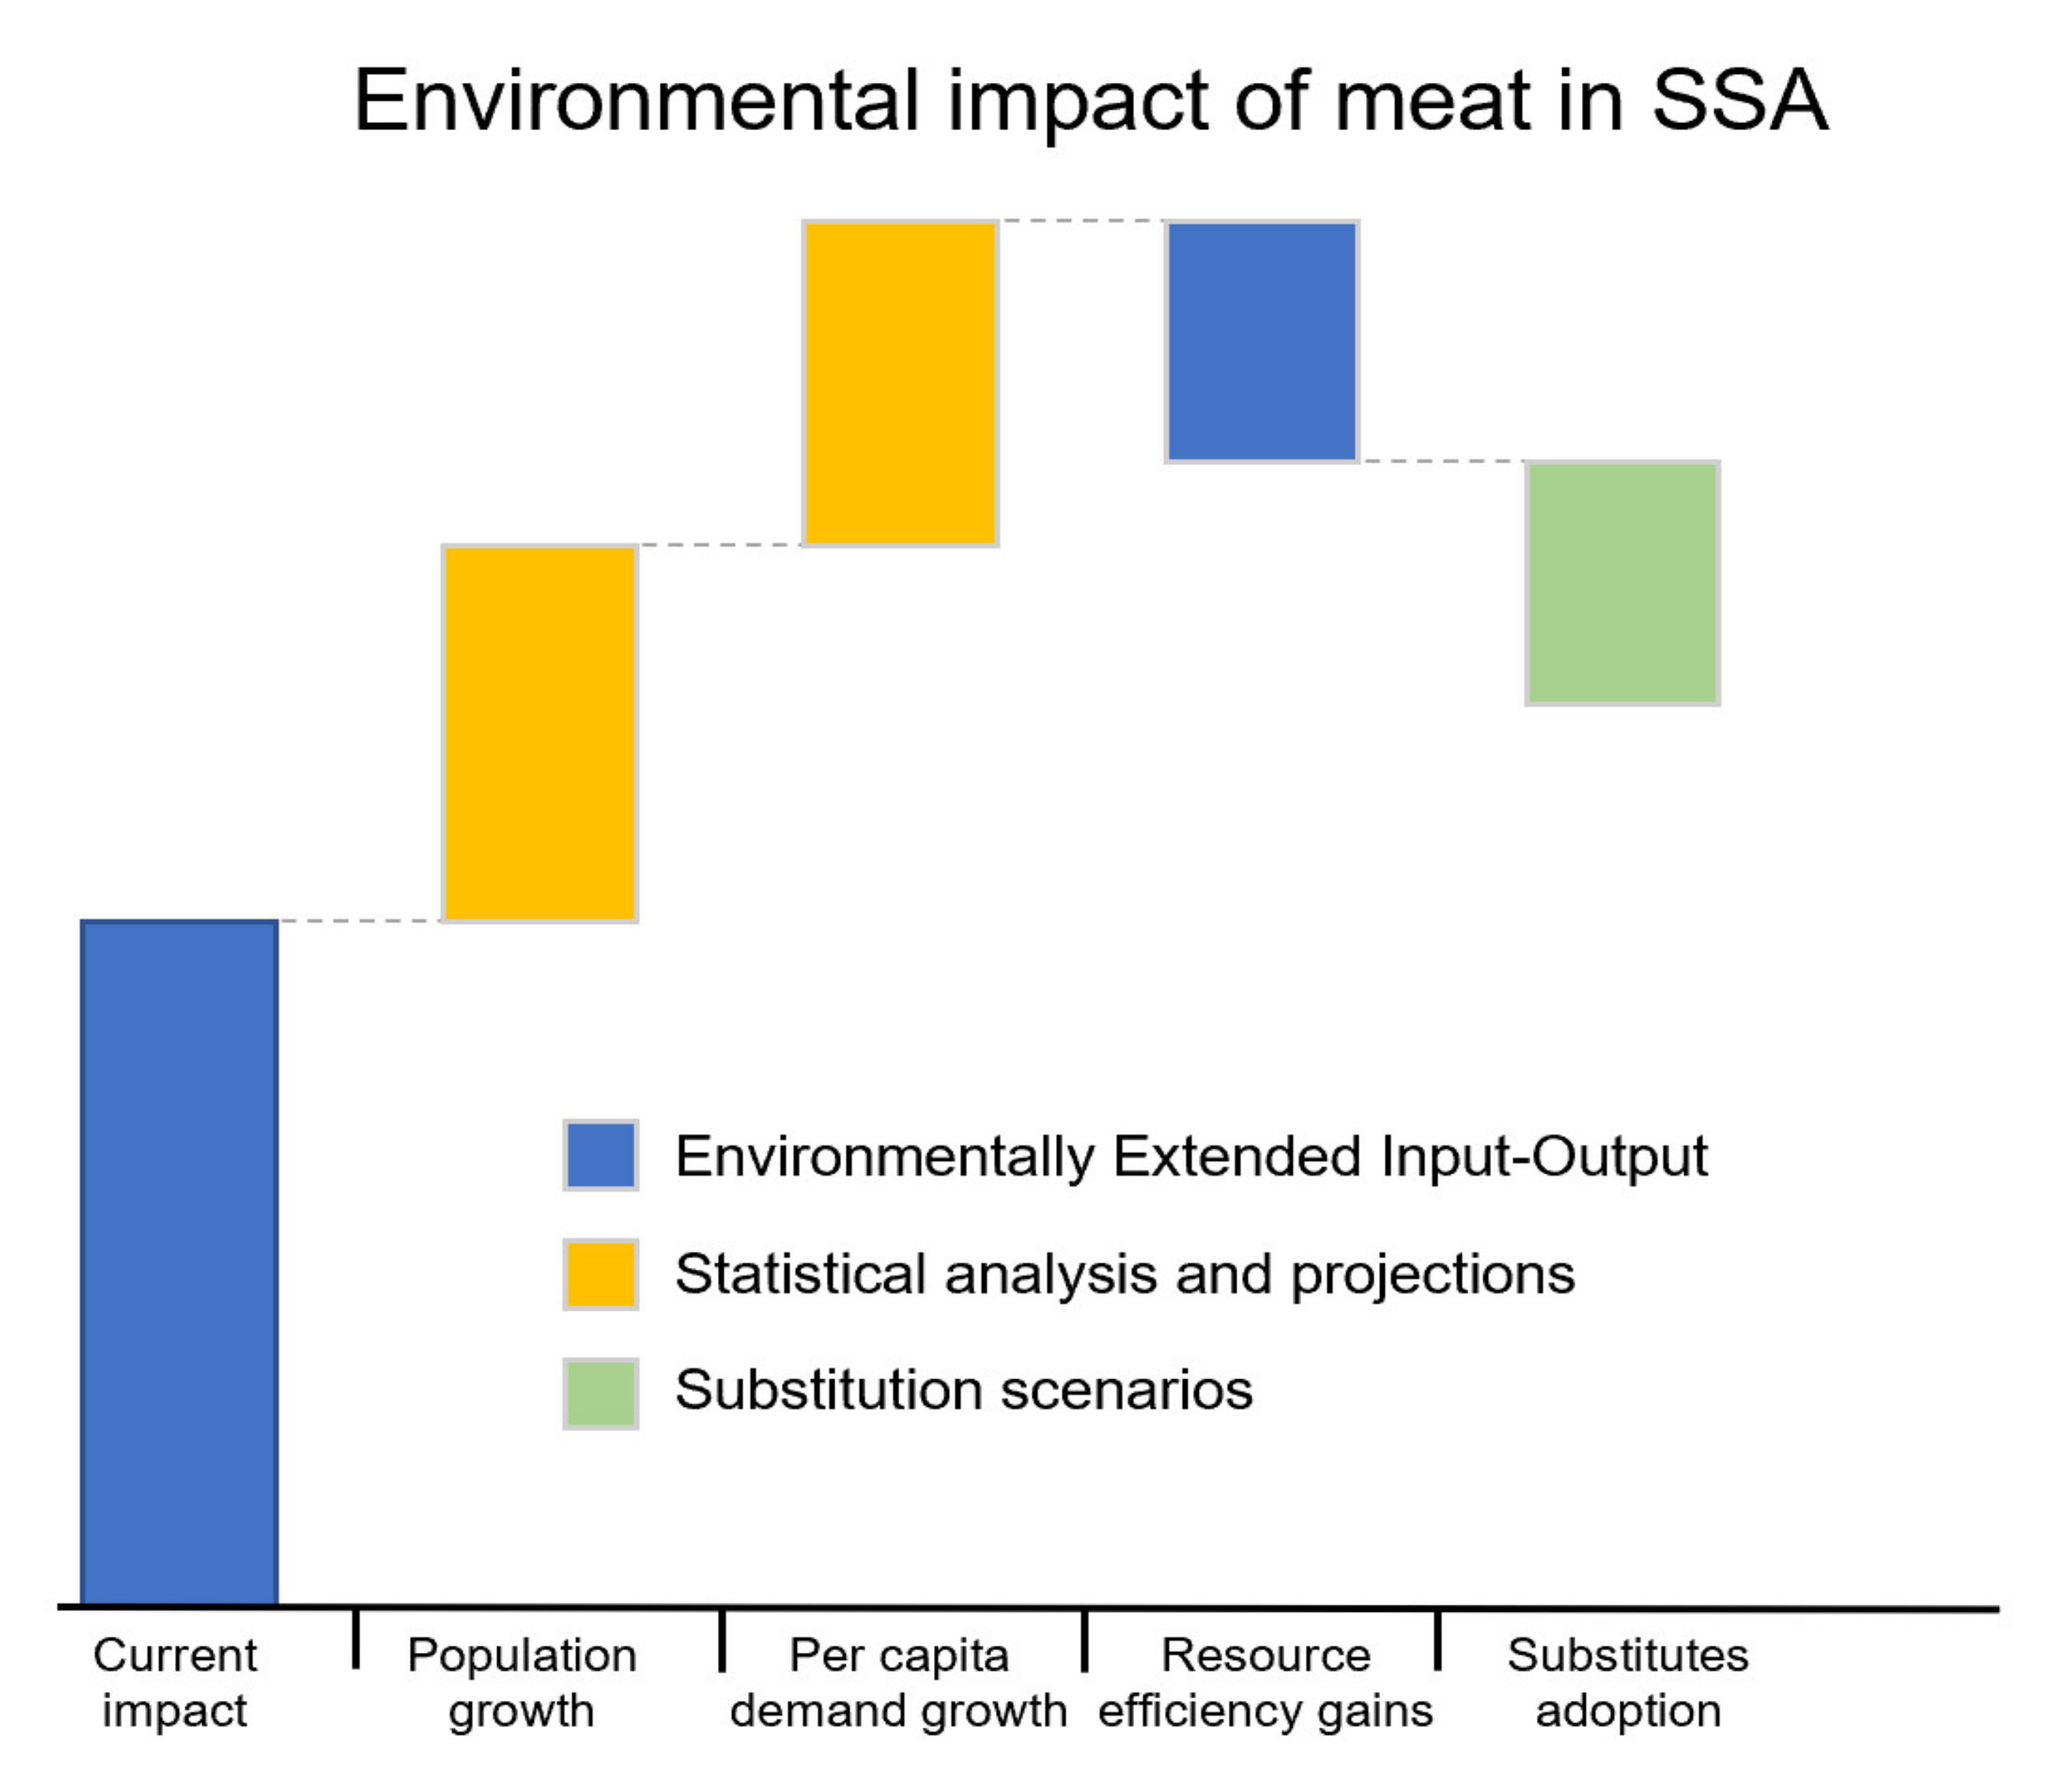
The aim of this paper is to evaluate pathways of meat consumption in SSA to 2050 to appraise the potential environmental implications in the region and globally. Being a long-term scenario analysis, the purpose of the study is to provide the reader with a range of results that could materialize depending on the interaction of demographic, economic, technological, and cultural factors change in the next three decades. The scenarios shed light on the role of these different factors in determining the meat demand and the relevant environmental pressure. The analysis consists of multiple steps (as schematically represented in the cascade diagram of Figure 2) which altogether—starting from today’s environmental impacts of meat consumption in SSA—aim to estimate the future impacts for an array of scenarios to 2050.
The demand modelling analysis evaluates how socio-economic and cultural factors can be crucial determinants of the meat demand pathway followed by SSA. This is an important step forward in understanding the role of different demand drivers and their interactions in the context of SSA. Then, the EEIO analysis exploits a table of technical coefficients and environmental extensions with schematic assumptions over the future changes in productive efficiency to evaluate the ranges of potential environmental impact from the increased meat consumption.
The main purpose of the paper is therefore to support the framing of policies targeting food security and sustainable environmental resources management. It must be remarked that the demand modelling and EEIO analysis carried out are however not meant to deterministically predict future trends, as the uncertainty in the transformation that will occur remains broad. The results of the analysis should therefore be interpreted with explicit reference to the limitations stated in Section 4.2.
2.2. Input Data and Processing
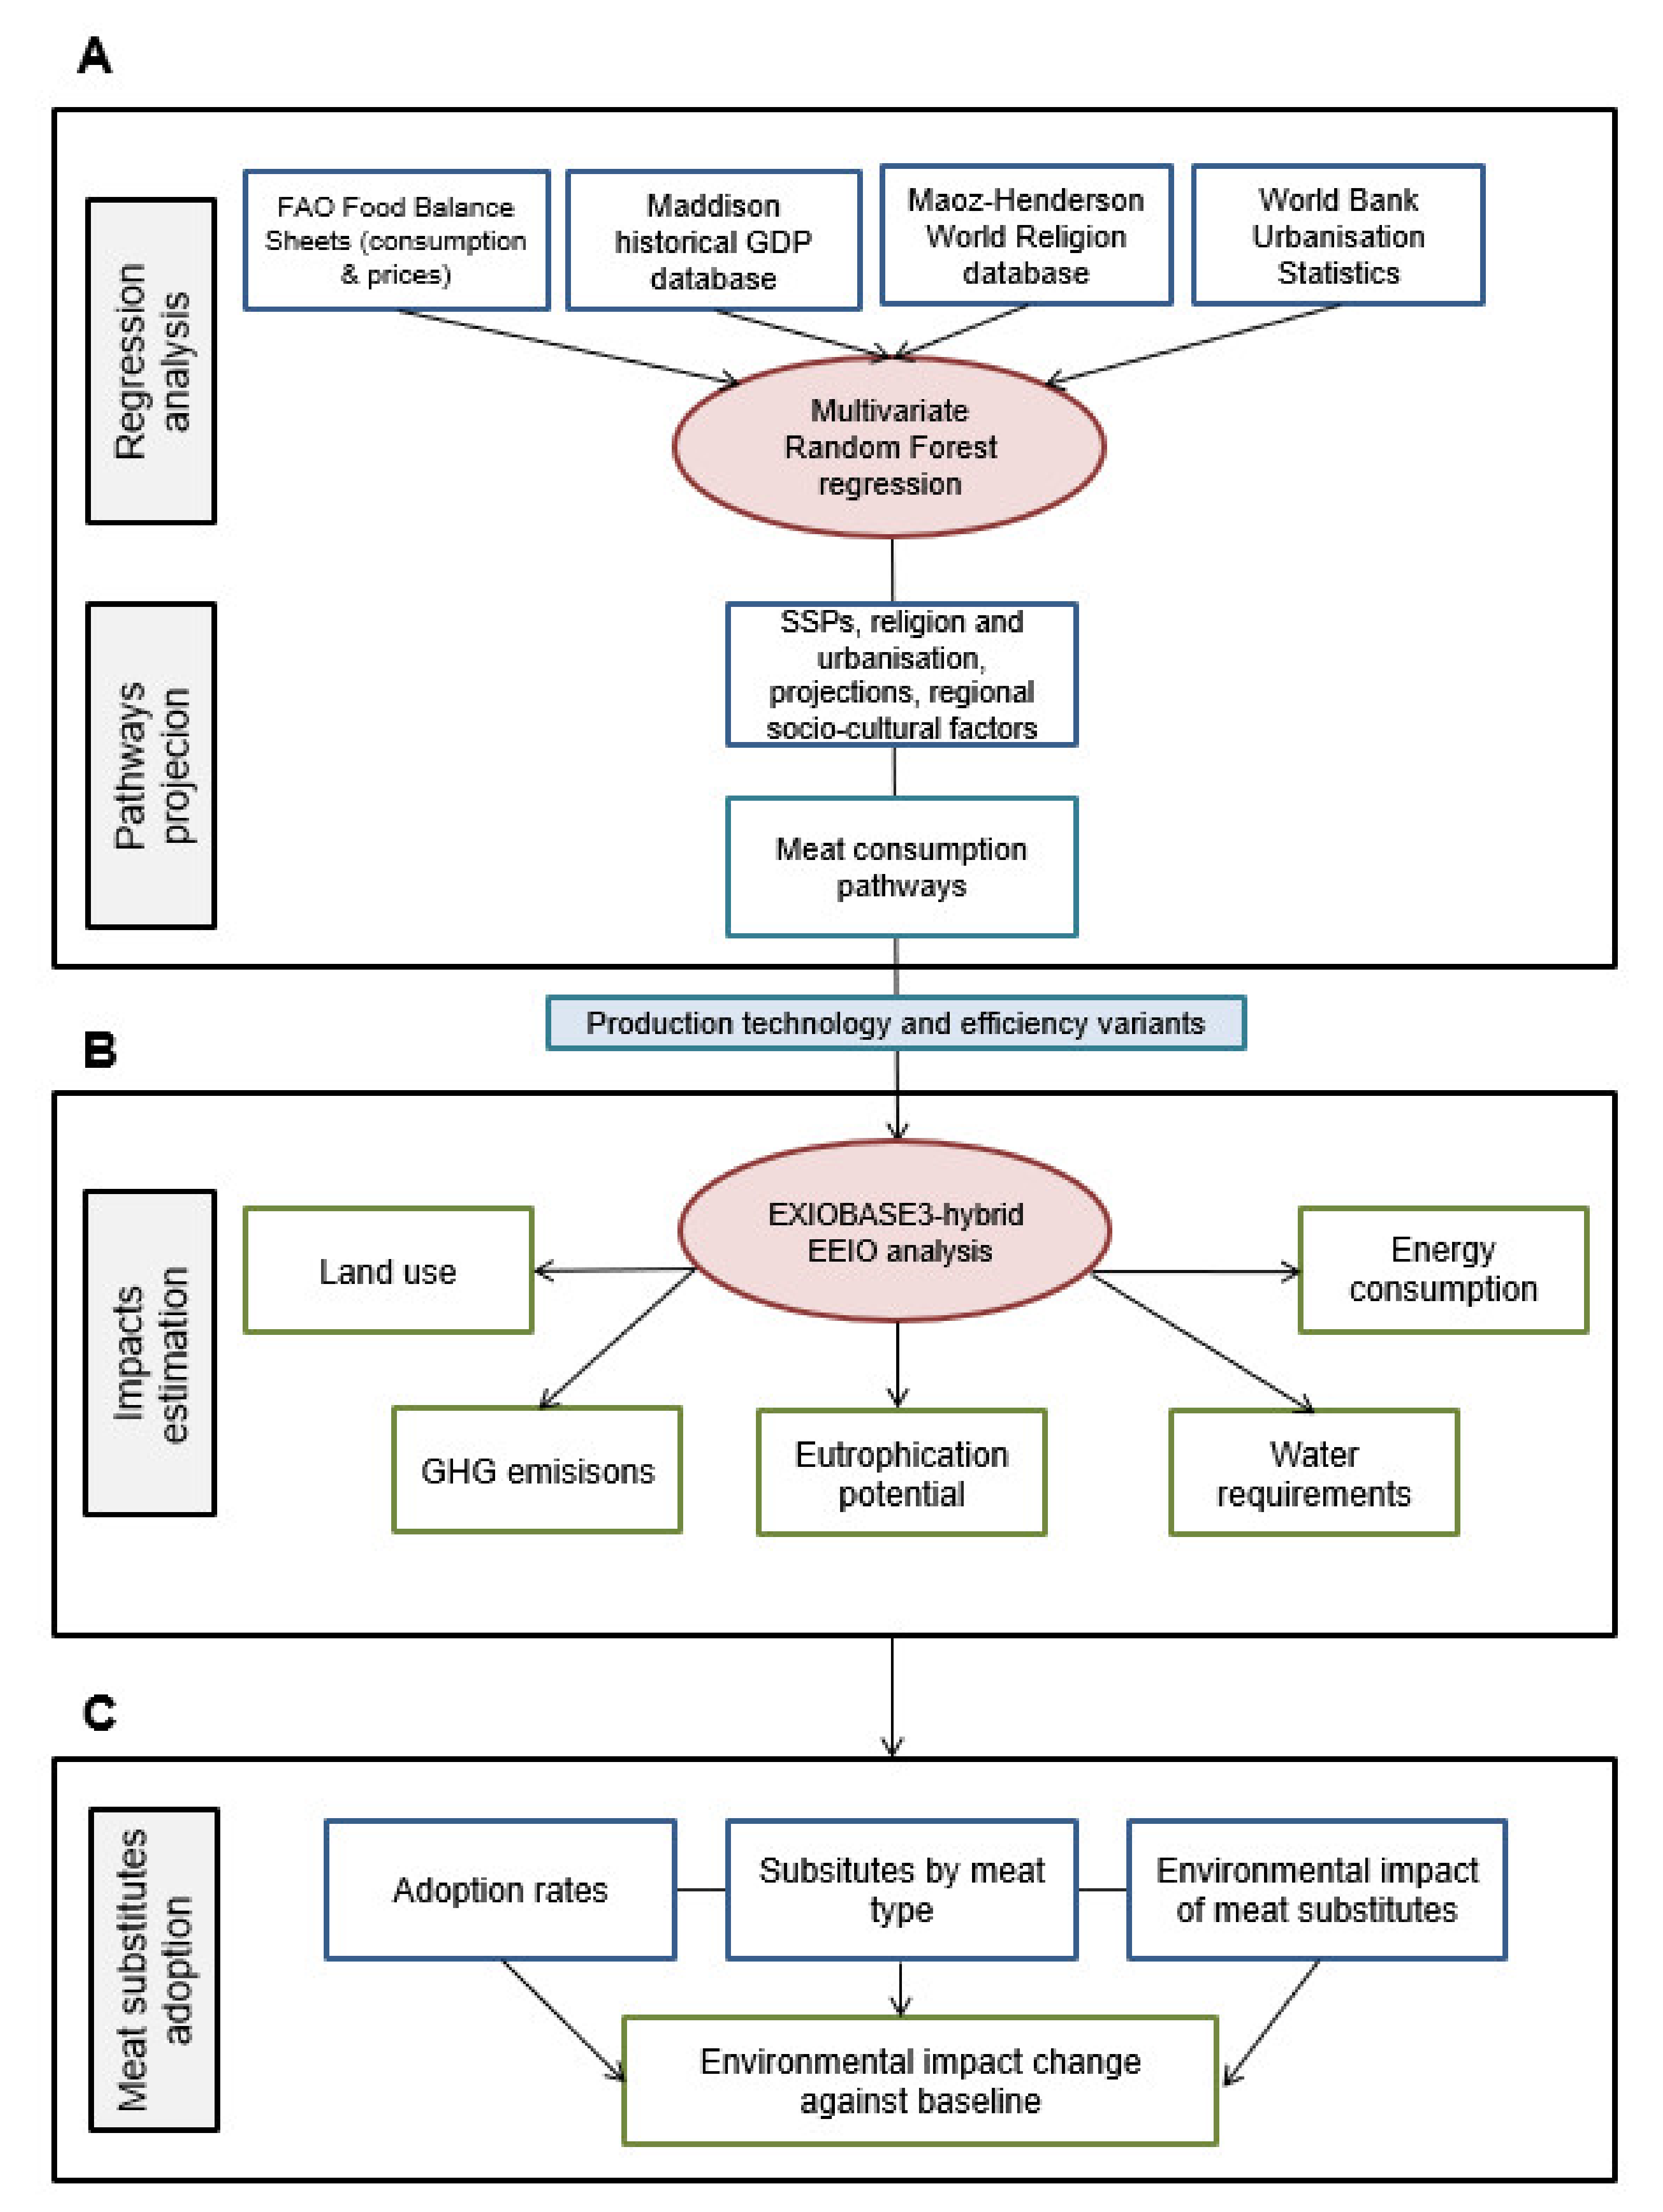
Figure 3 provides a schematic framework of the workflow followed in this study and detailed below. The input data sources of each methodological step are described in Table 1. Main input data table. A panel dataset (country by year) of the processed input data for each variable, including projections for the future, is available as Supplementary Materials.
For the statistical modelling of demand drivers, the OECD-FAO Agricultural Outlook database [38] is used to draw historical consumption and price data (country-level between 1961 and 2013) for four types of meat: (i) Beef and buffalo; (ii) pig meat; (iii) poultry; and (iv) goat and mutton. A composite price index of cereals is also added as a control variable. These data are combined with the Maddison Project database of historical per-capita GDP [39] for the same period. To project the scenarios, we refer to the Shared Socio-Economic Pathways (SSPs) database [40], containing five scenarios over the potential evolution of the global (and country-level) population and GDP until 2100. The SSPs are based on narratives of global development (including inequality) and anthropogenic warming. Since the GDP numbers of the Maddison Project database are reported in constant 2005 USD while those of the SSPs database are in 2010 constant USD, we harmonized the former to the latter using the World Bank PA.NUS.ATLS local currency unit (LCU) to the International Dollars adjustment factor.
Additional predictors considered in the statistical modelling and future pathways projection are derived from the World Religion Dataset, 1945–2010 [41] and the Future of World Religions [42] report. Future prices of meat and cereals (to predict future meat demand) are drawn from [32,38]. For the environmental impacts estimation, we exploit the EXIOBASE 3 hybrid units database [43]. EXIOBASE 3 is characterized by a high sectorial detail matched with multiple social and environmental satellite accounts. The database is constructed using rectangular Supply and Use tables in a 164 industry by 200 products classification exploiting national and international accounts and inventories to represent the global economy in year 2011.

Table 1.
Main input data table.
| Dataset | Variable (s) | Source | Temporal Resolution | Spatial Resolution | Time Scope |
|---|---|---|---|---|---|
| OECD-FAO Agricultural Outlook database | Per-capita consumption, by meat type (kg/capita) | [38] | 1 year | Country-level, global: 239 regions | 1961–2050 |
| OECD-FAO Agricultural Outlook database | Meat (by meat type) and fundamental crops producer prices (LCU/tonne) | [38] | 1 year | Country-level, global: 200 regions | 1961–2015 |
| The future of food and agriculture—Alternative pathways to 2050 | Meat (by meat type) and fundamental crops producer prices (LCU/tonne) | [32] | 5 years | Country-level, global: 178 regions | 2012–2050 |
| World Bank Data | PPP conversion factor | [44] | 1 year | Country-level, global: 213 regions | 1990–2019 |
| Project Maddison | Historical population and PPP per-capita GDP | [39] | 1 year | Country-level, global: 169 regions | 1000–2016 |
| Database | |||||
| SSPs database | Projected population and PPP per-capita GDP | [40] | 5 years | Country-level, global: 198 regions | 2010–2100 |
| Historical religion adherence | Share of the population | [41] | 5 years | Country-level, global: 200 regions | 1945–2010 |
| Forecasted religion adherence | Share of the population | [42] | 10 years | Country-level, global: 198 regions | 2010–2050 |
| Historical and forecasted urbanisation levels | Share of the population | [45] | 5 years | Country-level, global: 273 regions | 1950–2050 |
| EXIOBASE3 products database | Technical, economic, and impact coefficients | [43] | 1 year | Global coverage: 48 regions | 1995–2011 |
2.3. Demand Drivers Modelling
To estimate the demand for the four different types of meat considered we resort to the literature contribution analyzing the key drivers of meat consumption [46] and, based on this literature, we appraise the available data and projections that can be used to train a statistical model and make predictions for the future. The meat consumption drivers we consider include income [47], prices of each meat type [48], as well as of a composite index of cereal crops ([46], urbanization levels [45], religions adherence (a strong driver of dietary choices [49], and a set of residual regional socio-cultural mediators (reflecting historical and cultural mediators for the impact of economic growth on the demand for meat). The modelling analysis is carried out in per-capita consumption units since in developing countries the per-capita demand growth will likely be a more important driver of food demand than population growth between now and 2050, as discussed in [50].
To model the statistical relationships, we rely on the multivariate regression analysis (Figure 3A). The model choice is justified by the presence of four outcome variables of interest (the demand for each meat type) which are correlated among each other. In general, a multivariate regression is a statistical model where two or more correlated outcome variables are simultaneously predicted with the same set of predictor variables. A multivariate system aims at describing how elements in a vector of variables respond simultaneously to changes in a set of mutual predictors. The objective of a multivariate approach is to cope with the outcome variables and thus the stochastic error terms being simultaneously correlated across the regression equations for each meat type (in our case, as a result of the dynamics of substitution and complementation across meat types due to changing tastes) by simultaneously modelling the relationships. Equation (1) reports the general multivariate model:
where:
- is a set of m outcome variables (in our study four, one for each meat type);
- n and t are the number of entities and time-steps measured, respectively (and thus their product is the size of the panel dataset);
- f is a function that associates the outcome variables with the regressors (X);
- k is the number of independent regressors X;
- is the regression residual or error.
To empirically estimate the regression model, we adopt a learning-based approach, whereby the data is split into a training and a test set with shares of 70 and 30% of the data, respectively. To account for time auto-correlation in data splitting, i.e., ensure statistical independence between the groups, we follow [51]: The splitting is performed such that every observation in each country has an equal chance of being in the training and test sets, respectively. Namely, the random sampling is stratified by country. The model is then cross-validated over tuning parameters.
This approach allows for a non-parametric assessment that is able to capture non-linearities and mediated effects of the regressors. It is worth remarking that the purpose of this statistical analysis is modelling historical patterns based on the complex historical socio-economic and cultural interlinkages to predict plausible future pathways, and not investigating causal relationships. Namely, the key goal of our regression model is to replicate the outcome variables (meat consumption levels) as accurately as possible based on the inputs (the meat demand drivers considered in our analysis). Furthermore, the predictive nature of the analysis prevents us from including additional drivers for which no reliable long-term projections can be formulated and cannot therefore be included in the assessment (the main meat drivers identified in Milford et al. 2019, are however included in our analysis). For the same reason, year fixed-effects cannot be added to the regression (unless a time-trend of region-invariant factors is assumed for future years with respect to the past, which is at odds with the non-linear inquiry carried out).
Specifically, we estimate the following model:
where:
- i, c, r, and t refer to each of the four meat types, countries, regions (see below), and years in the dataset, respectively;
- is the per-capita amount of meat consumed (in kg);
- is the purchase-power-parity per-capita GDP in constant 2011 USD;
- is the average real price of each meat type i in each region r in each year t;
- is a composite index of average cereals real price in each region r in each year t;
- are country-level urbanisation levels, i.e., the fraction of the national population living in urban settlements;
- represents a set of seven fractional variables expressing (for each year in each country) the share of the country’s population adhering to each of the major global religions (plus an additional variable for the fraction of non-religious people);
- is a mediating categorical variable which links each country c to the corresponding region among the 20 country groups considered. These variables control for mediating regional socio-cultural factors that affect the link between the regressors and the demand driver variables;
- is a vector of stochastic error terms.
The data is randomly split into a training and a test set. The multivariate random forest (MRF) regression is implemented through the randomForestSRC package [52] in the R scientific computing environment v3.6. The model—with 1000 trees—is trained on the training subsets—producing training accuracies in the 82.9–92.2% range—and then validated on the test set, with resulting accuracies in the 87–93% range depending on the meat type inquired. The Supplementary Materials contains figures of OOB error rates and variable importance plots for each outcome variable, which altogether provide a comprehensive benchmark for the random forest modelling carried out. Moreover, income elasticity plots for each meat type calculated out-of-bag are plotted in Figure S3 These show the evolution of the marginal (i.e., ceteris paribus) response of meat consumption over the range of income levels in the training data (the % change in Yi variables in response to a 1% change in X, at different levels of each X, net of the effect of all other variables).
2.4. Projection of Future Consumption Pathways for SSA
Based on the trained model, we generate pathways of meat consumption for SSA to 2050. These are determined by a set of published projections of (i) PPP per-capita GDP growth; (ii) population growth; (iii) the forecasted share of people adhering to each religious belief; (iv) the forecasted urbanization level; and (v) the mediating region, i.e., the region among the 20 considered which accounts for mediating the relationship between the regressors (e.g., income and urbanization) and the consumption of each meat type. This region variable thus embeds the unmeasured regional socio-cultural factors which define the magnitude and functional form of the relationship between the regressors and the consumption of the different meat types in each region. Thus, each of our projections for future meat consumption in SSA assumes an anchoring towards a given SSP (numerical pathways for the growth of GDP/capita and population in the SSA region until 2050) scenario and—simultaneously—a certain mediating region. For our projections we consider Central Europe, Eastern Asia, Central Latin America, and North Africa and Middle East. Namely, we evaluate the impact of the SSA residual socio-cultural factors evolution towards those of these four regions.
Finally, to validate our estimates, the resulting pathways are appraised against estimates of meat demand in SSA obtained from the FAO Future of Food and Agriculture: Alternative Pathways to 2050 [32] global modelling study. A visual comparison is found in the Supplementary Materials, showing a general consistency of future trends, although our scenarios cover a wider range of variabilities.
2.5. MRIO EEIO Analysis and SSA Resource Efficiency Evolution
The multiregional input-output analysis methodologies have been recently employed in the literature for evaluating consequential impacts associated with different diets [4,53,54,55]. Here, in order to evaluate the environmental impact (Figure 3B) associated with future meat demand pathways in SSA, we adopt a Leontief impact model (Equation (4)) exploiting the hybrid version of EXIOBASE [43], a multi-regional environmentally extended input-output table (version 3.3.18 hsut 2011). The database offers a physical—when possible—and monetary representation of the economy, describing the interactions among 164 sectors of 48 regions and the environment. SSA is here modelled on the African “Rest of the World” region. We run the analysis using an in-house under-development Python module which expands the capabilities offered by pymrio [56]. Beef, poultry, and pork demand in physical dry units are allocated to the Products of meat cattle, Products of meat poultry, and Products of meat pigs sectors, respectively (mutton and goat are not considered due to the absence of an explicit corresponding sector in the adopted database). Impacts are estimated throughout the entire supply-chain (all sectors) and globally (including import/export flows). The analysis is run at four time steps: 2020, 2030, 2040, and 2050.
where:
- identifies the matrix of environmental extensions coefficients (i.e., matrix of resource efficiencies) in scenario s;
- is the vector of final demand (subscript s refers to the specific scenario while 0 refers to the baseline);
- I the identity matrix with the same dimension of A which is the matrix of intermediate transaction coefficients (i.e., matrix of technology coefficients).
Every scenario is identified by each combination of pathways and time steps which results in impacts which are strongly related to the production technology and yield. Indeed, in evaluating the environmental impacts of future demand of meat products, changes in economic-wide efficiencies play a role. Here, no explicit change in sectoral interactions, nor change in international trade patterns, are assumed (i.e., the same matrix of intermediate transaction coefficient is adopted in every scenario—see Equation (4)). Nevertheless, several resources of efficiency variants, representing a set of potential pathways of use of environmental resources that change over time in the livestock supply chain of SSA, are introduced. These pathways of production techniques changes assume dynamic resource efficiency gains, whereby regional efficiency gradually converges towards the efficiency of different countries worldwide as expressed by the current impact coefficients of the EXIOBASE 3 hybrid tables. The dynamic transition is operated at a 10-year time-step, from 2020 to 2050 (Figure S6).
As detailed in Table S6, resource efficiency scenarios mirror a gradual convergence (Figure S7) towards the median efficiency in the reference regions selected when generating the meat consumption scenarios: Central Europe, East Asia, Central Latin American, and MENA. For each scenario, in the 2020s, the resource efficiency is assumed to reflect 90% of today’s SSA efficiency and 10% of the reference region median efficiency; in the 2030s, the ratio shifts to 80 and 20%, respectively; in the 2040s to 65 and 35% each; and in the 2050s, it reaches levels of 50% for both today’s SSA coefficients and the reference regions coefficients.
2.6. Environmental Impact Assessment for SSA
In every year, environmental impacts are assessed starting from the technological description of national and international interlinkages described in the global input-output table adopted, by means of final demand, intermediate transactions (i.e., technology), and environmental extensions (i.e., environmental resource efficiency) coefficients. In every time step, a demand shock is performed updating the level of final meat demand accordingly to the future consumption pathways projection together with a change of SSA environmental extensions coefficients in both the baseline and specific scenario’s matrices. In this way, the impact is evaluated by computing the difference between the two scenarios which differ only in terms of meat consumption levels.
In each time step t, environmental extensions coefficients are used to evaluate midpoint life cycle impact assessments indicators. Greenhouse gases emissions are expressed in CO2equiv units as the weighted sum of CO2, CH4, N2O (i) by their emission factors (EF):
We define the emission factor in kg of CO2 equivalent based on [57] at 1 for CO2, 28 for CH4, and 265 for N2O.
The eutrophication potential is estimated using the seminal methodology by [58] and adopted in recent seminal studies [53]:
where and are the potential contributions to eutrophication of one mole of substance i and ref (i.e., PO43− equivalents), respectively, and (kg\mol−1) are the mass of i and ref. To calculate the eutrophication potential, we consider PO43− equivalence factors in land, air, and water reported in [59].
We consider blue water consumption as the key indicator for the water footprint of meat products. Blue water refers to water sourced from surface or groundwater resources and is either evaporated or incorporated into a product. The concept of blue water footprint thus refers to the physical resource depletion as opposed to green water footprint, which describes the direct use of water recharge, i.e., water from precipitation. Moreover, we refer to water consumption (i.e., the amount of water removed for use and not returned to its source) as opposed to water withdrawal (total water removed from a water source such as a lake or river, a portion of which is returned to the source and is available to be used again).
To estimate the land footprint of the meat supply-chain, we consider the total land requirements for agriculture, pastures, forestry and wood fuel by summing them up.
EXIOBASE 3 hybrid tables report energy consumption as resource use (i.e., fossil fuels such as coal, oil, and natural gas) or as an economic sector (i.e., electricity production). To translate these units into a comprehensive figure of primary energy demand, we transform physical units of fossil fuels () into primary energy by multiplying them to average energy contents () as reported in the International Energy Agency unit converter tool:
This estimated energy requirements are only in part directly driven by the energy-economic sector such as the electricity production one. A significant share of these requirements reflects the embodied energy into machinery and services consumed throughout the supply-chain. For further information on resource allocation procedures, see the Supplementary Materials.
2.7. Comparison of Impacts with Current Environmental Stocks and Flows in SSA
To put the estimated environmental impacts into perspective, it is useful to compare them with current environmental stocks and flows along the examined impact dimensions. We refer to the current suitable non-cultivated land and the current crop and grazing land in the region from [60]. Greenhouse gases emissions from the agricultural sector are retrieved from [61]. The sectoral primary energy demand is obtained from [62]. Last, both the current blue water consumption and the eutrophication potential from the agricultural sector in SSA are derived directly from the 2011 physical-unit EXIOBASE 3 tables [43].
2.8. Meat Substitutes Adoption in SSA and Relative Environmental Benefits
Plant-based, protein-rich meat alternatives such as tempeh and soy-based products are already cheaper than animal meat and widespread in many developing countries. On the other hand, high-tech meat substitutes such as lactose-based products and in vitro beef are generally more expensive. Yet, production costs are rapidly declining [63] and social perceptions are also shifting [64], and might make such products highly competitive over the next decades. With regards to the plausibility of adoption of meat substitutes in SSA, growing interest has been recently reported by international and local companies in the sector, e.g., refer to [65,66]. In addition, as reported by [67], in sub-Saharan Africa more than 60 grasshopper and locust species are already widely eaten, alleviating psychological barriers to e.g., insect-based burgers.
For each of the meat types considered, scenarios of different degrees of meat substitutes adoption are designed (Figure 3C). We refer to peer-reviewed state-of-the-art LCA assessment of environmental impact (refer to Table S7) of popular meat alternatives, including vegetal alternatives, dairy-based products, and in vitro meat. Each alternative is identified as a substitute to a specific meat type depending on texture, characteristics, and consumer perception. The LCA estimates collection aims at capturing the same dimensions of environmental impact examined in this study for animal meat.
We implement the meat substitution dynamics on the median meat demand scenario for each resource efficiency variant, simulating 10, 25, and 50% of animal product consumption substitution by 2050. In our assessment, we assume that each meat type is evenly substituted by those shares. Where multiple substitutes are identified for one single meat type, we simulate an equal mix of those substitutes (gluten, leguminous, insect, and lab-based products for beef; dairy-based products for poultry; soy-based products for pork [68]; hence, adopting the mean value of each environmental impact category).
In particular, we simulate substitution such that the absolute quantity of meat substitutes per kg of meat substituted in each adoption scenario provides the same amount of proteins, which would be provided by 1 kg of each meat type. Table S8 summarizes the assumed protein content (g/kg of product) of each meat type and of each meat substitute considered.
3. Results
3.1. Meat Consumption Projections in SSA to 2050
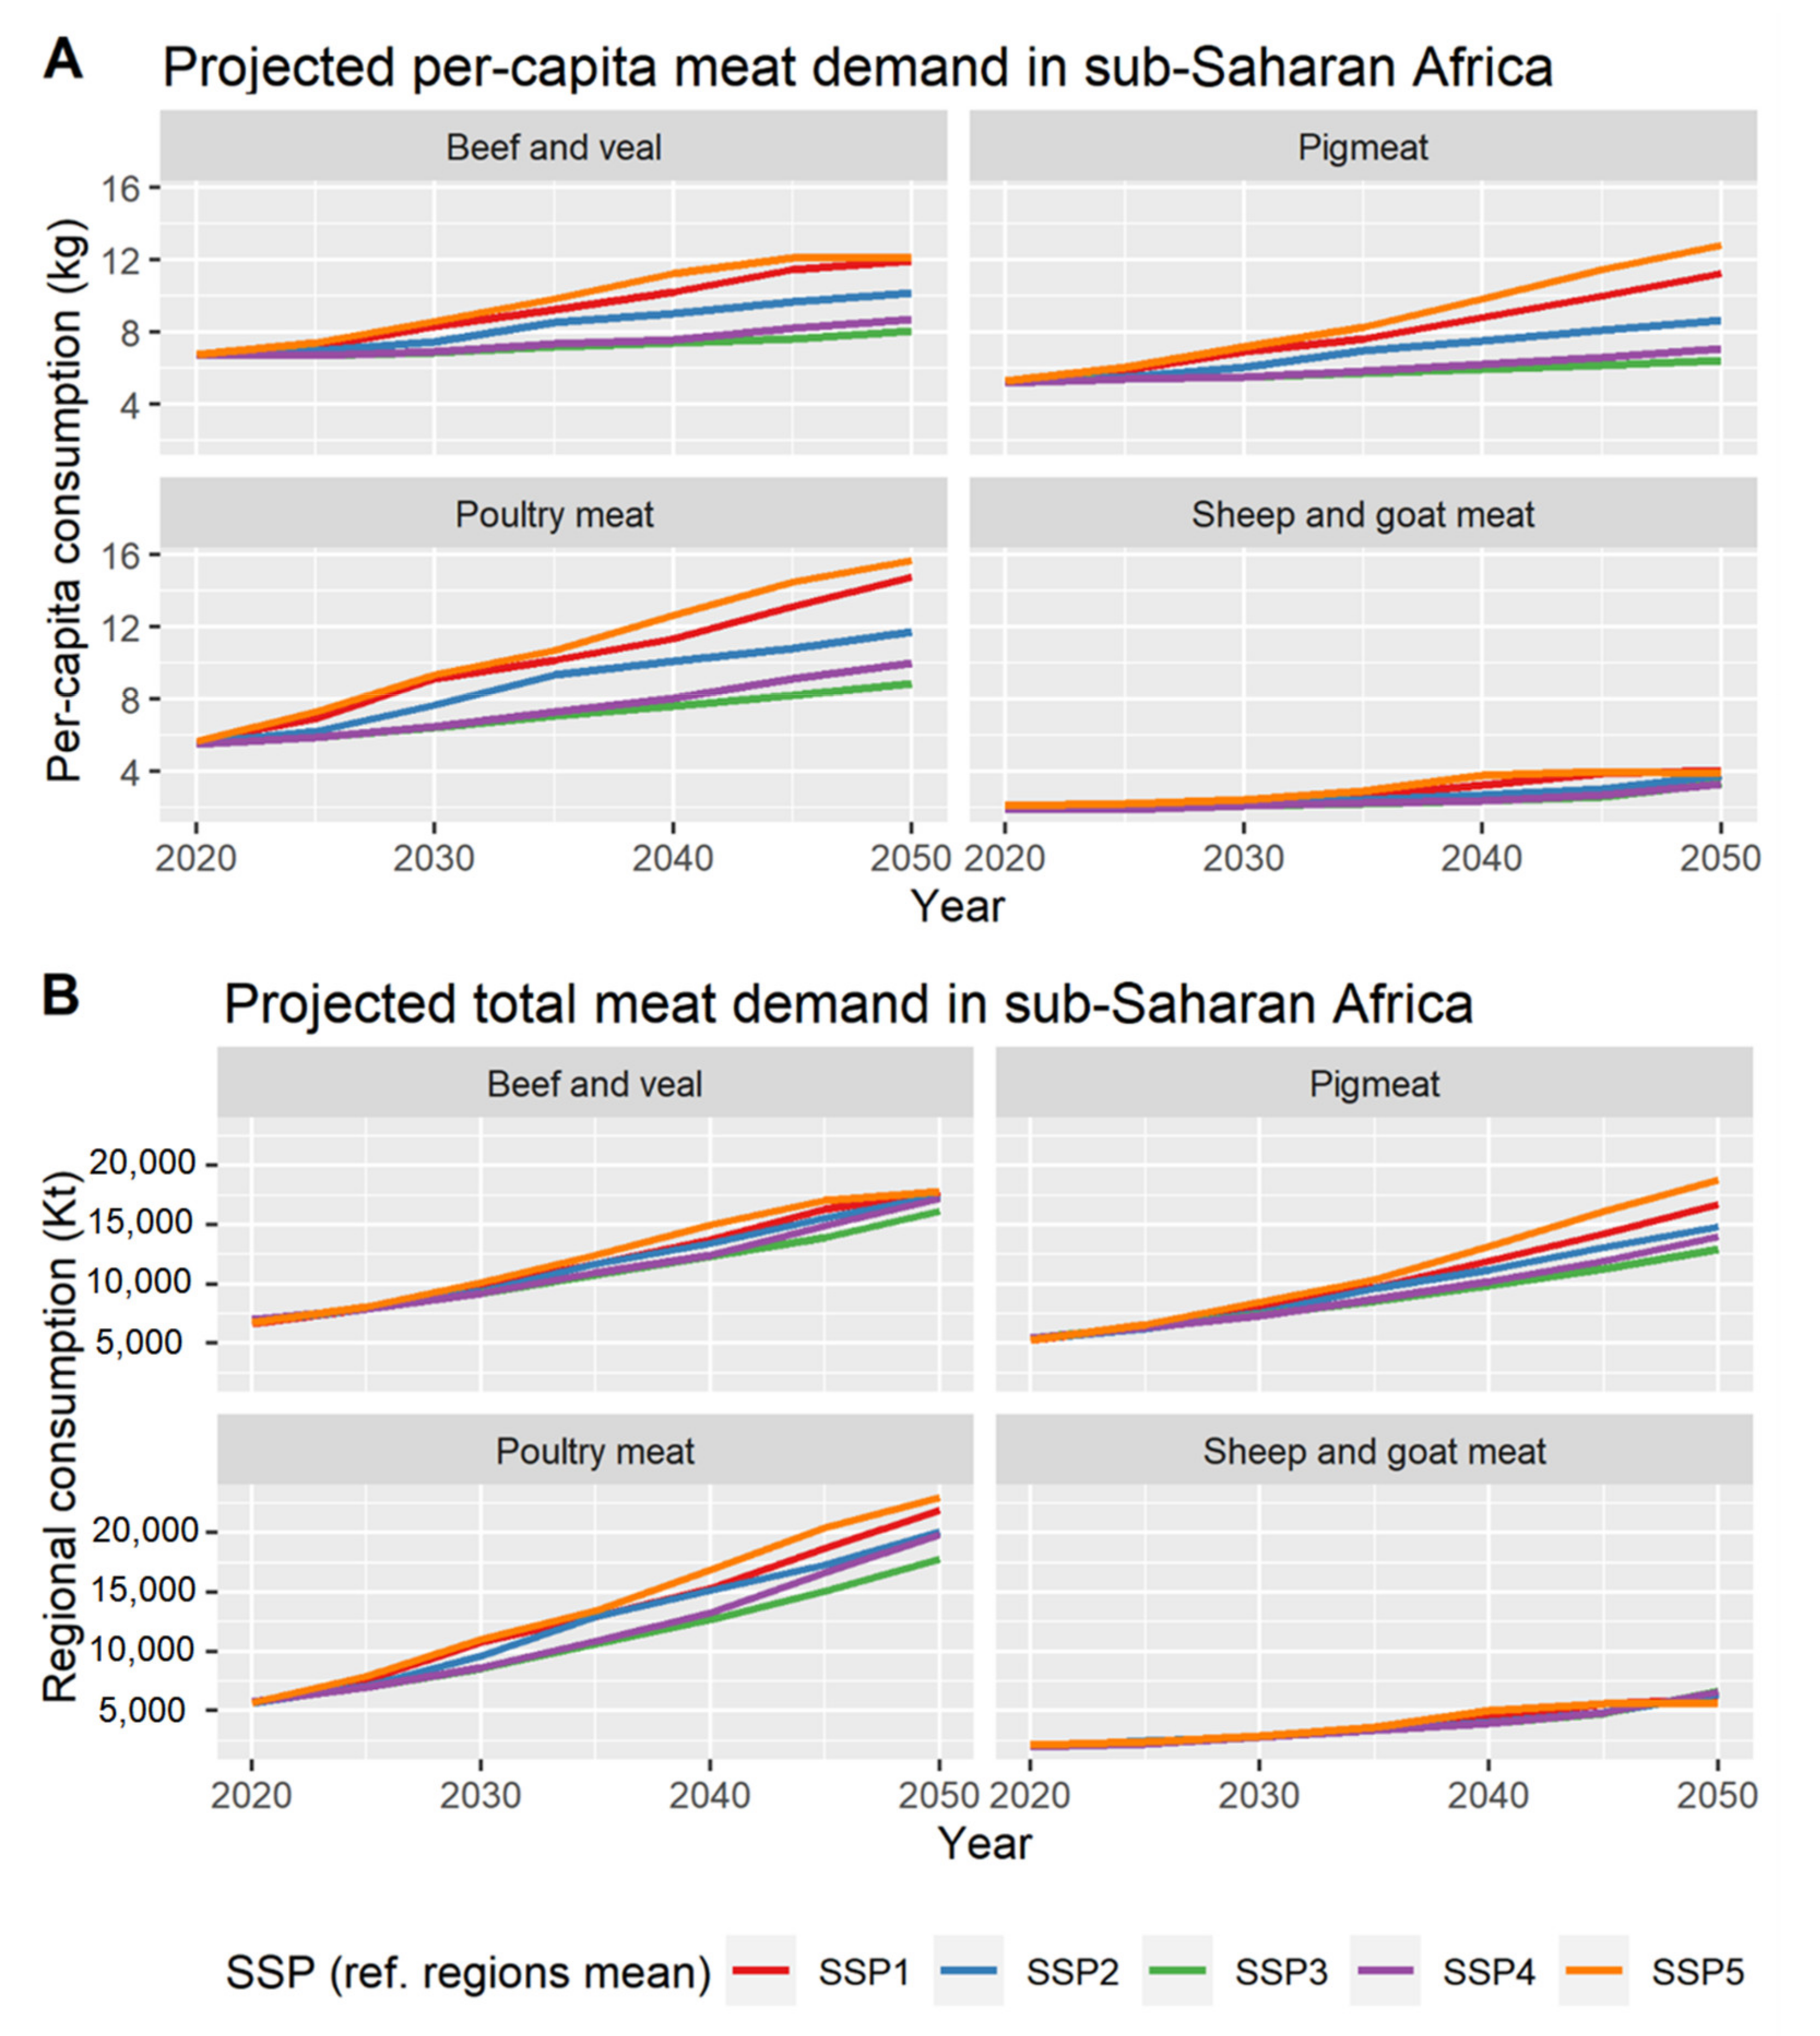
Figure 4 illustrates the projected per-capita (panel A) and aggregate (panel B) regional demand for each of the four types of meat in the five SSP scenarios. Each line therefore describes the reference-region mean outcome across each SSP scenario. The results and model benchmarks of the underlying statistical modelling are reported in Tables S1–S5 and Figure S2. The projections are also compared to FAO regional projections [32] in Figures S4 and S5, showing a general consistency. Yet, our projections follow non-linear growth trends and encompass a larger range of variability compared to the FAO projections, for which all three scenarios predict a very narrow outcome range for 2050. This is the result of the broad underlying drivers, with interactions in different scenarios of demographic and economic growth, the latter mediated by the prevalent socio-cultural dynamics.
According to the estimated pathways, beef and buffalo meat consumption in 2050 is projected in the 7–15 kg/capita/year range, with a mean value of 10 kg/capita/year, implying a scenario-median aggregate demand of 17.5 Mt in 2050. Poultry meat consumption is estimated to reach a value in the 8–18 kg/capita/year range, with a median of 12 kg/capita/year, and thus a scenario average aggregate demand of 21 Mt in 2050. Pork consumption is projected in the 3.5–23 kg/capita/year range, with a median value of 9.5 kg/capita/year, implying a scenario-average aggregate demand of 16 Mt in 2050. Finally, goat and mutton meat consumption will lie in the 1.5–5 kg/capita/year range, with a mean value of 3.4 kg/capita/year and a scenario-average aggregate demand of 5.9 Mt in 2050.
3.2. Estimated Environmental Impacts of SSA Meat Demand Growth
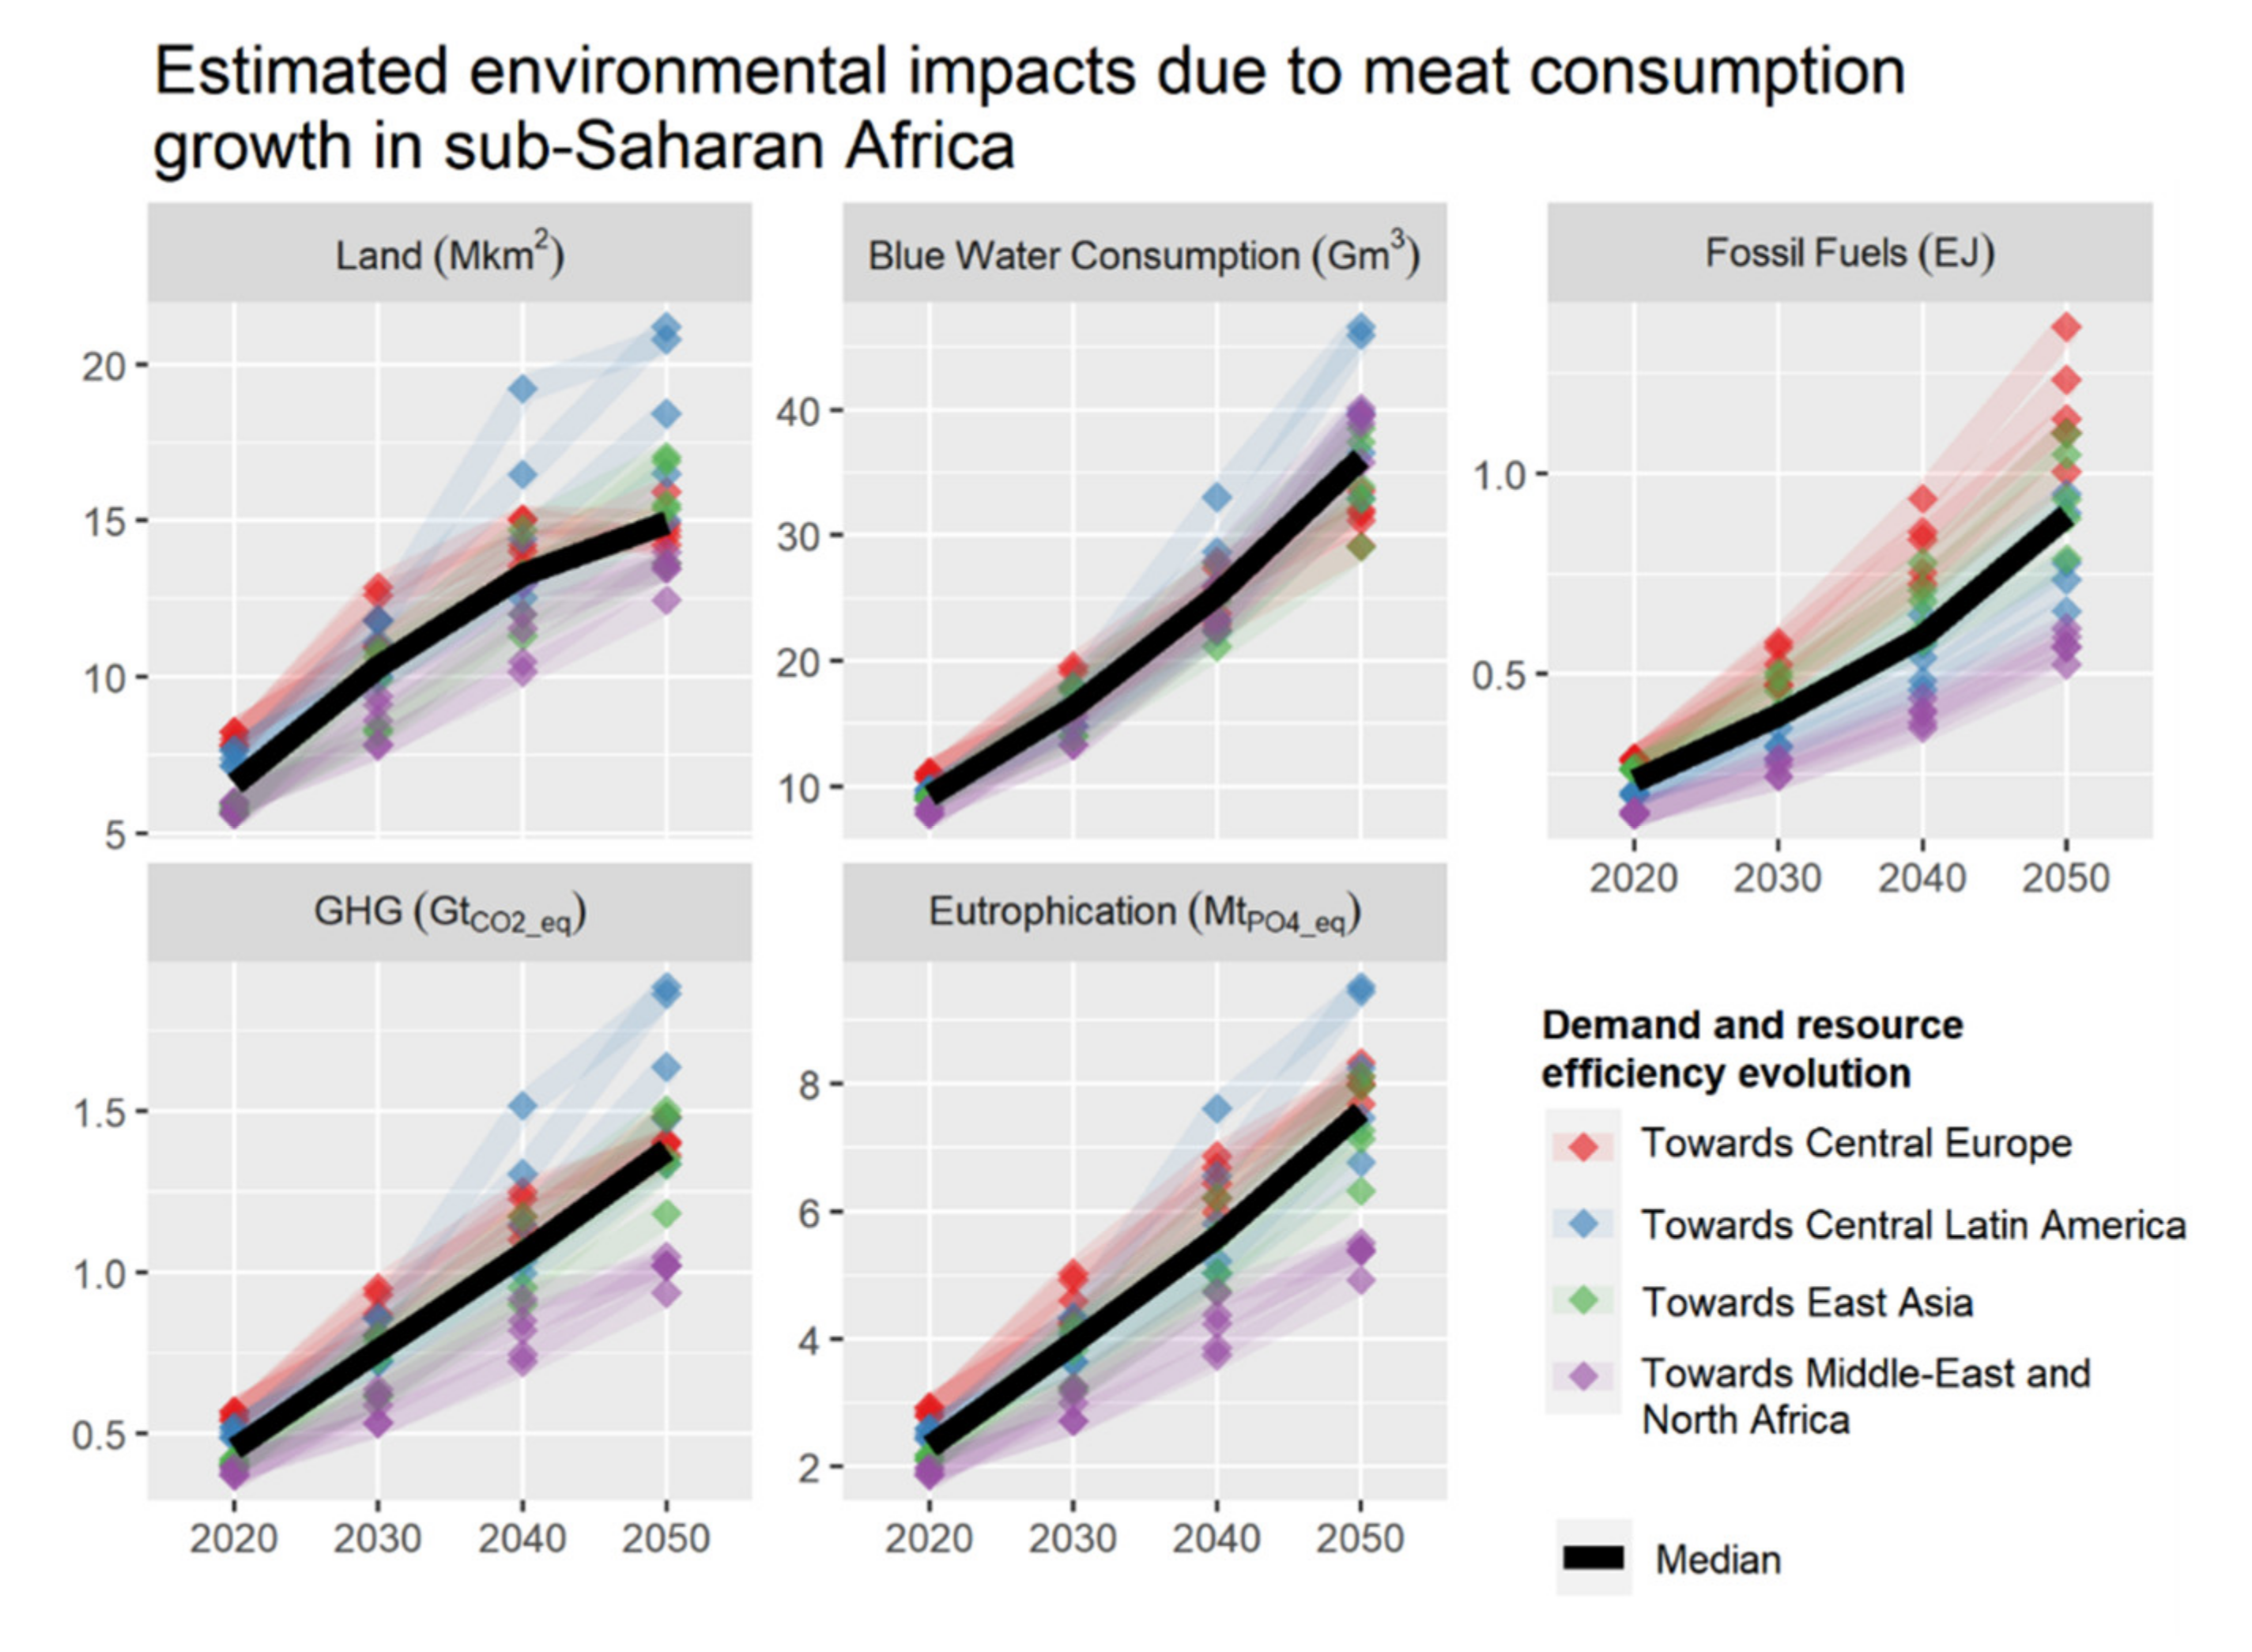
Figure 5 summarizes the results of the environmental impact assessment, carried out according to the LCA approach, hence accounting for the resources consumption and emissions throughout the entire supply chain of production of the final meat products. In the same figure, colors identify the socio-cultural and resource efficiency convergence regions and within each category they differ by the assumed SSP scenario. The black lines express the median values across all scenarios for each impact category, to which we attach the greatest significance in the interpretation of the numbers. It must remark that the figures describe the additional impacts, i.e., on top of today’s regional environmental impact due to meat consumption.
We find that by 2050—depending on the interplay of resources efficiency and demand growth—globally greenhouse gases emissions could grow by 1.4 [0.9–1.9] Gt CO2e/yr (~175% of today’s regional agriculture-related emissions), cropping and grazing-related land may cover additional 15 [12.5–21] · 106 km2 (one quarter of today’s global agricultural land), blue water consumption would rise by 36 [29–47] Gm3/yr (nearly doubling the current regional agricultural consumption), the eutrophication potential would grow by 7.6 [4.9–9.5] t PO4e/yr, and additional 0.9 [0.5–1.4] EJ/yr of fossil fuels and 49 [32–73] TWh/yr of electricity would be consumed. These results are inclusive of the different meat types considered in our analysis, the meat type specific results are reported in Figure S8 and suggest that in relative terms beef meat is responsible for a greater environmental impact than the other meat types, and mainly when it comes to its land, GHG, and eutrophication potential footprints, which are all at least ten times larger than those of pork and poultry. Blue water consumption is more evenly spread among meat types, but pork is the main consumer. Finally, energy consumption shows similar values across the meat types.
As previously detailed, the environmental impacts relative to each consumption pathway are estimated with hybrid-units EEIO tables. Environmental impacts of the supply-chain of meat depends on the production of the total quantities required, the resource efficiency of the adopted production processes (i.e., natural resource and emissions intensities). To represent the role of resources efficiency of the economic system with respect to environmental dimensions, five resource efficiency variants—responsible for linking production with environmental impacts—are designed (see Section 2.5). These pathways of resource efficiency change assume dynamic efficiency gains, whereby regional resource intensities gradually converge towards resources efficiencies of different reference economies worldwide, as expressed by the coefficients of the EXIOBASE 3 dataset. Each coefficient represents the marginal sectoral impact or resource consumption per additional physical unit produced in each region. The dynamic transition is operated at a 10-year time-step, from 2020 to 2050 (Figure S6). As schematically represented in Figure S7, those scenarios (described in Table S6) mirror a convergence towards the median resource efficiency in the reference regions selected when generating the meat consumption scenarios: Central Europe, East Asia, Central Latin American, and MENA. Moreover, in our study, the evolution in resource efficiency over time is associated with socio-cultural convergence: Meat demand scenarios where the impact of economic development is mediated by a given regional preference are later evaluated in the EEIO environmental impact analysis assuming resource efficiency convergence towards the same region.
Overall, our results show that while the demand-side has a prominent role in defining the expected environmental outcome, there is also a very large room for resource efficiency and technology to mediate these impacts. The mechanization and industrialization of the agricultural sector and of breeding sites are prone to long-lived lock-ins, and thus the paradigm followed has a large long-run impact. In general, it seems that reference regions which imply higher consumption pathways (such as the Central European and the Central Latin American paradigms) are at the margin also more resource-efficient, and yet the final environmental impact of each scenario is a trade-off between the two.
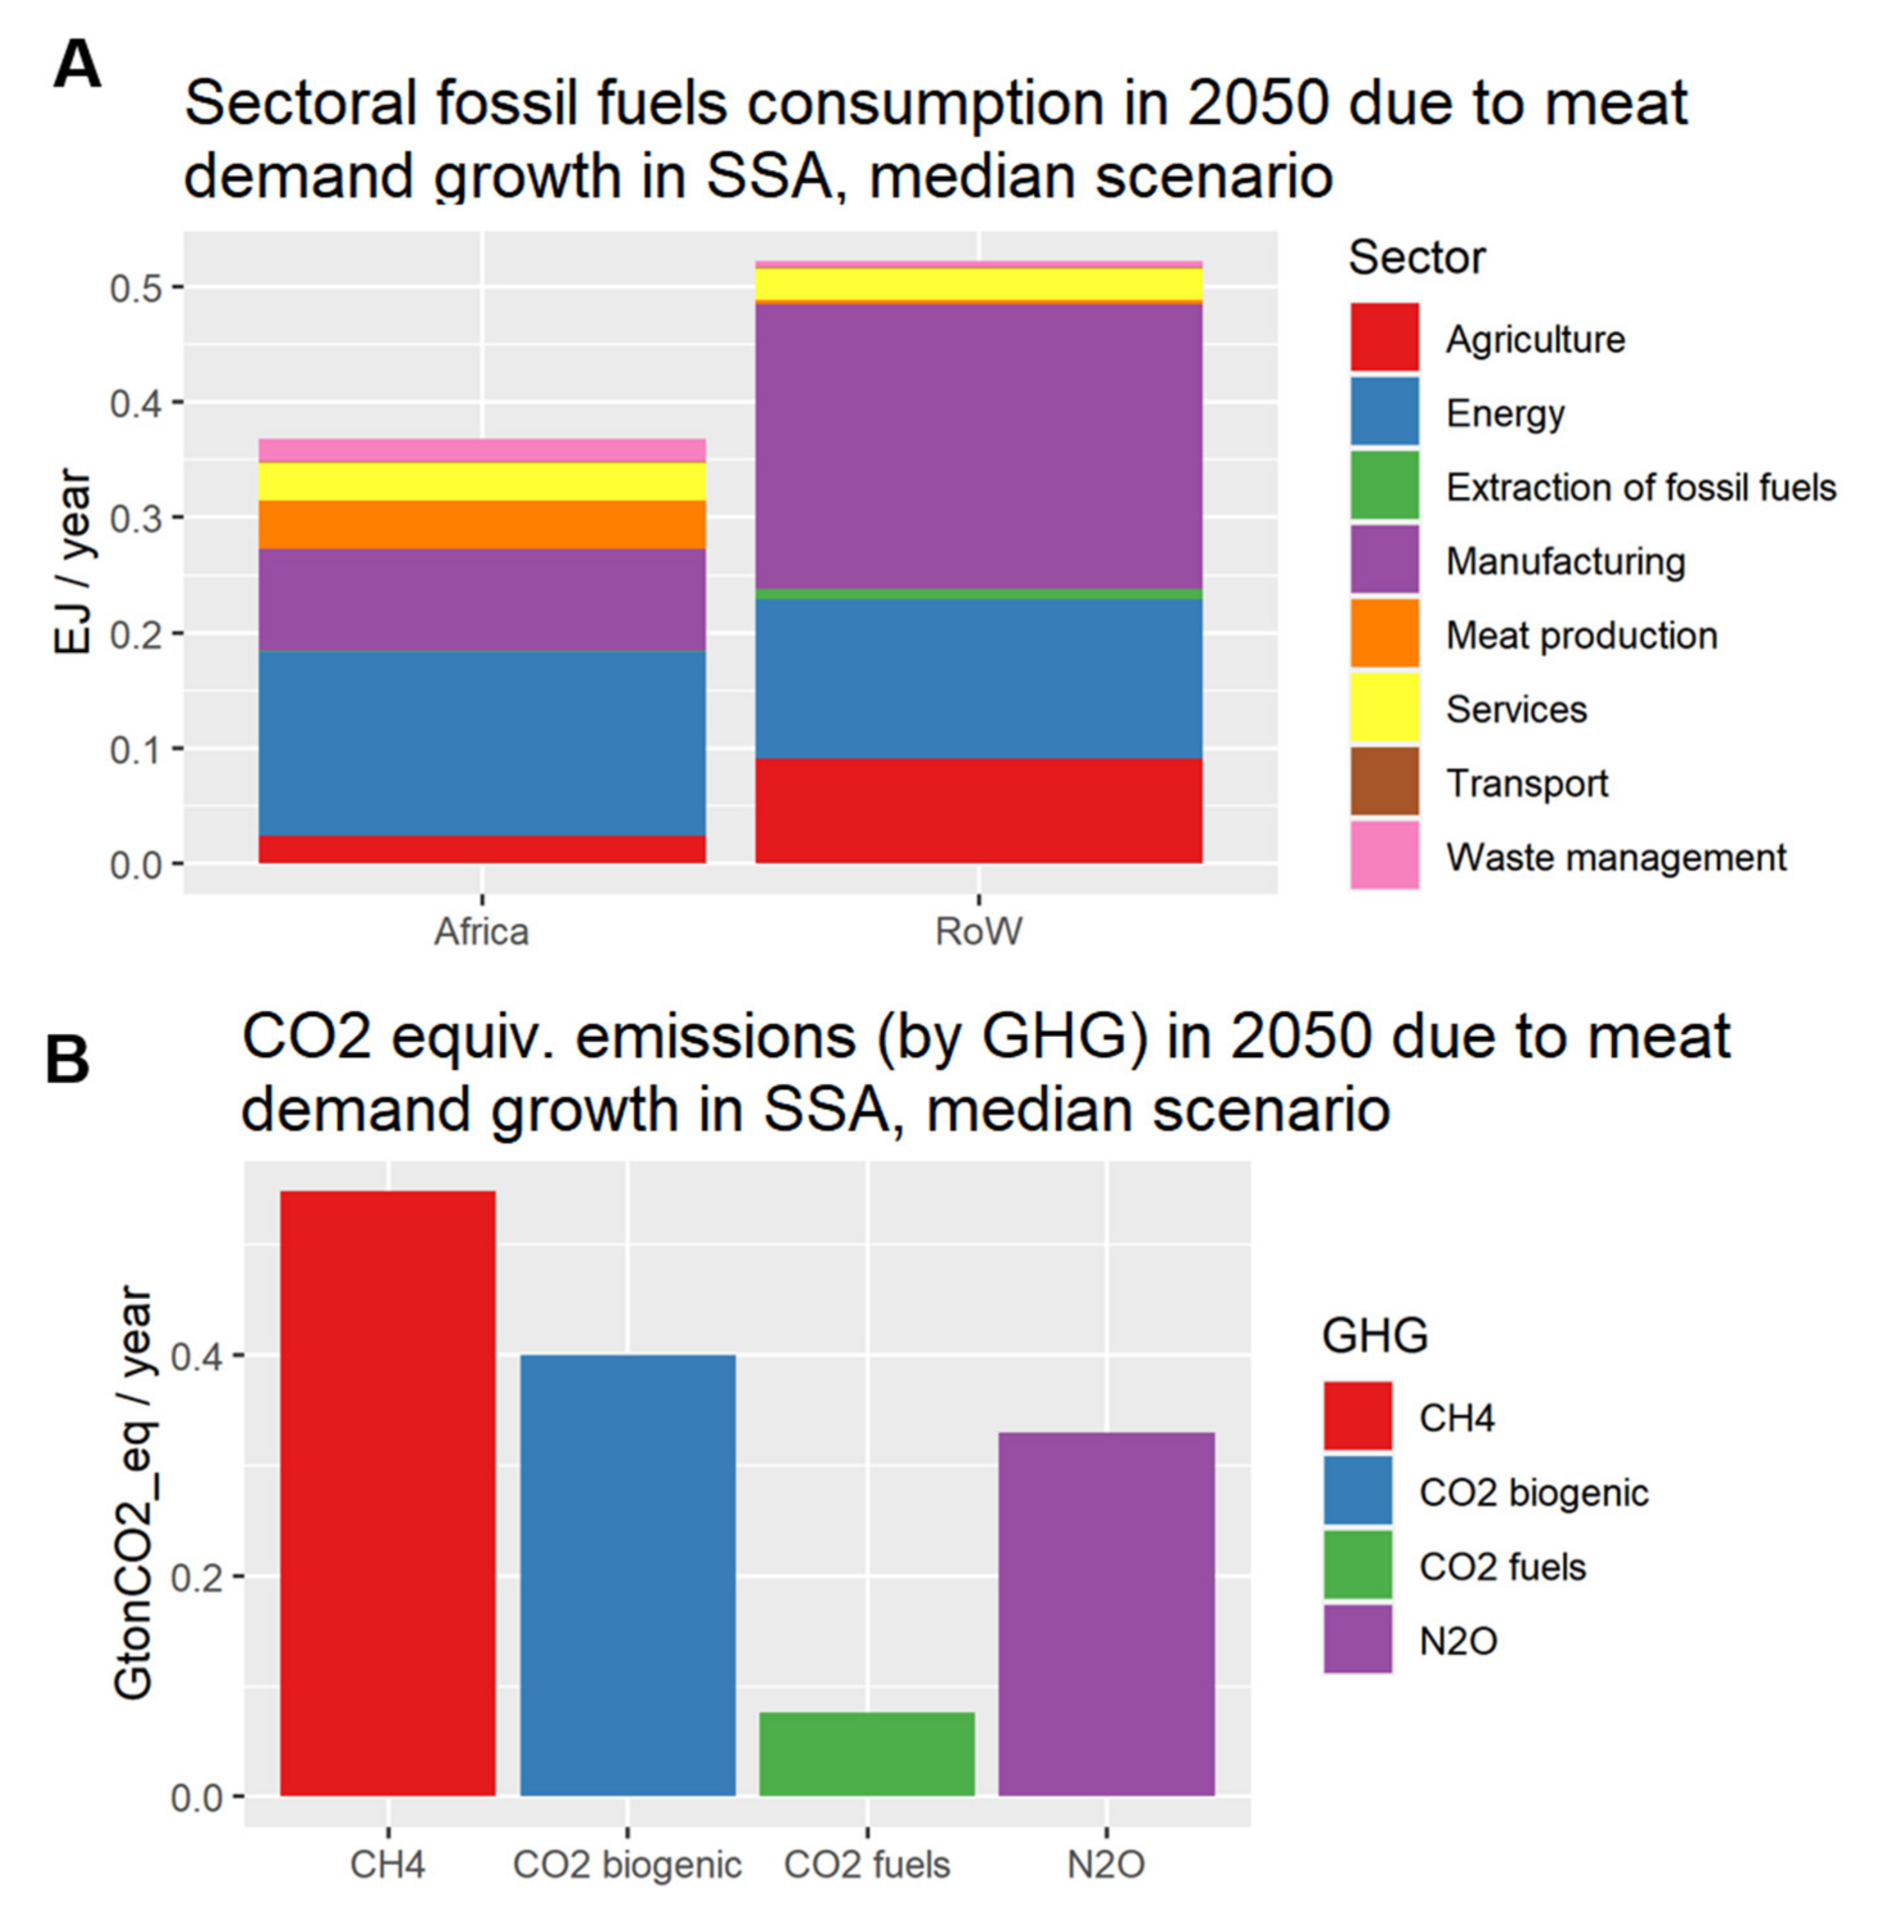
When looking at the sectoral final consumption of fossil fuels (see Section 2.6 for a description of the sectoral allocation approach), the results for the median scenario in 2050 (Figure 6A) show that about 60% of the total consumption occurs outside of SSA (about 0.52 EJ/year of the total 0.89 EJ/year). The sectoral repartition shows that manufacturing and the services sectors dominate the final consumption of fossil fuels, while a marginal role is played by the primary (agricultural) and meat production sectors. This result is justified by the LCA nature of the analysis, which includes embodied energy into machinery and services provision, emerging as the dominant consumption drivers. Disaggregation of the different greenhouse gases (Figure 6B) for the median scenario shows that the largest sectoral source of warming potential comes from increases in CH4 emissions, responsible for about 40% of the total 1.35 Gt CO2equiv. The residual 60% is divided into 49% of biogenic CO2 emissions from biomass combustion or decomposition, 41% of N2O (mainly from fertilization), and only 9% CO2 emissions from the combustion of fossil fuels. Note that here emissions from land use change are not accounted for.
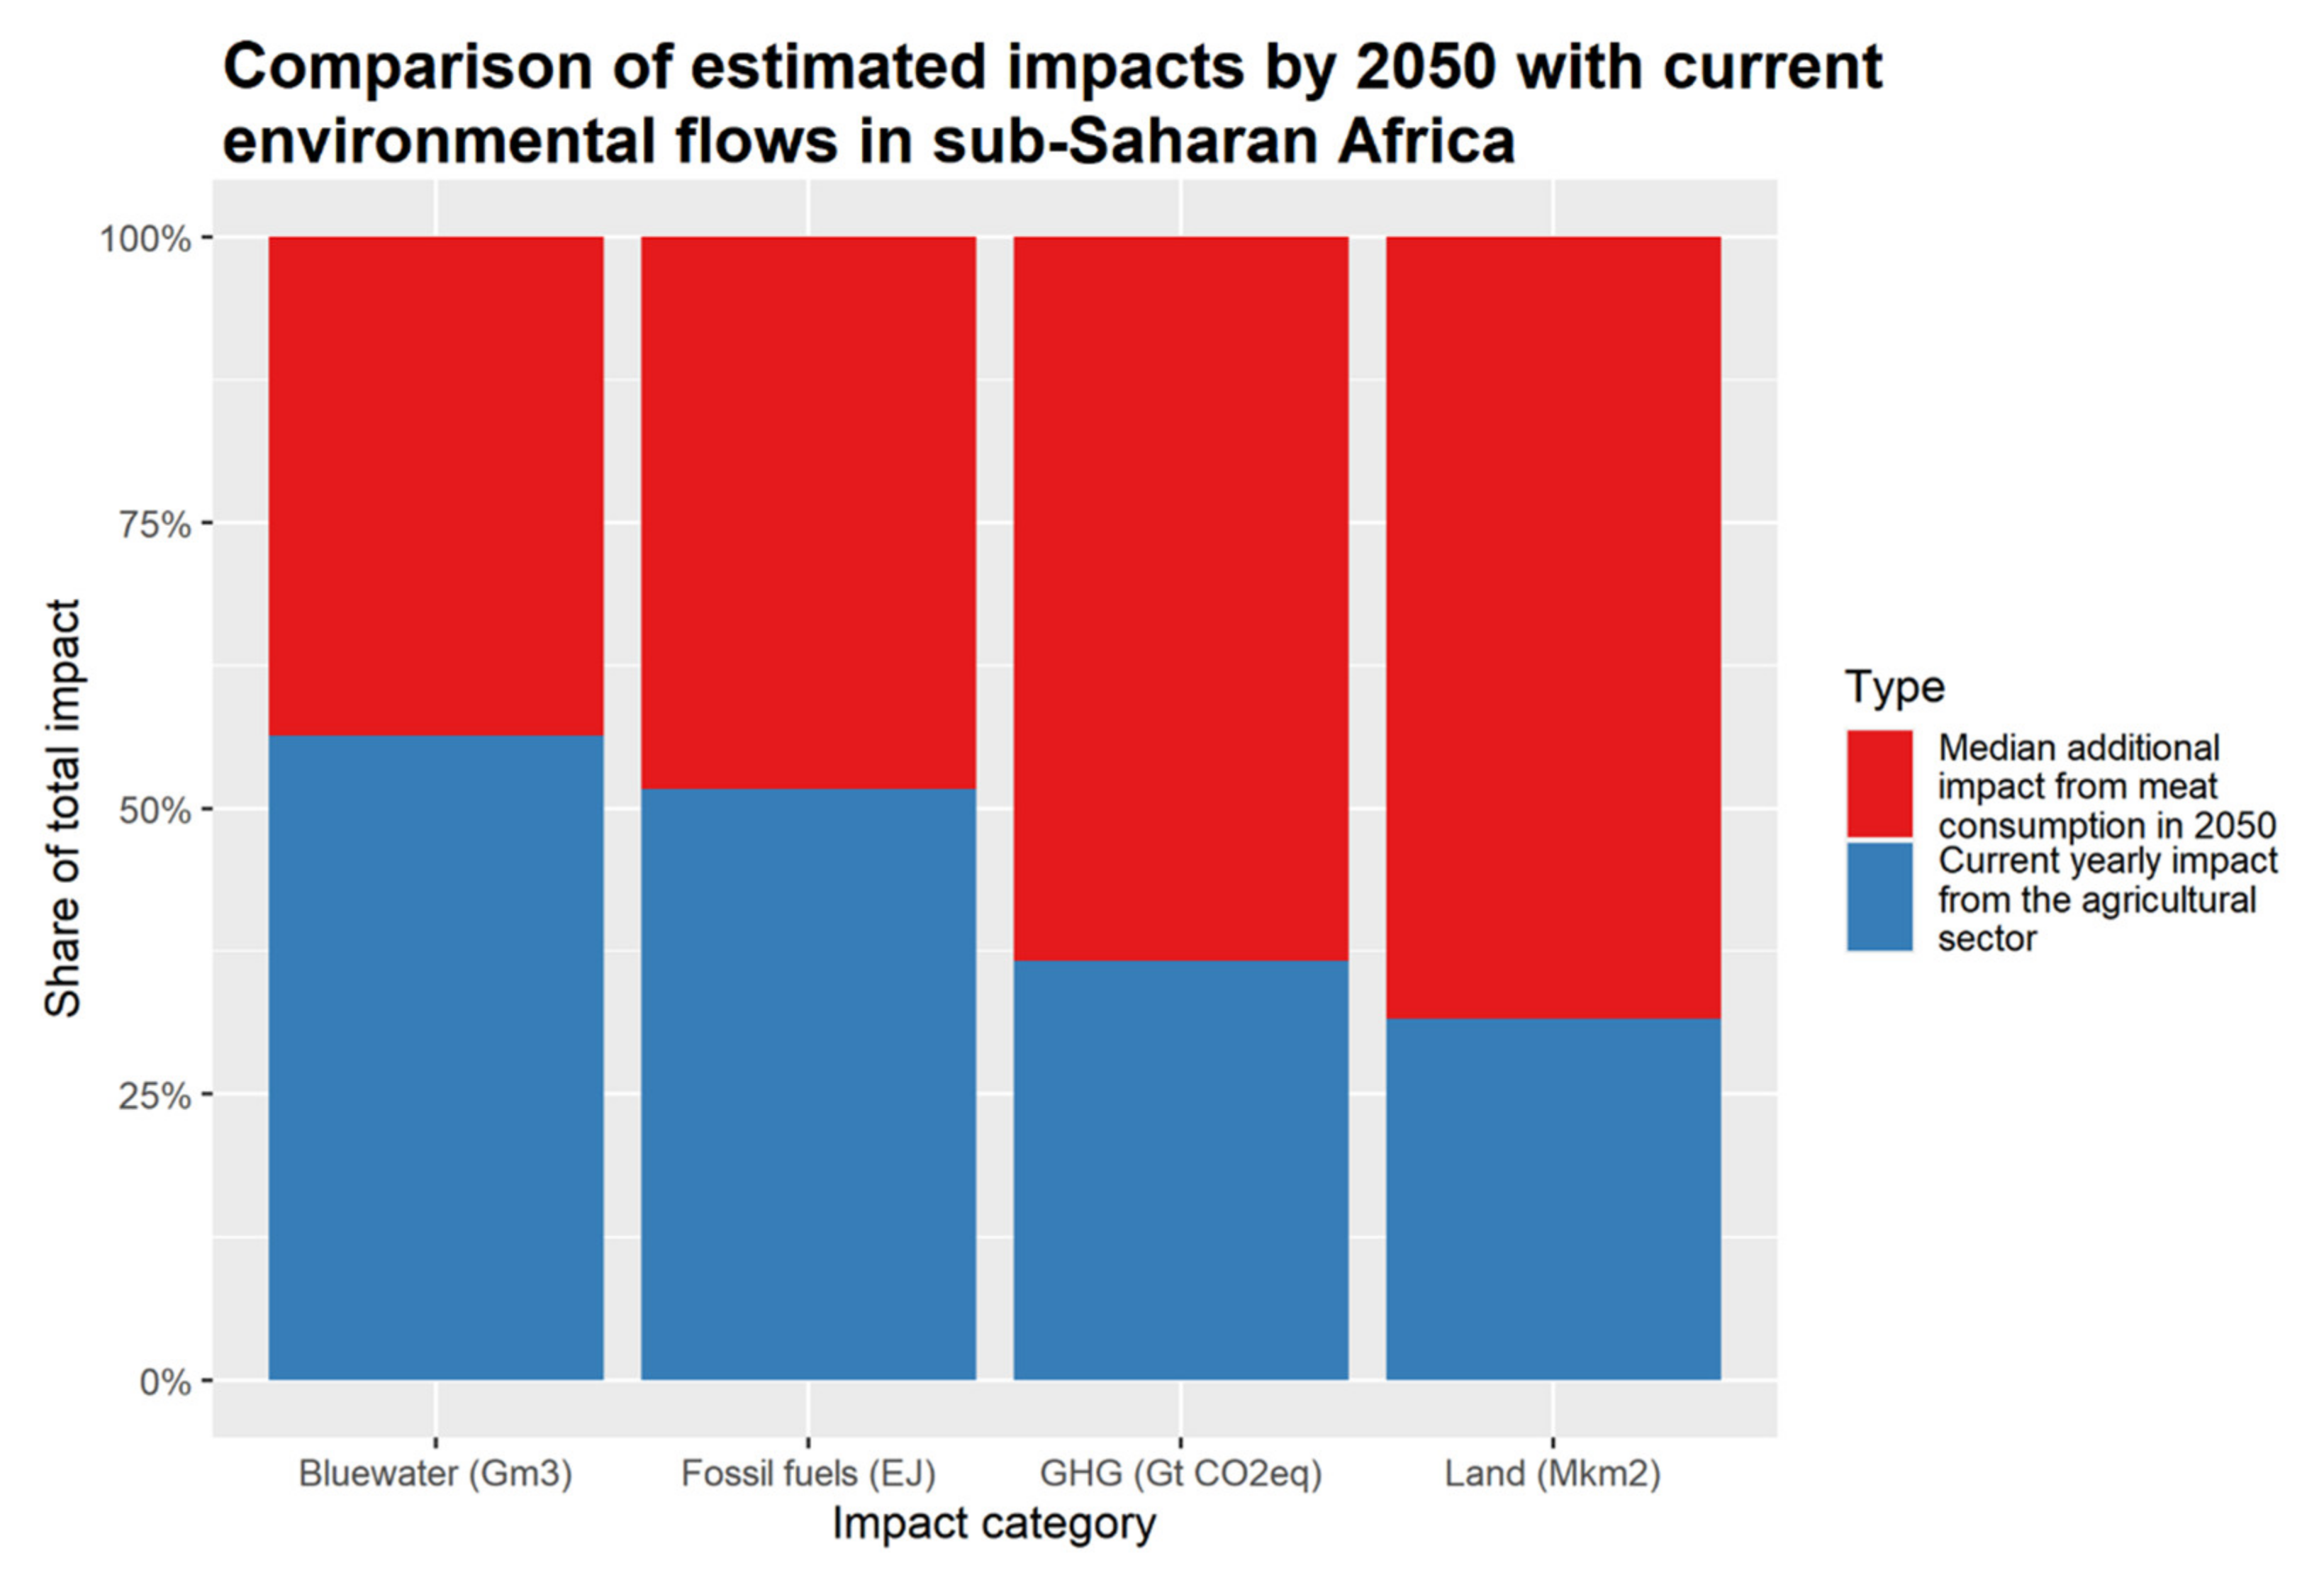
To put the absolute magnitude of the results into perspective, Figure 7 provides the comparison of the relative significance of the estimated median impacts in 2050 with reference environmental flows at the present time. The median blue water consumption in 2050 in SSA would nearly double the current regional agricultural consumption [43], significantly increasing the pressure on groundwater aquifers and freshwater surfaces. However, it must be remarked that in today’s SSA more than 90% of total cropland is rainfed only [69], and therefore substantial volumes of irrigation water for intensification purposes will be required to produce feedstock. Moreover, in the agricultural sectoral of SSA the fossil fuels consumption will also nearly double, while greenhouse gases emissions will grow almost 3-fold [62]. Yet, the most pervasive impact will perhaps be in the land use. Crop and grazing land will together require a more than 3-fold increase in the currently 6.9 million km2 occupied by the sector in SSA [60], unless a very strong intensification of production takes place. More strikingly, the additional 15 million km2 of median requirement would account for over one quarter of today’s global agricultural land [70].
3.3. Environmental Benefits of Meat Substitutes Adoption in SSA
To evaluate the role that different levels of adoption of meat substitutes could play in reducing the regional environmental footprint of diets, we simulate future substitution dynamics. For each of the meat types considered, we simulate scenarios of gradual adoption of most diffused meat alternatives (where 10, 25, and 50% of animal product consumption by 2050 is substituted). In particular, the absolute quantity of meat substitutes per kg of meat substituted in each adoption scenario is such that it provides the same amount (grams) of proteins which would be provided by 1 kg of each meat type (see Table S8). Then, we consider the distribution of demand/resource-efficiency scenarios and compare it with counterfactuals of substitutes adoption. We refer to peer-reviewed, state-of-the-art LCA assessments to evaluate the footprint of these products (Table S7).
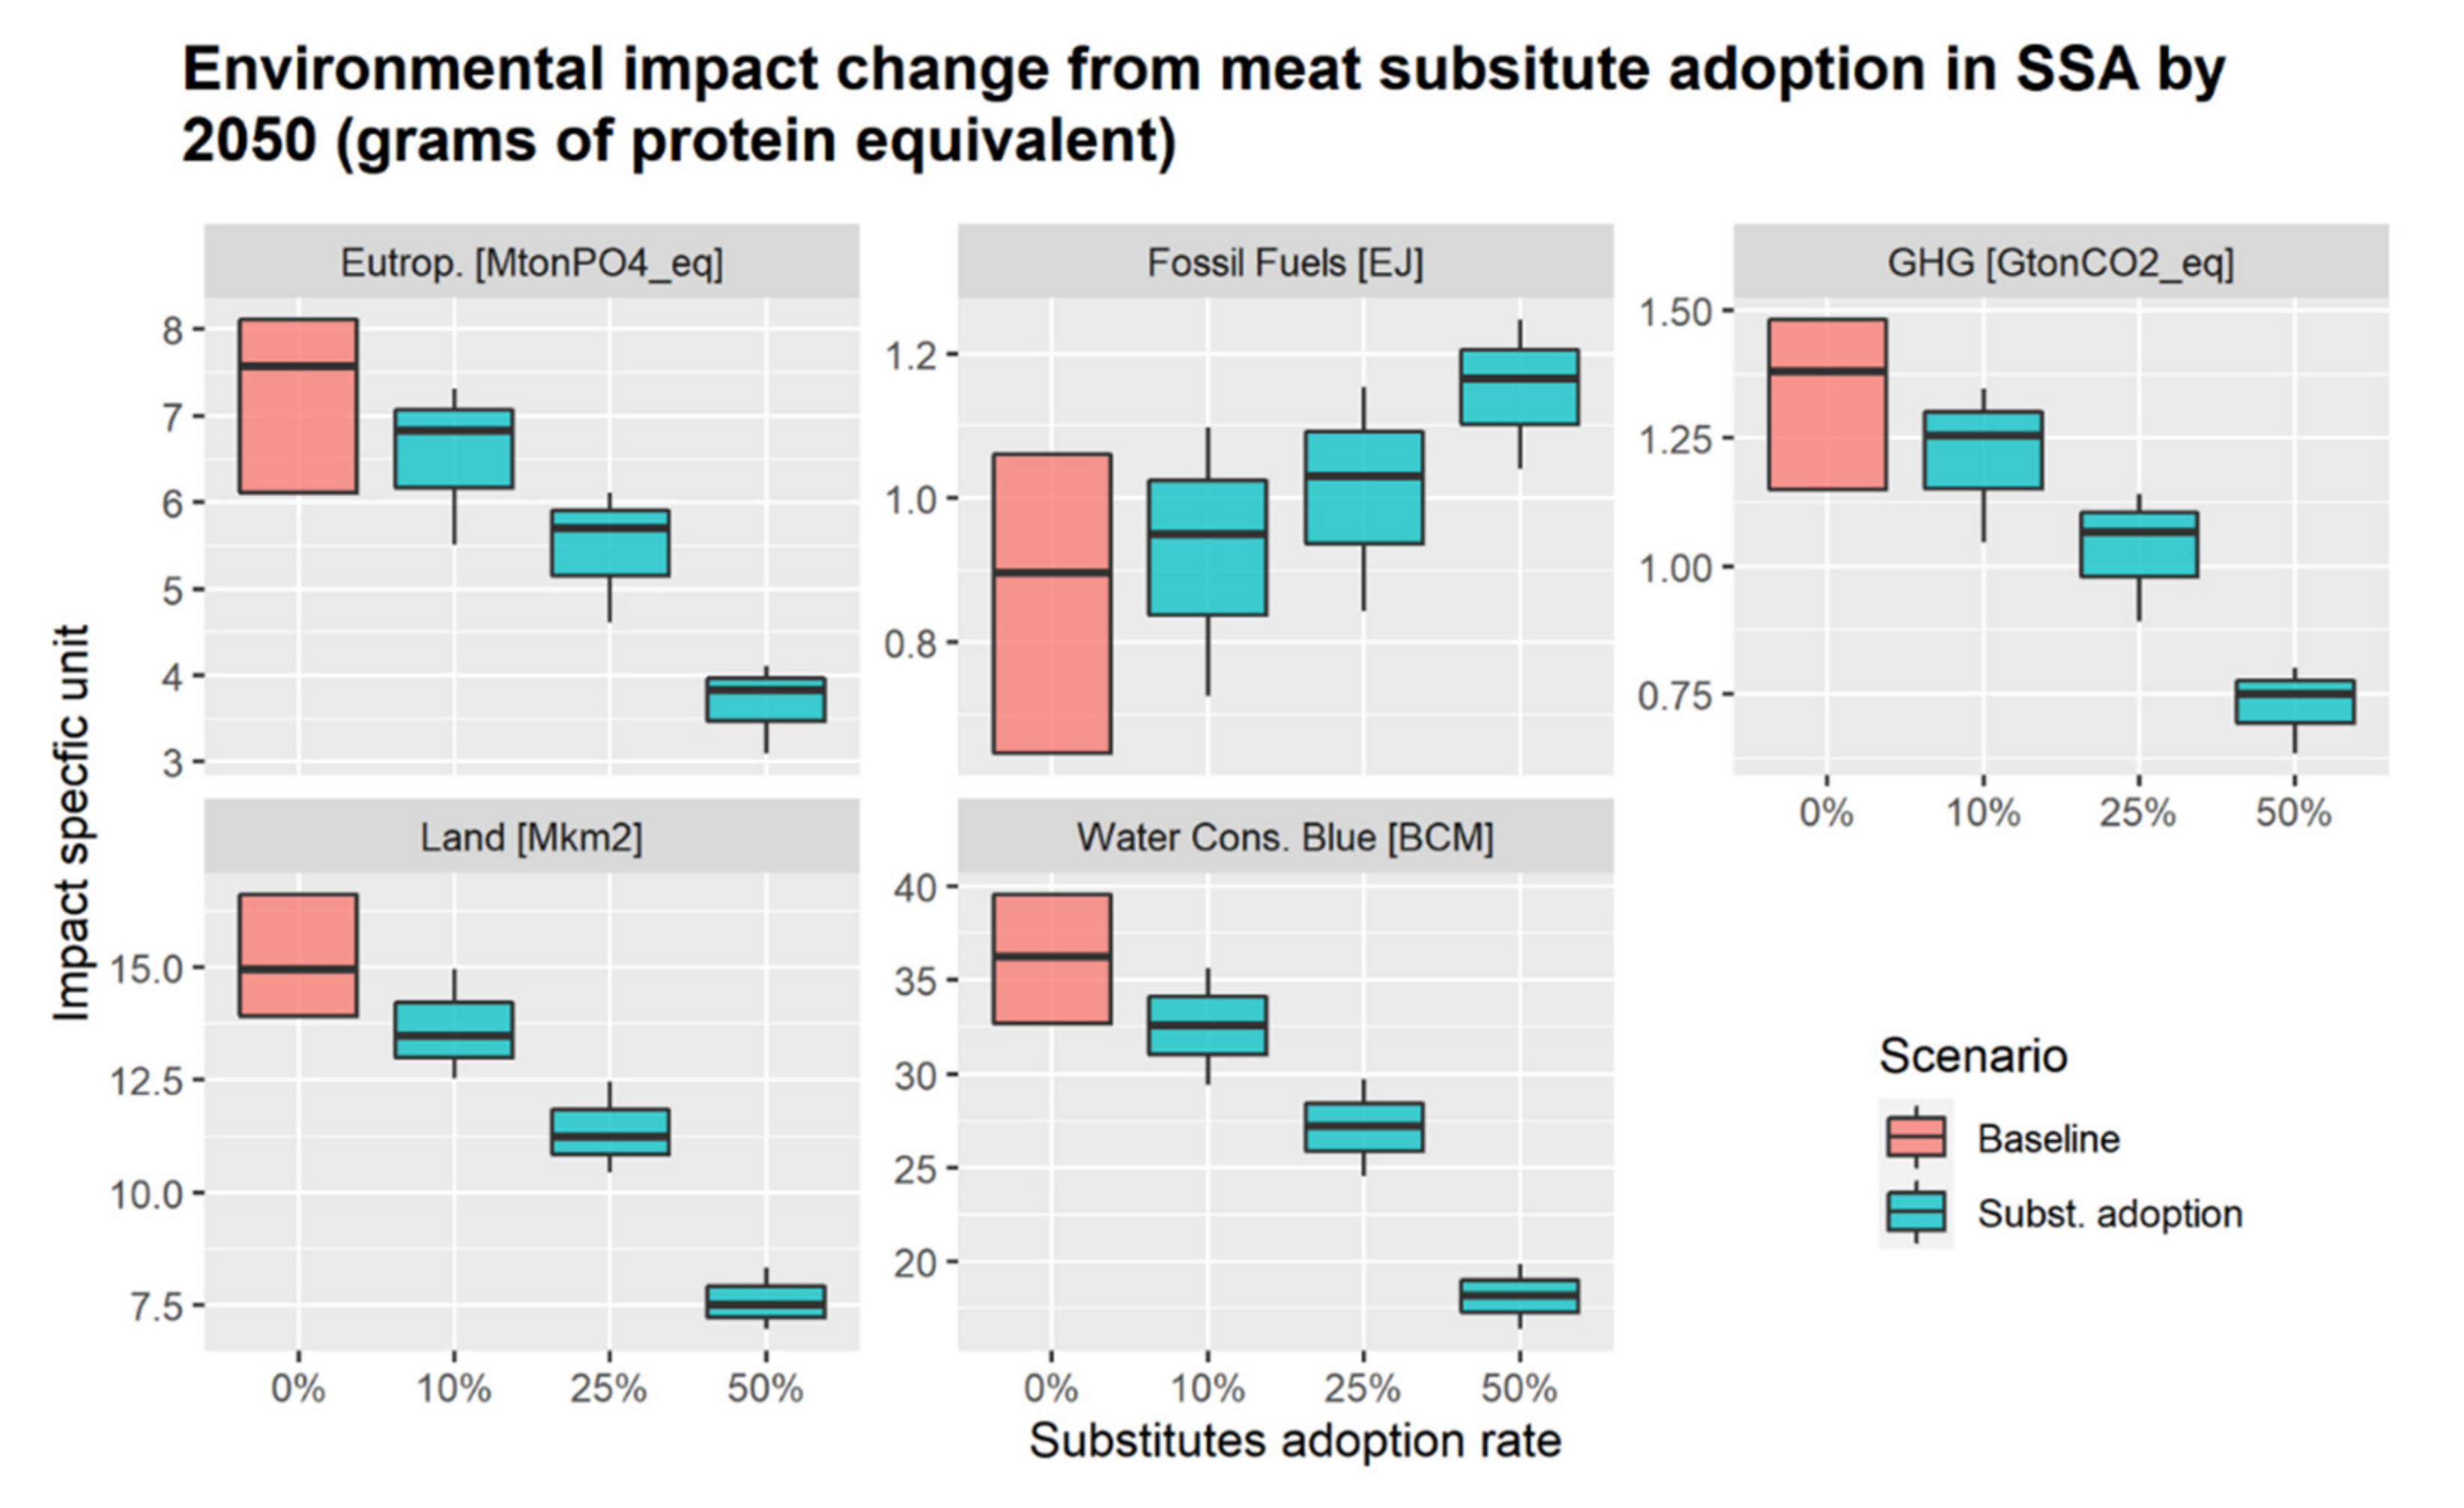
Figure 8 shows the change in environmental impact for each impact category relative to the baseline of 25th, 50th, and 75th percentiles of consumption and resources efficiency scenarios. The analysis shows that across all environmental impact categories but fossil fuels consumption, adoption of meat substitutes implies significant reductions in the 2050 environmental impact. In response to a 25% substitution, most (median) impacts show nearly linear reductions, with −24.9% for land and blue water, −22.8% for greenhouse gases emissions, and −24.7% for eutrophication at the 50th percentile of the impact distribution. Conversely, fossil energy consumption grows by 15% as—according to the compiled LCA database—the production of some of the substitutes is more energy-intensive than animal meat.
As previously highlighted by Figure 6A, CO2 emissions from fossil fuels combustion play a marginal role in the final GHG impact of meat. Therefore, irrespective of a larger fossil fuels consumption observed in the meat substitution scenarios presented in Figure 8, little impact from the combustion of those additional fossil fuels is observed on the final sectoral GHG emissions. Conversely, the final GHG emissions are strongly reduced due to the substantial decrease in the emission of other greenhouse gases in the meat supply chain (and chiefly CH4), which more than offset the larger fossil energy consumption. A decarbonization of the regional energy systems could also reduce the environmental impact of energy consumption for the production of meat substitutes.
4. Discussion
4.1. Policy Implications
Our results suggest that—in the absence of drastic resource efficiency or technological improvements—meat demand in SSA is bound to become a major reason for concern if environmental flows are to be preserved at a sustainable level.
However, what trends have been observed so far in SSA? The authors of [71] have highlighted that due to the steep economic growth of Ethiopia (at 6.8% in 2018), the share of food in the total consumption basket of households is declining, and yet total food quantities and calorie intakes have considerably increased between 1996 and 2011. The authors found that the growing household income is the driving force behind these trends, also highlighting that a shift towards animal products is actually occurring: This implies that households are complementing and expanding their diets, rather than substituting vegetal products. The authors of [72] focused on the impact of the urbanization process on diets in Tanzania, finding that urban migration is associated with a shift away from traditional staples towards more processed and ready-to-eat foods, and with increased consumption of both vegetables and animal-source foods. These studies hint at a “westernization” of diets in two rapidly growing economies of the region, consistently with the pathways introduced in this paper.
It is still too early to evaluate what pathways are being followed at a regional level: These are indeed due to a mix of several factors, including economic aspects (e.g., prices and availability) [73], behavioral factors (e.g., social norms and peer effects), and self-efficacy (self-control induced by external factors, e.g., information) [22], but also habits and ease-of-access [74], public policy implemented through non-coercive actions such as nudges—which can include changing physical microenvironments that affect meat purchase and consumption decisions [75]—taxation [76,77] or structured information campaigns aligning environmental and health messages [78].
Another significant role will be played by the quality and pace of global growth of plant-based meat substitutes (which generally have a significantly lower environmental impact than meat [79]) or in vitro cultured meat breakthroughs [80]. Our analysis on the adoption of these alternatives shows that at high levels of substitutes adoption there is nearly a linear reduction between the substitutes adoption rate and the reduction in environmental impact of most impact categories (and chiefly land use, blue water consumption, and eutrophication potential). Conversely, the substitution implies a significant growth in fossil fuels energy consumption, but such increase remains very marginal in terms of its GHG emission potential when compared to the reductions due to lower CH4 and N2O emissions.
Another relevant dimension to consider relates to the household energy requirements for cooking and the role of changing diets on those needs. Currently, about 900 million people in SSA rely on traditional biomass for cooking (wood, charcoal, dung or agricultural residues) [81], with significant health (390,000 premature deaths per year due to ambient pollution according to Collaborators, 2018) and environmental implications (498 million tons of fuelwood have been consumed in SSA in 2016, with a significant contribution to deforestation and land degradation trends). This energy use is also very inefficient. Thus, the cooking energy pathways and the dietary choices will thus play a major role in determining the cooking energy and environmental requirements, which are outside the scope of the analysis presented in this paper. For instance, it has been estimated that if households halt using biomass, greenhouse gases emissions from cooking will cut by at least half [82,83]. At the same time, in 2030, if households that will cook with electricity switch to pre-cooked food or low energy intensive diets, their final energy demand would become 50% lower.
4.2. Limitations and Future Research Prospects
As all other scenario-based forecasting assessments, the analysis carried out in this paper is characterized by multiple sources of uncertainty that can be mitigated but not completely eliminated. The first concerns the “inherited” uncertainty from modelled data on drivers for the future meat demand projection: While certain drivers are well understood, such as population growth dynamics, other are susceptible to exogenous shocks, and chiefly real GDP growth rates or food prices. In addition, our analysis can neither factor in drastic, unpredictable cultural changes that simply cannot be predicted when training a model on historical data.
A second layer of uncertainty concerns the data quality of the Exiobase hybrid tables and the relative environmental impact coefficients, grounded on intensive data dependency. These data are sometimes limited by data shortages, usually overcome by the adoption of strong assumptions necessary to balance the global-scale input-output table [84]. This issue is further exacerbated by the lack of consolidated data for African countries, which are lumped together in one unique averaged regional aggregation.
Relatedly, resource efficiency trends have a tremendous impact on environmental impact and the possibility that new technologies can disrupt existing paradigms and boost efficiency cannot be ruled out. In response to this source of uncertainty, our analysis includes different “target” efficiency levels to evaluate a broad range of efficiency outcomes.
Finally, also the meat substitutes assessment is affected by technological uncertainty: Research and development in innovative and low-impact food solutions is growing robustly, and ground-breaking technologies such as lab-cultured meat could become pervasive if costs fall sufficiently. Similarly, cultural attitudes and perception of these alternatives could also shift rapidly from the current situation.
Overall, we encourage future research in the field to address the key sources of uncertainty detailed above by endogenously modelling technological and cultural changes.
5. Conclusions
In this study, we have estimated the potential environmental and energy-related implications of a shift towards more meat-intensive diets in countries of SSA. To achieve this, we have evaluated the historical associations between economic growth and meat consumption in a set of countries that over the last decades have experienced a robust economic growth. We found that for beef, pork, poultry, and sheep meat, the levels of total consumption would reach a scenario-median of 19, 15, 21, and 8 kg/capita/year by 2050, respectively. Considering a representative average weight of 225 g per beef steak, 19 kg/capita/year are equivalent to slightly more than one beef steak per week. Not a very high intake, compared to most western diets.
Then, we calculated that—depending on the resources efficiency variants considered—global greenhouse gases emissions could require about 175% of today’s regional agriculture-related emissions), cropping and grazing-related land may require about one quarter of today’s global agricultural land), and blue water consumption would nearly double the current regional agricultural consumption. Moreover, the eutrophication potential would grow by 7.6 t PO4e/yr, and additional 0.9 EJ/yr of fossil fuels and 49 TWh/yr of electricity would be consumed.
These figures suggest that—in the absence of drastic resource efficiency or technological improvements—meat demand growth in SSA is bound to become a major global sustainability challenge. We have also shown that a partial substitution of the protein intake from the expected growth in meat consumption with plant-based alternatives carries additional significant potential for mitigating environmental impacts. Altogether, our main conclusion is that the policies affecting farming practices and dietary choices will have a significant impact on the SSA and global environmental flows.
It must be remarked that the impacts estimated here are only inclusive of potential changes in average per-capita consumption habits of SSA households. However, as suggested by the income elasticity of meat demand curves shown in Figure S3, it is possible that the increase in consumption at lower income levels will in the future be accompanied by a concomitant reduction in consumption at higher income levels. This is most apparent for beef, the type of meat with the highest environmental multipliers.
To conclude, it is worth noting that sustainable development embraces multiple dimensions, which are not limited to environmental aspects. Covering social aspects such as zero hunger and reduced inequalities are among the most urgent sustainable development goals highlighted in the 2030 Agenda of United Nations. Increased attention and awareness among the more affluent consumers could allow the poorest regions of the world to legitimately choose the paths of development desired by the multiplicity of their cultures, while continuing to pursue goals of reducing environmental impact on a global scale.
Supplementary Materials
The following are available online at https://0-www-mdpi-com.brum.beds.ac.uk/article/10.3390/su13137075/s1, Figure S1: Historical meat consumption pathways in a global perspective; Figure S2: Plots of out-of-bag (OOB) error rates and variable importance (VIMP) for the multivariate random forest model; Figure S3: Estimated income elasticity plots of meat demand (by meat type); Figure S4: Meat consumption in 2050 in sub-Saharan Africa according to three FAO scenarios, by meat type; Figure S5: Comparison of the meat consumption scenarios estimated in this paper with the FAO scenarios, by meat type; Figure S6: Dynamic convergence process towards environmental impact coefficients of reference regions; Figure S7: Production and efficiency variants considered in the impact assessment analysis; Figure S8: Meat specific environmental impacts. (A) Impacts related to beef consumption; (B) Impacts related to pig consumption; (C) Impacts related to poultry consumption; Figure S9: Allocation of Fossil Fuel resource use for fulfilling 2050 meat demand by local or import sector and allocation methodology; Table S1: RF model training results for each meat type; Table S2: RF model validation results—beef and buffalo; Table S3: RF model validation results—pigmeat; Table S4: RF model validation results—poultry; Table S5: RF model validation results—mutton and goat; Table S6: Technological efficiency variants; Table S7: Meat-based alternatives considered and their LCA environmental footprint; Table S8: Assumed protein values per kg of product.
Author Contributions
Conceptualization, methodology, resources, data curation, formal analysis, software, visualization, writing—original draft, writing—review and editing, G.F.; methodology, resources, data curation, formal analysis, software, writing—original draft, writing—review and editing, N.G.; methodology, writing—review and editing, M.V.R. All authors have read and agreed to the published version of the manuscript.
Funding
This research received no external funding.
Institutional Review Board Statement
Not applicable.
Informed Consent Statement
Not applicable.
Data Availability Statement
The R and Python code for replicating the analysis is hosted at the following public repository: https://github.com/giacfalk/MEAT_SSA, last updated in 20 February 2021. A data repository hosting input data, comma separated value files with the estimated pathways, and the resulting input-output impact matrixes is available on request from the authors.
Conflicts of Interest
The authors declare no conflict of interest.
References
- Allen, A.M.; Hof, A.R. Paying the price for the meat we eat. Environ. Sci. Policy 2019, 97, 90–94. [Google Scholar] [CrossRef]
- Anon 2017 FAO Food Balance Sheet. Available online: http://www.fao.org/faostat/en/#data/FBS (accessed on 15 March 2021).
- Behrens, P.; Kiefte-de Jong, J.C.; Bosker, T.; Rodrigues, J.F.; De Koning ATukker, A. Evaluating the environmental impacts of dietary recommendations. Proc. Natl. Acad. Sci. USA 2017, 114, 13412–13417. [Google Scholar] [CrossRef] [PubMed] [Green Version]
- Bhat, Z.F.; Kumar, S.; Bhat, H.F. In vitro meat: A future animal-free harvest. Crit. Rev. Food Sci. Nutr. 2017, 57, 782–789. [Google Scholar] [CrossRef]
- Bodirsky, B.L.; Rolinski, S.; Biewald, A.; Weindl, I.; Popp, A.; Lotze-Campen, H. Global food demand scenarios for the 21st century. PLoS ONE 2015, 10, e0139201. [Google Scholar] [CrossRef] [PubMed]
- Bolt, J.; Van Zanden, J.L. The Maddison Project: Collaborative research on historical national accounts. Econ. Hist. Rev. 2014, 67, 627–651. [Google Scholar] [CrossRef] [Green Version]
- Byamugisha, F.F. Securing Africa’s Land for Shared Prosperity: A Program to Scale Up Reforms and Investments; The World Bank: Washington, DC, USA, 2013. [Google Scholar]
- Caro, D.; Frederiksen, P.; Thomsen, M.; Pedersen, A.B. Toward a more consistent combined approach of reduction targets and climate policy regulations: The illustrative case of a meat tax in Denmark Environ. Sci. Policy 2017, 76, 78–81. [Google Scholar] [CrossRef]
- CleanTechnica. Botswana-Based Accite Holdings Brings Plant-Based Meat Revolution to Africa with beyond Meat CleanTechnica. 2020. Available online: https://cleantechnica.com/2020/01/22/botswana-based-accite-holdings-brings-plant-based-meat-revolution-to-africa-with-beyond-meat/ (accessed on 15 March 2021).
- Clonan, A.; Roberts, K.E.; Holdsworth, M. Socioeconomic and demographic drivers of red and processed meat consumption: Implications for health and environmental sustainability. Proc. Nutr. Soc. 2016, 75, 367–373. [Google Scholar] [CrossRef] [PubMed] [Green Version]
- Cockx, L.; Colen, L.; De Weerdt, J. From Corn to Popcorn? Urbanization and Food Consumption in Sub-Saharan Africa: Evidence from Rural-Urban Migrants in Tanzania; LICOS—Centre for Institutions and Economic Performance: Leuven, Belgium, 2017. [Google Scholar]
- GBD 2017 Risk Factor Collaborators. Global, regional, and national comparative risk assessment of 84 behavioural, environmental and occupational, and metabolic risks or clusters of risks for 195 countries and territories, 1990–2017: A systematic analysis for the Global Burden of Disease Study 2017. Lancet 2018, 392, 1923–1994. [Google Scholar]
- Cornelsen, L.; Alarcon, P.; Häsler, B.; Amendah, D.D.; Ferguson, E.; Fèvre, E.M.; Grace, D.; Dominguez-Salas, P.; Rushton, J. Cross-sectional study of drivers of animal-source food consumption in low-income urban areas of Nairobi, Kenya. BMC Nutr. 2016, 2, 70. [Google Scholar] [CrossRef] [Green Version]
- Dagnachew, A.G.; Hof, A.F.; Lucas, P.L.; van Vuuren, D.P. Scenario analysis for promoting clean cooking in Sub-Saharan Africa: Costs and benefits. Energy 2019, 192, 116641. [Google Scholar] [CrossRef]
- Desa, U. World Urbanization Prospects 2018; United Nations Department for Economic and Social Affairs: New York, NY, USA, 2018. [Google Scholar]
- Desiere, S.; Hung, Y.; Verbeke, W.; D’Haese, M. Assessing current and future meat and fish consumption in Sub-Sahara Africa: Learnings from FAO Food Balance Sheets and LSMS household survey data. Glob. Food Secur. 2018, 16, 116–126. [Google Scholar] [CrossRef] [Green Version]
- Dong, H.; Mangino, J.; McAllister, T.; Have, D. Emissions from livestock and manure management. In Intergovernmental Panel on Climate Change: 2006 IPCC Guidelines for National Greenhouse Gas Inventories; IPCC: Geneva, Switzerland, 2006; Volume 4, pp. 1–87. [Google Scholar]
- Eker, S.; Reese, G.; Obersteiner, M. Modelling the drivers of a widespread shift to sustainable diets. Nat. Sustain. 2019, 2, 725–735. [Google Scholar] [CrossRef] [Green Version]
- FAO. The State of the World’s Land and Water Resources for Food and Agriculture: Managing Systems at Risk; Earthscan: London, UK, 2011. [Google Scholar]
- FAO. The Future of Food and Agriculture: Alternative Pathways to 2050; FAO: Rome, Italy, 2018. [Google Scholar]
- FAOSTAT. FAOSTAT Database; Food and Agriculture Organization: Rome, Italy, 2017. [Google Scholar]
- Fukase, E.; Martin, W. Economic growth, convergence, and world food demand and supply. World Dev. 2020, 132, 104954. [Google Scholar] [CrossRef]
- Gallet, C.A. Meat Meets Meta: A Quantitative Review of the Price Elasticity of Meat. Am. J. Agric. Econ. 2010, 92, 258–272. [Google Scholar] [CrossRef]
- Gallet, C.A. The income elasticity of meat: A meta-analysis. Aust. J. Agric. Resour. Econ. 2010, 54, 477–490. [Google Scholar] [CrossRef] [Green Version]
- Gerbens-Leenes, P.; Mekonnen, M.; Hoekstra, A.Y. The water footprint of poultry, pork and beef: A comparative study in different countries and production systems. Water Resour. Ind. 2013, 1, 25–36. [Google Scholar] [CrossRef] [Green Version]
- Gerten, D.; Heck, V.; Jägermeyr, J.; Bodirsky, B.L.; Fetzer, I.; Jalava, M.; Kummu, M.; Lucht, W.; Rockström, J.; Schaphoff, S.; et al. Feeding ten billion people is possible within four terrestrial planetary boundaries. Nat. Sustain. 2020, 3, 200–208. [Google Scholar] [CrossRef]
- Gómez-Luciano, C.A.; de Aguiar, L.K.; Vriesekoop, F.; Urbano, B. Consumers’ willingness to purchase three alternatives to meat proteins in the United Kingdom, Spain, Brazil and the Dominican Republic. Food Qual. Prefer. 2019, 78, 103732. [Google Scholar] [CrossRef]
- Griffin, S. Assigning Panel Data to Training, Testing and Validation Groups for Machine Learning Models Medium. 2020. Available online: https://towardsdatascience.com/assigning-panel-data-to-training-testing-and-validation-groups-for-machine-learning-models-7017350ab86e (accessed on 15 March 2021).
- Hamilton, H.A.; Ivanova, D.; Stadler, K.; Merciai, S.; Schmidt, J.; van Zelm, R.; Moran, D.; Wood, R. Trade and the role of non-food commodities for global eutrophication. Nat. Sustain. 2018, 1, 314–321. [Google Scholar] [CrossRef]
- Heijungs, R.; Guinée, J.B.; Huppes, G.; Lankreijer, R.M.; Udo de Haes, H.A.; Wegener Sleeswijk, A.; Ansems, A.M.M.; Eggels, P.G.; Duin, R.; van De Goede, H.P. Environmental Life Cycle Assessment of Products: Guide and Backgrounds (Part 1); Centre of Environmental Science, Leiden University: Leiden, The Netherlands, 1992. [Google Scholar]
- Heiman, A.; Just, D.; McWilliams, B.; Zilberman, D. Religion, religiosity, lifestyles and food consumption. ARE Update 2004, 8, 9–11. [Google Scholar]
- Hitaj, C.; Rehkamp, S.; Canning, P.; Peters, C.J. Greenhouse gas emissions in the United States food system: Current and healthy diet scenarios. Environ. Sci. Technol. 2019, 53, 5493–5503. [Google Scholar] [CrossRef] [PubMed]
- Huijbregts, M.A.J. Life-Cycle Impact Assessment of Acidifying and Eutrophying Air Pollutants Calc. Characterisation Factors RAINS-LCA Interfaculty; Interfaculty Department of Environmental Science, Faculty of Environmental Science, University of Amsterdam: Amsterdam, The Netherlands, 1999. [Google Scholar]
- Van Huis, A. Insects as Food in Sub-Saharan Africa. Int. J. Trop. Insect Sci. 2003, 23, 163–185. [Google Scholar] [CrossRef]
- IEA. Africa Energy Outlook 2019. 2019. Available online: https://webstore.iea.org/africa-energy-outlook-2019 (accessed on 15 March 2021).
- Ishwaran, H.; Kogalur, U.B. Fast Unified Random Forests for Survival, Regression, and Classification (RF-SRC) (Manual). 2020. Available online: https://cran.r-project.org/package=randomForestSRC (accessed on 15 March 2021).
- Ivanova, D.; Stadler, K.; Steen-Olsen, K.; Wood, R.; Vita, G.; Tukker, A.; Hertwich, E.G. Environmental Impact Assessment of Household Consumption. J. Ind. Ecol. 2016, 20, 526–536. [Google Scholar] [CrossRef]
- Klein Goldewijk, K.; Beusen, A.; Doelman, J.; Stehfest, E. New anthropogenic land use estimates for the Holocene: HYDE 3.2. Earth Syst. Sci. Data 2017, 9, 927–953. [Google Scholar] [CrossRef] [Green Version]
- Maoz, Z.; Henderson, E.A. The world religion dataset, 1945–2010, Logic, estimates, and trends. Int. Interact. 2013, 39, 265–291. [Google Scholar] [CrossRef]
- Marques, A.C.; Fuinhas, J.A.; Pais, D.F. Economic growth, sustainable development and food consumption: Evidence across different income groups of countries. J. Clean. Prod. 2018, 196, 245–258. [Google Scholar] [CrossRef]
- Martinez, S.; del Mar Delgado, M.; Marin, R.M.; Alvarez, S. How do dietary choices affect the environment? The nitrogen footprint of the European Union and other dietary options. Environ. Sci. Policy 2019, 101, 204–210. [Google Scholar] [CrossRef]
- Mathijs, E. Exploring future patterns of meat consumption. Meat Sci. 2015, 109, 112–116. [Google Scholar] [CrossRef]
- Merciai, S.; Schmidt, J. Methodology for the Construction of Global Multi-Regional Hybrid Supply and Use Tables for the EXIOBASE v3 Database. J. Ind. Ecol. 2018, 22, 516–531. [Google Scholar] [CrossRef] [Green Version]
- Milford, A.B.; Le Mouël, C.; Bodirsky, B.L.; Rolinski, S. Drivers of meat consumption. Appetite 2019, 141, 104313. [Google Scholar] [CrossRef]
- Mulumba, P. Infinite Foods and the Growth of Plant-Based Protein Alternatives in Africa Longev. LIVE. 2020. Available online: https://longevitylive.com/anti-aging/infinite-foods-and-the-growth-of-plant-based-protein-alternatives-in-africa/ (accessed on 15 March 2021).
- Northfield, R. Is the future meatless? Eng. Technol. 2019, 14, 44–45. [Google Scholar] [CrossRef]
- OECD-FAO. Food and Organization a 2017 OECD-FAO Agricultural Outlook 2017–2026. OECD Publishing: Paris, France.
- Ouedraogo, N.S. Africa energy future: Alternative scenarios and their implications for sustainable development strategies. Energy Policy 2017, 106, 457–471. [Google Scholar] [CrossRef]
- Pachauri, R.K.; Allen, M.R.; Barros, V.R.; Broome, J.; Cramer, W.; Christ, R.; Church, J.A.; Clarke, L.; Dahe, Q.; Dasgupta, P. Contribution of Working Groups I, II and III to the Fifth Assessment Report of the Intergovernmental Panel on Climate Change. In Climate Change 2014, Synthesis Report; IPCC: Geneva, Switzerland, 2014. [Google Scholar]
- Pastor, A.V.; Palazzo, A.; Havlik, P.; Biemans, H.; Wada, Y.; Obersteiner, M.; Kabat, P.; Ludwig, F. The global nexus of food–trade–water sustaining environmental flows by 2050. Nat. Sustain. 2019, 2, 499–507. [Google Scholar] [CrossRef] [Green Version]
- Pew Research Center. The Future of World Religions: Population Growth: Projections 2010–2050; Pew Research Center: Washington, DC, USA, 2015. [Google Scholar]
- Poore, J.; Nemecek, T. Reducing food’s environmental impacts through producers and consumers. Science 2018, 360, 987–992. [Google Scholar] [CrossRef] [Green Version]
- Ramirez, C.; Patel, M.; Blok, K. How much energy to process one pound of meat? A comparison of energy use and specific energy consumption in the meat industry of four European countries. Energy 2006, 31, 2047–2063. [Google Scholar] [CrossRef] [Green Version]
- Raphaely, T. Impact of Meat Consumption on Health and Environmental Sustainability; IGI Global: Hershey, PA, USA, 2015. [Google Scholar]
- Rees, J.H.; Bamberg, S.; Jäger, A.; Victor, L.; Bergmeyer, M.; Friese, M. Breaking the habit: On the highly habitualized nature of meat consumption and implementation intentions as one effective way of reducing it. Basic Appl. Soc. Psychol. 2018, 40, 136–147. [Google Scholar] [CrossRef]
- Rehkamp, S.; Canning, P. Measuring embodied blue water in American diets: An EIO supply chain approach. Ecol. Econ. 2018, 147, 179–188. [Google Scholar] [CrossRef]
- Reuters. Can Africa Deal with an Expected Boom in Demand for Meat? 2017. Available online: https://www.reuters.com/article/us-africa-food-livestock-idUSKBN16K1V3 (accessed on 15 March 2021).
- Revell, B.J. One man’s meat… 2050? Ruminations on future meat demand in the context of global warming. J. Agric. Econ. 2015, 66, 573–614. [Google Scholar] [CrossRef]
- Riahi, K.; Van Vuuren, D.P.; Kriegler, E.; Edmonds, J.; O’Neill, B.C.; Fujimori, S.; Bauer, N.; Calvin, K.; Dellink, R.; Fricko, O.; et al. The shared socioeconomic pathways and their energy, land use, and greenhouse gas emissions implications: An overview. Glob. Environ. Chang. 2017, 42, 153–168. [Google Scholar] [CrossRef] [Green Version]
- Röös, E.; Bajželj, B.; Smith, P.; Patel, M.; Little, D.; Garnett, T. Greedy or needy? Land use and climate impacts of food in 2050 under different livestock futures. Glob. Environ. Chang. 2017, 47, 1–12. [Google Scholar] [CrossRef]
- Rose, D. Environmental nudges to reduce meat demand. Lancet Planet. Health 2018, 2, e374–e375. [Google Scholar] [CrossRef]
- Sans, P.; Combris, P. World meat consumption patterns: An overview of the last fifty years (1961–2011). Meat Sci. 2015, 109, 106–111. [Google Scholar] [CrossRef] [Green Version]
- Schepelmann, P.; Vercalsteren, A.; Acosta-Fernandez, J.; Saurat, M.; Boonen, K.; Christis, M.; Marin, G.; Zoboli, R.; Maguire, C. Driving Forces of Changing Environmental Pressures from Consumption in the European Food System. Sustainability 2020, 12, 8265. [Google Scholar] [CrossRef]
- Schroeder, T.; Tonsor, G.; Mintert, J. Beef Demand: Recent Determinants and Future Drivers. Available online: https://agmanager.info/beef-demand-recent-determinants-and-future-drivers-cattle-industry-summer-conference-general-session (accessed on 15 March 2021).
- Simo-Kengne, B.; Dikgang, J.; Ofstad, S.P. Causal Relationship between Meat Consumption and Economic Growth in SEAFO Countries: Evidence from Panel Granger Causality Test. 2015. Available online: 2015.essa.org.za/fullpaper/essa_3072.pdf (accessed on 15 March 2021).
- Smetana, S.; Mathys, A.; Knoch, A.; Heinz, V. Meat alternatives: Life cycle assessment of most known meat substitutes. Int. J. Life Cycle Assess. 2015, 20, 1254–1267. [Google Scholar] [CrossRef]
- Springer, N.P.; Duchin, F. Feeding nine billion people sustainably: Conserving land and water through shifting diets and changes in technologies. Environ. Sci. Technol. 2014, 48, 4444–4451. [Google Scholar] [CrossRef] [PubMed]
- Springmann, M.; Wiebe, K.; Mason-D’Croz, D.; Sulser, T.B.; Rayner, M.; Scarborough, P. Health and nutritional aspects of sustainable diet strategies and their association with environmental impacts: A global modelling analysis with country-level detail. Lancet Planet. Health 2018, 2, e451–e461. [Google Scholar] [CrossRef] [Green Version]
- Stadler, K. Pymrio-a Python module for automating input output calculations and generating reports. In Proceedings of the Adjunct Proceedings of the 29th EnviroInfo and 3rd ICT4S Conference 2015, Copenhagen, Denmark, 7–9 September 2015; p. 235. [Google Scholar]
- Stadler, K.; Wood, R.; Bulavskaya, T.; Södersten, C.-J.; Simas, M.; Schmidt, S.; Usubiaga, A.; Acosta-Fernández, J.; Kuenen, J.; Bruckner, M.; et al. EXIOBASE 3, Developing a Time Series of Detailed Environmentally Extended Multi-Regional Input-Output Tables. J. Ind. Ecol. 2018, 22, 502–515. [Google Scholar] [CrossRef] [Green Version]
- Stubbs, R.; Scott, S.; Duarte, C. Responding to food, environment and health challenges by changing meat consumption behaviours in consumers. Nutr. Bull. 2018, 43, 125–134. [Google Scholar] [CrossRef]
- Taljaard, P.R.; Jooste, A.; Asfaha, T. Towards a broader understanding of South African consumer spending on meat. Agrekon 2006, 45, 214–224. [Google Scholar] [CrossRef]
- Tongwane, M.I.; Moeletsi, M.E. A review of greenhouse gas emissions from the agriculture sector in Africa. Agric. Syst. 2018, 166, 124–134. [Google Scholar] [CrossRef]
- Valin, H. Future Food Demand Drivers and Pathways towards Sustainability Background Note. In Proceedings of the United Nations Expert Group Meeting on Population, Food Security, Nutrition and Sustainable Development for Sustainable Development, New York, NY, USA, 16–17 September 2019. [Google Scholar]
- Vranken, L.; Avermaete, T.; Petalios, D.; Mathijs, E. Curbing global meat consumption: Emerging evidence of a second nutrition transition. Environ. Sci. Policy 2014, 39, 95–106. [Google Scholar] [CrossRef]
- De Vries, M.; de Boer, I.J. Comparing environmental impacts for livestock products: A review of life cycle assessments. Livest. Sci. 2010, 128, 1–11. [Google Scholar] [CrossRef]
- Westhoek, H.; Lesschen, J.P.; Rood, T.; Wagner, S.; De Marco, A.; Murphy-Bokern, D.; Leip, A.; van Grinsven, H.; Sutton, M.A.; Oenema, O. Food choices, health and environment: Effects of cutting Europe’s meat and dairy intake. Glob. Environ. Chang. 2014, 26, 196–205. [Google Scholar] [CrossRef] [Green Version]
- Willett, W.; Rockström, J.; Loken, B.; Springmann, M.; Lang, T.; Vermeulen, S.; Garnett, T.; Tilman, D.; DeClerck, F.; Wood, A.; et al. Food in the Anthropocene: The EAT–Lancet Commission on healthy diets from sustainable food systems. Lancet 2019, 393, 447–492. [Google Scholar] [CrossRef]
- Wood, R.; Stadler, K.; Bulavskaya, T.; Lutter, S.; Giljum, S.; De Koning, A.; Kuenen, J.; Schütz, H.; Acosta-Fernández, J.; Usubiaga, A.; et al. Global Sustainability Accounting—Developing EXIOBASE for Multi-Regional Footprint Analysis. Sustainability 2015, 7, 138–163. [Google Scholar] [CrossRef] [Green Version]
- Worku, I.H.; Dereje, M.; Minten BHirvonen, K. Diet transformation in Africa: The case of Ethiopia. Agric. Econ. 2017, 48, 73–86. [Google Scholar] [CrossRef] [Green Version]
- World Bank. World Bank Data. 2019. Available online: https://data.worldbank.org/ (accessed on 15 March 2021).
- World Economic Forum. Meat: The Future Series—Alternative Proteins World Econ. Forum. 2019. Available online: https://www.weforum.org/whitepapers/meat-the-future-series-alternative-proteins/ (accessed on 15 March 2021).
- WWF. Appetite for Destruction. 2017. Available online: https://www.wwf.org.uk/sites/default/files/2017-10/WWF_AppetiteForDestruction_Summary_Report_SignOff.pdf (accessed on 15 March 2021).
- Xiong, J.; Thenkabail, P.; Tilton, J.; Gumma, M.; Teluguntla, P.; Oliphant, A.; Congalton, R.; Yadav, K.; Gorelick, N. Nominal 30-m cropland extent map of continental Africa by integrating pixel-based and object-based algorithms using Sentinel-2 and Landsat-8 data on Google Earth Engine. Remote Sens. 2017, 9, 1065. [Google Scholar] [CrossRef] [Green Version]
Figure 1.
Historical evolution of meat consumption in sub-Saharan Africa. (A) Per-capita meat-consumption, by meat type; (B) population; (C) total meat consumption, by meat type.
Figure 1.
Historical evolution of meat consumption in sub-Saharan Africa. (A) Per-capita meat-consumption, by meat type; (B) population; (C) total meat consumption, by meat type.

Figure 2.
Schematic cascade representation of the analysis carried out in this paper.

Figure 3.
Schematic framework of the analysis carried out to estimate environmental impacts on meat consumption to 2050 in sub-Saharan Africa. (A) Main data inputs to the statistical modelling of meat demand and projection of pathways for SSA to 2050. (B) Environmentally extended input output analysis (EEIO) carried out in hybrid units for the reported impact categories. (C) Simulation of meat substitutes adoption and relative environmental impact change. Dark blue blocks identify input data; red blocks refer to model-based analysis; green blocks define final environmental impacts results.

Figure 4.
Estimated consumption pathways. Resulting pathways of meat consumption until 2050 in SSA, by meat type. (A): Per-capita consumption (kg/capita/year); (B) total consumption (Kt/year), inclusive of population growth. The scenarios from the FAO Future of Food and Agriculture: Alternative Pathways to 2050 report are visualized for comparison in Figures S4 and S5.

Figure 5.
Distribution of the estimated additional local environmental impacts across scenarios 2050 from meat consumption growth in sub-Saharan Africa. Distribution of additional (i.e., on top of today’s levels) impacts across the five categories analyzed for 2020, 2030, 2040, and 2050 by consumption and resources efficiency scenarios for sub-Saharan Africa.

Figure 6.
(A) Distribution of fossil fuels consumption across world regions for a set of aggregated final use sectors. (B) Distribution of LCA greenhouse gases emissions for the four GHGs considered: CO2 (biogenic and fossil fuels), N2O, and CH4.
Figure 6.
(A) Distribution of fossil fuels consumption across world regions for a set of aggregated final use sectors. (B) Distribution of LCA greenhouse gases emissions for the four GHGs considered: CO2 (biogenic and fossil fuels), N2O, and CH4.

Figure 7.
Comparison of estimated impacts by 2050 with current environmental flows in sub-Saharan Africa. The boxplot compares the magnitude of the current regional environmental flows analyzed in this study (data sources: [43,60,61,62] with the range of impacts estimated for year 2050 under all the demand and resources efficiency scenarios.

Figure 8.
Change in the environmental impact of different levels of penetration of plant-based meat alternatives relative to baseline meat consumption scenarios. Facets distinguish the impact categories; filled colors identify the baseline vs. the substitutes adoption scenarios.
Figure 8.
Change in the environmental impact of different levels of penetration of plant-based meat alternatives relative to baseline meat consumption scenarios. Facets distinguish the impact categories; filled colors identify the baseline vs. the substitutes adoption scenarios.

Publisher’s Note: MDPI stays neutral with regard to jurisdictional claims in published maps and institutional affiliations. |
© 2021 by the authors. Licensee MDPI, Basel, Switzerland. This article is an open access article distributed under the terms and conditions of the Creative Commons Attribution (CC BY) license (https://creativecommons.org/licenses/by/4.0/).
Share and Cite
MDPI and ACS Style
Falchetta, G.; Golinucci, N.; Rocco, M.V. Environmental and Energy Implications of Meat Consumption Pathways in Sub-Saharan Africa. Sustainability 2021, 13, 7075. https://0-doi-org.brum.beds.ac.uk/10.3390/su13137075
AMA Style
Falchetta G, Golinucci N, Rocco MV. Environmental and Energy Implications of Meat Consumption Pathways in Sub-Saharan Africa. Sustainability. 2021; 13(13):7075. https://0-doi-org.brum.beds.ac.uk/10.3390/su13137075
Chicago/Turabian StyleFalchetta, Giacomo, Nicolò Golinucci, and Matteo Vincenzo Rocco. 2021. "Environmental and Energy Implications of Meat Consumption Pathways in Sub-Saharan Africa" Sustainability 13, no. 13: 7075. https://0-doi-org.brum.beds.ac.uk/10.3390/su13137075
Note that from the first issue of 2016, this journal uses article numbers instead of page numbers. See further details here.