
Implementation of Sustainability Indicators in Engineering Education Using a Combined Balanced Scorecard and Quality Function Deployment Approaches


Abstract
:1. Introduction
2. Materials and Methods
2.1. Balanced Scorecard Approach
- Customer perspective for creating value and differentiation from the perspective of the customer.
- Internal process perspective for various educational and academic processes to attain customer and shareholder satisfaction.
- Innovation and learning perspective to create an environment that supports organizational change, innovation, and growth.
- Financial perspective for gaining money, reducing costs, maximizing asset utilization, and minimizing risks.
2.2. Sustainability Triple Bottom Line
- Positive impact on the socio-cultural development of the society.
- Negative ecological footprint on the society.
- Positive impact on the economic sustainability of the society.
“A learning process based on the ideals and principles that underlie sustainability and is concerned with all levels and types of learning to provide quality education and foster sustainable human development—learning to know, learning to be, learning to live together, learning to do and learning to transform oneself and society”.
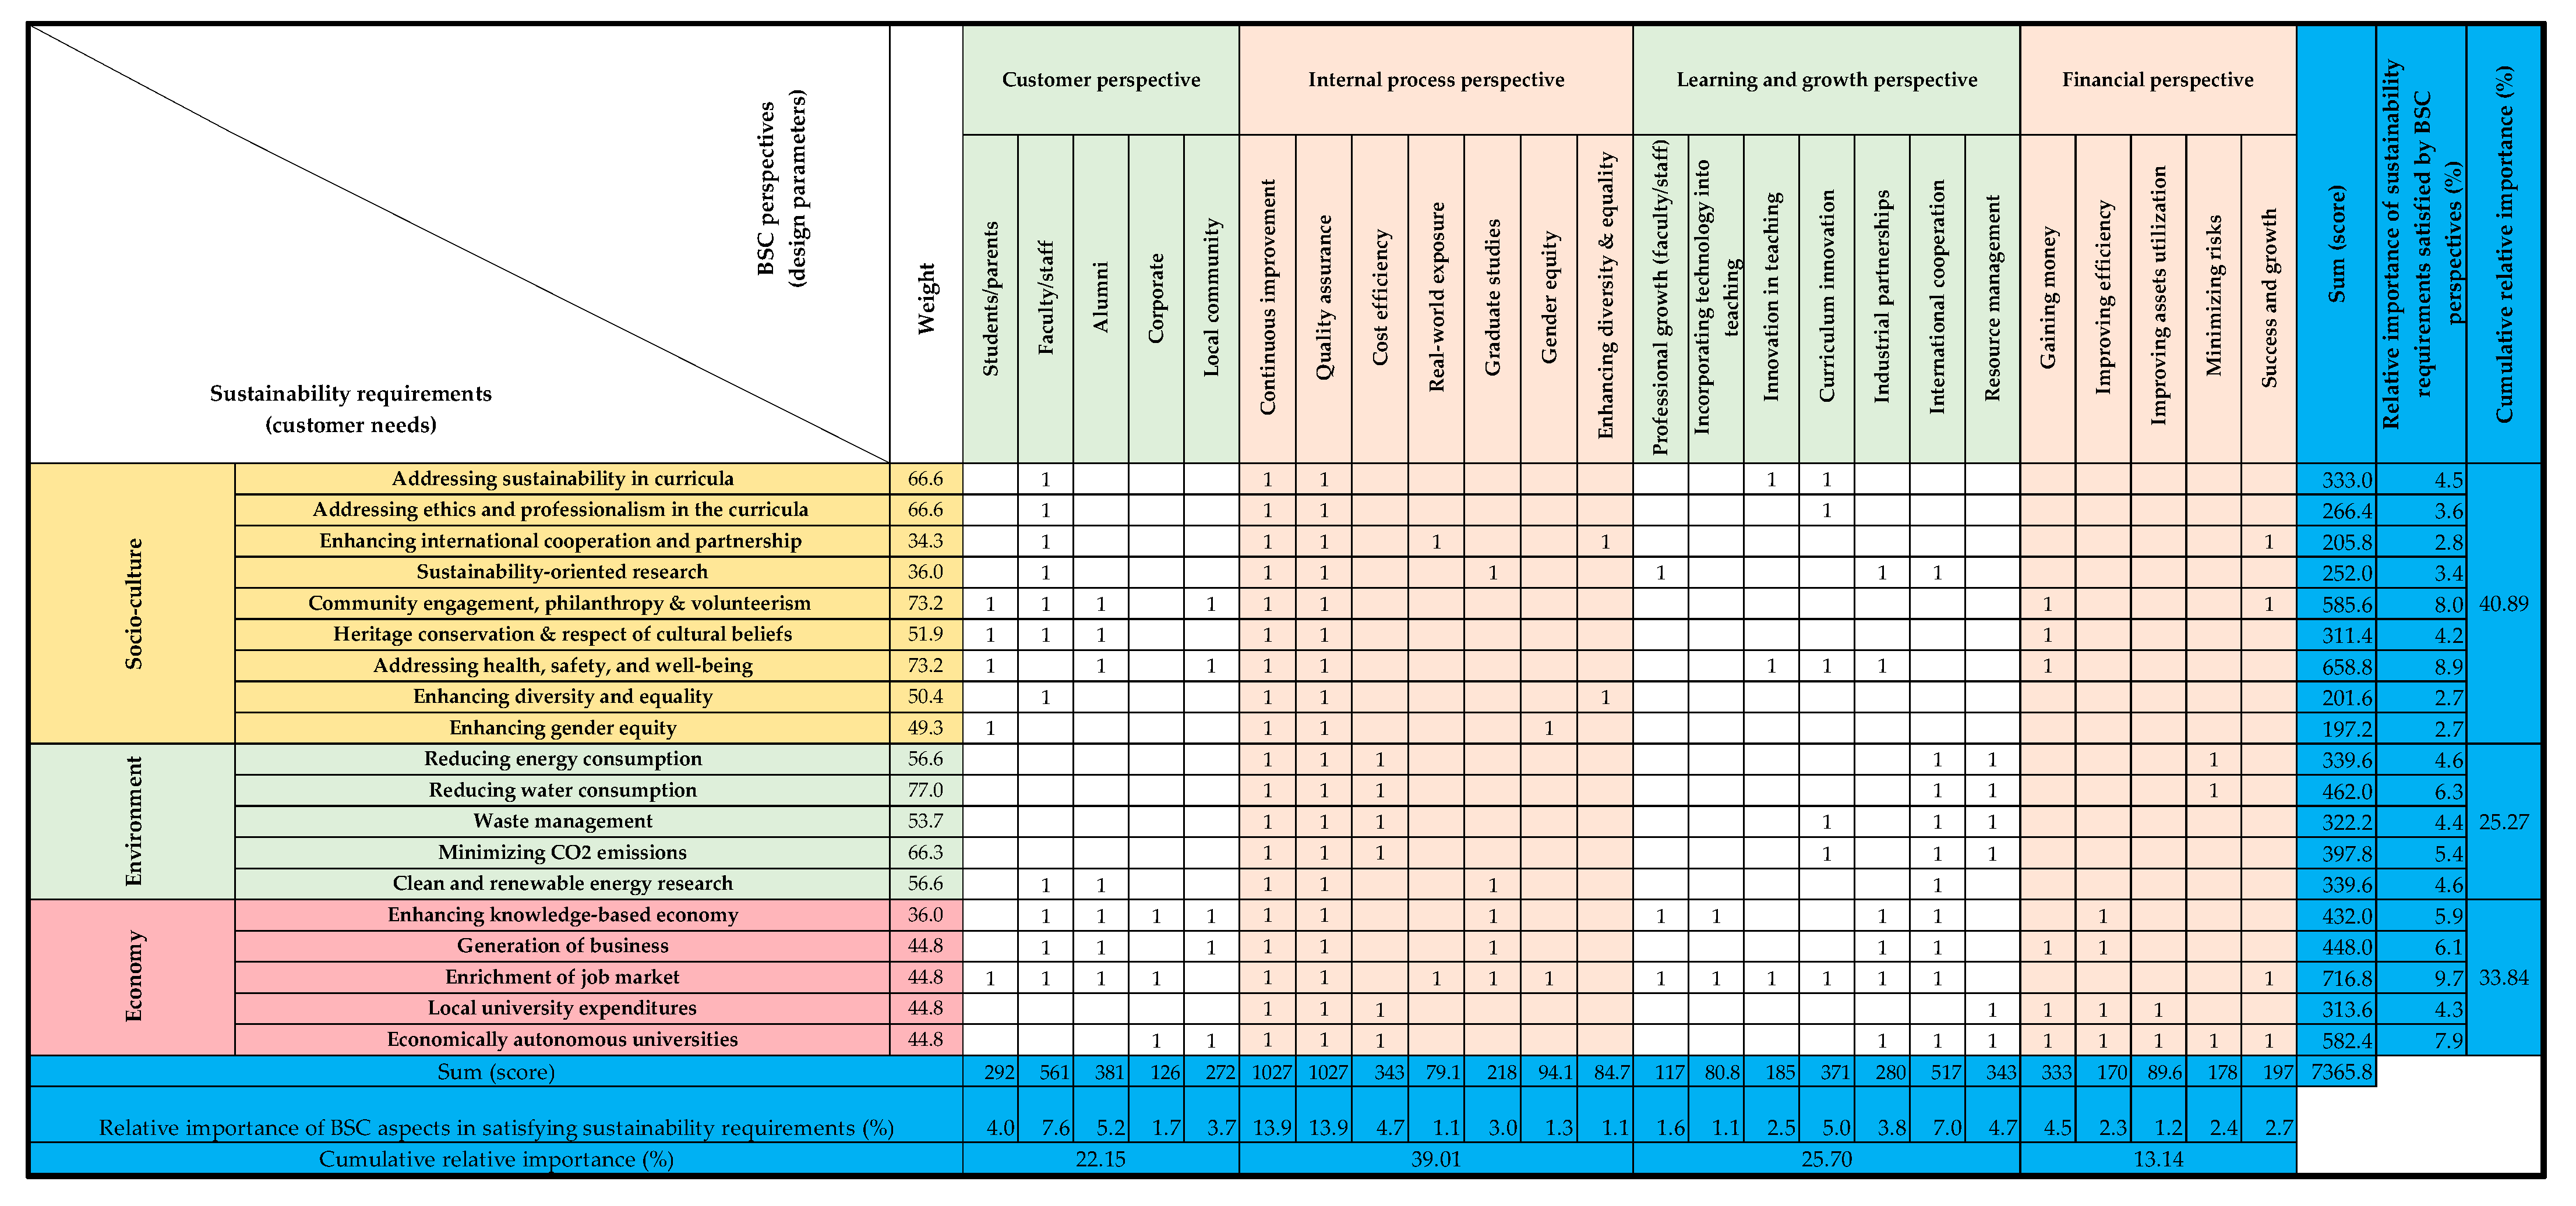
2.3. Quality Function Deployment
- Step 1: Identify the customer requirements/needs (WHATs), also called the voice of the customer (VOC), which are represented by the sustainability requirements of the society from an engineering education institute. Based on the work presented in [6] and the faculty interviews a set of 28 customer requirements were specified. The interviews were carried out with twenty faculty members and were face-to-face in their offices during the first week of April 2020. The purpose was to identify the most relevant customer requirements from an engineering education system. Based on the previous work of the authors in [6], the interviewees were asked to allocate a value between 0 and 7 to a set of proposed requirements to indicate their relevance and did not seek to generalize. The sample included professors (8), associate professors (7), assistant professors (4), and lecturers (1) from aerospace, chemical, civil, electrical, industrial, mechanical, and mining engineering departments. Table 6 represents the average and the standard deviation of the responses; ordered by the highest average. Due to the limited size of the sample under consideration and the fact that all interviewees are faculty members, an alternative approach, described in step 4, was used to prioritize those customer requirements with high averages and low standard deviation values.
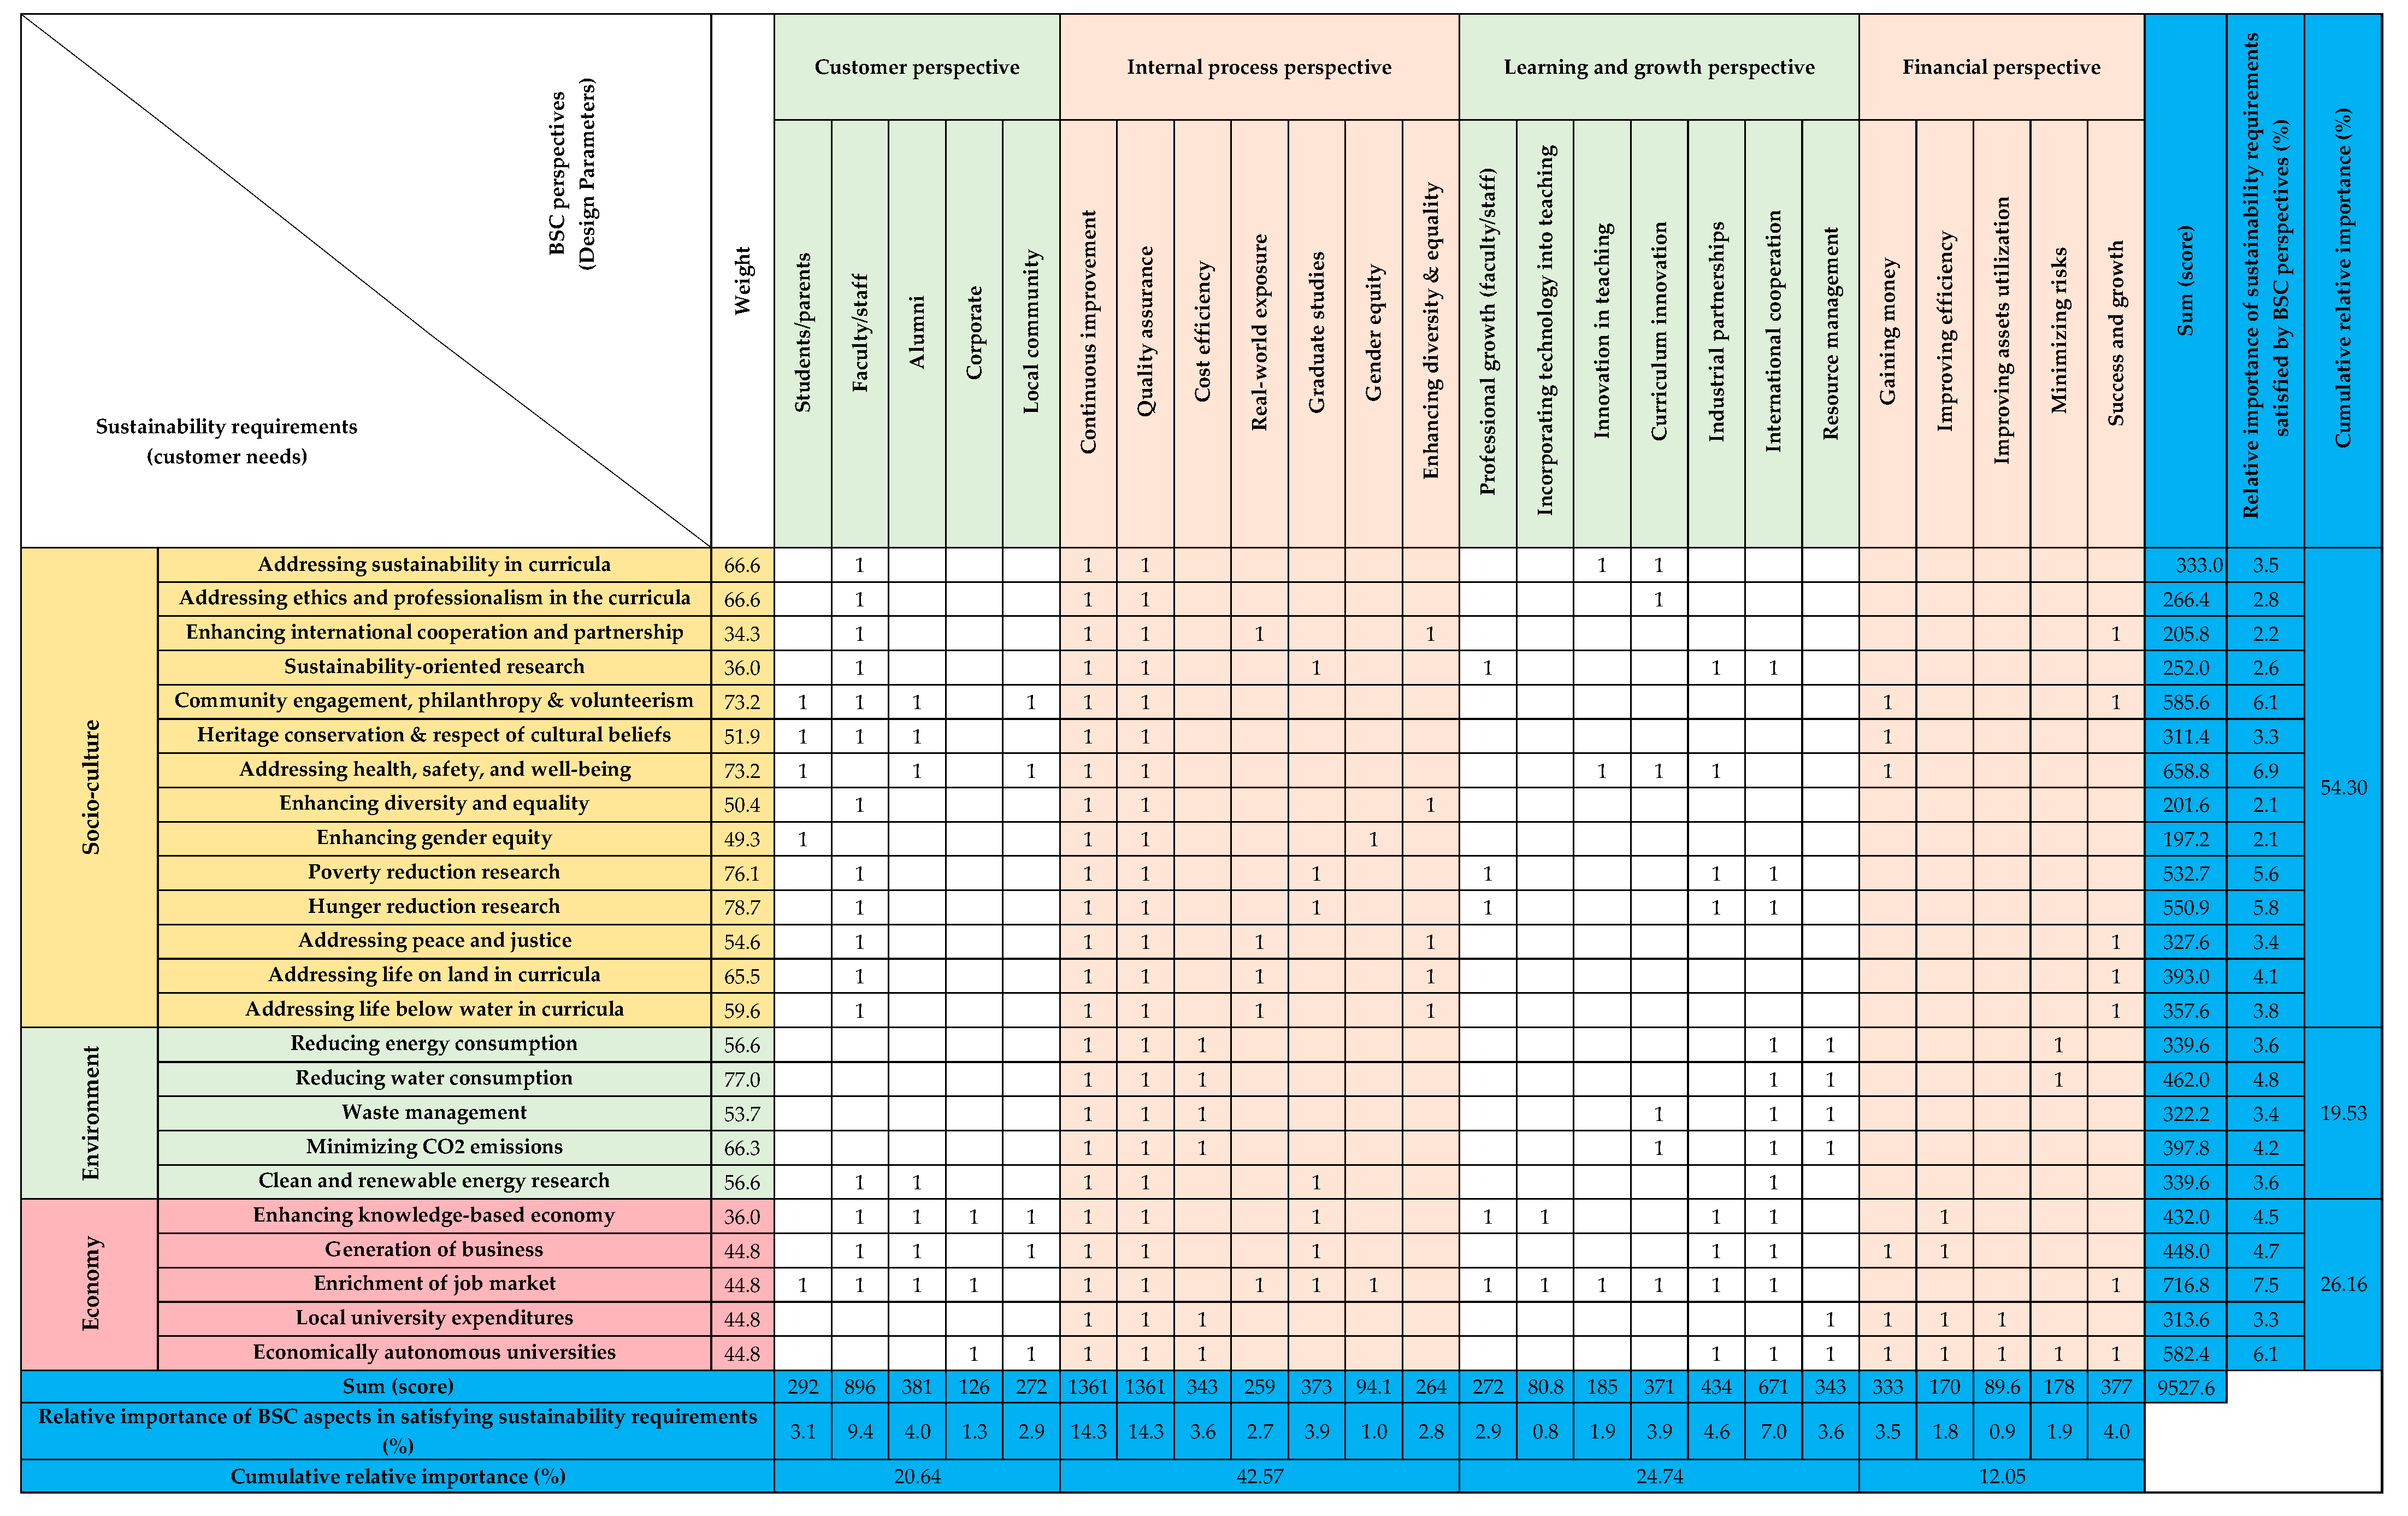
- Step 2: Define the managerial characteristics of the educational process using the BSC of the institute (HOWs) to meet the WHATs.
- Step 3: Determine the relationships between the WHATs and HOWs. A value of ONE is assigned if a HOW (or a BSC element) can help in achieving a certain WHAT (i.e., a customer requirement or a sustainability TBL element); otherwise, a null value is assigned. This is a simplification from the original QFD where the relationships between WHATs and HOWs could be Strong, Medium, or Weak and are assigned a value of 9, 3, 1, or 0 (blank), respectively.
- Step 4: Benchmark the WHATs, by rating/prioritizing different customer or sustainability requirements. This is normally carried out using the pairwise comparison charts [39] with the multi-voting approach. The process used in the present research is explained later in this paper.
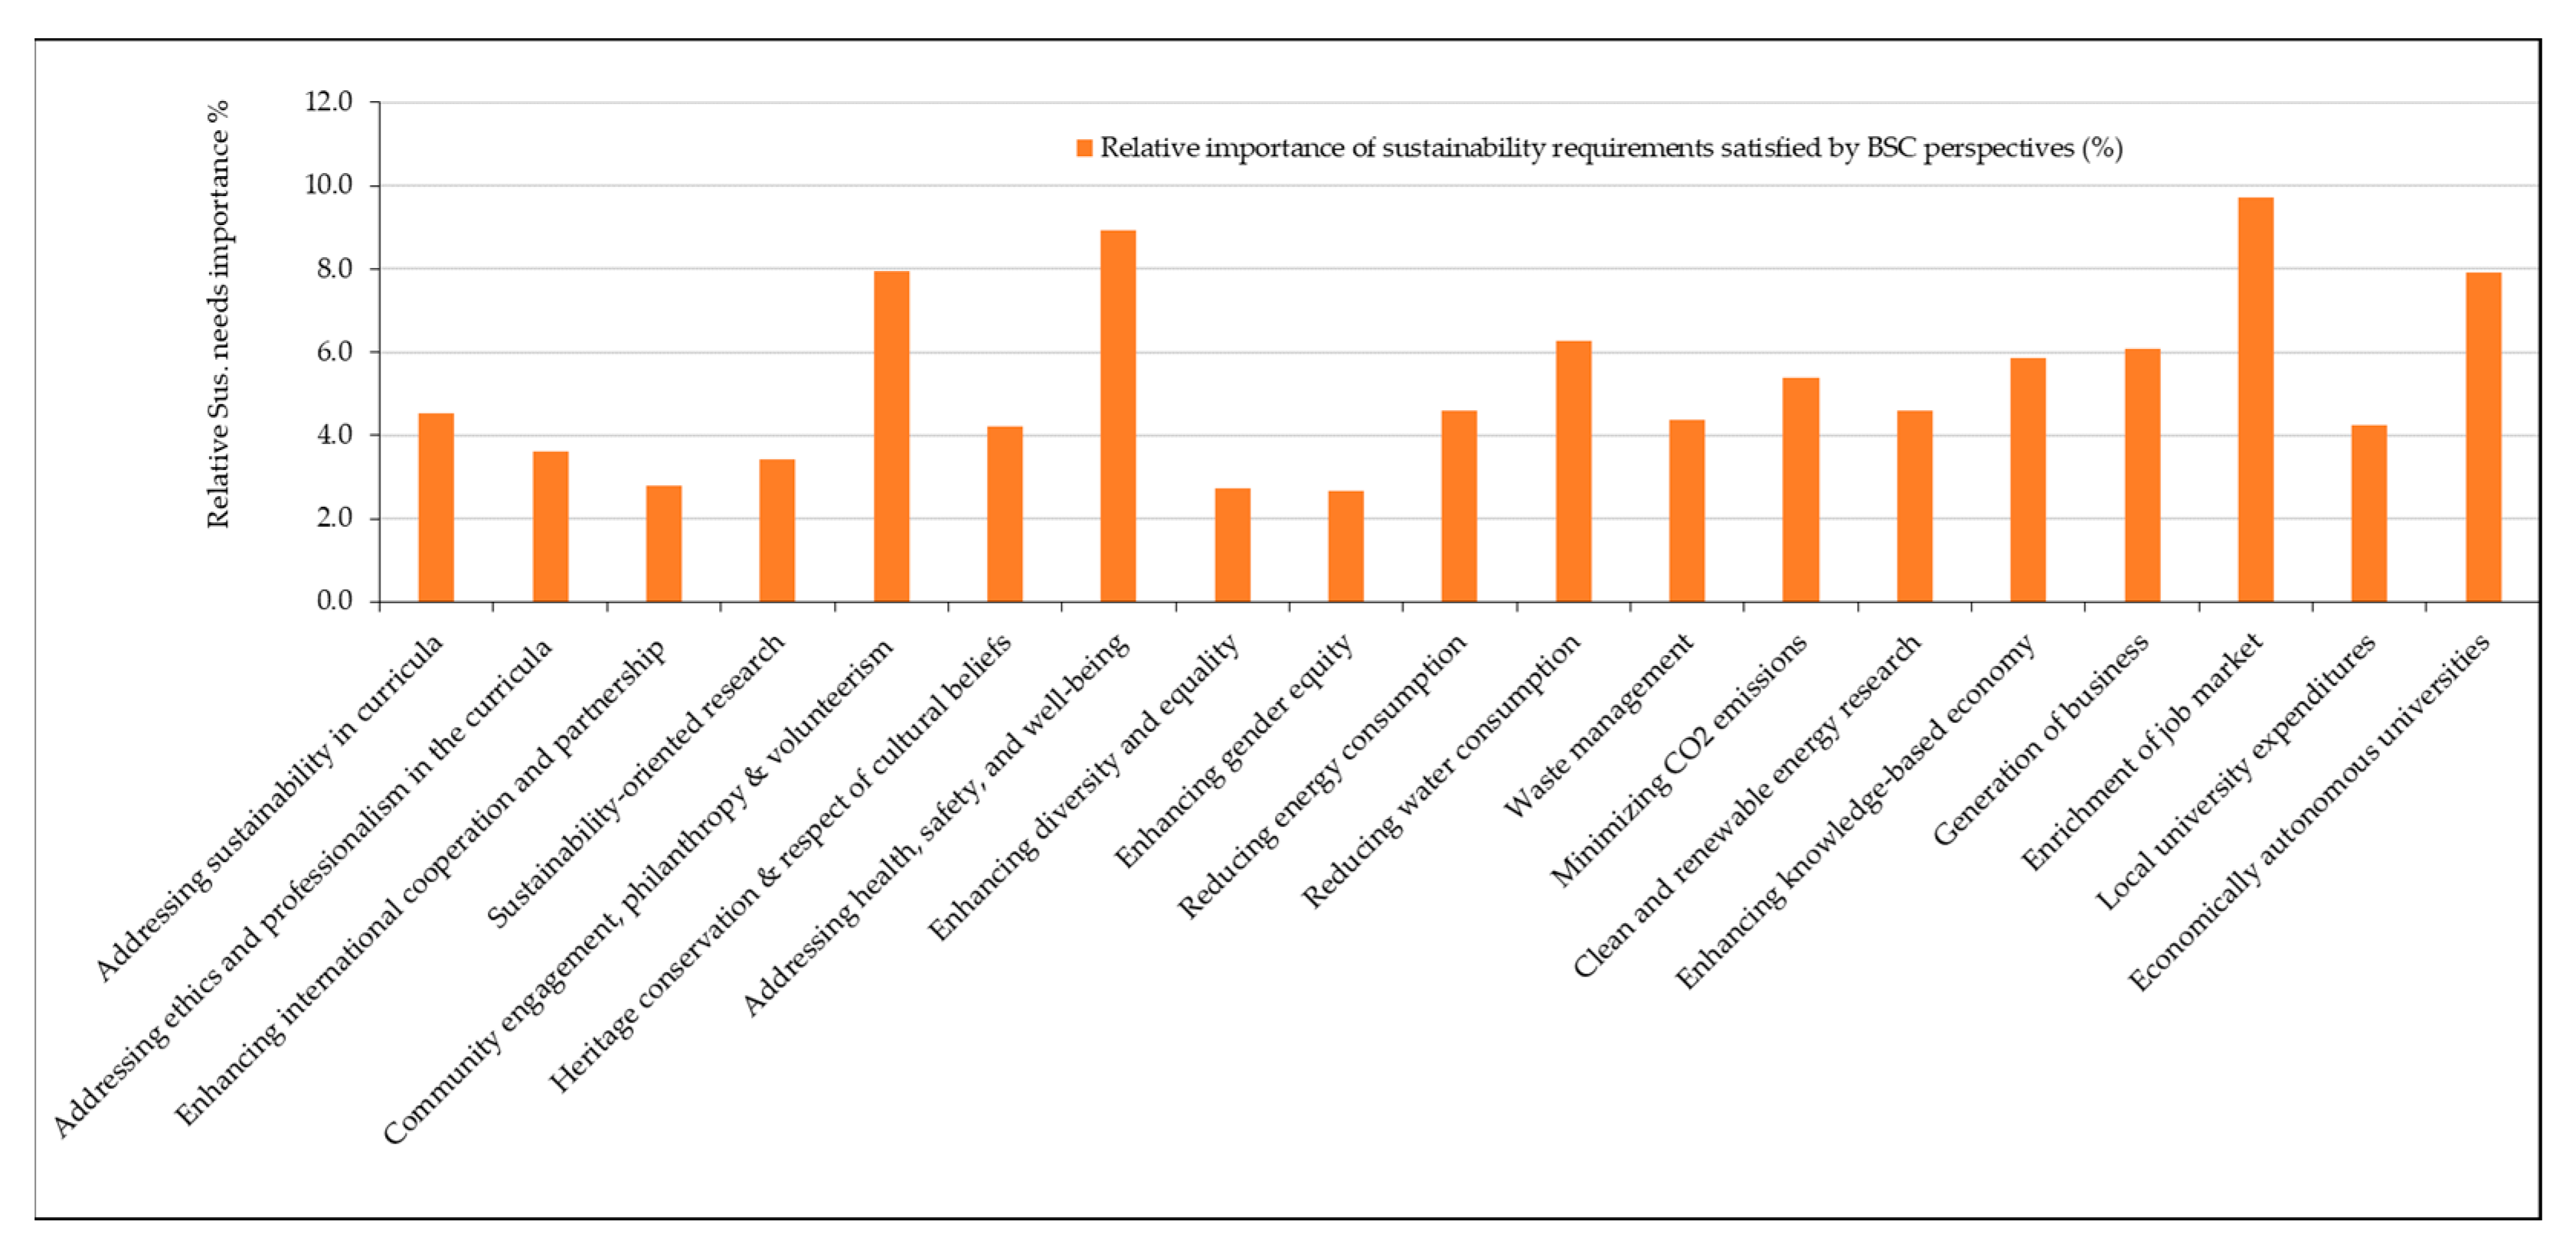
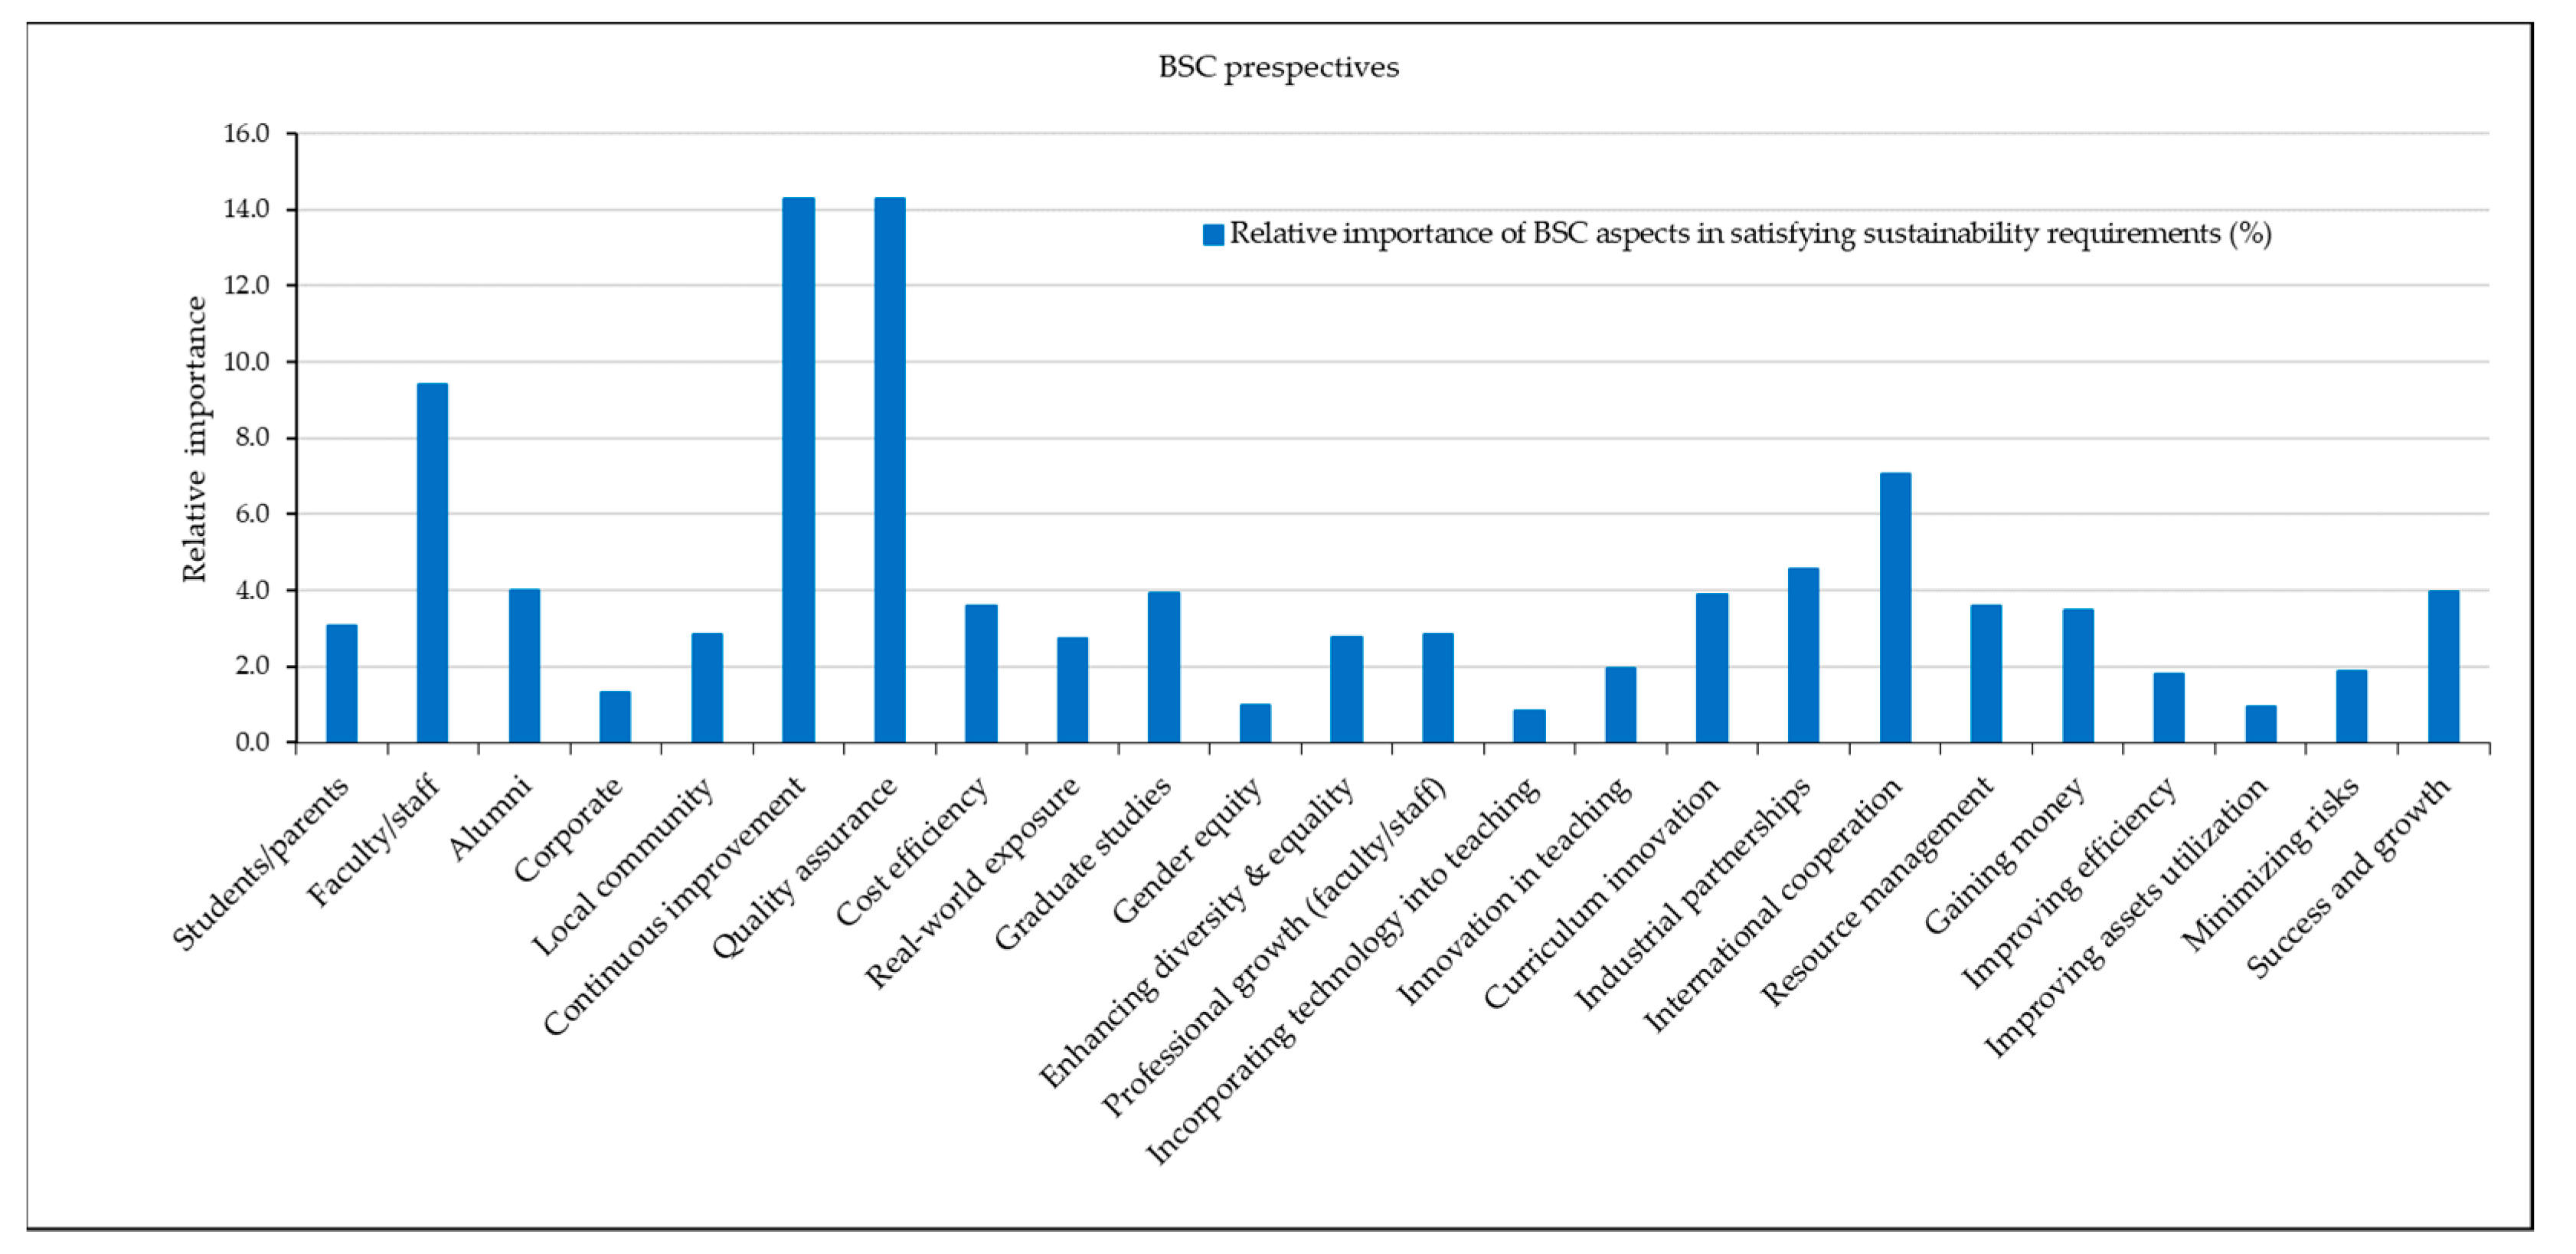
- Step 5: Use then the typical matrix multiplications to find the importance of each HOW element in meeting the customer requirements. The process requires several iterations to ensure that the elements in the HOWs are sufficient to address all the WHATs. In some cases, it may be necessary to add additional HOWs with their performance indicators, modify some performance indicators, and/or reformulate some WHATs and their indicators to be more specific to the designed system under consideration.
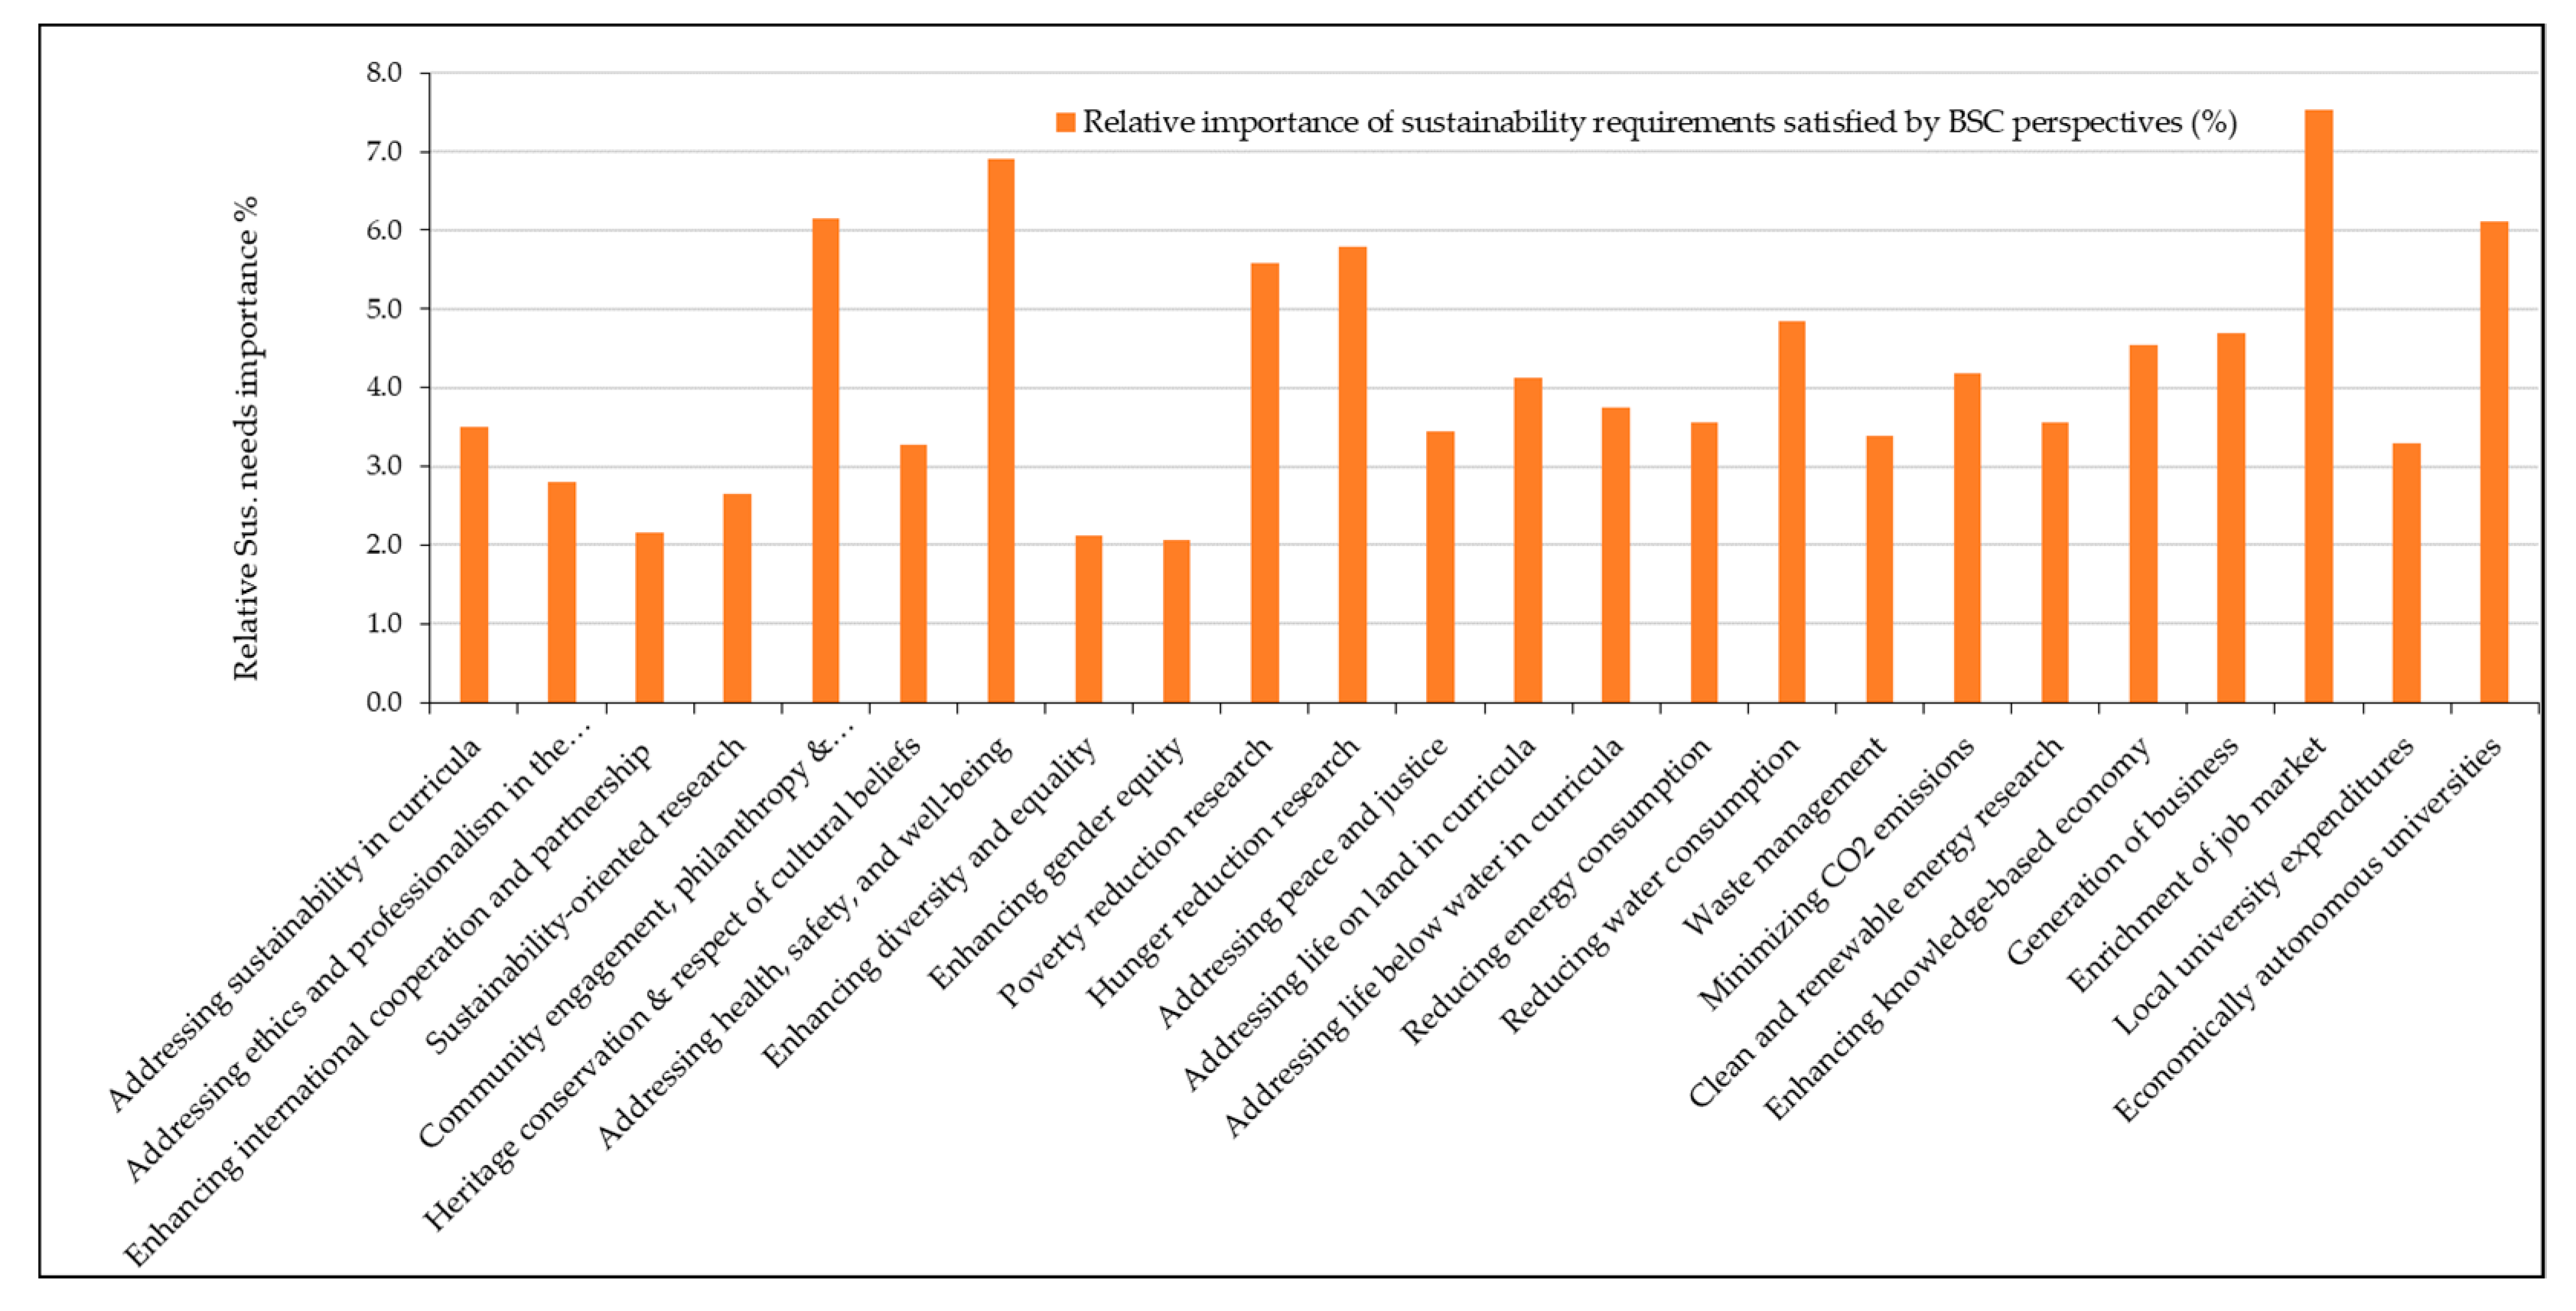
- Step 6: Repeat the same process in Step 5 horizontally to find the degree to which the designed system satisfies each WHAT element.
- Step 7: Define the initiatives and performance indicators for various BSC elements identified based on the WHAT–HOW relationship, the results of sustainability requirements, BSC elements, and trade-offs obtained between different HOWs.
2.4. Prioritizing Sustainability Requirements
3. Results and Discussion
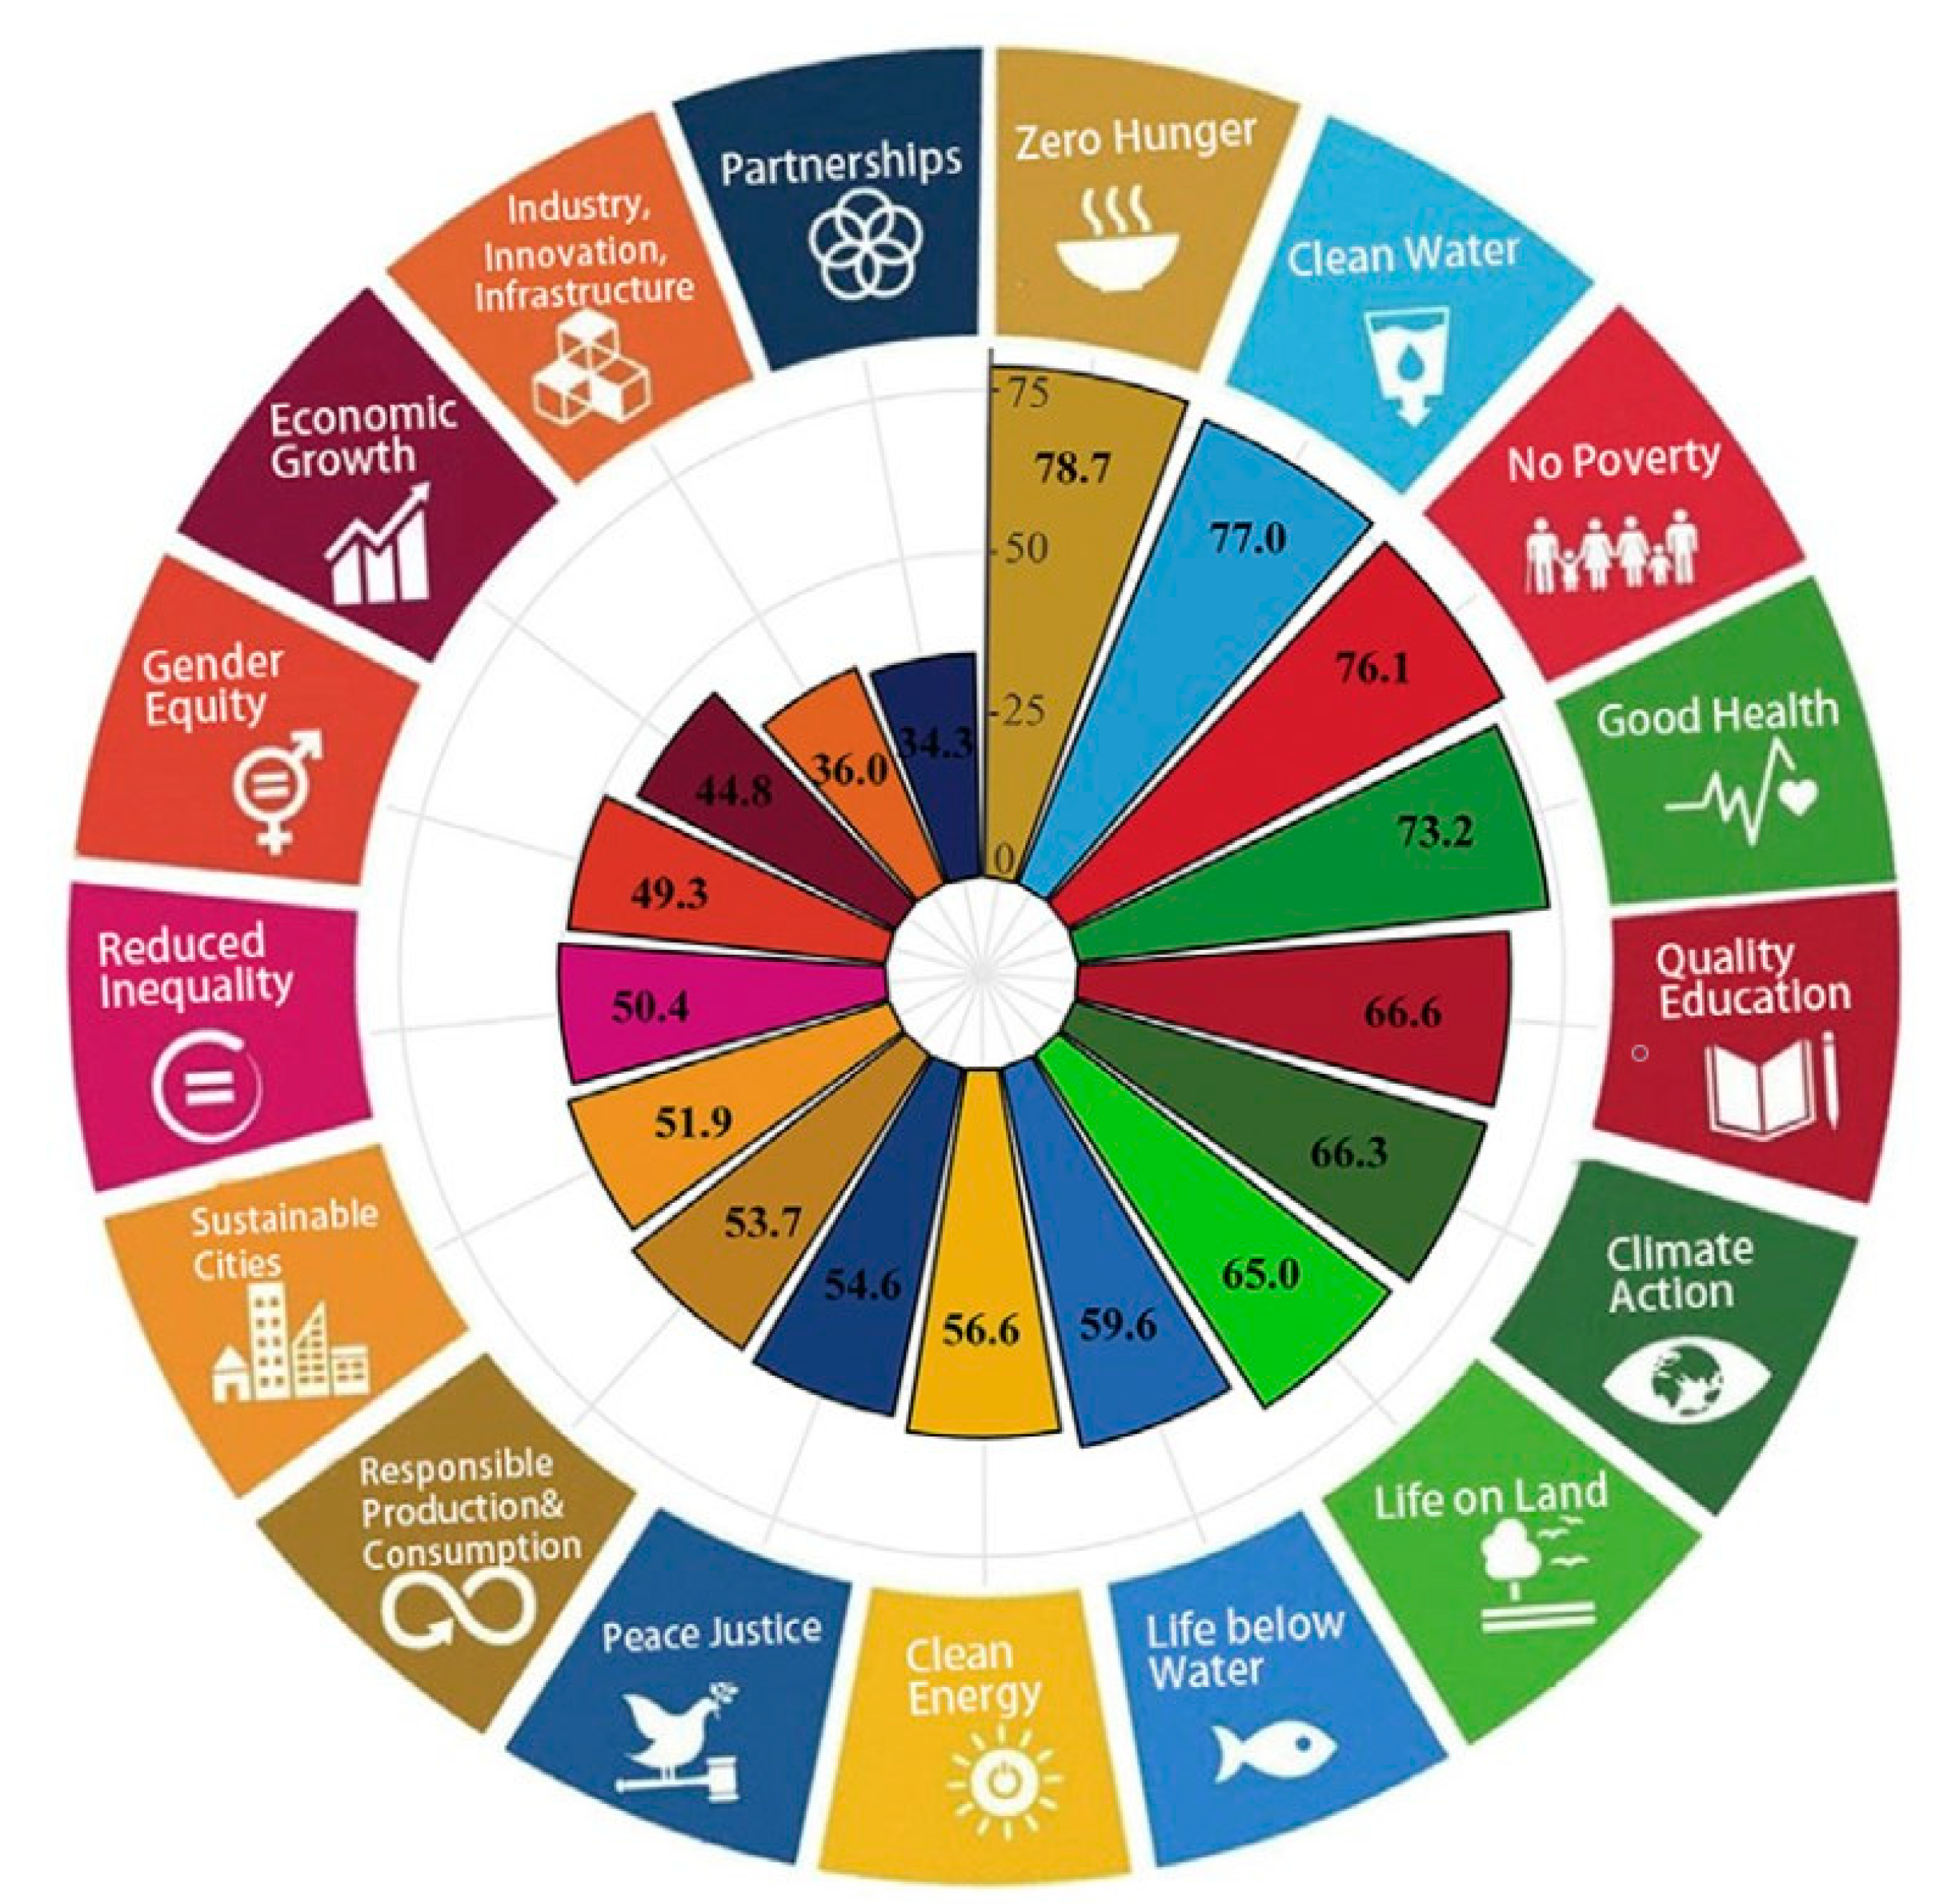
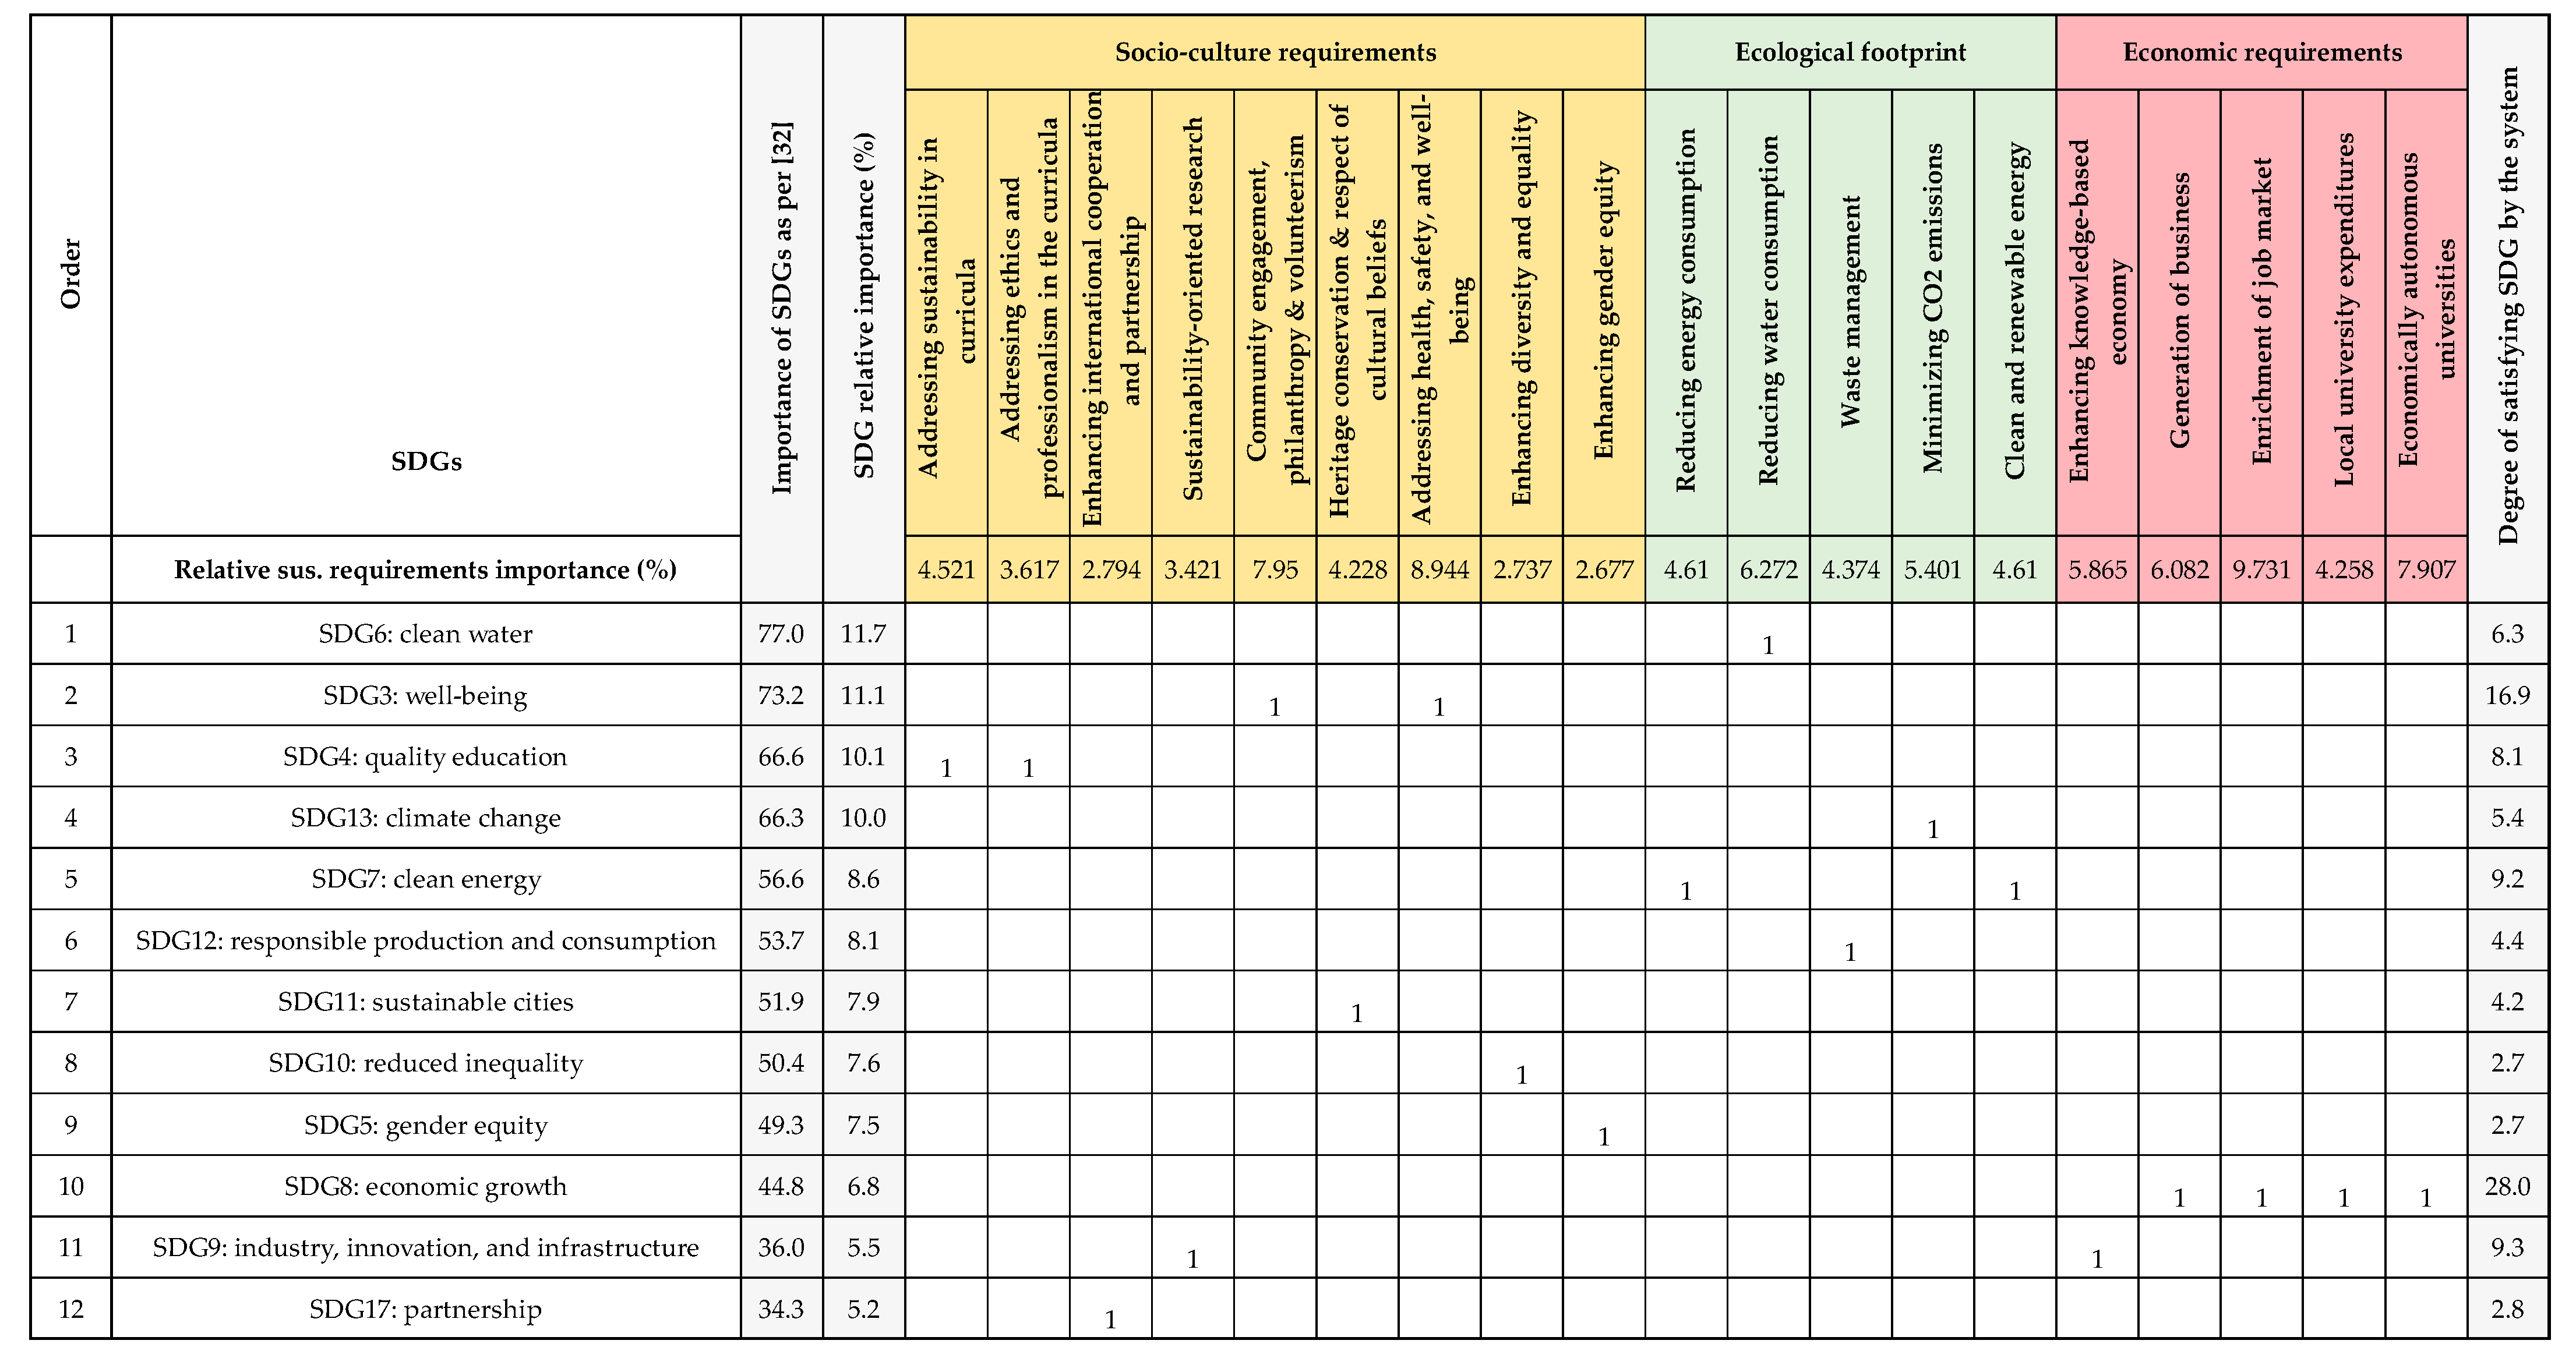
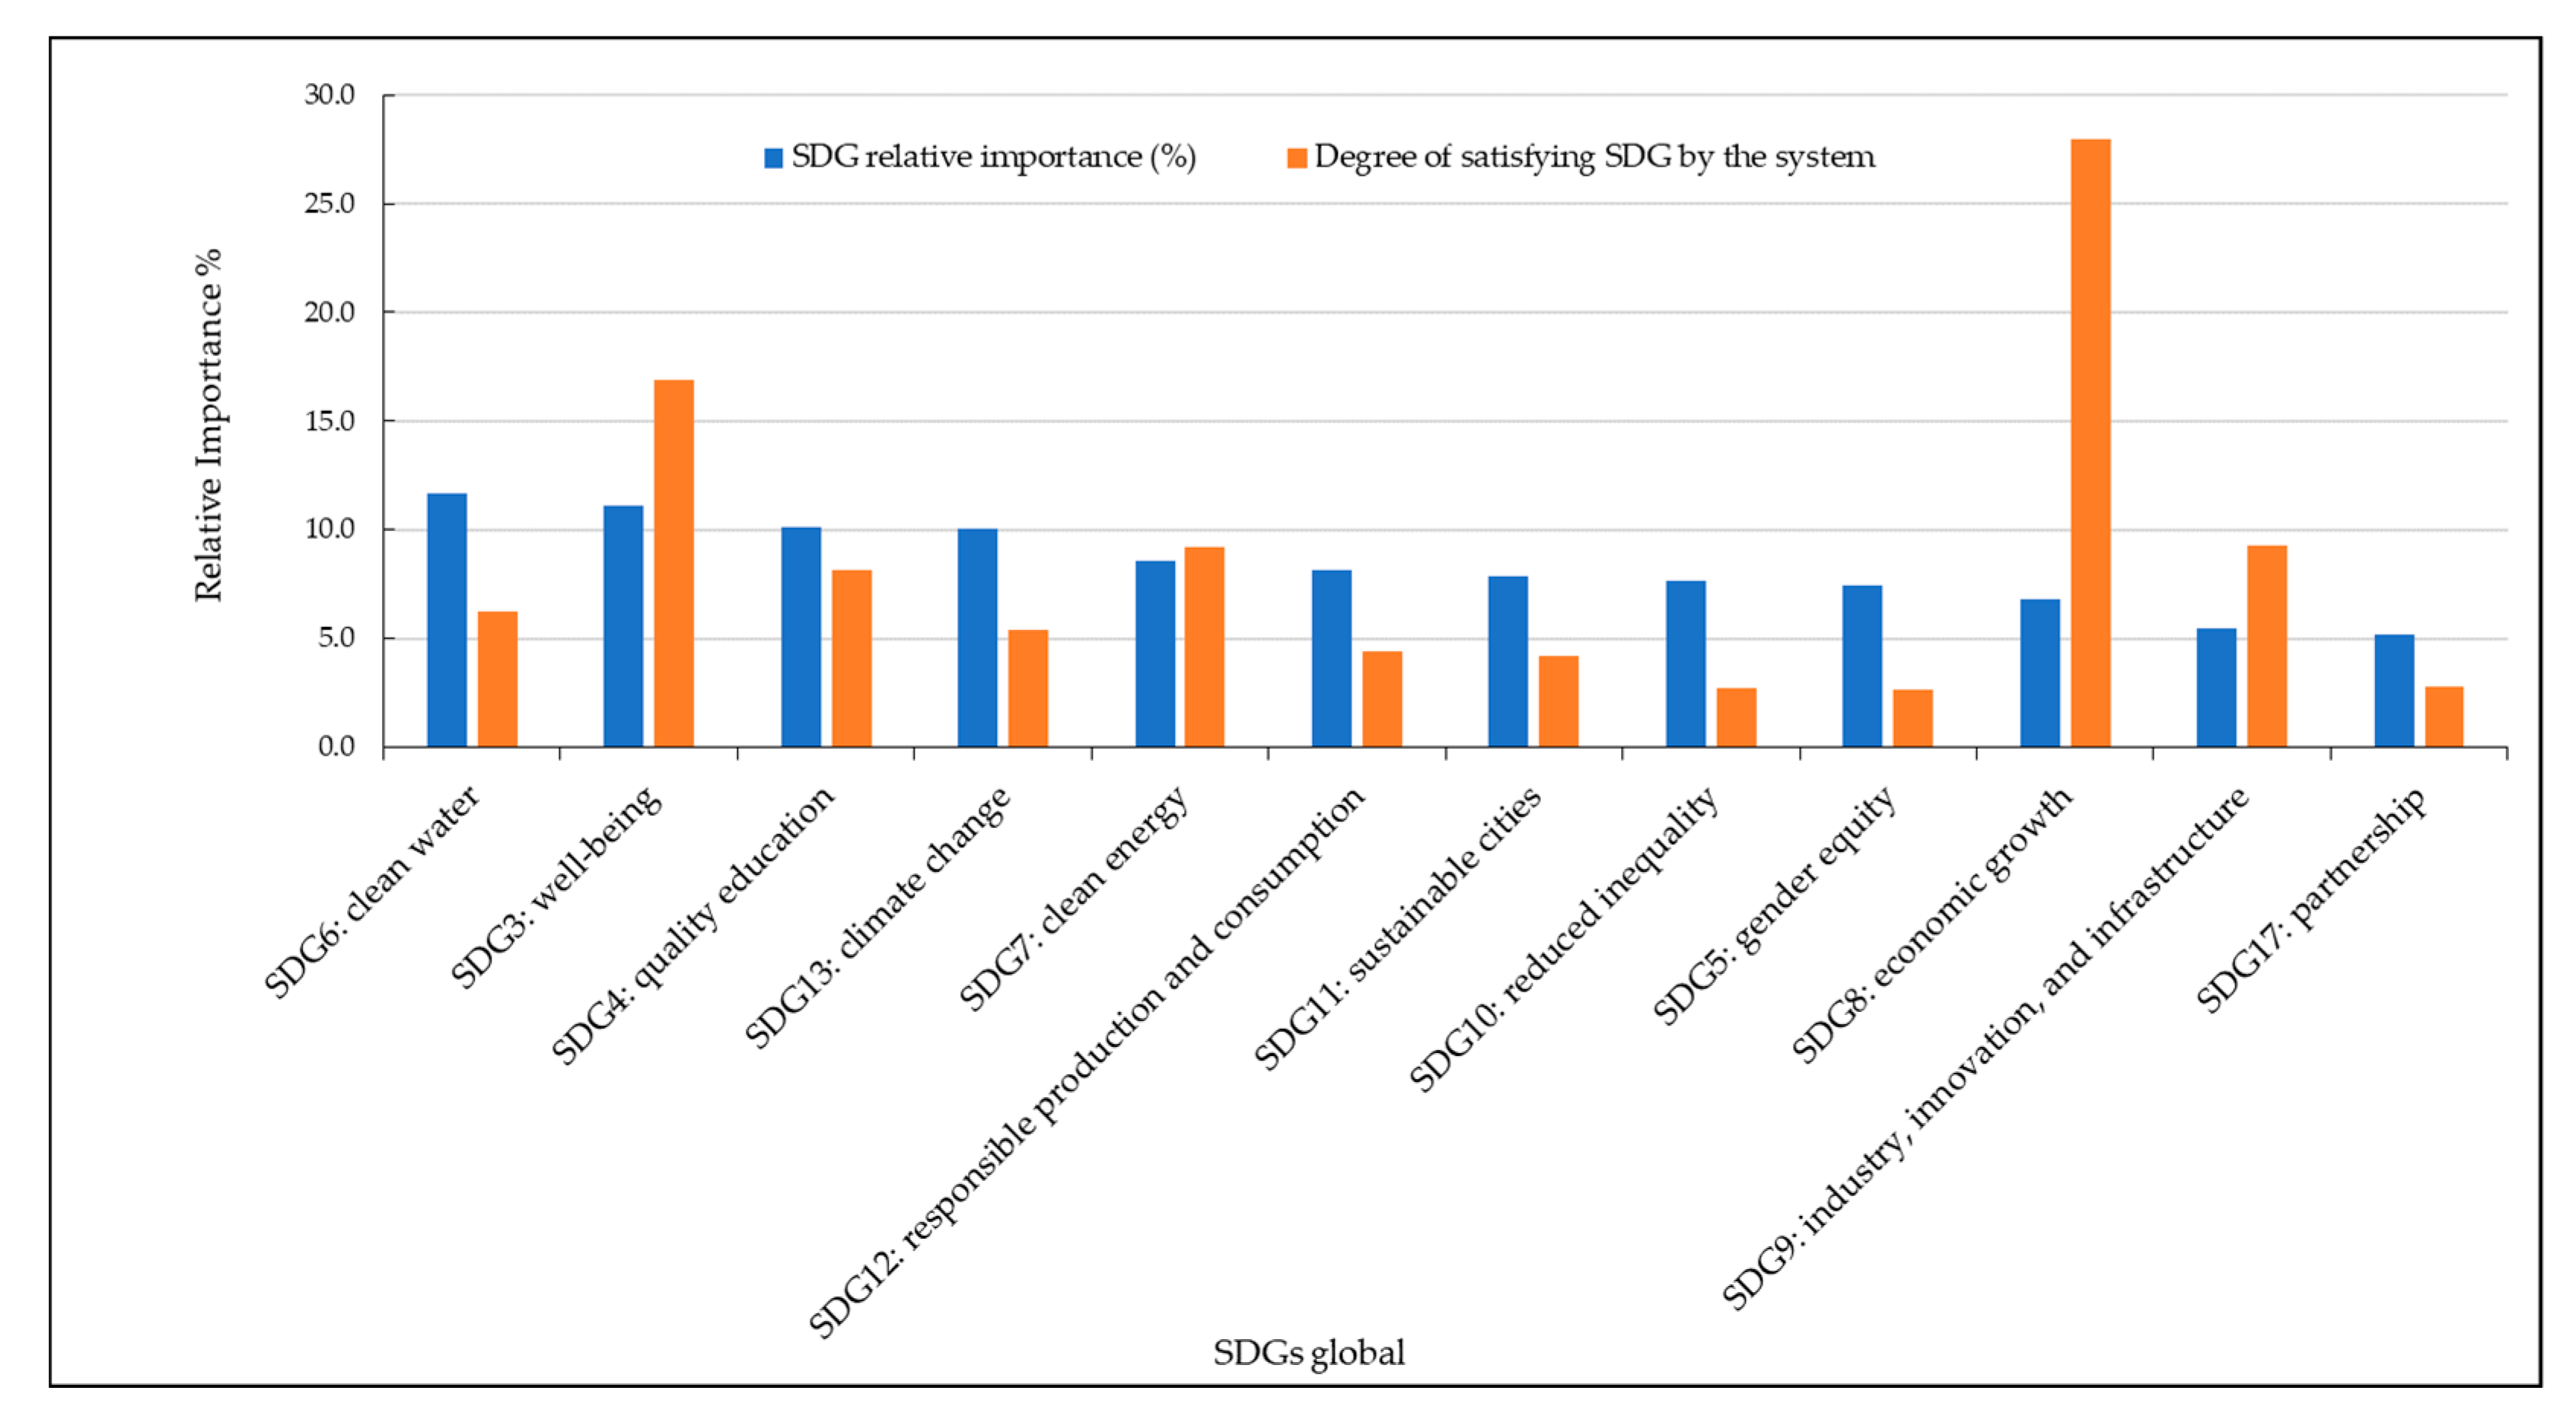
3.1. First Set of Results: Addressing 12 SDGs
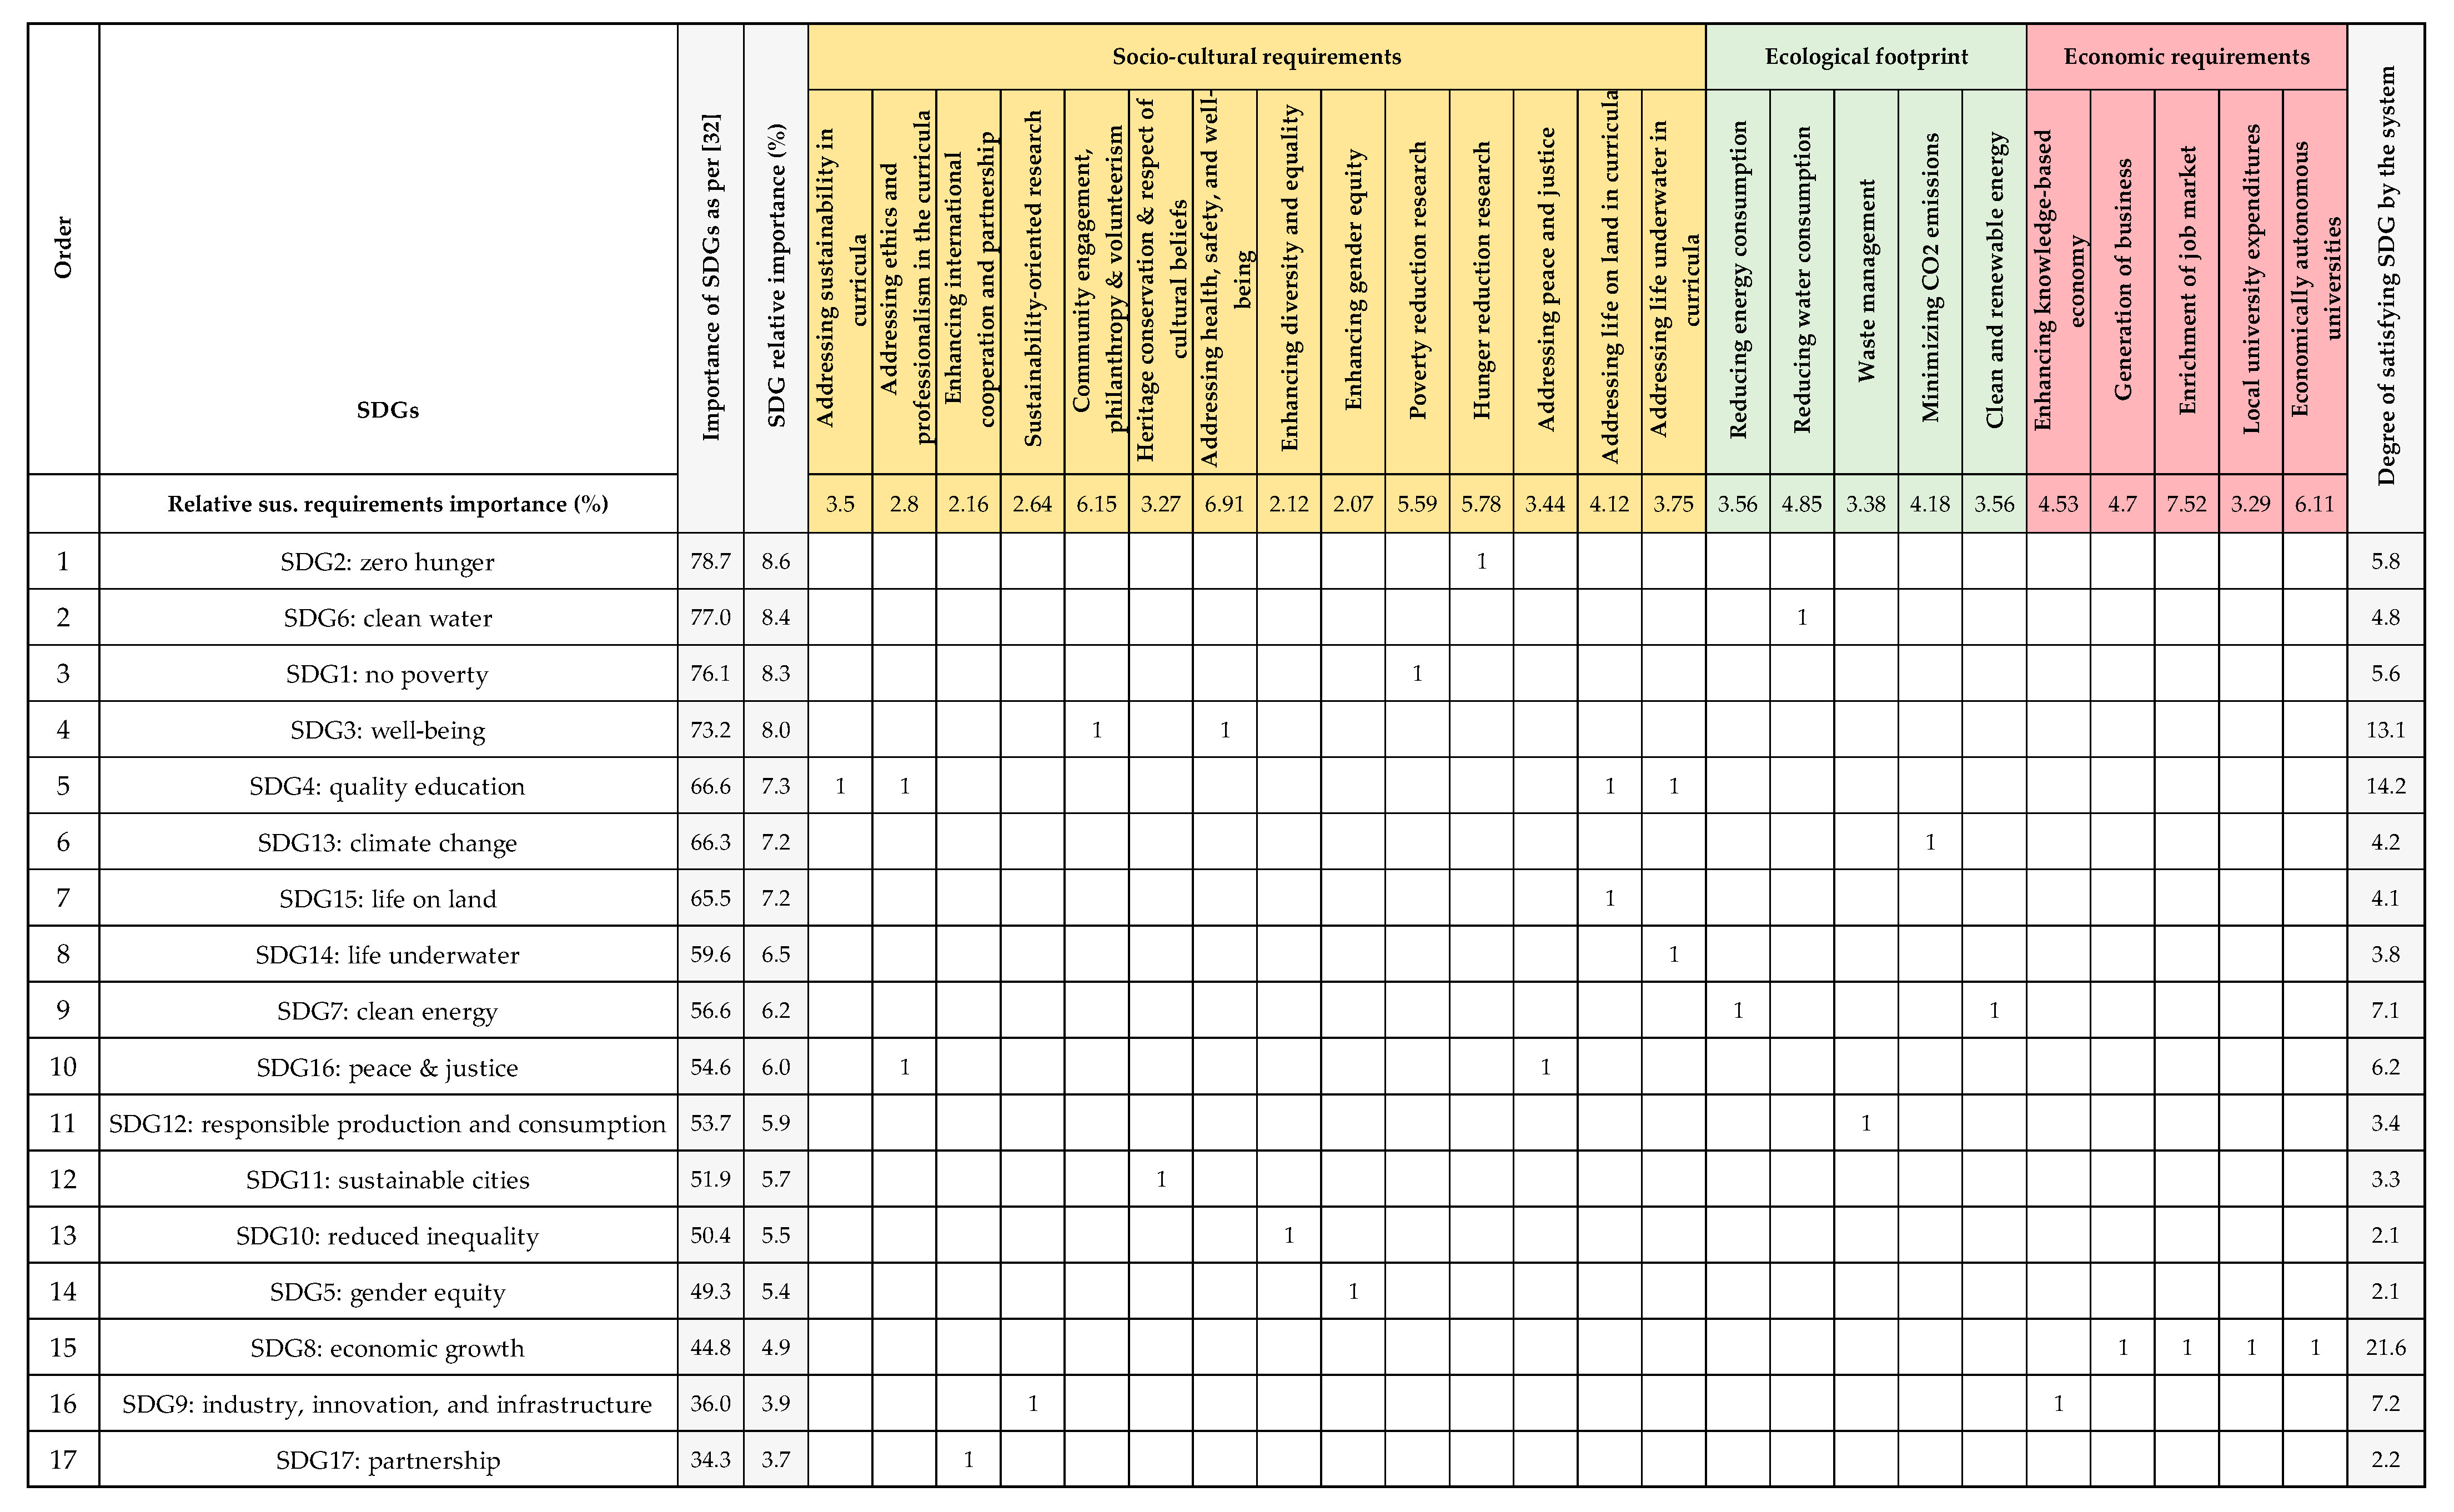
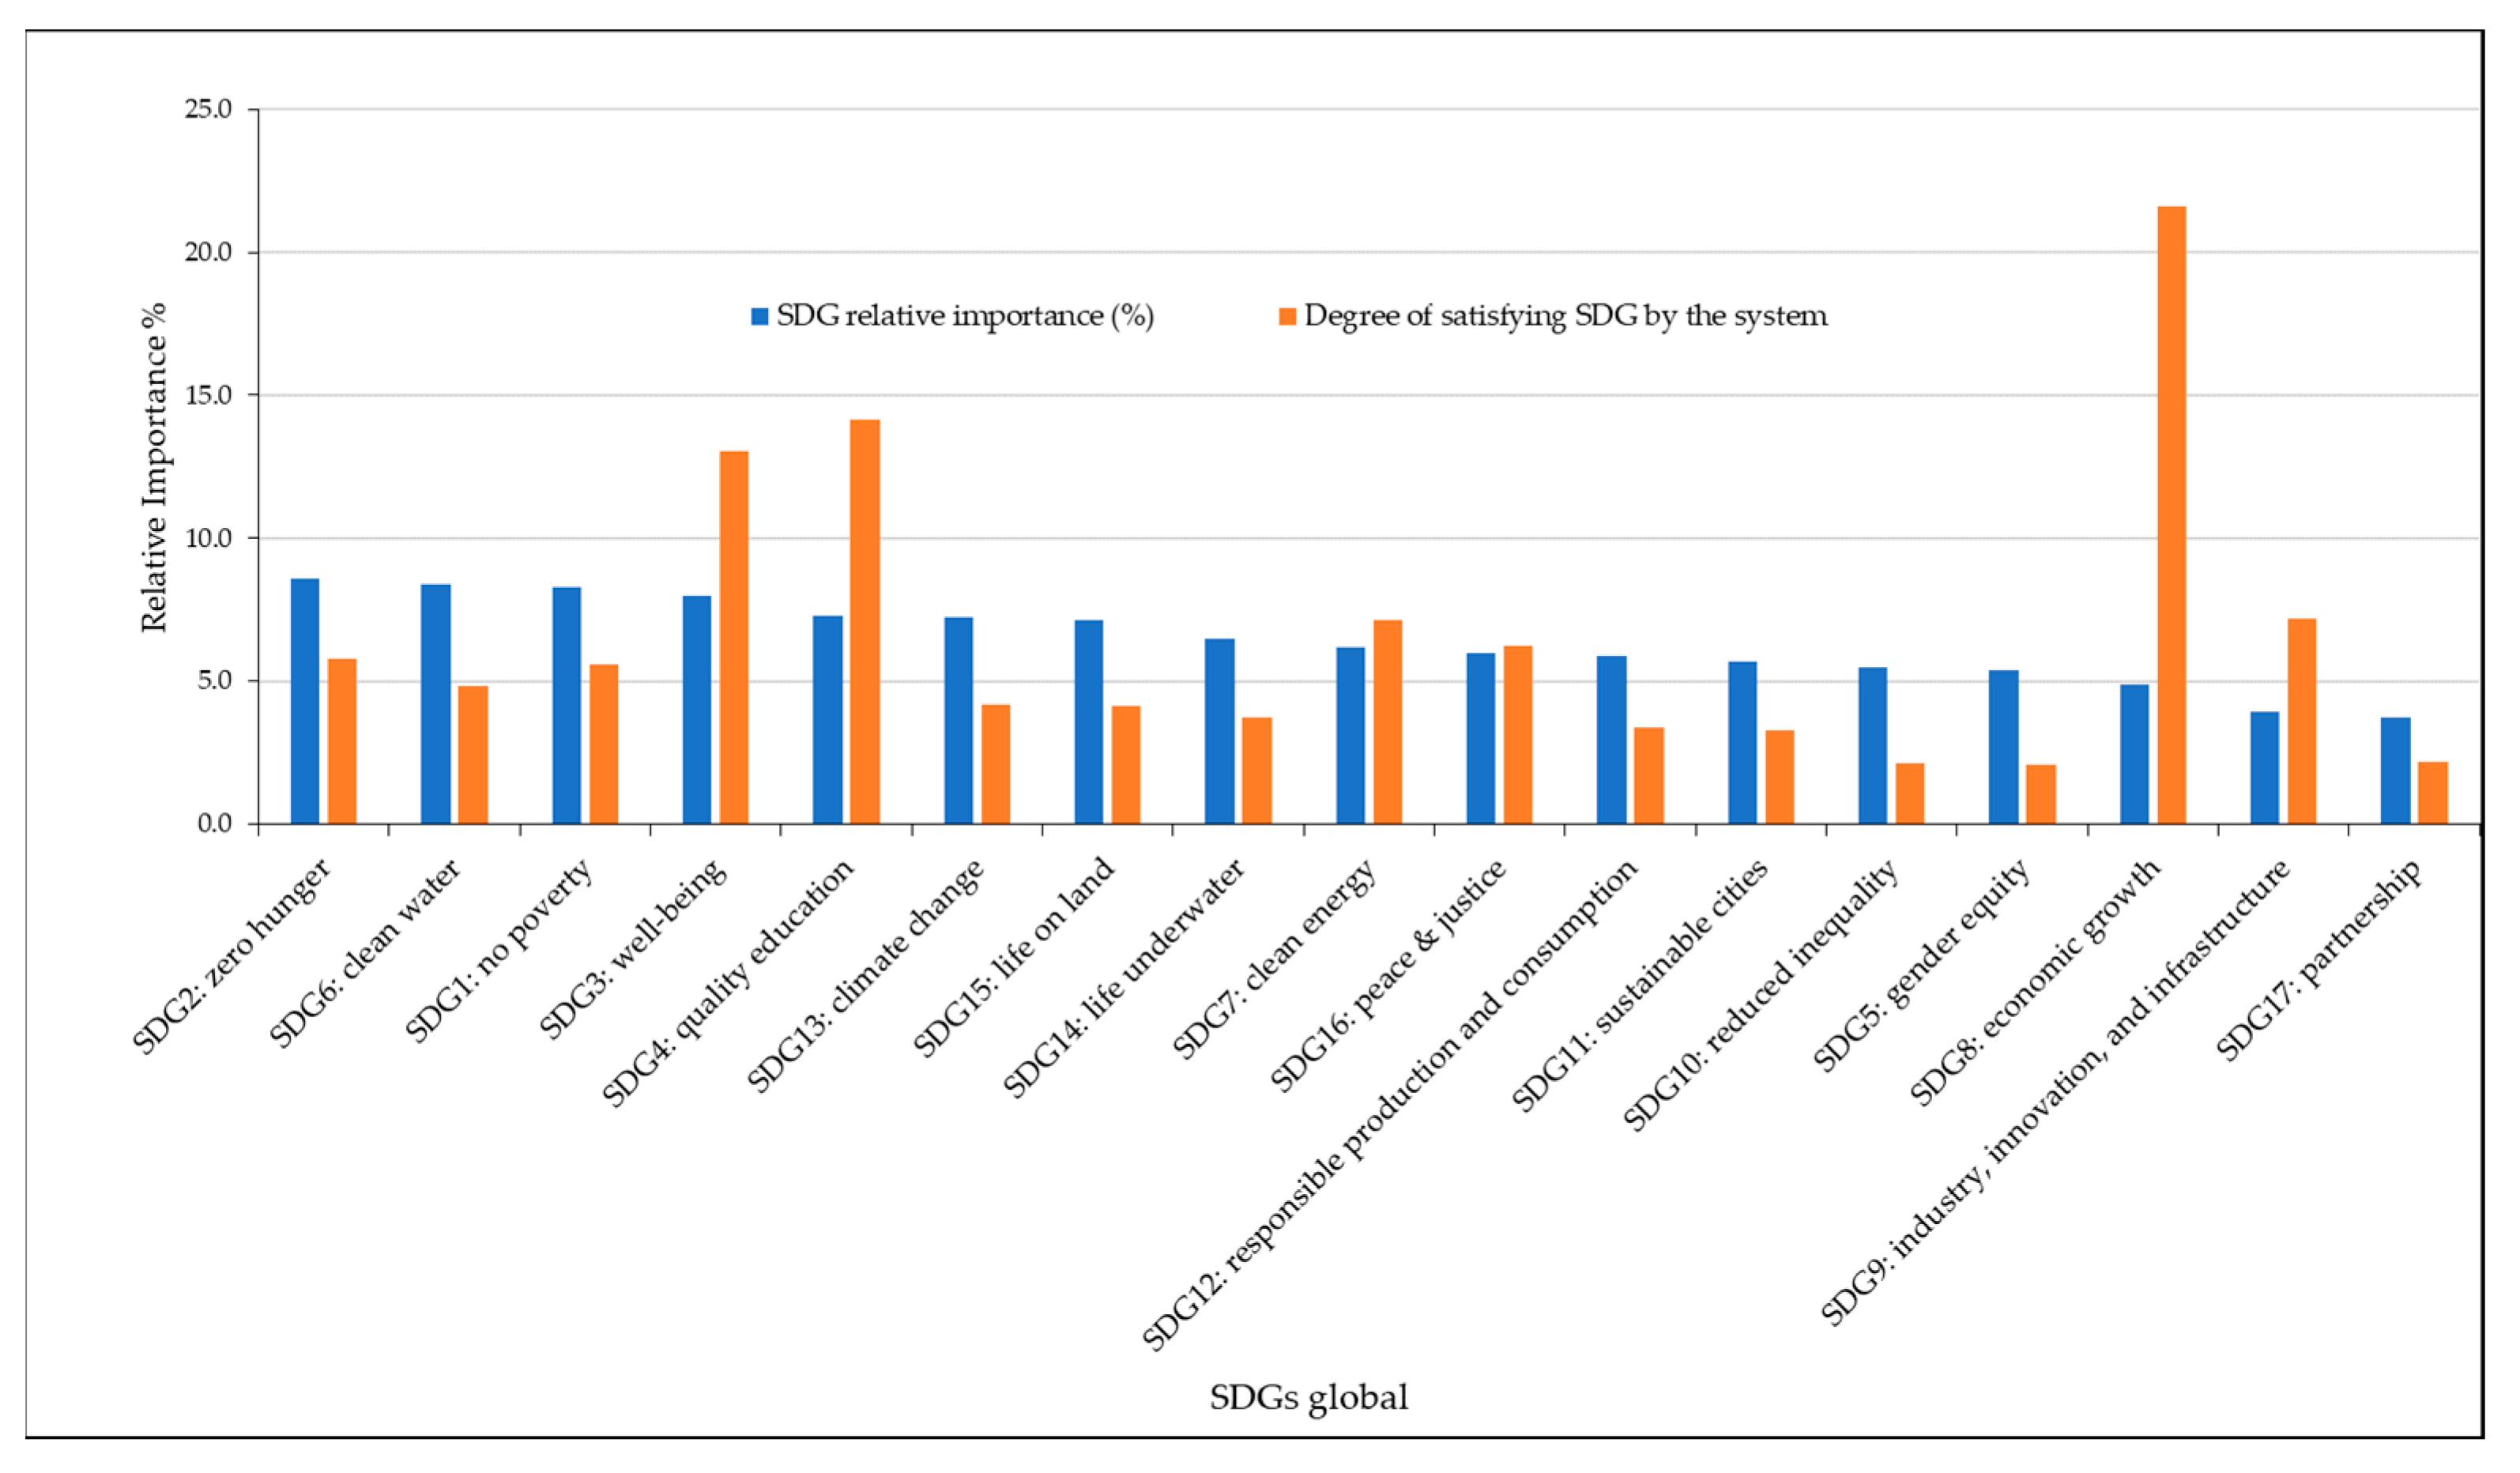
3.2. Second Set of Results: Possibility of Addressing All of the 17 SDGs
3.3. Discussion
- The sustainability TBL framework is used to identify the society requirements (formulated in the engineering design approach as customer requirements) from an engineering education system to achieve the sustainable development of the society.
- The strategic planning BSC approach is used to identify indicators to measure and assess different aspects of a successful engineering education system including four measurement perspectives, namely, finance, customer, internal business process, and learning and growth.
- The QFD which is a Total Quality Management tool for defining the customer’s demands in the customer’s own voice, prioritizing these demands, translating them into engineering requirements, and establishing targets for meeting these requirements.
4. Conclusions
Author Contributions
Funding
Institutional Review Board Statement
Informed Consent Statement
Data Availability Statement
Acknowledgments
Conflicts of Interest
References
- Derrick, S. Time and Sustainability Metrics in Higher Education. In Sustainability Assessment Tools in Higher Education Institutions; Caeiro, S., Leal Filho, W., Jabbour, C., Azeiteiro, U., Eds.; Springer International Publishing: Cham, Switzerland, 2013; ISBN 978-3-319-02374-8. [Google Scholar]
- Association of University Leaders for a Sustainable Future. The Talloires Declaration, 10 Point Action Plan. Available online: http://ulsf.org/wp-content/uploads/2015/06/TD.pdf (accessed on 21 April 2021).
- Thomas, W.A. (Ed.) Indicators of Environmental Quality; Plenum Press: New York, NY, USA, 1972. [Google Scholar]
- Alghamdi, N.; den Heijer, A.; de Jonge, H. Assessment tools’ indicators for sustainability in universities: An analytical overview. Int. J. Sustain. High. Educ. 2017, 18, 84–115. [Google Scholar] [CrossRef]
- Da Silva, A., Jr.; de Martins-Silva, P.O.; de Vasconcelos, K.C.A.; Da Silva, V.C.; De Melo, M.R.; Dumer, M.C.R. Sustainability Indicators for the Management of Brazilian Higher Education Institutions. BAR 2018, 15, 3. [Google Scholar] [CrossRef] [Green Version]
- Al-Bahi, A.M.; Soliman, A.Y. Sustainability SMART indicators of engineering education for sustainable development. In Proceedings of the Global Engineering Education Conference (EDUCON), Santa Cruz de Tenerife, Spain, 17–20 April 2018; pp. 80–88. [Google Scholar] [CrossRef]
- Hernandez-Diaz, P.M.; Polanco, J.-A.; Castaño, S.M. Do sustainability practices influence university quality? A Colombian case study. Int. J. Sustain. High. Educ. 2020, 21, 1525–1543. [Google Scholar] [CrossRef]
- Saqib, Z.A.; Zhang, Q.; Ou, J.; Saqib, K.A.; Majeed, S.; Razzaq, A. Education for sustainable development in Pakistani higher education institutions: An exploratory study of students’ and teachers’ perceptions. Int. J. Sustain. High. Educ. 2020, 21, 1249–1267. [Google Scholar] [CrossRef]
- Abubakar, I.R.; Aina, Y.A.; Alshuwaikhat, H.M. Sustainable Development at Saudi Arabian Universities: An Overview of Institutional Frameworks. Sustainability 2020, 12, 8008. [Google Scholar] [CrossRef]
- Sánchez, F.; Segalàs, J.; Vidal, E.; Martin, C.; Climent, J.; López, D.; Cabré, J. Improving Engineering Educators’ Sustainability Competencies by using Competency Maps. The EDINSOST Project. Int. J. Eng. Educ. 2018, 34, 1527–1537. [Google Scholar]
- Sánchez, F.; Moreno-Pino, F.; Sureda, B.; Antúnez, M.; Gütierrez, I. A Methodology to Analyze the Presence of Sustainability in Engineering Curricula. Case of Study: Ten Spanish Engineering Degree Curricula. Sustainability 2019, 11, 4553. [Google Scholar] [CrossRef] [Green Version]
- Daniela De Filippo, D.; Sandoval-Hamón, L.; Casani, F.; Sanz-Casado, E. Spanish Universities’ Sustainability Performance and Sustainability-Related R&D+I. Sustainability 2019, 11, 5570. [Google Scholar] [CrossRef] [Green Version]
- Sánchez, F.; López, D.; Bragós, R.; Cabre, J.; Climent, J.; Vidal, E.; Martín, C. Mapping the Sustainable Development Goals into the EDINSOST Sustainability Map of Bachelor Engineering Degrees. In Proceedings of the 2019 IEEE Frontiers in Education Conference (FIE), Covington, KY, USA, 16–19 October 2019; pp. 1–5. [Google Scholar] [CrossRef] [Green Version]
- United Nations. The Sustainable Development Goals Report 2020. Available online: https://unstats.un.org/sdgs/report/2020/The-Sustainable-Development-Goals-Report-2020.pdf (accessed on 21 April 2021).
- Narlikar, A. Learning, Life, and Love in Times of Corona: A Personal Reflection. Available online: https://www.globalpolicyjournal.com/blog/11/09/2020/learning-life-and-love-times-corona-personal-reflection (accessed on 24 April 2021).
- American Society for Engineering Education. COVID-19 & Engineering Education: An Interim Report on the Community Response to the Pandemic and Racial Justice; American Society for Engineering Education: Washington, DC, USA, 2020. [Google Scholar]
- García, E.; Weiss, E. COVID-19 and Student Performance, Equity, and U.S. Education Policy; Economic Policy Institute: Washington, DC, USA, 2020; Available online: https://files.epi.org/pdf/205622.pdf (accessed on 23 April 2021).
- Schunn, C. Engineering Educational Design. Educ. Des. 2008, 1. Available online: https://www.educationaldesigner.org/ed/volume1/issue1/article2/ (accessed on 23 April 2021).
- Kaplan, R.S.; Norton, D.P. Putting the Balanced Scorecard to Work. Harvard Business Review 71, No. 5 (September–October 1993): 134–147. (Reprint #93505). 1993. Available online: https://hbr.org/1993/09/putting-the-balanced-scorecard-to-work (accessed on 23 April 2021).
- Kaplan, R.S.; Norton, D.P. Linking the Balanced Scorecard to Strategy. Calif. Manag. Rev. 1996, 39, 53–79. [Google Scholar] [CrossRef]
- Kaplan, R.S.; Norton, D.P. The strategy-focused organization. Strat. Leadersh. 2001, 29, 29. [Google Scholar] [CrossRef]
- Patro, A. Using Balance scorecard in Educational institutions. Int. J. Bus. Manag. Invent. 2016, 5, 70–77. [Google Scholar]
- Nayeri, M.D.; Mashhadi, M.M.; Mohajeri, K. Universities Strategic Evaluation Using Balanced Scorecard. Int. J. Educ. Pedagog. Sci. 2008, 2, 25–29. [Google Scholar]
- Del Sordo, C.; Orelli, R.; Padovani, E.; Gardini, S. Assessing Global Performance in Universities: An Application of Balanced Scorecard. Procedia Soc. Behav. Sci. 2012, 46, 4793–4797. [Google Scholar] [CrossRef] [Green Version]
- Lassoued, K. Balanced scorecard implementation in higher education: An Emirati perspective. Corp. Ownersh. Control 2018, 15, 205–216. [Google Scholar] [CrossRef]
- Fijałkowska, J.; Oliveira, C. Balanced Scorecard in Universities. J. Intercult. Manag. 2018, 10, 57–83. [Google Scholar] [CrossRef]
- Wals, A. Learning for a Sustainable World. In Review of Contexts and Structures for Education for Sustainable Development 2009, Section for DESD Coordination Division for the Coordination of United Nations Priorities in Education; UNESCO: Paris, France, 2009. [Google Scholar]
- Abd-Elwahed, M.S.; Al-Bahi, A.M. Sustainability awareness in engineering curriculum through a proposed teaching and assessment framework. Int. J. Technol. Des. Educ. 2020. [Google Scholar] [CrossRef]
- Coral, J.S. Engineering Education for a Sustainable Future. Ph.D. Thesis, Technical University of Catalonia, Barcelona, Spain, 2009. [Google Scholar]
- Meaghan. Why You Need to Know Your Ecological Footprint. Lakeshore Recycling Systems. 2020. Available online: https://www.lrsrecycles.com/why-you-need-to-know-your-ecological-footprint/ (accessed on 23 April 2021).
- Jellenz, M.; Bobek, V.; Horvat, T. Impact of Education on Sustainable Economic Development in Emerging Markets—The Case of Namibia’s Tertiary Education System and its Economy. Sustainability 2020, 12, 8814. [Google Scholar] [CrossRef]
- O’Carroll, C.; Harmon, C.; Farrell, L. Economic and Social Impact of Higher Education; Irish Universities Association: Dublin, Ireland, 2006. [Google Scholar]
- Maritan, D. Practical Manual of Quality Function Deployment; Springer: Berlin/Heidelberg, Germany, 2015; Available online: https://0-link-springer-com.brum.beds.ac.uk/book/10.1007/978-3-319-08521-0 (accessed on 23 April 2021).
- Dror, S.; Barad, M. House of strategy (HOS)—From strategic objectives to competitive priorities. Int. J. Prod. Res. 2006, 44, 3879–3895. [Google Scholar] [CrossRef]
- Sirin, O.; Gunduz, M.; Moussa, A. Application of Tools of QFD and Modified BSC for Optimal Allocation of Pavement Management Resources. IEEE Access 2020, 8, 76399–76410. [Google Scholar] [CrossRef]
- Agarwal, A. Investigating design targets for effective performance management system: An application of balance scorecard using QFD. J. Adv. Manag. Res. 2020. [Google Scholar] [CrossRef]
- Ogul, V.G.; Ensari, H. Strategic Planning and a Balanced Scorecard in Higher Education: How to Make a Strategic Plan in Turkish Universities? In Problems and Prospects in Higher Education; Athens Institute for Education and Research: Athens, Greece, 2019. [Google Scholar]
- Pochampally, K.K.; Gupta, S.M. Six Sigma Case Studies with Minitab®; CRC Press: Boca Raton, FL, USA, 2014. [Google Scholar]
- Dym, C.L.; Wood, W.H.; Scott, M.J. Rank ordering engineering designs: Pairwise comparison charts and Borda counts. Res. Eng. Des. 2002, 13, 236–242. [Google Scholar] [CrossRef]
- Yang, S.; Zhao, W.; Liu, Y.; Cherubini, F.; Fu, B.; Pereira, P. Prioritizing sustainable development goals and linking them to ecosystem services: A global expert’s knowledge evaluation. Geogr. Sustain. 2020, 1, 321–330. [Google Scholar] [CrossRef]
- Brito, R.; Rodríguez, C.; Aparicio, J.; Paolacci, J.; Sampedro, M.; Beltrán, J. Indicators of Sustainability in Educational Practice: Perception of Teachers and Students of UAGro-Mexico. Sustainability 2018, 10, 3733. [Google Scholar] [CrossRef] [Green Version]
- Alghamdi, A.; Haider, H.; Hewage, K.; Sadiq, R. Inter-University Sustainability Benchmarking for Canadian Higher Education Institutions: Water, Energy, and Carbon Flows for Technical-Level Decision-Making. Sustainability 2019, 11, 2599. [Google Scholar] [CrossRef] [Green Version]
- ABET Engineering Accreditation Commission, 2021–2022 Criteria for Accrediting Engineering Programs, Engineering Accreditation Commission, Baltimore, Md. 28 December 2020. Available online: https://www.abet.org/wp-content/uploads/2021/02/E001-21-22-EAC-Criteria.pdf (accessed on 27 March 2021).


| Customer | Elements of Satisfaction | Performance Indicators |
|---|---|---|
| Students and parents | External ranking of the college | 1. Absolute ranking of the college in academic ranking of world universities in engineering/technology and computer sciences. |
| Accreditation and external review | 2. Proportion of engineering programs in which there was an accreditation/external review to the total number of engineering programs in the institution over the past 6 years. | |
| Completion rate | 3. Proportion of the undergraduate students who completed the program in the planned graduation time. | |
| Admission rate | 4. Percentage increase in the number of students admitted to the program in one year. | |
| Students’ satisfaction | 5. Percentage of graduating students who are very satisfied with the quality of their learning experience. | |
| 6. Percent of students who are very satisfied with the numerous services offered by the program (restaurants, transportation, sports facilities, etc.). | ||
| 7. Percent of students who are very satisfied with the advising system. | ||
| Students’ employability | 8. Percent of graduates who within 6 months of graduation are employed or enrolled in graduate studies. | |
| Faculty and staff | Salary growth | 9. Average percentage salary growth of faculty and staff over one year. |
| Faculty and staff satisfaction | 10. Percent of faculty and staff who are very satisfied with the work environment. | |
| Professional growth | 11. Percent of faculty and staff promoted in one year. | |
| Retention rate | 12. Percent of faculty and staff who left the institute for reasons other than age limit in one year. | |
| Recruitment | 13. Percentage of newly recruited faculty and staff in one year. | |
| Alumni | Graduate studies | 14. Percent of college alumni enrolled in graduate study programs in the college of total students enrolled in graduate studies programs. |
| Community services | 15. Percent of alumni who participated in community services activities in one year to the total number of participants. | |
| Surveys | 16. Proportion of programs in which stakeholders are surveyed for the continuous improvement of the program. | |
| Market requirements | 17. Proportion of programs in which graduates are surveyed for compatibility between market requirements and curricular goals. | |
| On-campus activities | 18. Percent of on-campus activities with alumni participation to total number of activities. | |
| Corporate | Employers’ satisfaction | 19. Percent of employers who are very satisfied or satisfied with the performance of the graduates in the work environment. |
| Training | 20. Percent increase in the number of corporate staff benefiting from training programs conducted by the college in one year. | |
| Grants and endowments | 21. Percent increase in grants/endowments generated from industry in one year. | |
| Local community | Community services | 22. Proportion of full-time teaching and other staff actively engaged in community service activities in the past year. |
| 23. Proportion of alumni engaged in one or more community service activities in the past year. | ||
| 24. Ratio of the number of general public activities, workshops, and awareness campaigns carried out by the institution to those carried out by the world’s best practicing ones. | ||
| 25. Percent of beneficiaries who are very satisfied with the community services provided by the college in one year. | ||
| Business creation | 26. Percent increase in the number of companies created by the university students and employees over one year. | |
| 27. Proportion of graduates establishing their own business to the total number of graduates in five years after the graduation. | ||
| Community-oriented research | 28. Percent of research activities linked to community development to the total number of research activities. | |
| Green university initiatives | 29. Percent increase in university environmental activities/initiatives over one year. |
| Elements of Internal Processes | Measures of Excellence | Performance Indicators |
|---|---|---|
| Continuous improvement | Student outcomes | 30. Proportion of improved student outcomes to the total number of student outcomes under consideration in the last assessment and improvement cycle. |
| Course delivery | 31. Proportion of courses modified in content, teaching approaches, or assessment to the total number of core courses in the curriculum in the last assessment and improvement cycle. | |
| Research output | 32. Percent increase in the number of publications in peer-reviewed journals per faculty member. | |
| Quality assurance | Industrial advisory board | 33. Proportion of programs in which the feedback of an industrial advisory board is included in the evaluation of the program. |
| Exit exams | 34. Proportion of programs in which the student competency evaluation/exit exam is carried out regularly. | |
| Professional exams | 35. Percentage of students or graduates who were successful in the professional and/or national examinations. | |
| Quality audits | 36. Proportion of programs for which an external administrative quality audit was carried out in the previous 5 years. | |
| Performance indicators | 37. Percentage of the performance indicators of the operational plan objectives of the program that achieved the targeted annual level to the total number of indicators targeted for these objectives in the same year. | |
| Cost efficiency | Faculty to student ratio | 38. Percentage increase in the faculty to student ratio over the past 5 years. |
| Real-world exposure | Internship | 39. Proportion of programs in which industrial training/internship is mandatory. |
| 40. Percent of on-site training supervisors who are very satisfied with students’ internship/coop experience. | ||
| Site/field visits | 41. Number of site/field visits per student per year. | |
| Graduate studies | Postgraduate programs | 42. Proportion of departments in which specialized PhD and MS programs are offered. |
| Gender Equity | Female students | 43. Percent of female students to the total number of students in the institution |
| Female faculty | 44. Percent of female faculty to the total number of faculty in the institution | |
| Enhancing diversity and equality | Diversity | 45. Percent of expatriated faculty and staff to the total number of faculty members in the institute |
| 46. Percent of expatriated students to the total number of students in the institute | ||
| Equality | 47. Ratio of average salaries of expatriated faculty and staff to the average salary in the institution. |
| Elements of Innovation and Learning | Measures of Excellence | Performance Indicators |
|---|---|---|
| Professional growth | Faculty | 48. Proportion of teaching staff participating in the professional development activities in the past year. |
| 49. Proportion of faculty members who had more than one refereed publication in the past year. | ||
| 50. Percentage increase in the average number of refereed and/or published research papers per each faculty member during the year. | ||
| 51. Percentage increase in the average number of citations in refereed journals from published research per faculty member in one year. | ||
| 52. Percentage increase in the number of papers or reports presented at academic conferences during the past year per full-time equivalent faculty member. | ||
| Staff | 53. Proportion of technical staff participating in the professional development activities in the past year. | |
| 54. Proportion of the administrative staff participating in professional development activities in the past year. | ||
| Incorporating technology in teaching | Courses | 55. Percentage increase in the number of courses incorporating new technology (such as learning management systems, augmented reality, virtual reality, virtual labs, and online teaching) to the total number of core courses in the curriculum in the last 5 years. |
| Innovation in teaching | Courses | 56. Percentage increase in the number of courses that use modern learning approaches (such as active cooperative learning and project-based and problem-based learning) to the total number of core courses in the curriculum in the last 5 years. |
| Faculty | 57. Proportion of teaching staff participating in teaching workshops in the past year. | |
| Research | 58. Proportion of refereed publications in the field of engineering education to the total number of refereed publications in the past year. | |
| Curriculum development and innovation | Curriculum revisions | 59. Proportion of engineering programs in which there was an independent verification of the curriculum and the standards of student achievement to the total number of engineering programs in the institution in the past 6 years. |
| Curriculum updates | 60. Percentage of courses added/removed/updated to the total number of courses in the curriculum in the past 6 years. | |
| Industrial partnerships | Companies | 61. Percent increase in number of industrial agreements, MOU, partnerships, cooperation, student training, joint research, and so on in one year. |
| International cooperation | Universities | 62. Percent increase in the number of international agreements, MOU, partnerships, cooperation, student exchange, joint research, and so on in one year. |
| Resource management | Strategic initiatives | 63. Proportion of introduced or modified strategic initiatives carried out in the last strategic plan revision, in order to benefit from opportunities and/or mitigate risks, to the total number of strategic initiatives of the plan. |
| Learning resources | 64. Percent of beneficiaries who are very satisfied with the adequacy and diversity of learning resources (e.g., library, online resources, references, journals, and databases). |
| Elements of Financial Perspective | Measures of Excellence | Performance Indicators |
|---|---|---|
| Gaining money | Student fees | 65. Percentage increase in the number of fees paying students admitted to the program in one year. |
| Funds and endowments | 66. Percentage of self-generated funds/endowments from the total budget of the institution. | |
| Patents | 67. Percentage increase in the number of registered national and international patents during the past year per full-time equivalent faculty member. | |
| Paid services | 68. Percent of revenue from paid services of the total budget of the institution. | |
| Entrepreneurial activities | 69. Percent of the university income from entrepreneurial activities of the total university budget. | |
| Improving efficiency | Overall efficiency | 70. Percentage increase in graduation to the enrollment rate in one year. |
| 71. Percent of instructional expenditures of the total expenditures of the institute in one year. | ||
| 72. Percent of self-generated funds of the total expenditure of the institute in one year. | ||
| Improving assets utilization | Assets productivity | 73. Percent of the average time during which labs, workshops, and sports facilities are fully utilized. |
| Utilization of library resources | 74. Percent increase in the number of beneficiaries from library resources. | |
| Utilization of online resources | 75. Percent increase in the number of beneficiaries from online resources. | |
| Utilization of sports facilities | 76. Percent increase in the number of beneficiaries from the sports facilities. | |
| Utilization of lab facilities | 77. Percent increase in the number of external beneficiaries from the laboratories (profit and nonprofit activities). | |
| Minimizing risks | Online courses | 78. Proportion of online courses to the total courses offered. |
| Emergency plans | 79. Percentage of emergency plans for which there has been an independent peer assessment in the previous year. | |
| 80. Percentage of emergency plans for which drills have been carried out in the previous year. | ||
| Reserve fund | 81. Annual percent increase in emergency/contingency reserve fund. | |
| Success and growth | Success | 82. Percentage increase in graduation to enrollment ratio in one year. |
| Growth | 83. Percentage increase in the number of students admitted to the program in one year. |
| Elements of TBL | Measures of Excellence | UN’s SDGs | Sustainability Indicators |
|---|---|---|---|
| Socio-cultural impacts | Infusion of sustainability in curricula | SDG 4: quality education | 1. Percentage of courses that address the sustainability objectives in the curriculum. |
| 2. Percentage of faculty working on sustainability research projects. | |||
| 3. Percentage of sustainability-related ISI publications and patents on sustainability issues of the total ISI publications and patents in one year. | |||
| 4. Percentage of senior projects that address one or more sustainability objectives. | |||
| Ethics and professionalism in curricula | SDG 4: quality education | 5. Percentage of courses that address ethics and professionalism in the curriculum. | |
| International cooperation and partnership | SDG 17: partnership | 6. Ratio of the number of international agreements, MOU, partnerships, cooperation, student exchange, joint research, and so on in one year to those carried out by the world’s best practicing institute in one year. | |
| Sustainability-oriented research | SDG 9: industry, innovation and infrastructure | 7. Percentage of MS and PhD theses that address one or more sustainability objectives. | |
| 8. Percentage of sustainability-related research projects from the total number of projects funded by the institution in one year. | |||
| 9. Percentage of funds provided for sustainability-related research from the total research fund provided by the institution in one year. | |||
| 10. Proportion of faculty working on sustainability research. | |||
| 11. Proportion of sustainability-related ISI publications and patents on sustainability issues of the total ISI publications and patents in one year. | |||
| Community engagement, philanthropy, and volunteerism | SDG 3: good health and wellbeing | 12. Percentage of full-time teaching and other staff actively engaged in community service activities in one year. | |
| 13. Percentage of alumni engaged in one or more community service activities in one year. | |||
| 14. Ratio of the number of general public activities, workshops, and awareness campaigns carried out by the institution to those carried out by the world’s best practicing institute in one year. | |||
| Heritage conservation and respect of cultural beliefs | SDG 11: sustainable cities and communities | 15. Percentage of master’s and doctoral theses dealing with an idea to preserve the heritage or archaeological sites. | |
| 16. Percentage of credit hours in the curriculum allocated to cultural beliefs and practices of the society, such as religion, linguistics, history, and literature subjects. | |||
| Health and safety | SDG 3: good health and wellbeing | 17. Percentage of senior projects that address one of the health or safety issues. | |
| Diversity and equality | SDG 10: reduced inequality | 18. Percent of expatriated faculty and staff to the total number of faculty in the institute. | |
| 19. Percent of expatriated students to the total number of students in the institute. | |||
| 20. Ratio of average salaries of expatriated faculty and staff to the average salary in the institution. | |||
| Gender equity | SDG 5: gender equity | 21. Percent of female students to the total number of students in the institution. | |
| 22. Percent of female faculty to the total number of students in the institution. | |||
| Ecological footprint | Reducing energy consumption | SDG 7: affordable and clean energy | 23. Inverse of the ratio of electricity consumption per student a year to the consumption in the world’s best practicing institute. |
| Reducing water consumption | SDG 6: clean water and sanitation | 24. Inverse of the ratio of water consumption per student a year to the consumption in the world’s best practicing institute. | |
| Waste management | SDG 12: responsible production and consumption | 25. Inverse of the ratio of waste produced per student a year to its value in the world’s best practicing institute. | |
| 26. Percent of recycled waste of the total waste produced | |||
| Minimizing CO2 emissions | SDG 13: combatting climate change | 27. Ratio of carbon emission per student a year to the same value in the world’s best practicing institute. | |
| Clean and renewable energy | SDG 7: affordable and clean energy | 28. Ratio of funded projects dealing with the renewable energy to all funded research projects in one year. | |
| Economic impacts | Knowledge economy | SDG 9: industry, innovation and infrastructure | 29. Ratio of industry-funded projects to all funded research projects in one year. |
| Generation of business | SDG 8: economic growth | 30. Proportion of graduates establishing their own business to the total number of graduates in five years after graduation. | |
| Enrichment of job market | SDG 8: economic growth | 31. Percentage increase in the number of graduates from the program in one year. | |
| Local university expenditures | SDG 8: economic growth | 32. Percent of the university local supplies of the total university budget. | |
| 33. Percent of the external guests of the university-held conferences of the total number of conferences’ attendees in one year. | |||
| Economically autonomous universities | SDG 8: economic growth | 34. Percent of self-generated funds of the total expenditure of the institute in one year. |
| Customer Requirements/Needs | Average (0–7) | Standard Deviation |
|---|---|---|
| Addressing health, safety, and wellbeing | 6.05 | 1.69 |
| Addressing ethics and professionalism in the curricula | 5.95 | 1.77 |
| Reducing energy consumption | 5.82 | 2.21 |
| Addressing sustainability in curricula | 5.68 | 1.77 |
| Waste management | 5.68 | 1.89 |
| Reducing water consumption | 5.55 | 2.19 |
| Generation of business | 5.48 | 1.87 |
| Enrichment of job market | 5.45 | 1.83 |
| Enhancing knowledge-based economy | 5.43 | 1.94 |
| Minimizing CO2 emissions | 5.41 | 2.23 |
| Clean and renewable energy research | 5.38 | 2.28 |
| Sustainability-oriented research | 5.14 | 2.28 |
| Community engagement, philanthropy and volunteerism | 4.95 | 2.31 |
| Improving life on land | 4.90 | 2.29 |
| Enhancing international cooperation and partnership | 4.86 | 1.98 |
| Heritage conservation and respect of cultural beliefs | 4.76 | 2.62 |
| Economically autonomous universities | 4.67 | 2.51 |
| Local university expenditures | 4.62 | 2.10 |
| Enhancing diversity and equality | 4.59 | 2.35 |
| Initiatives to reduce hunger | 3.95 | 2.46 |
| Poverty reduction research | 3.86 | 2.60 |
| Initiatives to reduce poverty | 3.71 | 2.43 |
| Enhancing gender equity | 3.68 | 2.53 |
| Life on land in curricula | 3.50 | 2.54 |
| Hunger reduction research | 3.36 | 2.51 |
| Improving life below water | 3.00 | 2.49 |
| Addressing peace and justice | 2.90 | 1.95 |
| Life below water in curricula | 2.72 | 2.47 |
| TBL Aspects | Cronbach’s Alpha |
|---|---|
| Socio-culture requirement (14) | 0.938 |
| Environmental requirement (7) | 0.902 |
| Economic requirement (7) | 0.920 |
| TBL Aspects | Customer Requirements/Needs | Sustainable Development Goals |
|---|---|---|
| Socio-culture | Addressing sustainability in curricula | SDG4: quality education |
| Addressing ethics and professionalism in the curricula | SDG4: quality education | |
| Enhancing international cooperation and partnership | SDG17: partnership | |
| Sustainability oriented research | SDG9: industry, innovation, and infrastructure | |
| Community engagement, philanthropy and volunteerism | SDG3: good health and wellbeing | |
| Heritage conservation and respect of cultural beliefs | SDG11: sustainable cities and communities | |
| Addressing health, safety, and wellbeing | SDG3: good health and wellbeing | |
| Enhancing diversity and equality | SDG10: reduced inequality | |
| Enhancing gender equity | SDG5: gender equity | |
| Environment | Reducing energy consumption | SDG7: affordable and clean energy |
| Reducing water consumption | SDG6: clean water and sanitation | |
| Waste management | SDG12: responsible production and consumption | |
| Minimizing CO2 emissions | SDG 13: combatting climate change | |
| Clean and renewable energy research | SDG7: affordable and clean energy | |
| Economy | Enhancing knowledge-based economy | SDG9: industry, innovation, and infrastructure |
| Generation of business | SDG8: economic growth | |
| Enrichment of job market | SDG8: economic growth | |
| Local university expenditures | SDG8: economic growth | |
| Economically autonomous universities | SDG8: economic growth |
| Order | Sustainability Development Goal | Prioritized Score |
|---|---|---|
| 1 | SDG2: zero hunger | 78.7 |
| 2 | SDG6: clean water and sanitation | 77.0 |
| 3 | SDG1: no poverty | 76.1 |
| 4 | SDG3: good health and wellbeing | 73.2 |
| 5 | SDG4: quality education | 66.6 |
| 6 | SDG 13: combatting climate change | 66.3 |
| 7 | SDG15: life on land | 65.5 |
| 8 | SDG14: life underwater | 59.6 |
| 9 | SDG7: affordable and clean energy | 56.6 |
| 10 | SDG16: peace and justice | 54.6 |
| 11 | SDG12: responsible production and consumption | 53.7 |
| 12 | SDG11: sustainable cities and communities | 51.9 |
| 13 | SDG10: reduced inequality | 50.4 |
| 14 | SDG5: gender equity | 49.3 |
| 15 | SDG8: economic growth | 44.8 |
| 16 | SDG9: industry, innovation, and infrastructure | 36.0 |
| 17 | SDG17: partnership | 34.3 |
| Elements of TBL | Measures of Excellence | UN’s SDGs | Sustainability Indicators |
|---|---|---|---|
| Socio-cultural impacts | Poverty reduction research | SDG1: no poverty | 35. Percentage of MS and PhD theses that address poverty reduction objectives. |
| 36. Percentage of poverty reduction research projects from the total number of projects funded by the institution in one year. | |||
| 37. Percentage of funds provided for poverty reduction research from the total research fund provided by the institution in one year. | |||
| 38. Proportion of faculty working on poverty reduction research. | |||
| 39. Proportion of sustainability-related ISI publications and patents on poverty reduction issues of the total ISI publications and patents in one year. | |||
| Hunger reduction research | SDG2: zero hunger | 40. Percentage of MS and PhD theses that address hunger reduction objectives. | |
| 41. Percentage of hunger reduction research projects from the total number of projects funded by the institution in one year. | |||
| 42. Percentage of funds provided for hunger reduction research from the total research fund provided by the institution in one year. | |||
| 43. Proportion of faculty working on hunger reduction research. | |||
| 44. Proportion of sustainability-related ISI publications and patents on hunger reduction issues of the total ISI publications and patents in one year. | |||
| Addressing peace and justice in curricula | SDG16: peace and justice | 45. Percentage of courses that address peace and justice in the curriculum. | |
| Addressing life on land in curricula | SDG15: life on land | 46. Percentage of courses that address life on land in the curriculum. | |
| Addressing life below water in curricula | SDG14: life below water | 47. Percentage of courses that address the life under water in the curriculum. |
Publisher’s Note: MDPI stays neutral with regard to jurisdictional claims in published maps and institutional affiliations. |
© 2021 by the authors. Licensee MDPI, Basel, Switzerland. This article is an open access article distributed under the terms and conditions of the Creative Commons Attribution (CC BY) license (https://creativecommons.org/licenses/by/4.0/).
Share and Cite
Al-Bahi, A.M.; Abd-Elwahed, M.S.; Soliman, A.Y. Implementation of Sustainability Indicators in Engineering Education Using a Combined Balanced Scorecard and Quality Function Deployment Approaches. Sustainability 2021, 13, 7083. https://0-doi-org.brum.beds.ac.uk/10.3390/su13137083
Al-Bahi AM, Abd-Elwahed MS, Soliman AY. Implementation of Sustainability Indicators in Engineering Education Using a Combined Balanced Scorecard and Quality Function Deployment Approaches. Sustainability. 2021; 13(13):7083. https://0-doi-org.brum.beds.ac.uk/10.3390/su13137083
Chicago/Turabian StyleAl-Bahi, Ali M., Mohamed S. Abd-Elwahed, and Abdelfattah Y. Soliman. 2021. "Implementation of Sustainability Indicators in Engineering Education Using a Combined Balanced Scorecard and Quality Function Deployment Approaches" Sustainability 13, no. 13: 7083. https://0-doi-org.brum.beds.ac.uk/10.3390/su13137083