Article

Entrepreneurship Ecosystem Performance in Egypt: An Empirical Study Based on the Global Entrepreneurship Index (GEI)

by
Mohamed Abouelhassan Ali
1,2,*,
Moaaz Kabil
2,3,*,
Rahaf Alayan
3,
Róbert Magda
3,4 and
Lóránt Dénes Dávid
3
1
Doctoral School of Regional Policy and Economics, Faculty of Business and Economics, University of Pécs, 7622 Pécs, Hungary
2
Regional Urban Development Department, Faculty of Urban and Regional Planning, Cairo University, 12613 Giza, Egypt
3
Doctoral School of Economic and Regional Sciences, Hungarian University of Agriculture and Life Sciences (MATE), 2100 Godollo, Hungary
4
Vanderbijlpark Campus, North-West University, 1900 Vanderbijlpark, South Africa
*
Authors to whom correspondence should be addressed.
Sustainability 2021, 13(13), 7171; https://0-doi-org.brum.beds.ac.uk/10.3390/su13137171
Submission received: 24 April 2021 / Revised: 17 June 2021 / Accepted: 18 June 2021 / Published: 25 June 2021
(This article belongs to the Special Issue Social and New Technology Challenges of Sustainable Business II)

Abstract

:
Entrepreneurship is a significant economic process in regional economic development. This study aims to analyze the characteristics of the Egyptian entrepreneurial ecosystem by using the global entrepreneurship index (GEI) data from 2006–2017. This empirical study provides an in-depth insight into the Egyptian entrepreneurship ecosystem situation based on GEI methodology and its sub-indexes, pillars, and individual and institutional variables. Results revealed that the Egyptian entrepreneurial “Aspiration” pillars play a promising role in the Egyptian entrepreneurship ecosystem, especially the “Process Innovation” and “Risk Capital” pillars. Although the entrepreneurial “Abilities” pillars appear as shortcomings in the Egyptian GEI, especially the "Opportunity Startup" and "Competition" pillars. Furthermore, Egyptian entrepreneurial “Attitudes” pillars are considered to be the main disadvantage of forming the Egyptian GEI score. Finally, the paper proved that the “Risk Acceptance” and “Networking” pillars appeared as the weakest aspect of the Egyptian entrepreneurship ecosystem. Consequently, developing national policies and strategies to enhance these two pillars will improve the Egyptian GEI score by 2%.

1. Introduction

Entrepreneurship is considered one of the most significant economic driving force processes that boosts any nation’s economic growth, especially in the context of sustainability. The sustainability approaches are varied between environmental, social sustainability, economic sustainability, and human sustainability. The integration between sustainability and the economic and business sector is gaining significant concern nowadays [1]. Commonly, economic sustainability seeks to preserve the capital intact, while business sustainability aims to use firm assets to maintain its sustainability. Therefore, this study focused on shedding light on economic sustainability from an entrepreneurship perspective. Entrepreneurship is defined as innovative, risk-taking, gap filling, and acquisitive business, while sustainability is a theme of efficiency, equality, and achieving economic viability parallel with sustaining the resources [2]. Although entrepreneurship and sustainability seem to have a contradictory conceptual kernel, they still have an interrelated, close, and widely recognized relation. Entrepreneurship habitually is aware of sustaining its activities and standing as long as possible in a competitive business environment [3]. Consequently, this is considered one of the main pillars and principles of successful entrepreneurship in the sustainability era.
By leading to positive spillovers in the national and regional economies through achieving economic expansion, providing job opportunities, creating new products, and fostering community well-being, entrepreneurship is essential for sustainable economic development [4,5,6].
In recent decades, entrepreneurship has turned into an evolving area of research in academic work. In the entrepreneurship discipline, many academic terms appeared in the entrepreneurship literature. One of the most critical terms that attracted many researchers and scholars was the entrepreneurship ecosystem, also known as Entrepreneurial Ecosystem (EE) [5,6]. Entrepreneurship researchers consider the individual attitudes for entrepreneurs and the economic environment factors to be the main pillars that formed the entrepreneurship ecosystem [7]. Therefore, the paper adopted the entrepreneurial ecosystem as an analytical lens for the Egyptian entrepreneurship profile, which combined individual and institutional aspects.
Accordingly, this study explores the Egyptian entrepreneurial ecosystem from the scope of individual and institutional pillars, aiming to answer the core research question in this paper: what are the principal strengths and weaknesses of the Egyptian entrepreneurial ecosystem? Answering this question contributes to enhancing our understanding of the Egyptian entrepreneurship ecosystem throughout its both aspects: individual and institutional. Accordingly, the Egyptian government can develop and design policies and action plans to promote entrepreneurship based on this analysis and understanding. Besides, this study contributes to expanding the research contributions from the empirical side on entrepreneurship in emerging countries, particularly in the Middle East.
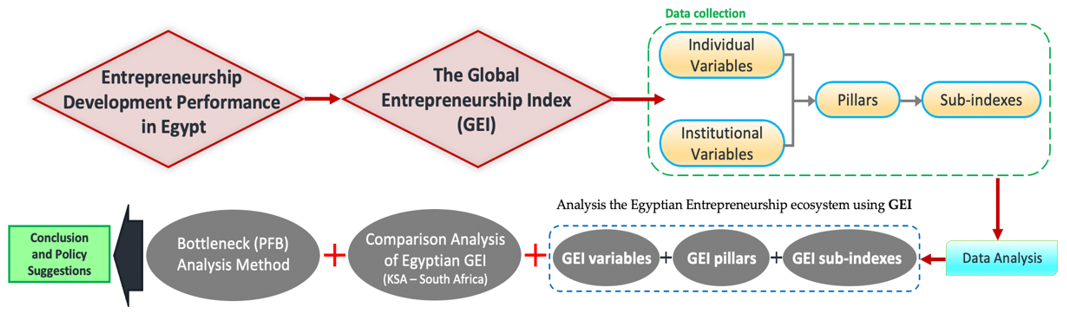
This paper has four key aims. Firstly, use GEI methodology and data to evaluate the Egyptian entrepreneurial ecosystem. Secondly, analyze and assess the Egyptian entrepreneurial profile. Thirdly, identify the strengths and weaknesses of both the institutional and individual variables in the Egyptian entrepreneurial profile. Finally, present recommendations for policymakers.
This article is structured as follows. Firstly, this study presents a literature review of the entrepreneurship ecosystem. Secondly, this paper shows the current Egyptian economic development performance and entrepreneurship context. Thirdly, it presents a summary of GEI methodology and an explanation of the dataset. Fourthly, the paper analyzes the performance of the Egyptian entrepreneurship GEI score through its three sub-indices and pillars, followed by a comparison between the Egyptian GEI score and the score of the other participated countries in the dataset. Fifthly, the paper analyzes the performance of the Egyptian entrepreneurship GEI through the institutional and individual variables, followed by a comparison between the Egyptian GEI score and two other countries: Saudi Arabia and South Africa. Finally, it discusses the Egyptian entrepreneurship profile’s weaknesses and strengths by presenting its penalty-bottleneck performance, followed by suggested policies and recommendations that could improve Egyptian entrepreneurship’s performance.

2. Literature Review: Entrepreneurship Ecosystem

The entrepreneurship ecosystem has been defined through the OECD as “a set of interconnected entrepreneurial actors (both potential and existing), entrepreneurial organizations (e.g., firms, venture capitalists, business angels, banks), institutions (universities, public sector agencies, financial bodies), and entrepreneurial processes (e.g., the business birth rate, numbers of high growth firms, levels of “blockbuster entrepreneurship”, number of serial entrepreneurs, degree of sellout mentality within firms, and levels of entrepreneurial ambition) which formally and informally coalesce to connect, mediate and govern the performance within the local entrepreneurial environment” [8] (p. 5). According to this definition, there are some significant terminologies that depicted the theme of entrepreneurship ecosystem, such as “blockbuster entrepreneurship” and “serial entrepreneurs”. Block-buster entrepreneurship refers to entrepreneurs who manage entrepreneurial companies successfully, exceptional and profitable, which makes them earn wealth and reinvest it in the entrepreneurship ecosystem as investors or mentors [8]. For example, Starbucks, Dell, and Novo’s owners are considered pioneers in the entrepreneurship community (blockbusters). Another entrepreneurship ecosystem’s keyword is “serial entrepreneurs” which represents the passion version of traditional entrepreneurs. In other words, we can say that serial entrepreneurs are people who are extraordinarily innovative when it comes to generating fresh business ideas and then putting those ideas into action to start a new business [
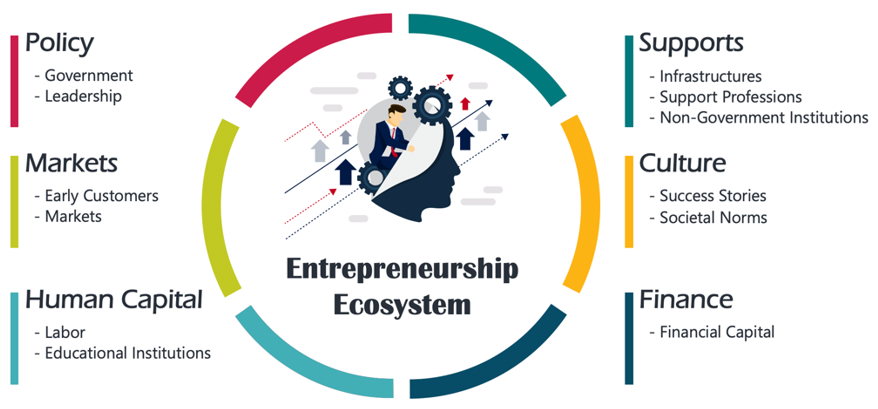
9]. Elon Musk can be presented as a vivid example of a serial entrepreneur in our modern society. Furthermore, the entrepreneurship ecosystem (Isenberg Model) consists of six critical domains, with 12 sub-elements operating in an extraordinarily nuanced and individualistic technique [8,10] (Figure 1). The first domain focused on enabling policies, and it had two main sub-elements: government and leadership. The government sub-element consists of institutional (e.g., investment and support), financial support (e.g., for R&D), regulatory framework incentives (e.g., tax benefits), research institutes, and venture-friendly legislation.
Meanwhile, the leadership sub-element consists of unequivocal support, social legitimacy, open door for advocates, entrepreneurship strategy, and urgency crisis and challenges [11]. The second domain deals with venture-friendly markets for products structured on early customers through early adopters for proof of concept, expertise in productizing, reference customer, and first reviews. The third domain adopted human capital, which focused on labor through skilled and unskilled, serial entrepreneurs, later-generation family, general degrees (professional and academic), and specific entrepreneurship training. The availability of appropriate finance considers the fourth domain from Isenberg’s model view through micro-loans, angel investors, family, venture capital funds, private equity, and public capital markets. The fifth domain was a conducive culture dealing with societal norms through visible successes, wealth for funders, international reputation, innovation, creativity, experimentation, social status of entrepreneurs, and wealth creation. The last domain focuses on a range of institutional supports that appear in infrastructure, support professions, and non-governmental institutions. Where infrastructure representative in telecommunications, transportation, energy zones, incubators, co-working, and clusters. Meanwhile, support professions are representing legal, accounting, and technical experts. Non-governmental institutions contain entrepreneurship promotion in non-profits, business plan contests, entrepreneur-friendly associations [5].
Following that, many researchers defined the entrepreneurship ecosystem but there was a difference in its definition, leading to direct and indirect different entrepreneurship measurements and indexes. These measures have differed literature between the personality measures for entrepreneurs and attitude measures, output measures that focus on activity-related density measures, framework measures that discuss institutional context measures, and the ecosystem’s measures [12]. Although entrepreneurship’s role in economic development is becoming more transparent, entrepreneurship’s developmental policies’ understanding persists insufficient. Economists have attributed this lower understanding due to the contradiction between the definition and the measurements of entrepreneurship [13]. Consequently, there is a significant gap between the quantity indices for entrepreneurship activities and quality indices. Therefore, it can be said that the entrepreneurship ecosystem concept or definition is “not one size fits all”, especially when this ecosystem is connected with the location assets [14]. Therefore, a set of indexes have been developed to measure entrepreneurial competency. Although these indexes have common components to measure entrepreneurship, each index has tailor-made policy recommendations. Additionally, these indexes went through two stages of development, as they were initially concerned with measuring the entrepreneurs by identifying the ability of individuals to become future entrepreneurs. Subsequently, these indexes focused on studying and analyzing the entrepreneurship process itself. Therefore, entrepreneurship indexes are considered useful analytical tools for both the entrepreneurs and the entrepreneurship ecosystems themselves.
One of these indexes is the Kauffman Index of Entrepreneurial Activity (KIEA), which developed in 1996 [15]. The primary idea of this index was to measure a new business creation in the USA from the perspective of the demographic and geographical dimensions of entrepreneurial activity. In other words, this index presents the outputs achieved in the various American states in terms of rates and trends [15]. Another entrepreneurship index is the Santander enterprise index (SEI), created by the global entrepreneurship and development institute (GEDI) [16]. It is an annual index ranking of the UK’s regional entrepreneurial ecosystems. It is considered one of the first indexes that dealt with the concept of entrepreneurial ecosystems. Additionally, SEI confirmed the importance of the resources, local economic infrastructure, and societal attitudes toward entrepreneurship as crucial factors for entrepreneurs’ success [16]. The Legatum prosperity index (LPI) which Legatum Institute established considered a third example of the entrepreneurship indexes [17]. According to the 2020 report, LPI contains 12 pillars of prosperity, including entrepreneurship, to reveal the ranking of 167 countries from the view of most and least prosperous performance of country success [17]. Lastly, the Ivey entrepreneurs index, which developed by Ivey Business School at Western University in Canada [18]. This index aims to recognize entrepreneurs’ ability and optimism level for Canada’s entrepreneurs through effective consults related to operational, financial, and business challenges.
Furthermore, some other measures are dealing with different aspects of the entrepreneurship ecosystem such as the global entrepreneurship monitor (GEM) [19], global entrepreneurship index (GEI) [20], ease of doing business (EDB) [21], national entrepreneurship context index (NECI) [22], regional entrepreneurship and development index (REDI) [23], and global competitiveness index (GCI) [24] are the well-known main measurements of the entrepreneurial ecosystem. Every measure has its own approach to describe and analyze the entrepreneurial ecosystem. For example, the global entrepreneurship monitor (GEM) is a single-level measure that provides entrepreneurship indicators which are mainly measured by self-employment and total early-stage activity (TEA) at the country’s level [25]. GEM’s primary deficiency is the combination of low quality and highly masterly business types “gazelles” [26]. “Gazelles” as a term appeared in the 1980s by David Birch and referred to the young, fast-growing, rapidly rising sales, and rapidly expanding workforce firms [27,28,29]. David Birch defined this term in his book for the first time as "one that doubles its sales every four years" [30]. What distinguishes these types of companies is their ability to enhance economies by creating enormous job opportunities.
Additionally, other recently common characteristics of gazelles were that these types of companies had been high-tech or internet firms, which looked up to regular expansion for capital turnover and employment opportunities [28]. Another measure is the ease of doing business index (EDB), which measures the regulatory context of the business environment [21]. Therefore, it partially deals with the quality of the output, lacking a holistic view of the entrepreneurial ecosystem.
Although the diversity of the entrepreneurial ecosystem indexes and measures, most of them focused on discussing the individual and contextual entrepreneurship levels only [13]. Furthermore, these indexes only measure the quantity output, not containing the quality output of individual entrepreneurs’ activities and calculating them as a representative measure for country-level [12,31]. The national measuring system needs a sound approach from the empirical and conceptual aspects to achieve its goals [12]. It should also deal with these national entrepreneurship systems as an interaction between entrepreneurial ability, attitudes, and entrepreneurial aspirations [12]. In this context, most measures of the entrepreneurial ecosystem should include measurements of the varied system-level framework conditions with individual-level measures to provide proper context. Moreover, the indexes should allow interaction between the system components through the system dynamics.
For these considerations, the global entrepreneurship index (GEI) is presented as a comprehensive and systemic approach to measuring the entrepreneurship ecosystem within the country [12]. For these reasons, this paper focuses on studying and analyzing the global entrepreneurship index (GEI) as the primary measure to identify the entrepreneurship ecosystem performance in Egypt. The global entrepreneurship index (GEI) opted in this study for three main reasons: (i) it provides an exhaustive measurement of country-level entrepreneurial ecosystems, (ii) GEI combines institutional and individual factors in a single framework, reflecting the factors influencing the Egyptian entrepreneurship ecosystem development, and (iii) the regularity of Egypt’s participation in GEI through the selected period for analysis.

3. Methodology, Materials, and Methods

In general, the core aim of this research is to analyze the entrepreneurship ecosystem performance in Egypt. Based on this aim, this study investigated the Egyptian entrepreneurial ecosystem situation through the GEI pillars; (i) sub-indexes level (3 sub-index), (ii) pillars level (14 pillars), and individual and institutional variables level (28 variables). Before that, the paper will present a general overview of the entrepreneurship sector in Egypt and an explanation of the GEI methodology mechanism. The methodology of this paper can be seen in Figure 2 below.

3.1. Entrepreneurship Development Performance in Egypt

Egypt is considered one of the lower-middle-income countries in the Middle East and North African region [32]. According to the Egyptian Central Agency for Public Mobilization and Statistics (CAPMAS), Egypt’s population surpassed 100 million in 2020 with an annual population growth of 2% [33]. The gross domestic product per capita (GDP) in Egypt averaged 11,763.3 US dollars in 2020 when adjusted by purchasing power parity (PPP), equivalent to 62% of the world’s average [34]. Through the last decade, the Egyptian economy went through critical economic challenges; one of them is the increase in unemployment rates that jumped from 8.7% in 2010 to 13.15% in 2013, before it declined again to 9.7% in 2020. In this context, supporting the private sector and entrepreneurs’ encouragement was the key strategy of the Egyptian government to reduce and control the unemployment rates [34,35]. Therefore, the study focused on studying the Egyptian context, a case study, to discover the changes in the Egyptian entrepreneurship development due to the challenges in the last decade. Besides determining the weakness and strength points of the Egyptian entrepreneurship environment.
Regarding the global indicators measuring the Egyptian entrepreneurial ecosystem, Egypt’s score was 55 in the global competitiveness index (GCI) in 2019 and ranked 93rd globally with an increase from the previous year where Egypt’s score was 53.5 [24]. According to the ease of doing business measure (EDB), Egypt scored 60.1 and ranked 114th in 2020 [32], with observable development from the previous ranking in 2019 where it scored 58.56 and ranked 120th globally [36]. In 2019, Egypt ranked 92nd in the global innovation index (GII) with a score of 27.47, where the global median was 33.86 [37].
The Egyptian situation in the previous insights and indicators confirmed the positive momentum on entrepreneurship in Egypt as mentioned in the latest national report for global entrepreneurship monitor [38]. This report reminded that Egypt’s entrepreneurship ecosystem has developed on more procedures such as: several venture capital funds that have opened, more technology startups have become prominent, and the micro, small, and medium enterprises development agency (MSMEDA) were initiated with authorization of supporting entrepreneurship and SMEs [39]. Additionally, the development of entrepreneurship propagation support programs accelerators, incubators, startups, and ambitious reform programs for the educational sector including primary education, technical and vocational education and training (TVET), and university education [38]. According to “EgyptInnovate”, the online innovation hub for Egypt owned by technology innovation and entrepreneurship Center (TIEC), Egypt had 653 startups, 26 accelerators and incubators, and 137 co-working spaces [40].
With an overview of the entrepreneurship ecosystem in Egypt, the SMEs sector is considered a core driving force in the Egyptian economy. Egyptian SMEs represent about 90% of the total industrial sector firms and share about 25% of the GDP, and approximately 85% of the employment [41]. Additionally, if we add micro-enterprises to SMEs, we find that more than 2.5 million SMEs in Egypt and nearly 39,000 new SMEs enter the production field annually. In addition, the Egyptian government paid great attention to the entrepreneurship system through a set of initiatives. For example, in 2017, the Egyptian government established the micro, small, and medium enterprises development agency (MSMEDA) in order to develop the SMEs sector and entrepreneurship [42]. These initiatives encourage startups and entrepreneurs to participate in employment, the economy’s performance, and sustainable growth in a more efficient way [34]. It is substantial to note that Egypt’s entrepreneurial activity is driven mainly by necessity than opportunity, where the necessity-paying entrepreneurship represents 33.3% of the TEA percentage, while the opportunity-paying entrepreneurship constitutes about 23% of TEA [34,43]. Additionally, the incubation and acceleration of entrepreneurial initiatives not only from the public, private and academic sectors but also from the social sector (NGO) which are considered a significant promoter in the Egyptian entrepreneurship ecosystem [44].
From the policy development procedures and based on Egypt’s vision 2030, the country started making efficient procedures to develop the entrepreneurship ecosystem and MSMEs initiatives. Egypt’s vision 2030 is a government agenda released in 2016 and represents the Egyptian government’s long-term action strategy to enhance sustainable development goals (SDG) in different economic sectors [45]. This vision is focusing on three main dimensions: social, economic, and environmental. In order to achieve the sustainability principles in the economic dimension, Egypt’s vision 2030 developed many action plans and strategies to promote the private sector and entrepreneurship [45]. For example, the 2018 MSME’s national strategy aimed to achieve a sustainable development strategy for the Egyptian entrepreneurship ecosystem [39]. This strategy was adopted to improve the regulatory and legislative environment, simplify the regulatory ecosystem for entrepreneurs, curtail administrative encumbrances, and create an extent of financial and non-financial motivations to encourage the informal sector to merge into the formal sector [46]. Additionally, the strategy aimed to evolve a culture of entrepreneurship and promote an entrepreneurship ecosystem by incubating entrepreneurship programs and innovation centers in the CBDs to incorporate with universities in cities and regions such as the New Administrative Capital in eastern Cairo, Egypt [47,48].

3.2. The Global Entrepreneurship Index (GEI)—Motivations and Considerations

With the fact that there are various measures of the entrepreneurship ecosystem, the global entrepreneurship index (GEI) presents a broad vision of the entrepreneurship ecosystem at the country level. Authors of the GEI Index (2018) defined entrepreneurship as the dynamic, institutionally embedded interaction between entrepreneurial attitudes, entrepreneurial abilities, and entrepreneurial aspirations by individuals, which drives the allocation of resources through the creation and operation of new ventures" [49] (p. 93). The GEI measures the entrepreneurship ecosystem based on this definition. For this, the GEI authors have used a four-level index to structure the GEI ’super index’ [49]. The first level is based on variables; these variables have made up the pillars that formed the three core sub-indices. The variables were varied between individual and institutional (see Table 1). The second level contains the fourteen pillars (see Appendix A; Table A1). These pillars structured the three sub-indices: entrepreneurial attitudes, entrepreneurial abilities, and entrepreneurial aspirations, which have built the GEI “super index”.
The entrepreneurial attitudes sub-index has five pillars: opportunity perception, start-up skills, risk acceptance, networking, and cultural support. The entrepreneurial ability sub-index has four pillars: opportunity startup, technology absorption, human capital, and competition. Finally, the entrepreneurial aspiration sub-index has five pillars: product innovation, process innovation, high growth, internationalization, and risk capital [49,50].
Table 1 presents the GEI structure through sub-indices, pillars, and variables. Lastly, the GEI provides the bottleneck alleviation-based policy recommendations for each country. As defined by Autio et al. (2012) for the penalty for bottleneck method (PBM) method, a bottleneck is determined as “the weakest link or binding constraint in the national entrepreneurial dynamic” [51] (p. 34). This method contains a selection of individual and institutional variables. Based on this, the entrepreneurial ecosystem’s pillars are built using the interaction variables method, followed by using a benchmarking system to deal with outliers. Using the normalization method, followed by average pillar adjustment, to apply GEI for public policy purposes, the method uses a penalizing way to create a pillar-adjusted value. From the average of pillars adjusted values, the sub-indices values are calculated by percentage values. From the average of these indices, the founders of the global entrepreneurship index have calculated the GEI score [51]. The importance of this method is that it shows bottleneck aspects that influence entrepreneurship performance at the country level [51]. If the bottleneck component upgrades the sub-indices, the GEI index will display considerable improvements. Consequently, the proposed policies should address the weakest pillars by improving the bottleneck factor [52].

3.3. Data Collection

This research used GEI’s raw data for the period 2006–2017 from 73 countries. The GEI founders collected the data through eight steps, as follows [31]. Firstly, the selection of variables from the original countries sources, which varied between individual (14 variables) and institutional (14 variables) levels. Secondly, the construction of the pillars through the interaction variable method. Thirdly, normalization of the pillars through distance method; this technique compares the selected country’s performance to the best-performing country. Fourthly, making capping for the variables where the index-building is based on a benchmarking rule. Fifthly, making average pillar adjustment by equalizing the components’ marginal effects only on the countries’ average pillar values. Sixthly, penalizing the pillars through the penalty for bottleneck methodology to create the values for pillar-adjusted. Seventhly, building sub-index calculation of entrepreneurial attitudes, entrepreneurial abilities, and entrepreneurial aspirations. Lastly, the determination of the global entrepreneurship index (GEI) considers the average of the three sub-indices.
The trendline correlation between gross domestic product (GDP) per capita in 2011 with GEI score based on average 2015–2017 has shown a high positive correlation with 0.80 (see Figure 3a). In this context, the three sub-indices components for GEI score varied related to GDP per capita. From the charts, we can conclude that the relationship between GDP per capita versus the GEI and its sub-indices has shown on the best-fitting model through the 73 countries samples signed with R-squares moderately higher rates. Therefore, it indicates that the extended model was logical and can provide the best results explanation.
Returning to the Egyptian profile; the GEI index for Egypt has scored a predicted value for GEI and the same case for the ABT sub-index score in Figure 3a,c, respectively. In contrast, the ATT sub-index scored a far score from the predicted value, as in Figure 3b. ASP scored more than the Egyptian context’s expected value, as shown in Figure 3d, indicating a good impression for the Egyptian entrepreneurial aspiration sub-index. In sum, the relation between GDP per capita versus the GEI, ABT, ATT, and ASP shows a strong relationship with the best fitting model through highly R-squares results. Table 2 presents the classification for participated countries in the 2006–2017 survey based on GDP categories with GEI ranking. Egypt ranks 61st places in GEI and is classified in the fifth category for GDP values from the origin six categories, indicating that the GEI index’s improvement will support GDP per capita, reflecting economic development.

4. Results and Discussion

4.1. Egyptian Entrepreneurial Performance Based on the GEI: Trends of Sub-Indexes and Pillars

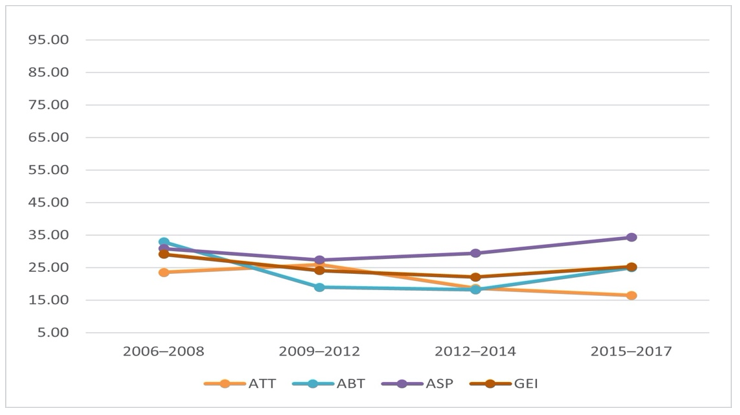
Based on Egypt’s participation in GEI data through the period 2008–2017, Figure 4 shows the development of GEI scores over time. The lowest GEI score was in 2012 due to the social and economic issues that accompanied the Egyptian revolution of 2011. This revolution began in December 2011, when mass demonstrations broke out all over Egypt protesting against poverty, government corruption, unemployment, and low economic levels in the country. Subsequently, Egypt went through various drastic changes that affected all the economic sectors and processes. After this period, the Egyptian GEI scores expanded to increase social and economic opportunities [38]. Therefore, the tendency has increased after the revolution period by a growth of 4.6% between 2012 and 2016. This reflects the improvement of GDP annual growth from 2.22% in 2012 to 4.34% in 2016; followed by a high fluctuation from 2016 to 2017, with a 4.18% decline in GDP growth.
Aspiration sub-index (ASP) records progress over time, with an annual average increasing to 1.15% from 2006 to 2017, and hit the peak in 2015/2017. This entrepreneurial aspiration sub-index seems to have a substantial aspect in the Egyptian entrepreneurship ecosystem. This might be due to the significant progress in the Egyptian economy’s annual GDP growth, which increased from 1.675% in 2011 to 5.314% in 2018 [35]. Regarding the attitudes sub-index (ATT) records, the annual average score retreated by 2.36% from 2006 to 2017. Accordingly, the entrepreneurial attitudes sub-index seems to be a weak aspect of the Egyptian entrepreneurship ecosystem.
The abilities sub-index (ABT) recorded a retreat of 2.36% from 2006 to 2017, with a slight improvement from 2014 to 2017 and achieved its highest score in 2017. The entrepreneurial ability sub-index seems a weak aspect, with a slight improvement in the last years from 2014. Based on the doing business project, the startup procedures to register a business for Egypt stayed flat curve from 2008 to 2017 without any improvements, but decreasing by 5% till 2019. A closer analysis reveals that the overall decline in the Egyptian GEI index value was due to the slight fall in the attitudes and the abilities sub-indexes. Overall, this drop remains unclear from 2012 to 2016, though Arab spring events that influenced Egypt’s economic growth and affected the entrepreneurial ecosystem in general. The Arab spring events affected the economic systems in some of the MENA region countries, including Egypt. One of the challenges that led to the uprisings is the exclusion of the economic opportunities from most people to the power class, besides some social and political challenges [49]. These obstacles and challenges undermined worked Egyptian entrepreneurial ecosystem performance.
To emit more light on explaining these tendencies, we next examine the Egyptian entrepreneurial sub-indices pillars’ analysis. 
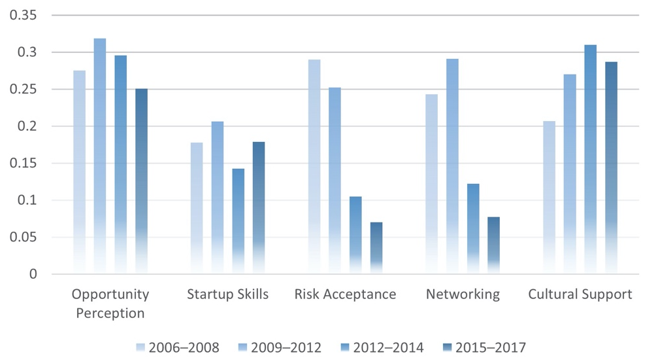
Figure 5 shows the trends for the constituent pillars of the attitudes sub-index. We can see that the movement from 2012 to 2017 was at least mildly declining for all pillars, excluding the startup skills and culture support pillars. There was a significant drop in the risk acceptance and networking pillars in 2012. The startup skill pillar exhibits a light increasing trend from 2012 to 2017, especially in 2009–2012.
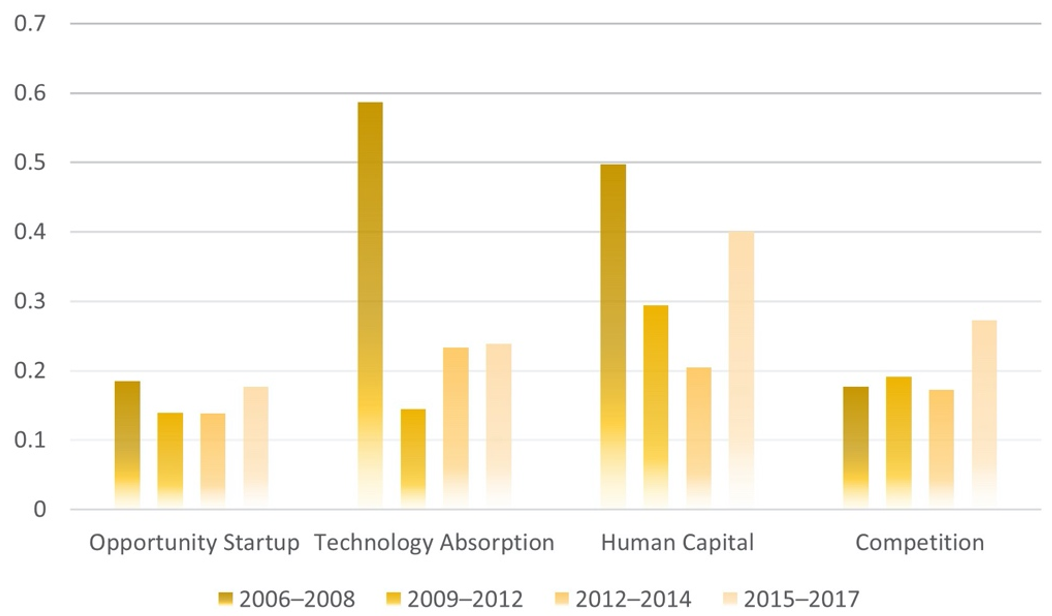
Furthermore, the culture support pillar exhibits an increasing trend from 2009 to 2015, with a slight decline through the 2015–2017 period. Egyptian entrepreneurial abilities pillars revealed different trends (see Figure 6). In 2009, there was a vivid rise in technology absorption, competition, and opportunity startup pillars, possibly due to those more people being in self-employment in post-revolution 2011. Interestingly, the human capital pillar shows a u-curve pattern that bottoms out in 2012. This trend could be explained through the firms’ target of reducing job opportunities to mitigate the effects of the economic recession after the Egyptian revolution in 2011.
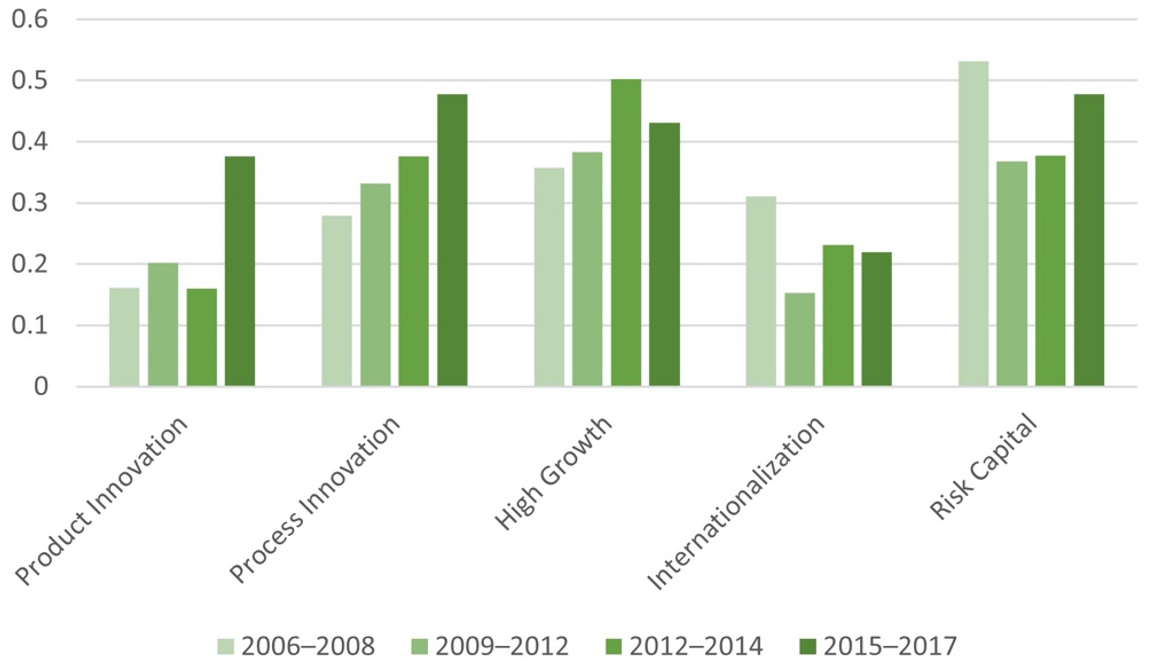
Figure 7 shows the trends for the constituent pillars of the aspirations sub-index. It can be seen that the trend from 2006–2017 increased for all pillars, excluding the internationalization pillar. However, there was a sharp drop from 2009 in the internationalization pillar, followed by slight improvements in 2014. Furthermore, the process innovation and product innovation pillars exhibit a remarkable mounting. Although the trend is somewhat less clear for the high growth pillar, where scored increasing trend to 2014 with a retreat from 2015–2017, this decline could be explained by the decrease in the Egyptian GDP growth annual rate from 4.4% to 4.1%.

4.2. The Analysis of Egyptian Entrepreneurial Profile

This part analyzes the 14 pillars, which are the component of the GEI sub-indices. Based on GEI’s dataset from 2006–2017, data from 73 countries were available. Therefore, the following analysis has compared the Egyptian profile to 33% and 67% of the engaged countries. The aim of this analysis illustrates the Egyptian condition of GEI pillars comparing to other participated countries. The previous study of GEI sub-indices has cleared that the Egyptian term has strong points in entrepreneurial aspirations and abilities sub-indices.
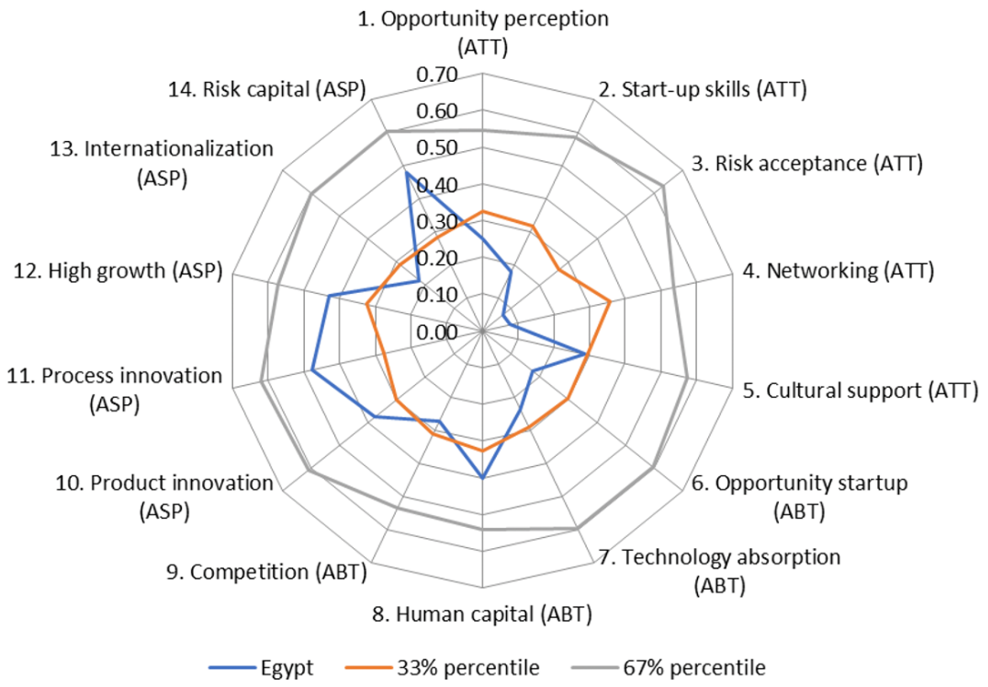
The economic issues post-revolution (2011) have influenced the unemployment rate, which in turn decreases entrepreneurial attitude. According to the entrepreneurial attitude pillars, risk acceptance, and networking pillars are the weakest aspects with a score below the 33% countries’ bottom, as shown in Figure 8. Among the three sub-indices, entrepreneurial aspiration contributes best to the Egyptian GEI score, which indicates that the country has a moderately qualitative and distinguishing nature of entrepreneurial activities. Compared to GEI countries over the period, entrepreneurial aspiration places Egypt approximately in a promising position at 44th rank, while entrepreneurial abilities set it in 58th and entrepreneurial attitude puts it in the weakest rank 71st. As shown in Figure 8, all Egyptian entrepreneurial pillars are below the top 67 percentile; some pillars are considered bright pillars from the Egyptian context such as risk capital, high growth, process innovation, and product innovation. These pillars were recorded between scores ranging from the lowest (33%) and the highest (66%). In contrast, nine entrepreneurial pillars have below the lowest 33% of the participating countries; besides, all entrepreneurial attitudes pillars, further opportunity startup, technology absorption, and competition from the entrepreneurial ability pillars.
In sum, the Egyptian entrepreneurship profile is still below performance levels, where around two-thirds of the total 14 entrepreneurial pillars below the lowest 33 percentile from the participated countries in the dataset. Meanwhile, there are five pillars within the range between the most economical and the highest percentile, which must be maintained and improved to reach the most top score percentile.

4.3. The Analysis of Entrepreneurial Profiles-Institutional vs. Individual Variables

Based on an analysis of the Egyptian situation, more than 70% of institutional variables have a dramatic retreat and scored less than the average for the 25% least of the participated countries, especially the institutional variables for entrepreneurial attitudes and abilities sub-indices. The weak institutional variables were freedom, education, country risk, connectivity, and corruption, as shown in Table 3. Indeed, the country’s freedom degree influences the entrepreneurship ecosystem, which retreats from 2009 to 2017 by the total score for economic freedom 5.05 with a late ranking 155 of 162 participated countries [54].
The entrepreneurial abilities variables have shown fewer scores, and these weak variables were governance, technology absorption, labor market, and competitiveness and regulation. As mentioned above in the overview economic performance section, the competitiveness index for Egypt improved, but other aspects still need improvement, such as governance. On the other hand, the variables of entrepreneurial aspirations have shown progress compared to the 2nd 25% of the participated countries and 3rd 25%, excluding the economic complexity depth of capital variable, which has retreated at scored 0.40. Overall view, the institutional variables for Egyptian condition have scored 0.38, which was less than the average for 25% of the participating countries.
In contrast, the individual variables have shown strong points and scored 0.62 overall, higher than the 3rd 25% of participated countries. Examples of these variables are: career status, educational level, and new technology which are considered strength aspects for the Egyptian entrepreneurial index. These variables have appeared as the highest score compared to the 25% best country. Besides, some institutional variables have achieved progress, compared to the 3rd 25% of the countries such as opportunity recognition, risk perception, and gazelle.
Nevertheless, the institutional variables have some declining variables and are considered disadvantage points in the Egyptian entrepreneurship ecosystem. In addition, the entrepreneurs and opportunity motivation variables have shown retreat in their scores. Finally, the analysis of the institutional and individual variables has demonstrated that the Egyptian entrepreneurship index has weak institutional variables with some progress and strength points in individual variables.

4.4. Comparison Analysis for Egyptian Context

This part discusses Egypt’s GEI Profile compared to other two countries: Saudi Arabia and South Africa. The choice of these two countries was based on criteria such as being in the same spatial and geographic region (the Middle East and Africa), population size, a close GEI score with the Egyptian condition, and the variety of economic levels in these two countries. In addition to the previous criteria, it can be said that the entrepreneurship practices in Saudi Arabia and South Africa were one of the main reasons for choosing these two countries particularly. For example, in Saudi Arabia, there are many government initiatives carried out to enhance the KSA entrepreneurship ecosystem. In 2015, for instance, there was a significant shift in the government policies where the Saudi SME authority developed a board coordination strategy between different stakeholders [55]. This strategy aimed to promote the networking pillar in GEI by identifying the problems and challenges faced by the entrepreneurs and overcome it by providing new laws and regulations. Moving to South Africa, with its high unemployment rate and low economic growth, the national government was focusing on pushing the entrepreneurship ecosystem by improving the abilities and skills of the entrepreneurs [56,57]. By conducting reconstruction and development program (RDP), which started in 1994, the South Africa government indicated that entrepreneurship education is a core pillar to improve TEA in GEI measure [58].
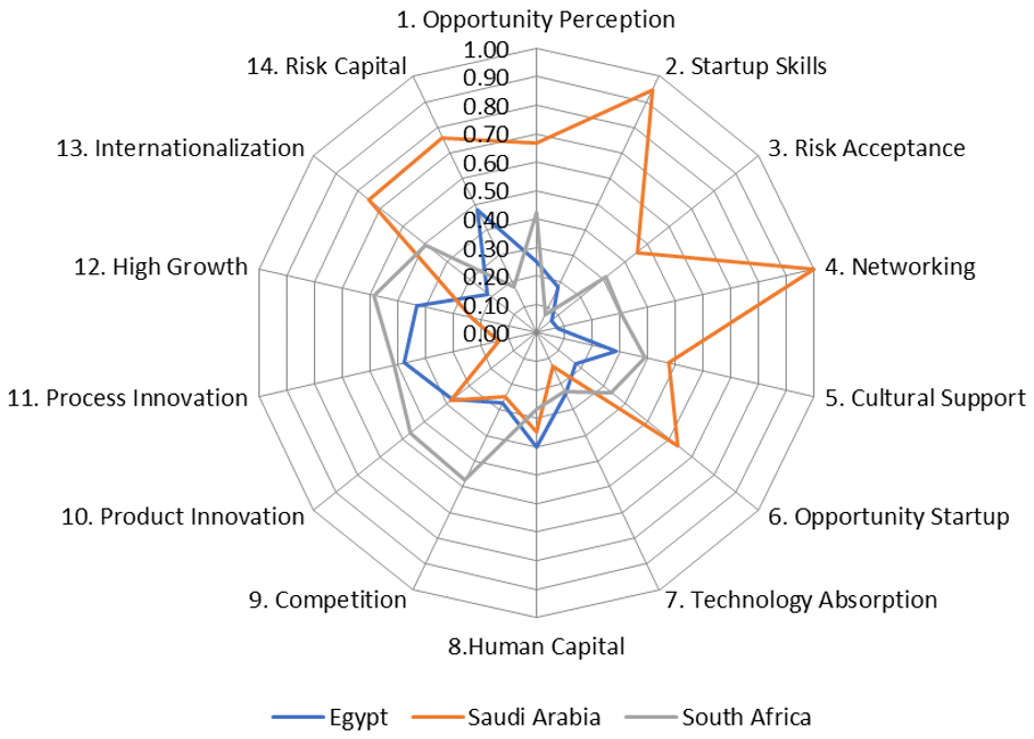
This comparison aims to show the Egyptian entrepreneurial pillars from other countries’ perspective and identify its strengths and weaknesses. The web chart presented in Figure 9 shows that Saudi Arabia’s profile is more durable for the attitude pillar than the Egyptian and South African ones. Regarding the aspirations pillar, Egypt tended to have better aspiration sub-index scores than Saudi Arabia, with South Africa’s superiority in this pillar.
The biggest bottleneck for Egyptian performance appears to be in risk acceptance and networking pillars. Egypt also lagged behind the two other countries in internationalization, opportunity startup, and culture support. Egypt’s relative strength is found in human capital and relative strength compared to South Africa in the risk capital pilar. So, aspirations sub-index pillars have shown some advantages for the Egyptian condition compared to the other two countries. According to entrepreneurial abilities, competition and product innovation pillars have achieved progress compared to Saudi Arabia, but still less than South Africa that is making remarkable progress in these pillars. According to the technology absorption pillar, there is a vivid retreat in the three countries with a slight superiority in the Egyptian index score compared to the two other countries. Finally, based on this comparative analysis for these countries, Egypt has advantages in entrepreneurial aspirations pillars, some vital points at entrepreneurial abilities, and disadvantages and severe retreats in entrepreneurial attitudes pillars.

4.5. Penalizing for Bottleneck Method Analysis (PBM)

As mentioned previously the institutional and individual variables are considered to be the main structure of the Egyptian entrepreneurial context. Z.J. Ács et al. (2014) argued that the valuable contextualization analysis provides a balance between different components [12]. These components interact with themselves to produce the system performance. At the same time, most of the used variables are not systemic, which badly effects the interaction of the GEI components and resulting an ignore of the system dynamics. Besides that, entrepreneurship is defined as the interaction between entrepreneurial abilities, attitudes, and aspirations across various levels of development [31]. Therefore, the value of each pillar is penalized after equalizing the averages of all pillars through the weakest performance pillar in the Egyptian context.
As defined in the literature, the bottleneck is the weakest point or bound constraint in the national entrepreneurial dynamic. It is represented mathematically by the smallest value within a set of normalized pillars of the index [12,13]. The GEI creators have used the method through optimum configurations, which are defined as not too different levels of the entrepreneurship variables in a particular country. The higher the variance of various entrepreneurial features in one specific country, the more problematic it is to be able to exploit the advantage of the high entrepreneurial feature. Therefore, they dealt with average adjustments through pillar averages are equalized to consider the difficulty (marginal effect) of reaching a particular pillar value. The GEI authors argued that this method is beneficial for every country’s policy suggestions [53].
The concept of bottlenecks of entrepreneurial Egyptian context represents direct results of pillars components interactions. The theories related to the concepts of the weakest point and constraints in the system performance argued that the improvement for the system could be achieved through working on strengthening the weakest pillar for the system [12]. This means that if risk acceptance and networking constitute a bottleneck for the Egyptian entrepreneurial context, more efforts must be made in these pillars to reach the desired position.
For example, risk acceptance and networking within the entrepreneurial attitude sub-index recorded the weakest scores among all Egyptian entrepreneurial pillars with 0.07 and 0.08, respectively. Hence, based on the data analysis for GEI 2006–2017 to improve the Egyptian entrepreneurial index (see Table 4), increasing the risk acceptance and networking pillars is necessary to increase the total new effort for these pillars by 50% each. Consequently, the overall Egyptian GEI score will increase by 2%. Making more effort in entrepreneurial attitudes sub-index by 4%, the GEI target’s influence score increased by 3% to achieve a 27.8 rating. This new effort for the entrepreneurial attitude sub-index increases entrepreneurial abilities and aspiration sub-indices by 1% and 2%, respectively (see Table 5).
On the contrary, there are bright aspects or strength pillars from the Egyptian context, which should be maintained and improved to reach the highest percentile. These pillars were risk capital and process innovation, and human capital.

5. Conclusions and Policy Suggestions

Based on the analysis of GEI and its sub-indexes, pillars, and institutional and individual variables, it has become clear for the Egyptian policymakers that they should be making more effort in the entrepreneurial attitudes sub-index, especially risk acceptance and networking pillars. The risk acceptance pillar is influenced by the fear of the population’s failure to start a business and the various risk condition. The fear of failure among people who perceive Egypt’s entrepreneurial opportunities is not high (30.2%) compared to the global average (41.3%) in 2017 [25]. Decrement from previous years between 33% in 2012 to 36% in 2016, the fear of failure is not the main hurdle for entrepreneurs in Egypt [38]. Therefore, to improve the risk acceptance pillar in the Egyptian case, the policy should work on the business risk condition, which deals with country risk and institutional variables to improve the risk acceptance pillar.
According to the networking pillar definition (see Appendix A; Table A1), there are two main aspects of networking: the ability of entrepreneurs to access and mobilize opportunities and resources, and the possible use of the internet [59]. Consequently, the networking pillar is influenced by the connection between various entrepreneurs, where internet connection plays a vital role. With the fact that the number of internet users grew by 33.4% from 2006 to 2017 based on the World Bank data, creating a solid internet connection between the Egyptian entrepreneurs can improve the Egyptian entrepreneurial attitude and push the national GEI score. It is also worth mentioning that this recommendation related to the organization between entrepreneurs is a responsibility of the micro, small, and medium enterprises development agency (MSMEDA) in Egypt.
The study has concluded that the Egyptian entrepreneurial profile analysis has shown that the entrepreneurial aspirations pillar appeared to be a vital aspect of the Egyptian entrepreneurship ecosystem. In contrast, entrepreneurial abilities pillars are considered weak points in the Egyptian profile of entrepreneurship. Furthermore, Egyptian entrepreneurial attitudes have been considered the main disadvantage of forming the Egyptian entrepreneurship index. The risk acceptance and networking pillars have shown the weakest aspect of the Egyptian entrepreneurial profile. Therefore, the bottleneck analysis demonstrated that increased effort by 50% for each of these pillars would improve the Egyptian entrepreneurial profile situation by 3%. Lastly, the analysis of institutional and individual variables has shown that the Egyptian entrepreneurship index has weak institutional variables with some progress and strong points in individual variables.
Additionally, comparing these study findings with the previous studies revealed that improving the Egyptian entrepreneurial ecosystem needs more funding facilitation efforts, supporting venture capital, encouraging venture capital, and encouraging private funds to invest in innovative enterprises [44,60]. These previous findings refer to the lack of entrepreneurial abilities in the Egyptian context. For example, Mansour et al., in their study in 2018 mentioned the need for an empirical approach to assessing the Egyptian entrepreneurship ecosystem [44]. Besides, this study highlighted the importance of building an infrastructure of innovation in the Egyptian entrepreneurship ecosystem, and enhancing technical and managerial education. Furthermore, Mansour et al. (2018) study’s results refer that the entrepreneurial attitudes aspect needs more improvements [44], which enhancing the current study findings.
In summary, this study made some noteworthy academic contributions to the entrepreneurship scientific area. Firstly, this study addressed the possibility of applying or transferring its results to other countries or geographical areas that have the same economic situation. In other words, understanding contextual factors that influence outcomes enhances the transferability of solutions or approaches to other programs, case studies or issues. Here, the study focused on countries with emerging economies or countries that have recently gone through the same economic and social changes that Egypt has undergone, such as countries in which the Arab Spring revolutions took place. For example, through this research paper, the weakness of the educational dimension was indicated as the primary variable that significantly affects the entrepreneurship ecosystem, and this dimension is an apparent weakness faced by most countries with emerging economies. Secondly, this study highlighted the importance of the institutional dimension as one of the essential dimensions that should be studied when dealing with or assessing the entrepreneurship ecosystem. This may guide other academic studies that are not related to a specific geographic area or those that focused on the theoretical perspective of the entrepreneurship ecosystem. Thirdly, this research confirmed that the academic background for studying the entrepreneurship ecosystem in Egypt is still new and needs more scientific research. Thus, this study provides a good presentation of the performance of entrepreneurship from the perspective of strengths and weaknesses. Consequently, this opens the way for more future research ideas related to urgent issues and gives more robust results when studying the entrepreneurship ecosystem, whatever in Egypt or any countries with a similar economic situation. Finally, this study contributes to expanding the research contributions from the empirical side on entrepreneurship in emerging countries, particularly in the Middle East.

6. Limitations and Future Research

This study has some limitations which can be covered in future researches to enrich this scientific research area. Firstly, the study depended on analyzing the Egyptian entrepreneurship ecosystem based on one measure which is GEI. Consequently, in the future, a combination of different economic indexes can provide a more comprehensive perspective of the study of any entrepreneurship ecosystem. Secondly, some Egyptian government programs for entrepreneurship are incompletely shared, which affects the suggested policies and recommendations. Thirdly, an econometric model can be conducted to support this study’s findings and presented more than an overview of entrepreneurship in Egypt.
Regarding future research, the econometrics methodology can be used to analyze the Egyptian entrepreneurial ecosystem compared with the bottleneck approach results for this study. Besides, there is a need to expand on studying entrepreneurs’ feedback through structured research methods such as (questionnaires or surveys), that could reflect the nature of the Egyptian entrepreneurial system. Additionally, future research may be interested in answering some potential future questions such as: Is the country-level analysis is the best level to study the entrepreneurship ecosystem, or other levels may be more effective (regional or sub-national level analysis)?; Is entrepreneurship ecosystem (EE) development in a resource-driven economy consider a priority, or some other programs should be prioritized (e.g. FDI, small business competitiveness, infrastructure development)?; and Are the improvement of a culture of entrepreneurship target specific stages of education levels, or is it a holistic view of education development?

Author Contributions

Conceptualization, M.A.A. and M.K.; methodology, M.A.A., M.K., R.A., R.M., and L.D.D.; validation, M.A.A. and M.K.; investigation, M.A.A., M.K., R.A., R.M., and L.D.D.; resources, M.A.A.; writing—original draft preparation, M.A.A. and M.K.; writing—review and editing, M.A.A., M.K., R.A., R.M. and L.D.D.; visualization, M.A.A. and M.K.; supervision, M.A.A., R.M. and L.D.D.; project administration, R.M. and L.D.D. All authors have read and agreed to the published version of the manuscript.

Funding

This research received no external funding.

Institutional Review Board Statement

Not applicable.

Informed Consent Statement

Not applicable.

Data Availability Statement

The data presented in this study are available on request from the corresponding author.

Acknowledgments

Authors would like to thank Szerb László. The authors also would like to thank the Egyptian Ministry of Higher Education and scientific research (MoHESR) for providing the academic mission. The authors also appreciate the comments through the IDK conference, university of pécs which improved the quality of this paper.

Conflicts of Interest

The authors declare no conflict of interest.

Abbreviations

Global Entrepreneurship Index (GEI); Entrepreneurial Ecosystem (EE); Organization for Economic Cooperation and Development (OECD); Kauffman Index of Entrepreneurial Activity (KIEA); Santander Enterprise Index (SEI); Legatum Prosperity Index (LPI); Global Entrepreneurship Monitor (GEM); Ease of Doing Business (EDB); National Entrepreneurship Context Index (NECI); Regional Entrepreneurship and Development Index (REDI); Global Competitiveness Index (GCI); Total Early-stage Activity (TEA); Egyptian Central Agency for Public Mobilization and Statistics (CAPMAS); Gross Domestic Product (GDP); Purchasing Power Parity (PPP); The Global Innovation Index (GII); Micro, Small, and Medium Enterprises Development Agency (MSMEDA); Technical and Vocational Education and Training (TVET); Technology Innovation and Entrepreneurship Center (TIEC); Small and Medium-sized Enterprises (SMEs); Non-Governmental Organization (NGOs); Sustainable Development Goals (SDGs); Central Business Districts (CBDs); Kingdom of Saudi Arabia (KSA); Reconstruction and Development Program (RDP); Penalizing for Bottleneck Method (PBM); Entrepreneurial Attitudes sub-index (ATT); Entrepreneurial Abilities sub-index (ABT); Entrepreneurial Aspiration sub-index (ASP).

Appendix A

Table A1. The definition of different GEI’s pillars.
GEI’s PillarsDescriptions and Definitions
Opportunity PerceptionThis pillar captures the potential “opportunity perception” of a population by considering the state of property rights and the regulatory burden that could limit the real exploitation of the recognized entrepreneurial opportunity.
Startup SkillsLaunching a successful venture requires the potential entrepreneur to have the necessary startup skills. Skill Perception measures the percentage of the population who believe they have adequate startup skills. Most people in developing countries think they have the skills needed to start a business, but their skills were usually acquired through workplace trial and error in relatively simple business activities.
Risk AcceptanceOf the personal entrepreneurial traits, fear of failure is one of the most important obstacles to a startup. Aversion to high-risk enterprises can retard nascent entrepreneurship. Risk Perception is defined as the percentage of the population who do not believe that fear of failure would prevent them from starting a business. Country Risk reflects to transfer and convertibility risk of a country and believed to closely correlate to business.
NetworkingNetworking combines an entrepreneur’s personal knowledge with their ability to connect to others in a country and the whole world. This combination serves as a proxy for networking, which is also an important ingredient of successful venture creation and entrepreneurship.
Cultural SupportThis pillar is a combined measure of how a country’s inhabitants view entrepreneurs in terms of status and career choice, and how the level of corruption in that country affects this view. Without strong cultural support, the best and brightest do not want to be responsible entrepreneurs, and they decide to enter a traditional profession.
Opportunity StartupThis is a measure of startups by people who are motivated by opportunity but face red tape and tax payment. An entrepreneur’s motivation for starting a business is an important signal of quality. Opportunity entrepreneurs are believed to be better prepared, to have superior skills, and to earn more than what we call necessity entrepreneurs.
Technology AbsorptionIn the modern knowledge economy, information and communication technologies (ICT) play a crucial role in economic development. Not all sectors provide the same chances for businesses to survive and or their potential for growth.
Human Capital.The prevalence of high-quality human capital is vitally important for ventures that are highly innovative and require an educated, experienced, and healthy workforce to continue to grow.
CompetitionCompetition is a measure of a business’s product or market uniqueness, combined with the market power of existing businesses and business groups and the effectiveness of anti-monopoly regulation. The variable Competitors is defined as the percentage of TEA businesses that have only a few competitors offering the same product or service.
Product InnovationNew products play a crucial role in the economy of all countries. While countries were once the source of most new products, today developing countries are producing products that are dramatically cheaper than their Western equivalents.
Process InnovationApplying and/or creating new technology is another important feature of businesses with high-growth potential.
High GrowthHigh Growth is a combined measure of the percentage of high-growth businesses that intend to employ at least 10 people and plan to grow more than 50 percent in five years (Gazelle variable) with business strategy sophistication (Business Strategy variable) and venture capital financing possibility (Venture Capital)
InternationalizationInternationalization is believed to be a major determinant of growth. A widely applied proxy for internationalization is exporting. Exporting demands capabilities beyond those needed by businesses that produce only for domestic markets
Risk CapitalThe availability of risk finance, particularly equity rather than debt, is an essential precondition for fulfilling entrepreneurial aspirations that are beyond an individual entrepreneur’s personal financial resources.
Source: [53].

References

  1. Stewart, R.; Bey, N.; Boks, C. Exploration of the Barriers to Implementing Different Types of Sustainability Approaches. Procedia CIRP 2016, 48, 22–27. [Google Scholar] [CrossRef] [Green Version]
  2. Ciegis, R.; Ramanauskiene, J.; Martinkus, B. The Concept of Sustainable Development and Its Use for Sustaina-bility Scenarios. Inz. Ekon.-Eng. Econ. 2009, 62, 10. [Google Scholar]
  3. Jayaratne, M.; Sullivan Mort, G.; D’Souza, C. Sustainability Entrepreneurship: From Consumer Concern Towards Entrepreneurial Commitment. Sustainability 2019, 11, 7076. [Google Scholar] [CrossRef] [Green Version]
  4. Ács, Z.J. How Is Entrepreneurship Good for Economic Growth? Innov. Technol. Gov. Glob. 2006, 1, 97–107. [Google Scholar] [CrossRef]
  5. Isenberg, D.J. The Entrepreneurship Ecosystem Strategy as a New Paradigm for Economic Policy: Principles for Cultivating Entrepreneurships; The Babson Entrepreneurship Ecosystem Project; Institute of International and European Affairs: Dublin, Ireland, 2011; p. 13. [Google Scholar]
  6. Sitaridis, I.; Kitsios, F. Competitiveness Analysis and Evaluation of Entrepreneurial Ecosystems: A Mul-ti-Criteria Approach. Ann. Oper. Res. 2020, 294, 377–399. [Google Scholar] [CrossRef]
  7. Acs, Z.J.; Estrin, S.; Mickiewicz, T.; Szerb, L. Entrepreneurship, Institutional Economics, and Economic Growth: An Ecosystem Perspective. Small Bus. Econ. 2018, 51, 501–514. [Google Scholar] [CrossRef]
  8. Mason, C.; Brown, R. Entrepreneurial Ecosystems and Growth Oriented Entrepreneurship. In Proceedings of the Entrepreneurial Ecosystems and Growth Oriented Entrepreneurship, The Hague, The Netherlands, 7 November 2013; Dutch Ministry of Economic Affairs: The Hague, The Netherlands, 2014; p. 38. [Google Scholar]
  9. Kirschenhofer, F.; Lechner, C. Performance Drivers of Serial Entrepreneurs: Entrepreneurial and Team Experience. Int. J. Entrep. Behav. Res. 2012, 18, 305–329. [Google Scholar] [CrossRef]
  10. Morant-Martínez, O.; Santandreu-Mascarell, C.; Canós-Darós, L.; Millet Roig, J. Ecosystem Model Pro-posal in the Tourism Sector to Enhance Sustainable Competitiveness. Sustainability 2019, 11, 6652. [Google Scholar] [CrossRef] [Green Version]
  11. Lu, J.-B.; Liu, Z.-J.; Tulenty, D.; Tsvetkova, L.; Kot, S. Implementation of Stochastic Analysis in Corporate Decision-Making Models. Mathematics 2021, 9, 1041. [Google Scholar] [CrossRef]
  12. Ács, Z.J.; Autio, E.; Szerb, L. National Systems of Entrepreneurship: Measurement Issues and Policy Im-plications. Res. Policy 2014, 43, 476–494. [Google Scholar] [CrossRef]
  13. Szerb, L.; Komlósi, É.; Páger, B. Measuring Entrepreneurship and Optimizing Entrepreneurship Policy Efforts in the European Union. CESifo DICE 2016, 14, 8–23. [Google Scholar]
  14. Audretsch, D.B.; Belitski, M. Entrepreneurial Ecosystems in Cities: Establishing the Framework Condi-tions. J. Technol. Transf. 2017, 42, 1030–1051. [Google Scholar] [CrossRef]
  15. Fairlie, R.W. Kauffman Index of Entrepreneurial Activity, 1996–2013; Ewing Marion Kauffman Foundation: Kansas City, MO, USA, 2014; p. 32. [Google Scholar]
  16. Autio, E.; Acs, Z.J. Santander Corporate & Commercial Santander Enterprise Index 2014: Benchmarking the Regional Ecosystem for Entrepreneurs in the UK; Santander: London, UK, 2014; p. 16. [Google Scholar]
  17. Ahadizadeh, A.; Brien, S.; Flanagan, S.; Irving, H.; Lee, J.; Masser, A.; Pilsbury, S.; Wickstead, E. Legatum Institute The Legatum Prosperity Index 2020: A Tool for Transformation; Legatum Institute Foundation: London, UK, 2020; p. 82. [Google Scholar]
  18. IVEY Entreprenuership Research Initiative. Available online: https://entrepreneurship.uwo.ca/for-scholars/our-research-and-publications/ (accessed on 17 June 2021).
  19. Global Entrepreneurship Research Association Global Entrepreneurship Monitor (GEM). Available online: https://www.gemconsortium.org/ (accessed on 12 February 2021).
  20. Acs, Z.; Szerb, L.; Autio, E. The Global Entrepreneurship Index. In Global Entrepreneurship and Development Index 2016; SpringerBriefs in Economics; Springer International Publishing: Washington, DC, USA, 2017; pp. 19–38. ISBN 978-3-319-63843-0. [Google Scholar]
  21. World Bank Doing Business: Measuring Business Regulations. Available online: https://www.doingbusiness.org/en/doingbusiness (accessed on 18 March 2021).
  22. Gradinãru, C.; Toma, S.-G.; Catanã, S.; Nicoleta, Z.L. The National Entrepreneurship Context Index in The Preiod 2018–2020: An Overview. Ann.-Econ. Ser. 2020, 5, 222–227. [Google Scholar]
  23. European Commission REDI. The Regional Entrepreneurship and Development Index—Measuring Regional Entrepreneurship; Final Report; Publications Office of the European Union: Brussels, Belgium, 2013; p. 177. [Google Scholar]
  24. Schwab, K. The Global Competitiveness Report 2019; World Economic Forum; World Economic Forum: Cologny, Switzerland, 2019; p. 666. [Google Scholar]
  25. Ismail, A.; Tolba, A.; Barakat, S. GEM Egypt National Report 2016/17; The American University: Cairo, Egypt, 2017; pp. 5–89. [Google Scholar]
  26. Szerb, L.; Ács, Z.J. Extension of GEDI Indicators; Financial and Institutional Reforms to build an Entrepreneurial Society (FIRES); Horizon 2020: Utrecht, The Netherlands, 2016; p. 33. [Google Scholar]
  27. Acs, Z.J.; Parsons, W.; Tracy, S. High-Impact Firms: Gazelles Revisited; Corporate Research Board, LLC: Washington, DC, USA, 2008; p. 92. [Google Scholar]
  28. Audretsch, D.B. Determinants of High-Growth Entrepreneurship; OECD/DBA: Copenhagen, Denmark, 2012; p. 37. [Google Scholar]
  29. Acs, Z.J.; Mueller, P. Employment Effects of Business Dynamics: Mice, Gazelles and Elephants. Small Bus. Econ. 2007, 30, 85–100. [Google Scholar] [CrossRef] [Green Version]
  30. Birch, D. Job Creation in America: How Our Smallest Companies Put the Most People to Work; Free Press: New York, NY, USA, 1987; ISBN 0-02-903610-0. [Google Scholar]
  31. Szerb, L.; Vörös, Z.; Komlósi, É.; Acs, Z.J.; Páger, B.; Rappai, G. The Regional Entrepreneurship and Development Index: Structure, Data, Methodology and Policy Applications; Financial and Institutional Reforms to build an Entrepreneurial Society (FIRES); Horizon 2020: Utrecht, The Netherlands, 2018; p. 124. [Google Scholar]
  32. World Bank Group. Doing Business 2020: Comparing Business Regulation in 190 Economies-Economy Profile of Egypt; World Bank Publications: Washington, DC, USA, 2020; p. 135. Available online: https://www.doingbusiness.org/en/reports/global-reports/doing-business-2020 (accessed on 8 February 2021).
  33. CAPMAS Egyptian Central Agency for Public Mobilization and Statistics. Available online: https://www.capmas.gov.eg/ (accessed on 15 December 2020).
  34. Ahmad, I.; Abdel-aziz, M.A.A. Assessing Entrepreneurship Ecosystem in Egypt: Access to Finance and Entrepreneurship Education; Challenges and Opportunities. Bachelor’s Thesis, Cairo University, Giza, Egypt, 2015. [Google Scholar]
  35. World Bank. Global Economic Prospects, January 2020: Slow Growth, Policy Challenges; World Bank Publications: Washington, DC, USA, 2020; ISBN 9781464814686. [Google Scholar]
  36. World Bank. Doing Business 2019: Training and Reform; World Bank Publications: Washington, DC, USA, 2019. [Google Scholar]
  37. World Intellectual Property Organization (WIPO); Cornell University; Insead. GII Global Innovation Index 2019; Dutta, S., Lanvin, B., Wunsch-Vincent, S., Eds.; WIPO: Ithaca, NY, USA, 2019. [Google Scholar]
  38. Ismail, A.; Tolba, A.; Barakat, S.; Meshreki, H. Global Entrepreneurship Monitor-Egypt National Report. 2018, pp. 1–103. Available online: https://www.gemconsortium.org/file/open?fileId=50709 (accessed on 7 March 2021).
  39. IMF Arab Republic of Egypt. Available online: https://www.imf.org/en/Countries/EGY (accessed on 27 May 2020).
  40. EgyptInnovate Innovation Map. Available online: https://egyptinnovate.com/en/innovation/map (accessed on 13 January 2021).
  41. Elsaid, H.; Alsaid, M.; Zaki, C. Trade access tofinance of smes: Is there a nexus? Econ. Res. Forum 2015, 53, 1–27. [Google Scholar]
  42. MSMEDA Micro, Small and Medium Enterprises Development Agency. Available online: https://www.msme.eg/ar/msmeda/Pages/default.aspx (accessed on 2 February 2021).
  43. Hattab, H. Global Entrepreneurship Monitor Egypt Entrepreneurship Report 2012; The British University in Egypt (BUE): El Sherouk City, Egypt, 2012; Available online: https://www.gemconsortium.org/report/gem-egypt-2012-report (accessed on 6 April 2021).
  44. Mansour, D.M.; Sedita, S.R.; Apa, R. Dynamics of Entrepreneurship in Egypt: Assessing the Entrepreneurial Ecosystem. In Entrepreneurship Ecosystem in the Middle East and North Africa (MENA): Dynamics in Trends, Policy and Business Environment; Faghih, N., Zali, M.R., Eds.; Springer International Publishing: Cham, Switzerland, 2018; pp. 519–542. ISBN 978-3-319-75913-5. [Google Scholar]
  45. Egypt Ministry of Planning, Monitoring and Administrative Reform. Sustainable Development Strategy: Egypt’s Vision 2030; Egypt Ministry of Planning, Monitoring and Administrative Reform: Cairo, Egypt, 2016; pp. 1–378.
  46. Zaki, H.M.; Zeini, N.T. Descriptive Analysis of the Entrepreneurship Ecosystem in Egypt from a Start-up Perspective: Challenges and Opportunities. Available online: https://en.econostrum.info/Descriptive-analysis-of-the-entrepreneurship-ecosystem-in-Egypt-from-a-start-up-perspective%C2%A0-challenges-ans_a509.html (accessed on 10 March 2021).
  47. Ministry of Planning and Economic Development. Sustainable Development Strategy: Egypt’s Vision 2030; Ministry of Planning and Economic Development: Cairo, Egypt, 2014; Available online: https://mped.gov.eg/EgyptVision?lang=en (accessed on 12 May 2021).
  48. ACUD The Developmental Plan for the New Administrative Capital; Cairo. 2017. Available online: http://www.acud.eg/ (accessed on 23 April 2021).
  49. Acs, Z.; Szerb, L.; Lafuente, E.; Lloyd, A. Global Entrepreneurship and Development Index 2018; Springer Briefs in Economics; Springer: Washington, DC, USA, 2018. [Google Scholar]
  50. Lafuente, S.E. The Global Entrepreneurship Index; Regional Innovation and Entrepreneurship Research Center: Washington, DC, USA, 2019. [Google Scholar]
  51. Autio, E.; Cleevely, M.; Hart, M.; Levie, J.; Acs, Z.J.; Szerb, L. Entrepreneurial Profile of the UK in the Light of the Global Entrepreneurship and Development Index. SSRN Electron. J. 2012, 35. [Google Scholar] [CrossRef] [Green Version]
  52. Acs & Szerb Extension of GEDI Indicators. Available online: https://projectfires.eu/wp-content/uploads/2018/07/d4.1-report-on-extension-of-the-gedi-indicator.pdf (accessed on 17 May 2021).
  53. Zoltán, J.Á.; László, S.; Lloyd, A. The Global Entrepreneurship Index 2018; The Global Entrepreneurship and Development Institute: Washington, DC, USA, 2018. [Google Scholar]
  54. Vásquez, I.; Porčnik, T. The Human Freedom Index. 2019. Available online: https://www.fraserinstitute.org/sites/default/files/human-freedom-index-2019-rev.pdf (accessed on 5 May 2021).
  55. Khan, M.R. Entrepreneurship Ecosystem Evolution Strategy of Saudi Arabia. Entrep. Antecedents Eff. 2016, 2, 26. [Google Scholar]
  56. Meyer, D.F.; Masehla, T.M.; Kot, S. The Relationship between Economic Growth and Economic Development: A Regional Assessment in South Africa. J. Adv. Res. Law Econ. 2017, 8, 1377–1385. [Google Scholar]
  57. Meyer, N.; Meyer, D.F. The Relationship between the Creation of an Enabling Environment and Economic Development: A Comparative Analysis of Management at Local Government Sphere. PJMS 2016, 14, 150–160. [Google Scholar] [CrossRef]
  58. Chimucheka, T. Entrepreneurship Education in South Africa. Mediterr. J. Soc. Sci. 2014, 5, 403. [Google Scholar] [CrossRef] [Green Version]
  59. Szerb, L.; Trumbull, W.N. Entrepreneurship Development in Russia: Is Russia a Normal Country? An Empirical Analysis. J. Small Bus. Enterp. Dev. 2018, 25, 902–929. [Google Scholar] [CrossRef]
  60. Szczepańska-Woszczyna, K. Strategy, Corporate Culture, Structure and Operational Processes as the Context for the Innovativeness of an Organization. Found. Manag. 2018, 10, 33–44. [Google Scholar] [CrossRef] [Green Version]
Figure 1. Entrepreneurship ecosystem domains and sub-elements. Source: adapted from [5,8,10].
Sustainability 13 07171 g001
Figure 2. Research methodology.
Sustainability 13 07171 g002
Figure 3. The correlation between GEI, Sub-indices, and GDP 2011 per capita (PPP: Purchasing Power Parity): (a) The relation between GEI and GDP; (b) The relation between ATT and GDP; (c) The relation between ABT and GDP; (d) The relation between ASP and GDP. Source: adapted from [53].
Sustainability 13 07171 g003
Figure 4. Development trend for GEI and triple-A sub-indices 2006–2017.
Sustainability 13 07171 g004
Figure 5. The trend in Egyptian entrepreneurial attitudes pillars. Source: adapted from [53].
Sustainability 13 07171 g005
Figure 6. The trend in Egyptian entrepreneurial abilities pillars. Source: adapted from [53].
Sustainability 13 07171 g006
Figure 7. The trend in Egyptian entrepreneurial aspiration pillars. Source: adapted from [53].
Sustainability 13 07171 g007
Figure 8. Egyptian condition for GEI pillars comparing Percentiles participated countries. Source: adapted from [53].
Sustainability 13 07171 g008
Figure 9. Comparison between the Egyptian, Saudi Arabia, and South Africa entrepreneurial profiles. Source: adapted from [53].
Sustainability 13 07171 g009
Table 1. Global Entrepreneurship Index structure.
Global Entrepreneurship and Development Index GEISub-IndexesPillarsVariables (Indv./Inst.)
Attitude sub-indexOpportunity perceptionOpportunity recognition
Freedom (economic freedom and roperty rights)
Startup skillsSkill perception
Education (tertiary education and quality of education)
Risk acceptanceRisk perception
Country risk
NetworkingKnow entrepreneurs
Agglomeration (urbanization and infrastructure)
Cultural supportCareer status
Corruption
Ability sub-indexOpportunity startupOpportunity motivation
Governance (taxation and good governance)
Technology absorptionTechnology level
Technology absorption
Human capitalEducational level
Labor market (staff training and labor freedom)
CompetitionCompetitors
Competitiveness (market dominance and regulation)
Aspiration sub-indexProduct innovationNew product
Tech transfer
Process innovationNew technology
Science (GERD((average quality of scientifical institutions and availability of scientists and engineers))
High growthGazelle
Finance and strategy (venture capital and business sophistication)
InternationalizationExport
Economic complexity
Risk capitalInformal investment
Depth of capital market
Legend: White Color shadow: Individual variables; Gray Color shadow: Institutional variables. Source: [53].
Table 2. GDP categories and GEI ranking for participated countries in the data set.
RankCountryGDP 2015–2017GEIRankCountryGDP 2015–2017GEI
1United States53,54384.438Tunisia10,76640.6
2Switzerland57,3658039Hungary25,82539.6
3Canada43,46878.240Romania20,55636.6
4United Kingdom39,30175.441Colombia13,12536.4
5Australia44,35573.742Greece24,31935.5
6Sweden46,39972.743Malaysia25,82635.4
7Ireland63,79471.644Barbados16,45834.5
8Netherlands47,41269.245Botswana15,35734.5
9France38,33467.746Croatia21,81833.6
10Finland39,30067.447Uruguay20,15933.2
11Hong Kong54,41367.348South Africa12,32032.3
12Austria44,46465.649Kazakhstan23,67630.2
13Germany44,53365.650Thailand15,74529.4
14Israel32,61564.351Macedonia12,94028.9
15Belgium41,70862.652Morocco735627.7
16Taiwan48,45960.853Peru12,03027.6
17Chile22,63358.554Bulgaria17,78626.8
18Luxembourg 58.255Panama21,50926.4
19Norway64,00855.856Mexico17,16126.4
20Estonia28,38055.657India609326.4
21Korea35,04554.258Iran18,02725.9
22Slovenia30,12353.859Georgia927725.7
23Japan39,00253.360Russia24,41725.3
24Qatar 53.361Egypt10,43725.2
25UAE67,50052.962Argentina18,87824
26Poland26,18448.763Vietnam586324
27Portugal26,86647.864Philippines687523.9
28Cyprus31,92946.765Indonesia10,77422.6
29Spain33,29545.866Jamaica818022.2
30Turkey23,75644.567Ecuador10,58519.9
31Puerto Rico34,95543.768Bosnia and Herzegovina11,71419.5
32Slovak Republic29,22543.769Brazil14,29418.9
33Czech Republic28,38043.370Guatemala736218.3
34Saudi Arabia49,73441.171El Salvador716416.7
35China14,4264172Cameroon331815
36Italy34,7264173Burkina Faso161912.6
37Latvia23,94240.9
Source: adapted from [53].
Table 3. Individual and institutional entrepreneurial variables for Egyptian condition.
PillarsInstitutional VariablesIndividual Variables
Entre. AttitudesOpportunity Perception0.25Freedom0.29Opportunity Recognition0.73
Start-up skills0.18Education0.35Skill Perception0.54
Risk Acceptance0.07Country Risk0.09Risk Perception0.7
Networking0.08Connectivity0.3Know Entrepreneurs0.27
Cultural Support0.29Corruption0.37Career Status0.94
Total Entrepreneurial Attitudes Score = 16.4
Entre. AbilitiesOpportunity Startup0.18Governance0.36Opportunity Motivation0.33
Technology Absorption0.24Tech Absorption0.31Technology Level0.47
Human Capital0.4Labor Market0.38Educational Level0.82
Competition0.27Competitiveness and Regulation0.4Competitors0.59
Total Entrepreneurial Abilities Score = 25
Entre. AspirationsProduct Innovation0.38Technology Transfer0.54New Product0.59
Process Innovation0.48Science0.52New Technology0.96
High Growth0.43Finance and strategy0.44Gazelle0.73
Internationalization0.22Economic complexity0.4Export0.44
Risk Capital0.48Depth of Capital Market0.63Informal Investment0.63
Total Entrepreneurial Aspirations Score = 34.3
Total GEI Pillars25.2Institutional Variables0.38Individual Variables0.62
Legend: Red Color: less than the bottom 25%; Yellow Color: 2nd 25%; Green Color: 3rd 25%; and Blue Color: best 25%. Source: adapted from [53].
Table 4. The bottlenecks of Egyptian entrepreneurial pillars for targeting GEI.
PillarRequired Increase in PillarPercentage of the Total New Effort
Opportunity Perception 00%
Start-up Skills 00%
Risk Acceptance0.0950%
Networking 0.0950%
Cultural Support 00%
Opportunity Startup 00%
Technology Absorption00%
Human Capital00%
Competition 00%
Product Innovation 00%
Process Innovation 00%
High Growth 00%
Internationalization 00%
Risk Capital 00%
Total effort0.18100%
Table 5. The required effort for Egyptian entrepreneurial sub-indices.
Sub-IndicesPrevious ScoreNew ScoreChange% Of Total New Effort
ATT0.1640.2040.04100%
ABT0.250.2630.010%
ASP0.3430.3660.020%
GEI0.2520.2780.026100%
Publisher’s Note: MDPI stays neutral with regard to jurisdictional claims in published maps and institutional affiliations.

