Article

Carbon Mineralization Rates and Kinetics of Surface-Applied and Incorporated Rice and Maize Residues in Entisol and Inceptisol Soil Types

1
Department of Soil Science and Agricultural Chemistry, Uttar Banga Krishi Viswavidyalaya, Pundibari, Cooch Behar 736165, West Bengal, India
2
Department of Soil Science and Agricultural Chemistry, Institute of Agricultural Sciences, Banaras Hindu University, Varanasi 221005, Uttar Pradesh, India
3
Krishi Vigyan Kendra, Ranichauri, Veer Chandra Singh Garhwali Uttarakhand University of Horticulture and Forestry, Tehri Garhwal 249199, Uttarakhand, India
4
Department of Soil Science, Bahauddin Zakariya University, Multan 60800, Pakistan
5
Department of Agronomy, The University of Haripur, Haripur 22620, Pakistan
6
Department of Geology and Pedology, Faculty of Forestry and Wood Technology, Mendel University in Brno, 61300 Brno, Czech Republic
*
Authors to whom correspondence should be addressed.
Sustainability 2021, 13(13), 7212; https://0-doi-org.brum.beds.ac.uk/10.3390/su13137212
Submission received: 19 May 2021 / Revised: 25 June 2021 / Accepted: 25 June 2021 / Published: 28 June 2021

Abstract

:
Mineralization of carbon (C) is a burning issue that is regulated by soil attributes. It has direct impacts on crop productivity and quantification of organic residue addition in soil. For better understanding and achievement of potential tillage benefits, a comprehensive scientific understanding of C mineralization is very important. Therefore, a laboratory incubation experiment was conducted to investigate the C mineralization rates and kinetics of crop residues (rice and maize) when applied on the surface (as zero-tillage, ZT) and incorporation (as conventional tillage, CT) in four different soil types (S1 and S2 of Entisol; S3 and S4 of Inceptisols) of West Bengal state, India. Results showed that after 7 days of incubation, there was a rapid phase of decrease in CO2-C fluxes. It continued up to day 14 followed by a sluggish nature of CO2 emission up to day-42, and after that almost levelling off in all subsequent periods up to the end of 126 days of incubation. There was a progressive release of cumulative total C from the soils with an increase in time till the last day of incubation. For every 10% increase in C loss, there was about 0.376 mg/g C mineralization from the applied residue C. It was evident from the kinetic models that C mineralization from the residues followed the exponential model: C = Co(1 − e−kt). Similar rate constant (k) values were recorded in both placement methods, but the rate of maximum potential mineralizable (C0k) residue C was higher under residue incorporation treatments for both rice and maize residue. However, the rice and maize residues showed almost similar amounts of C mineralized over time when applied on the surface. The future prediction analysis using the equation C = Co(1 − e−kt) suggested that the residues incorporated into the soil releases a maximum C irrespective of residue type. We conclude that the residues when incorporated into the soil significantly increases the C footprints through maximum C mineralization; leaving the crop residue on the soil surface reduces the C footprints which helps in achieving sustainability from an environmental perspective.

1. Introduction

Conservation agriculture (CA)/zero tillage (ZT) under rice and maize cultivation with residue retention is extensively used to deal with soil erosion and improve overall crop productivity, as well as income and environmental sustainability. Farmers widely adopt CA due to lower production costs and higher profitability [1]. Residue management under ZT has a great impact on soil physicochemical, and biological properties [2] and subsequent plant growth [3]. Generally, continuous crop rotation in agriculture helps in improving soil carbon stock [4,5]. The amount of residue returned to soil forms organo-mineral complexes that increase C sequestration which safeguards the SOC status from losses through mineralization [6]. Placement of residue on soil surface and incorporation within the soil also have different impacts on the rate of decomposition and C sequestration rates in different soil types. Thus, knowledge of C mineralization dynamics is very important to assess the potential and beneficial changes in soil quality and crop production as influenced by tillage and residue management practices. The soil microbiota cannot be neglected when speaking about soil quality status [7,8,9] and especially crops, as microbiota is an essential part of the process, either the upper level-phyto-microbiome, or the rhizobacteria consortia, responsible for forming symbiotic nodules in the roots of the plants [10].
Mineralization of residue C depends on several factors. Native soil properties largely affect the C mineralization rates, where soil pH plays a dominant role [11]. Inceptisols are neutral to saline in reaction with high clay content, and Entisol is also neutral in reaction but the texture varies from loam to sandy loam in nature [12]. Naturally, these characteristics of soil will tremendously affect mineralization rates. Additionally, the nutrient composition of residue and its application method influence the decomposition process. Residue incorporation into the soil leads to faster decomposition as compared to surface application [13]. However, this depends on soil nutrient status and the residue type [14]. Carbon dioxide (CO2) evolution decreases over time and is also influenced by the chemical composition of organic matter similar to that of humus. The nutrients which are residue bound may become available to the plant in a considerable quantity with time [15]. Residue decomposition is highly essential for both nutrient cycling and carbon balance in the soil system [16]. Carbon compounds in crop residue components are highly resistant to the decay process that forms humus which is the major C source. Amended crop residues enhance the supplement of energy sources (carbonaceous materials) for living microbes [17]; residues that are low in C/N ratios show more C mineralization than those with wide C/N ratios.
The first-order kinetic model C = C0 (1 − e−kt) is used to describe the C mineralization process [18], assuming that the microbial biomass is constant, and the patterns and rate of decomposition process entirely depends on the available substrate. The kinetic parameters such as rate constants (k) and potentially mineralizable C (C0), and the potential mineralization rate (kC0) calculated according to the model, may be of great interest for improving our understanding of soil organic matter balance [19].
Soil respiration or C-mineralization is the largest vertical carbon efflux from soil to atmosphere [20] and an indicator of soil fertility [21] and quality. Incubation study is a more direct approach to quantify the decomposition rates of the residue C in soil than various procedures using chemical extraction analysis [22]. Research in C mineralization patterns and their kinetics has received more attention recently to assess the rate of decomposition in respect of time and also to predict future variations through the model approach. Many researchers have studied the C mineralization and its temperature sensitivity [23], but the effect of application mode (incorporation and surface application) of different crop residues on C mineralization patterns and its kinetics has not been well documented.
Our hypothesis in the present study was that C mineralization rates and their kinetics are strongly influenced by the type of residue added, mode of application, and the inherent soil properties.
Thus, the objective of this investigation was to assess C mineralization patterns, rates, and kinetics under surface application and incorporation of the two types of residue (rice and maize) in contrasting soil types (Entisol and Inceptisols) of West Bengal State.

2. Materials and Methods

2.1. Characteristics of Soil and Crop Residues

The soils used for the incubation experiment were chosen from farmers’ plots which were part of an ongoing larger research project entitled ‘Sustainable and Resilient Farming System Intensification (SRFSI)’ being maintained by the Uttar Banga Krishi Viswavidyalaya (UBKV), West Bengal in collaboration with the Australian Centre for International Agricultural Research (ACIAR) and the International Maize and Wheat Improvement Centre (CIMMYT) since 2013. The soils belong to two soil orders (Entisol of Coochbehar (26°09′62.7″ N, 89°53′51.7″ E) and Inceptisol of Malda (25°27′33.9″ N, 88°19′10.2″ E), West Bengal State, India), having distinctive edaphoclimatic conditions and different type of cultivation management practices. Within the soils, we noticed some peculiar characteristics in respect to their physical and chemical status (Table 1). Soil samples were collected from the top arable layer (0–15 cm) from two locations of Coochbehar [S1-Durganagar & S2-Ghugumari] and Malda [S3-Kalinagar & S4-Manikchak] districts. Three individual soil monoliths (nearest locations) were collected and bulked together to form one composite soil sample. The soils were then air-dried, visible impurities were removed, and soils sieved using 2 mm mesh. The pH of three soils (S1, S2, and S3) was neutral (Table 1), and the other (S4) was alkaline in nature. Total organic carbon (TOC) of the soils ranged between 10.5 g/kg (S2) to 16.9 g/kg (S4). Total soil nitrogen content varied from 0.98 (S1) to 1.81 g/kg (S4). The C:N ratio of the soils ranged from 7.78:1 to 12.35:1 in S2 and S1 soils, respectively. Clay content varied between 11% to 31%, the highest being for S3; maximum silt content (66%) recorded both in S2 and S4. When clay and silt content of the soils were considered together, S3 soil recorded the highest value of 90% of the total soil separates (clay + silt + sand) and the lowest was 62% for soil S1.
Residues of rice (Oryza sativa) and maize (Zea mays) were specifically chosen for this study because these two are the dominant cereal crops growing under zero-tillage (ZT) management in the area under consideration. The residues are left on the surface under ZT and incorporated under conventional tillage (CT) but decomposition rates vary with soil type, inherent soil nutrient status, placement, and type of crop residue. Residues of rice and maize plants were collected at harvest from the site/plot where soil samples were collected. Samples of the plant residues were dried at 55 °C in the hot air oven and then ground for experimentation and chemical analysis. The total carbon (TC) content (Table 1) of maize appeared to be higher than rice. Rice residue contained slightly higher TN as compared with maize. Accordingly, the C:N ratio of rice residue was lower than that of maize residue.

2.2. Soil and Residue Analysis

Soil pH was estimated by Jackson [24] method. Total N in soil and residue samples was analyzed by the Kjeldahl method [25]. TOC was determined by a modified Walkley and Black method suggested by Baker [26]. The proportion of sand, silt, and clay, i.e., soil texture, was estimated by the Bouyoucos hydrometer method [27]. The TC content in crop residue was estimated by CHNS elemental analyzer (Company: vario MACRO, Hanau, Germany) by dry combustion method.

2.3. Incubation Experiment

For the incorporation treatment, approximately 30 g of soil was taken and mixed with 0.3 g (1% of soil) of finely ground residue, placed into 500 mL capacity conical flask, and its bulk density brought to normal (approx. 1.3 g/cc) by tapping the bottom of the flask. Moisture was maintained at field capacity (60% of the maximum water holding capacity (MWHC), due to its ideal moisture level for maximum microbial activity in soil [28]. Similar handling was also performed for the surface application treatment, but the residue was added to the surface without disturbing the soil. Totally, there were 16 treatments (four soils × two residues × two methods of application) along with two blank treatments (only soil and no soil) with three replications. The design was a factorial completely randomized design (CRD).
Approximately 10 mL of 0.5 M sodium hydroxide (NaOH) solution was taken in 20 mL capacity vials and placed inside the container (Conical flask). A double-layered high-quality Parafilm tape (Made: PARAFILM “M” Laboratory film BEMIS, Neenah, WI 549567, USA) was used to seal the flask in order to trap the mineralized CO2 [29]. The flasks were incubated for 126 days at room temperature starting from December (winter season) after pre-incubation for 7 days. The soil moisture was balanced by weighing and adding distilled water whenever needed throughout the experimental period. The daily minimum and maximum room temperature and relative humidity were noted using a digital hygrometer (Figure 1). After the incubation, a solution containing NaOH was removed from the flask and transferred to a 100 mL conical flask, then 25 mL of distilled water was added to dilute the sample. After the addition of 1 mL of saturated barium chloride (BaCl2) and phenolphthalein indicator, the sample turned violet in color and was titrated against 0.5 M HCl as described by Alef [30]. CO2 evolved was determined at days 3, 7, 14, 21, 28, 35, 42, 56, 76, 96, and 126.

2.4. Computation of Carbon Mineralization and Its Kinetics

The concentration of CO2 evolved during the incubation study, amount C mineralized, rate constants, and maximum rate of mineralization potential were calculated as per the Equations (1)–(4), respectively.
Amount CO2 (mg) evolved = R × 0.5 × 22
where R: Reading = Blank (mL) − Sample (mL); 0.5 = Molarity of HCL; 22 = mg of CO2 neutralized by 0.5 M HCl
Amount C mineralized (mg) = CO2 × 12/44
where CO2 = Amount of carbon dioxide (mg); 12 = molecular weight of C; 44 = molecular weight of CO2
1st order kinetic model C = C0 (1 − e−kt)
where, k = mineralization rate constant (%/day); t = time (days of incubation); C0 = mineralization potential (%); C = % C lost from the initial residue and ln = negative logarithm
Maximum rate of mineralization potential (%/day) = C0 × k

2.5. Model Evaluation

The best fit model for describing the amount of residue C lost in soil over the incubation period and thereby to calculate the kinetic parameters was determined by using the linear method and Lavenberg-Marquardt method. The latter method is suitable for nonlinear models which consider lower MSE and higher R2 as the basis for choosing the best model. A linear model was not found to be suitable for describing the mineralization pattern as the values of MSE and R2 were insignificant. Among the non-linear models, the amount of residue C remained over 126 days of incubation in both application methods (incorporated and surface applied) was best described using the exponential model: C = C0 (1 − e−kt). Mineralization kinetic parameters (C0 & k) were calculated by repeated iteration process using the Levenberg-Marquardt method of parameter estimation for nonlinear models using SPSS, 17.0 software package.

2.6. Statistical Analysis

The difference between the treatments was tested for statistical significance by using the least significant difference (LSD) value or Duncan’s multiple range test (DMRT) at p ≤ 0.05. This was calculated for comparison between soil, residue, mode of application, and their interactions over the entire incubation period in factorial completely randomized design (CRD). The SPSS, 17.0 software package was used to perform the statistical analysis.

3. Results

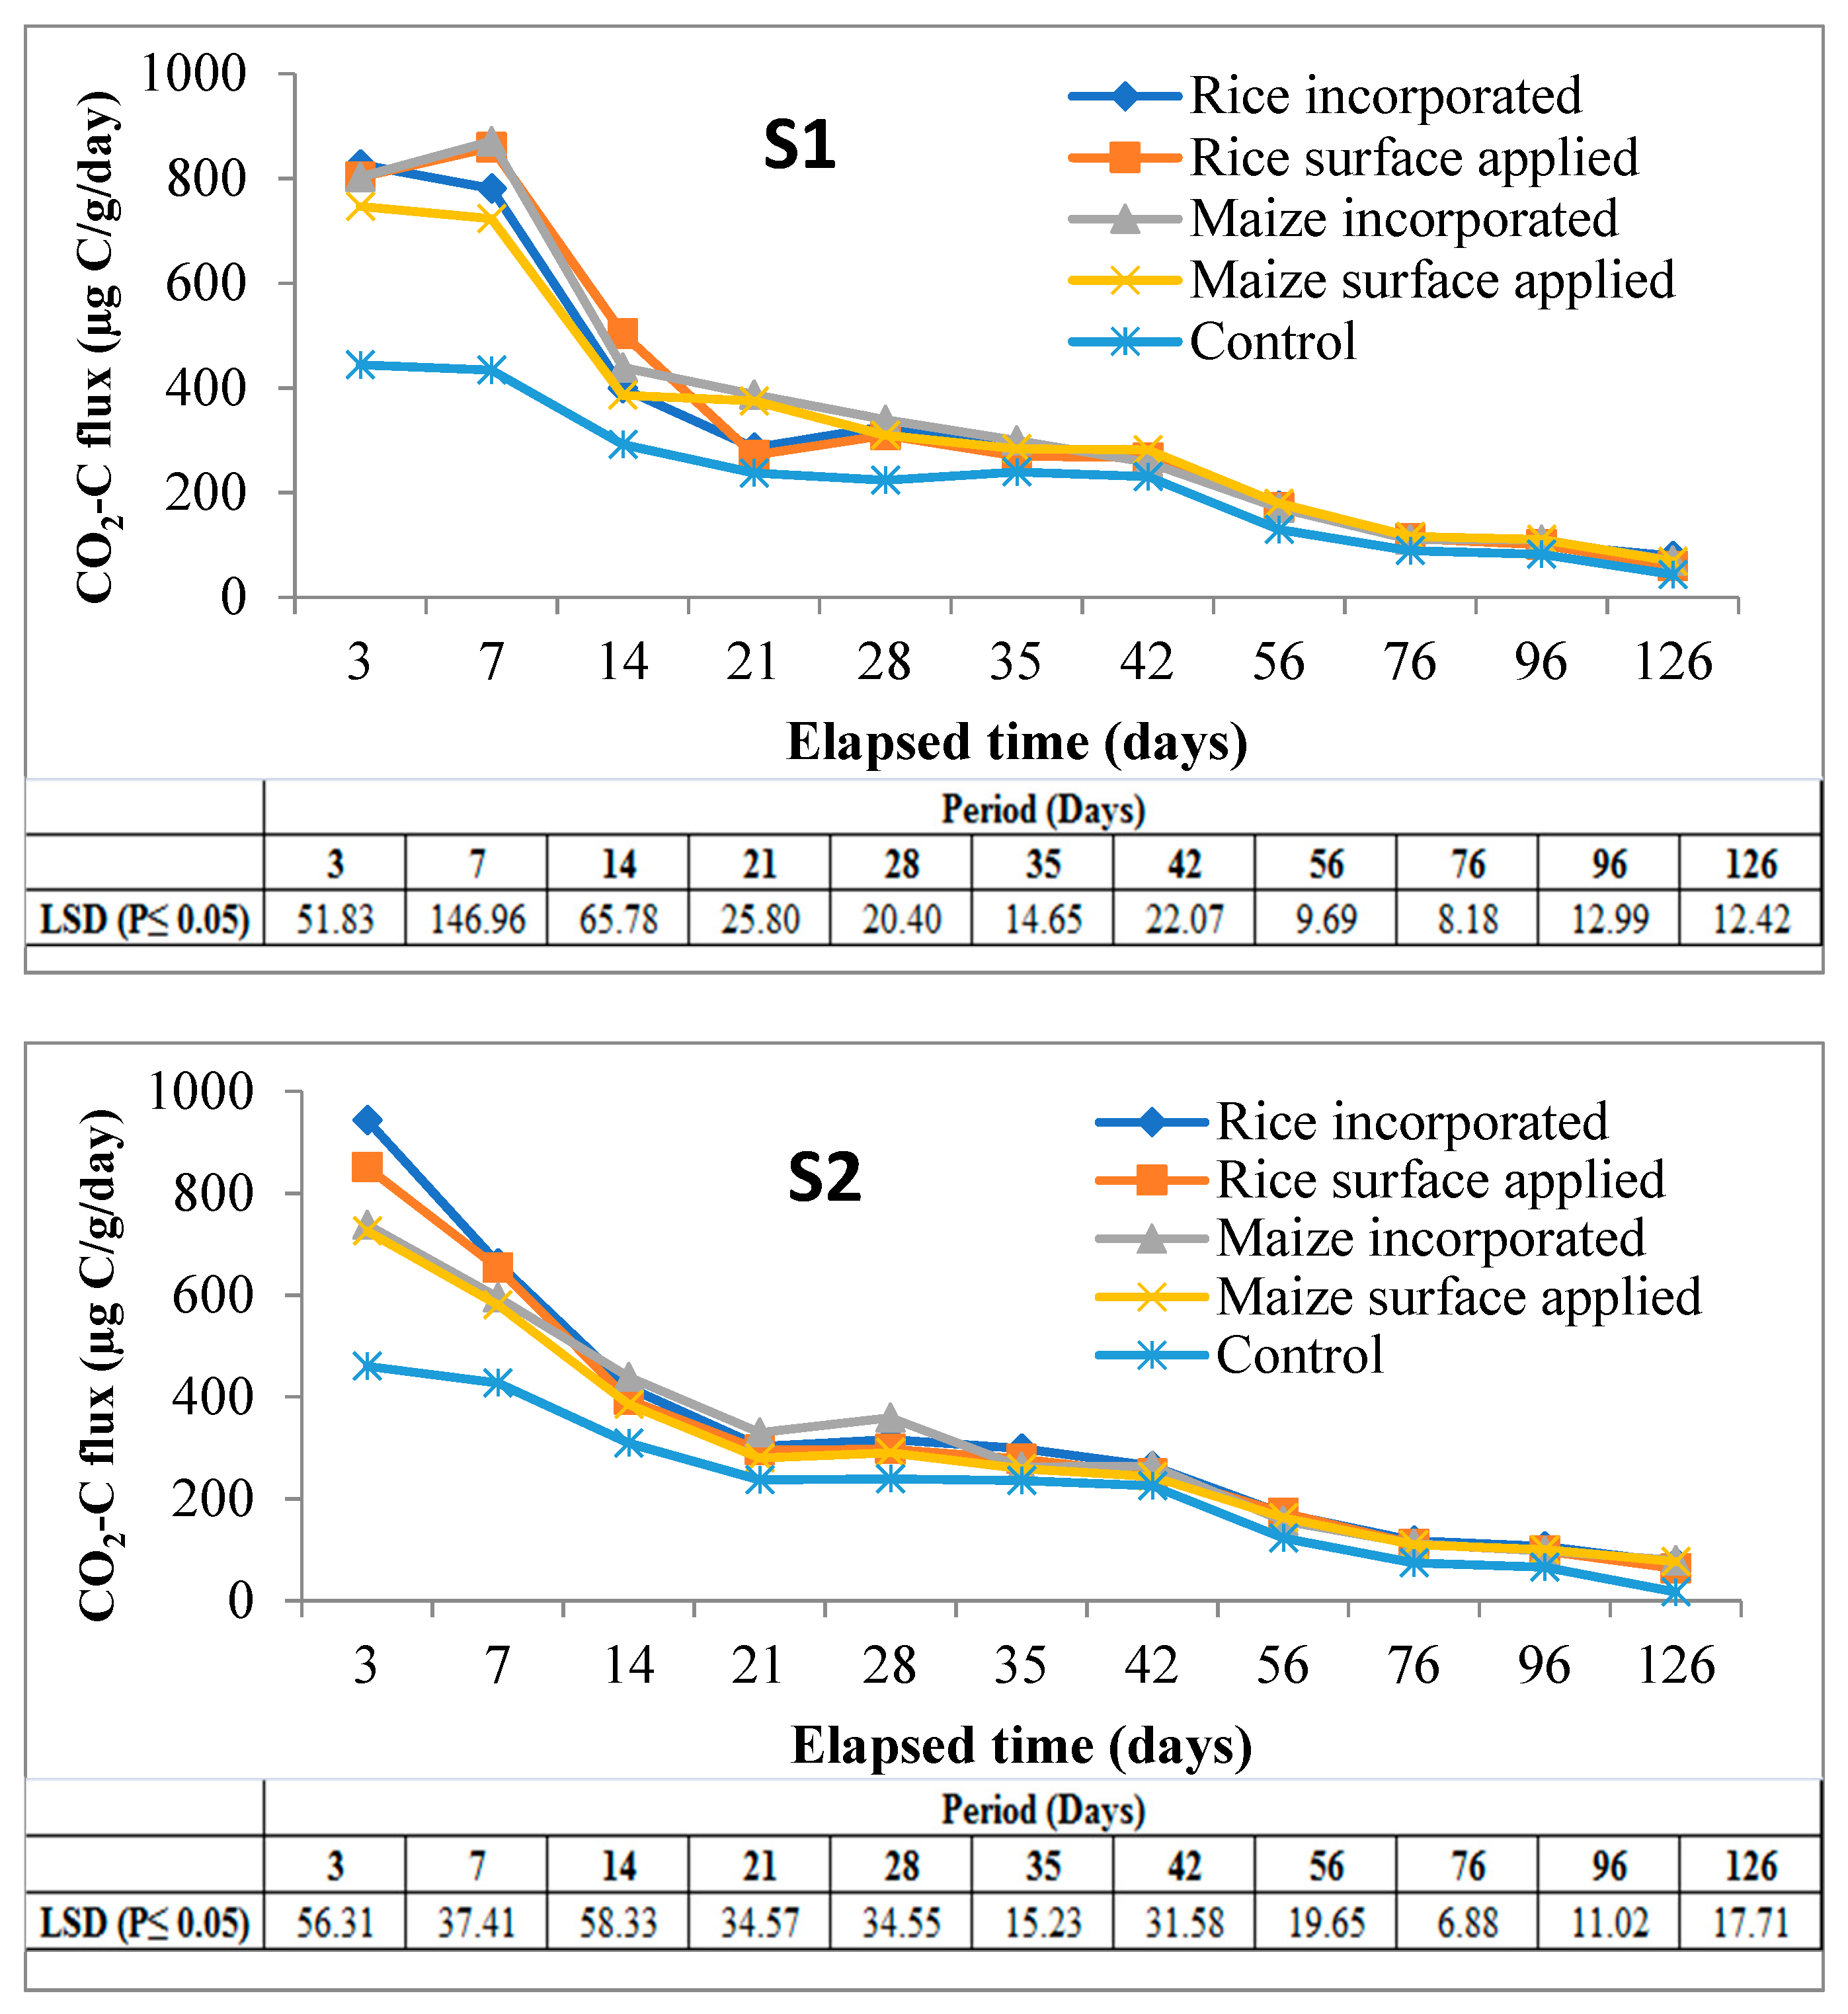
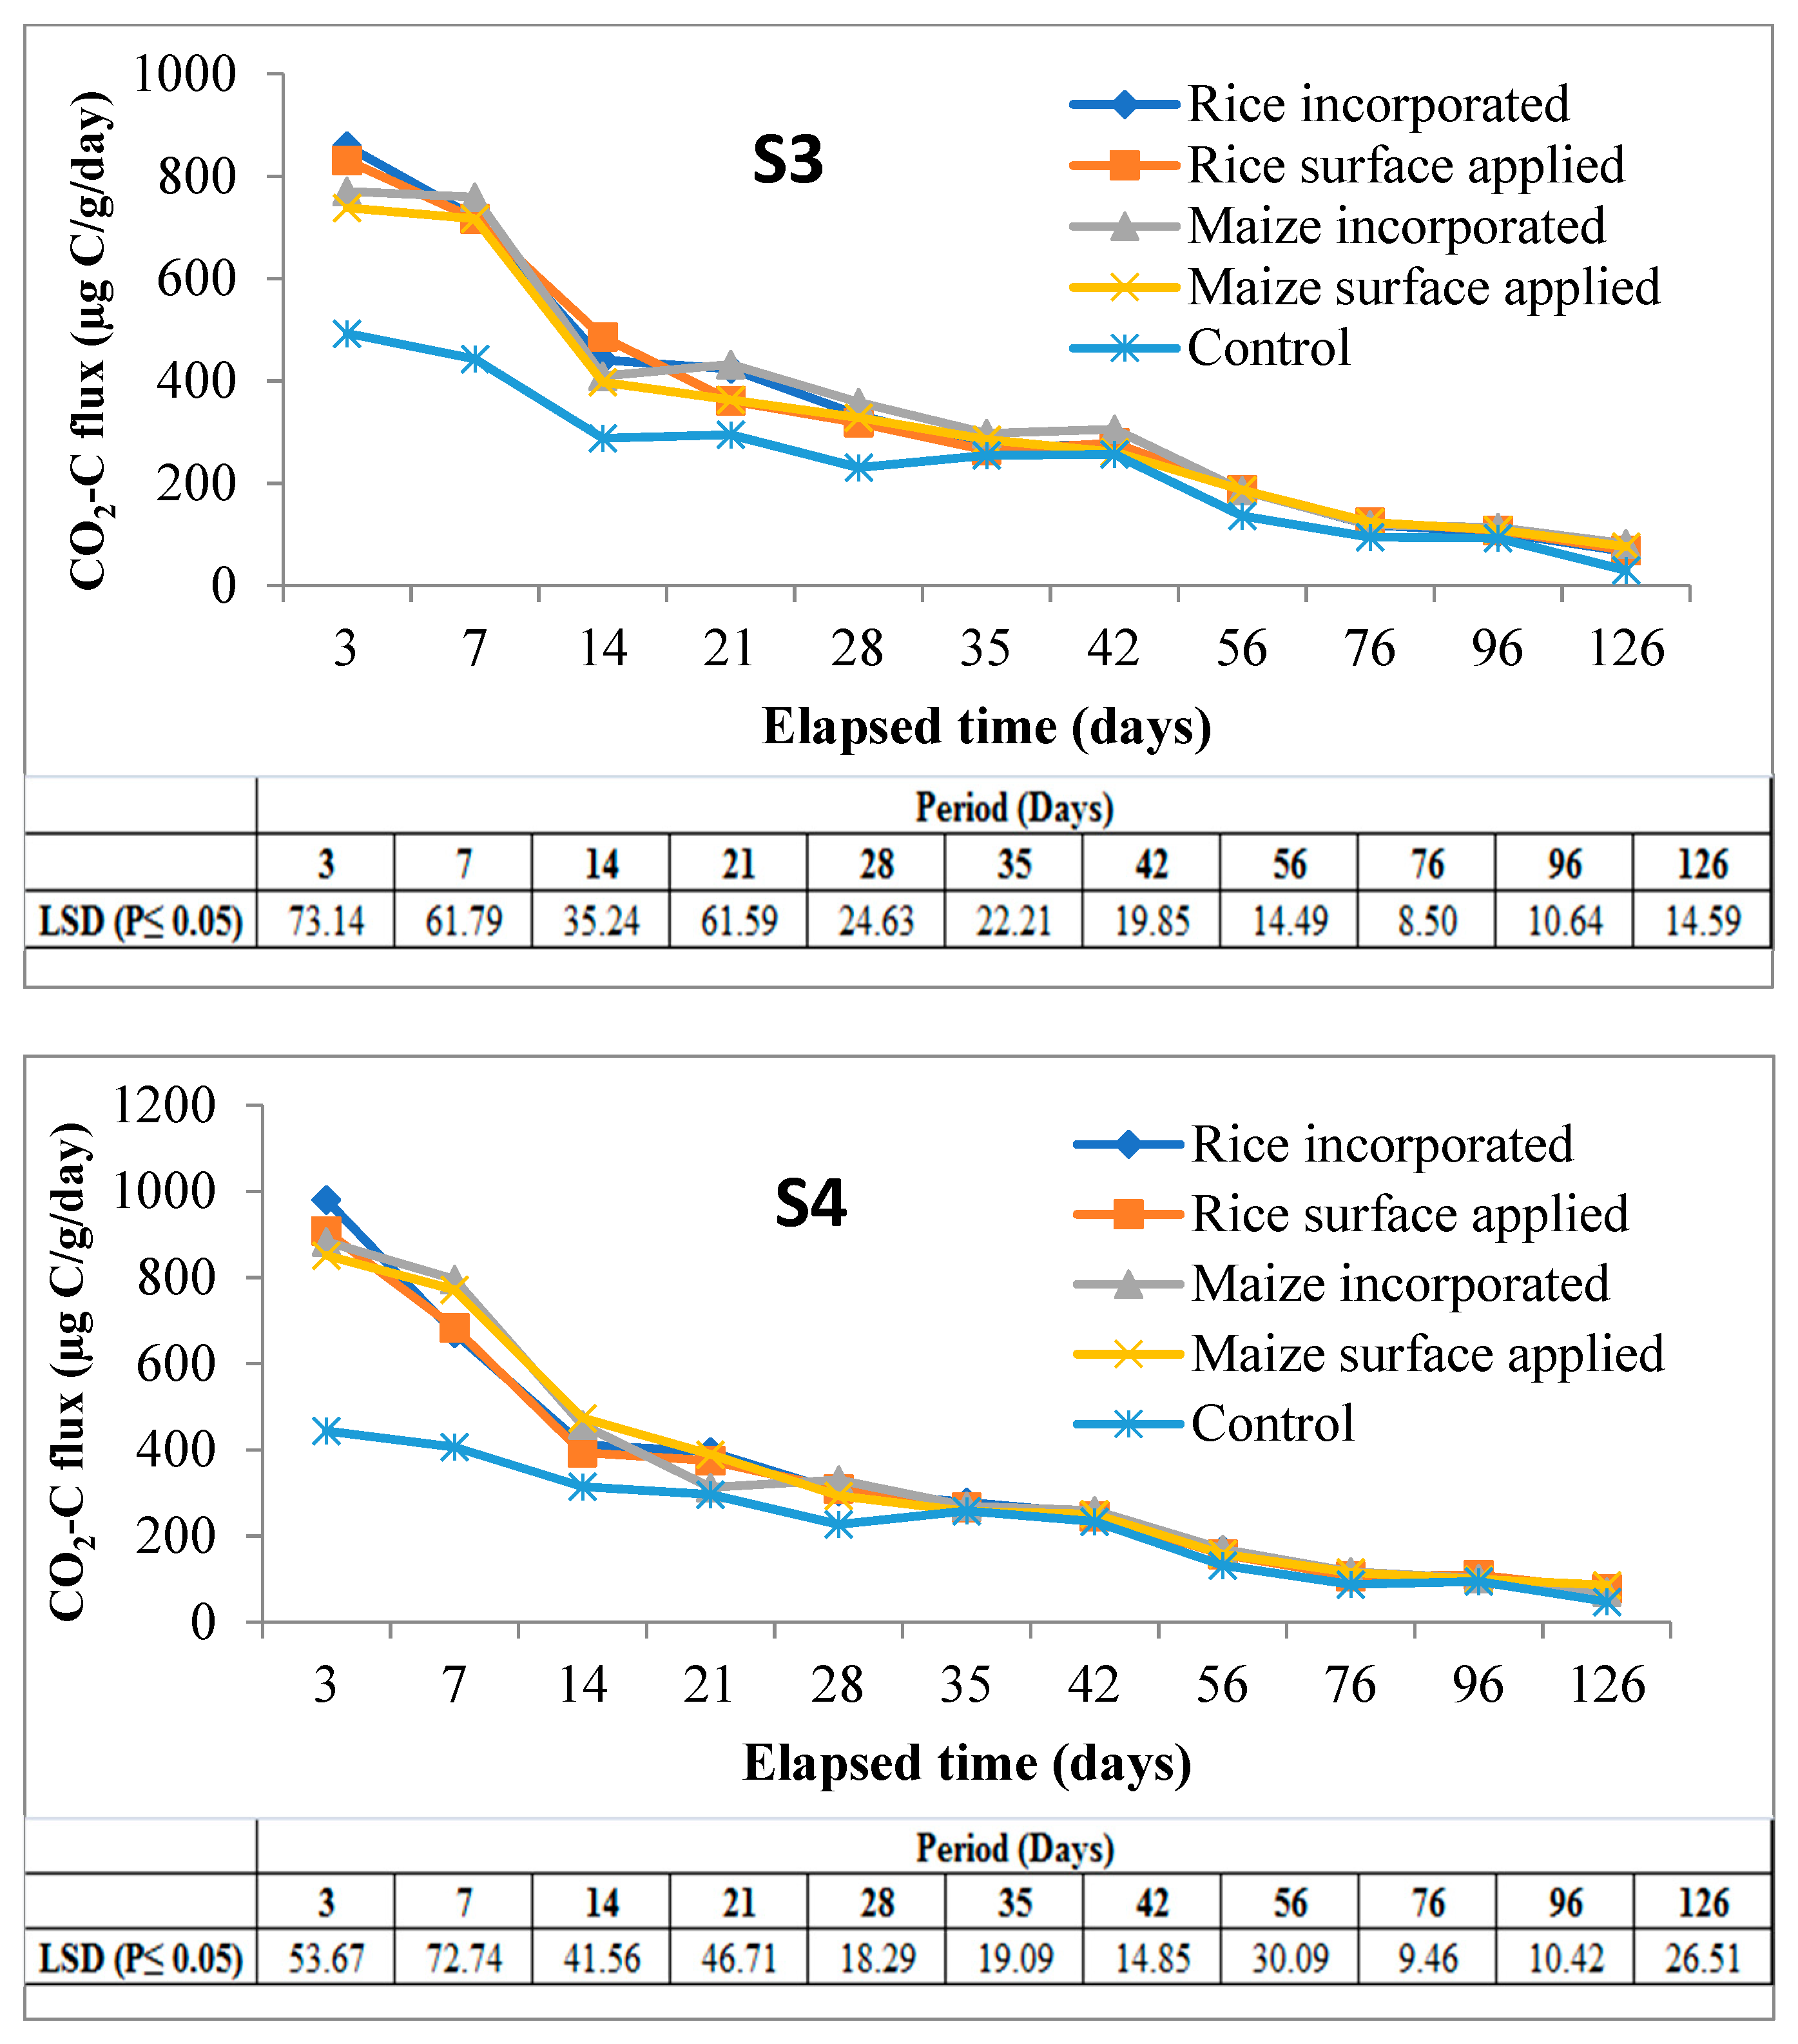
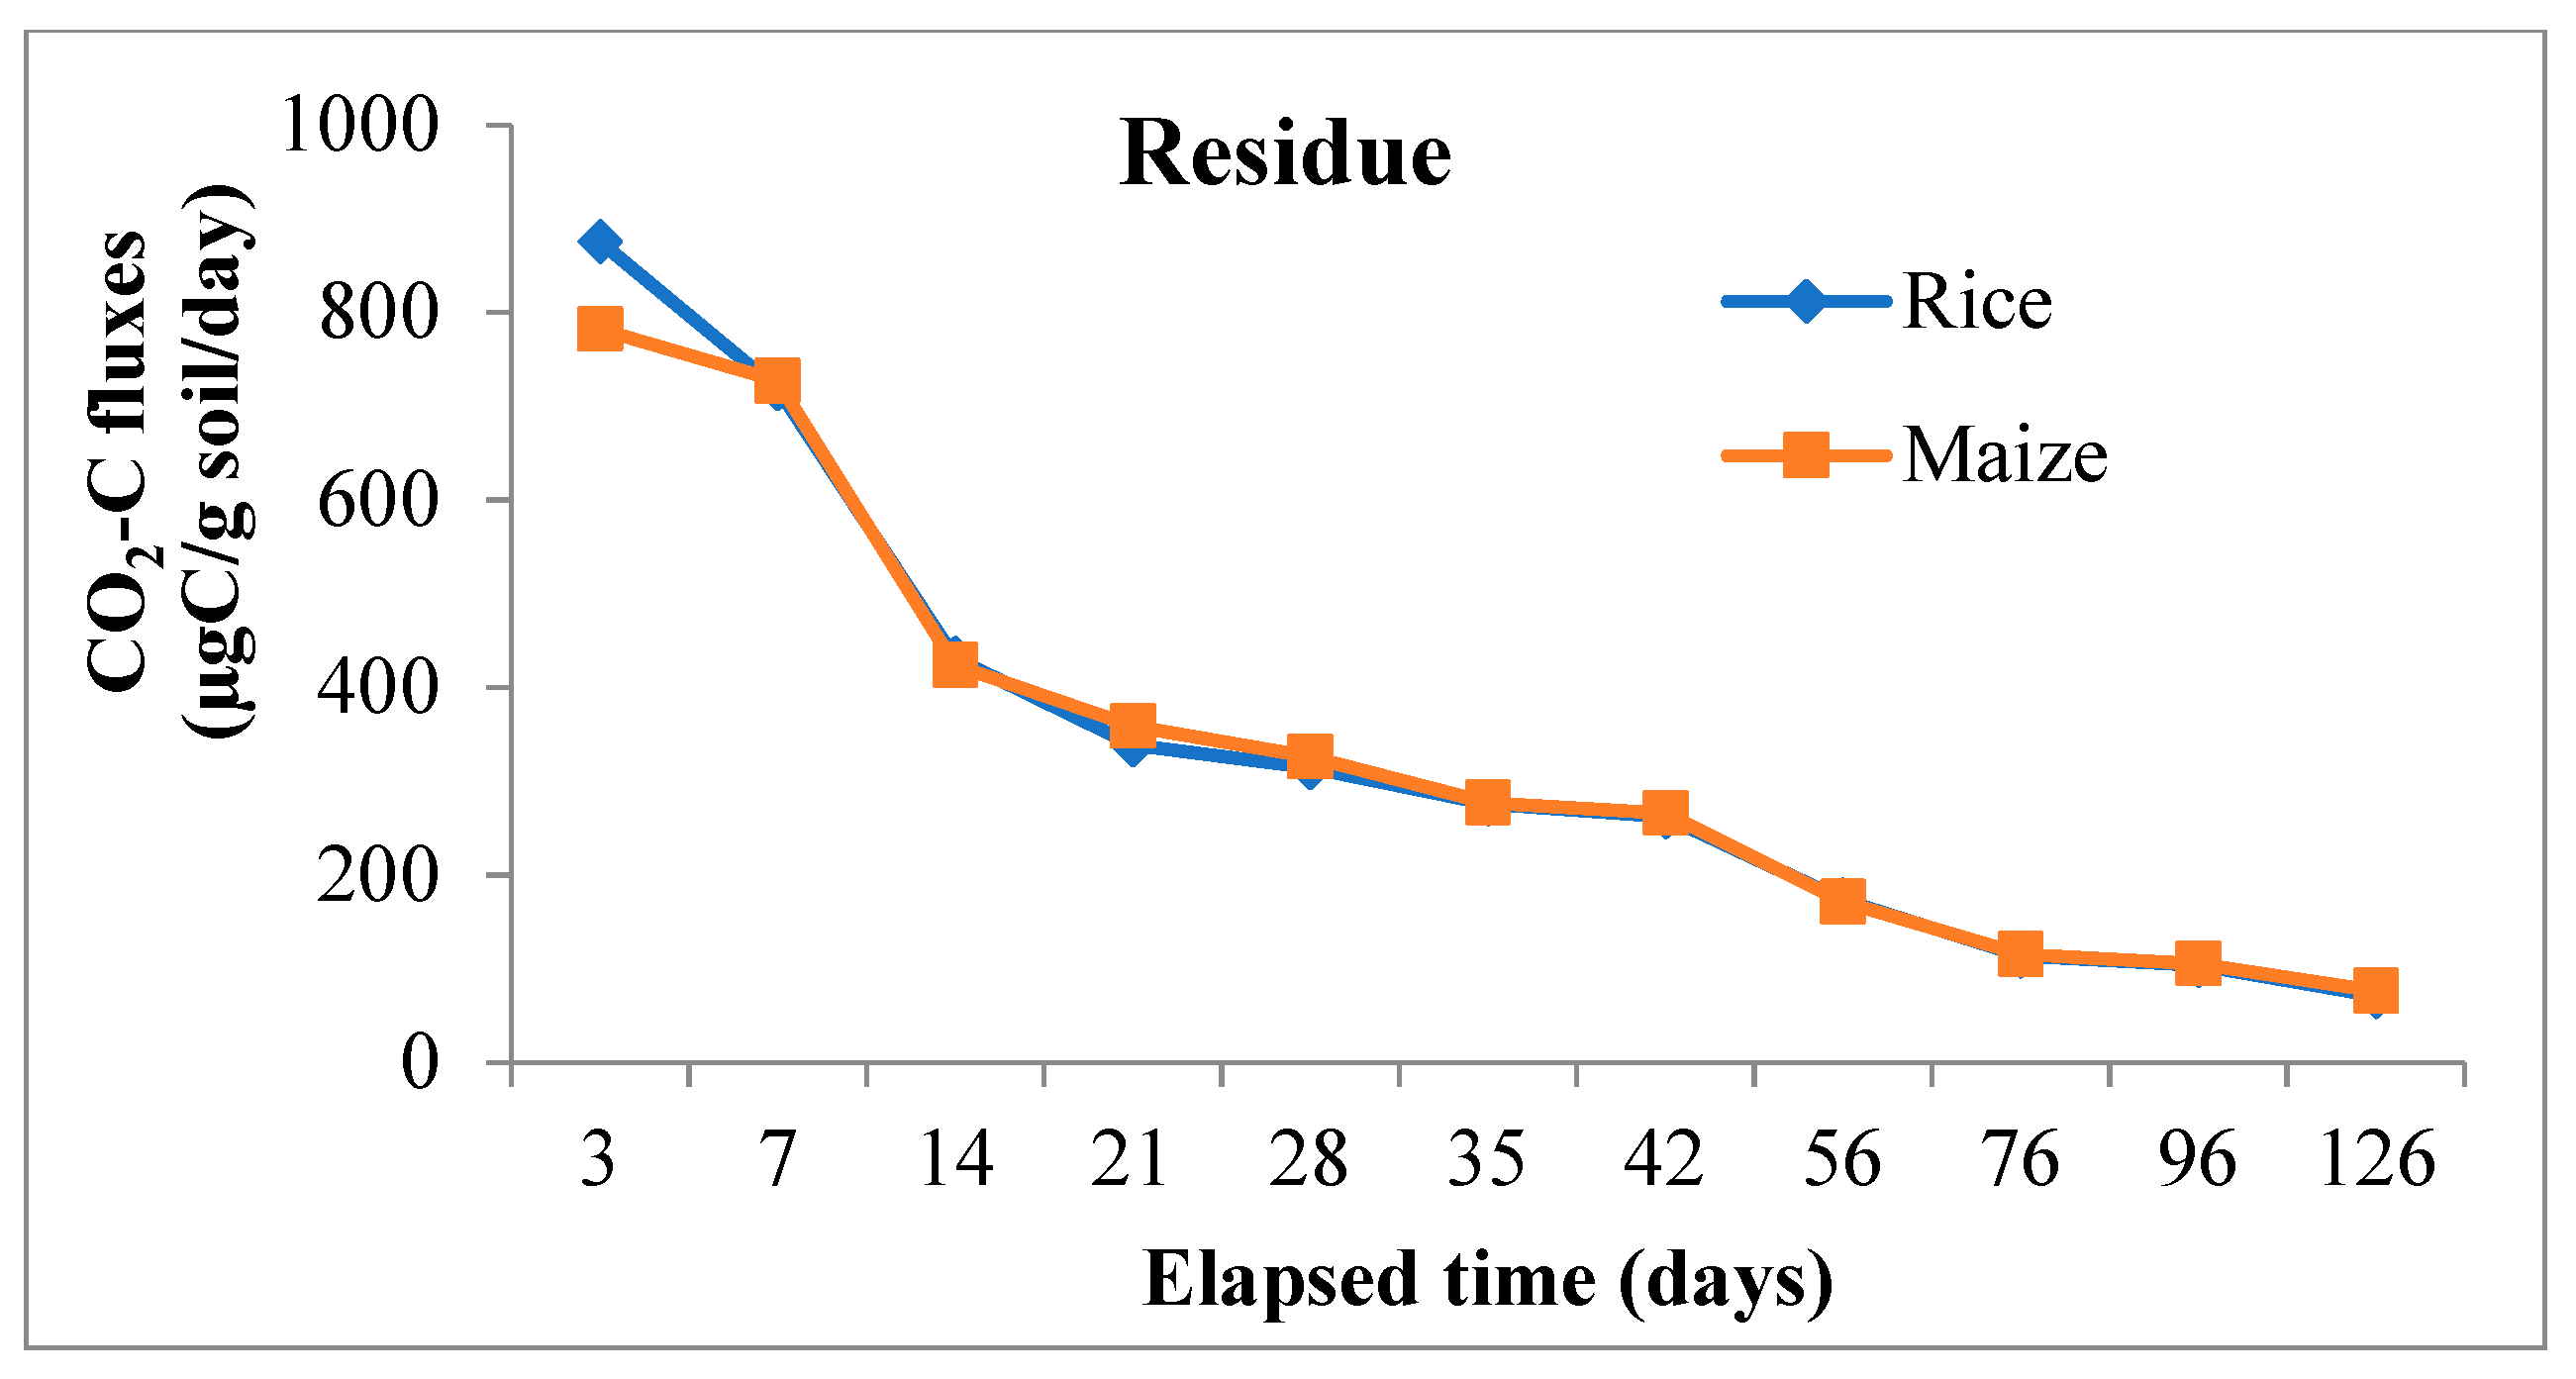
3.1. CO2-C Fluxes during the Period of Incubation

A sharp rise in CO2 evolution during first 7 days of incubation was noticed in all the soils irrespective of residue types and their methods of application. After day 7, there was a rapid phase of decrease in CO2-C which continued up to day 14 followed by a sluggish nature of CO2 emission up to 42 days. Thereafter, CO2 evolution almost levelled off in all subsequent periods up to the end of 126 days of incubation. A highly significant difference between the amended and control soil was observed up to 28 days of incubation in all cases (Figure 2).
From the main effects of the residue, application, and soil (Figure 3), it was found that CO2-C evolution rate was higher in rice residue (875.32 µg C/g/day) than maize (782.04 µg C/g/day) only at third day of incubation, the increase over maize residue being 11.9%. From day-7 and onwards evolution of CO2-C rate from maize residue was higher than from rice in all subsequent periods up to 126 days of the experiment. At the end of incubation (126 days), the mean CO2-C rate from maize and rice residues figured as 76.19 and 70.64 µg C/g/day. However, the CO2 evolution rate from maize residues varied more significantly than rice residue treatments at three sampling periods i.e., 3, 21, and 28 days. Residue incorporation recorded higher values than surface applied mode of application but differences between the two were significant only up to 42 days and it was more so in the initial stage (850.61 vs. 806.75 µg C/g/day) of incubation. The higher amount of CO2-C was released from S3 (Inceptisol of Malda) during the period of incubation, but it varied significantly from day 21 to the last sampling day of incubation; however, at third and 14th day of incubation, S4 recorded significantly higher values of 905.57 and 434.35 µg C/g/day respectively.
Interaction effects (data is presented in Supplementary Tables S1 and S2) showed that the effect of residue and soil on CO2-C fluxes was positively significant between 3 and 21 days of the experiment, and after that from the intermediate period to the last day of incubation was non-significant on CO2-C fluxes except at 35, 76, and 96 days of study. In case of interaction between soil and mode of application, incorporation of residue in soil-3 significantly increased the CO2-C fluxes as compared to surface application treatment. While residue x method of application on CO2-C fluxes confirmed that maize residue when incorporated significantly enhanced the CO2-C fluxes over surface applied treatment at day-7, this was reversed in the case of rice. However, the surface application of maize residue recorded significantly lower values during the intermediate stage of incubation.

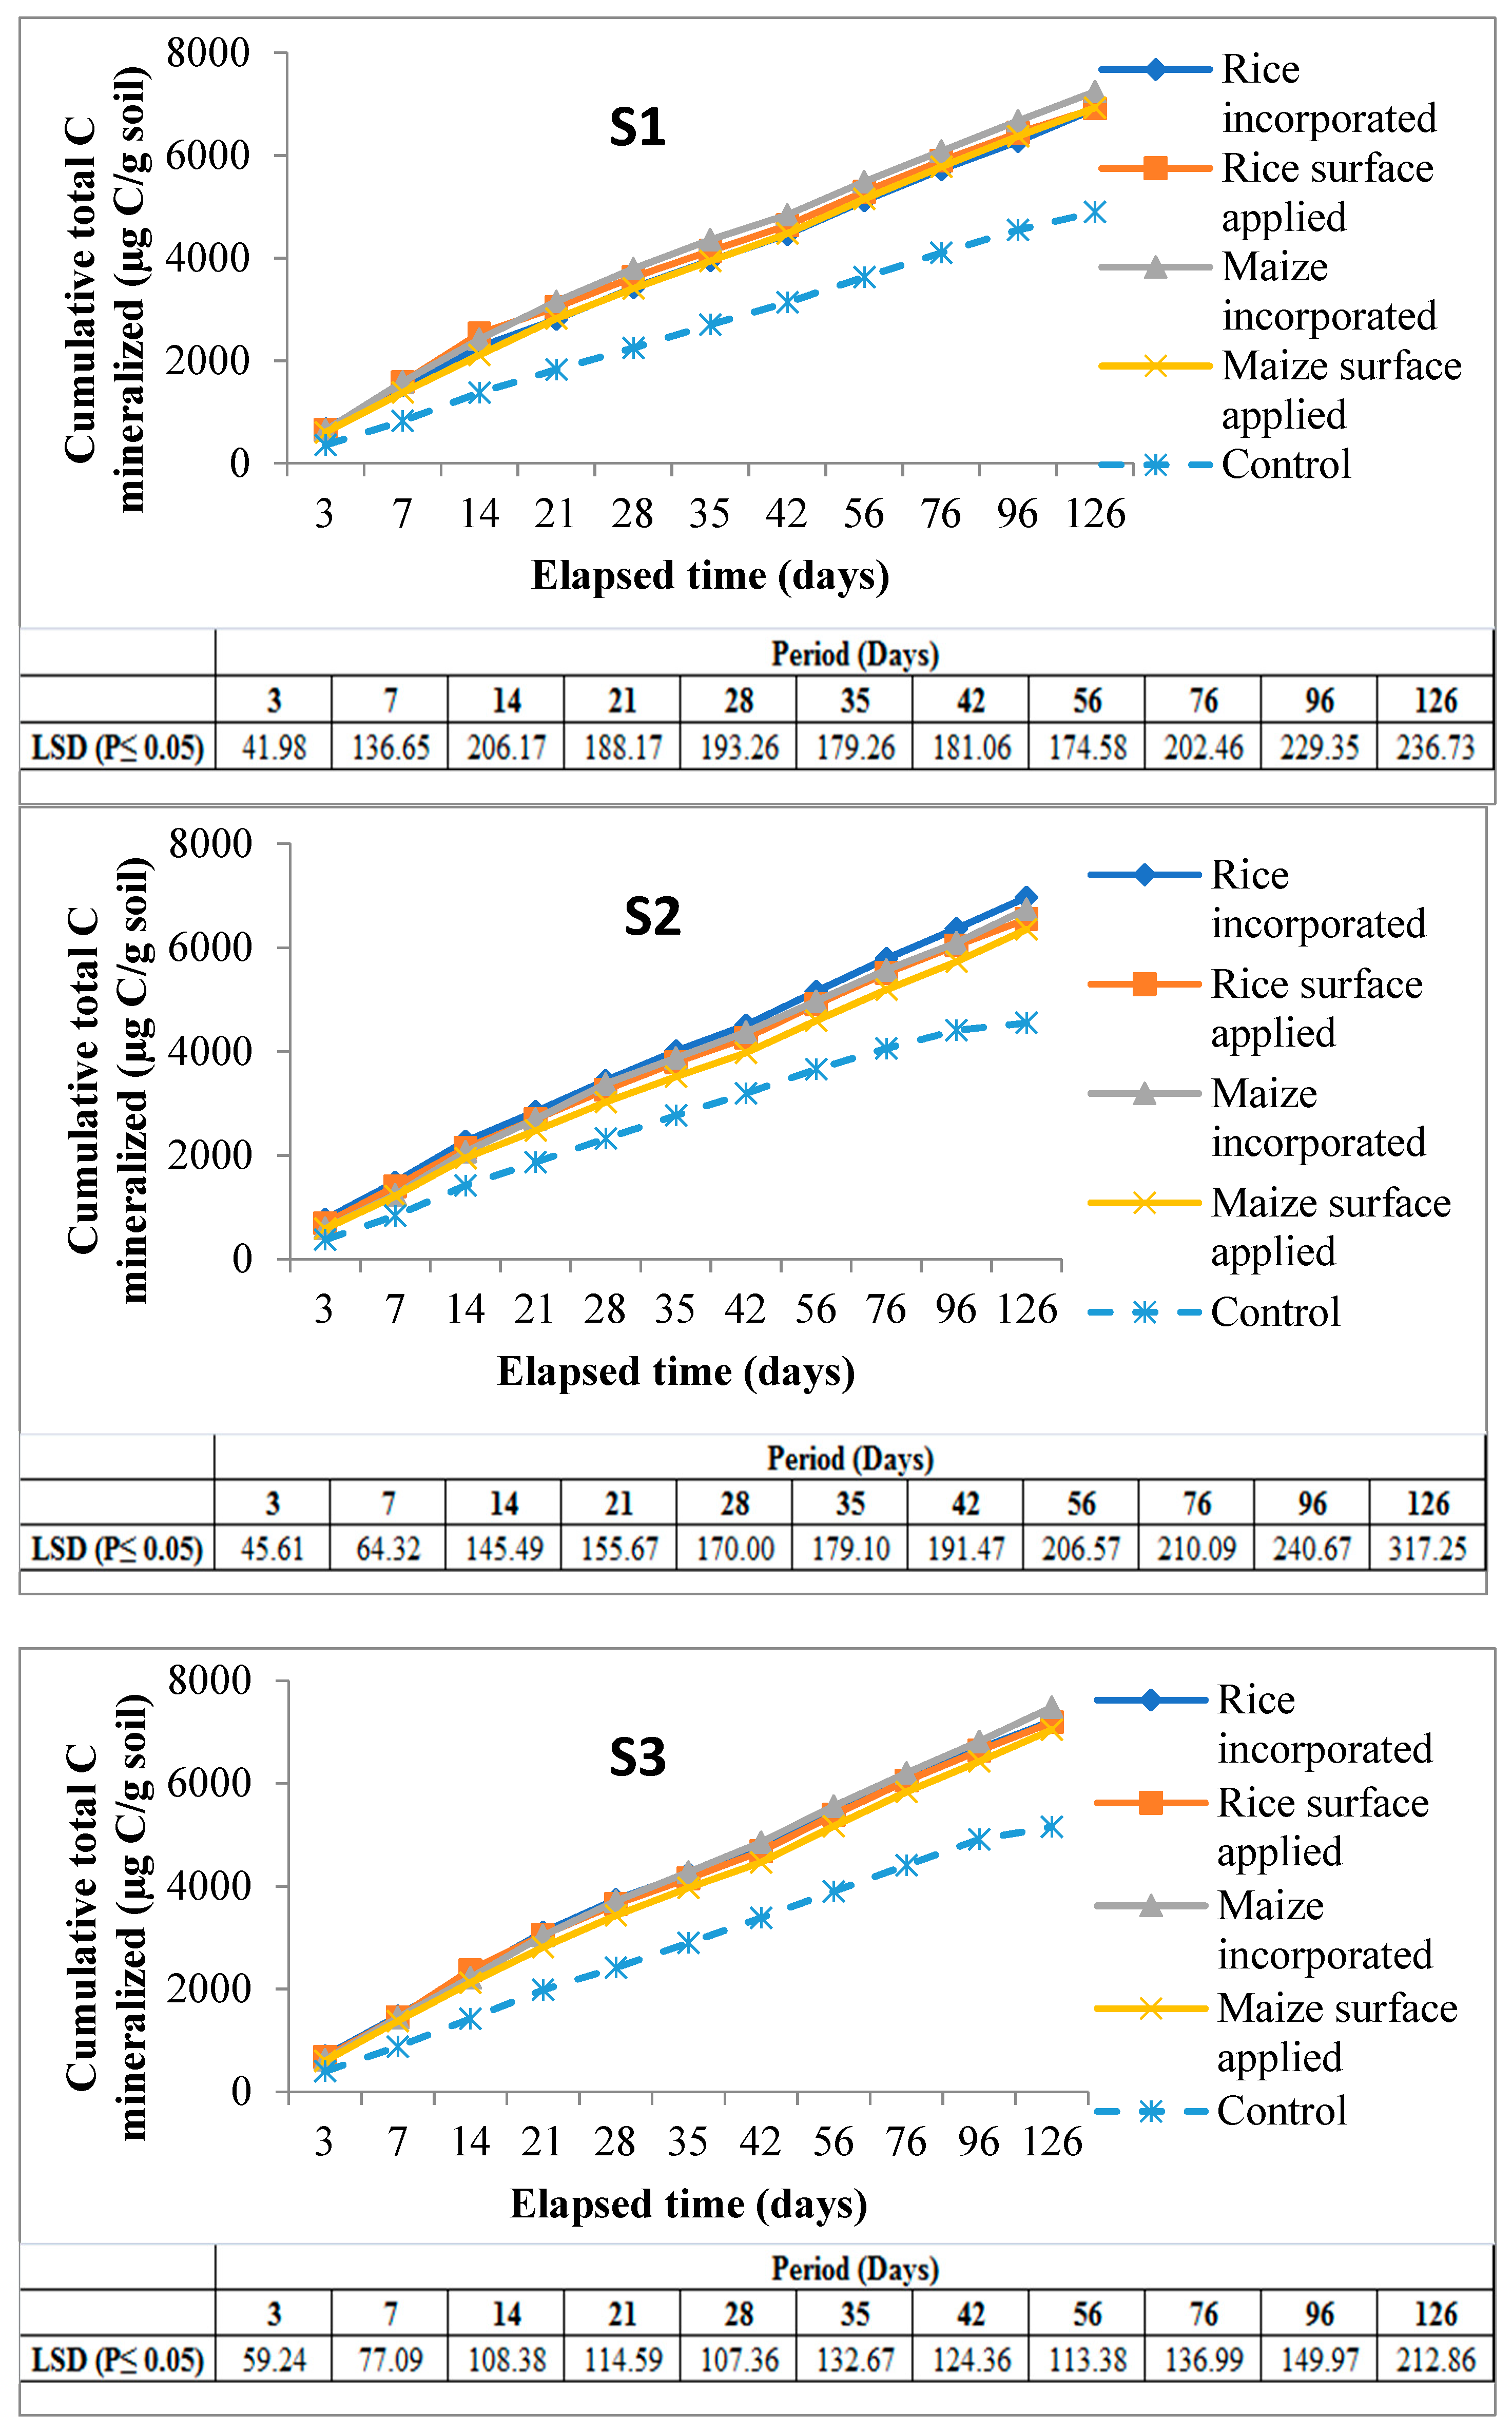
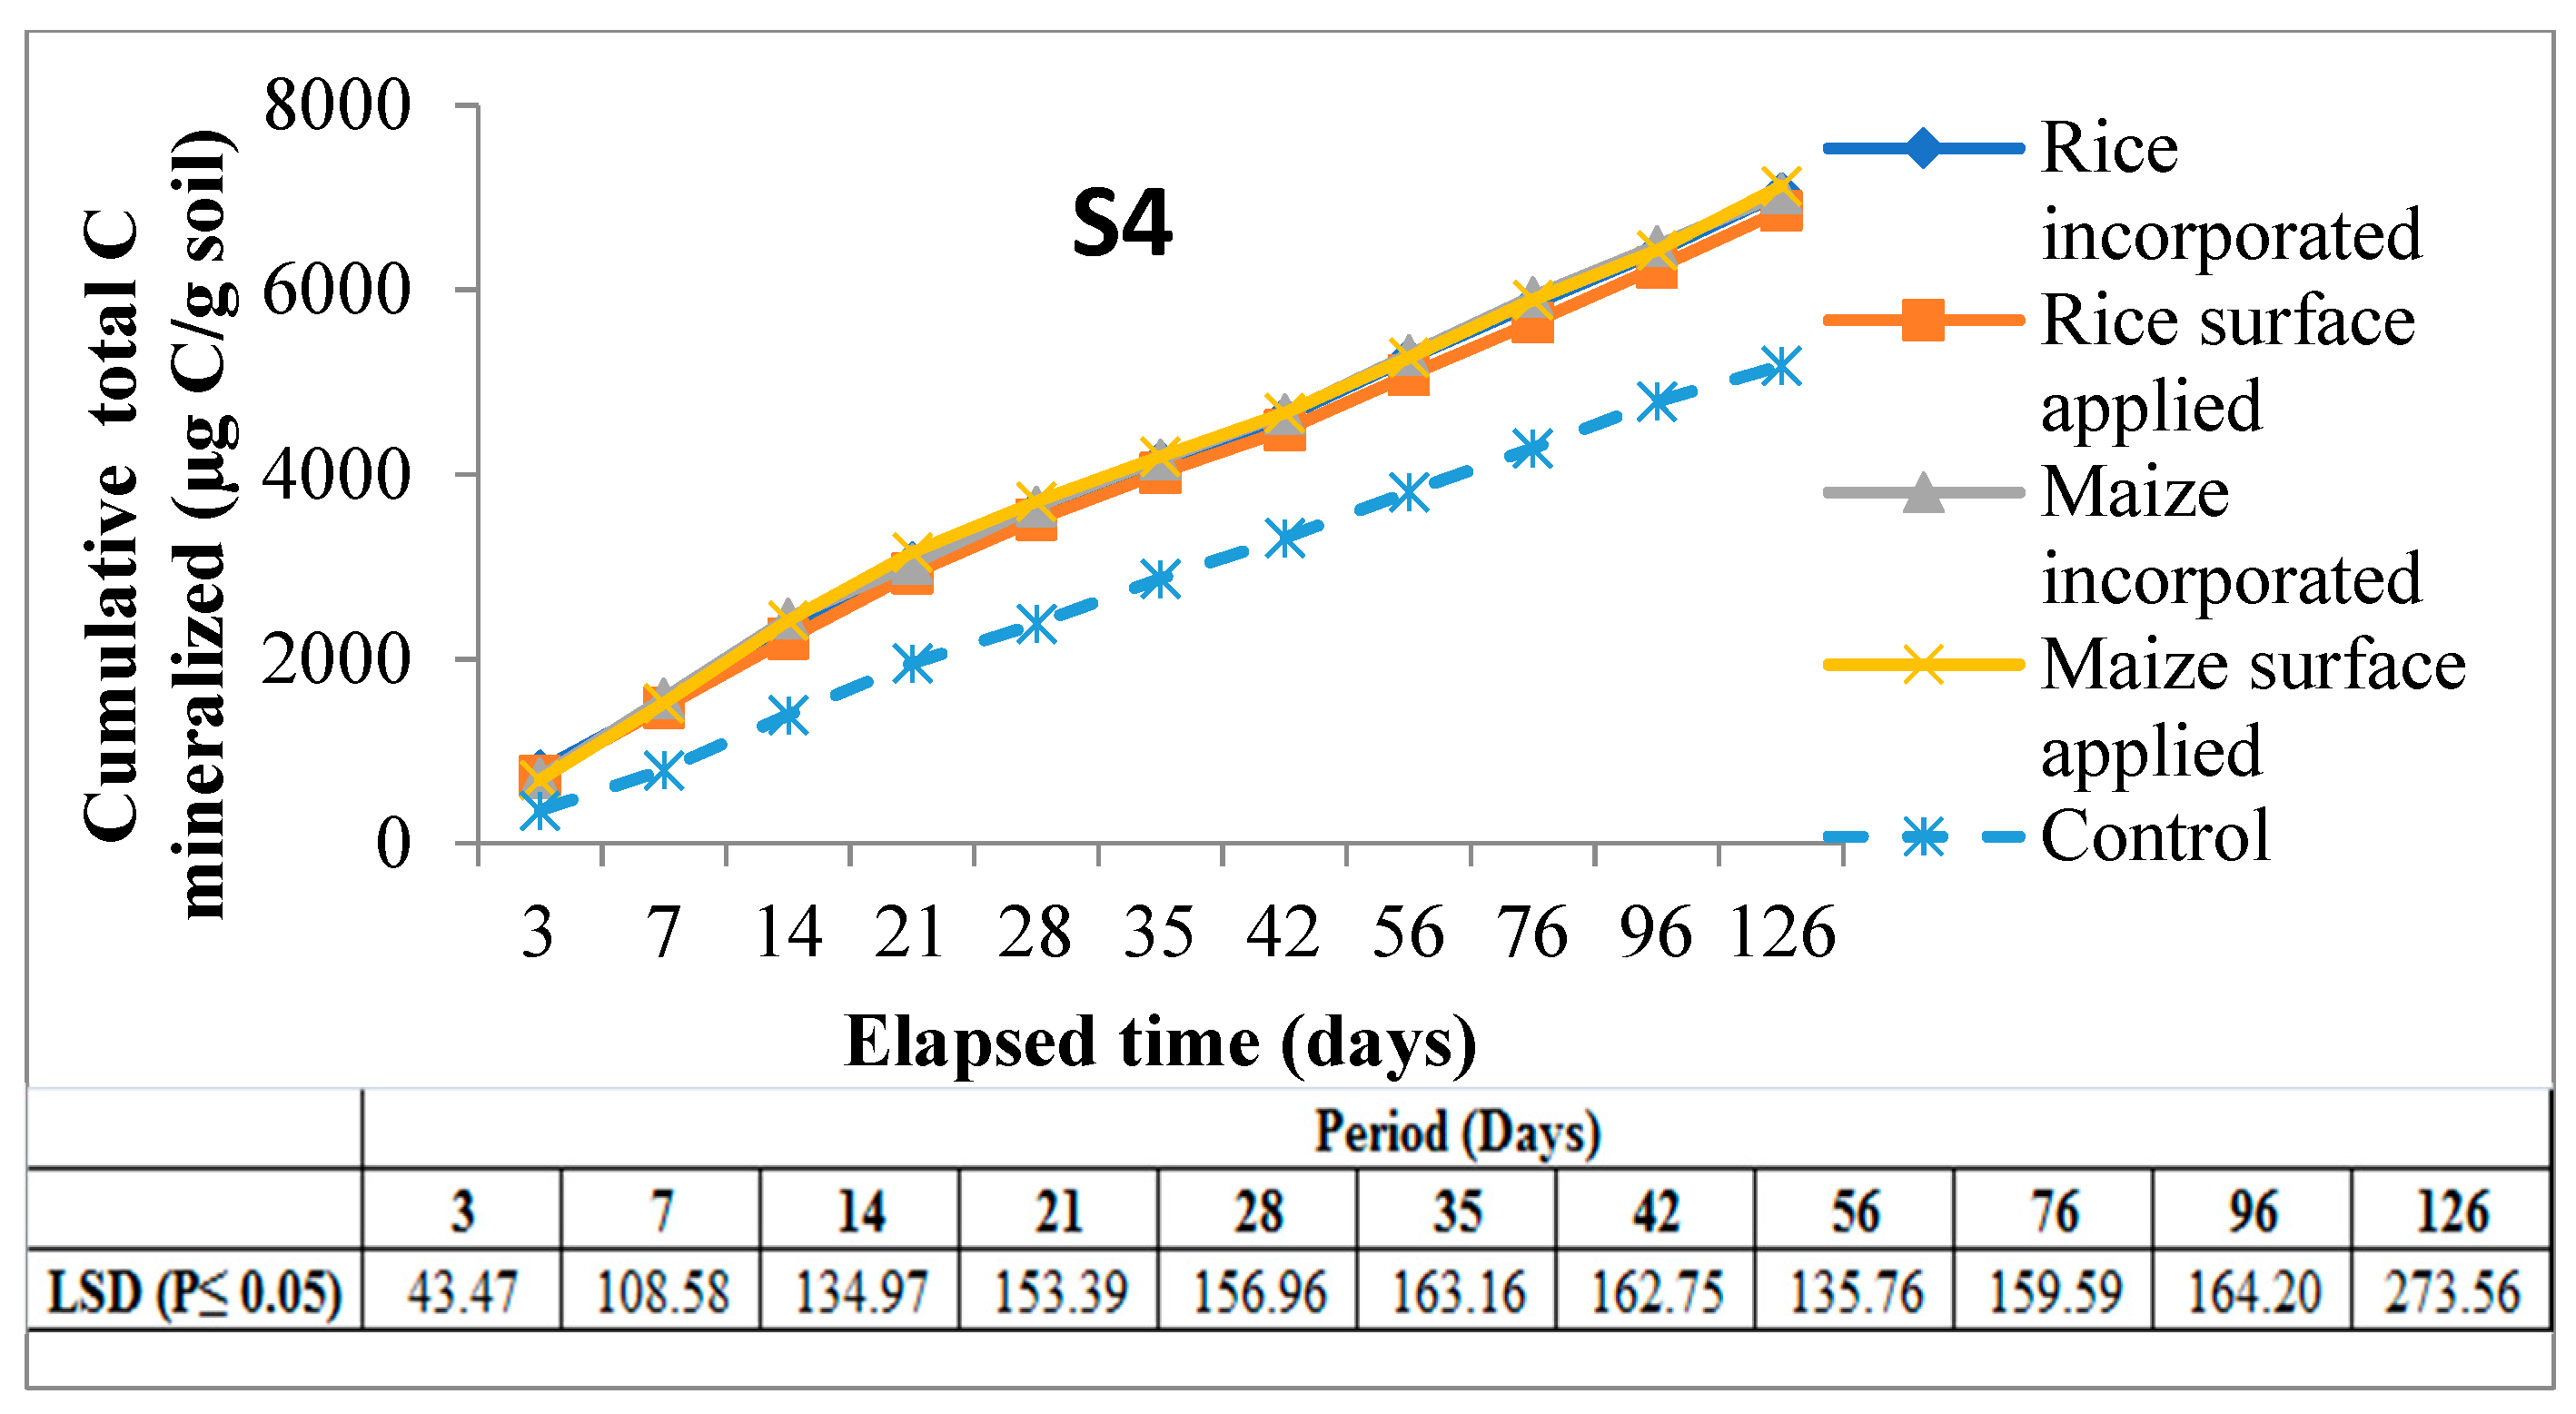
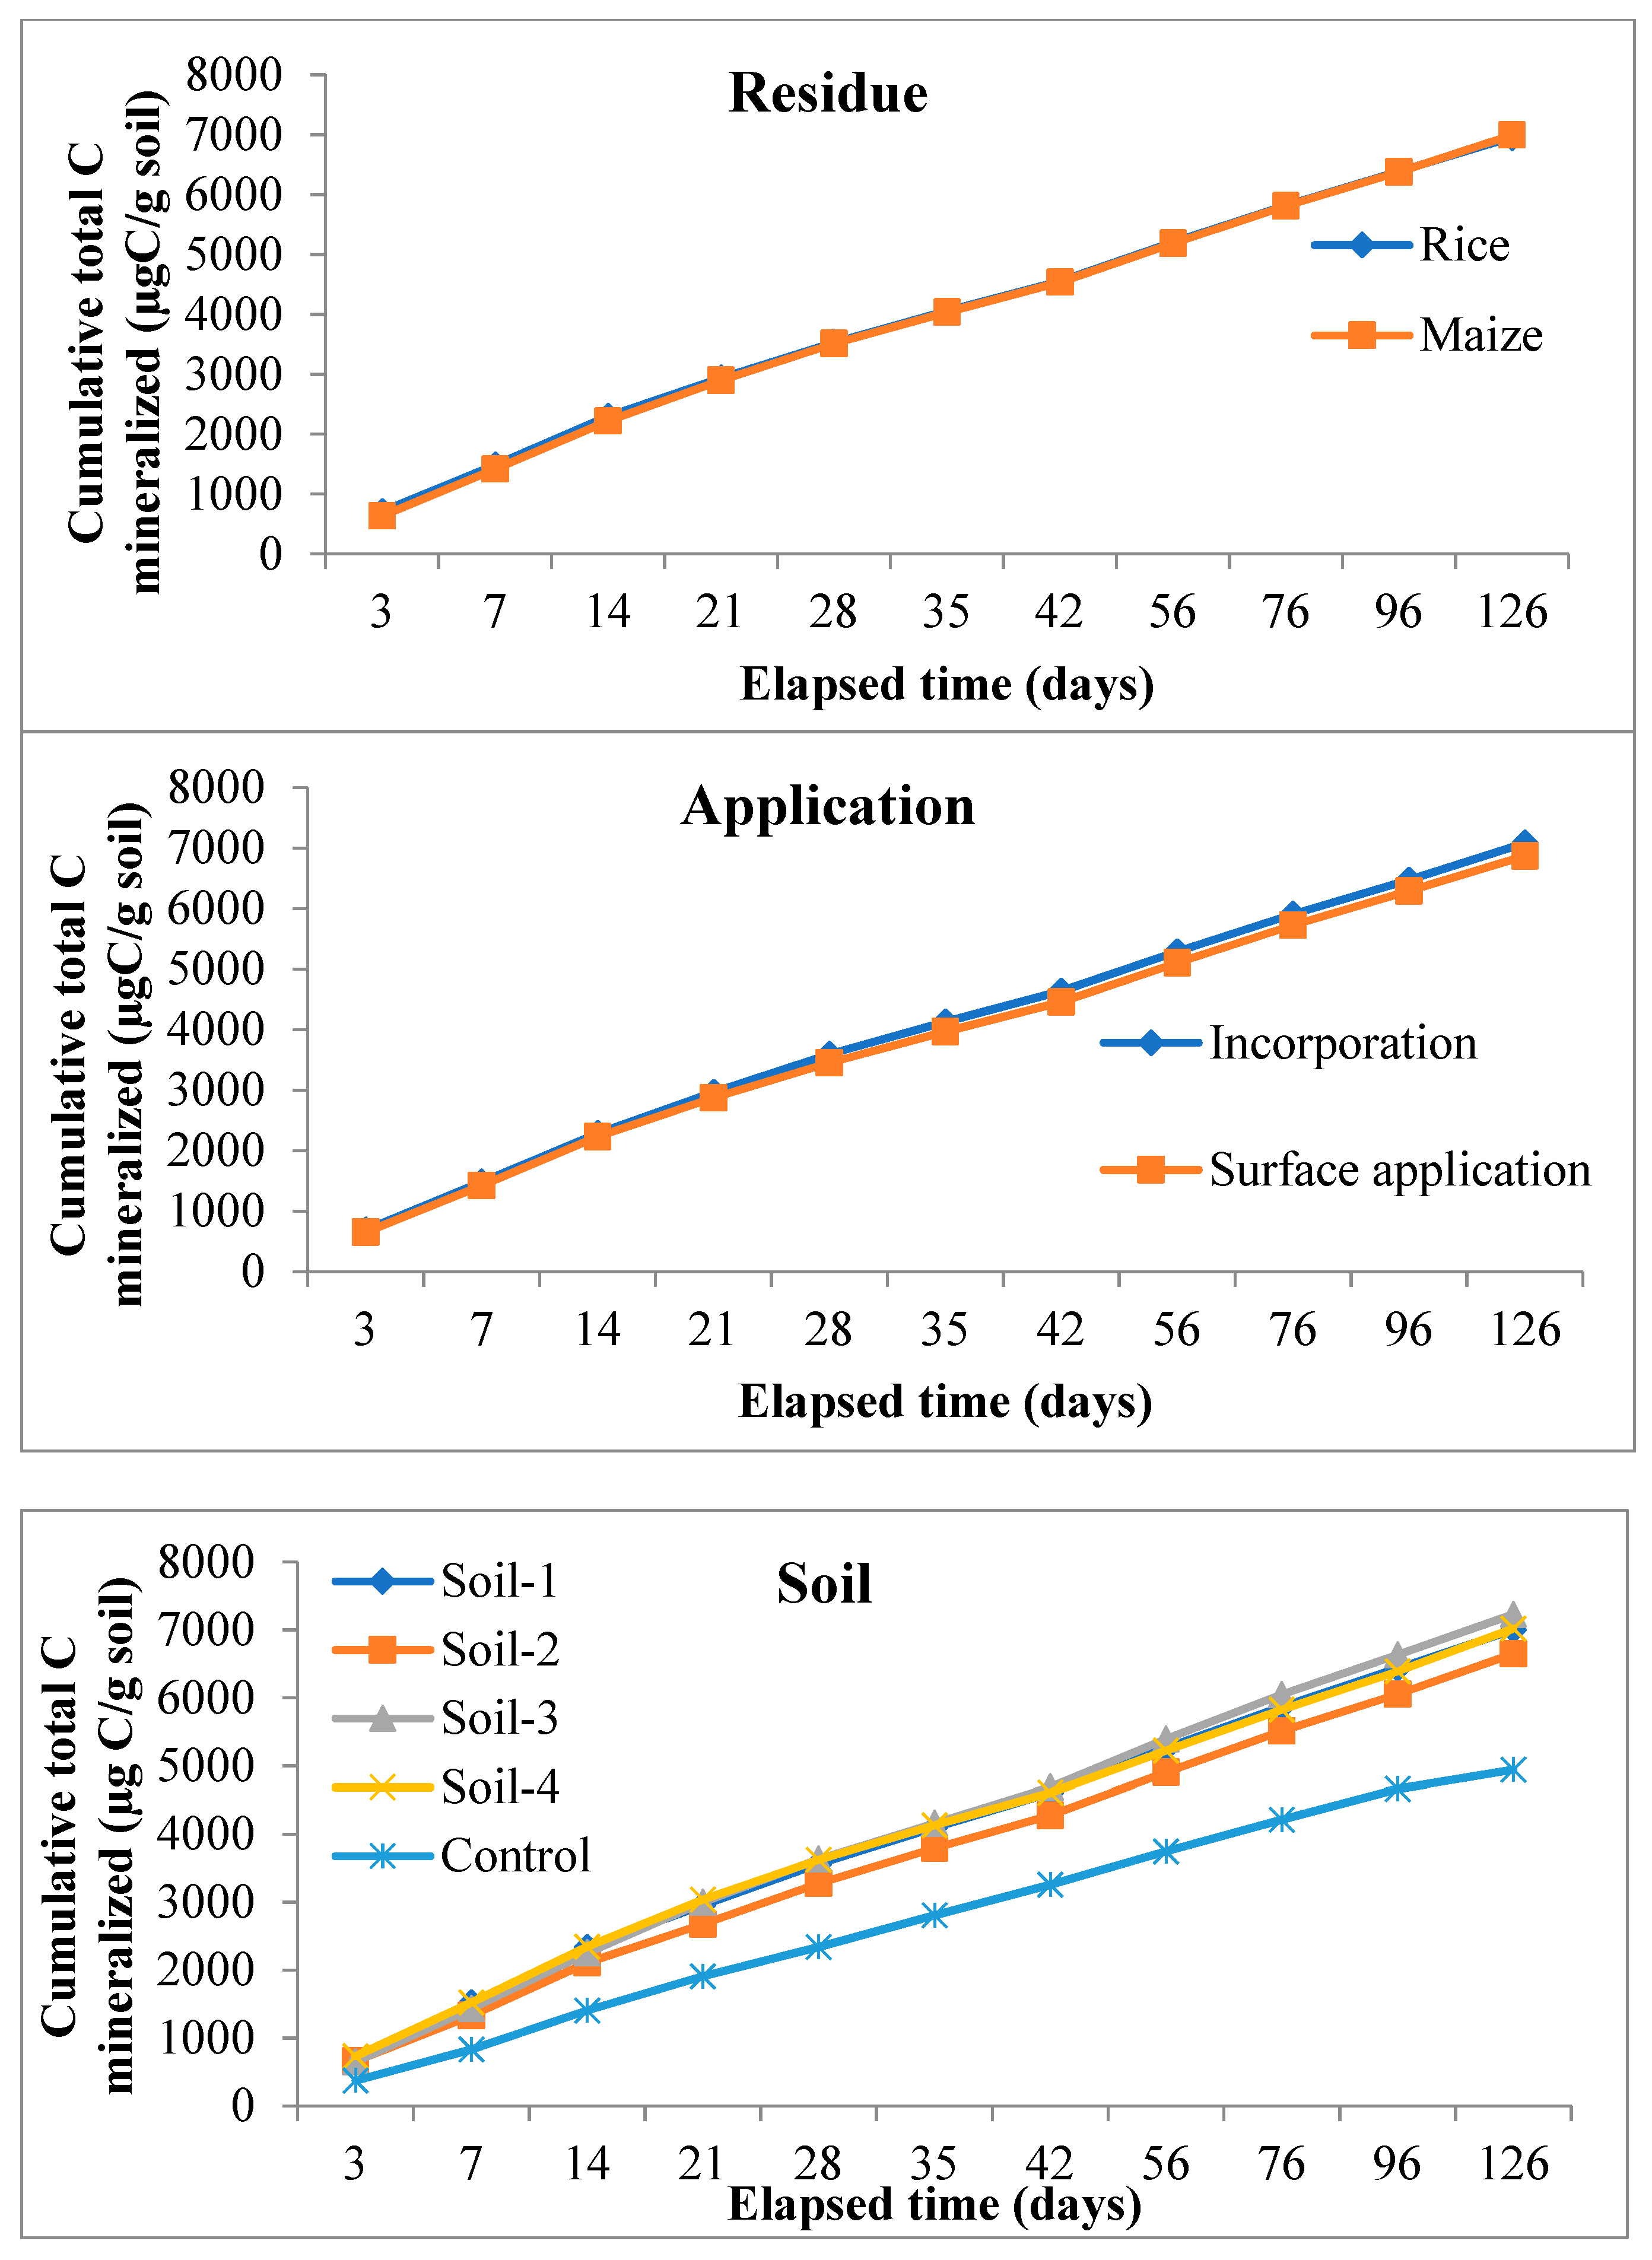
3.2. Cumulative Total C Mineralized during the Period of Incubation

There was a progressive release of cumulative total C from the soils with an increase in time till 126 days of incubation, but cumulative C releases from control soils were significantly lower than residue amended soils at all sampling intervals till the end of incubation. The highest amount of C mineralized was noted in S3 (Inceptisols of Malda) incorporated with maize residue treatment (7478.9 µg C/g soil) as against the lowest (6544.5 µg C/g soil) C released in S2 (Entisols of Coochbehar) under rice surface applied treatment, showing significant variation between these two (Figure 4).
The rate of C mineralization was significantly (p ≤ 0.05) higher in case of rice residue compared to maize from day-3 and up to day-14 during the entire period of incubation. The highest cumulative total C mineralized was recorded in rice residue (709.01 µg C/g soil) over maize (633.45 µg C/g soil) at day-3, but at the last day of incubation (day-126) the highest value was noted in maize residue (6994.12 µg C/g soil) over rice (6955.32 µg C/g soil) which was comparably non-significant (Figure 5). Significantly (p ≤ 0.05) higher values of cumulative total C mineralized were documented by the incorporation of residue than by application on the surface during the entire period of incubation. The cumulative total C mineralized after 126 days of incubation period was 7080.71 and 6868.74 µg C/g soil in case of incorporation and surface application, respectively, with the former being 3.08% higher than the latter. At 126 days of incubation period, a significantly (p ≤ 0.05) highest cumulative total C mineralized was recorded in S3 followed by S4, i.e., 7229.78 and 7020.67 µg C/g soil, respectively (both soils are of Inceptisols), the lowest being 6649.01 µg C/g soil recorded in S2 (Entisol), which was 8.73% lower than the former highest value.
Under the interaction effect at day-3, a significantly highest amount of C mineralized was documented in S4 when amended with rice residue, followed by S2 treated with maize. However, on the last day (day-120), S3 recorded the highest values of cumulative C mineralized when amended with maize and rice residues, respectively, compared to the other three soils studied in this experiment. The interplay between soil and method of residue application indicated that there was higher mineralization in S4 in case of incorporation at day-3 compared to surface application. Placement of both rice and maize residue as incorporation significantly enhanced the cumulative total C mineralized between 14 and 96 days of incubation period as compared to surface application.
Significantly (p ≤ 0.05) higher amount of relative % loss or released of added C was noted in residue amended soils over control soils (Figure 6). The maximum C release showed under rice residue, followed by maize when incorporated in S1. However, the lowest % C loss was recorded in S2 when rice residue was applied on the surface, followed by S4 under the same treatment. Conclusively, the % C lost on the last day (day-126) of incubation varied to a great extent among all the treatments including control soils. The relationship between C mineralized vs. % C lost irrespective of treatments (Figure 7) showed that, for every 10% increase in C loss, there was about 0.376 mg/g C mineralization from the applied residue C.

3.3. C Mineralization Kinetics

The exponential model was found to be the best fit in explaining the variability among the residue amended treatments in four different types of soils at each method of placement in this experiment (Table 2).
Mineralization potential (C0) values in residue incorporated treatments varied (Table 3) from 16.66% in S2 to 25.86% in S1 for maize residue; where, in case of surface applied treatment, the values ranged from 11.83% for maize residue in S2 to 26.25% for rice residue in S1. Relatively, similar rate constant (k) values were reported in both the methods of placement, but the higher rate of potential mineralizable residue C (C0k) was recorded in residue incorporated treatments over surface application for both rice and maize residues. The lowest k value of 0.007%/day was noted in S4 in both the residues under both methods of placement. Similarly, the alike value (0.007) was also recorded in case of rice residue for both S1 and S2 under surface application and in maize residue for S1 under incorporation treatments as against the highest value of 0.010%/day in maize residue for S2 under both the application methods. The greater amount of C0k (0.185%/day) was recorded in maize for S3 under residue incorporation followed by the closest value 0.184%/day noted in rice for S1 where the residue applied on the surface. The least k value of 0.007%/day with the highest C0k (0.184%/day) resulted in rice residue for S1 under the surface application. The extrapolation data (Table 3) which predicts the future outcomes based on the study between 0-day and 126-days using the first order kinetic model equation: C = C0 (1 − e−kt) revealed that the treatment where the residue was incorporated in soil releases maximum amount of C at 156 days of incubation, irrespective of residue type. The highest % C lost at 156 days of incubation was recorded for S3 (83.58%) followed by the lowest value of 69.32% for S4 in maize residue under incorporation treatment; whereas, in the case of surface application, rice residue in soil-1 showed the greater C loss (78.23%).

4. Discussion

An active phase of CO2 evolution during early stages of incubation is due to the priming effect of the added residue. Maximum rates of CO2-C noticed from days 2 to 9 show the active phases of releasing organic C due to the priming effect of the added organic materials [31]. In our study, we noticed a rapid phase of decrease in CO2-C from 7 to 14 days followed by a sluggish nature up to 42 days and thereafter a levelling off up to the end of incubation. Our results were in strong agreement with Jin et al. [32] who found a very rapid C evolution in the initial 5 days and after 3 to 4 weeks, which levelled off and became linear. On the first day of incubation, CO2 evolution rates from soil varied from 51 to 85 µg C/g/h and after 7 days the rate of CO2 evolution [33] decreased rapidly; thereafter, the intensity flattened during the 56-days incubation period.
CO2 evolution followed a different pattern according to residues species, mode of application and soil type during incubation. We observed different responses in CO2 evolution among the soils due to the variation in soil pH. The variations for total CO2-C evolutions are due to the fact that there is a loss between the low and high pH soils [34]. The significantly higher amount of CO2 release from S4 (Inceptisols of Malda) in the earlier part of incubation may be explained by its higher initial soil pH i.e., 8.25 (Table 1). An increase in C mineralization is accelerated by the increase in soil pH with variable effects of organic materials’ biochemical properties [35]. When residues were applied as incorporation in soil, this liberated a huge amount of CO2 compared to surface application. Mixing of crop residues with soil particles accelerates the decomposition process compared to residues being left on the soil surface [36]. Rice residue, when applied on the surface, showed higher peaks of CO2 evolution. Our results were in strong agreement with Li et al. [37]. The maximum CO2-C evolution in the case of rice residue at the early phase of incubation is due to its lowest C:N ratio (62.8–73:1) compared (Table 1) to maize residue (89.7–109.6:1). Residue with low C:N ratios significantly increases the initial C mineralization compared to high C:N ratios [29,38,39]. Soil microorganism’s activity is highly influenced by the soil N availability and the quantity of mineralizable substrate [40]. Further, the N release from the residue decomposition also helps in meeting the N demands of decomposers, and they produce a stimulating effect on C mineralization [41,42].
Interestingly, the S2 (Entisol of Coochbehar) comprised of low C and N content (10.5 and 1.35 g/kg, respectively) showed a greater amount of relative loss of added C (Figure 6) because of the residue addition. Soils with low C and N availability also affected the C mineralization rates with organic materials [43,44]. The greater amount of C mineralization in the residue incorporated treatment is mainly due to the interaction of soil with residue that accelerates the decomposition rates by providing the nutrients to the microbial population. Maximum cumulative C mineralized under residue incorporated treatments, also noted in the study of Datta et al. [29]. At the last stage of incubation, lower C mineralization rates were observed in the surface application as compared to the incorporation of wheat straw (29.3% of total added C mineralized) [32]. In residue mixes, higher decomposition rates and nutrient availability are observed due to synergistic interaction [45]. Synergistic interaction is referred to as nutrient transfer between the residue and decomposing microbes due to changes in the microbial population and priming [45]. Stemmer et al. [46] revealed in their incubation experiment that organic matter is more decomposed and protected when mixed into the soil than via surface application. However, Smith et al. [47] in their study concluded that the higher the substrate mineralization at the initial stage, the more persistent it will be over time in the soil. The type of residue does not matter; when it is applied on the surface, C mineralization or decomposition rate is naturally slower; ultimately the cumulative C mineralization is also lower. Coppens [48] reported that, regardless of the residue type, the decomposition rates were slower when left on the soil surface. However, soil properties and organic C quality determine the decomposition rates of organic matter [49].
The present incubation experiment followed the exponential model. Similar kind of C mineralization data fitted to the exponential model were also reported by Salvator et al. [50] and Li et al. [37]. Residue incorporated treatments had higher mineralization potential (C0) values as compared to those with residue surface applied irrespective of residue types, as well as soils used in this experiment, except with rice residue for S1 (Entisol) and maize residue for S4 (Inceptisol) wherein slightly lower C0 values were noted. However, the C0 values not only depend on residue species or soil type but are also regulated by the soil moisture content which governs the microbial activity. Soil rhizobacteria consortia plays a significant role in determining soil quality [51,52,53,54,55]. Qi et al. [56] suggested that soil moisture also alters the activity of microbes that finally affect the C0. The higher the k values, the faster is the mineralization of organic C in the soil [16]. Similar k values as in our study were also reported by Salvator et al. [50]. The k values ranged from 0.007 to 0.010, which was lower than the values 0.055 to 0.060 reported by Kumar and Goh [57]. We noticed no significant difference in mineralization kinetics between the treatments. This result was in strong agreement with Abiven and Recous [58]. An association between soils and residues would be one of the important reasons for altering the soil physicochemical and biological properties that affect residue decomposition [59,60,61,62] with varying soil moisture conditions [63] and temperature [36].

5. Conclusions

The nature of CO2-C evolution or cumulative C mineralization patterns depends on soil initial C status and physicochemical properties. The amount of C release was higher on the initial days of the experiment and later it gradually decreased, and after that almost levelled off in subsequent periods. Residue species will not only govern the decomposition process; rather the soil characteristics also modify its dynamics. Soils with low C and N availability also affected the C mineralization rates with organic materials added. A significantly higher amount of CO2 was released in the earlier part of incubation from higher pH soils. Thus, among different soil properties, pH is the one strongly influencing factor in the mineralization process. Maximum CO2-C evolution at the early phase of incubation was noticed in rice residue due to its lowest C: N ratio. Placement of rice and maize residue as incorporation significantly enhanced the cumulative total C mineralized between 14 and 96 days of incubation period compared to surface application. Mode of application and residue type with varying soil characteristics governed the C mineralization kinetics. Relatively similar rate constant values were recorded in both placement methods, but the higher rate of maximum potential mineralizable residue C was observed in residue incorporated treatments over surface application irrespective of residue type. In this experiment, C mineralization from the residues followed the exponential model: C = C0 (1 − e−kt). From the results of the kinetic study, it is definitive that residues when incorporated into the soil significantly increases the C footprints through maximum C mineralization compared to when residues are left on the soil surface. Thus, we could further conclude that leaving the crop residues on the soil surface (i.e., ZT management) helps in decreasing the C footprints, aiding in the provision of achieving sustainability from an environmental perspective in comparison to CT where residues incorporated in soils mineralize at a faster rate.

Supplementary Materials

The following are available online at https://0-www-mdpi-com.brum.beds.ac.uk/article/10.3390/su13137212/s1, Table S1: Interaction effect—CO2-C fluxes (µg C/g soil/day) at various sampling intervals in soils amended with different residue treatments under two methods of placement over the period of incubation, Table S2: Interaction effect—Cumulative total C mineralized (µg C/g soil) at various sampling intervals in soils amended with different residue treatments under two methods of placement over the period of incubation.

Author Contributions

Conceptualization, R.S., A.K.S. and D.S.; method, R.S. and A.K.S.; software, R.S., D.S. and A.K.S.; validation, R.S., A.K.S. and D.S.; formal analysis, R.S., D.S. and A.K.S.; investigation, R.S., D.S. and A.K.S.; resources, P.M.; data curation, S. and P.M.; writing—original draft preparation, R.S., D.S., A.K.S., S., P.M., R.D., S.F. and S.D.; writing—review and editing, R.S., D.S., A.K.S., R.D., S.F. and S.D.; supervision, A.K.S. All authors have read and agreed to the published version of the manuscript.

Funding

This research received no external funding.

Institutional Review Board Statement

Not Applicable.

Informed Consent Statement

Not Applicable.

Data Availability Statement

Not Applicable.

Acknowledgments

Rakesh S is thankful to the Australian Centre for International Agricultural Research (ACIAR)—Sustainable and Resilient Farming System Intensification (SRFSI) team, International Maize and Wheat Improvement Center (CIMMYT), Bangladesh, and Department of Soil Science and Agricultural Chemistry, Uttar Banga Krishi Viswavidyalaya (UBKV), Pundibari, Cooch Behar, West Bengal for providing the support in sampling and laboratory facilities. The authors are also grateful to the trial farmers.

Conflicts of Interest

The authors declare no conflict of interest.

References

  1. Sharma, P.C.; Jat, H.S.; Kumar, V.; Gathala, M.K.; Datta, A.; Yaduvanshi, N.P.S.; Choudhary, M.; Sharma, S.; Singh, L.K.; Saharawat, Y.; et al. Sustainable Intensification Opportunities under Current and Future Cereal Systems of North-West India; Technical Bulletin; Central Soil Salinity Research Institute: Karnal, India, 2015; p. 46. [Google Scholar] [CrossRef]
  2. Sinha, A.K.; Ghosh, A.; Dhar, T.; Bhattacharya, P.M.; Mitra, B.; Rakesh, S.; Paneru, P.; Srestha, S.R.; Manandhar, S.; Beura, K.; et al. Trends in key soil parameters under conservation agriculture-based sustainable intensification farming practices in the Eastern Ganga Alluvial Plains. Soil Res. 2019, 57, 883–893. [Google Scholar] [CrossRef]
  3. Sarkar, D.; Kar, S.K.; Chattopadhyay, A.; Shikha; Rakshit, A.; Tripathi, V.K.; Dubey, P.K.; Abhilash, P.C. Low input sustainable agriculture: A viable climate-smart option for boosting food production in a warming world. Ecol. Indic. 2020, 115. [Google Scholar] [CrossRef]
  4. Rakesh, S.; Sinha, A.K.; Sarkar, D.; Sahoo, S.; Roy, D. Key soil attributes as influenced by cropping systems in an entisol of West Bengal, India. Climate Chang. Environ. Sustain. 2020, 8, 226–232. [Google Scholar] [CrossRef]
  5. Rakesh, S.; Sarkar, D.; Shikha; Sankar, A.; Sinha, A.K.; Mukhopadhyay, P.; Rakshit, A. Protocols for determination and evaluation of organic carbon pools in soils developed under contrasting pedogenic processes and subjected to varying management situations. In Soil Analysis: Recent Trends and Applications; Springer Nature Singapore Pte Ltd.: Singapore, 2020. [Google Scholar] [CrossRef]
  6. Lal, R. Soil health and carbon management. Food Energy Secur. 2016, 5, 212–222. [Google Scholar] [CrossRef]
  7. Lynn, T.M.; Ge, T.; Yuan, H.; Wei, X.; Wu, X.; Xiao, K.; Kumaresan, D.; Yu, S.S.; Wu, J.; Whiteley, A.S. Soil Carbon-Fixation Rates andAssociated Bacterial Diversity and Abundance in Three Natural Ecosystems. Microb. Ecol. 2017, 73, 645–657. [Google Scholar] [CrossRef]
  8. Videmsek, U.; Hagn, A.; Suhadolc, M.; Radl, V.; Knicker, H.; Schloter, M.; Vodnik, D. Abundance and diversity of CO2-fixingbacteria in grassland soils close to natural carbon dioxidesprings. Microb. Ecol. 2009, 58, 1–9. [Google Scholar] [CrossRef]
  9. Sarkar, D.; Rakshit, A.; Al-Turki, A.I.; Sayyed, R.Z.; Datta, R. Connecting bio-priming approach with integrated nutrient management for improved nutrient use efficiency in crop species. Agriculture 2021, 11, 372. [Google Scholar] [CrossRef]
  10. Sarkar, D.; Chattopadhyay, A.; Singh, S.; Devika, O.S.; Pal, S.; Parihar, M.; Pal, S.; Singh, H.B.; Rakshit, A. Modulation of microbiome through seed bio-priming. In Trichoderma: Agricultural Applications and Beyond; Manoharachary, C., Singh, H.B., Varma, A., Eds.; Soil Biology; Springer: Cham, Switzerland, 2020; Volume 61, pp. 209–218. [Google Scholar]
  11. Wang, W.J.; Chalk, P.M.; Chen, D.; Smith, C.J. Nitrogen mineralization, immobilization and loss, and their role in determining differences in net nitrogen production during waterlogged and aerobic incubation of soils. Soil Biol. Biochem. 2001, 33, 1305–1315. [Google Scholar] [CrossRef]
  12. Rakesh, S.; Sinha, A.K.; Mukhopadhyay, P. Vertical distribution of TOC, TN and other important soil attributes and their relationship in Alfisol and Entisol of West Bengal. Int. J. Environ. Clim. Change 2020, 10, 62–73. [Google Scholar] [CrossRef] [Green Version]
  13. Giacomini, S.J.; Recous, S.; Mary, B.; Aita, C. Simulating the effects of N availability, straw particle size and location in soil on C and N mineralization. Plant Soil 2007, 301, 289–301. [Google Scholar] [CrossRef]
  14. Nicolardot, B.; Bouziri, L.; Bastian, F.; Ranjard, L. A microcosm experiment to evaluate the influence of location and quality of plant residues on residue decomposition and genetic structure of soil microbial communities. Soil Biol. Biochem. 2007, 39, 1631–1644. [Google Scholar] [CrossRef]
  15. Rahman, S.M.; Haque, M.E.; Ahmed, S.; Khalil, M.I.; Wahab Mia, A. Organic matter management for increased and sustainable agricultural production in Bangladesh. In Proceedings of the Final RCM of the Joint FAO/IAEA on Coordinated Research Project, Kuala Lumpur, Malaysia, 26–30 March 2001; p. 27. [Google Scholar]
  16. Mohammed, A.M.; Naab, J.B.; Nartey, E.; Adiku, S.G.K. Carbon mineralization from plant residue-amended soils under varying moisture conditions. J. Exp. Biol. Agric. Sci. 2014, 1, 491–498. [Google Scholar]
  17. Mengel, K. Turnover of organic nitrogen in soils and its availability to crops. Plant Soil 1996, 181, 83–93. [Google Scholar] [CrossRef]
  18. Llorente, M.; Turrion, M.B. Microbiological parameters as indicators of soil organic carbon dynamics in relation to different land use management. Eur. J. For. Res. 2010, 129, 73–81. [Google Scholar] [CrossRef]
  19. Riffaldi, R.; Saviozzi, A.; Levi-Minzi, R. Carbon mineralization kinetics as influenced by soil properties. Biol. Fert. Soils. 1996, 22, 293–298. [Google Scholar] [CrossRef]
  20. Yu, S.; Chen, Y.; Zhao, J.; Fu, S.; Li, Z.; Xia, H.; Zhou, L. Temperature sensitivity of total soil respiration and its heterotrophic and autotrophic components in six vegetation types of subtropical China. Sci. Total Environ. 2017, 607, 160–167. [Google Scholar] [CrossRef] [PubMed]
  21. Staben, M.L.; Bezdicek, D.F.; Smith, J.L.; Fauci, M.F. Assessment of soil quality in conversation reserve program and wheat–fallow soils. Soil Sci. Soc. Am. J. 1997, 61, 124–130. [Google Scholar] [CrossRef]
  22. Ahn, M.Y.; Zimmerman, A.R.; Comerford, N.B.; Sickman, J.O.; Grunwald, S. Carbon Mineralization and Labile Organic Carbon Pools in the Sandy Soils of a North Florida Watershed. Ecosystems 2009, 12, 672–685. [Google Scholar] [CrossRef]
  23. Cenkseven, S.; Kizildag, N.; Kocak, B.; Sagliker, H.A.; Darici, C. Soil Organic Matter Mineralization under Different Temperatures and Moisture Conditions in Kızıldağ Plateau, Turkey. Sains Malays. 2017, 46, 763–771. [Google Scholar] [CrossRef]
  24. Jackson, M.L. Soil Chemical Analysis; Prentice Hall of India. Pvt. Ltd.: New Delhi, India, 1967. [Google Scholar]
  25. Anonymous. Official Methods of the Association of Official Analytical Chemists, 12th ed.; Horwitz, W., Ed.; AOAC International: Washington, DC, USA, 1975; pp. 15–18. [Google Scholar]
  26. Baker, K.F. The determination of organic carbon in soil using a probe-colorimeter. Lab. Practice. 1976, 25, 82–83. [Google Scholar]
  27. Dewis, J.; Freitas, F. Physical and Chemical Methods of Soil and Water Analysis; FAO United Nations: Rome, Italy, 1984; p. 10. [Google Scholar]
  28. Rey, A.; Petsikos, C.; Jarvis, P.G.; Grace, J. Effect of temperature and moisture on rates of carbon mineralization in a Mediterranean oak forest soil under controlled and field conditions. Eur. J. Soil Sci. 2005, 56, 589–599. [Google Scholar] [CrossRef]
  29. Datta, A.; Jat, H.S.; Yadav, A.K.; Choudhary, M.; Sharma, P.C.; Rai, M.; Singh, L.K.; Majumder, S.P.; Choudhary, V.; Jat, M.L. Carbon mineralization in soil as influenced by crop residue type and placement in an Alfisols of Northwest India. Carbon Manag. 2019, 10, 37–50. [Google Scholar] [CrossRef] [PubMed]
  30. Alef, K. Soil Respiration. Methods in Soil Microbiology and Biochemistry; Alef, K., Nannipieri, P., Eds.; Academic Press Inc.: San Diego, CA, USA, 1995; pp. 214–215. [Google Scholar]
  31. Curtin, D.; Selles, F.; Wang, H.; Campbell, C.A.; Biederbeck, V.O. Carbon dioxide emissions and transformation of soil carbon and nitrogen during wheat straw decomposition. Soil Sci. Soc. Am. J. 1998, 62, 1035–1041. [Google Scholar] [CrossRef]
  32. Jin, K.; Steven, S.; Stefaan, D.N.; Donald, G.; Dianxiong, C.; Jiyun, J.; Georges, H. Nitrogen and carbon mineralization of surface-applied and incorporated winter wheat and peanut residues. Biol. Fert. Soils. 2008, 44, 661–665. [Google Scholar] [CrossRef]
  33. de Gerenyu, V.O.L.; Kurganova, I.N.; Kuzyakov, Y. Carbon pool and sequestration in former arable Chernozems depending on restoration period. Ekologija 2008, 54, 232–238. [Google Scholar] [CrossRef]
  34. Lal, J.K.; Mishra, B.; Sarkar, A.K. Effect of plant residues incorporation on specific microbial groups and availability of some plant nutrient in soil. J. Indian Soc. Soil Sci. 2000, 48, 67–71. [Google Scholar]
  35. Pare, T.; Dinel, H.; Schnitzer, M.; Dumontel, S. Transformation of carbon and nitrogen during composting of animal manure and shredded paper. Biol. Fert. Soils. 1997, 26, 173–178. [Google Scholar] [CrossRef]
  36. Coppens, F.; Garnier, P.; De Gryze, S.; Merckx, R.; Recous, S. Soil moisture, carbon and nitrogen dynamics following incorporation and surface application of labelled crop residues in soil columns. Eur. J. Soil Sci. 2006, 57, 894–905. [Google Scholar] [CrossRef]
  37. Li, J.L.; Han, X.Z.; You, M.Y.; Yuan, Y.R.; Ding, X.L.; Qiao, Y.F. Carbon and nitrogen mineralization patterns of two contrasting crop residues in a Mollisol: Effects of residue type and placement in soils. Eur. J. Soil Biol. 2013, 54, 1–6. [Google Scholar] [CrossRef]
  38. Raiesi, F. Carbon and N mineralization as affected by soil cultivation and crop residue in a calcareous wetland ecosystem in Central Iran. Agric. Ecosys. Environ. 2006, 112, 13–20. [Google Scholar] [CrossRef]
  39. Li, L.J.; Zeng, D.H.; Yu, Z.Y.; Fan, Z.P.; Yang, D.; Liu, Y.X. Impact of litter quality and soil nutrient availability on leaf decomposition rate in a semi-arid grassland of Northeast China. J. Arid Environ. 2011, 75, 787–792. [Google Scholar] [CrossRef]
  40. Dinesh, R.; Chaudhuri, S.; Ganeshamurthy, A.; Pramanik, S. Biochemical properties of soils of undisturbed and disturbed mangrove forests of South Andaman (India). Wetl. Ecol. Manag. 2004, 12, 309–320. [Google Scholar] [CrossRef]
  41. Vestgarden, L.S. Carbon and nitrogen turnover in the early stage of Scots pine (Pinus sylvestris L.) needle litter decomposition: Effect of internal and external nitrogen. Soil Biol. Biochem. 2001, 33, 465–474. [Google Scholar] [CrossRef]
  42. Zheng, B.; Marschner, P. Previous residue addition rate and C/N ratio influence nutrient availability and respiration rate after the second residue addition. Geoderma 2017, 285, 217–224. [Google Scholar] [CrossRef]
  43. Aulakh, M.S.; Khera, T.S.; Doran, J.W. Mineralization and denitrification in upland, nearly saturated and flooded subtropical soil II. Effect of organic manures varying in N content and C: N ratio. Biol. Fert. Soils. 2000, 31, 168–174. [Google Scholar] [CrossRef]
  44. Thonnissen, C.; Midmore, D.J.; Ladha, J.K.; Olk, D.C.; Schmidhalter, U. Legume decomposition and nitrogen release when applied as green manures to tropical vegetable production systems. Agron. J. 2000, 92, 253–260. [Google Scholar] [CrossRef]
  45. Gartner, T.B.; Cardon, Z. Decomposition dynamics in mixed-species leaf litter. Oikos 2004, 104, 230–246. [Google Scholar] [CrossRef]
  46. Stemmer, M.; Gerzabek, M.; Kandeler, E. Invertase and xylanase activity of bulk soil and particle-size fractions during maize straw decomposition. Soil Biol. Biochem. 1999, 31, 9–18. [Google Scholar] [CrossRef]
  47. Smith, P.; Smith, J.; Flynn, H.; Killham, K. ECOSSE: Estimating Carbon in Organic Soils-Sequestration and Emissions; Scottish Executive: Edinburgh, Scotland, 2007.
  48. Coppens, F. Water, Carbon and Nitrogen Dynamics in Soil: Influence of Crop Residue Location and Quality. Ph.D. Thesis, Leuven University, Leuven, Belgium, 2005; pp. 11–22. [Google Scholar]
  49. Mande, K.H.; Abdullah, A.M.; Zaharin, A.A.; Ainuddin, A.N. Drivers of soil carbon dioxide efflux in a 70 years mixed trees species of tropical lowland forest, Peninsular Malaysia. Sains Malays. 2014, 43, 1843–1853. [Google Scholar] [CrossRef]
  50. Salvator, K.; Basil, T.; Ongor, I.; Chantal, K.; Menus, N.; Elie, K. carbon mineralization kinetics from legume residues applied to a high altitude acidic soil. Int. J. Adv. Sci. Res. Eng. 2019, 5, 4. [Google Scholar] [CrossRef]
  51. Zafar-ul-Hye, M.; Naeem, M.; Danish, S.; Khan, M.J.; Fahad, S.; Datta, R.; Brtnicky, M.; Kintl, A.; Hussain, G.S.; El-Esawi, M.A. Effect of Cadmium-Tolerant Rhizobacteria on Growth Attributes and Chlorophyll Contents of Bitter Gourd under Cadmium Toxicity. Plants 2020, 9, 1386. [Google Scholar] [CrossRef]
  52. Zafar-ul-Hye, M.; Tahzeeb-ul-Hassan, M.; Abid, M.; Fahad, S.; Brtnicky, M.; Dokulilova, T.; Datta, R.; Danish, S. Potential role of compost mixed biochar with rhizobacteria in mitigating lead toxicity in spinach. Sci. Rep. 2020, 10, 1–12. [Google Scholar] [CrossRef]
  53. Zafar-ul-Hye, M.; Naeem, M.; Danish, S.; Fahad, S.; Datta, R.; Abbas, M.; Rahi, A.A.; Brtnicky, M.; Holátko, J.; Tarar, Z.H.; et al. Alleviation of Cadmium Adverse Effects by Improving Nutrients Uptake in Bitter Gourd through Cadmium Tolerant Rhizobacteria. Environments 2020, 7, 54. [Google Scholar] [CrossRef]
  54. Danish, S.; Zafar-ul-Hye, M.; Fahad, S.; Saud, S.; Brtnicky, M.; Hammerschmiedt, T.; Datta, R. Drought Stress Alleviation by ACC Deaminase Producing Achromobacter xylosoxidans and Enterobacter cloacae, with and without Timber Waste Biochar in Maize. sustainability 2020, 12, 6286. [Google Scholar] [CrossRef]
  55. Pathan, S.I.; Větrovský, T.; Giagnoni, L.; Datta, R.; Baldrian, P.; Nannipieri, P.; Renella, G. Microbial expression profiles in the rhizosphere of two maize lines differing in N use efficiency. Plant Soil 2018, 433, 401–413. [Google Scholar] [CrossRef]
  56. Qi, G.; Wang, Q.; Zhou, W.; Ding, H.; Wang, X.; Qi1, L.; Wang, Y.; Li, S.; Dai, L. Moisture effect on carbon and nitrogen mineralization in topsoil of Changbai Mountain, Northeast China. J. For. Sci. 2011, 57, 340–348. [Google Scholar] [CrossRef] [Green Version]
  57. Kumar, K.; Goh, K.M. Nitrogen release from crop residues and organic amendments as affected by biochemical composition. Commun. Soil Sci. Plant Anal. 2003, 34, 2441–2460. [Google Scholar] [CrossRef]
  58. Abiven, S.; Recous, S. Mineralisation of crop residues on the soil surface or incorporated in the soil under controlled conditions. Biol. Fert. Soils. 2007, 43, 849–852. [Google Scholar] [CrossRef] [Green Version]
  59. Fruit, L.; Recous, S.; Richard, G. Plant residue decomposition: Effect of soil porosity and particle size. In Effect of Mineral-Organic-Microorganisms Interactions on Soil and Freshwater Environments; Berthelin, J., Huang, J.M., Bollag, J.-M., Andreux, F., Eds.; Lewis: New York, NY, USA, 1999; pp. 189–196. [Google Scholar]
  60. Danso Marfo, T.; Datta, R.; Vranová, V.; Ekielski, A. Ecotone Dynamics and Stability from Soil Perspective: Forest-Agriculture Land Transition. Agriculture 2019, 9, 228. [Google Scholar] [CrossRef] [Green Version]
  61. Marfo, T.D.; Datta, R.; Pathan, S.I.; Vranová, V. Ecotone Dynamics and Stability from Soil Scientific Point of View. Diversity 2019, 11, 53. [Google Scholar] [CrossRef] [Green Version]
  62. Izhar Shafi, M.; Adnan, M.; Fahad, S.; Wahid, F.; Khan, A.; Yue, Z.; Danish, S.; Zafar-ul-Hye, M.; Brtnicky, M.; Datta, R. Application of Single Superphosphate with Humic Acid Improves the Growth, Yield and Phosphorus Uptake of Wheat (Triticum aestivum L.) in Calcareous Soil. Agronomy 2020, 10, 1224. [Google Scholar] [CrossRef]
  63. Angers, D.A.; Recous, S. Decomposition of wheat straw and rye residues as affected by particle size. Plant Soil 1997, 189, 197–203. [Google Scholar] [CrossRef]
Figure 1. Mean air temperature and mean relative humidity during the period of incubation.
Sustainability 13 07212 g001
Figure 2. CO2-C fluxes (µg C/g/day) at various sampling dates in soils amended with different residues under two methods of placement over control soil throughout the period of incubation. Note: Mean (±LSD); n = 3, S1 & S2 = soils of Coochbehar; S3 & S4 = soils of Malda.
Sustainability 13 07212 g002aSustainability 13 07212 g002b
Figure 3. Main effect of residue, application method and soil types on CO2-C fluxes (µg C/g soil/day) at various sampling intervals over the period of incubation. Note: Soil 1 & Soil 2 = soils of Coochbehar; Soil 3 & Soil 4 = soils of Malda.
Sustainability 13 07212 g003aSustainability 13 07212 g003b
Figure 4. Cumulative C mineralized (µg C/g soil) in experimental soils amended with different residues over control soil throughout the period of incubation. Note: Mean (±LSD); n = 3, S1 & S2 = soils of Coochbehar; S3 & S4 = soils of Malda.
Sustainability 13 07212 g004aSustainability 13 07212 g004b
Figure 5. Main effect of residue, application method and soil types on cumulative total C mineralized (µg C/g soil) at various sampling intervals over the period of incubation.
Sustainability 13 07212 g005
Figure 6. Percentage C released from the residue amended and control soil after 126 days of incubation period. Alphabets over the column indicate significant differences at p ≤ 0.05 among the treatments according to DMRT.
Sustainability 13 07212 g006
Figure 7. Relation between C mineralized and % C lost from the added residue.
Sustainability 13 07212 g007
Table 1. Characteristics of experimental soils and crop residues.
Soil
SitepHTOCTNC:N ratioTexture (%)
g/kgClaySiltSand
S16.612.10.9812.35:1115138
S27.110.51.357.78:1106624
S36.814.81.629.14:1315910
S48.2516.91.819.34:1206614
Residue
SiteTotal C (%)Total N (%)C:N Ratio
RiceMaizeRiceMaizeRiceMaize
S138.441.60.560.3868.7109.6
S240.140.40.550.417398.7
S340.542.10.580.4669.991.6
S438.940.30.620.4562.889.7
S1-Durganagar & S2-Ghugumari Entisols; S3-Kalinagar & S4-Manikchak Inceptisols.
Table 2. MSE and R2 values for best fit model in cases of crop residues studied under two methods of placement.
SoilResidueIncorporatedSurface Applied
MSER2Best Fit ModelMSER2Best Fit Model
Soil-1Rice40.410.794Exponential68.470.673Exponential
Maize79.60.69347.60.772
Soil-2Rice25.30.90212.650.817
Maize33.480.8598.470.943
Soil-3Rice53.920.73144.730.764
Maize57.530.77628.620.819
Soil-4Rice32.940.76625.740.767
Maize39.110.72343.860.706
MSE: Mean square error.
Table 3. Mineralization potential and rate constant values of rice and maize residues under two methods of placement in four soil types.
TreatmentIncorporatedSurface Applied
SoilResidueMineralization Potential (C0, %)Rate Constant (k, %/day)Rate of Potential Mineralizable Residue C (C0k, %/day)% C Lost @ 126 Days*
% C Lost @ 156 Days
Mineralization Potential (C0, %)Rate Constant (k, %/day)Rate of Potential Mineralizable Residue C (C0k, %/day)% C Lost @ 126 Days*
% C Lost @ 156 Days
1Rice22.080.0080.17754.1076.9126.250.0070.18454.1978.23
Maize25.860.0070.18158.1077.0619.520.0080.15650.4967.99
2Rice20.290.0090.18362.0282.6115.760.0070.11036.3646.96
Maize16.660.0100.16755.7979.2811.830.0100.11846.0856.29
3Rice22.20.0080.17852.5677.3321.030.0080.16851.9973.25
Maize20.530.0090.18557.0283.5816.270.0090.14646.5366.24
4Rice23.290.0070.16349.9069.4120.90.0070.14644.9062.28
Maize23.260.0070.16348.0969.3223.270.0070.16350.0569.35
Note: * indicates Extrapolation of data relating to % C lost from the treatments i.e., incorporated and surface applied at 156 days using 1st order kinetic model: C = Co(1 − e−kt). Mean (n = 3).
Publisher’s Note: MDPI stays neutral with regard to jurisdictional claims in published maps and institutional affiliations.

