
Sustainable Humanitarian Operations: Multi-Method Simulation for Large-Scale Evacuation


1
Industrial Engineering Program, Department of Mechanical and Industrial Engineering, Universitas Gadjah Mada (UGM), Yogyakarta 55281, Indonesia
2
Engineering Systems and Design, Singapore University of Technology and Design (SUTD), Singapore 487372, Singapore
*
Author to whom correspondence should be addressed.
Sustainability 2021, 13(13), 7488; https://0-doi-org.brum.beds.ac.uk/10.3390/su13137488
Submission received: 27 May 2021
/
Revised: 27 June 2021
/
Accepted: 28 June 2021
/
Published: 5 July 2021
(This article belongs to the Special Issue Sustainable City Logistics and Humanitarian Logistics)
Abstract
:Integrating sustainability in humanitarian operations has been seen as a promising approach toward effective and long-term solutions. During disaster emergency management, the evacuation determines the risk of loss in a disaster. To better understand the effectiveness of the evacuation plan while considering the sustainability standpoint, this paper develops a multi-method simulation (MMS) approach to evaluate evacuation time, load balance of the shelters, and CO2 emission. The MMS integrating Agent-Based Modeling (ABM) and Discrete-Event Simulation (DES) incorporates evacuation decision-making and evacuation processes. Comparative analysis shows that the MMS outperforms the use of ABM solely. The simulation results indicate over-utilization and imbalanced load among the shelters, implying a need to expand shelters’ capacity and to revisit the evacuation plan concerning the location of the assembly points and the shelters and the resource allocation. Evacuation behavior heading to the nearest assembly point instead of the designated assembly point based on the evacuation plan worsens the imbalanced load among the shelters and results in higher CO2 emissions by 8%. The results demonstrate the necessity to include evacuation decision-making (social dimension) on top of the technical dimension and to adopt sustainable performance indicators in planning the evacuation sustainably. Avenues for future research are also discussed.
1. Introduction
Sustainability is a concept that has been used widely in various disciplines and contexts. The sustainability of humanitarian operations has been fragmented and received less attention [1]. Because the sustainable perspective has been useful to develop effective and sustainable solutions, humanitarian operations should pursue direct sustainable objectives [2]. Van Wassenhove [3] has defined sustainable humanitarian operations as “humanitarian operations that reduce the vulnerability of certain populations by fulfilling their immediate needs and supporting them in building resilience and creating long-term prosperity prospects with minimum possible economic and environmental resources.”Accordingly, the sustainable humanitarian logistics and supply chain aims at maintaining a balance between lifesaving, social, environmental, and economic goals [4]. The sustainable humanitarian operations have therefore shifted the focus from providing direct aid to capacity building, engaging the technical solutions into the socio-technical context of humanitarian problems, and eventually facilitating effective and long-term solutions.
Research addressing the sustainability in humanitarian operations is however still lacking but progressing. Some researchers have contributed to the conceptualization of integrating sustainability in humanitarian operations such as van Wassenhove [3] and Klumpp [5]. Furthermore, some researchers have developed a framework to identify sustainable supply chain strategies such as Chen et al. [6]. Sustainability in humanitarian operations can be implemented in numerous practices such as reducing material consumption/packaging, repurposing waste materials of relief items, reducing energy consumption by shortening travel distance, modifying transportation mode, reducing non-value adding processes and activities, reusing second-hand materials, recycling of excess supply, and recovering of waste. Current literature on the sustainable humanitarian supply chain has explored various humanitarian operations, such as Sopha and Ma’mun [7] who investigated alternative electricity supply in replacing traditional ineffective solution of diesel power generation with an aluminum debris power generator, Hasselbalch et al. [8] who investigated sustainable procurement, Liperda et al. [9] who studied drone operations to distribute aid supplies, and Regattieri et al [10] who dealt with waste management during disaster response. It seems that studies focusing on sustainable evacuation operations are still lacking. Given that evacuation has played a critical role in reducing the risk of loss and contributed to major transportation challenges in humanitarian operations, effective and sustainable evacuation planning is therefore necessary.
This paper aims at developing an evacuation simulation model that enables the Regional Disaster Management Agency (BPBD—Badan Penanggulangan Bencana Daerah), as a decision-maker, to evaluate the existing evacuation plan while considering sustainability challenges. Three sustainability performance indicators according to Salvado [11], i.e., evacuation time, load balance of the shelters, and CO2 emission, were evaluated. The evacuation time represents effectiveness to meet the demand, the load balance of the shelters corresponds to fairness/equity, and CO2 emission indicates environmental performance. The 2010 eruption of Mount Merapi, an active volcano located near the center of the Java Island, Indonesia, was used as a case study.
According to the best of the authors’ knowledge, the present study is a pioneer in addressing sustainability issues in evacuation planning. Because the evacuation involves both social (e.g., large people with various decision-making who interact with each other) and technical dimensions (e.g., road network, vehicles), the present study developed multi-method simulation (MMS) to incorporate both evacuation decision-making and evacuation processes, and further conducted a comparative analysis between the proposed MMS and the most widely approach of agent-based modeling (ABM). Eventually, the MMS is used as an experimentation tool to develop scenarios for sustainable evacuation.
The paper’s main contributions are as follows: First, the paper introduces the application of sustainability in the humanitarian evacuation by adopting sustainability performance indicators. Second, the paper demonstrates a novel MMS combining ABM and discrete-event simulation (DES) in one platform and compares its performance against a simulation method using ABM alone. Third, the paper proposes an approach for assessing multi-modal evacuations, combining pedestrian and vehicular transportation modes, often overlooked in the literature. Most evacuation studies have dealt with vehicular evacuation or are limited to pedestrian evacuation for indoor evacuation or small-scale outdoor evacuation [12]. The paper involves multi-modal evacuation considering both pedestrian and vehicular evacuation for regional-scale natural disasters. Finally, the paper offers empirical contribution in terms of evaluating the performance of the evacuation plan by BPBD for the case of a volcano eruption in the densely populated island of Java in Indonesia.
In the following sections of the paper, the evacuation modeling approaches are briefly reviewed in Section 2. The fundamentals of the MMS, the advantages and disadvantages of ABM and DES, and how the two can be integrated, are presented in Section 3. The proposed MMS approach to model evacuation is described in Section 4, followed by Section 5, which reports the simulation results of comparative analysis and scenario developments. Finally, Section 6 discusses the conclusions drawn from the results, limitation, and avenues for future research.
2. Evacuation Modeling
Evacuation, the process involving a mass and temporary physical movement of people from a danger zone to a safe zone, is a critical operation influencing the effectiveness of humanitarian logistics [13]. As the impact of a sudden emergency such as a disaster will be greater if the emergency becomes more widely felt, it is crucial to evacuate people from the danger zone as soon as possible after an emergency occurs [14]. Therefore, an effective evacuation process is essential to reduce the risk of loss due to a disaster for both life and property. Unfortunately, the evacuation process is highly complex. The evacuation includes the context of the community (infrastructure, population, uncertainty of disaster) and the various sequences of behavior [15], which interact and result in evacuation dynamics that need to be understood and managed to save lives. A good evacuation model is imperative, and more research on modeling the realistic evacuation operation and management is needed to construct or improve the effectiveness and efficiency of evacuation plans.
Engineering and social sciences have made significant contributions to evacuation modeling, each discipline bringing its own strength. Engineers develop analytical models and optimization/simulation models, which can be used as operational planning tools to solve evacuation problems to meet specific goals, e.g., evacuation time. The social sciences’ strength lies in identifying psychological and social factors and connecting these factors to evacuation behavior based on empirical and theoretical insights. Many studies such as [16,17,18] have highlighted the necessity to address different perspectives such as psychological, physical, and social factors in evacuation modeling to formulate appropriate evacuation strategies. Because one simulation method cannot cover all factors influencing evacuation, the paper develops MMS combining ABM facilitating evacuation decision making and DES facilitating evacuation processes.
Numerous evacuation models and techniques ranging from analytical approaches, optimization, and simulation have been deployed to determine efficient evacuation plans. The analytical approaches using graph model, network model, queueing theory, and game theory have been used during early development to analyze emergency evacuation. For instance, Borrmann et al. [19] used a network model for pedestrian evacuation. Smith [20] used a queueing network model to estimate evacuation networks and their associated evacuation time, whereas Lo et al. [21] deployed game theory to model the dynamic exit selection process. However, these analytical models lack the details of individual representation. With the improvement of computational capability, optimization models have been developed numerically to solve large-scale evacuation routes and respective evacuation times [22], whereas simulation models have widely been used as decision support tools to evaluate the performance of evacuation strategies in realistic environments [23]. However, many developed evacuation models do not recognize human behavior.
Simulation approaches have typically been deployed to analyze and evaluate evacuation plans, as the simulation approach is intuitive for representing the evacuation process. Three simulation methods, namely System Dynamics (SD), DES, and ABM, have been used to simulate the evacuation. Because each of those methods have a different approach, so are the objects to be modeled. The selection of simulation methods usually depends on the study’s goal, level of abstraction, critical variables to be modeled, and researchers’ familiarity using the method [24,25]. The present study selected ABM and DES instead of SD due to some reasons. As the goal of the present study is to capture both evacuation decision-making and evacuation processes, ABM is used to model evacuees’ decision-making and their interactions, whereas DES is applied to model the evacuation processes that involve vehicles and volunteers as the required resources in the processes. Moreover, both ABM and DES facilitate spatial modeling. On the other hand, SD, which is seldom used for modeling evacuation, focuses on the system level, thus unable to model the heterogeneity of the evacuees, decision-making at the individual level, and the evacuation processes at the operational level.
To capture interactions among elements at different abstraction levels, a combined approach of two or more simulation methods appears to be promising as it provides broader flexibility to represent complex problems. The initiative to link the different modeling approach into one single model, so-called multi-method modeling, has been proposed earlier [26]. The implementation of the MMS is, however, still limited. Thus, the developed MMS captures both the technical dimension (i.e., evacuation processes) and social (i.e., people who make decisions and interact with one other) dimension and their interactions. According to the authors’ best knowledge, evacuation studies using MMS, particularly for sudden-onset disasters, such as volcano eruptions, are still rare.
3. Multi-Method Simulation (MMS)
Research on evacuation has been studied within disciplinary boundaries such as transportation engineering and social sciences. Existing studies separately discuss evacuation behavior, evacuation of natural disasters, evacuation of traffic, and evacuation of buildings. As evacuation is a complex process, an interdisciplinary approach to modeling is required to understand how to manage it [17]. However, the integration of different disciplines towards modeling remains a challenge. Simulation, usually deployed to mimic the existing system, has typically been developed using only one method. Borshchev [26] acknowledges that one simulation modeling method is unable to represent all components of evacuation. An integrated approach such as MMS seems necessary to represent the complexity of the process better.
3.1. Agent-Based Modeling (ABM)
ABM, also known as individual-based modeling or multi-agent modeling, has gained increasing attention due to its ability to understand a wide range of problems by capturing heterogeneous, autonomous agents when it comes to decision-making. ABM also captures interactions among agents and agent-environment interactions at a micro-level, influencing system behavior on a macro-level [27]. ABM has been widely used in different applications ranging from archeology, politics, social networks, infectious disease, economic processes, strategic simulation, diffusion of innovation, traffic jams, and evacuation.
When it comes to evacuation, ABM addresses heterogeneity of the evacuees when it comes to the initial location of evacuees, perceived hazard level, walking speed, and state (referring to condition/mode of being of the evacuee). ABM formally recognizes individuals’ decision-making and facilitates the interaction among the evacuees and between the evacuees and infrastructure such as road networks [18]. Several studies have applied ABM to model evacuation. For instance, Takabatake et al. [28] modeled route choice and moving speed of evacuees using agent-based modeling for tsunami evacuation in Japan. Mas et al. [29] developed a multi-agent-based simulation involving geospatial data, evacuation start time, and destination and shortest route choice to estimate casualty of the 2011 great east Japan earthquake/tsunami evacuation. Chen et al. [30] deployed agent-based modeling to simulate evacuation for a hurricane in Florida, which aimed at achieving the minimum time needed to evacuate all affected residents by considering route and destination choice. Agent-based modeling and simulation were also used to evaluate the effectiveness of simultaneous and staged evacuation strategies as explored by Chen and Zhan [31].
3.2. Discrete-Event Simulation (DES)
DES has been initially developed to model business processes. Differing from ABM, which focuses on the concept of an agent, DES focuses on processes. The abstraction level of DES is operational so that DES represents a system as sequential processes that occur in a physical system [32]. Each object in the system is represented by an entity or a resource. However, the entity in DES is different from the entity in ABM, which is active and autonomous. The entity in DES is passive and has no behavior on its own.
When it comes to evacuation modeling, DES deals with the operational aspect of the evacuation. The evacuation is modeled as processes, i.e., the sequence of operations being performed across entities. Evacuees are defined as entities, whereas vehicles or volunteers who help evacuees are the available resources. The processes may require services provided by the resources (e.g., the evacuation process requires the vehicles and the volunteers to assist the evacuee) and may involve delays when the resources are not available at a given time to allow the process. When the entities compete for resources that are limited, queues are present. Although not as widely used as ABM, DES has been applied to model crowd simulation to assess the configuration of exit locations on the egress time of the occupants in a hall by Nassar and Bayyoumi [33]. Furthermore, DES was also used to model evacuation in an aircraft [34]. Table 1 compares ABM and DES [35,36].
3.3. Combining Agent-Based Modeling and Discrete-Event Simulation
An MMS responds to current challenges in managing, designing, and evaluating a complex system. Since evacuation involves psychological, physical, and social aspects, evacuation modeling must sufficiently represent these factors to represent the system better and develop effective evacuation plans. ABM can incorporate psychological and social aspects through evacuation decision-making, whereas DES models detail the movement process and its required resources within a given physical system (e.g., road network, shelters, evacuation route). Given that the entities in DES are passive, while ABM includes autonomous agents/entities, these two simulation methods can be combined to capture the advantage of both methods.
The advantages of ABM include its ability to describe heterogeneous behavior and to be able to capture phenomena that appear dynamically with time through a bottom-up approach. ABM is a method with a time-step-based approach, which means that the agent will move, make decisions, and interact with other agents at each time interval. The time-step should be short enough to capture all potential interactions without missing any events, but not so short that there is no difference between steps and unnecessary updates. Therefore, determining the right time-step is complex and requires high computational time and costs [37]. On the other hand, DES uses an event scheduling-based approach, in which the state of the system is updated when needed, based on the event schedule. Nothing changes between events, so unnecessary state updates can be avoided to reduce computation time. However, DES lacks flexibility in modeling the behavior and decision-making processes of individual agents/entities. Therefore, by combining the ABM and DES methods, one can capture agents’ behavior and resultant system performance with efficient computational effort.
Furthermore, modeling the evacuation process in DES provides insights on evacuee movement as well as services. The evacuees, who are heterogeneous when it comes to a residential location, physical capability, and evacuation decision-making, act as entities in the evacuation process that involves movement or transport from their original locations to the assembly points. Then, they use resources to move from the assembly points to the shelters. By accounting for many people moving at the same time within limited road space and available resources, the system behavior will emerge at the macro level.
Therefore, this study proposes an MMS for evacuation by combining ABM and DES in one platform. The ABM method was chosen because it is a bottom-up method that can describe the behavior of agents or heterogeneous individuals in decision making, which results in system behavior (emergent properties) at the macro-level. At the same time, the DES can model the evacuation process as triggered by individual decision-making. It is expected that by combining these methods, better results and more efficient computation can be achieved. It has been alleged that when two or more abstraction levels can be distinguished in the system to be modeled, the MMS might yield a better result than one modeling method alone [38].
In addition, as evacuation modeling requires spatial modeling [39,40], the present study deploys an MMS software tool, which includes Geographical Information Data (GIS) data, i.e., AnyLogic [41], to capture the spatial aspect of the simulation such as the initial location of the affected population, the location of the assembly points and the shelters, and the road network.
The combined approach of ABM and DES for evacuation has previously been deployed by Zhang et al. [37] and Na and Banerjee [42]. The difference between the present study and the studies lies in the model architecture. The present study used ABM as a base model, which was extended by embedding the movement during evacuation using DES. DES was developed inside ABM, whereas Zhang et al. [37] integrated event scheduling into ABM and Na and Banerjee [42] assigned decision logic on the entities in DES. Unlike the earlier studies, which used DES as a base model, the architecture used in this study used ABM as a base model, thus providing more flexibility and capability to model human behavior and decision-making.
4. Multi-Method Simulation for Volcano Eruption
The MMS referring to the deployment of two or more modeling methods within one model, has many possible model architectures, depending on the system’s goal and characteristics/nature to be modeled. This section is divided into five sub-sections: the brief description of the official evacuation plan by BPBD for volcano eruption, the evacuation decision model using ABM, the evacuation process model using DES, the MMS combining ABM and DES, and scenario development. The developed MMS aims to support evacuation planning decision-making and improve contingency disaster policymaking in the region.
4.1. Evacuation Plan of Mount Merapi Volcano Eruption
The eruption of Mount Merapi has recurred regularly, on average, every four to six years. However, the volcano eruption in 2010 caused 341 casualties due to the high uncertainty of lava movement and poor evacuation planning [43]. Since then, the Sleman Regional Disaster Management Agency (BPBD), as the coordinator of the Mount Merapi disaster response, has carefully redesigned the evacuation emergency plan to evacuate populations successfully and rapidly. The evacuation plan has played an essential role in saving lives, given that the terrains of Mount Merapi slopes are steep with narrow roads, causing over-crowdedness and thus a long evacuation time. The emergency evacuation plan involves shelters, including the number, locations, population allocation to the shelters, evacuation routes, and ready-to-use vehicles. The plan has also developed two types of eruption scenarios, namely effusive and explosive. In an effusive eruption, 23 hamlets have to be evacuated to 8 main shelters within a radius of more than 10 km, while in an explosive eruption, residents of more than 188 hamlets have to evacuate to a radius of more than 17 km, which leads to the increase in the number of evacuees from 11,259 to 95,041 people. Figure 1 presents the affected areas for both effusive and explosive scenarios based on the evacuation plan [44].
The plan has specified that every resident who lives in a particular area must be directed to the specified assembly point and onward to a designated shelter once the evacuation occurs. Table 2 presents the assembly plan and the shelters for the effusive scenario [44], which are spatially shown in Figure 2. The coordinates of the assembly points and the shelters are provided in the Appendix A.
The evacuees are expected to walk from their homes to their respective assembly points. At the assembly points, volunteers escort the evacuees to their respective shelters using vehicles that have been allocated at each assembly point. As long as there is no explosive eruption, the evacuees will stay in the evacuation shelters. If there is an explosive eruption, the evacuees located at the shelters within a 10-km radius will be moved to a safer shelter outside a radius of 17 km.
Based on the evacuation plan, the multi-method simulation is developed to mimic the evacuation decision-making and evacuation process, detailed in the following sub-sections. The objective of the simulation is to evaluate the performance of the evacuation plan when it is to be implemented in the system for effusive scenarios, which occur, on average, every four years.
4.2. Evacuation Decision-Making Model
Several studies have explored various factors explaining the evacuation. Sopha et al. [18] supported by Parvin et al. [45] and Mostafizi et al. [46], have demonstrated that the heterogeneous evacuation decision-making of the population has a significant influence on the effectiveness of the evacuation. Exposure to hazards, perceptions of danger, and perceptions of evacuation readiness are the influencing factors [47]. Other social factors such as belief, social engagement with cultural leaders, and a strong sense of belonging toward their valuables and livestock are also influential in evacuation [48]. Existing literature on evacuation modeling, e.g., Vorst [16], Trainor et al. [17], has highlighted the necessity to include human behavior in the evacuation decision model to represent the system better, thus providing more accurate predictions.
The evacuation decision-making model used in this study was based on a previous study by Sopha et al. [18]. The evacuation decision-making consists of two stages: when-to-evacuate and how-to-evacuate. When it comes to the when-to-evacuate decision, two types of decision-making based on Sopha et al. [18], i.e., adaptive and leader-following, are used in the developed simulation model. Adaptive behavior represents self-evacuation behavior, which exhibits highly rational thinking and high behavioral control to identify the destination shelter and move toward the designated shelter through the evacuation route [48]. Leader-following behavior represents the behavior that follows others. People with a strong belief in the cultural leader follow the cultural leader. The people following their cultural leader and vulnerable groups such as children, the elderly, and the disabled are likely to exhibit leader-following behavior. When it comes to the how-to-evacuate decision, the populace determines their destination of the assembly points and move towards them. During the movement, they may experience congestion, where interaction between agents and interaction between agents and the environment occur.
In addition to decision making, the population is also heterogeneous when it comes to their location, designated shelters, hazard threshold indicating the level of perceived hazard initiating evacuation, and walking speed. Based on the findings of Shi et al. [49], the walking speed during evacuation with free movement is between 1.2 m/s to 1.8 m/s. The walking speed differs among population groups. Children walk at a speed of 1.08 m/s, adults at 1.27 m/s, and the elderly at 1.04 m/s [49].
In addition to the evacuees, other agents, i.e., the volunteers, vehicles, assembly points, and shelters are also modeled. The evacuees, the volunteers, and the vehicles are mobile agents, whereas the assembly points and the shelters are stationary agents. Table 3 presents the agents used in the simulation model. Based on the previous empirical studies, decision-making types of the evacuees are implemented in the model. The agents are then situated in actual geographical areas using a GIS map (OpenStreetMap) in AnyLogic [41].
The evacuees have four possible states, i.e., AtHome, moveToAssemblyPoint, moveToShelter, and Stay. During initialization, all evacuees are at the AtHome state. Once the eruption occurs, if the perceived hazard exceeds his/her hazard threshold, the evacuee decides to evacuate and change their state to moveToAssemblyPoint. During the moveToAssemblyPoint state, the evacuee moves to the assembly point by walking. Once he/she arrives at the assembly point, he/she changes his/her state to moveToShelter upon arrival. However, he/she may join a queue to wait for available resources (volunteers and vehicles) to transport him/her to the designated shelters. If the resources are available, the evacuee is transported to the designated shelter. When the evacuee arrives at the shelter, he/she will change his/her state to Stay.
4.3. Evacuation Process Model
The evacuation process refers to the process during which evacuation decision-making is performed until the affected population arrives at the safe shelters. It includes the movement from the home/origin location to the assembly points and then proceeding to the designated shelters. The evacuees make their way to the assembly points on foot. From the assembly points, the evacuees will be transported to the designated evacuation shelters with the assistance of volunteers. At each assembly point, 15 volunteers and 15 vehicles are allocated. Each volunteer is assumed to bring eight evacuees to the designated shelter using a four-wheel vehicle that travels at a speed of 9 m/s. Eight shelters are determined as final destinations. Once the evacuees arrive at the shelters, they will stay there.
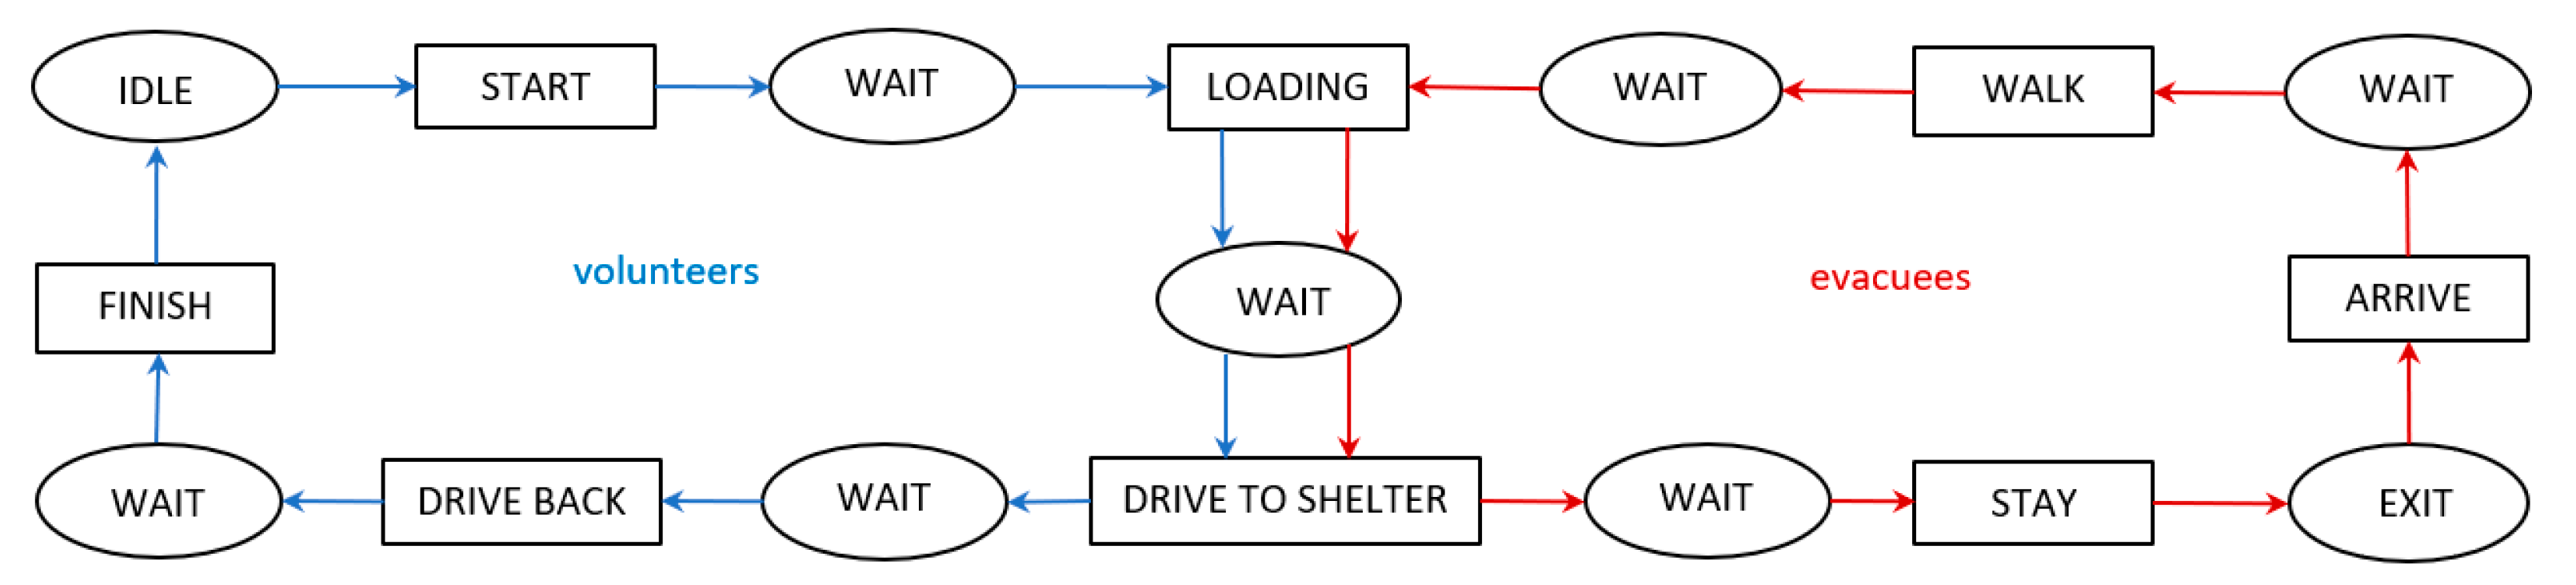
As the evacuation involves processes and requires resources, DES is, therefore, a suitable simulation method. The processes are modeled using an activity cycle diagram (ACD). Two entities are defined for the DES model, namely the evacuees and the volunteers. Based on the aforementioned evacuation movement, the activities/processes of the evacuees include entering the system (ARRIVE), moving to the assembly point (WALK), boarding vehicles (LOADING), being driven to the shelter (DRIVE TO SHELTER), and staying at the shelter (STAY), as shown in Figure 3. The volunteers are assumed to be ready at the assembly points together with the vehicles. After escorting the evacuees to the designated shelters, the volunteers return to the assembly point before returning to idle until they are assigned to assist the evacuation. Hence, the activities/processes of the volunteers include starting (START), ushering the evacuees to board the vehicle (LOADING), driving to the shelter (DRIVE TO SHELTER), returning to the assembly point (DRIVE BACK), and ending (FINISH), as shown in Figure 3. The ACD shown in Figure 3 was then implemented in AnyLogic software [41].
4.4. Combining Agent-Based Modeling and Discrete-Event Simulation
Many multi-method model architectures have existed depending on the nature of the problem. The evacuation decision-making model using ABM determines the agent’s state, which then triggers movement and the required resources, which are modeled in DES.
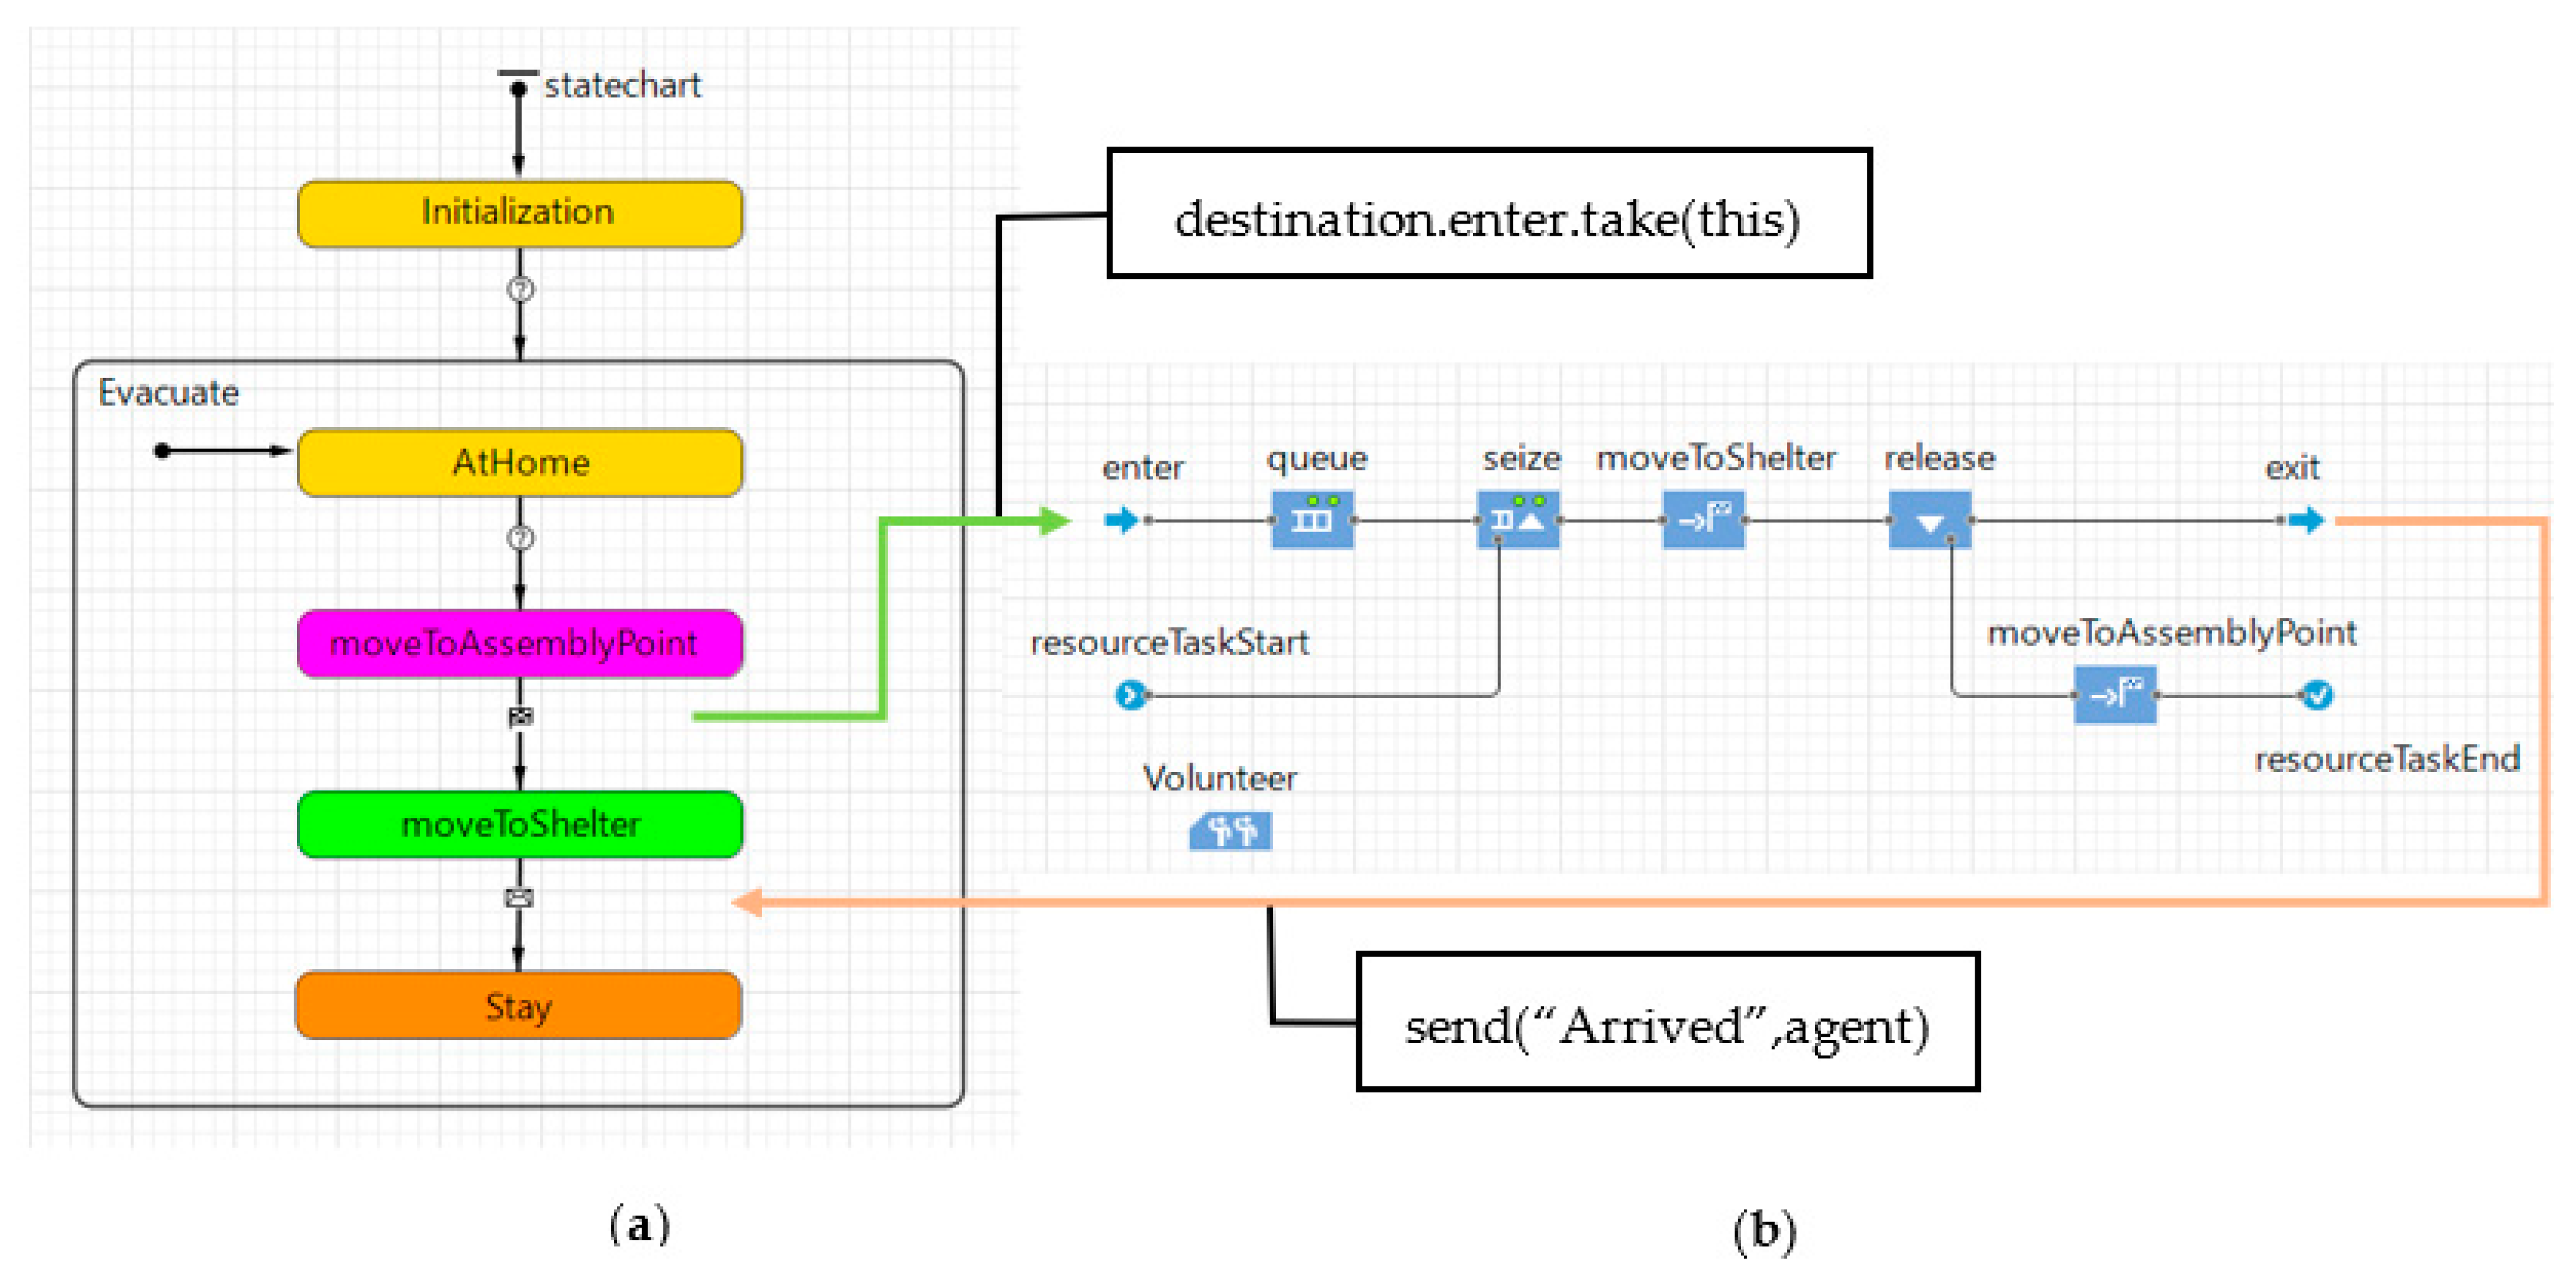
Figure 4 illustrates the interaction between ABM and DES, which adheres to the processes inside the agents architecture [26]. The processes in DES are triggered by the arrival of the evacuees at the assembly point. The evacuees enter the processes in DES through enter. During the DES processes, the resources are acquired, and the evacuees are transported to the designated shelters. Once the evacuees arrived at the shelter, the resources are released, and the evacuees exit from the processes and change their state to Stay.
When it comes to performance indicators, evacuation time, load balance of the shelters, and CO2 emissions are evaluated. These indicators are essential considerations in sustainable humanitarian logistics, acknowledging sustainability as one factor that should be considered when designing socio-technical systems [12]. The evacuation time, which is the period during which the evacuees are exposed to risk until reaching the shelter, is reported to measure the effectiveness of the evacuation plan. The load balance among shelters was used to measure fairness/equity. A load of each shelter was measured using shelter utilization, which is the percentage of the number of evacuees in the shelter to their respective capacity. The wider the gap of load among the shelters, the lesser the fairness. CO2 emissions, estimated from vehicle transportation, measures environmental performance.
Verification and validation were carried out to ensure that the simulation model was implemented according to the conceptual model and represents the actual system being modeled, respectively. Verification was conducted through code-walk-through, whereas validation was conducted by comparing the simulation results with the historical data of the previous evacuation of the volcano eruption in 2010. Because no historical record of evacuation time is available, the validation on the average evacuation time cannot be conducted. The results of MMS are then contrasted with the results of a single ABM to evaluate their relative performance. The difference between the two models lies in the evacuation process modeling, absent in the sole ABM.
4.5. Scenario Development
Three scenarios were developed to explore alternative, more realistic evacuation behavior and plans. The first scenario is the base scenario, which simulates the evacuation based on the evacuation plan. The base scenario specifies that each individual in a particular hamlet should move to the designated assembly point and the shelter following the predetermined evacuation route as specified by the official evacuation plan. Often, individuals may tend to select the shortest distance toward the assembly point instead of following the predetermined evacuation route and the assembly point specified by the evacuation plan. Therefore, Scenario 2 evaluates the route choice behavior selecting the nearest assembly point and using the shortest distance. Scenario 3 extends Scenario 2 by relocating resources to improve the performance of the evacuation to anticipate the deviation of evacuation decision-making, i.e., selecting the nearest assembly point through the shortest distance. Three performance indicators, i.e., evacuation time, the load of the shelters, and CO2 emission, are compared. The CO2 emission factor of 237 g/km was derived from Erahman et al. [50].
5. Results and Discussion
This section is divided into two parts. The first part discusses the comparative analysis between the MMS and the single ABM, and the second part discusses the results of the developed scenarios. Figure 5 shows the visualization of the simulation model showing the assembly points (blue houses), the shelters (green buildings), and the vehicles (white trucks).
5.1. Comparative Analysis
Table 4 shows that the simulated data using MMS well-reproduces the historical data of the 2010 volcano eruption, as indicated by the non-significant difference between the historical and the simulated data (χ2 = 0.00006, df = 7, p = 1). Table 4 also presents the simulated data of the evacuees who arrived at each shelter for both the single ABM and the MMS. When compared to historical data of the 2010 volcano eruption, both models indicate a non-significant difference (χ2 = 9.941, df = 7, p = 0.269 for the agent-based modeling and χ2 = 0.00006, df = 7, p = 1 for the multi-method simulation). Although both models can reproduce the historical data with a statistically non-significant difference, the MMS provides a more accurate representation than the single ABM.
The MMS reports a longer evacuation time than the single ABM. It is not unexpected since the MMS considers the evacuation processes and the available services in detail, whereas the single ABM does not consider the evacuation processes and the services, and thus may underestimate the actual evacuation time.
When it comes to the distribution of evacuees at the shelters, it appears that the MMS performs better than the single ABM. It can be concluded that the benefits of the MMS are the facilitation of interoperability and capturing the interaction among components of the model at different abstraction levels. The approach captures the multi-dimensional nature of the system, offering broader flexibility to represent more complex problems and the reduction of computational effort. However, it is worth noting that when the model becomes more complex, evaluating the model and data requirements becomes more challenging.
5.2. Scenarios
Table 5 presents simulation results of the three scenarios regarding the average evacuation time, shelter utilization, and CO2 emissions. According to the evacuation plan, the base scenario modeled the evacuees following the predetermined evacuation route, the assembly points, and the shelters, based on the evacuation plan. The results indicate that six out of eight shelters have operated over their capacity, while two shelters are below their capacity. It implies that an imbalance load exists among the shelters, resulting in unequal services provided by each shelter. Similar patterns are also observed for Scenarios 2 and 3. Over-utilized shelters indicate that the number of evacuees exceeds the capacity of the shelters. The imbalanced load of the shelters indicates that the allocation policy, as shown in Table 2, needs to be reviewed. The results also suggest that the existing capacity of the shelters should be increased by adding the capacity to the existing shelters and establish new shelters to facilitate a balanced load and equal services (equity/fairness) across the shelters.
Because people tend to select the nearest assembly point and find the shortest route to get to the assembly point, Scenario 2 evaluates the circumstance when the evacuees do not follow the predetermined evacuation route and the assembly point according to the evacuation plan; instead, the evacuees select the nearest assembly point and shortest route. The result indicates that the average evacuation time is longer than that of the base scenario. This was due to the congestion of evacuees on the route and at several assembly points. The number of evacuees at several assembly points has far exceeded the allocated resources, resulting in queues, and consequently, longer evacuation. Surprisingly, some assembly points were not chosen by any of the evacuees, which then worsened the imbalance load of the shelters. The result is, to some extent, in line with that of Takabatake et al. [28], who demonstrated that if the evacuees were to choose their closest evacuation place, the mortality rate increases. For the CO2 emission, Scenario 2 has higher CO2 emission than the base scenario by 8%. It is interesting to note that the evacuation plan (Scenario 1) results in a shorter total distance, and hence less CO2 emissions, than Scenario 2. It can be explained that although the distance from the original location to the assembly point is shorter (as the evacuees choose the nearest assembly points using the shortest distance), it leads to a longer distance from the assembly points to the shelters. It implies that the evacuation system should be evaluated as a whole, not only optimizing one part of the system while creating inefficiency at another part of the system.
In anticipation of the behavior described in Scenario 2, i.e., selecting the nearest assembly point and the shortest route, Scenario 3 attempts to evaluate the effect of relocating resources from no-evacuee assembly points to congested assembly points. The results indicate that the resource relocation may help to reduce the evacuation time by almost half. The evacuation time of Scenario 3 is slightly faster than in the base scenario. It implies that relocating resources decreases the evacuation time but does not lead to lower CO2 emission because the allocation of the evacuees to the assembly points and the shelters is similar, thus leading to the same needs for transportation.
The results demonstrate that evacuation decision-making imposes on the three performance indicators, whereas relocating resources affects the evacuation time. The results highlight that the evacuation plan can also be enhanced by re-allocating resources for faster evacuation time. It also implies the necessity to adopt sustainable performance indicators from different standpoints, e.g., effectiveness, economy, social and environmental, to evaluate for long-term solutions which fulfill the needs effectively with minimum possible environmental impact.
Based on the three scenarios’ findings, these results imply that the number and location of the assembly points, the allocation of evacuees to the assembly points and the shelters, the capacity of shelters, and the choice of the route are paramount importance for a successful evacuation. Further, the results also suggest some practical implications, as follows. It appears that the current capacity does not suffice to meet the required demands. Hence, the capacity can be extended by increasing the assembly points’ and the shelters’ current capacity or expanding new assembly points and shelters. The uneven load distribution among the assembly points and the shelters requires careful re-examination of the allocated evacuees at the assembly points and the shelters that need to be synchronized with the resource allocation to reduce evacuation time and achieve a balanced load among the shelters.
Regarding the location and allocation of the shelters, the present study could be enhanced further by using hybrid optimization-multi-method simulation as potential future research to refine the existing evacuation plan. Hybrid optimization simulation has previously been conducted by Sopha et al. [52], who attempted to find the optimized delivery route in a dynamic demand setting. Another future research could focus on expanding the developed multi-method simulation to include aid distribution to the shelters.
The evacuation plan should also be accompanied by proper execution according to the plan. Facilitating other measures such as the appropriate signs of the evacuation route which guide the population to evacuate to the designated assembly points and shelters, training/workshop to increase awareness of emergency and the evacuation plan, and agents of change who guide the population toward appropriate evacuation decision-making are of importance to leverage the community resilience.
6. Conclusions
The paper has provided a technical demonstration to develop a multi-method simulation, which is then used to evaluate the existing evacuation plan for the Mount Merapi volcano eruption from the sustainability standpoint. Three sustainability performance indicators, i.e., evacuation time, load balance of the shelters, and CO2 emission, were evaluated. Combining ABM and DES allows interaction between the evacuees, the volunteers, the vehicles, and the infrastructure (i.e., road network, shelters). The MMS captures empirically-based evacuation decision-making linked with the movement and the required volunteers and vehicles. The inclusion of a detailed evacuation process that models the movement and its associated required resources offers better performance, and thus a better understanding of the mechanism resulting in overall system behavior.
Results imply that the capacity of the existing shelters should be expanded. Moreover, the number, the location, and the allocation of evacuees to the assembly points and the shelters, and resource allocation should be re-evaluated to anticipate the evacuees following the nearest assembly point and shortest route, resulting in longer evacuation time due to bottleneck/congestion, imbalance load of the shelters, and higher CO2 emissions. The evacuation time is influenced by the interaction between the evacuation decision-making and the evacuation movement, which available resources and infrastructure may constrain. Evacuation decision-making also affects the load of the shelters and CO2 emissions, whereas relocating resources affects the evacuation time. It is therefore important to adopt sustainable performance indicators in order to select long-term solutions that fulfill the needs effectively with minimum possible environmental impact.
The limitation of the developed model lies in the incapability to determine the best, most optimized evacuation plan (e.g., best shelter locations, best capacity allocation) because the simulation approach is used for exploration (what-if scenario), not for optimization. The present study could be complemented by optimization studies to solve the optimized evacuation plan, and further enhanced by developing hybrid optimization-multi-method simulation. The developed MMS can be used to develop disaster response policies, training disaster emergency personnel, and helping to make real-time decisions so that sustainable evacuation strategies can be formulated. Furthermore, the multi-method simulation approach can also be applied to the evacuation of other sudden-onset disasters such as earthquakes, tsunamis, landslides, floods, and hurricanes with multi-mode transportation.
Author Contributions
Conceptualization, B.M.S., L.C.; methodology, B.M.S.; software, B.M.S.; validation, B.M.S., A.I.T., L.C.; formal analysis, B.M.S., A.I.T.; investigation, B.M.S.; resources, B.M.S., L.C.; data curation, B.M.S., A.I.T.; writing—original draft preparation, B.M.S., L.C.; writing—review and editing, B.M.S., L.C., project administration, B.M.S.; funding acquisition, B.M.S. All authors have read and agreed to the published version of the manuscript.
Funding
This research is funded by the Indonesian Ministry of Education and Culture (Kementrian Pendidikan dan Kebudayaan) under the World Class Research (WCR) Scheme (2020–2022). The authors thank the editor and anonymous referees for their valuable comments and suggested improvements.
Institutional Review Board Statement
Not applicable.
Informed Consent Statement
Not applicable.
Data Availability Statement
Not applicable.
Acknowledgments
The authors gratefully acknowledge Regional Disaster Management Agency (BPBD–Badan Penanggulangan Bencana Daerah, Daerah IstimewaYogyakarta), Indonesia, for supporting data for the study.
Conflicts of Interest
The authors declare no conflict of interest.
Appendix A

Table A1.
Location of the assembly points. Reprinted with permission from ref. [44].
Table A1.
Location of the assembly points. Reprinted with permission from ref. [44].
| No | Assembly Points | Latitude | Longitude |
|---|---|---|---|
| 1 | Kopeng (hall) | −7.625126 | 110.452652 |
| 2 | Pagerjurang | −7.630556 | 110.447337 |
| 3 | Batur Kindergarten | −7.617471 | 110.45186 |
| 4 | An-Nur Mosque | −7.625915 | 110.455147 |
| 5 | Wondo’s house | −7.576664 | 110.454423 |
| 6 | Maryono’s house | −7.584692 | 110.45908 |
| 7 | Purwanto’s house | −7.5937 | 110.456727 |
| 8 | Singlar Mosque | −7.619006 | 110.463997 |
| 9 | Jimin’s house | −7.627264 | 110.464548 |
| 10 | Marjono’s house | −7.627152 | 110.467059 |
| 11 | Glagah Mosque | −7.63155 | 110.46775 |
| 12 | Karangkendal | −7.597802 | 110.439688 |
| 13 | Nur Iman Mosque | −7.614689 | 110.439833 |
| 14 | Balong Mosque | −7.61827 | 110.433316 |
| 15 | Umbulharjo (village hall) | −7.625823 | 110.433375 |
| 16 | Gondang Square | −7.623071 | 110.443244 |
| 17 | Kaliurang Barat (village hall) | −7.599485 | 110.426769 |
| 18 | Kaliurang Timur Square | −7.603291 | 110.427087 |
Table A2.
Location of the shelters. Reprinted with permission from ref. [44].
Table A2.
Location of the shelters. Reprinted with permission from ref. [44].
| No | Shelters | Latitude | Longitude |
|---|---|---|---|
| 1 | Wukirsari | −7.657729 | 110.443807 |
| 2 | Gayam | −7.659587 | 110.469966 |
| 3 | Argomulyo | −7.659441 | 110.456382 |
| 4 | Glagaharjo | −7.648145 | 110.468467 |
| 5 | Sindumartani | −7.69152 | 110.47619 |
| 6 | Plosokerep | −7.629053 | 110.446883 |
| 7 | Brayut | −7.648655 | 110.443729 |
| 8 | Hargobinangun | −7.639738 | 110.425821 |
References
- Halldorsson, A.; Kovacs, G. The sustainable agenda and energy efficiency: Logistics solutions and supply chains in times of climate change. Int. J. Phys. Distrib. Logist. Manag. 2010, 40, 5–13. [Google Scholar] [CrossRef]
- Klumpp, M.; de Leeuw, S.; Regattieri, A.; de Souza, R. Sustainability in humanitarian logistics—Why and how? In Humanitarian Logistics and Sustainability, 1st ed.; Lecture Notes in Logistics; Klumpp, M., de Leeuw, S., Regattieri, A., de Souza, R., Eds.; Springer International Publishing: Cham, Switzerland, 2015; pp. 3–9. [Google Scholar] [CrossRef]
- Van Wassenhove, L.N. Humanitarian aid logistics: Supply chain management in high gear. J. Oper. Res. Soc. 2006, 57, 475–489. [Google Scholar] [CrossRef]
- Oloruntoba, R. A planning and decision-making framework for sustainable humanitarian logistics in disaster response. In Humanitarian Logistics and Sustainability, 1st ed.; Lecture Notes in Logistics; Klumpp, M., de Leeuw, S., Regattieri, A., de Souza, R., Eds.; Springer International Publishing: Cham, Switzerland, 2015; pp. 31–48. [Google Scholar] [CrossRef]
- Klumpp, M. Sustainable humanitarian logistics research—A conceptualization. In Humanitarian Logistics and Sustainability, 1st ed.; Lecture Notes in Logistics; Klumpp, M., de Leeuw, S., Regattieri, A., de Souza, R., Eds.; Springer International Publishing: Cham, Switzerland, 2015; pp. 49–63. [Google Scholar] [CrossRef]
- Chen, H.S.Y.; van Wassenhove, L.; Cheng, T.C.E. Designing sustainable humanitarian supply chain. In OSF Preprints m82ar; Center for Open Science: Charlottesville, VA, USA, 2020; Available online: https://ideas.repec.org/p/osf/osfxxx/m82ar.html (accessed on 10 March 2021). [CrossRef]
- Sopha, B.M.; Ma’mun, S. Economic analysis and environmental assessment of aluminum debris power generator for deployment to communal-scale disaster areas. Heliyon 2021, 7, e07264. [Google Scholar] [CrossRef] [PubMed]
- Hasselbalch, J.; Costa, N.; Blecken, A. Investigating the barriers to sustainable procurement in the United Nations. In Humanitarian Logistics and Sustainability, 1st ed.; Lecture Notes in Logistics; Klumpp, M., de Leeuw, S., Regattieri, A., de Souza, R., Eds.; Springer International Publishing: Cham, Switzerland, 2015; pp. 67–86. [Google Scholar] [CrossRef]
- Liperda, R.I.; Pewira Redi, A.A.M.; Sekaringtyas, N.N.; Astiana, H.B.; Sopha, B.M.; Asih, A.M.S. Simulated annealing algorithm performance on two-echelon vehicle routing problem-mapping operation with drones. In Proceedings of the IEEE International Conference on Industrial Engineering and Engineering Management, Singapore, 14–17 December 2020. [Google Scholar] [CrossRef]
- Regattieri, A.; Santarelli, G.; Piana, F.; Gamberi, M. Classification of technical requirements and the means of addressing the problem of waste management in a refugee camp. In Humanitarian Logistics and Sustainability, 1st ed.; Lecture Notes in Logistics; Klumpp, M., de Leeuw, S., Regattieri, A., de Souza, R., Eds.; Springer International Publishing: Cham, Switzerland, 2015; pp. 169–192. [Google Scholar] [CrossRef] [Green Version]
- Salvado, L.L. Towards a Sustainable Humanitarian Supply Chain: Characterization, Assessment and Decision-Support. Ecole des Mines d’Albi-Carmaux. 2018. English. NNT: 2018EMAC0016. Tel-02317052. Available online: https://tel.archives-ouvertes.fr/tel-02317052/document (accessed on 19 January 2021).
- Aalami, S.; Kattan, L. Fairness and efficiency in pedestrian emergency evacuation: Modeling and simulation. Saf. Sci. 2020, 12, 373–384. [Google Scholar] [CrossRef]
- Joo, J.; Kim, N.; Wysk, R.A.; Rothrock, L.; Son, Y.J.; Oh, Y.G. Agent-based Simulation of Affordance-based Human Behaviors in Emergency Evacuation. Simul. Model Pract. Theory 2013, 32, 99–115. [Google Scholar] [CrossRef]
- Dulebenets, M.A.; Abioye, O.F.; Ozguven, E.E.; Moses, R.; Boot, W.R.; Sando, T. Development of Statistical Models for Improving Efficiency of Emergency Evacuation in Areas with Vulnerable Population. Reliab. Eng. Syst. Saf. 2018, 9, 233–249. [Google Scholar] [CrossRef]
- Aguirre, B.E. Planning, Warning, Evacuation and Search and Rescue: A Review of the Social Science Research Literature; Department of Sociology Texas A&M University: College Station, TX, USA, 1994. [Google Scholar]
- Vorst, H.C.M. Evacuation models and disaster psychology. Procedia Eng. 2010, 3, 15–21. [Google Scholar] [CrossRef] [Green Version]
- Trainor, J.E.; Murray-Tuite, P.; SCE, A.M.; Edara, P.; Fallah-Fini, S.; Triantis, K. Interdisciplinary Approach to Evacuation Modelling. Nat. Hazard Rev. 2013, 14, 151–162. [Google Scholar] [CrossRef]
- Sopha, B.M.; Doni, R.E.; Asih, A.M.S. Mount Merapi Eruption: Simulating Dynamic Evacuation and Volunteer Coordination using Agent-Based Modeling Approach. J. Humanit. Logist. Supply Chain. Manag. 2019, 9, 292–322. [Google Scholar] [CrossRef]
- Borrmann, A.; Kneidl, A.; Köster, G.; Ruzika, S.; Thiemann, M. Bidirectional coupling of macroscopic and microscopic pedestrian evacuation models. Saf. Sci. 2012, 50, 1695–1703. [Google Scholar] [CrossRef]
- Smith, J.M. State-dependent queueing models in emergency evacuation networks. Transport. Res. B Meth. 1991, 25, 373–389. [Google Scholar] [CrossRef]
- Lo, S.M.; Huang, H.C.; Wang, P.; Yuen, K.K. A game theory-based exit selection model for evacuation. Fire Saf. J. 2006, 41, 364–369. [Google Scholar] [CrossRef]
- Xiongfei, Z.; Qixin, S.; Rachel, H.; Bin, R. Network emergency evacuation modeling: A literature review. In Proceedings of the 2010 International Conference on Optoelectronics and Image Processing, Haikou, China, 11–12 November 2010; IEEE Xplore: Piscataway, NJ, USA, 2010. [Google Scholar] [CrossRef]
- Widera, A.; Konradt, C.; Bohle, C.; Hellingrath, B. A multi-method simulation environment for humanitarian supply chains. In Proceedings of the 4th International Conference on Information and Communication Technologies for Disaster Management (ICT-DM), Münster, Germany, 11–13 December 2017. [Google Scholar] [CrossRef]
- Lorenz, T.; Jost, A. Towards an orientation-framework for multiparadigm modeling. In Proceedings of the 24th International Conference of the System Dynamics Society, Nijmegen, The Netherlands, 23–27 July 2006; pp. 1–18. [Google Scholar]
- Mykoniatis, K.; Angelopoulou, A. A modeling framework for the application of multi-paradigm simulation methods. Simul. Trans. Soc. Modeling Simul. Int. 2019, 96, 55–73. [Google Scholar] [CrossRef]
- Borshchev, A. The Big Book of Simulation Modeling: Multimethod Modeling with AnyLogic 6; AnyLogic North America: Chicago, IL, USA, 2013. [Google Scholar]
- Wilensky, U.; Rand, W. An Introduction to Agent-Based Modeling; The MIT Press: Cambridge, MA, USA, 2015. [Google Scholar]
- Takabatake, T.; Fujisawa, K.; Esteban, M.; dan Shibayama, T. Simulated Effectiveness of a Car Evacuation from a Tsunami. Int. J. Disaster Risk Reduc. 2020, 47, 101532. [Google Scholar] [CrossRef]
- Mas, E.; Suppasri, A.; Imamura, F.; Koshimura, S. Agent-based simulation of the 2011 great east Japan earthquake/tsunami evacuation-an integrated model of tsunami inundation and evacuation. J. Nat. Disaster Sci. 2012, 34, 41–57. [Google Scholar] [CrossRef] [Green Version]
- Chen, X.; Meaker, J.W.; Zhan, F.B. Agent-based Modeling and Analysis of Hurricane Evacuation Procedures for the Florida Keys. Nat. Hazards 2006, 38, 321–338. [Google Scholar] [CrossRef]
- Chen, X.; Zhan, F.B. Agent-based modeling and simulation of urban evacuation: Relative effectiveness of simultaneous and staged evacuation strategies. J. Oper. Res. Soc. 2008, 59, 25–33. [Google Scholar] [CrossRef]
- Banks, J.; Carson, J.S.; dan Nelson, B.L.; Nicol, D.M. Discrete-Event System Simulation; Pearson Education, Inc.: Cranbury, NJ, USA, 2010. [Google Scholar]
- Nassar, K.; Bayyoumi, A. A simulation study of the effect of mosque design on egress times. In Proceedings of the Winter Simulation Conference, Berlin, Germany, 9–12 December 2012; p. 110. [Google Scholar]
- Deng, X. An Aircraft Evacuation Simulation Baseline Using DES for Passenger Path Planning. Master’s Thesis, Embry-Riddle Aeronautical University, Daytona Beach, FL, USA, 2016. [Google Scholar]
- Sopha, B.M.; Sakti, S. Pemodelan dan Simulasi Berbasis Agen untuk Sistem Kompleks Sosio-Teknikal: Konsep, Metode dan Aplikasi; Gadjah Mada University Press: Yogyakarta, Indonesia, 2020. [Google Scholar]
- Triasari, A.I. Pengembangan dasar Multi-Method Simulation Model Proses Evakuasi pada Bencana Erupsi Merapi; Departemen Teknik Mesin dan Industri, Universitas Gadjah Mada: Yogyakarta, Indonesia, 2020. [Google Scholar]
- Zhang, B.; Chan, W.K.; Ukkusuri, S.V. On the Modelling of Transportation Evacuation: An Agent-based Discrete-event hybrid-space Approach. J. Simul. 2014, 8, 259–270. [Google Scholar] [CrossRef]
- Gebetsroither-Geringer, E. Multimethod modeling and simulation supporting urban planning decisions. In Understanding Complex Urban Systems: Multidisciplinary Approaches to Modeling; Understanding Complex Systems; Walloth, C., Gurr, J.M., Schmidt, J.A., Eds.; Springer: Berlin/Heidelberg, Germany, 2014. [Google Scholar] [CrossRef]
- Castle, C.J.E.; Crooks, A.T. Principles and Concepts of Agent-Based Modelling for Developing Geospatial Simulations; UCL Centre for Advanced Spatial Analysis: London, UK, 2006; pp. 1–60. [Google Scholar]
- Crooks, A.; Malleson, N.; Manley, E.; Heppenstall, A. Agent-Based Modelling and Geographical Information Systems: A Practical Primer; SAGE: New York, NY, USA, 2018. [Google Scholar]
- AnyLogic. AnyLogic: Simulation Modeling Software Tools and Solutions. 2019. Available online: https://www.anylogic.com/ (accessed on 10 January 2019).
- Na, H.S.; dan Banerjee, A. Agent-based Discrete-event Simulation Model for No-Notice Natural Disaster Evacuation Planning. Comput. Ind. Eng. 2019, 129, 44–55. [Google Scholar] [CrossRef]
- Mei, E.T.W.; Lavigne, F. Mass evacuation of the 2010 Merapi eruption. Int. J. Emerg. Manag. 2013, 9, 298–311. [Google Scholar] [CrossRef]
- BPBD (Badan Penanggulangan Bencana Daerah). Dokumen Kontijensi Erupsi Gunung Api Merapi; Pemerintah Kabupaten Sleman, Sleman: Yogyakarta, Indonesia, 2012. [Google Scholar]
- Parvin, G.A.; Sakamoto, M.; Shaw, R.; Nakagawa, H.; Sadik, M.S. Evacuation Scenarios of Cyclone Aila in Bangladesh: Investigating the Factors Influencing Evacuation Decision and Destination. Prog. Disaster Sci. 2019, 2, 100032. [Google Scholar] [CrossRef]
- Mostafizi, A.; Wang, H.; Cox, D.; Dong, S. An Agent-Based Vertical Evacuation Model for A Near-Field Tsunami: Choice Behavior, Logical Shelter Locations, and Life Safety. Int. J. Disaster Risk Reduct. 2019, 34, 467–479. [Google Scholar] [CrossRef]
- Lechner, H.N.; Rouleau, M.D. Should We Stay or Should We Go Now? Factors Affecting Evacuation Decisions at Pacaya Volcano, Guatemala. Int. J. Disaster Risk Reduct. 2019, 40, 101160. [Google Scholar] [CrossRef]
- Sopha, B.M.; Asih, A.M.S.; Ilmia, D.G.; Yuniarto, H.A. Knowledge engineering: Exploring evacuation behavior during volcanic disaster. In Proceedings of the IEEM International Conference of Industrial Engineering and Engineering Management, Singapore, 10–13 December 2017; pp. 235–239. [Google Scholar] [CrossRef]
- Shi, L.; Xie, Q.; Cheng, X.; Chen, L.; Zhou, Y.; Zhang, R. Developing a Database for Emergency Evacuation Model. Build. Environ. 2009, 44, 1724–1729. [Google Scholar] [CrossRef]
- Erahman, Q.F.; Reyseliani, N.; Purwanto, W.W.; Sudibandriyo, M. Modeling future energy demand and CO2 emission of passenger cars in Indonesia at the provincial level. Energies 2019, 12, 3168. [Google Scholar] [CrossRef] [Green Version]
- BPBD (Badan Penanggulangan Bencana Daerah). Tanggap Darurat Erupsi Merapi 2010; Pemerintah Kabupaten Sleman, Sleman: Yogyakarta, Indonesia, 2011. [Google Scholar]
- Sopha, B.M.; Siagian, A.; Asih, A.M.S. Simulating Dynamic Vehicle Routing Problem using Agent-Based Modeling and Simulation. In Proceedings of the IEEE International Conference on Industrial Engineering and Engineering Management, Bali, Indonesia, 4–7 December 2016; pp. 1335–1339, Art. No. 7798095. [Google Scholar] [CrossRef]
Figure 1.
Effusive scenario (pink zones) and explosive scenario (orange zones) based on data in ref. [44] which was implemented in AnyLogic software using OpenStreetMap with the scale of 1:100,000 [41].

Figure 2.
(a) Risk map with red represent high-risk areas. Reprinted with permission from ref. [44] and (b) the assembly points (blue houses) and the shelters (green buildings) for effusive scenario based on data on ref. [44] which was developed in AnyLogic software using OpenStreetMap with the scale of 1:50,000 [41]. (Permission added for Figure 2a, Copyright Year 2012. Copyright Owner’s Name: BPBD).

Figure 3.
Activity cycle diagram (ACD) of the evacuation in the discrete-event simulation (note: blue colored lines: ACD for evacuees; brown-colored lines: ACD for volunteers; rectangles represent activities/processes, ovals represent queues).
Figure 3.
Activity cycle diagram (ACD) of the evacuation in the discrete-event simulation (note: blue colored lines: ACD for evacuees; brown-colored lines: ACD for volunteers; rectangles represent activities/processes, ovals represent queues).

Figure 4.
The architecture of the combined agent-based modeling and discrete-event simulation—processes inside the agents: (a) Statechart of the evacuees during the evacuation of the ABM, (b) evacuation process modeling of the DES, implemented in AnyLogic software [41]. The picture is the screenshots of the ABM dan DES models we have developed in AnyLogic (ref. [41]).

Figure 5.
Visualization of the simulation model (blue houses represent the assembly points, green buildings represent the shelters, orange dots represent agents with the “AtHome” state, pink dots represent agents with the “moveToAssemblyPoint” state, and green dots represent agents with the “moveToShelter” state, following the state colors shown in Figure 4a. The figure is the screenshot of the simulation model we have developed in AnyLogic software using OpenStreetMap ref. [41].

| Elements | ABM | DES |
|---|---|---|
| Approach | Bottom-up (individual-based; focus on modeling entities and interactions between entities) | Top-down (process-centric modeling; focusing on modeling the process in the system in detail) |
| Abstraction level | Micro-macro | Micro |
| Entity | Active entities that take the initiative to act; intelligence is shown in each entity. | Passive entities that act as they pass through the system; intelligence is modeled at the system level. |
| Control System | Decentralized; each agent has its control | Centralized |
| System Behavior | System behavior is not modeled explicitly but emerges from the micro-decisions of each agent. | The flow of entities in the system; system behavior is modeled explicitly. |
| Data | Input distribution based on theory (subjective data) and measured data (objective data) | Input distribution based on collected/measured data (objective data) |
| Spatial aspect | Yes | Yes |
| Application-level | Strategic | Operational |
| Advantage | Able to model heterogeneous agent behavior | Event-based scheduling can save computing costs |
| Disadvantage | Requires high computation time and costs | Entities do not have their intelligence in behavior. |
Table 2.
Assembly points and shelters according to the evacuation plan for an effusive scenario. Reprinted with permission from ref. [44].
Table 2.
Assembly points and shelters according to the evacuation plan for an effusive scenario. Reprinted with permission from ref. [44].
| Sub-District | Village | Hamlet | Assembly Point | Shelter |
|---|---|---|---|---|
| Cangkringan | Kepuh Harjo | Kopeng | Kopeng (hall) | Wukirsari |
| Kaliadem | Pagerjurang | |||
| Jambu | Batur Kindergarten | |||
| Batur | Batur Kindergarten | |||
| Manggong | Pagerjurang | |||
| Kepuh | Pagerjurang | |||
| Petung | An-Nur Mosque | |||
| Pagerjurang | Pagerjurang | |||
| Glagaharjo | Kalitengah Lor | Wondo’s house | Gayam | |
| Kalitengah Kidul | Maryono’s house | |||
| Srunen | Purwanto’s house | Argomulyo | ||
| Singlar | Singlar mosque | Glagaharjo | ||
| Gading | Jimin’s house | |||
| Jetis Sumur | Marjono’s house | Sindumartani | ||
| Glagahmalang | Glagah mosque | |||
| Umbulharjo | Pelemsari | Karangkendal | Plosokerep | |
| Pangukrejo | Nur Iman mosque | |||
| Balong | Balong mosque | |||
| Gambretan | Umbulharjo (village hall) | Brayut | ||
| Plosorejo | Umbulharjo (village hall) | |||
| Gondang | Gondang square | |||
| Pakem | Hargobinangun | Kaliurang barat | Kaliurang barat (village hall) | Hargobinangun |
| Kaliurang Timur | Kaliurang timur square |
Table 3.
Agents and their attributes.
| Agents | Attributes | Description |
|---|---|---|
| Evacuees | Decision-making type | Three types of decision making based on Sopha et al. [18]: adaptive (adults, 99.83%), leader-following (adults, 0.17%), non-adaptive (elders, children, disabilities) |
| Location | During the initialization, the location is based on the actual geographical location of the evacuees’ hamlet. The evacuees’ location changes as they move. | |
| Assembly point | Each evacuee has a designated assembly point based on the evacuation plan. | |
| Shelter | Each evacuee has a designated shelter based on the evacuation plan. | |
| Walking speed | Based on Shi et al. [49]: Children = 1.08 m/s, Adults = 1.27 m/s, Elders = 1.04 m/s | |
| State | At the start of the simulation, all evacuees are in a state of AtHome. During simulation, the evacuees are in one of the following states: moveToAssemblyPoint—move to the assembly pointmoveToShelter—move to the shelter Stay—arrived at the shelter | |
| Vehicles | Capacity | Eight people in one-go |
| Speed | 9 m/s | |
| Volunteers | Designated shelter | Each volunteer has a designated shelter based on his/her designated assembly point. |
| Assembly Points | Location | Based on actual geographical location according to the evacuation plan [44] (see Appendix A Table A1) |
| Shelters | Location | Eight shelters have been determined according to the evacuation plan [44] (see Appendix A Table A2): Wukirsari, Gayam, Argomulyo, Glagaharjo, Sindumartani, Plosokerep, Brayut, Hargobinangun |
Table 4.
Comparative analysis.
| Performance Indicators | Actual Data [51] | Simulated Data Using ABM Solely | Simulated Data Using MMS |
|---|---|---|---|
| Average Evacuation Time (hours) | Not Available | 3.22 | 3.75 |
| Distribution of evacuees at the shelters (%) | |||
| Wukirsari | 27.9 | 29.1 | 27.9 |
| Gayam | 7.3 | 9.5 | 7.3 |
| Argomulyo | 4.0 | 4.4 | 3.9 |
| Glagaharjo | 5.5 | 10.3 | 5.5 |
| Sindumartani | 4.5 | 5.2 | 4.5 |
| Plosokerep | 12.6 | 9.1 | 12.6 |
| Brayut | 15.2 | 7.6 | 15.2 |
| Harjobinangun | 23.1 | 24.7 | 23.0 |
| Total | 100.0 | 100.0 | 100.0 |
Table 5.
Results of scenarios.
| Performance Indicators | Scenario 1 Based on Evacuation Plan | Scenario 2 Shortest Route to Assembly Point | Scenario 3 Shortest Route and Relocating Resources |
|---|---|---|---|
| Average Evacuation Time (hours) | 3.75 | 6.90 | 3.43 |
| Shelter Utilization (%) | |||
| Wukirsari | 313 | 165 | 165 |
| Gayam | 82 | 82 | 82 |
| Argomulyo | 148 | 412 | 413 |
| Glagaharjo | 62 | 115 | 114 |
| Sindumartani | 167 | 77 | 77 |
| Plosokerep | 282 | 489 | 489 |
| Brayut | 341 | 220 | 219 |
| Harjobinangun | 259 | 258 | 259 |
| CO2 emissions (kg) | 3376 | 3654 | 3654 |
Publisher’s Note: MDPI stays neutral with regard to jurisdictional claims in published maps and institutional affiliations. |
© 2021 by the authors. Licensee MDPI, Basel, Switzerland. This article is an open access article distributed under the terms and conditions of the Creative Commons Attribution (CC BY) license (https://creativecommons.org/licenses/by/4.0/).
Share and Cite
MDPI and ACS Style
Sopha, B.M.; Triasari, A.I.; Cheah, L. Sustainable Humanitarian Operations: Multi-Method Simulation for Large-Scale Evacuation. Sustainability 2021, 13, 7488. https://0-doi-org.brum.beds.ac.uk/10.3390/su13137488
AMA Style
Sopha BM, Triasari AI, Cheah L. Sustainable Humanitarian Operations: Multi-Method Simulation for Large-Scale Evacuation. Sustainability. 2021; 13(13):7488. https://0-doi-org.brum.beds.ac.uk/10.3390/su13137488
Chicago/Turabian StyleSopha, Bertha Maya, Athaya Islami Triasari, and Lynette Cheah. 2021. "Sustainable Humanitarian Operations: Multi-Method Simulation for Large-Scale Evacuation" Sustainability 13, no. 13: 7488. https://0-doi-org.brum.beds.ac.uk/10.3390/su13137488
Note that from the first issue of 2016, this journal uses article numbers instead of page numbers. See further details here.