Article

Effects of Pretreatment and Ratio of Solid Sago Waste to Rumen on Biogas Production through Solid-State Anaerobic Digestion

Department of Chemical Engineering, Faculty of Engineering, Universitas Diponegoro, Semarang 50239, Indonesia
*
Author to whom correspondence should be addressed.
Sustainability 2021, 13(13), 7491; https://0-doi-org.brum.beds.ac.uk/10.3390/su13137491
Submission received: 23 April 2021 / Revised: 28 June 2021 / Accepted: 1 July 2021 / Published: 5 July 2021
(This article belongs to the Section Energy Sustainability)

Abstract

:
Solid sago waste is a potential source of producing renewable energy in the form of biogas. This study investigated the effects of solid sago waste particle size, biological pretreatment using a microbial consortium of lignocelluloses, pretreatment with NaOH, and the ratio between solid sago waste and cow rumen based on the biogas production rate. Several variations of these conditions were used to achieve this. The anaerobic digestion process was conducted over two months at 30.42 °C ± 0.05 °C, and the biogas production rate was measured every two days. The 1:1 ratio showed better results compared to the 2:1, because it allows the bacteria to achieve metabolic balance. The highest cumulative biogas production (27.91 mL/g TS) was generated when the sago waste underwent milling (±1 mm), pretreatment with 4% NaOH g/g TS, and treatment with microbial consortium 5% v/v at a 1:1 ratio of solid sago waste to the rumen.

1. Introduction

Renewable energy sources, e.g., biogas, are alternatives to fossil fuels and are used to overcome the energy crisis [1,2]. Biogas can be obtained from various organic wastes, such as animal wastes (manures), various byproducts from human activities (sewage sludge, wet market waste, and municipal solid waste), and plants (agricultural waste), through anaerobic digestion in which the microorganisms degrade the organic matter in four main steps hydrolysis, acidogenesis, acetogenesis, and methanogenesis. The product gas is then used as a renewable energy source [1,2,3]. Typically, biogas consists of methane (CH4, 55–70%) and carbon dioxide (CO2, 30–45%) as well as some impurities, such as H2S (0–0.5%), NH3 (0–0.05%), water vapor (1–5%), and N2 (0–5%) [4]. Biogas can be used to produce heat and electricity or as a fuel for transportation after being subjected to a special treatment such as the process of removing impurities and the process of increasing heating value, causing high-quality biomethane and resulting in a significant reduction in greenhouse gas emissions and other pollutants and reducing the dependence on fossil fuels [1,5,6].
Solid sago waste is a readily available organic material that contains enough lignocellulose as raw materials in biogas production. Co-digestion of different types of biomasses, such as cattle dung with solid sago waste, offers great potential to increase the volume of biogas. Co-digestion has many advantages, such as a C/N ratio optimization and eliminates the accumulation of toxic compounds for microorganisms [6,7]. Additionally, pretreatment can increase biogas productivity by removing lignin and hemicellulose, which are difficult for microorganisms to digest. Several types of pretreatments, including physical; chemical; and biological pretreatments, can be used in biogas production [8]. Grinding is the most common physical pretreatment [9]. Chemical pretreatments include alkali [10] and acid pretreatments [11]. Alternatively, biological pretreatment is conducted using bacteria, fungi, or enzymes [8].
Two types of treatment methods are available to generate biogas from raw materials containing lignocellulosic biomass: solid-state anaerobic digestion (SS-AD) or liquid anaerobic digestion (L-AD) [12]. SS-AD is used for raw materials with a high concentration of solids, i.e., a total solid content of above 15%. Conversely, L-AD is used for raw materials with solid concentrations between 0.5–15% [13]. SS-AD exhibits several advantages compared to L-AD, such as smaller reactor volume, lower heating requirements, easy handling of materials, and lower total parasitic energy. The SS-AD method was suitable for biogas production using sago solid waste, which is characterized by its high lignocellulosic biomass content. SS-AD practice offers an additional advantage, producing a granular byproduct used as a fertilizer that can be easily handled and removed compared to the L-AD byproducts [14,15].
Pretreatment can accelerate the slow process of lignocellulosic hydrolysis by anaerobic digestion. Thus, using a combined physical, chemical, and biological pretreatment is necessary to expedite and facilitate the process and enhance biogas productivity [16,17]. In the physical pretreatment of sago solid waste, the raw material size is decreased to reduce the cellulose crystallinity to facilitate the enzymatic hydrolysis process [18]. In chemical pretreatment, acids or bases are used under extreme conditions. Moreover, biological treatment is conducted using microorganisms to process lignocellulose and increase enzymatic hydrolysis [19]. In this study, physical pretreatment was conducted out by sago waste grinding (±1 mm). The performance of the ground material was compared to that of an unground material. Chemical pretreatment was conducted by adding NaOH, and the performance of the pretreated material was compared to that of the untreated one. Finally, biological treatment was performed using microbial consortium (cellulolytic, ligninolytic, and proteolytic), and its effects were compared to a case involving no use of microbial consortium. Additionally, the impact of the ratio (1:1 and 2:1) between sago waste and rumen cattle solid waste was compared at a C/N ratio of 25 [20].
Therefore, the general aim of this study was to examine the production rate of biogas from sago solid waste using physical, chemical, and biological pretreatments and to determine the optimum ratio between sago and rumen solid cattle wastes. The specific aim of the study was to investigate the effects of physical, chemical, and biological pretreatments on the production rate of biogas to compare the impact of the ratio of cow sago waste to rumen solid waste on the volume of the biogas produced and to investigate the kinetics reaction of biogas production from sago solid waste.

2. Materials and Methods

2.1. Materials

The solid sago waste used in this study was obtained from a sago plant located in Plajan, Pakis Aji Jepara, Central Java, Indonesia. Microbial consortium (Decoprima) containing several microorganisms, such as Trichoderma sp. (4.35 × 10⁵ cfu/g); Streptomyces sp. (1.16 × 10⁶ cfu/g); and Geobacillus sp. (1.94 × 10⁶ cfu/g), was used in addition to analytical grade urea, NaOH, and HCl. A fresh rumen from a slaughterhouse in Semarang, Central Java, Indonesia, was used as an inoculum.

2.2. Substrate Preparation

Table 1 shows the variables and the treatment of each variable. Coarse solid waste is the solid waste without milling, and the waste in fine solid sago is produced by grinding it to a size of 1 mm. For chemically treated samples, 4% NaOH g/g TS was added, and the samples were soaked for 1 h. After that, for samples using biological treatment, the pH of the pretreated substrate was neutralized by adding HCl, followed by the addition of the microbial consortium (5% v/v). The solid waste of sago used for each sample weighs 200 g.

2.3. Experimental Procedure

According to the predetermined ratio of solid waste of sago to the rumen, the pretreated substrate was mixed with cow rumen. Urea was then added until the volume of the mixture reached 200 mL. The prepared samples were placed in 5-L anaerobic digesters made from polyethylene bottles. Rubber plugs were used to tightly seal the reactors equipped with valves for biogas measurement to achieve anaerobic conditions. The anaerobic digestion process was conducted over two months at 30.42 °C ± 0.05 °C, and the biogas production rate was measured every two days for 60 days. The biogas volume was measured by pouring the biogas into a water-filled glass utilizing Boyle’s law. The biogas from the digester presses in all directions. Hence, by opening the valve of the digester, the biogas directly flows into the glass measurement, and the volume difference is observed.

2.4. Kinetics Model of Biogas Production Rate

The nonlinear regression method was applied to determine the kinetics constant of biogas production rate (U), maximum biogas production (A), and minimum time for biogas production (λ). Furthermore, the Polymath 6.1 program was applied to solve numerical calculations using nonlinear regression techniques.
Since the biogas production rate and specific growth rate of methanogenic microorganisms were always proportional to the batch biodigester, the Gompertz equation was applied [21]. This mathematical equation model represented a time series observation model that considers the slowest of microbial growth at the start and end of the observation period. The Gompertz Equation takes the following general form [22]:
P = A   exp   { exp   [ U e A ( λ t ) + 1 ] } ,
P = Total biogas production (mL/g TS) at time t (days)
A = Maximum biogas production (ml/g TS)
U = The maximum biogas production rate constant (mL/g TS.day)
λ = Long lag phase (minimum time for biogas production) (days)
t = Cumulative time for biogas production (days)
e = Euler number (e = 2.71828)

3. Results

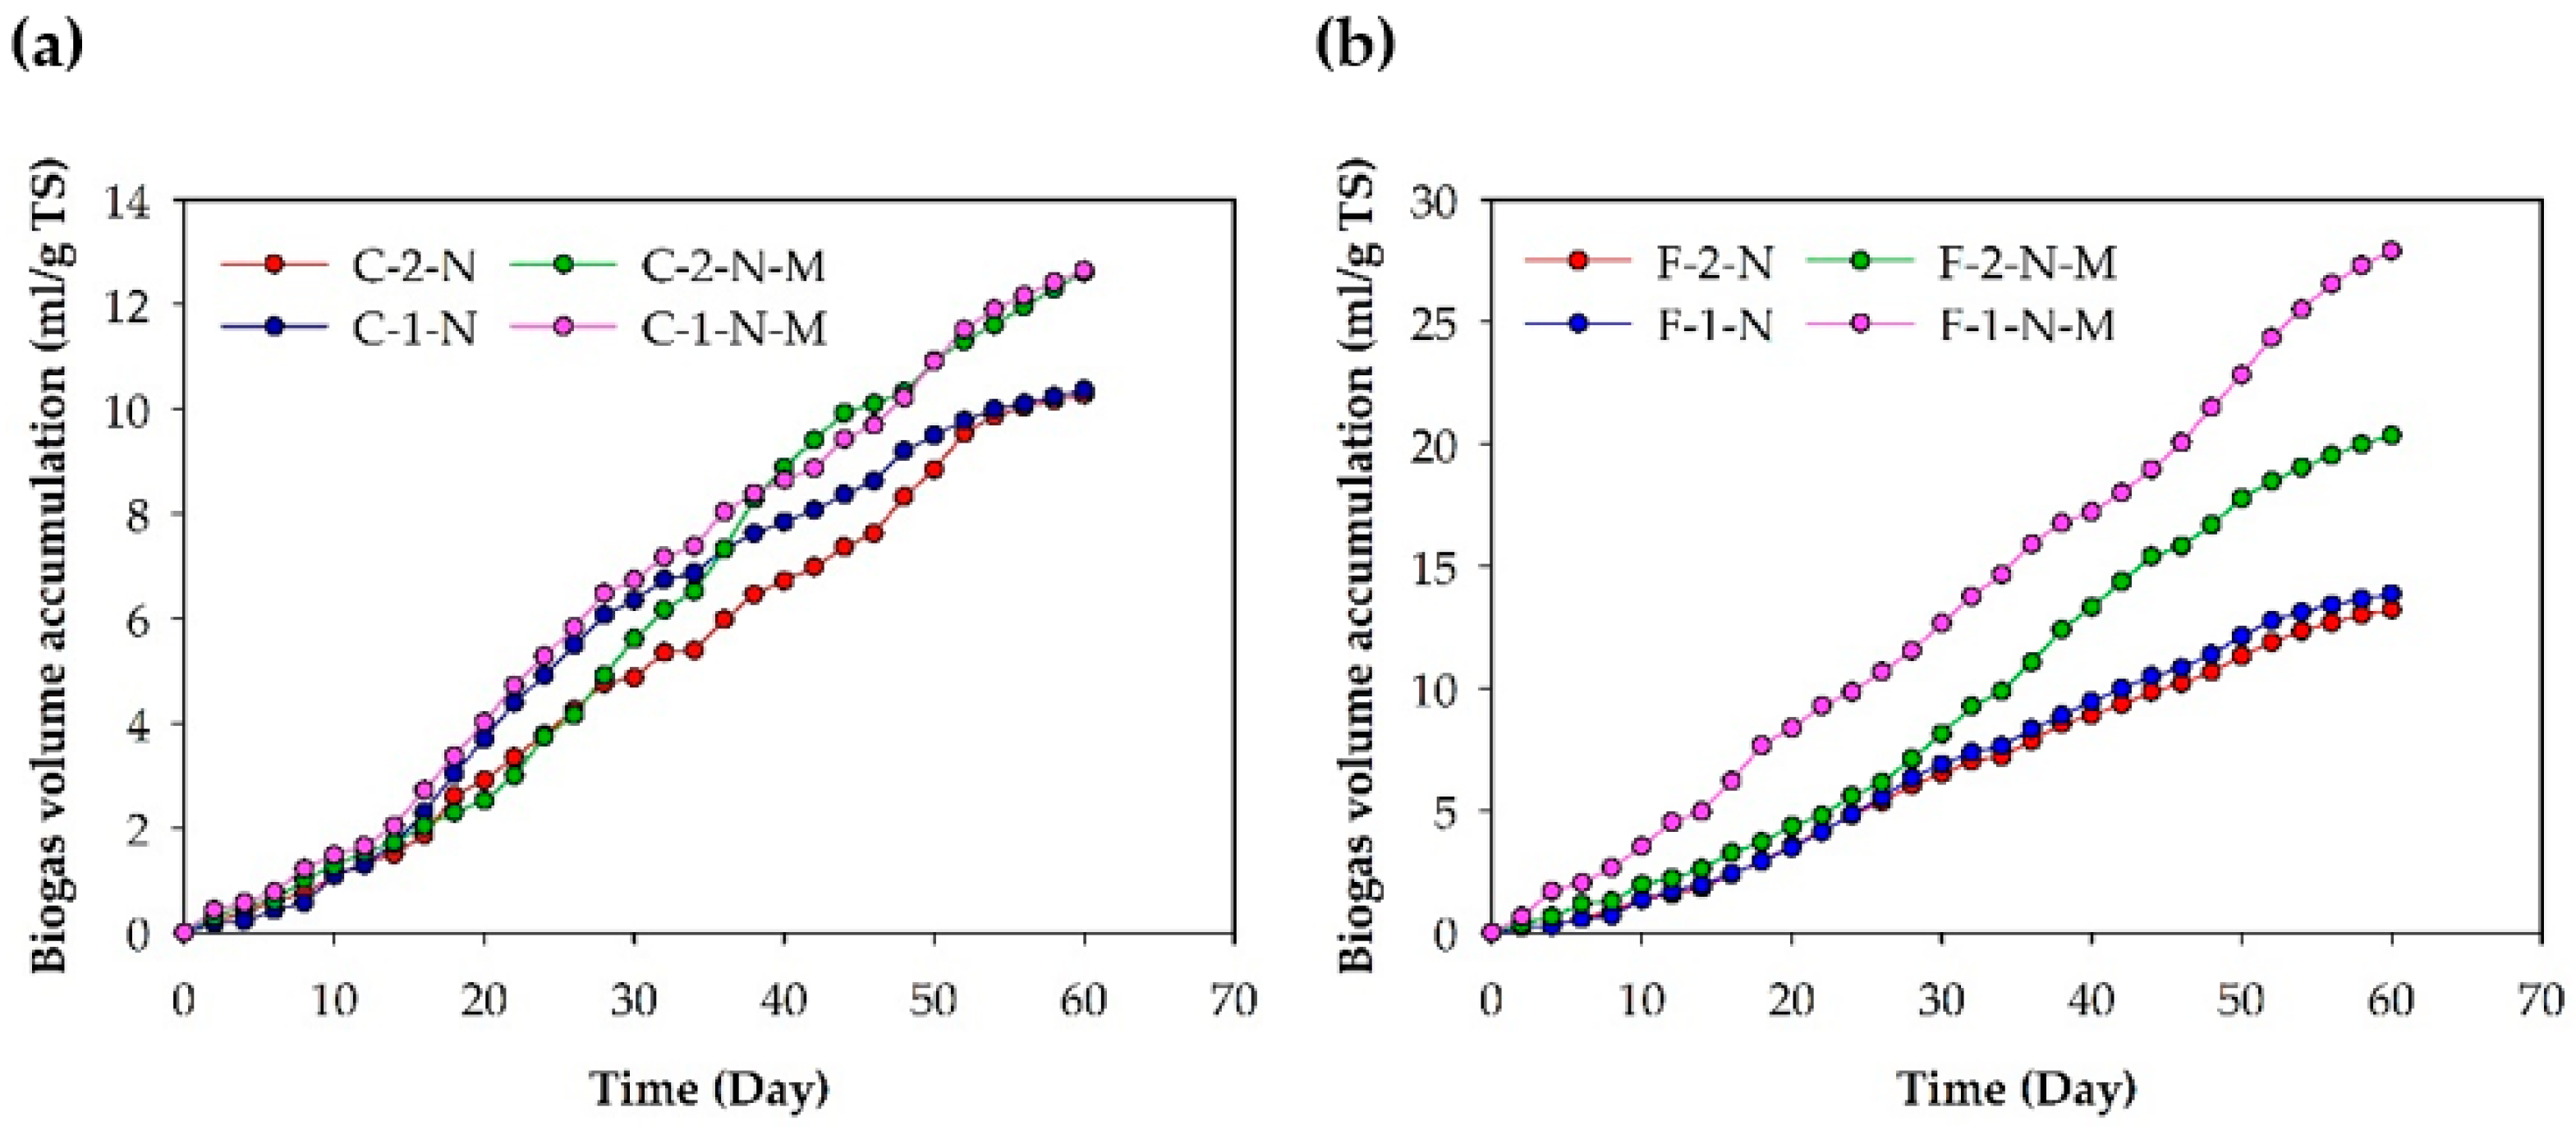
3.1. Effects of NaOH Pretreatment on the Biogas Production

The effects of NaOH addition on the every two days and cumulative biogas productions were assessed in milled (refined) and unrefined sago solid wastes and the wastes treated and untreated with the microbial consortium.
Figure 1a shows that the cumulative biogas volumes obtained from C-2-N and C-1-N are higher than those obtained from C-2 and C-1. The most significant total volume of biogas produced from crude sago solid waste with NaOH pretreatment at a ratio of 1:1 was 10.37 mL/g TS. Additionally, Figure 1b shows the positive effect of NaOH treatment on the cumulative biogas volume. Every two days biogas production is presented in Figure 1c,d, where on day 55 to day 60 simultaneously all variables show a decrease significantly in biogas production. Figure 2a,b show that the presence of a microbial consortium as the control variable with an independent variable in the form of NaOH addition has the same cumulative biogas volume profile without a microbial consortium, which is equally important. Furthermore, the highest volume rate of biogas produced from solid sago waste (27.91 mL/g TS) was obtained by pretreatment with NaOH at a mixing ratio of 1:1.

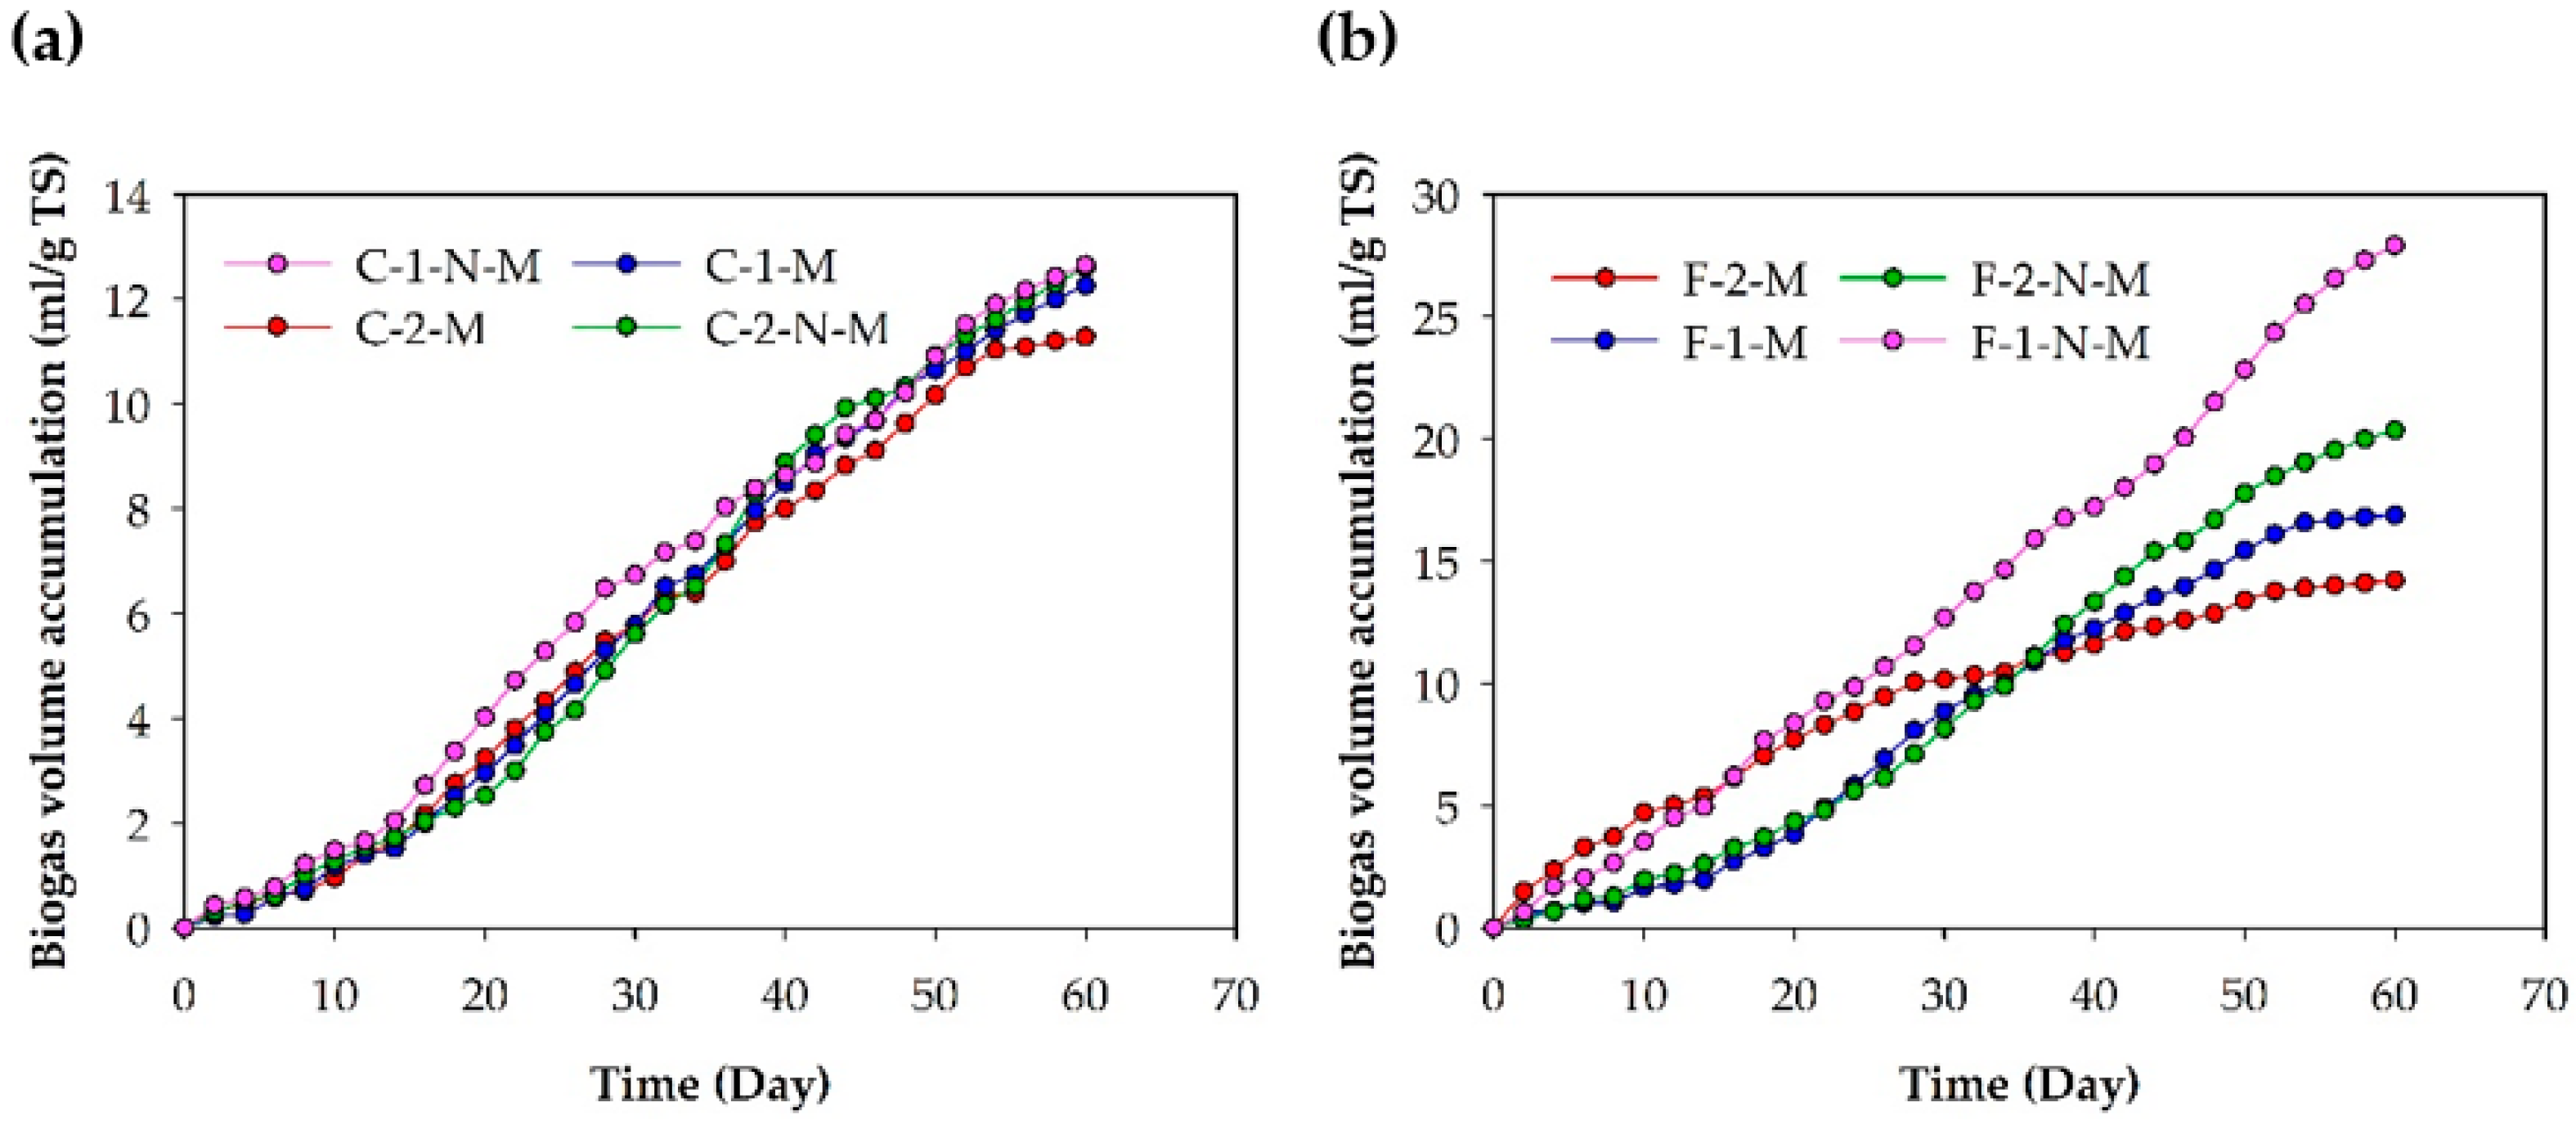
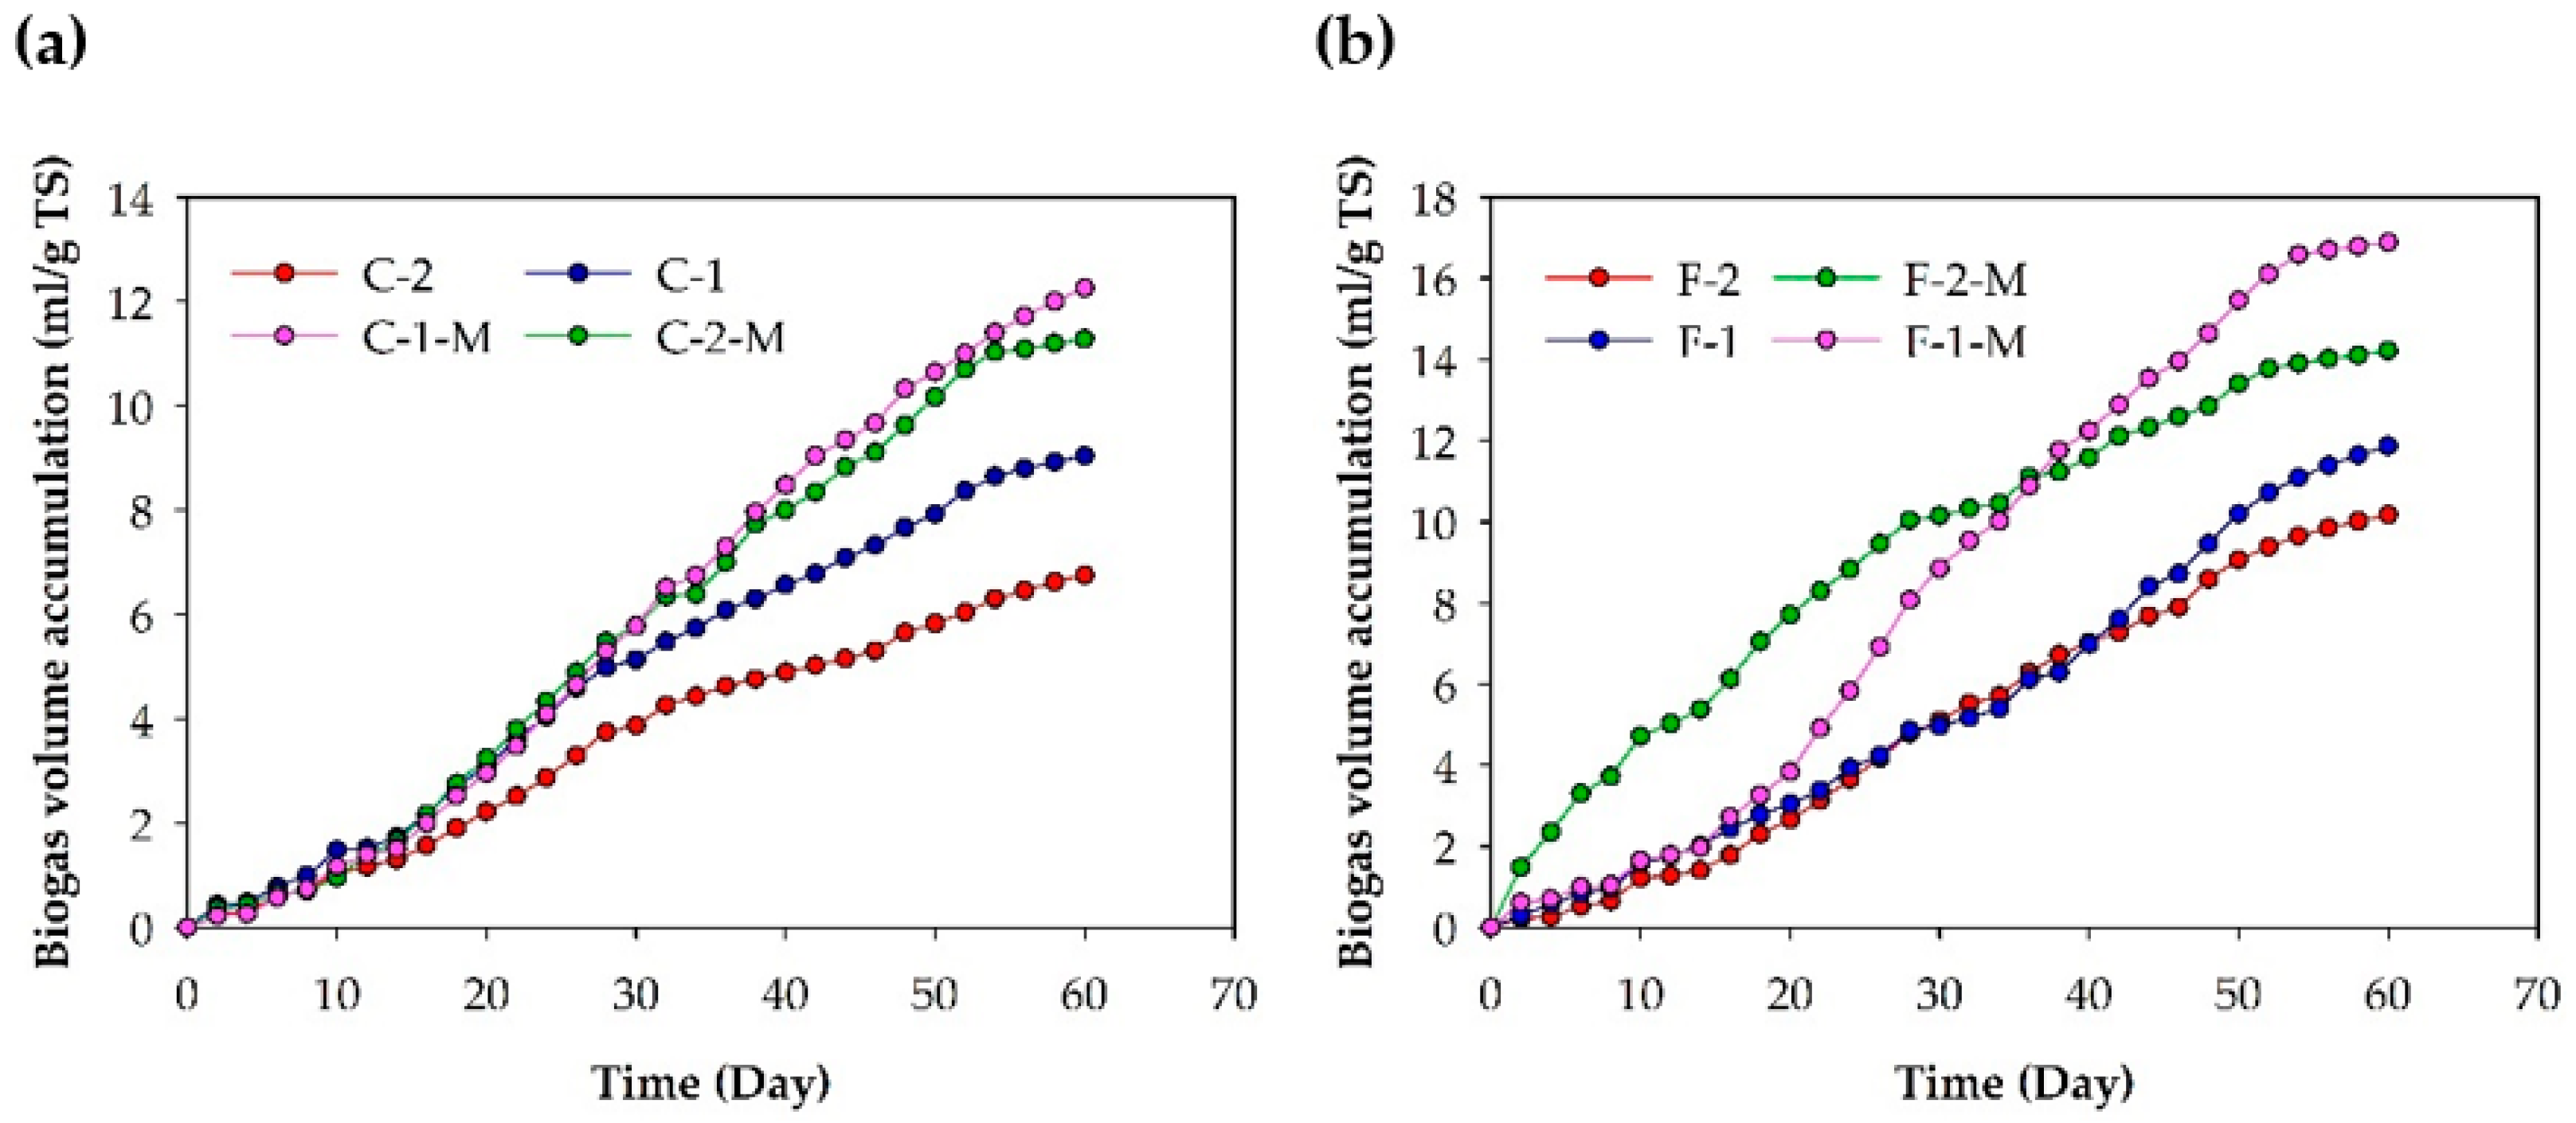
3.2. Effects of Microbial Consortium Addition to Sago Solid Waste on Biogas

The next step was mixing the pretreated sago with the cow rumen solid waste. Additionally, the effect of the biological pretreatment on every two days and cumulative biogas productions was assessed in fine and unground (coarse) sago solid waste treated and untreated with NaOH.
Figure 3a shows that the cumulative biogas volumes from C-2-M and C-1-M were higher than those from C-2 and C-1. The highest total biogas production was produced at a 1:1 mixing ratio and the addition of microbial consortium was 12.26 mL/g TS. At this point, the same phenomenon is observed in Figure 3b, which shows the positive effect of microbial consortium on cumulative biogas production from fine sago solid waste. By comparison, Figure 4a,b show that NaOH treatment did not affect the final cumulative biogas volume. Additionally, the highest biogas volume (27.91 mL/g TS) in this case was produced with the addition of microbial consortium at a 1:1 mixing ratio.

3.3. Effect of Sago Solid Waste Size on Biogas Production

After mixing the physically, chemically, and microbially treated sago waste with cow rumen, the effect of the waste size on the every two days and cumulative biogas production was assessed in the ground (fine) and unground (coarse) sago waste at sago-to-rumen mixing ratios of 1:1 and 2:1.
Figure 5a shows cumulative biogas volume generated using the following variations: coarse sago at mixing ratios of 2:1 and 1:1 as well as fine sago at mixing ratios of 2:1 and 1:1. Summing up all four cases, the total volume of biogas began to increase from day 2 to day 60. Additionally, the highest biogas production (11.87 mL/g TS) was obtained in the case of fine sago at a mixing ratio of 1:1.
Figure 5b shows the effect of NaOH addition on the cumulative biogas volume produced using the following variations: coarse sago solid waste at mixing ratios of 2:1 and 1:1 as well as fine sago at mixing ratios of 2:1 and 1:1. Additionally, the highest total biogas production (13.87 mL/g TS) among these was obtained using fine sago at a ratio of 1:1.
Figure 6a shows the effect of using microbial consortium on the cumulative biogas volume generated using the following variations: coarse sago solid waste at mixing ratios of 2:1 and 1:1 as well as fine sago at mixing ratios of 2:1 1:1. Further, the highest biogas production (16.89 mL/g TS) was produced using fine sago at a mixing ratio of 1:1.
Figure 6b shows the effect of adding both the NaOH and microbial consortium on the total biogas volume generated using the same variations described above. Moreover, the highest total biogas production (27.91 mL/g TS) was obtained using fine sago at a ratio of 1:1.

3.4. Kinetics Model of Biogas Production Rate

Table 2 shows the kinetics data of the digested waste obtained using a nonlinear regression method (Gompertz equation).
Table 2 shows that A ranged from 7.45 to 43.86 mL/g TS. The maximum value (43.86 mL/g TS) was obtained in the experiment where physical pretreatment, the addition of microbial consortium, and NaOH addition were used at a 1:1 mixing ratio of sago solid waste to the rumen.
The lowest U value (0.15 mL/g TS.day) was obtained without using a pretreatment at a 2:1 mixing ratio of sago-to-rumen solid waste, whereas the highest U value (0.54 mL/g TS.day) was obtained with the mixture that underwent physical, chemical, and biological pretreatments at a 1:1 sago-to-rumen ratio.
The shortest (best) and longest (worst) λ, which is the time when the biogas is first formed or increased [23], were obtained at 2 and 12 days, respectively. However, the former was obtained with the mixtures that underwent only physical and biological pretreatment at a 2:1 ratio of sago-to-rumen ratio. In contrast, the latter was obtained with the mixture that underwent all three types of pretreatments at the same sago-to-rumen ratio (2:1).

4. Discussion

Figure 1 and Figure 2 show that the chemical pretreatment using NaOH can separate lignin, hemicellulose, and cellulose, accelerating the microbial decomposition of lignocellulosic biomass. Furthermore, it can reduce the degree of polymerization and crystallinity and destroy the chains between lignin and other polymers [24,25,26]. At this time, NaOH molecules enter the material and break down the lignin structure, which increases its solubility and decreases its levels [27]. Therefore, the chemical pretreatment using NaOH is commonly called the delignification process [28]. According to You et al. [29] and Chen et al. [30], the addition of NaOH for pretreatment during biogas production causes the accumulative biogas volume to increase.
The delignification process causes damage to the structure of lignin and releases carbohydrate compounds [31]. Additionally, destroying the lignocellulosic content structure is one step to convert it into sugar compounds. Furthermore, the delignification process can be used as a preliminary process to prepare the primary raw materials [32]. Thus, sago solid waste treated with NaOH produced more significant quantities of biogas than untreated waste. NaOH pretreatment can significantly increase cellulose breakdown and sugar degradation compared with acid pretreatment [33]. Pretreatment of lignocellulosic material with NaOH solution causes swelling, increased inner surface area, reduced degree of polymerization, reduced crystallinity, separation of structural bonds between carbohydrates and lignin, and breakdown of the lignin structure [34,35].
Figure 3 and Figure 4 show that the cellulose is surrounded by hemicellulose and lignin that act as barriers for cellulose, and hence destroying the structure by removing lignin can enhance cellulose utilization [36,37]. Equally important, the intense bonding within lignocellulose can be disturbed by eliminating most of the lignin, increasing the accessibility of cellulose, which can be further enhanced by pretreatment with a microbial consortium. This was proven by Zhong et al. [38], who used scanning electron microscope analysis to examine wheat straw. Their study demonstrated that structural damage accompanied by an enlargement of the specific surface area can be achieved through this pretreatment and that the structural disruption increases the accessibility of the remaining cellulose (hemicellulose).
The existence of the microbial consortium in biogas production (Figure 4) can be attributed to the microbial activity of the consortium species, including Streptomyces sp., Geobacillus sp., and Trichoderma mushroom [39]. At this point, the function of microorganisms is assumed to be delignification, reduction in the degree of cellulose polymerization, and hydrolysis of hemicellulose. The existence of microbial consortium accelerates the degradation of cellulose, hemicellulose, and lignin into compounds required by biogas-producing microorganisms, which increases biogas production [40,41]. In other words, microbes can change the structure of components and increase enzymatic hydrolysis because the added microorganisms can help the process of hydrolysis of cellulose into glucose [42,43].
Furthermore, Figure 5 and Figure 6 show that the biogas production using fine sago solid waste was better than coarse sago. This can be attributed to the fact that physical pretreatment enhances the enzymatic treatment, especially in lignocellulosic substrates [44]. At this time, physical pretreatment is typically conducted to reduce the size of the substrate by destroying its cell structure. This method aims to increase the biomass-specific surface area, especially the size of the material, which affects its porosity during the delignification process [45]. Additionally, decreasing the particle size breaks the long polymer chains into shorter ones, facilitating the separation of lignin from cellulose bonds [46]. This can be attributed to reducing the cellulose crystallinity and disrupting the lignin protective layer caused by decreasing the particle size. Furthermore, this facilitates the hydrolysis process and increases biogas production [47]. Besides, reducing sago solid waste size can increase the specific surface area and pore size and reduce the degree of cellulose polymerization and crystallinity [32].
The findings given in Table 2 indicate that the physical (grinding), chemical (NaOH addition), and biological (microbial consortium) pretreatments have a considerable effect on the amount of biogas production owing to the degradation of lignin, cellulose, and hemicellulose, which facilitates the hydrolysis of lignocellulosic biomass. In sago solid waste with no pretreatment, the lowest A value was obtained at a 2:1 mixing ratio of sago-to-rumen solid wastes. There was no process to speed up lignocellulose decomposition. Moreover, these results of the lowest U value (Table 2) prove the roles of pretreatment and the sago-to-rumen ratio in accelerating biogas production. The best results were obtained at a 1:1 ratio.
In this study, the rate of the kinetics of the biogas production process was modeled using the Gompertz equation. To conclude, the model’s predicted data were closely correlated with the experimental data. Using physical (±1 mm grinding), chemical (NaOH addition), and biological (microbial consortium addition) pretreatments resulted in the maximum biogas production (U) and potential biogas production (A) from lignocellulosic biomass compared to that obtained using no pretreatment. Additionally, the modification of the Gompertz equation describes the correlation between the total biogas production and residence time [48].

5. Conclusions

The highest cumulative biogas production (27.91 mL/g TS) was generated using milling (±1 mm) of solid sago waste, NaOH pretreatment, and microbial consortium addition at a 1:1 solid sago waste to the rumen. The combination of these variables becomes the best fine solid powder which causes the surface area to increase, and the presence of NaOH causes lignin and hemicellulose to break down. In addition, the microbial consortium, which consists of microorganisms, creates a synergistic process to produce high biogas.
The waste mixture that underwent the three types of pretreatments had the maximum values of A, U, and λ (43.86 mL/g TS; 0.54 mL/g TS.day; and 7.11 days, respectively). Sago solid waste that was not subjected to any preliminary treatment had A, U, and λ values of 7.45 mL/g TS; 0.15 mL/g TS.day, and 5.16 days, respectively.

Author Contributions

Conceptualization, S.S., B.B.; methodology, S.S., B.B.; software, M.H., G.A.; validation, S.S., B.B., H.C.; formal analysis, S.S., B.B.; investigation, S.S., M.H., G.A.; resources, S.S., B.B.; data curation, S.S., M.H.; writing—original draft preparation, S.S., M.H., G.A.; writing—review and editing, S.S., H.C.; visualization, H.C., G.A.; supervision, S.S., B.B.; project administration, S.S., H.C.; funding acquisition, S.S. All authors have read and agreed to the published version of the manuscript.

Funding

This research was funded by Faculty of Engineering, Universitas Diponegoro through the scheme of Research Strategic 2019 No. 167/UN7.5.3/HK/2019.

Institutional Review Board Statement

Not applicable.

Informed Consent Statement

Not applicable.

Data Availability Statement

The datasets generated during and/or analyzed during the current study are available from the corresponding author on reasonable request.

Acknowledgments

The authors would like to thank the Faculty of Engineering, Universitas Diponegoro through the Research Strategic 2019 Scheme and the Department of Chemical Engineering, Faculty of Engineering, Universitas Diponegoro for allowing us to use the laboratory.

Conflicts of Interest

The authors declare no conflict of interest related to this research.

References

  1. Hagos, K.; Zong, J.; Li, D.; Liu, C.; Lu, X. Anaerobic co-digestion process for biogas production: Progress, challenges and perspectives. Renew. Sustain. Energy Rev. 2017, 76, 1485–1496. [Google Scholar] [CrossRef]
  2. Al-Zuhairi, F.; Micoli, L.; Florio, C.; Ausiello, A.; Turco, M.; Pirozzi, D.; Toscano, G. Anaerobic co-digestion of municipal solid wastes with giant reed under mesophilic conditions. J. Mater. Cycles Waste Manag. 2019, 21, 1332–1340. [Google Scholar] [CrossRef]
  3. Jonsson, S.; Westman, J. Cryogenic Biogas Upgrading Using Plate Heat Exchangers. Master’s Thesis, Department of Energy and Environment, Division of Energy Technology, Chalmers Universityof Technology, Göteborg, Sweden, 2011; p. 76. [Google Scholar]
  4. Yavini, T.D.; Silas, K.; Grema, M.B.; Luria, J.A. Kinetic study of agricultural wastes conversion to biogas using cow dung/poultry droppings as inoculums. IOSR J. Environ. Sci. Toxicol. Food Technol. 2014, 8, 46–51. [Google Scholar] [CrossRef]
  5. Putri, D.A.; Saputro, R.R.; Budiyono, B. Biogas Production from cow manure. Int. J. Renew. Energy Dev. 2012, 1, 61–64. [Google Scholar] [CrossRef]
  6. Li, Y.; Li, Y.; Zhang, D.; Li, G.; Lu, J.; Li, S. Solid state anaerobic co-digestion of tomato residues with dairy manure and corn stover for biogas production. Bioresour. Technol. 2016, 217, 50–55. [Google Scholar] [CrossRef]
  7. Dobre, P.; Nicolae, F.; Matei, F. Main factors affecting biogas production—An overview. Rom. Biotechnol. Lett. 2014, 19, 9283–9296. [Google Scholar]
  8. Rodriguez, C.; Alaswad, A.; Benyounis, K.Y.; Olabi, A.G. Pretreatment techniques used in biogas production from grass. Renew. Sustain. Energy Rev. 2017, 68, 1193–1204. [Google Scholar] [CrossRef] [Green Version]
  9. Tedesco, S.; Benyounis, K.Y.; Olabi, A.G. Mechanical pretreatment effects on macroalgae-derived biogas production in co-digestion with sludge in Ireland. Energy 2013, 61, 27–33. [Google Scholar] [CrossRef]
  10. Kim, I.; Han, J.I. Optimization of alkaline pretreatment conditions for enhancing glucose yield of rice straw by response surface methodology. Biomass Bioenergy 2012, 46, 210–217. [Google Scholar] [CrossRef]
  11. Zhao, R.; Zhang, Z.; Zhang, R.; Li, M.; Lei, Z.; Utsumi, M.; Sugiura, N. Methane production from rice straw pretreated by a mixture of acetic–propionic acid. Bioresour. Technol. 2010, 101, 990–994. [Google Scholar] [CrossRef]
  12. Brown, D.; Shi, J.; Li, Y. Comparison of Solid-State to Liquid Anaerobic Digestion of Lignocellulosic Feedstocks for Biogas Production. Bioresour. Technol. 2012, 124, 379–386. [Google Scholar] [CrossRef] [PubMed]
  13. Yang, L.; Xu, F.; Ge, X.; Li, Y. Challenges and strategies for solid-state anaerobic digestion of lignocellulosic biomass. Renew. Sustain. Energy Rev. 2015, 44, 824–834. [Google Scholar] [CrossRef]
  14. Li, Y.; Park, S.Y.; Zhu, J. Solid-state anaerobic digestion for methane production from organic waste. Renew. Sustain. Energy Rev. 2011, 15, 821–826. [Google Scholar] [CrossRef]
  15. Heiske, S.; Jurgutis, L.; Kádár, Z. Evaluation of novel inoculation strategies for solid state anaerobic digestion of yam peelings in low-tech digesters. Energies 2015, 8, 1802–1816. [Google Scholar] [CrossRef] [Green Version]
  16. Sumardiono, S.; Widiasa, I.N.; Matin, H.H.A. Long term stability test of biogas production from cattle manure using rumen fluid as inoculum. Adv. Sci. Lett. 2018, 24, 9559–9562. [Google Scholar]
  17. Wicaksono, A.; Rahmawan, A.; Matin, H.H.A.; Wardani, L.G.K.; Kusworo, D.T.; Sumardiono, S. The effect of pretreatment using sodium hydroxide and acetic acid to biogas production from rice straw waste. MATEC Web. Conf. 2017, 101, 02011. [Google Scholar]
  18. Sumardiono, S.; Mardiani, D.T. The effect of microwave power and heating time pretreatment on biogas production from fresh and dried water hyacinth (Eichhornia crassipes). AIP Conf. Proc. 2015, 1699, 050018. [Google Scholar]
  19. Sumardiono, S.; Riyanta, A.B.; Matin, H.H.A.; Kusworo, D.T.; Jos, B.; Budiyono. Increasing biogas production from sugar cane baggase by anaerobic co-digestion with animal manure. MATEC Web. Conf. 2017, 101, 02014. [Google Scholar] [CrossRef] [Green Version]
  20. Prasetyo, T.; Sumardiono, S.; Aji, H.A.; Pratama, A.Y. Effect of C/N Ratio and pH on biogas production from industrial cassava starch wastewater through anaerobic process. Adv. Sci. Lett. 2017, 23, 5810–5814. [Google Scholar] [CrossRef]
  21. Nopharatana, A.; Pullammanappallil, P.C.; Clarke, W.P. Kinetics and dynamic modelling of batch anaerobic digestion of municipal solid waste in a stirred reactor. Waste Manag. 2007, 27, 595–603. [Google Scholar] [CrossRef]
  22. Adiga, S.; Ramya, R.; Shankar, B.B.; Patil, J.H.; Geetha, C.R. Kinetics of anaerobic digestion of Water Hyacinth, poultry litter, cow manure and primary sludge: A comparative study. Int. Proc. Chem. Biol. Environ. Eng. 2012, 42, 73–78. [Google Scholar]
  23. Yono, B.; Syaichurrozi, I.; Sumardiono, S. Biogas production kinetic from vinasse waste in batch mode anaerobic digestion. World Appl. Sci. J. 2013, 26, 1464–1472. [Google Scholar]
  24. He, Y.; Pang, Y.; Liu, Y.; Li, X.; Wang, K. Physicochemical characterization of rice straw pretreated with sodium hydroxide in the solid state for enhancing biogas production. Energy Fuels 2008, 22, 2775–2781. [Google Scholar] [CrossRef]
  25. He, Y.; Pang, Y.; Li, X.; Liu, Y.; Li, R.; Zheng, M. Investigation on the changes of main compositions and extractives of rice straw pretreated with sodium hydroxide for biogas production. Energy Fuels 2009, 23, 2220–2224. [Google Scholar] [CrossRef]
  26. Zheng, Y.; Zhao, J.; Xu, F.; Li, Y. Pretreatment of lignocellulosic biomass for enhanced biogas production. Prog. Energy Combust. Sci. 2014, 42, 35–53. [Google Scholar] [CrossRef]
  27. Sumardiono, S.; Matin, H.H.A.; Widiasa, I.N. Optimization of Total Solid (TS), temperature, and rumen fluid content during biogas production from cattle manure using response surface methodology. Adv. Sci. Lett. 2018, 24, 9791–9793. [Google Scholar] [CrossRef]
  28. Kumar, P.; Barrett, D.M.; Delwiche, M.J.; Stroeve, P. Methods for pretreatment of lignocellulosic biomass for efficient hydrolysis and biofuel production. Ind. Eng. Chem. Res. 2009, 48, 3713–3729. [Google Scholar] [CrossRef]
  29. You, Z.; Pan, S.Y.; Sun, N.; Kim, H.; Chiang, P.C. Enhanced corn-stover fermentation for biogas production by NaOH pretreatment with CaO additive and ultrasound. J. Clean. Prod. 2019, 238, 117813. [Google Scholar] [CrossRef]
  30. Chen, G.; Chang, Z.; Zheng, Z. Feasibility of NaOH-treatment for improving biogas production of digested Spartina alterniflora. Int. Biodeterior. Biodegrad. 2014, 93, 131–137. [Google Scholar] [CrossRef]
  31. Zheng, Y.; Pan, Z.; Zhang, R. Overview of biomass pretreatment for cellulosic ethanol production. Int. J. Agric. Biol. Eng. 2009, 2, 51. [Google Scholar]
  32. Taherzadeh, M.J.; Karimi, K. Pretreatment of lignocellulosic wastes to improve ethanol and biogas production: A review. Int. J. Mol. Sci. 2008, 9, 1621–1651. [Google Scholar] [CrossRef] [PubMed] [Green Version]
  33. Talebnia, F.; Karakashev, D.; Angelidaki, I. Production of bioethanol from wheat straw: An overview on pretreatment, hydrolysis and fermentation. Bioresour. Technol. 2010, 101, 4744–4753. [Google Scholar] [CrossRef] [PubMed]
  34. Wardhani, D.H.; Cahyono, H.; Dwinanda, M.F.H.; Nabila, P.R.; Aryanti, N.; Pangestuti, D.R. Effect of KOH as deacetylation agent on physicochemical properties of glucomannan. J. Phys. Conf. Ser. 2019, 1295, 012037. [Google Scholar] [CrossRef]
  35. Abraham, A.; Mathew, A.K.; Park, H.; Choi, O.; Sindhu, R.; Parameswaran, B.; Pandey, A.; Park, J.H.; Sang, B.I. Pretreatment strategies for enhanced biogas production from lignocellulosic biomass. Bioresour. Technol. 2020, 301, 122725. [Google Scholar] [CrossRef] [PubMed]
  36. Berlin, A.; Balakshin, M.; Gilkes, N.; Kadla, J.; Maximenko, V.; Kubo, S.; Saddler, J. Inhibition of cellulase, xylanase and β-glucosidase activities by softwood lignin preparations. J. Biotechnol. 2006, 125, 198–209. [Google Scholar] [CrossRef] [PubMed]
  37. Rahikainen, J.L.; Martin-Sampedro, R.; Heikkinen, H.; Rovio, S.; Marjamaa, K.; Tamminen, T.; Rojas, O.J.; Kruus, K. Inhibitory effect of lignin during cellulose bioconversion: The effect of lignin chemistry on non-productive enzyme adsorption. Bioresour. Technol. 2013, 133, 270–278. [Google Scholar] [CrossRef]
  38. Zhong, C.; Wang, C.; Wang, F.; Jia, H.; Wei, P.; Zhao, Y. Enhanced biogas production from wheat straw with the application of synergistic microbial consortium pretreatment. RSC Adv. 2016, 6, 60187–60195. [Google Scholar] [CrossRef]
  39. Tuesorn, S.; Wongwilaiwalin, S.; Champreda, V.; Leethochawalit, M.; Nopharatana, A.; Techkarnjanaruk, S.; Chaiprasert, P. Enhancement of biogas production from swine manure by a lignocellulolytic microbial consortium. Bioresour. Technol. 2013, 144, 579–586. [Google Scholar] [CrossRef]
  40. Yuan, X.; Cao, Y.; Li, J.; Wen, B.; Zhu, W.; Wang, X.; Cui, Z. Effect of pretreatment by a microbial consortium on methane production of waste paper and cardboard. Bioresour. Technol. 2012, 118, 281–288. [Google Scholar] [CrossRef]
  41. Zhang, Q.; He, J.; Tian, M.; Mao, Z.; Tang, L.; Zhang, J.; Zhang, H. Enhancement of methane production from cassava residues by biological pretreatment using a constructed microbial consortium. Bioresour. Technol. 2011, 102, 8899–8906. [Google Scholar] [CrossRef]
  42. Taniguchi, M.; Suzuki, H.; Watanabe, D.; Sakai, K.; Hoshino, K.; Tanaka, T. Evaluation of pretreatment with Pleurotus ostreatus for enzymatic hydrolysis of rice straw. J. Biosci. Bioeng. 2005, 100, 637–643. [Google Scholar] [CrossRef]
  43. Kurakake, M.; Ide, N.; Komaki, T. Biological pretreatment with two bacterial strains for enzymatic hydrolysis of office paper. Curr. Microbiol. 2007, 54, 424–428. [Google Scholar] [CrossRef]
  44. Montgomery, L.F.R.; Bochmann, G. Pretreatment of Feedstock for Enhanced Biogas Production; IEA Bioenergy: Tulln, Austria, 2014; Available online: https://www.iea-biogas.net/files/daten-redaktion/download/Technical%20Brochures/pretreatment_web.pdf (accessed on 7 January 2021).
  45. Sun, Y.; Cheng, J. Hydrolysis of lignocellulosic materials for ethanol production: A review. Bioresour. Technol. 2002, 83, 1–11. [Google Scholar] [CrossRef]
  46. Sumardiono, S.; Sari, A.R.; Santoso, H.M.; Jos, B.; Pudjihastuti, I. Production of Biobuthanol from Various Lignocellulose Waste With Clostridium Acetobutylicum Bacteria Using ABE (acetone-buthanol-ethanol) Fermentation. AIP Conf. Proc. 2020, 2197, 030012. [Google Scholar]
  47. Li, H.; Saeed, A.; Jahan, M.S.; Ni, Y.; van Heiningen, A. Hemicellulose removal from hardwood chips in the pre-hydrolysis step of the kraft-based dissolving pulp production process. J. Wood Chem. Technol. 2010, 30, 48–60. [Google Scholar] [CrossRef]
  48. Syaichurrozi, I.; Sumardiono, S. Effect of total solid content to biogas production rate from Vinasse. Int. J. Eng. Trans. B 2014, 27, 177–184. [Google Scholar]
Figure 1. Biogas production of (a,c)coarse and (b,d) fine sago solid waste with and without NaOH treatment for ratios of sago solid waste:rumen of 2:1 and 1:1.
Sustainability 13 07491 g001
Figure 2. Total biogas production of (a) coarse and (b) fine sago solid wastes treated by the microbial consortium with and without NaOH addition at sago solid waste: rumen mixing ratios of 2:1 and 1:1.
Sustainability 13 07491 g002
Figure 3. Total biogas production of (a) coarse and (b) fine sago solid wastes treated by with and without the microbial consortium addition at sago solid waste: rumen mixing ratios of 2:1 and 1:1.
Sustainability 13 07491 g003
Figure 4. Total biogas production of NaOH-treated (a) coarse and (b) fine sago solid wastes with and without microbial consortium addition at sago solid waste: rumen ratios of 2:1 and 1:1.
Sustainability 13 07491 g004
Figure 5. Total production of biogas at sago solid waste: rumen ratios of 2:1 and 1:1 (a) without and (b) with NaOH pretreatment.
Sustainability 13 07491 g005
Figure 6. Total production of biogas at sago solid waste: rumen ratios of 2:1 and 1:1 (with microbial consortium) (a) without and (b) with NaOH pretreatment.
Sustainability 13 07491 g006
Table 1. Sample variants were used in this study.
Digester CodeSize SubstrateMicrobial Consortium
(v/v)
NaOH
(g/g TS)
Ratio of
Sago Solid Waste
and Rumen
C-1Coarse--1:1
C-2Coarse--2:1
C-1-NCoarse-4%1:1
C-2-NCoarse-4%2:1
C-1-MCoarse5%-1:1
C-2-MCoarse5%-2:1
C-1-N-MCoarse5%4%1:1
C-2-N-MCoarse5%4%2:1
F-1Fine--1:1
F-2Fine--2:1
F-1-NFine-4%1:1
F-2-NFine-4%2:1
F-1-MFine5%-1:1
F-2-MFine5% 2:1
F-1-N-MFine5%4%1:1
F-2-N-MFine5%4%2:1
Table 2. The kinetics data of the biogas production process obtained using the Gompertz equation 1.
Digester CodeA
(mL/g TS)
U
(mL/g TS.Day)
λ (Day)
C-17.450.155.16
C-210.350.204.73
C-1-N14.170.228.02
C-2-N10.870.287.32
C-1-M13.790.268.27
C-2-M14.980.299.88
C-1-N-M16.030.3010.95
C-2-N-M15.030.276.09
F-112.610.238.65
F-222.920.2511.00
F-1-N16.500.298.57
F-2-N17.230.329.27
F-1-M14.810.332.56
F-2-M20.040.4310.20
F-1-N-M29.180.4712.07
F-2-N-M43.860.547.11
1 A: maximum biogas production, U: maximum biogas production rate constant, and λ: long lag phase.
Publisher’s Note: MDPI stays neutral with regard to jurisdictional claims in published maps and institutional affiliations.

