
Influence of Tree Canopy Coverage and Leaf Area Density on Urban Heat Island Mitigation


Department of Architectural Engineering, Kyung Hee University, 1732 Deogyeongdaero, Giheung-gu, Yongin-si 17104, Gyeonggi-do, Korea
*
Author to whom correspondence should be addressed.
Sustainability 2021, 13(13), 7496; https://0-doi-org.brum.beds.ac.uk/10.3390/su13137496
Submission received: 4 May 2021
/
Revised: 29 June 2021
/
Accepted: 1 July 2021
/
Published: 5 July 2021
(This article belongs to the Special Issue The Nexus of Thermal Comfort, Energy Use and Air Quality)
Abstract
:Urban heat islands (UHI) are a widely documented phenomenon that adversely increases urban overheating and, among other effects, contributes to heat-related mortalities and morbidities in urban areas. Consequently, comprehensive UHI-mitigating measures are essential for improving urban microclimate environments and contributing to salutogenic urban design practices. This study proposed urban cooling strategies involving different tree percentages and leaf area densities in a dense urban area during the summertime in Korea. The cooling effects of sixteen various combinations of proposed scenarios based on common urban tree types were studied via in-situ field measurements and numerical modeling, considering both vegetated and exposed areas. It was observed that by changing the characteristics of the leaf area density (LAD) per plant of our vegetated base area—for instance, from 4% trees to 60% trees, from a low LAD to a high LAD—the daily average and daily maximum temperatures were reduced by approximately 3 °C and 5.23 °C, respectively. The obtained results demonstrate the usefulness of urban trees to mitigate urban heating, and they are particularly useful to urban designers and policymakers in their efforts to minimize UHI effects.
1. Introduction
Increased urbanization and population densities result in urban heat islands (UHI). UHI is a phenomenon in which the temperature in urban areas is considerably higher than that in rural areas or the urban peripheries [1,2,3]. The causes of UHI are well documented in the literature [4]. The fundamental drivers of UHI are related to (i) increased anthropogenic activities, particularly those related to space cooling in buildings; (ii) reduced convective heat losses as a result of the high-absorptance materials prevalent in urban areas; (iii) condensed infrastructure that modulates wind flows and radiative heat exchanges, which inherently modulate the thermal structure in urban areas. The effects of UHI are also well documented for major global cities in the world [5,6,7,8]. For instance, Santamouris et al. estimated an increase in the global electricity demand of up to 8.5% for a unit increase in temperature [9]. UHI is also linked to increased heat-related mortalities and morbidities in urban areas, especially during heat wave periods [10,11,12,13].
In order to mitigate the UHI-related effects discussed above, urban greenery, surface reflectance modifications, or a combination of both strategies (i.e., urban greenery and surface reflectance) have been proposed in the past [14,15,16]. The presence of greenery improves microclimates through various complex mechanisms that can be subtly summarized into three fundamental processes: (i) reduced solar insolation by building components as a result of solar shading; (ii) reduced long-wave exchanges among urban infrastructural elements as a result of solar blockage; and (iii) reduced dry-bulb temperature and increased latent cooling as a result of increased evapotranspiration. The effect of greenery on temperature reduction and microclimates has been quantified in various climates through field measurements and numerical modeling up until the present. For example, the result of a recent literature review by Santamouris et al. indicated that adding additional trees inside an urban canopy layer results in an air temperature reduction in the range of 0.1 °C and 5 °C [17]. Furthermore, in another review study, the potential cooling effect of trees in an urban environment was documented [18]; the conclusion of the investigations showed that more trees resulted in a maximum air temperature reduction in the range of 0.2 °C and 5 °C.
It is, however, essential to note that the specific ability of trees to reduce urban temperature is mostly dependent on a number of factors mainly related to the characteristics of said trees, such as the number of trees, the leaf density and the shape of the crown. The importance of the tree characteristics was demonstrated in various previous studies. For instance, Shinzato et al. reported air temperature reductions of 1.3 °C and surface temperature reductions of 14.7 °C, which were attributable to LAD’s maximization [19]. A similar study reported 84% solar radiation blockage as a result of maximizing the LAD [20]. However, there exists a lack of investigations about the value of the achieved potential cooling for various levels of LADs [21].
In addition previous studies have shown that a combination of highly reflective materials and vegetation is the most effective way to reduce the microclimatic air temperature [18]. For instance, Salata et al. reported 2.5 °C further reductions in air temperature attributed to the combined employment of cool pavements and urban vegetation instead of single strategies [22]. Wang et al. reported that by changing the surface albedo from 0.2 to 0.4 and increasing the greenery by up to 10%, the maximum air temperature was reduced by 1 °C, and the mean air temperature was reduced by 0.75 °C [23]. Huynh et al. found that replacing asphalt materials with concrete materials and increasing the number of trees in an urban area decreased the maximum air temperature by 0.6 °C [24]. Similarly, Alchapar et al. found that by increasing the reflectivity of the pavement and, at the same time, increasing the surrounding greenery, the daily maximum air temperature was reduced by 3.5 °C compared to the original conditions [25]. Another study observed daily maximum air temperature reductions of 3.5 °C and daily average air temperature reductions of 1.5 °C resulting from the use of cool pavements (instead of asphalt) and the presence of mature deciduous trees [26].
As we discussed above, greenery and highly reflective materials play a prominent role in urban cooling. However, achieving the optimized cooling results in urban areas through said methods is rather challenging, mainly because of the peculiarity in morphology and land-use patterns of many urban areas. Consequently, urban cooling strategies should be optimized, considering local climatic conditions and a given locality’s topography. Korea is a unique country with various hot spots that are susceptible to overheating resulting from UHI. This overheating is likely to increase, given the steady increase in Korea’s urban development and population density, which exacerbate anthropogenic heat release [27,28]. As such, UHI-mitigation measures are necessary to mitigate the discussed UHI effects.
To that end, through a case study of a hot spot street canyon, we studied the cooling effect of sixteen various tree percentage combinations, LAD, and surface albedo modification. The analysis was conducted via in-situ field measurements and numerical modeling. The objectives were to quantify said scenarios’ cooling effects, and to propose an optimized cooling strategy for hot spots in Korea. Our findings demonstrate the usefulness of urban trees’ and surface albedos’ specific characteristics to mitigate urban overheating, and they are particularly useful to urban designers and policymakers in Korea in their efforts to curb the effects of UHI.
2. Materials and Methods
2.1. Site Location and Field Measurements
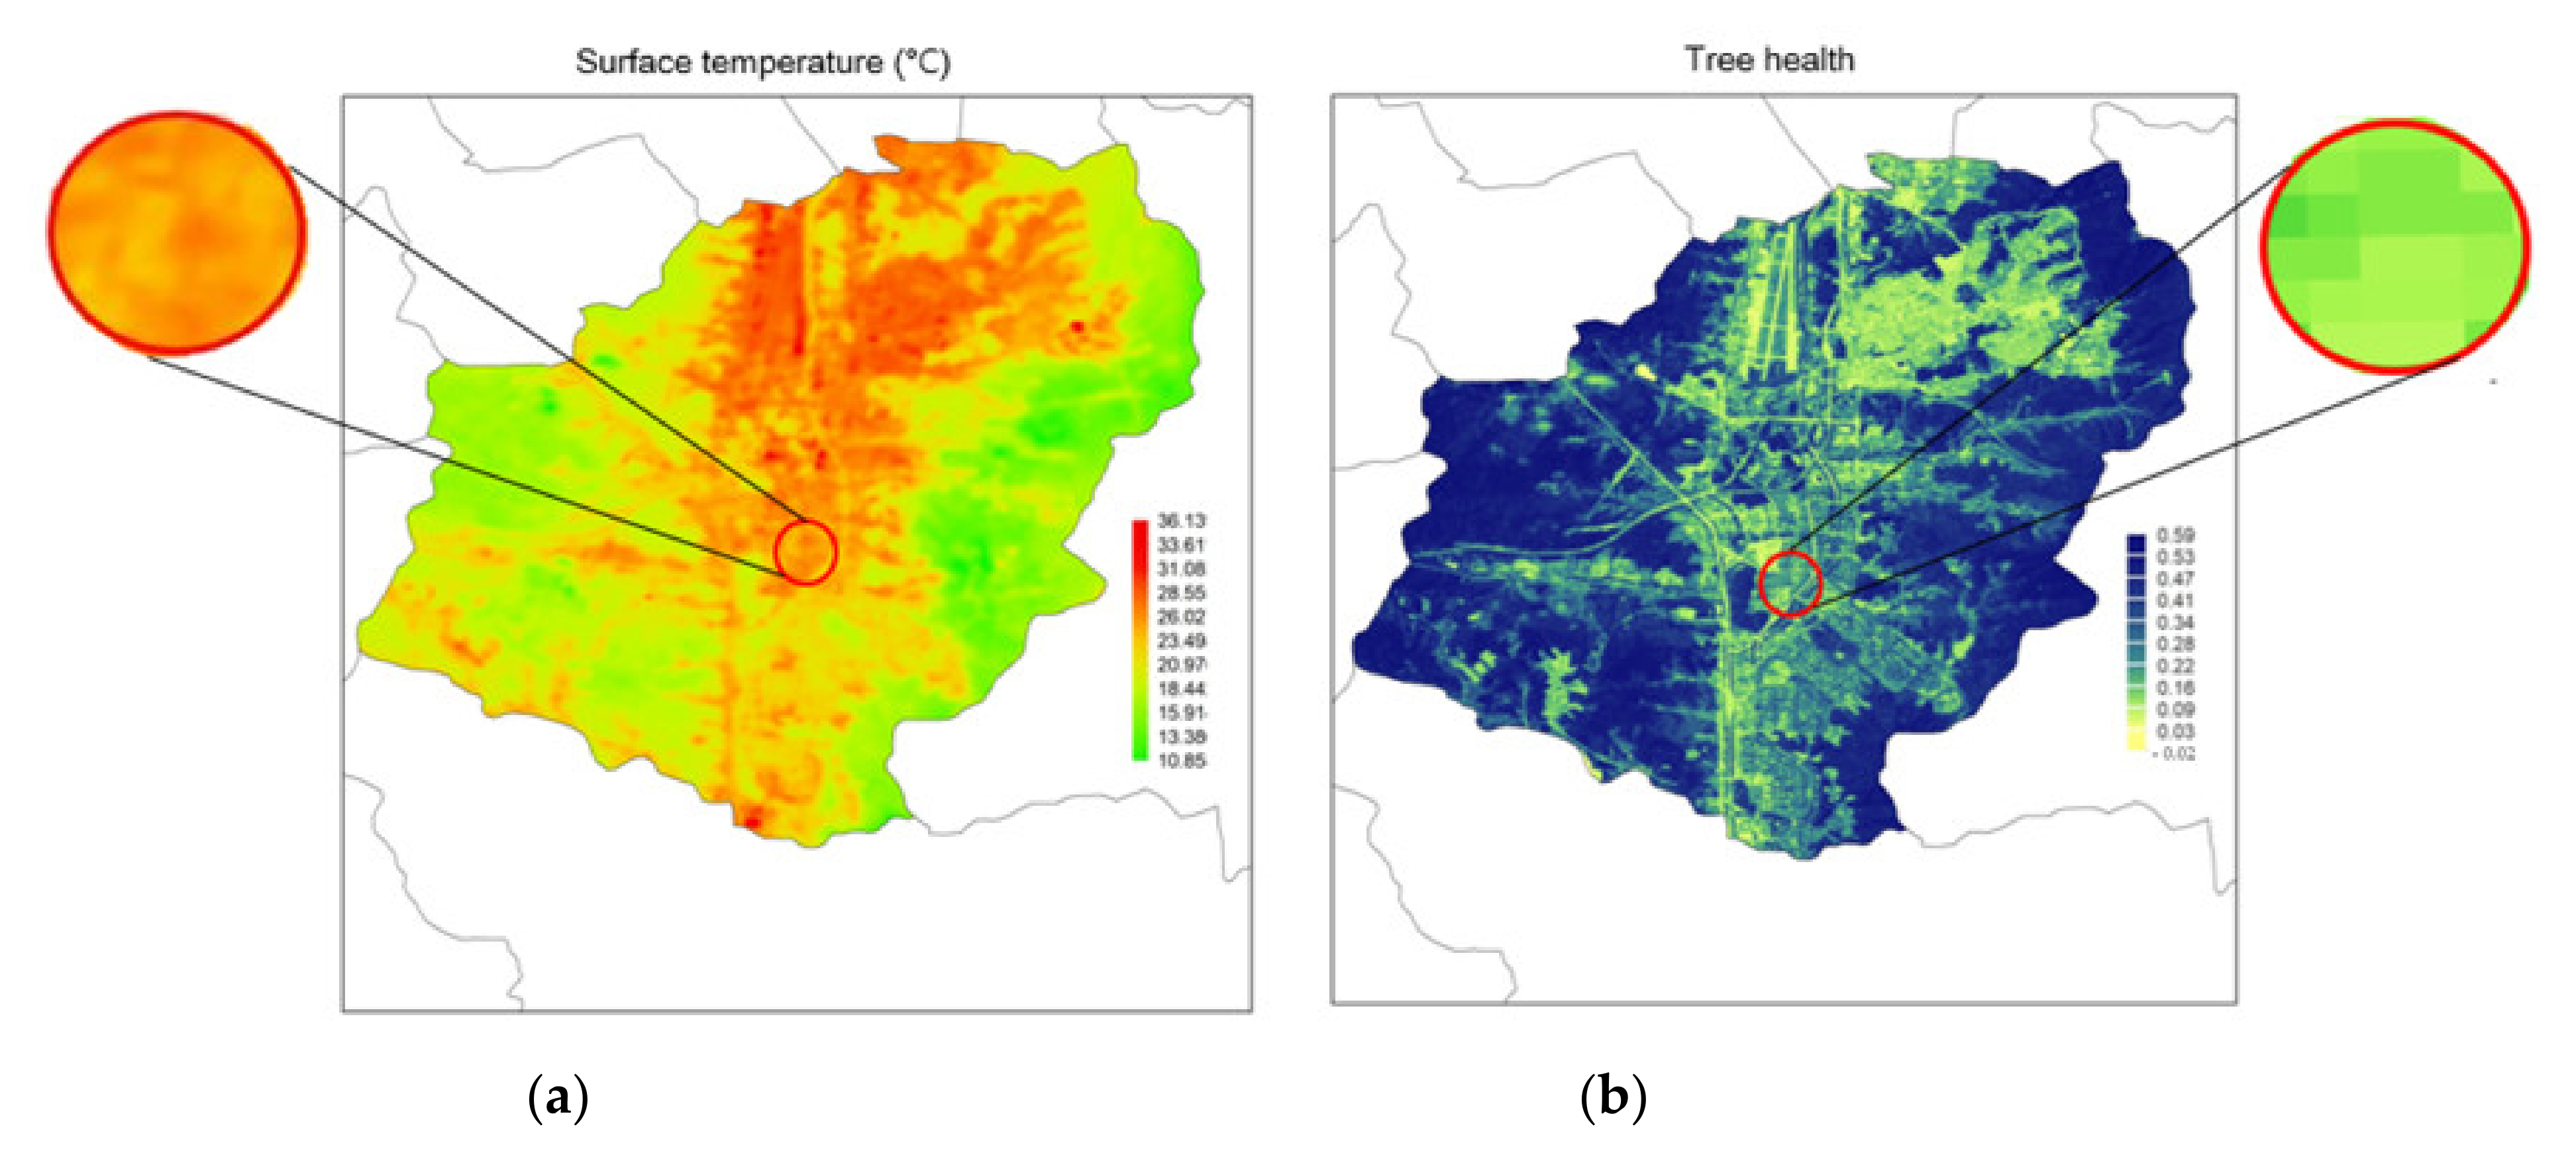
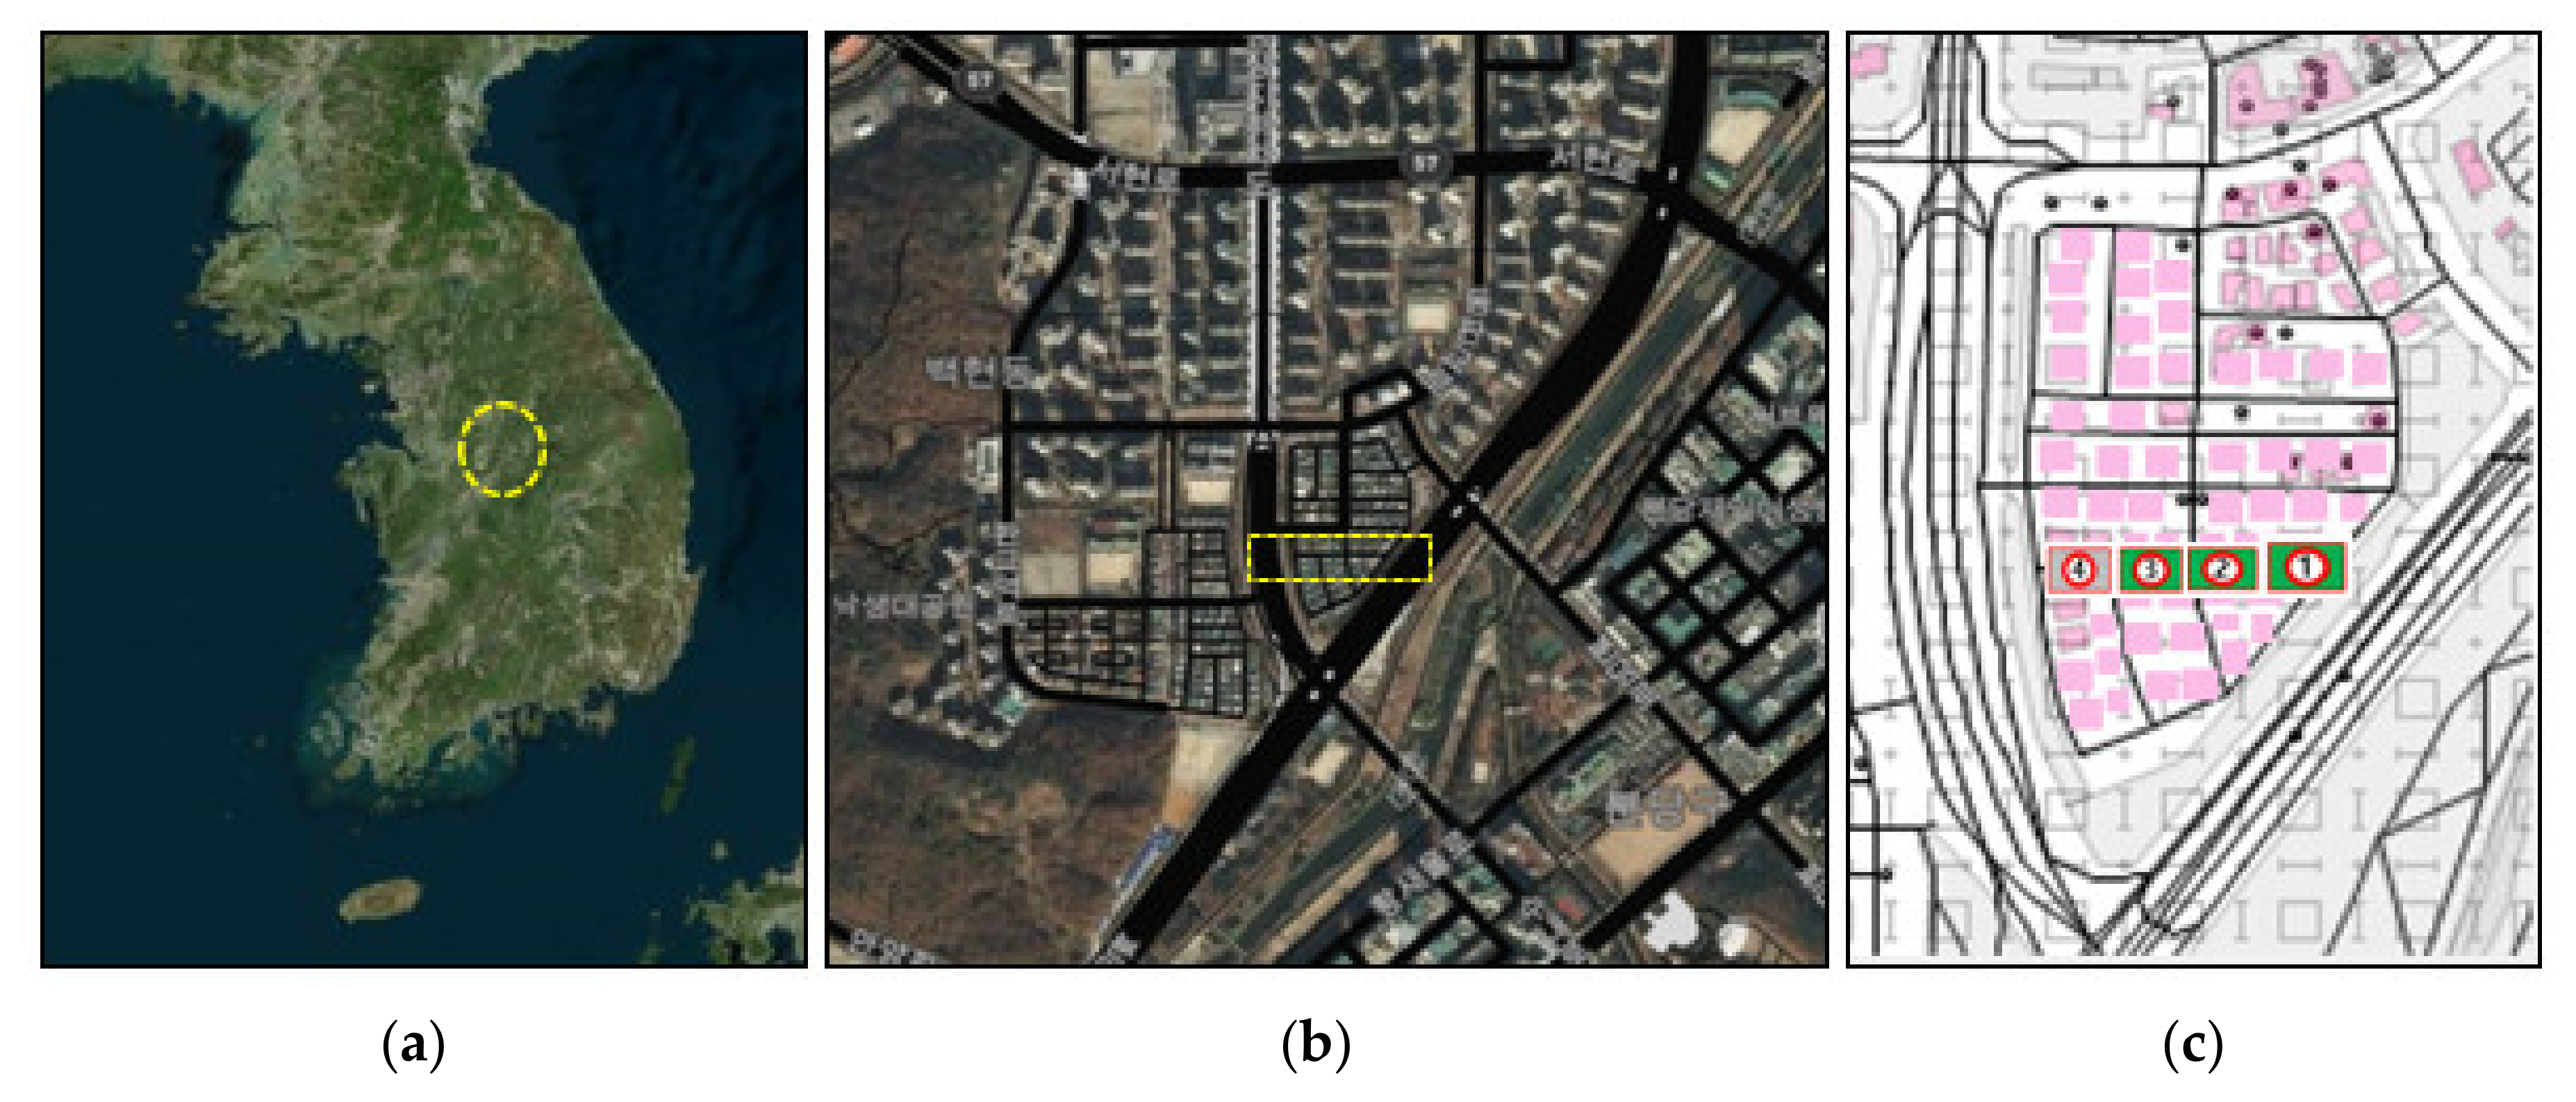
A residential area in Seongnam (latitude: 37° 39′, longitude: 127° 09′), South Korea, was selected for the current investigation. Seongnam is densely populated, with a large ground percentage covered in asphalt. Moreover, the area is made up of tall buildings averaging a height between 9.9 m and 14 m, has low vegetation coverage and often experiences heightened surface temperatures (See Figure 1). The field measurement data were collected in four spots of an East–West oriented street canyon. Three of the spots were located in a vegetated area, and one of the spots was located in an exposed area (see Figure 2). The air temperature and relative humidity were monitored at a 1.5 m height in each spot using Hobo-U12-012 data loggers. The data loggers measure the air temperature within a range of −20 °C and 70 °C (accuracy of ±0.35 °C) and the relative humidity within a range of 5% to 95% (accuracy of ±2.50%). The monitoring was conducted on the 13th June for 14 h (i.e., 6 am to 8 pm), and the air temperature and relative humidity were recorded in one-minute intervals.
2.2. Scenarios, Model Validation and Simulation Settings
2.2.1. Scenarios
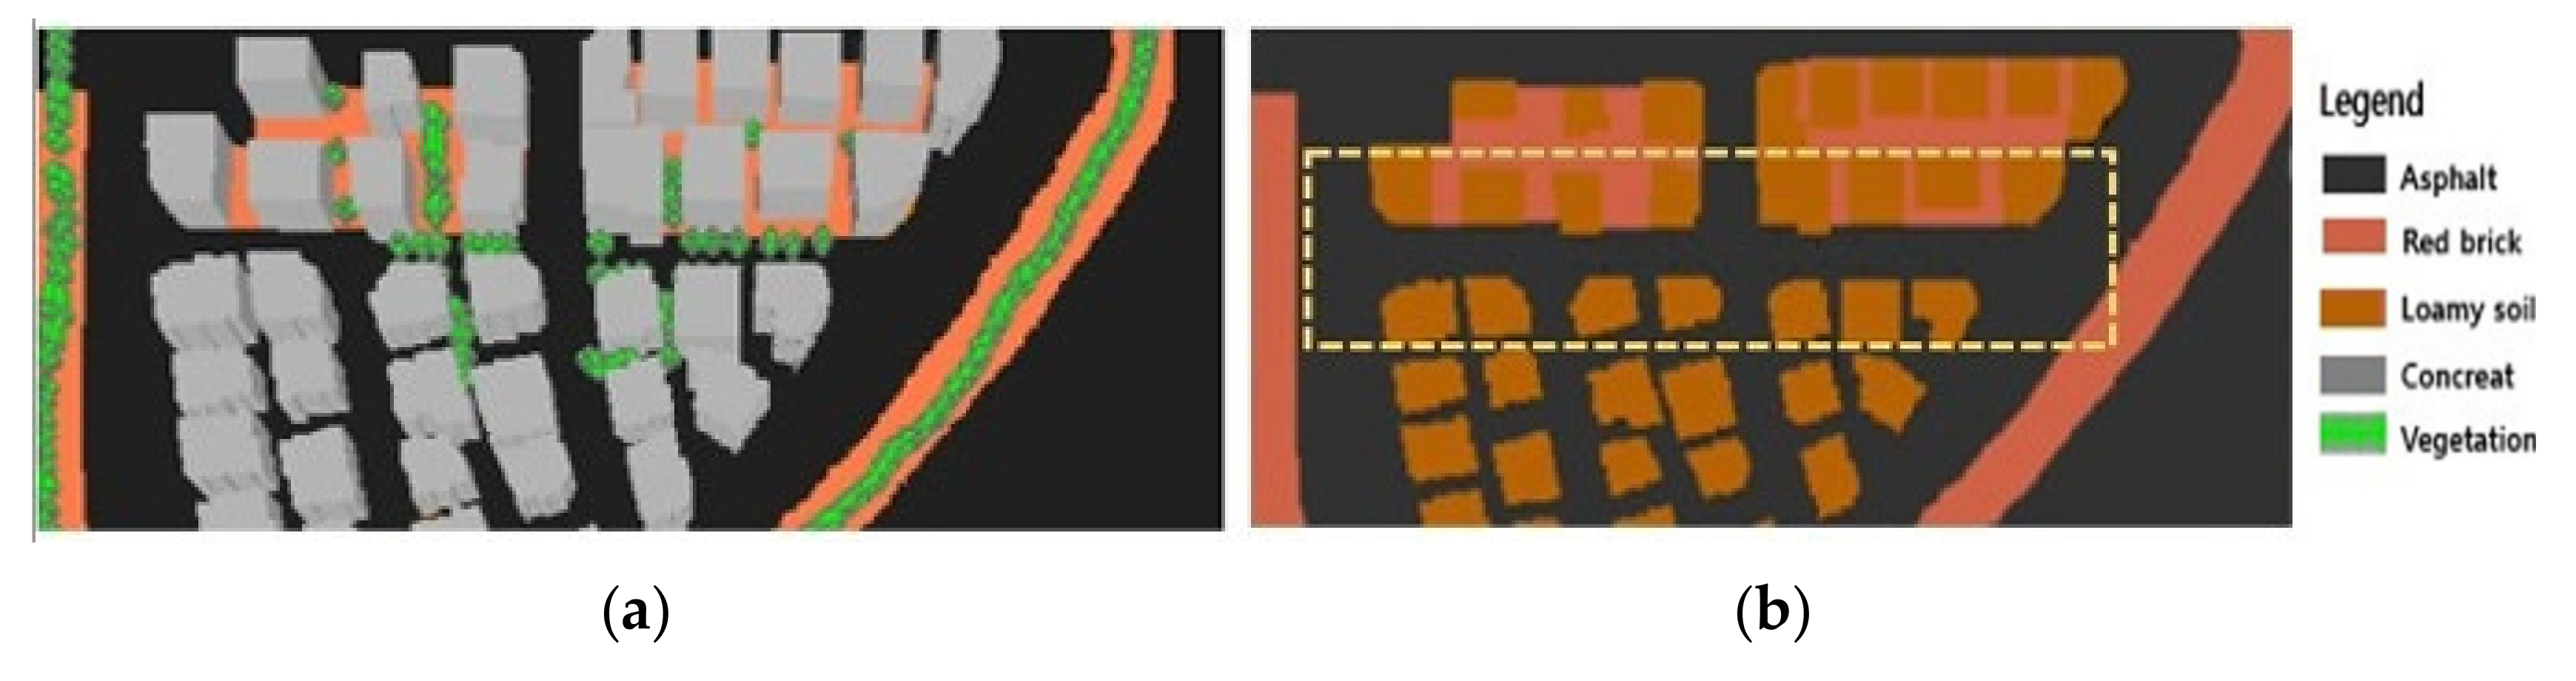
We assessed the cooling ability of sixteen scenarios involving various combinations of the percentage of trees, LAD and surface albedo. The tree (deciduous type) percentages considered ranged from 20% to 30% (moderate greenery) and 50% to 60% (intensive greenery), while the LAD was categorized into two groups: high LAD (1.1 m2/m3) and low LAD (0.3 m2/m3). The surface albedo was modulated between 0.2 and 0.4, as these are typical albedo values found in urban areas [31,32]. The scenarios were divided into two categories: (i) scenarios that assess the effect of vegetation modifications (i.e., the percentage of trees and LAD) and a ground albedo of 0.2; and (ii) scenarios that assess the effect of vegetation modification and an improved ground albedo of 0.4. Table 1 and Table 2 show the specific details of said scenarios, and the layout and three-dimensional (3D) model of the base model are shown in Figure 3.
2.2.2. Model Validation and Simulation Settings
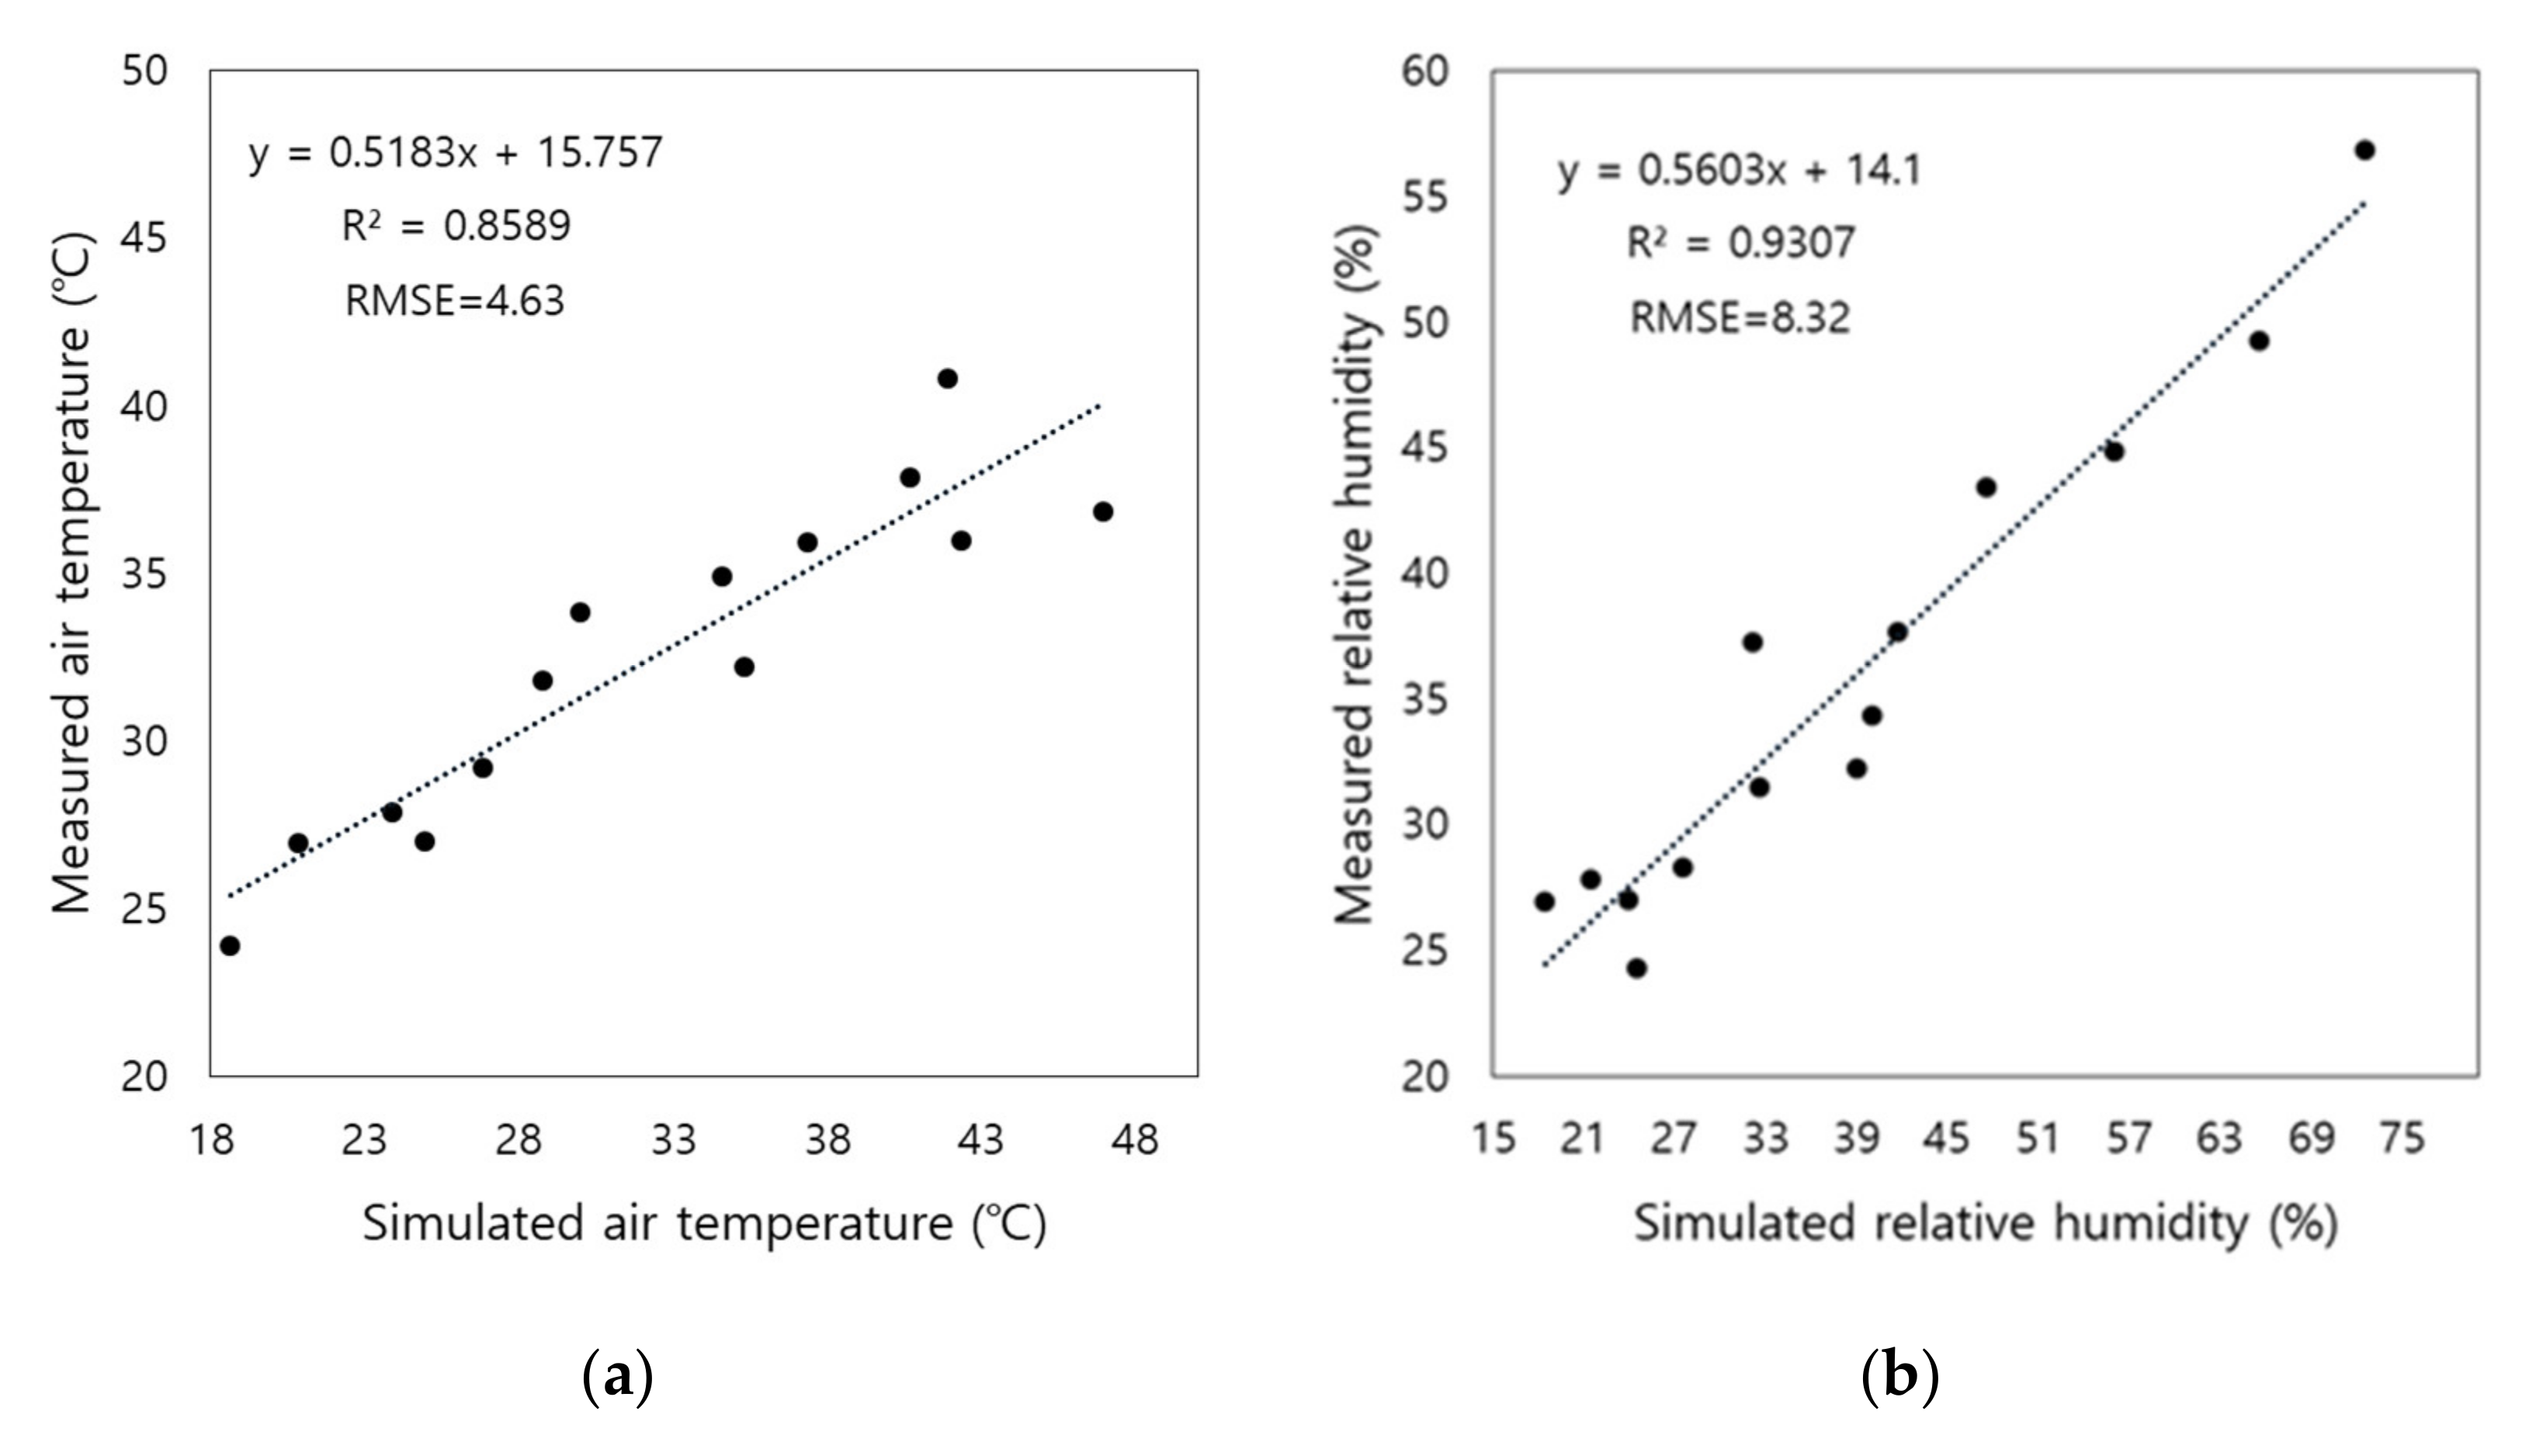
In order to explore the cooling potential of the scenarios discussed above (Section 2.2.1), we employed a three-dimensional microclimate model, ENVI-met (Version 4.4.5). The model dynamically simulates thermal interactions among physical elements, ground surfaces and the atmosphere within a given locality [33]; it includes particular schemes that analyze the influences of radiative, turbulent and convective mechanisms on the urban atmosphere, and is thus adequate for the assessment of the temperature-reductive effect of tree shading. Before the model simulation, we conducted a test run to validate ENVI-met’s performance against the observed field measurement data discussed in Section 2.2.2. ENVI-met requires inputs related to the meteorological elements and space characteristics of the area under analysis. Table 3 shows the meteorological conditions and space characteristics found at the experimental site and subsequently used as inputs in ENVI-met. However, some of the meteorological elements used as model inputs (e.g., wind and cloud cover) were collected from weather observatories near the experimental site (i.e., the Seongnam area). The trees found in the area were typically of low LAD, 3 m crown diameter and 5 m high.
For the validation process, the measured data collected from Spot 1 (see Figure 1 above) were used as inputs, and the model outputs were validated against the air temperature and relative humidity data measured in the other spots. The root mean square error (RMSE) and the determination of the coefficient (R2) were used to gauge the similarity between the air temperatures and the relative humidity values computed using ENVI-met and the actual measured air temperature and relative humidity values. The formulae used to calculate RMSE and R2 are shown in Equations (1) and (2), respectively. The scheme designed in ENVI-met was representative of the real area and modeled within 190 × 50 × 30 grid input dimensions. The vertical and horizontal grid resolution were set at 1 m. In order to certify the simulation constancy, we added eight nesting grid areas around the study domain.
where yk is the actual value, xk is the predicted value at time k, and n is the sample size.
3. Results and Discussion
3.1. The Effect of Vegetation on Air Temperature and Relative Humidity
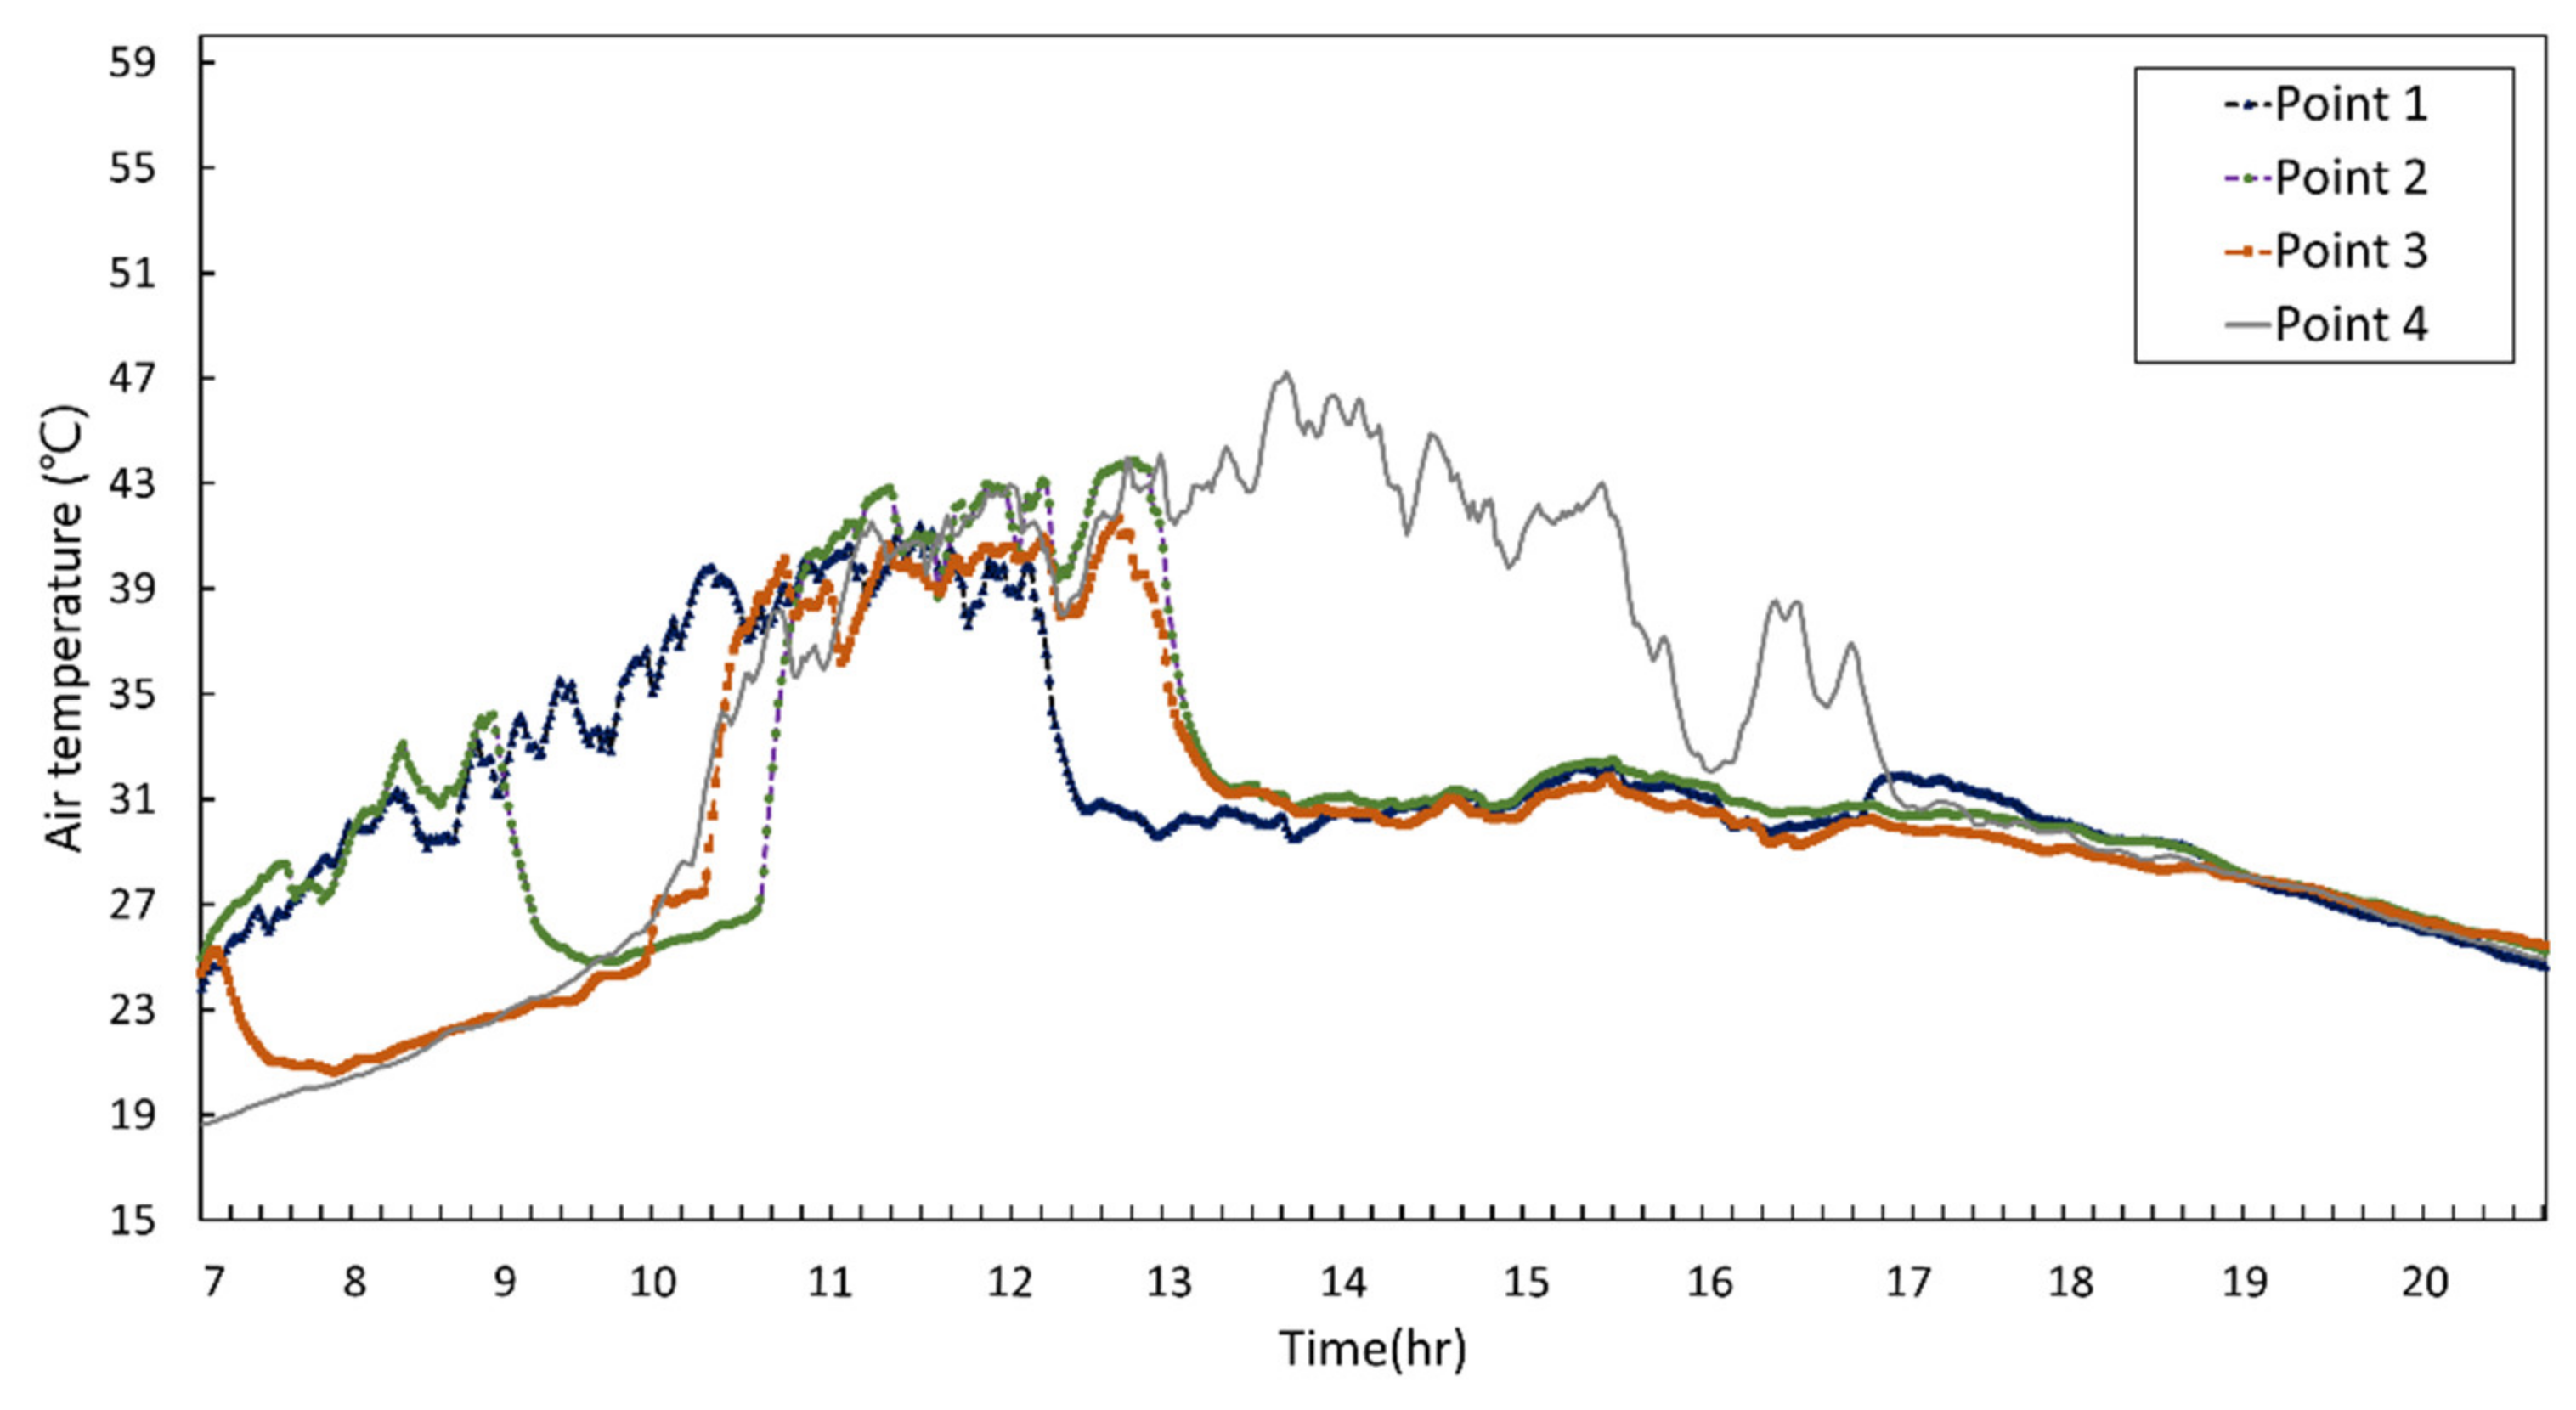
Figure 5 shows the hourly temperature changes between the vegetated area (Point 1, Point 2 and Point 3) and exposed spots (Point 4), whereas Figure 5 shows the changes in the hourly relative humidity between the vegetated and exposed spots. As shown in Figure 4, the air temperature in both the vegetated and the exposed areas was lowest (i.e., between 18 °C and 24 °C) in the morning hours (i.e., between 7 am and 9 am) before sharply increasing to temperatures between 38 °C and 42 °C between 10 am and 1 pm. There is then a clear difference in the air temperature levels between the vegetated areas (Point 1, Point 2 and Point 3) and the exposed area (Point 4) in the early afternoon between 1 pm and 5 pm; while the air temperature in the vegetated areas gradually decreased after 1 pm, the air temperature in the exposed area continued to increase, peaking at 46 °C at around 2 pm. Furthermore, it was observed that the air temperature is significantly higher in the exposed areas than the vegetated areas for the entire afternoon period, suggesting that the influence of the vegetation on the air temperature is more pertinent during the afternoon hours than the morning hours. This finding emphasizes the importance of vegetation in urban areas in reducing the air temperature in urban areas, particularly in the afternoon hours when solar insolation is likely to peak. Our findings also echo reports from various previous studies that observed apparent temperature differences between vegetated and non-vegetated areas, especially in the peak solar periods [34,35]. For example, Taha et al. reported air temperature differences of up to 8 °C between vegetated and non-vegetated areas [36]. Similarly, Akbari et al., found air temperature differences of up to 5 °C between areas with a tree presence and those without trees and vegetation [37]. The vegetation reduction of air temperature, especially related to trees, is primarily due to evapotranspiration and moisture dispersion processes; moisture release through the leaf stomata cells into the atmosphere prompts a cooling effect to the surrounding air. However, the cooling magnitude of said evapotranspiration processes is dependent on various factors, including the type, amount and size of the trees and their canopies.
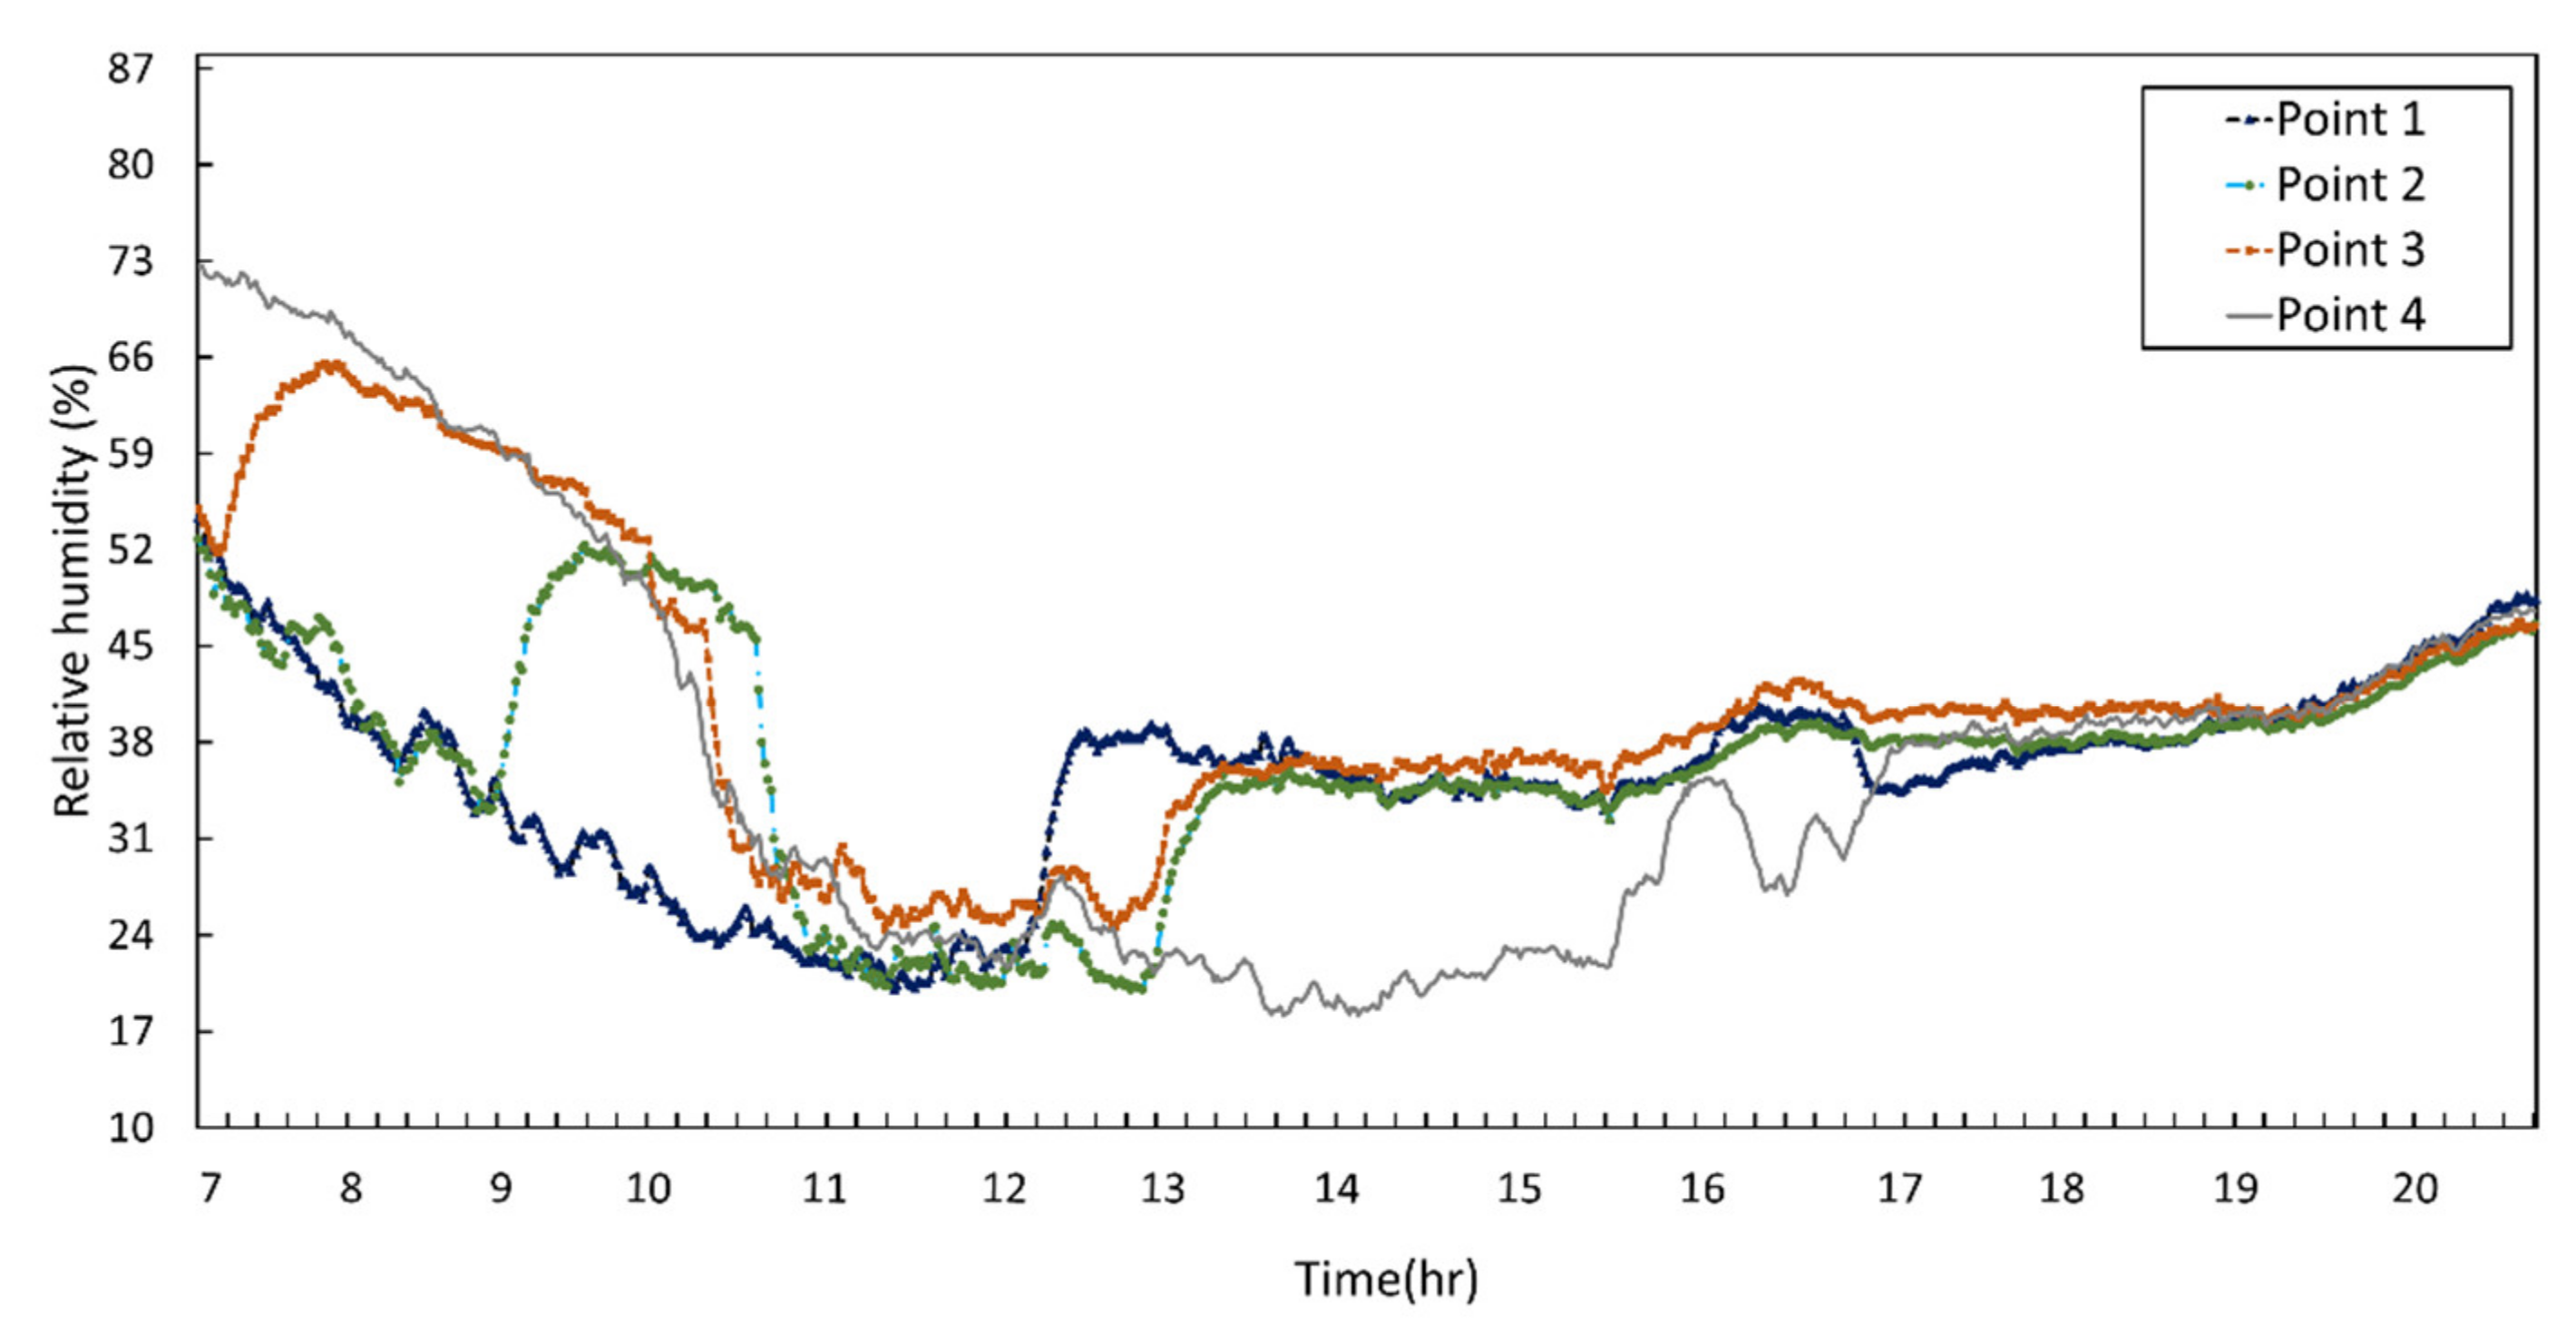
Furthermore, as shown in Figure 6, there is an apparent effect of vegetation on the relative humidity. By comparing the vegetated areas (Point 1, Point 2, and Point 3) and the exposed area (Point 4), it was observed that while the relative humidity is relatively higher (i.e., 70%) in the exposed area than in the vegetated areas (i.e., 55%) in the early morning hours (e.g., 7 am), it decreases sharply and becomes substantially lower in the exposed areas than the vegetated areas, particularly in the afternoon hours. For example, the relative humidity at 2 pm in the exposed area was 16%, while that in the vegetated areas ranged between 30% and 40%. These observations were also reported in previous studies, further highlighting the influence of trees on ground-to-air moisture exchanges and the relative humidity [38,39]. For example, Potchter et al. observed 13% relative humidity differences between the vegetated and built-up areas [40]. Similarly, Shashu-Bar et al. observed relative humidity differences of about 56% between a vegetated park and a nearby surrounding area [41]. The higher relative humidity observed in the vegetated areas than non-vegetated areas in the early morning hours is a potential result of surface moisture transpiration. The opposite results seen in the afternoon are related to the evapotranspiration processes associated with leaf moisture discussed earlier. The observed differences in relative humidity among the different locations can also be attributed to the observed temperature differences among said locations.
3.2. The Effect of Tree Coverage on Air Temperature Reduction
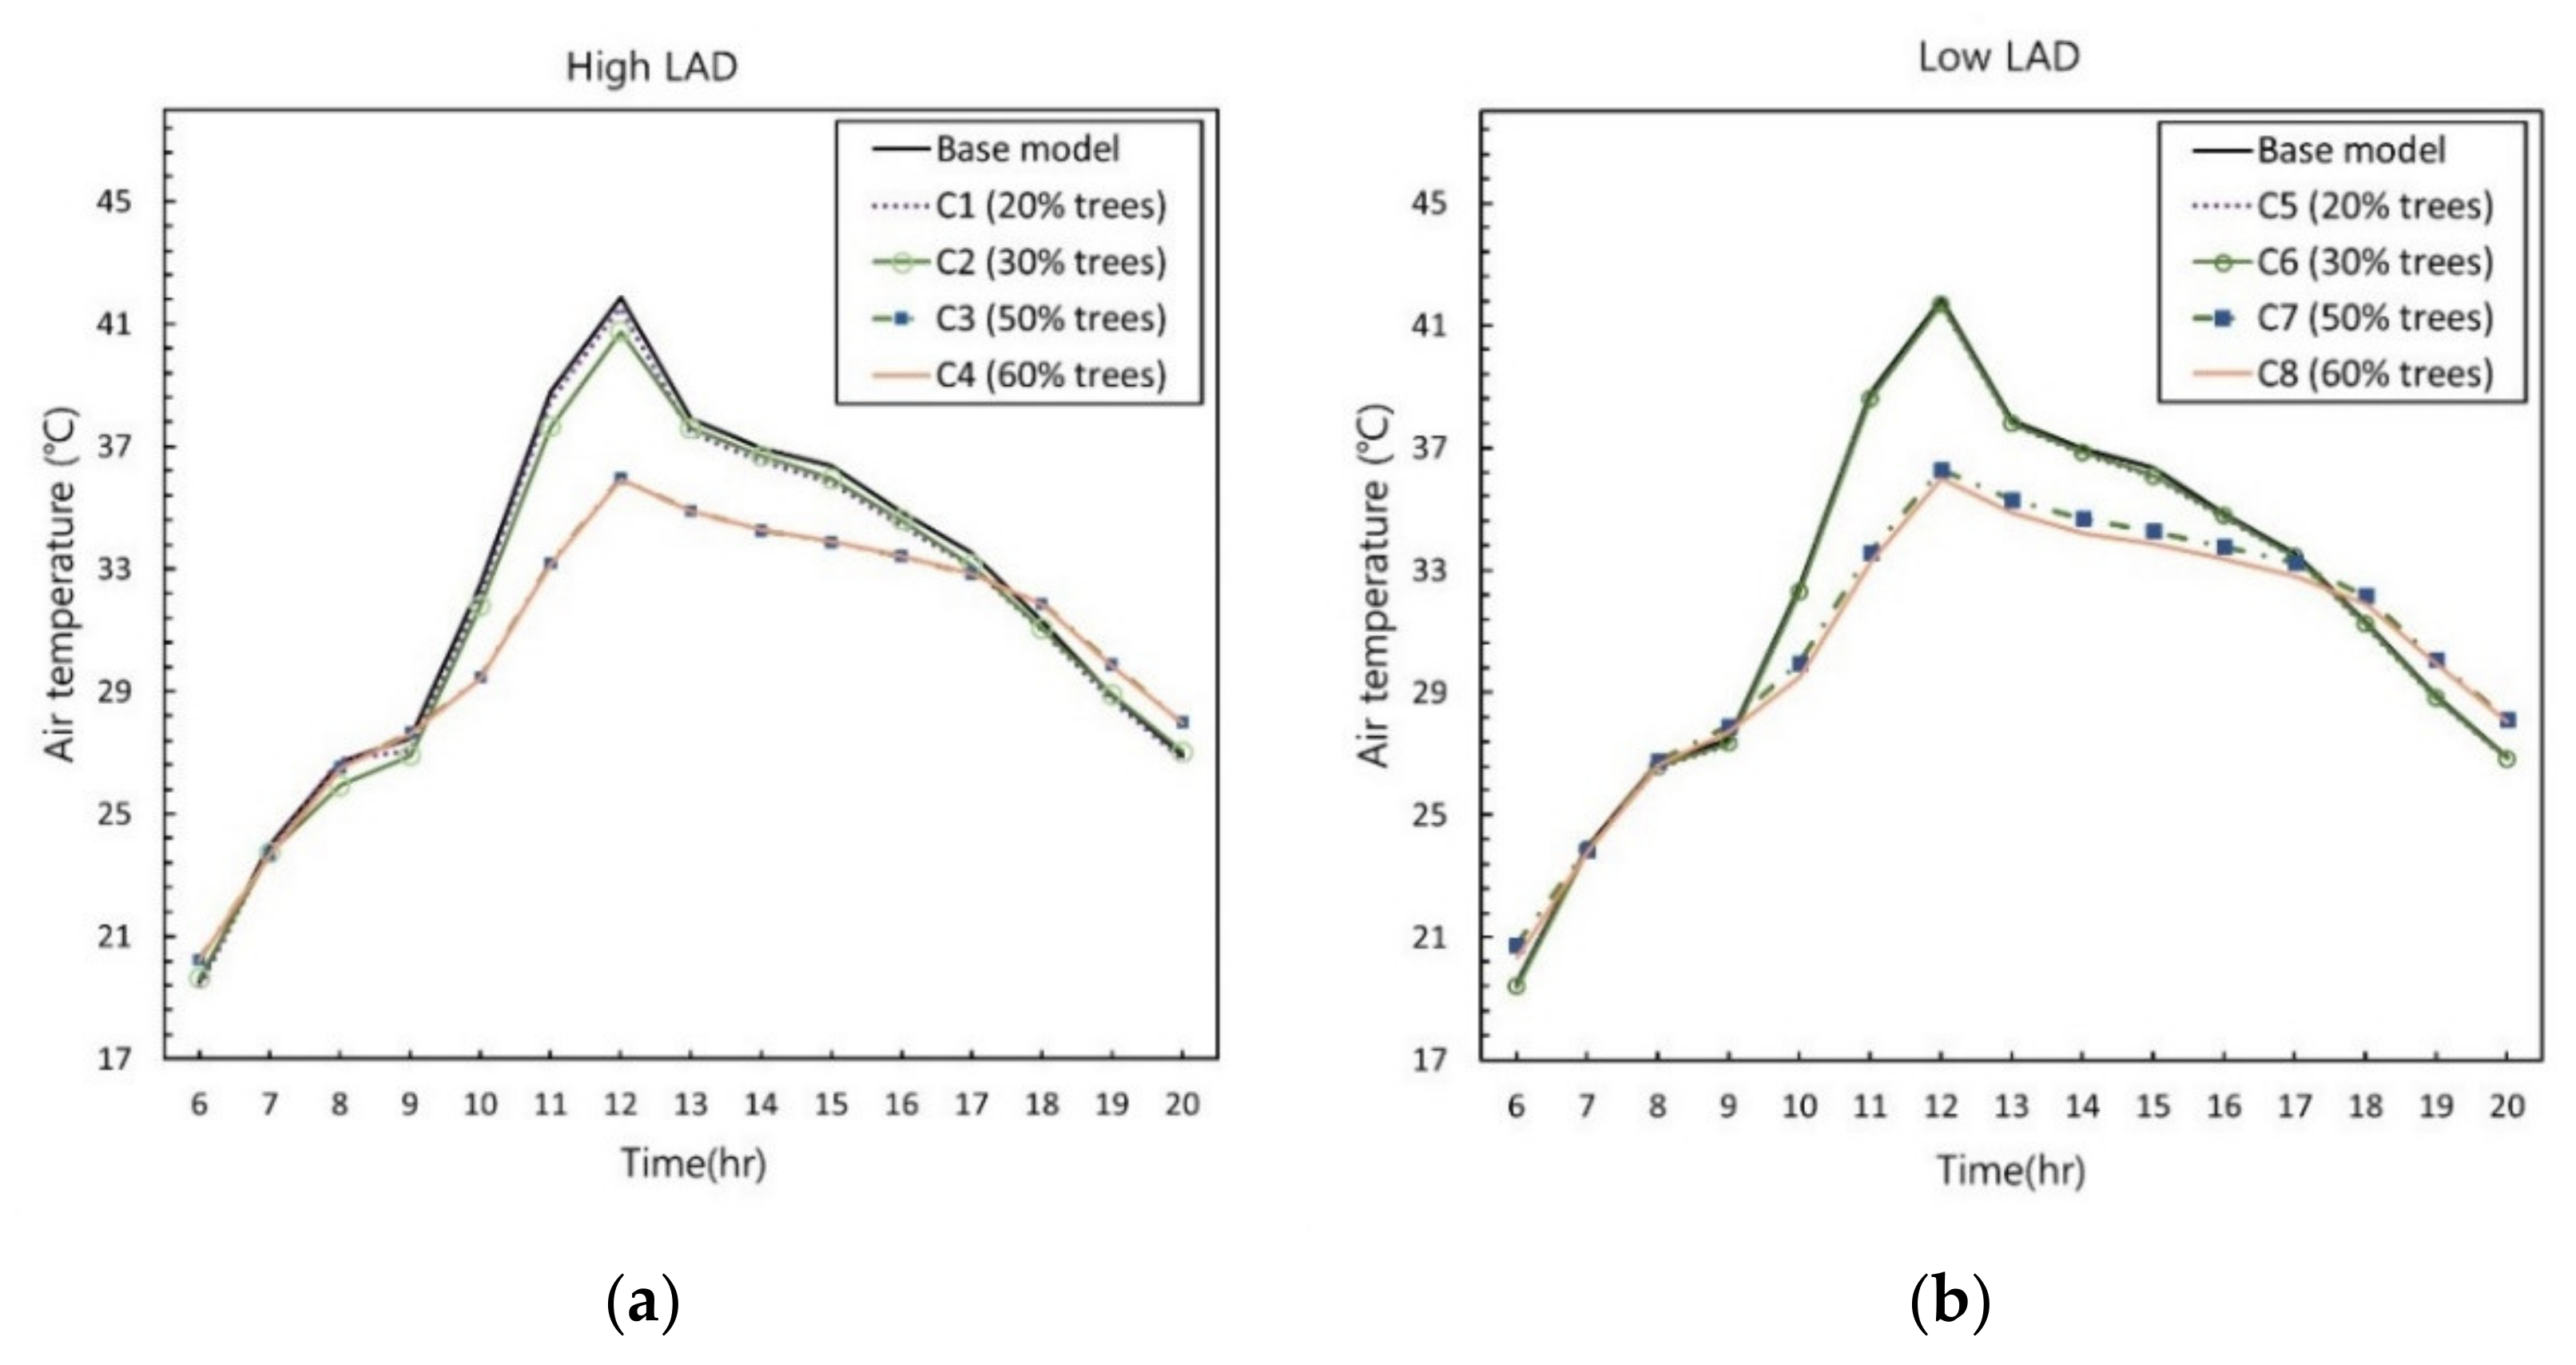
Figure 7 reveals the effect of changing the tree percentages while keeping the LAD constant on air temperature reduction. In order to properly assess the influence of the tree percentage on the air temperature alone (i.e., without considering the additional influence of LAD), we can look at the Figure 6, which shows the air temperature changes between the base area (i.e., the original spot with 4% trees) and our proposed scenarios, C1 (20% trees), C2 (30% trees), C3 (50% trees) and C4 (60% trees). As seen from the figure, all of the proposed scenarios demonstrate hourly temperatures lower than the base temperature during the solar peak time (i.e., 10 am–1 pm). As we expected, the lowest temperatures, particularly during the solar peak time, were observed under scenario C4, which consisted of the highest percentage of trees (60% trees). For instance, the difference in air temperature between the base area and C4 at noon was approximately 5.23 °C, which is substantial.
One interesting observation is related to the cooling potential of trees during different periods of the day. For example, it was observed that the ambient temperature in the evening time (between 5 pm–8 pm) was relatively higher under the high tree percentage scenario (i.e., C4) than the base scenario associated with a low tree percentage. This finding seems to indicate that the cooling effect of trees is likely to diminish in the evening hours. The finding is commensurate with the previously published reports [42] and is likely due to the low sky view factors (SVF) resulting from broad tree canopies. Said low SVF restricts the outward escape of re-radiated long-wave radiation, which ultimately increases the air temperature under the tree canopies. This is an interesting finding, and it points to the importance of the sky view factor in the evening hours when long-wave radiation is re-emitted. Similarly, the air temperature differences between the proposed scenarios, which consisted of high tree percentages and the base area, were not substantial in the early morning hours (i.e., between 6 am–9 am). This result is similar to various previous studies [43,44], and is likely due to the absence of direct solar radiation, which seems to peak at around midday.
3.3. The Effect of the Leaf Area Density on the Air Temperature Reduction
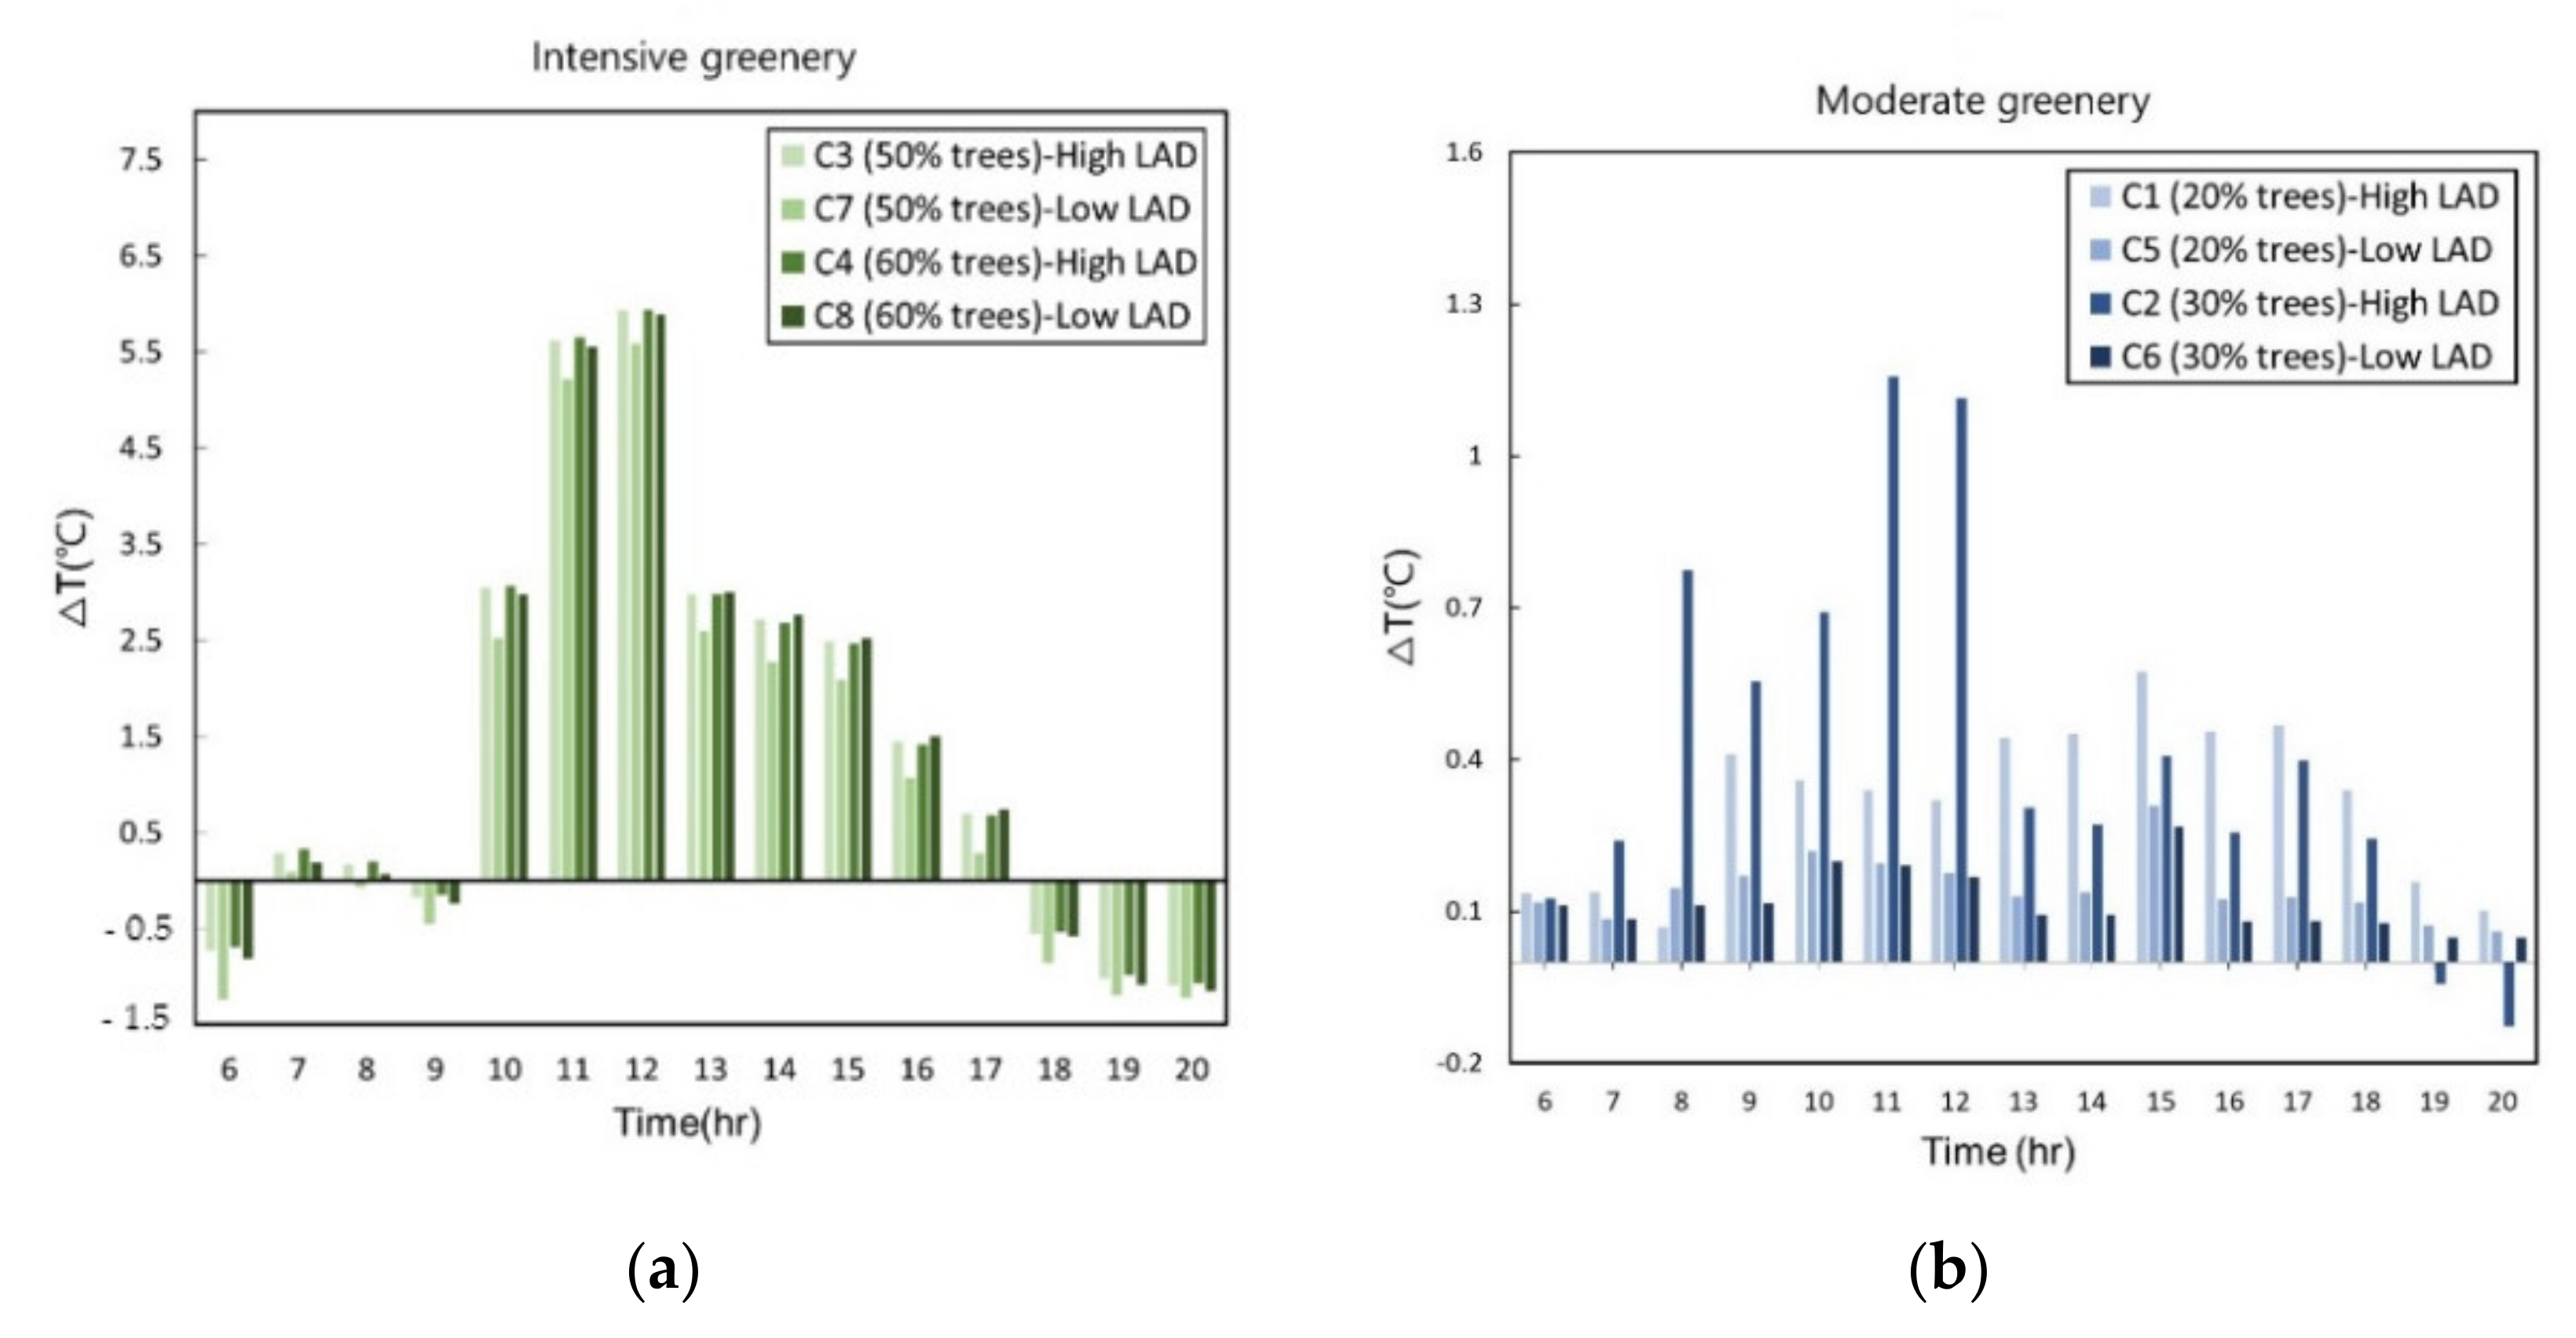
Figure 8 demonstrates the effect of different LADs on the air temperature reduction. As seen from the figures, the effect of the LAD is minimal in intensive greenery scenarios. For example, comparing the scenarios C4 (60% trees, high LAD) and C8 (60% trees, low LAD) at the peak temperature (12 pm), the corresponding difference in temperature is less than 0.5 °C. On the contrary, in moderate greenery scenarios (i.e., tree percentages between 20% and 30%), the influence of LAD is more considerable, especially during the solar peak time of the day (i.e., 11 am–12 pm), and its difference is about 0.8 °C. This finding suggests that no substantial temperature reduction is induced by increasing the LAD level from low to high in intensive greenery scenarios. The influence of LAD changes on air temperature reduction has been controversial in the literature, with some studies reporting substantial differences in air temperature due to LAD adjustments [45,46]. In contrast, a few other studies reported no substantial air temperature reduction attributed to LAD changes and the proper value of changing the leaf area density [39]. Thus, future research is encouraged to quantify further the potential influence of LAD changes on air temperature reduction, which is quite pertinent to the employment of trees as an urban cooling strategy.
3.4. Combined Effect of Vegetation and a Cool Pavement
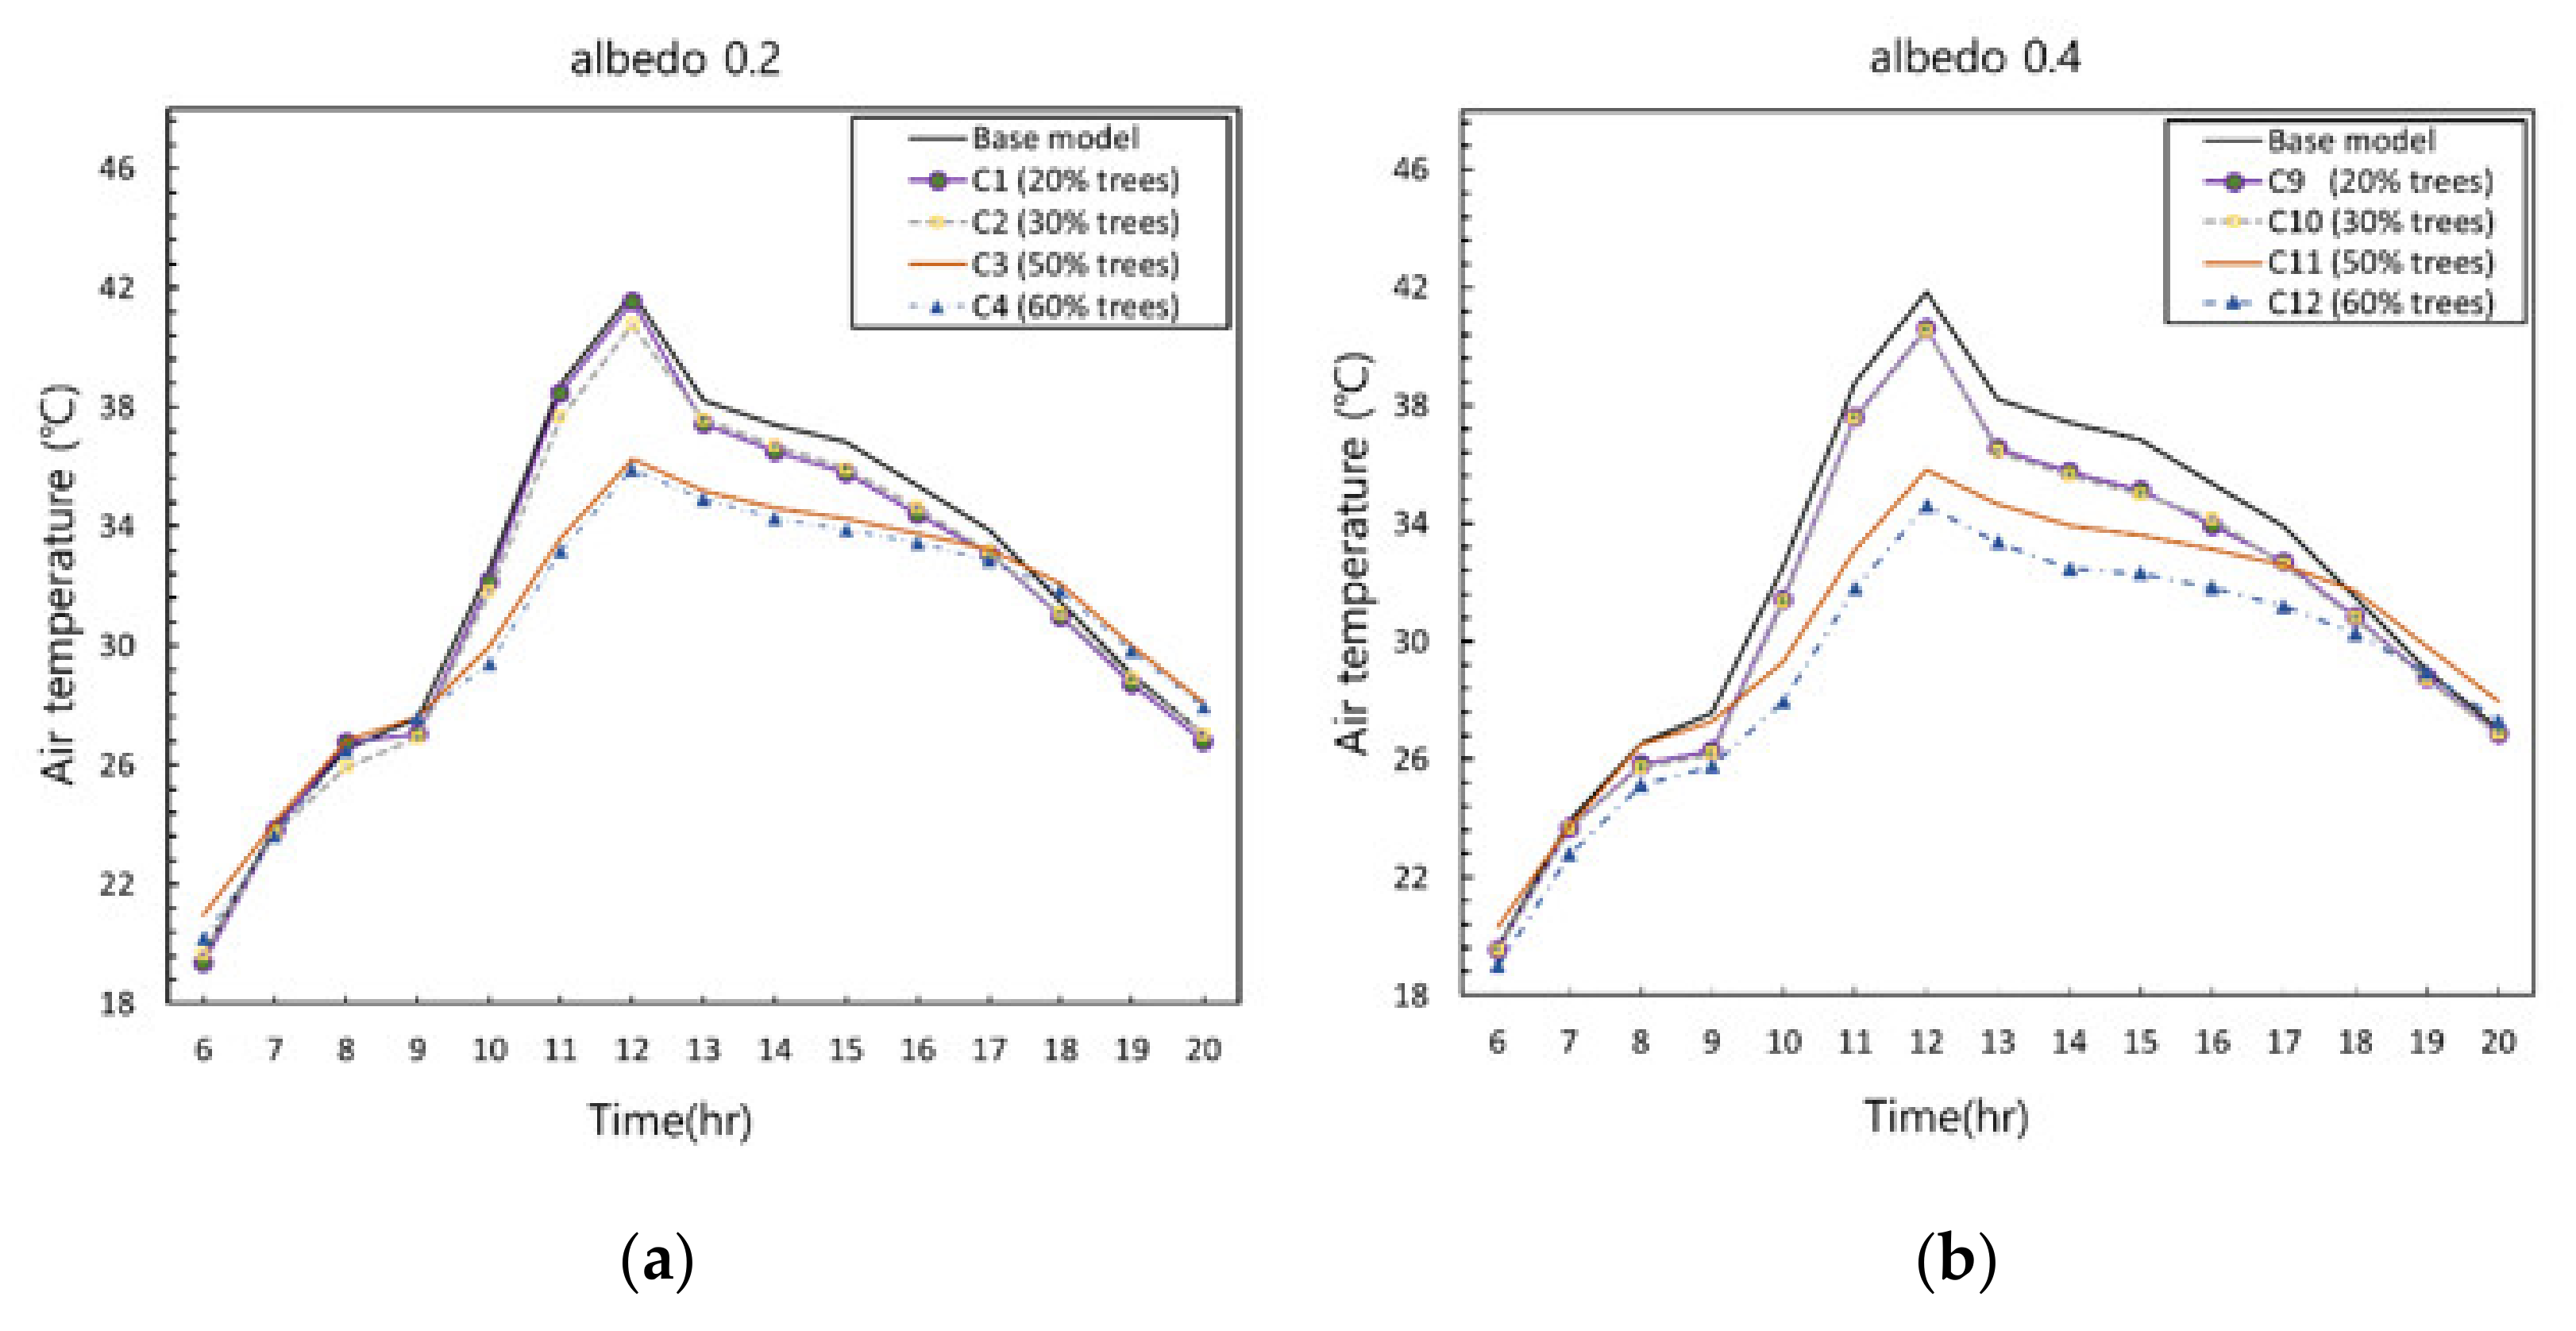
Figure 9 represents the hourly variations of the air temperature reduction as a result of combining tree percentages and surface albedo modifications; this is shown for the best case scenarios (High LAD). As seen from the figure, the air temperature varied between 19.66 °C and 41.83 °C for the base model. For scenarios C9 and C10, the air temperature ranged between 19.53 °C and 40.60 °C, while in scenarios C11 and C12, the air temperature varied between 18.99 °C and 35.81 °C.
For all of the scenarios, the air temperature levels showed a constant increase from the morning hours to noon, after which a steady decrease was observed. However, possibly as a result of albedo, the specific air temperature levels were different for each scenario. For example, it was observed that the maximum difference in air temperature was between the base model and the scenarios with albedo 0.4 and intensive greenery. In contrast, the minimum difference in air temperature was observed between the base temperature and C1, C2, C9 and C10. The most substantial differences in air temperature were observed at noon between the base model and scenario C4 (i.e., an air temperature difference of 5.90 °C) and C12 (i.e., an air temperature difference of 7.21 °C). Furthermore, it was observed that the air temperature differences between the base model and scenarios C1 and C9 at noon were approximately 0.28 °C and 1.23 °C, respectively. This finding suggests that cool materials (i.e., an albedo of 0.4), in our case, could reduce the air temperature by a further 1.31 °C compared to the scenarios with an albedo of 0.2. The findings show that combined scenarios are capable of reducing the air temperature, particularly during the day’s critical time. Furthermore, it was observed that the individual effect of greenery on air temperature reduction is more substantial than that of cool materials alone. While that is the case, our results also indicate that the highest cooling effects are induced from coupling the two heat mitigation techniques (i.e., increased vegetation and cool materials). This finding is consistent with previous reports [31] and further alludes to the importance of combining various heat imitative techniques in the bid to reduce urban overheating.
3.5. Comparison of Mitigation Techniques
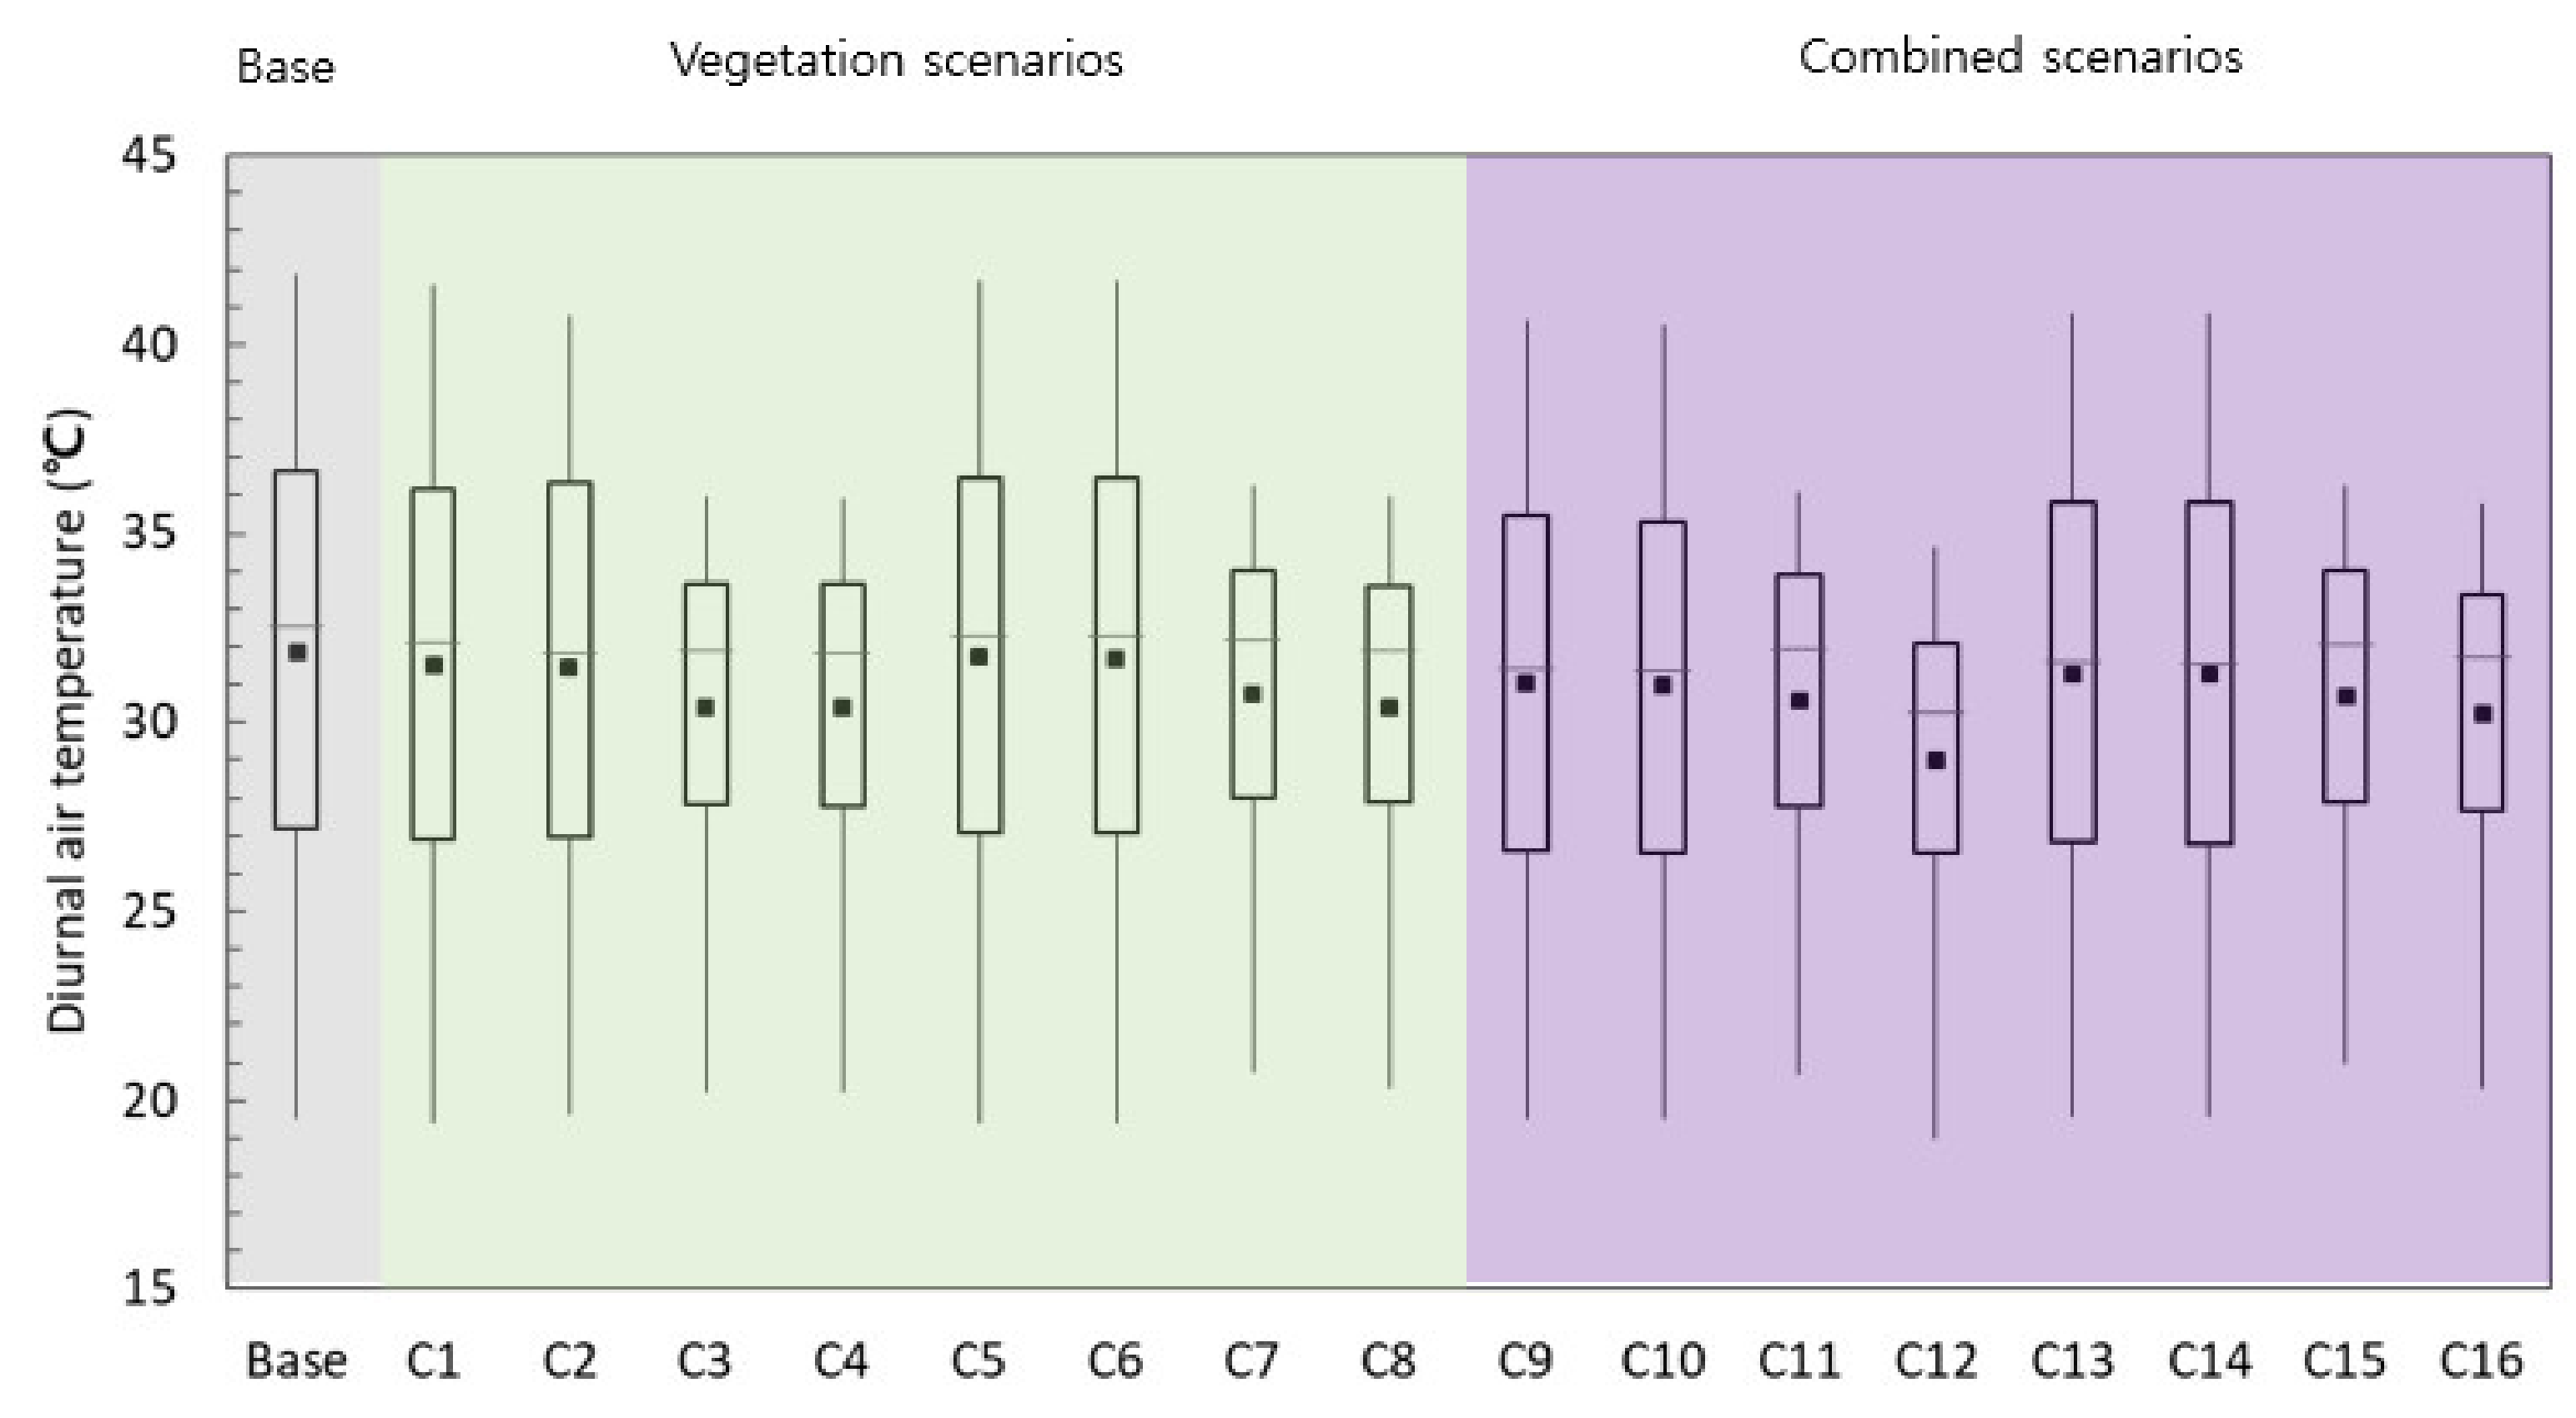
Figure 10 compares the potential cooling effect of various applied scenarios (see Table 1 and Table 2) in the study area. The figure shows that the air temperature among vegetation scenarios ranged between 31.71 ± 6.17 °C (mean ± standard deviation) and 30.41 ± 4.43 °C, when the tree coverage percentages were 20% and 60%, respectively. These values were slightly lower for the combined scenarios, which were between 31.29 ± 5.86 °C and 28.98 ± 4.33 °C for the same tree percentage. The standard deviations for the vegetation scenarios are higher than those of the combined scenarios by nearly a maximum value of 1.83 °C. These results clearly show the effect of the proposed scenarios on the air temperature reduction.
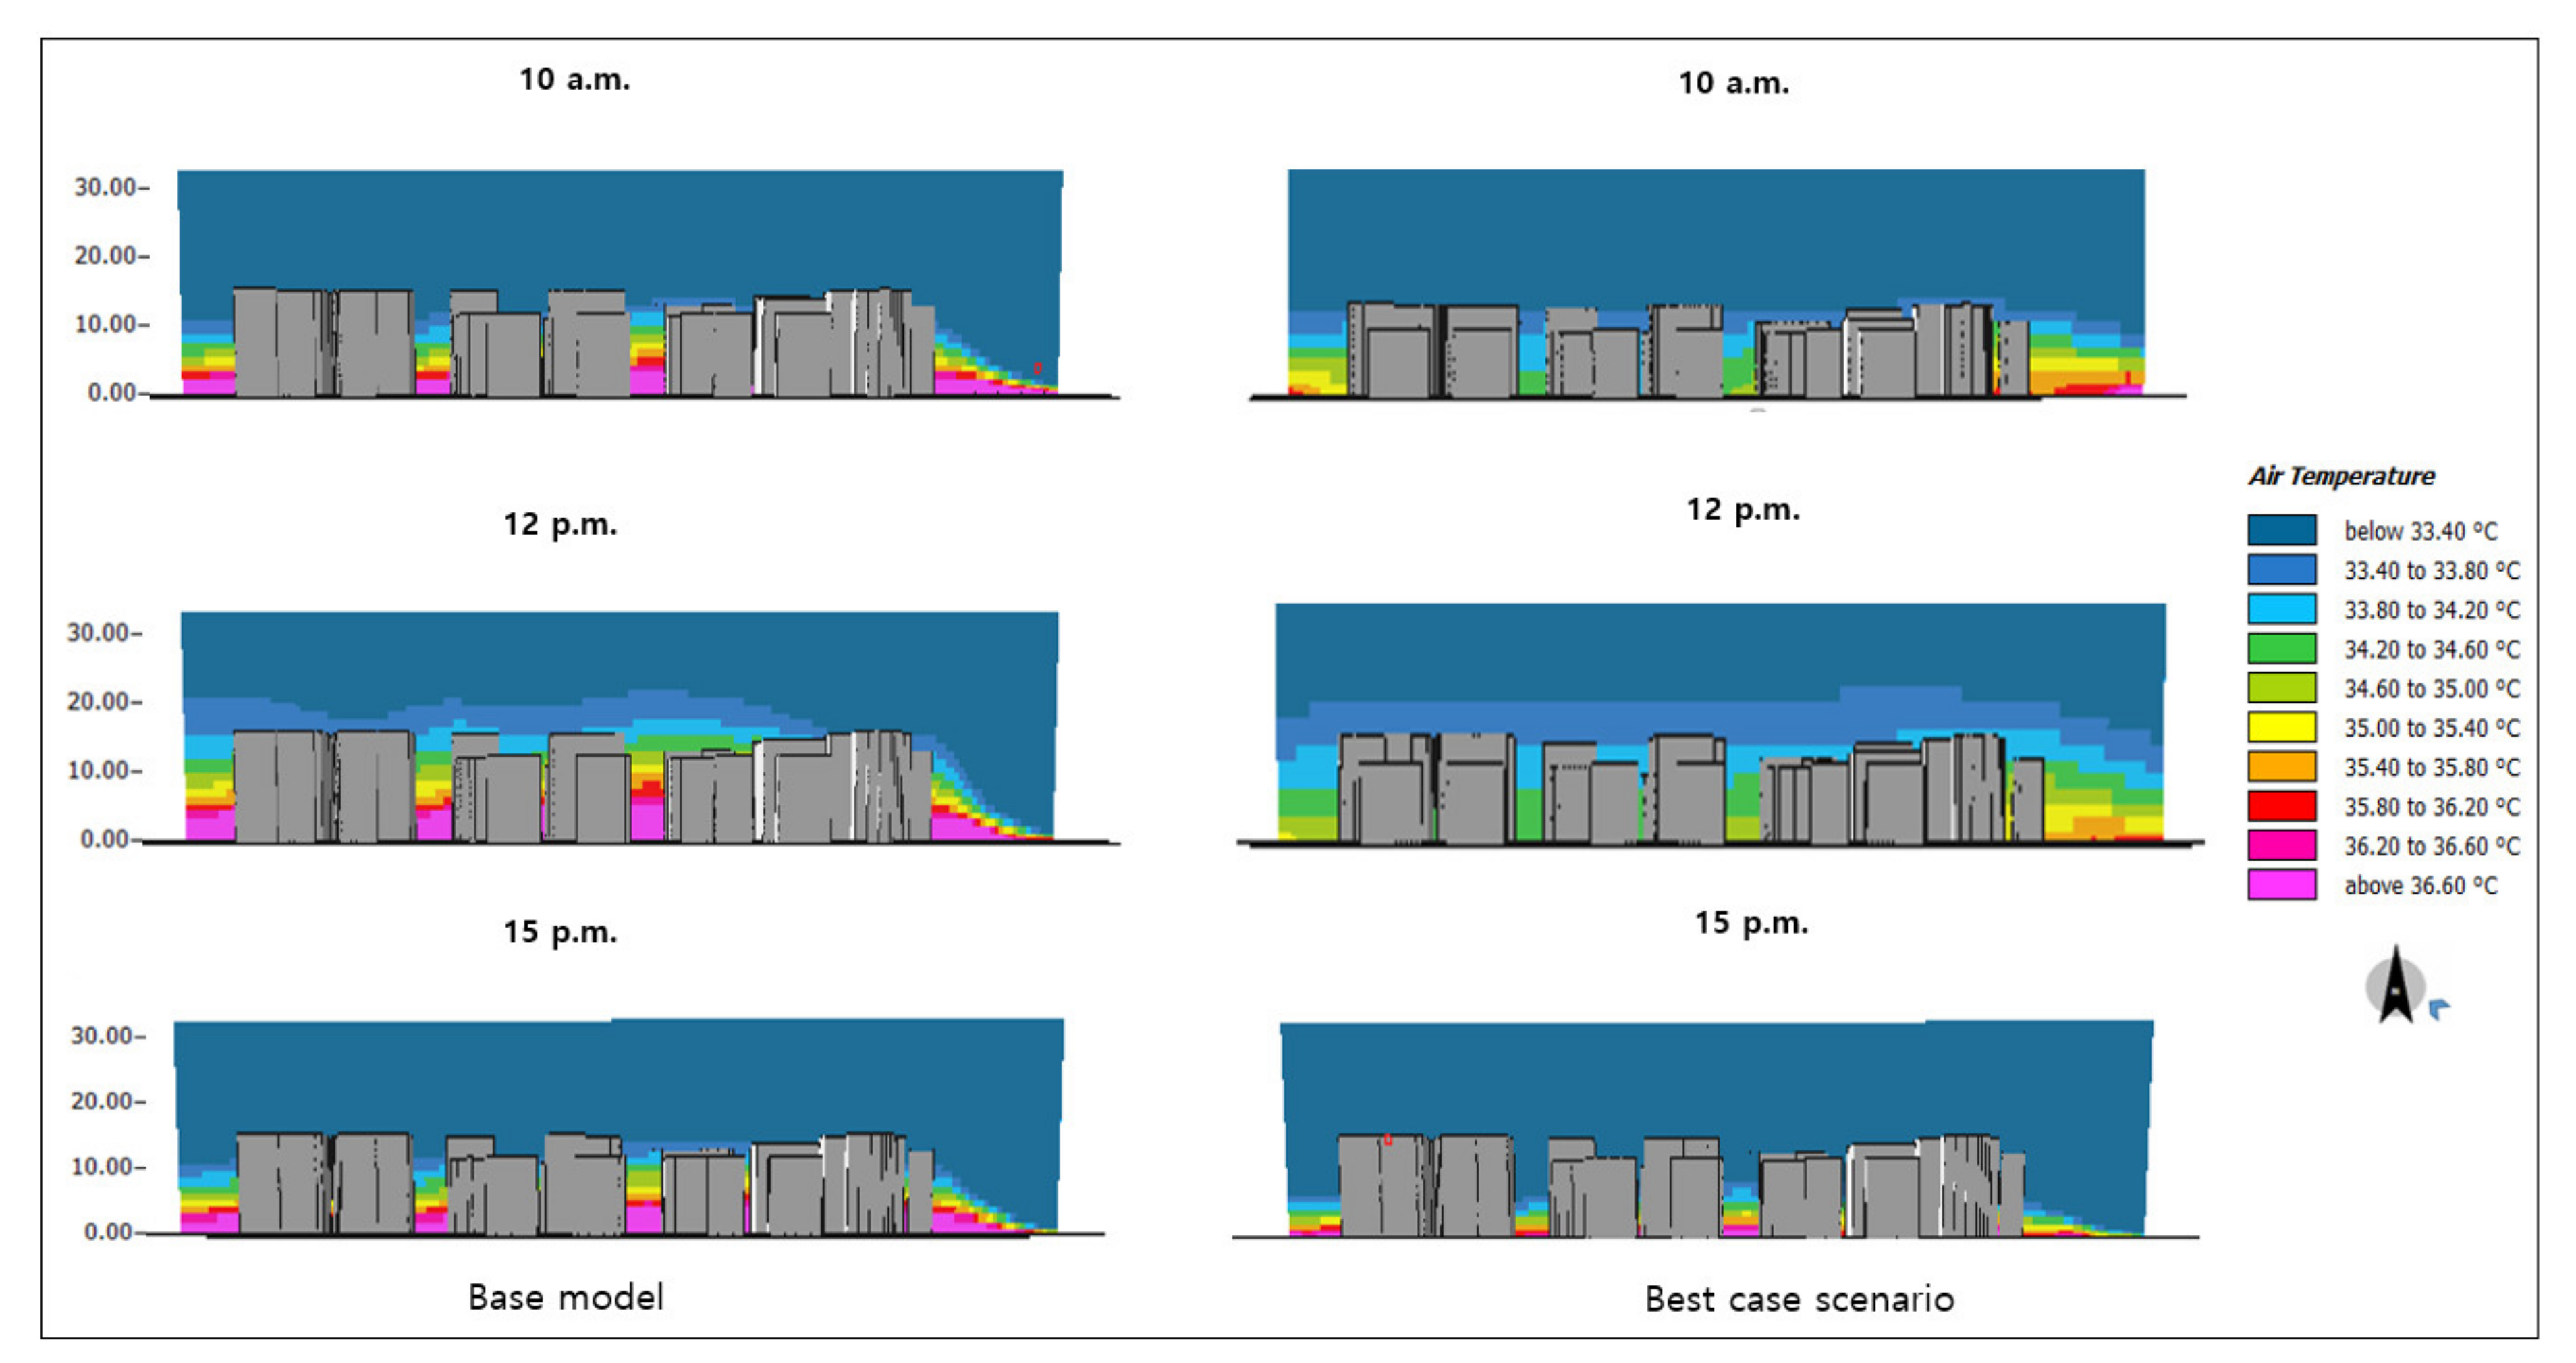
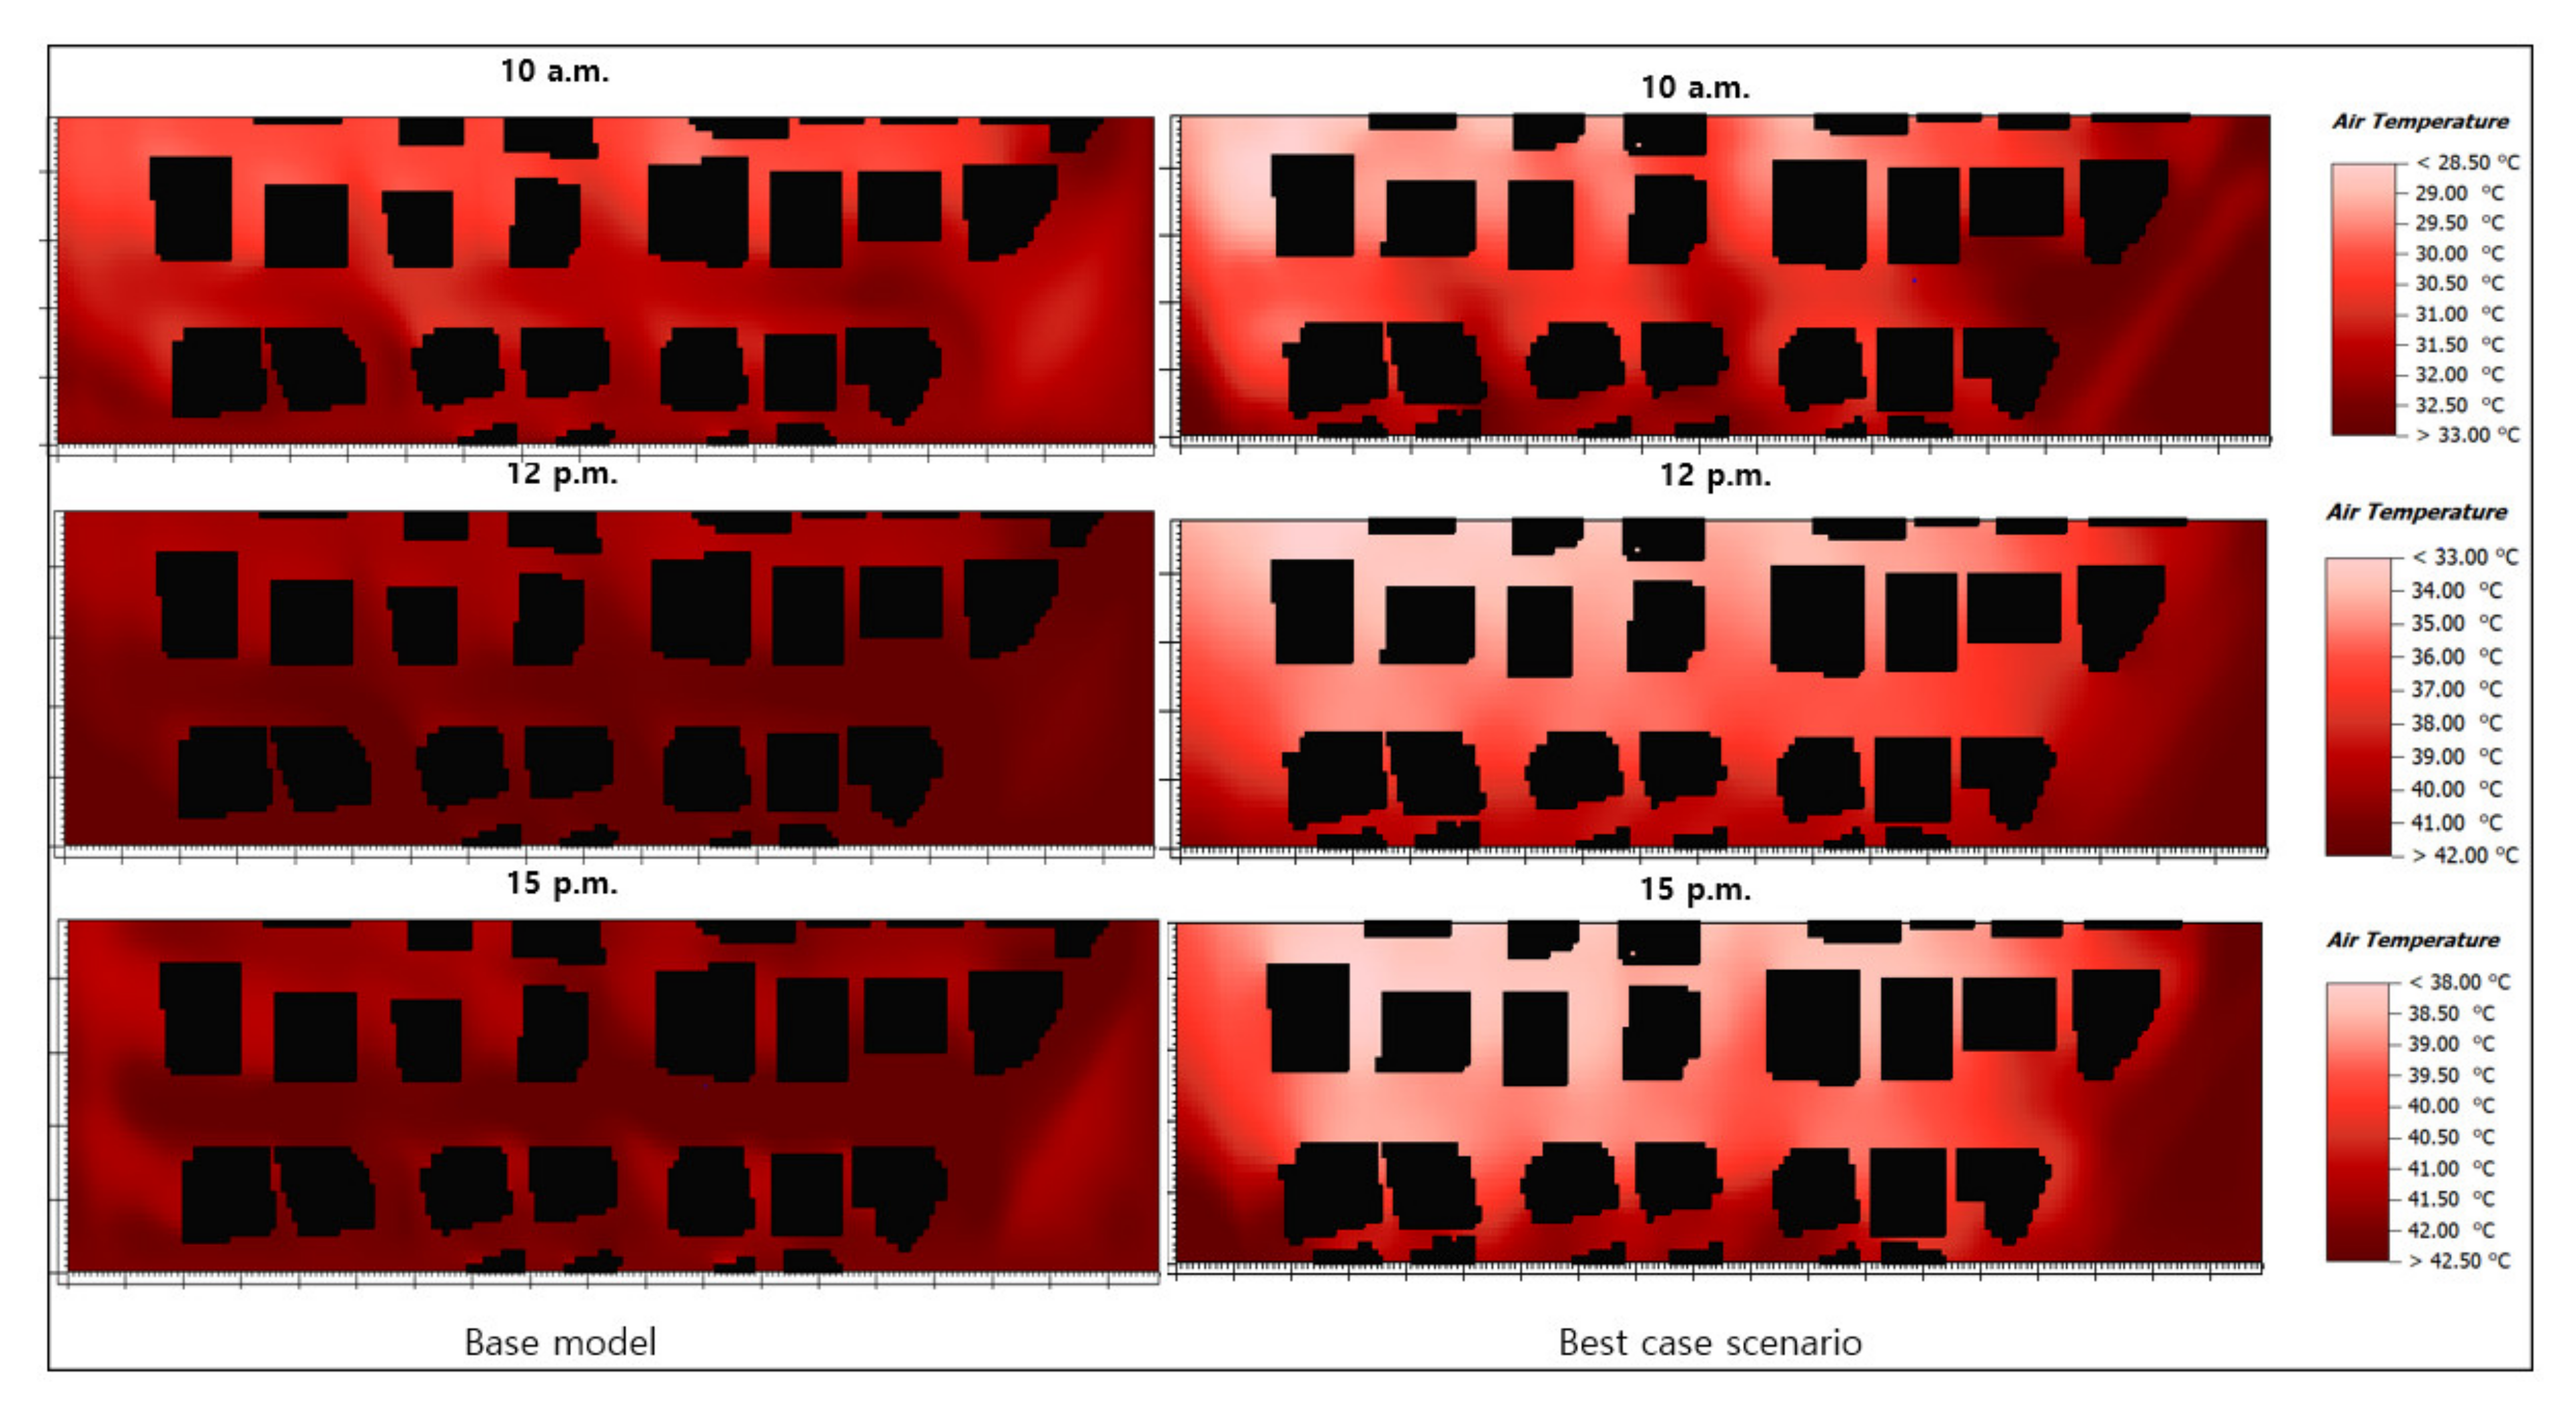
Figure 11 and Figure 12 compare the air temperature distributions between the base temperature and the best temperature-reducing scenario during solar peak hours (i.e., between 10 am and 3 pm). UHIs are disparate in spatial distribution, particularly during the daytime [46]. The maximum urban heat stress happens between the afternoon hours when the daily UHI and total temperature are at their maximum [47]; thus, the air temperature distribution layout was represented where the significant effect was anticipated. Comparing a base model with the best-case scenario, the considerable effect was observed at 12 pm, and it ranged between 35.40 °C and 37.24 °C, which reduces the maximum air temperature by nearly 6 °C in the entire canopy (see Figure 11). Moreover, less spatial distribution can be observed at 10 am and ranged between 29.11 °C and 30.11 °C in the best-case scenario, while at 3 pm they ranged between 33.31 °C and 35.38 °C. The air temperature differences were about 3 °C and 4 °C between 10 am and 3 pm, respectively, for the entire study domain compared to the base model. With the comparison of all of the spatial distributions at different times of the day, it was observed that the best-case scenario has a relatively lower air temperature compared to its base model.
4. Conclusions
The current study demonstrated the effect of trees (i.e., the percentage of trees), tree characteristics (i.e., LAD), and combined scenarios on the air temperature levels in a hot street canyon during the summertime. Said effects were first investigated through in situ measurements by comparing diurnal air temperature levels between a vegetated area (4% trees) and an exposed area with no trees. Secondly, 16 different scenarios involving various combinations of tree percentages, LAD and combined scenarios were simulated and studied via a numerical modeling tool in order to quantify their potential effect on the selected street canyon’s air temperature. Among the considered combinations, the maximum diurnal temperature reductions in the vegetated area, which were approximately 3 °C, were achieved by modifying the base area characteristics from 4% tree coverage and low LAD to 60% tree coverage and high LAD. The effect of said modifications was much higher in the exposed area (i.e., a 5.23 °C temperature reduction). Furthermore, we observed that while increasing tree percentages had a substantial effect on temperature reductions, adjusting the LAD levels alone did not yield any substantial temperature reductions in intensive greenery scenarios, i.e., approximately 0.5 °C, considering scenarios of the same tree percentage but different LAD levels (i.e., high LAD and low LAD). The observed temperature reduction was attributed to increased tree percentages, high LADs, and high surface albedos, which enhance convective cooling through evapotranspiration processes and reduced solar absorptivity. The obtained results demonstrate the usefulness of urban tree characteristics and urban albedo to mitigate urban heating, and are particularly useful to urban designers and policymakers in their efforts to minimize UHI effects.
5. Limitations and Future Research Studies
This study examined some mitigating strategies that can reduce the urban heat island effect in an urban area, especially in the most problematic E–W street canyon orientation. Future potential studies could be expanded to different urban configurations by combining various mitigation techniques with different LAD values. It is important to note that some of the meteorological elements (i.e., wind speed, wind direction and cloud coverage) used in model validation in Section 2.2.2. were obtained from a nearby weather observatory, rather than direct measurements from the experimental site. The validation results shown in Figure 3 could potentially be improved if locally measured elements, particularly wind speed and wind direction, are used as the model inputs. This pinpoints crucial future research directions specifically regarding the scale or range of synoptic weather elements appropriate for climatic model validations.
Author Contributions
Conceptualization, G.Y.Y. and A.T.E.; methodology, G.Y.Y. and A.T.E.; software, A.T.E.; validation, A.T.E.; formal analysis, J.N. and A.T.E.; writing—original draft preparation, A.T.E. and J.N.; writing—review and editing, A.T.E., J.N., and G.Y.Y. All authors have read and agreed to the published version of the manuscript.
Funding
This work was supported by the Korea Institute of Energy Technology Evaluation and Planning (KETEP) and the Ministry of Trade, Industry & Energy (MOTIE) of the Republic of Korea (No. 20202020800360).
Institutional Review Board Statement
Not applicable.
Informed Consent Statement
Not applicable.
Data Availability Statement
The data used in the study is available on reasonable request from the corresponding author.
Conflicts of Interest
We have no conflict of interest to declare.
References
- Oke, T.R. The energetic basis of the urban heat island. Q. J. R. Meteorol. Soc. 1982, 108, 1–24. [Google Scholar] [CrossRef]
- Parsaee, M.; Joybari, M.M.; Mirzaei, P.A.; Haghighat, F. Urban heat island, urban climate maps and urban development policies and action plans. Environ. Technol. Innov. 2019, 14, 100341. [Google Scholar] [CrossRef]
- Liu, Y.; Li, Q.; Yang, L.; Mu, K.; Zhang, M.; Liu, J. Urban heat island effects of various urban morphologies under regional climate conditions. Sci. Total Environ. 2020, 743, 140589. [Google Scholar] [CrossRef]
- Deilami, K.; Kamruzzaman, M.; Liu, Y. Urban heat island effect: A systematic review of spatio-temporal factors, data, methods, and mitigation measures. Int. J. Appl. Earth Obs. Geoinf. 2018, 67, 30–42. [Google Scholar] [CrossRef]
- Yun, G.Y.; Ngarambe, J.; Duhirwe, P.N.; Ulpiani, G.; Paolini, R.; Haddad, S.; Vasilakopoulou, K.; Santamouris, M. Predicting the magnitude and the characteristics of the urban heat island in coastal cities in the proximity of desert landforms. The case of Sydney. Sci. Total Environ. 2020, 709, 136068. [Google Scholar] [CrossRef] [PubMed]
- Roman, K.K.; O’Brien, T.; Alvey, J.B.; Woo, O. Simulating the effects of cool roof and PCM (phase change materials) based roof to mitigate UHI (urban heat island) in prominent US cities. Energy 2016, 96, 103–117. [Google Scholar] [CrossRef]
- Ramamurthy, P.; Sangobanwo, M. Interannual variability in urban heat island intensity over 10 major cities in the United States. Sustain. Cities Soc. 2016, 26, 65–75. [Google Scholar] [CrossRef]
- Zhou, D.; Zhao, S.; Liu, S.; Zhang, L.; Zhu, C. Surface urban heat island in China’s 32 major cities: Spatial patterns and drivers. Remote Sens. Environ. 2014, 152, 51–61. [Google Scholar] [CrossRef]
- Santamouris, M.; Cartalis, C.; Synnefa, A.; Kolokotsa, D. On the impact of urban heat island and global warming on the power demand and electricity consumption of buildings—A review. Energy Build. 2015, 98, 119–124. [Google Scholar] [CrossRef]
- Founda, D.; Santamouris, M. Synergies between Urban Heat Island and Heat Waves in Athens (Greece), during an extremely hot summer (2012). Sci. Rep. 2017, 7, 10973. [Google Scholar] [CrossRef] [Green Version]
- Paravantis, J.; Santamouris, M.; Cartalis, C.; Efthymiou, C.; Kontoulis, N. Mortality Associated with High Ambient Temperatures, Heatwaves, and the Urban Heat Island in Athens, Greece. Sustainability 2017, 9, 606. [Google Scholar] [CrossRef] [Green Version]
- Tan, J.; Zheng, Y.; Tang, X.; Guo, C.; Li, L.; Song, G.; Zhen, X.; Yuan, D.; Kalkstein, A.J.; Li, F.; et al. The urban heat island and its impact on heat waves and human health in Shanghai. Int. J. Biometeorol. 2010, 54, 75–84. [Google Scholar] [CrossRef] [PubMed]
- Ngarambe, J.; Nganyiyimana, J.; Kim, I.; Santamouris, M.; Yun, G.Y. Synergies between urban heat island and heat waves in Seoul: The role of wind speed and land use characteristics. PLoS ONE 2020, 15, e0243571. [Google Scholar] [CrossRef]
- Rosenfeld, A.H.; Akbari, H.; Bretz, S.; Fishman, B.L.; Kurn, D.M.; Sailor, D.; Taha, H. Mitigation of Urban Heat Islands: Materials, Utility Programs, Updates. Energy Build. 1995, 22, 255–265. [Google Scholar] [CrossRef]
- O’Malley, C.; Piroozfar, P.; Farr, E.R.P.; Pomponi, F. Urban Heat Island (UHI) mitigating strategies: A case-based comparative analysis. Sustain. Cities Soc. 2015, 19, 222–235. [Google Scholar] [CrossRef] [Green Version]
- Akbari, H.; Kolokotsa, D. Three Decades of Urban Heat Islands and Mitigation Technologies Research. Energy Build. 2016, 133, 834–842. [Google Scholar] [CrossRef]
- Santamouris, M.; Ding, L.; Fiorito, F.; Oldfield, P.; Osmond, P.; Paolini, R.; Prasad, D.; Synnefa, A. Passive and active cooling for the outdoor built environment—Analysis and assessment of the cooling potential of mitigation technologies using performance data from 220 large scale projects. Sol. Energy 2017, 154, 14–33. [Google Scholar] [CrossRef]
- Tsoka, S.; Tsikaloudaki, A.; Theodosiou, T. Analyzing the ENVI-met microclimate model’s performance and assessing cool materials and urban vegetation applications–A review. Sustain. Cities Soc. 2018, 43, 55–76. [Google Scholar] [CrossRef]
- Shinzato, P.; Duarte, D. Microclimatic Effect of Vegetation for Different Leaf Area Index-LAI. In Proceedings of the 28th International PLEA Conference: Opportunities, Limits & Needs towards an Environmentally Responsible Architecture, Lima, Peru, 7–9 November 2012; Volume 6. [Google Scholar]
- Zhao, Q.; Sailor, D.J.; Wentz, E.A. Impact of tree locations and arrangements on outdoor microclimates and human thermal comfort in an urban residential environment. Urban For. Urban Green. 2018, 32, 81–91. [Google Scholar] [CrossRef] [Green Version]
- Tsoka, S.; Leduc, T.; Rodler, A. Assessing the effects of urban street trees on building cooling energy needs: The role of foliage density and planting pattern. Sustain. Cities Soc. 2021, 65, 102633. [Google Scholar] [CrossRef]
- Salata, F.; Golasi, I.; Petitti, D.; de Lieto Vollaro, E.; Coppi, M.; de Lieto Vollaro, A. Relating microclimate, human thermal comfort and health during heat waves: An analysis of heat island mitigation strategies through a case study in an urban outdoor environment. Sustain. Cities Soc. 2017, 30, 79–96. [Google Scholar] [CrossRef]
- Wang, Y.; Berardi, U.; Akbari, H. Comparing the effects of urban heat island mitigation strategies for Toronto, Canada. Energy Build. 2016, 114, 2–19. [Google Scholar] [CrossRef]
- Huynh, C.; Eckert, R. Reducing heat and improving thermal comfort through urban design-A case study in Ho Chi Minh city. Int. J. Environ. Sci. Dev. 2012, 3, 480. [Google Scholar] [CrossRef]
- Alchapar, N.L.; Correa, E.N. The use of reflective materials as a strategy for urban cooling in an arid “OASIS” city. Sustain. Cities Soc. 2016, 27, 1–14. [Google Scholar] [CrossRef]
- Peron, F.; De Maria, M.M.; Spinazzè, F.; Mazzali, U. An analysis of the urban heat island of Venice mainland. Sustain. Cities Soc. 2015, 19, 300–309. [Google Scholar] [CrossRef]
- Metzger Kristina, B.; Kazuhiko, I.; Matte Thomas, D. Summer Heat and Mortality in New York City: How Hot Is Too Hot? Environ. Health Perspect. 2010, 118, 80–86. [Google Scholar] [CrossRef]
- Litardo, J.; Palme, M.; Borbor-Córdova, M.; Caiza, R.; Macías, J.; Hidalgo-León, R.; Soriano, G. Urban Heat Island intensity and buildings’ energy needs in Duran, Ecuador: Simulation studies and proposal of mitigation strategies. Sustain. Cities Soc. 2020, 62, 102387. [Google Scholar] [CrossRef]
- Landsat. Available online: https://www.nasa.gov/mission_pages/landsat/main/index.html (accessed on 24 June 2021).
- Open Street Map. Available online: https://www.openstreetmap.org/#map=16/37.3869/127.1152&layers=Y (accessed on 25 June 2021).
- Tsoka, S.; Tsikaloudaki, K.; Theodosiou, T. Urban space’s morphology and microclimatic analysis: A study for a typical urban district in the Mediterranean city of Thessaloniki, Greece. Energy Build. 2017, 156, 96–108. [Google Scholar] [CrossRef]
- Wang, Y.; Akbari, H. Analysis of urban heat island phenomenon and mitigation solutions evaluation for Montreal. Sustain. Cities Soc. 2016, 26, 438–446. [Google Scholar] [CrossRef]
- Sodoudi, S.; Zhang, H.; Chi, X.; Müller, F.; Li, H. The influence of spatial configuration of green areas on microclimate and thermal comfort. Urban For. Urban Green. 2018, 34, 85–96. [Google Scholar] [CrossRef]
- Park, M.; Hagishima, A.; Tanimoto, J.; Narita, K. Effect of urban vegetation on outdoor thermal environment: Field measurement at a scale model site. Build. Environ. 2012, 56, 38–46. [Google Scholar] [CrossRef]
- Aram, F.; Higueras García, E.; Solgi, E.; Mansournia, S. Urban green space cooling effect in cities. Heliyon 2019, 5, e01339. [Google Scholar] [CrossRef] [PubMed] [Green Version]
- Taha, H.; Akbari, H.; Rosenfeld, A. Heat island and oasis effects of vegetative canopies: Micro-meteorological field-measurements. Theor. Appl. Climatol. 1991, 44, 123–138. [Google Scholar] [CrossRef] [Green Version]
- Akbari, H.; Pomerantz, M.; Taha, H. Cool surfaces and shade trees to reduce energy use and improve air quality in urban areas. Sol. Energy 2001, 70, 295–310. [Google Scholar] [CrossRef]
- Zhang, Z.; Lv, Y.; Pan, H. Cooling and humidifying effect of plant communities in subtropical urban parks. Urban For. Urban Green. 2013, 12, 323–329. [Google Scholar] [CrossRef]
- Gillner, S.; Vogt, J.; Tharang, A.; Dettmann, S.; Roloff, A. Role of street trees in mitigating effects of heat and drought at highly sealed urban sites. Landsc. Urban Plan. 2015, 143, 33–42. [Google Scholar] [CrossRef]
- Climatic Behavior of Various Urban Parks during Hot and Humid Summer in the Mediterranean City of Tel Aviv, Israel-Potchter, 2006. International Journal of Climatology, Wiley Online Library. Available online: https://0-rmets-onlinelibrary-wiley-com.brum.beds.ac.uk/doi/abs/10.1002/joc.1330 (accessed on 25 June 2021).
- Shashua-Bar, L.; Hoffman, M.E. Vegetation as a climatic component in the design of an urban street: An empirical model for predicting the cooling effect of urban green areas with trees. Energy Build. 2000, 31, 221–235. [Google Scholar] [CrossRef]
- Souch, C.A.; Souch, C. The effect of trees on summertime below canopy urban climates: A case study bloomington, indiana. J. Arboric. 1993, 19, 303–312. [Google Scholar]
- Golden, J.S.; Carlson, J.; Kaloush, K.E.; Phelan, P. A comparative study of the thermal and radiative impacts of photovoltaic canopies on pavement surface temperatures. Sol. Energy 2007, 81, 872–883. [Google Scholar] [CrossRef]
- Piselli, C.; Castaldo, V.L.; Pigliautile, I.; Pisello, A.L.; Cotana, F. Outdoor comfort conditions in urban areas: On citizens’ perspective about microclimate mitigation of urban transit areas. Sustain. Cities Soc. 2018, 39, 16–36. [Google Scholar] [CrossRef]
- Fahmy, M.; Sharples, S.; Yahiya, M. LAI based trees selection for mid latitude urban developments: A microclimatic study in Cairo, Egypt. Build. Environ. 2010, 45, 345–357. [Google Scholar] [CrossRef] [Green Version]
- Oke, T.R. Initial Guidance to Obtain Representative Meteorological Observations at Urban Sites; World Meteorological Organization: Geneva, Switzerland, 2006. [Google Scholar]
- Soltani, A.; Sharifi, E. Daily variation of urban heat island effect and its correlations to urban greenery: A case study of Adelaide. Front. Archit. Res. 2017, 6, 529–538. [Google Scholar] [CrossRef]
Figure 1.
Surface temperature (a) and tree health conditions (b) at the study area. The original data was obtained via Landsat 8 [29].
Figure 1.
Surface temperature (a) and tree health conditions (b) at the study area. The original data was obtained via Landsat 8 [29].

Figure 2.
The study area (a), the examined street canyon (b), aerial pictures of the location (c). The location of the logger in the vegetation is shown by the green colour, and that in the exposed area is shown in the grey colour. This contains data from the Open Street Map and the Open Street Foundation that were made available under the open-source database [30].

Figure 3.
Three-dimensional input of the study domain (a), and the plot input file (b).

Figure 4.
Correlation coefficient and root mean square error between simulated values and measured values of air temperature (a) and relative humidity (b).
Figure 4.
Correlation coefficient and root mean square error between simulated values and measured values of air temperature (a) and relative humidity (b).

Figure 5.
Air temperature fluctuations between the vegetated areas (Point 1, Point 2 and Point 3) and the exposed area (Point 4).
Figure 5.
Air temperature fluctuations between the vegetated areas (Point 1, Point 2 and Point 3) and the exposed area (Point 4).

Figure 6.
Relative humidity fluctuations between the vegetated areas (Point 1, Point 2, Point 3) and the exposed area (Point 4).
Figure 6.
Relative humidity fluctuations between the vegetated areas (Point 1, Point 2, Point 3) and the exposed area (Point 4).

Figure 7.
Comparison of the effect of the tree percentage on the air temperature reduction at the height of 1.5 m; high LAD (a) and low LAD (b).
Figure 7.
Comparison of the effect of the tree percentage on the air temperature reduction at the height of 1.5 m; high LAD (a) and low LAD (b).

Figure 8.
Comparison of the effect of the leaf area density on air temperature reduction at the height of 1.5 m between the base case scenario and study scenarios; intensive greenery (a) and moderate greenery (b).
Figure 8.
Comparison of the effect of the leaf area density on air temperature reduction at the height of 1.5 m between the base case scenario and study scenarios; intensive greenery (a) and moderate greenery (b).

Figure 9.
Comparison of the effect of a cool pavement on the air temperature reduction at the height of 1.5 m; albedo.0.2 (a) and albedo 0.4 (b).
Figure 9.
Comparison of the effect of a cool pavement on the air temperature reduction at the height of 1.5 m; albedo.0.2 (a) and albedo 0.4 (b).

Figure 10.
Diurnal temperature variations under different scenarios. The black dots indicate the mean diurnal temperature.
Figure 10.
Diurnal temperature variations under different scenarios. The black dots indicate the mean diurnal temperature.

Figure 11.
Vertical section of the spatial air temperature distribution of the study.

Figure 12.
Horizontal section of the spatial air temperature distribution at the height of 1.5 m.


Table 1.
Scenarios involving tree percentage and LAD changes with 0.2 surface albedo.
| Scenario | The Percent of Trees Coverage [%] | Leaf Area Density (LAD) |
|---|---|---|
| C1 | 20 | High |
| C2 | 30 | High |
| C3 | 50 | High |
| C4 | 60 | High |
| C5 | 20 | Low |
| C6 | 30 | Low |
| C7 | 50 | Low |
| C8 | 60 | Low |
Table 2.
Scenarios involving tree percentage and LAD changes with 0.4 surface albedo.
| Scenario | The Percent of Trees Coverage [%] | Leaf Area Density (LAD) |
|---|---|---|
| C9 | 20 | High |
| C10 | 30 | High |
| C11 | 50 | High |
| C12 | 60 | High |
| C13 | 20 | Low |
| C14 | 30 | Low |
| C15 | 50 | Low |
| C16 | 60 | Low |
Table 3.
Input parameters for ENVI-met validation.
| Parameters | Element [Unit] | Input Values |
|---|---|---|
| Meteorological data | Hourly air temperature [°C] | Hourly data from field study |
| Hourly relative humidity [%] | Hourly data from field study | |
| Wind speed, 10 m [m/s] | Weather station data | |
| Wind direction [°] | Weather station data | |
| Cloud cover [Octas] | Weather station data | |
| Street characteristics | Length [m] | 189 |
| Road width [m] | 10 | |
| Building heights [m] | Between 9.9–14 | |
| Aspect ratio | 1.4 | |
| Roof albedo | 0.15 | |
| Road albedo | 0.2 | |
| Wall albedo | 0.2 | |
| Tree characteristics | Crown diameter [m] | 3 |
| Height [m] Albedo | 5 0.18 |
Publisher’s Note: MDPI stays neutral with regard to jurisdictional claims in published maps and institutional affiliations. |
© 2021 by the authors. Licensee MDPI, Basel, Switzerland. This article is an open access article distributed under the terms and conditions of the Creative Commons Attribution (CC BY) license (https://creativecommons.org/licenses/by/4.0/).
Share and Cite
MDPI and ACS Style
Tamaskani Esfehankalateh, A.; Ngarambe, J.; Yun, G.Y. Influence of Tree Canopy Coverage and Leaf Area Density on Urban Heat Island Mitigation. Sustainability 2021, 13, 7496. https://0-doi-org.brum.beds.ac.uk/10.3390/su13137496
AMA Style
Tamaskani Esfehankalateh A, Ngarambe J, Yun GY. Influence of Tree Canopy Coverage and Leaf Area Density on Urban Heat Island Mitigation. Sustainability. 2021; 13(13):7496. https://0-doi-org.brum.beds.ac.uk/10.3390/su13137496
Chicago/Turabian StyleTamaskani Esfehankalateh, Atefeh, Jack Ngarambe, and Geun Young Yun. 2021. "Influence of Tree Canopy Coverage and Leaf Area Density on Urban Heat Island Mitigation" Sustainability 13, no. 13: 7496. https://0-doi-org.brum.beds.ac.uk/10.3390/su13137496
Note that from the first issue of 2016, this journal uses article numbers instead of page numbers. See further details here.