
Cooperative Green Technology Innovation of an E-Commerce Sales Channel in a Two-Stage Supply Chain

Department of Management Science and Engineering, School of Business, Qingdao University, Qingdao 266071, China
*
Author to whom correspondence should be addressed.
Sustainability 2021, 13(13), 7499; https://0-doi-org.brum.beds.ac.uk/10.3390/su13137499
Submission received: 1 June 2021
/
Revised: 23 June 2021
/
Accepted: 2 July 2021
/
Published: 5 July 2021
(This article belongs to the Special Issue Green and Sustainable Supply Chains)
Abstract
:The potential broad market of green consumption has encouraged an increasing number of enterprises to carry out green technology innovation activities. This paper examines a two-stage supply chain of e-commerce sales channels under different cooperative models. We find that consumers’ green preferences are the main factor that affects green product market demand. The manufacturer and the retailer can raise the levels of green technology innovation and extend green promotional services to expand product market demand in online and offline channels. However, consumers’ e-commerce preferences and online free-riding behaviors affect the manufacturer’s sales channel choice. The retailer can improve the level of green promotional services to hold offline channel market demand, while promotional behaviors have a positive/negative spillover effect on online market demand if the level of free riding falls above/below consumers’ e-commerce preferences. The higher the cooperative level is, the later the manufacturer will open the online channel and close the offline channel to ensure a high level of green promotional service from the cooperative retailer. The results show that the stronger the level of cooperation among all members is, the better the economic, ecological, and social benefits will be. Therefore, we design a revenue-cost sharing contract that can effectively motivate green technology innovation and green promotional services and afford all members win-win profits.
1. Introduction
With the marked improvement of consumers’ environmental awareness, consumers pay more and more attention to products’ green attributes or carbon labels during purchasing products. In other words, consumers are more sensitive to green products to fulfill their social responsibility [1]. Aliresearch data show that the proportion of consumers who buy green products from Alibaba’s retail platform increased rapidly from 3.8% in 2011 to 16.2% in 2015, with the fastest growth found for the group aged 23–28 and the average premium for green products reaching 33%. From 2012 to 2016, the Chinese government purchased $746 billion worth of energy-saving (water-saving) products [2]. Against this setting, producing green products can not only maintain and enhance the enterprises’ reputation for responsibility [3], but also improve competitive benefits and the sustainable performance of the supply chain [4]. For this reason, an increasing number of enterprises are engaging in green technology innovation [5]. For example, Haier has continuously increased its R&D investment, causing its green management of the product life cycle to reach internationally advanced levels. Microsoft has set up a $1 billion Climate Innovation Fund to reduce carbon emissions through carbon reduction and elimination technologies. Apple plans to reduce carbon emissions through low carbon product design, energy efficiency expansion, renewable energy utilization, process and material innovation, and carbon removal to achieve 100% carbon neutrality in its supply chain by the end of 2030 [6]. Meanwhile, governmental policy and legislation will facilitate public sector organizations to implement sustainable procurement, achieve sustainable development, and further promote green innovative activities [7,8]. For example, EU HORIZON 2020 and the European Structural and Investment Funds focus on investments in sustainable economies, with some priorities contributing to investment in ecological innovation technologies. China Environmental Labelling is committed to constantly improving green industry evaluation systems and encouraging green innovation activities. Due to the attention of consumers, enterprises, governments, and other sectors of society being paid to green environmental protection, green supply chain management has become a hot topic for many scholars [9].
When the manufacturer innovates green technology successfully, it can entrust the retailer with a service advantage to promote his green product to expand the market. Through the research and development (R&D) and promotion service of green products, the manufacturer and retailer not only fulfill their social responsibilities, but also have a cooperative relationship while expanding the market scale and obtaining more profits. In practice, GOME analyzes the market demand of green appliances and promotes Haier’s green appliances in physical stores based on a three-year cooperation agreement to achieve sales of 50 billion yuan. GOME also provides high-quality display and sales platform services for Haier green products. Led by GOME, the consumption of green appliances has been fully realized and such products have entered millions of households across China [10]. In addition, Suning has successively signed strategic orders with Haier, Samsung, and Midea to engage in in-depth cooperation in the consumption of green and smart appliances. Suning also organizes a special “green plan” show in all channels, covering green design products for electricity, households, FMCG, and other categories. To better motivate retail terminals to carry out green promotional services, manufacturers can enhance cooperation with retailers. For instance, Samsung helps retail stores train promoters by sharing promotional costs.
The operating processes of technology development and product sales are usually divided into two stages [11]. In stage 1, when green technology is successfully innovated and products produced through this technology unfold the market through the retailer’s promotional services, the manufacturer can entrust the retailer to sell green products in stage 2. In addition, currently e-commerce business is becoming increasingly popular among consumers due to the convenience of online shopping. According to the latest figures from the French Confederation of Trade Promotion, online sales at its member merchants grew by 35% overall during the discount season of 2020. China’s National Bureau of Statistics shows that China’s online retail sales reached 6078.5 billion yuan from January to July 2020 [12]. To expand the market and reap profits, an increasing number of manufacturers are opening online channels along with using the traditional retail channel to form a dual-channel sales system, e.g., in addition to offline channels, Haier also sells products through official malls, the Haier Smart Home App, and official flagship stores through e-commerce platforms. Apple has opened an online store that allows consumers to access electronic products without going to physical stores during the COVID-19 epidemic. However, when a dual channel is used, the online channel often has a price advantage, while the traditional channel has a service advantage which is costly to provide but has the characteristics of a public good [13]. Although consumers who experience sales services at retail stores are persuaded to buy the product, they may turn to purchase products from the online channel with a lower price to maximize their surplus [14]; that is, the online channel exhibits free-riding behavior from the retailer’s promotional service. This phenomenon is not conducive to cooperation among all members and should be given more attention.
As illustrated by the above case, green product research and development (R&D) and e-commerce are hot issues in real life. However, we find that few scholars pay attention to dual-channel green R&D when considering free-riding behavior and e-commerce preferences. At the same time, there has been no research on the influence of cooperative relationships on sales channel strategy in the green supply chain. Accordingly, we study the following questions. First, how do consumers’ green preferences, the manufacturer’s green technology innovation, and the retailer’s green promotional service influence product market demand? What are the conditions under which the manufacturer opens an e-commerce sales channel in addition to an offline channel, and how do consumers’ green and e-commerce preferences and online free-riding behavior influence the manufacturer’s sales channel choice? Second, how do cooperative relationships between the manufacturer and retailer influence the manufacturer’s sales channel choice? Third, do higher levels of cooperation enhance green technology innovation and green promotional services and economic, ecological and social benefits? If this is true, this leads us to a fourth question of whether the manufacturer can use a revenue-cost sharing contract to realize full-channel coordination and enhance all members’ benefits.
To answer the above four questions, we model a two-stage dual-channel supply chain composed of a manufacturer and a retailer. In stage 1, the manufacturer successfully implements green technology for consumers’ green preferences and entrusts the retailer to encourage certain products to open the market. In stage 2, the manufacturer produces products with green technology and sells them through online and offline sales channels. The consumer utility selection theory is used to determine product market demand. This approach can help us analyze the effects of consumers’ green and e-commerce preferences, the manufacturer’s level of green technology innovation, and the retailer’s promotional services on product market demand. Game theory is also used to determine all members’ cooperative decisions. We compare levels of green technology innovation and green promotional services, pricing decisions and market demand, and economic, ecological and social benefits under centralized and wholesale price and green promotional service cost-sharing models. The results show that the higher the level of cooperation is, the more efficient the system is. For this reason, we design a revenue-cost sharing contract to perfectly coordinate all members’ behaviors and improve the operation efficiency of a dual-channel supply chain.
This paper makes contributions in the following three ways. First, we investigate for the first time the joint influences of consumers’ green preferences and free riding behavior on manufacturers’ product greenness, channel choice, environment impact, and social welfare in a green dual-channel supply chain. Consequently, this research builds connections between green innovation and dual-channel supply chain with free-riding behavior. Second, we establish two-stage game models to explore supply chain operation strategies under three different cooperation models (centralized, wholesale price, and green promotional service cost-sharing cooperation models), and then conduct quantitative analysis of the cooperation efficiency for each model. Third, we find that with the rise of the cooperation level, not only does the product greenness and green promotion service levels increase, but the economic, ecological, and social benefits of the supply chain also improve.
The rest of this paper is organized as follows. The relevant literature is reviewed in Section 2. Section 3 describes the dual-channel supply chain game model, establishes the market demand function, and analyzes the impact of green and e-commerce preferences on the manufacturer’s sales channel choice. Three cooperative models are given in Section 4 to analyze the impact of cooperation on the manufacturer’s channel choice. We compare the benefits of the three cooperative models in Section 5. A revenue-cost sharing contract designed to achieve full channel cooperation is described in Section 6. Section 7 concludes the paper.
2. Literature Review
Three fields of achievements are relevant to our work: green R&D in supply chain management, e-commerce supply chain management, and retail service and free-riding management.
2.1. Green R&D in Supply Chain Management
Many scholars have studied green supply chain management problems and found that they can lead to economic and ecological benefits [15,16]. As an efficient activity in green supply chain management, product R&D (research and development) can better improve green technology, to improve the product’s greenness and bring the product to market [17]. Wu et al. [18] find that when a manufacturer invests in emission reduction technology in a green supply chain, the system can achieve economic and social win-win outcomes. Similar studies have been conducted by Wang et al. [19], Ranjan et al. [20], and Ghosh et al. [21].
In this context, some scholars have researched green R&D efficiency problems. For example, Zhu et al. [22] find that price and greenness competition influence the level of green product design. Dey et al. [23] and Gao et al. [24] analyze the influence of strategic inventory and ecolabel policies on R&D-intensive green products and find that they have different effects on green production. Chen et al. [25] find that green R&D cooperation performance is mainly determined by green R&D investment efficiency and the spillover effect. Dey et al. [26] propose that the operating processes of technology development and product sales are divided into two stages and find that compared to those obtained from a conventional single-period procurement decision, supply chain members can obtain higher profits, and manufacturers can invest more in improving product greening levels when the retailer establishes strategic inventory. Dong et al. [27] study investment in green product development (GPD) in a two-period green supply chain and find that the dominance of manufacturers in GPD investment could lead to more revenue for supply chain members and more environmental tax savings for the manufacturer. The above studies of green product design, eco-label policy, and two-period green supply chain have made abundant achievements. However, few of them pay attention to consumer preferences and green promotion service for green supply chain operation efficiency, and there is no literature focusing on the impact of free-riding behavior on e-commerce green supply chain. To bridge the gap, this paper focuses on the impact of consumers’ green preference and free-riding behavior on the operational efficiency and channel strategy of the e-commerce green supply chain, which could provide a reference for green R&D and the production operation of enterprises.
2.2. E-Commerce Supply Chain Management
With the rapid development of e-commerce today, opening online channel along with traditional offline channel to sale product has attracted many scholars’ attention. Chiang et al. [28] find that the opening of online channels can not only improve manufacturers’ profits and give them a greater say in the negotiation process, but also lower wholesale prices to benefit retailers, which alleviates the “double marginal effect” problem. Similar conclusions about the advantages of opening online channels are also drawn by many other scholars (Lan et al. [29], Wang et al. [30], Chen et al. [31], Wang et al. [32]). Zhang et al. [33] take retailers as the leader and construct pure offline, pure online, and dual-channel supply chain respectively, and study the sales channel choice. They find that the offline retailer may strategically open the online channel where market demand is low in order to obtain lower wholesale prices from the manufacturer. Wang et al. [34] research how a manufacturer selects a direct-sales channel or a third-party consignment channel to complement their existing physical retail channel. They find that manufacturer’s sales choice between direct-sales channel or a third-party consignment channel is influenced by unit operating cost in the direct e-channel or the e-tailer’s revenue allocation ratio in the consignment e-channel. The above scholars have made corresponding research on the opening of online channels, but with the rapid development of e-commerce, they are still somewhat inadequate.
Since then, dual-channel supply chain management has attracted extensive attention of many scholars. There are different opinions when considering different influencing factors. Mukhopadhyay et al. [35] study a supply chain with a traditional manufacturer and a retailer, in which the manufacturer can sell products directly to consumers. To eliminate the resulting channel conflict, the manufacturer allows the retailer to increase market demand by increasing the value of their products. Rahmani et al. [36] pay attention to the demand disruption management in a dual-channel supply chain producing and selling green products and find that demand disruption is not only beneficial to the supply chain, but also can bring more enhancements to products’ greening level. Li et al. [37] mainly study the pricing decisions of competitive supply chains in different power structures. Research shows that no matter how competitive intensity is, supply chain members can reap more benefits by playing the role of leader. In addition, whether the leader has the motivation to play a leadership role depends on the asymmetric state of relative channels. Shi et al. [38] study the vertical and horizontal competitions among the manufacturer, online retailer, and physical store via considering different power structures of the supply chain to derive supply chain members’ contract choices. Their results show that a product’s matching probability, travel cost to physical stores, and profit-sharing ratio have important influences on supply chain members’ contract choices. Huang et al. [39] point out that when the supplier establishes a direct channel, retailers may voluntarily share demand information in antitrust to prevent suppliers from encroachment. Sharing low demand information will hinder the supplier from establishing a direct sales channel and reduce downstream channel competition. Ye et al. [40] discuss the conditions for retailers to establish an online channel alongside its offline physical store when considering promised delivery time and find logistics capability of the third-party logistics provider and the degree of demand competition have important impacts. Yang et al. [41] analyze the behavior of the manufacturer and retailer in centralized and decentralized models through consumer reviews and find that it is not necessarily wise for the manufacturer to provide online consumer reviews in the online channel unless the information revealed by online consumer reviews is sufficiently favorable. Yan et al. [42] consider the horizontal and vertical pricing games between the capital-constrained manufacturer and the e-retailer providing finance. They find that increased profits generated from financing offerings can offset the lowered revenue in the online distribution channel, and e-retailer finance can increase market share, which also benefits the supplier. The above studies mostly focus on topics such as power structure, channel conflict, and supply chain finance. This paper for the first time studies the influences of green R&D and free-riding behavior on channel selection and cooperation strategy in dual-channel supply chain, which can well add to the existing body of knowledge.
2.3. Retail Service and Free-Riding Management
As an effective means of sales promotion for the retailer, retail services are also an effective means to cope with competition from direct marketing channels. Zhang et al. [43] note that dominant retailers investing in services provide an effective anti-encroachment measure and may lead to Pareto improvement for both supply chain members and consumers. Moreover, Pi et al. [44] consider each channel’s demand disruption in a dual-channel supply chain consisting of one manufacturer and two retailers and find that retailers’ cooperation in service and pricing improves the performance of each retailer but reduces the profits of manufacturers and the supply chain. In view of the impact of services, some scholars have conducted research focused on different aspects. Dan et al. [45] and Wang et al. [46] research the impact of retail services on the pricing and service decisions of dual-channel supply chains considering different decision-making models and supply chain structures, respectively. Li et al. [47] consider the optimal decisions of different service channels and conclude that when the service cost is the same, the manufacturer and retailer tend to bear the service cost themselves or employ a third party to provide the service. Dan et al. [48] subdivide services into warranty and free value-added services and find that implementing the differentiation strategy of value-added services may harm the profits of all members and the whole supply chain. It can be seen from the above literature that promotion service has always been a hot topic studied by scholars. At the same time, with the rapid development of e-commerce nowadays, the consumers’ free-riding behavior is also becoming more and more popular.
It has been found that up to 20% of consumers in both offline and online channels engage in free-riding behavior, which means that when consumers accept services in the offline channel and understand product features, they use the online channel with a lower price to purchase the product [49]. Most scholars hold that free riding reduces retailers’ sales efforts to provide services [50], while some scholars have also found that contract coordination can improve retailers’ service levels when free riding behavior exists (Zhou et al. [51], Dan et al. [52]). He et al. [53] point out that although manufacturers may gain economic benefits from consumer free riding behavior, total carbon emissions across the supply chain also increase. The above literature discusses the negative aspects of free riding and corresponding actions designed to mitigate these impacts, while some studies focus on the positive side of free riding. Yan et al. [54] prove that bidirectional free-riding under online finance can provide additional benefits to supply chain members. Luo et al. [55] find that manufacturers’ free-riding behavior has both negative and positive effects. When both customer acceptance of the direct online channel and the degree of free riding are low, free riding behavior motivates the retailer to improve its service level. Pu et al. [56] show that the centralized setting is better than the decentralized setting in terms of sales effort and supply chain profits, and both decrease as the number of free-riding consumers increases. The above studies of free-riding behavior have great theoretical value and practical significance. This paper fills a gap in the existing literature by analyzing the impact of free-riding behavior and product green research and development (R&D) on supply chain cooperation strategy and operational efficiency.
2.4. Research Gaps
From the above literature review, we find rich achievements in green R&D in the supply chain and in dual-channel supply chain management. These results highlight the benefits of green innovation and e-commerce. A summary of closely related papers and our work is shown in Table 1.
Table 1 shows that few works have examined green R&D problems affecting dual-channel supply chains. Thus, there has been no research on how consumers’ green and e-commerce preferences and online free-riding behavior influence sales channel strategy or how the cooperative relationships among supply chain members influence sales channel strategy. To fill this gap, similar to Yu et al. (2019) [17], we consider a two-stage dual-channel supply chain with an e-commerce sales channel and cooperation strategies of the dual-channel supply chain adopted when consumers exhibit free-riding behaviors.
3. Model Development
We consider a supply chain composed of an innovative manufacturer as the leader and a promotional retailer as the follower operating in an e-commerce environment. The supply chain operation process is divided into two stages. Stage 1 is the innovation and promotion period. The manufacturer invests in green technology innovation based on consumers’ green preferences and opens the market through promotional services provided by cooperative retailers. We define cooperation as different entities working on independent business activities towards a common (agreed-on) goal, either to improve performances or to solve conflicts [57]. Stage 2 is the production and sales period. For market demand for occupied and determined products, the manufacturer produces products with green technology and sells them through the traditional retail and e-commerce direct channels simultaneously. All members expect to maximize their own profits through the two-stage operation process.
Consumers who have experienced green promotional services in stage 1 purchase products due to their green preferences in stage 2. All customers aim to maximize their consumer surplus by choosing offline or online channels. For this reason, some consumers are likely to choose the online channel for shopping if they have strong e-commerce preferences. In addition, the manufacturer exhibits free-riding behavior for green promotional services provided by the retailer in stage 1. Please see Figure 1 for the details of the operation process of the two-stage dual-channel supply chain. The notations used in this paper are summarized in Table 2.
3.1. Green Technology Innovation and Promotional Services
To satisfy consumers’ green preferences, the manufacturer innovates green technology to produce green products with low carbon emissions. is the product’s greenness, which represents the level of carbon emissions reduction achieved relative to nongreen products performing the same function. The higher the level of product greenness is, the more investment in green technology is needed. The cost of green technology innovation is , and is the cost rate of green technology innovation.
The manufacturer as the leader plays an important role in improving the competitiveness and sustainable development of the supply chain by mutual support and cooperative engagement of upstream and downstream enterprises [58]. After the manufacturer innovates the green technology, the cooperative retailer promotes green products produced from the green technology through green promotional services (such as green advertising, green promotion, and improved shopping experiences and offline after-sales services). In this way, the retailer can not only open the green products market but also encourages consumers to choose the offline channel to purchase products, which is used as an effective measure to cope with online channel competition. The stronger the retailer’s green promotional service is, the greater the required investment becomes. The cost of the retailer’s green promotional service is , where is the green promotional service level and is the cost rate of the green promotional service.
Clearly, the manufacturer’s green technology innovation cost is higher than the retailer’s green promotional service cost, so the cost rate of green technology innovation is higher than the cost rate of green promotional services, i.e., [5].
3.2. Product Market Demand
After the manufacturer successfully innovates green products and promotes them to consumers through the cooperative retailer, he will produce products with green technology and sell them through offline and online channels. Consumers have different preferences for the two channels.
- In the offline channel, consumers can physically experience and immediately possess products, so we assume that consumer utility is (the consumer utility of product functional attributes and shopping experience). is uniformly distributed in the range of [0, 1] with a density of 1.
- In the online channel, due to a lack of physical experience and immediate access, we assume that consumer utility is , where represents the consumer e-commerce preference.
We assume that product greenness can increase consumer utilities in the two channels to the same extent , in which is consumer green preference. The increase in consumer utility from green promotional services is when consumers purchase products through an offline channel. represents consumer sensitivity to green promotional services of offline channels. Some consumers who approve of the retailer’s green promotional service may turn to buying products through online channels due to their e-commerce preference. It is assumed that the perceived utility of these consumers with green promotional service level is . is online consumers’ sensitivity to the green promotional service level. Compared to when purchasing products in offline channels, most consumers will lack presale and in-sale services, such as reception, shopping guides, displays, trials, assistance with selection, debugging and packaging assistance, and after-sales services such as door-to-door installation and on-site guidance, when using online channels. Therefore, online consumers’ sensitivity to green promotional services will not be greater than that experienced through offline channels, i.e., . In addition, to maintain analytical tractability, we assume that .
Based on the above assumptions, each consumer will consider the following two conditions when he chooses a channel from which to purchase products:
- The consumer can obtain nonnegative surplus (consumer surplus is the total consumer utility minus the unit sales price of product) when he purchases products through one channel. Based on this, the consumer surplus from purchasing products through the offline channel is expressed as , where is the offline retail price. There exists a threshold of where under condition , a positive consumer surplus can be achieved by purchasing products through the offline channel. Therefore, the market demand of the pure offline channel is . Likewise, the consumer surplus achieved when purchasing products through the online channel is expressed as , where is the online sales price. There also exists a threshold where under condition , the consumer can obtain a positive consumer surplus when he purchases products in this channel. Therefore, the market demand of the pure online channel is .
- The consumer surplus obtained through one channel is greater than that obtained from the other channel. Specifically, the consumer will compare the surpluses of both channels and then choose the channel that can generate more consumer surplus. Therefore, at another critical threshold , the consumer can obtain the same utility from both sales channels, i.e., . Now, we can easily conclude that, when keeping the online and offline retail prices unchanged, increases with an increase in consumer e-commerce preference and free riding, while it decreases with the promotional service level. This is the case because the stronger e-commerce preferences and free riding behavior are, the more surplus consumers can obtain from the online channel, causing more consumers to turn to the online channel. On the other hand, a higher promotional service level will enable offline consumers to obtain more consumer surplus, causing more consumers to shift from online to offline channels.
Thus, the market demand functions of the pure offline channel (Figure 2a), dual-channel (Figure 2b), and pure online channel (Figure 2c) supply chain can be expressed as follows:
Functions (1) and (2) indicate that there are price bounds and . When the offline channel retail price is not higher than , all consumers can obtain more surplus from the offline channel, and then the manufacturer only opens the offline channel. When the offline channel retail price is moderate and lies within , some consumers can obtain more surplus from the offline channel while for the others, the opposite is the case, so the manufacturer opens a dual-channel system. When the offline channel retail price is not lower than , all consumers can obtain more surplus from the online channel, and the manufacturer only opens an online channel. However, in this case, the retailer cannot obtain any revenue for zero offline market demand, and the cooperative relationship will be destroyed. For this reason, we only focus on the two cases of offline channels and dual-channel supply chains. The pure online channel model is excluded from the following study.
From Equations (1) and (2), when , we can obtain the pure offline market demands as follows:
When , we can derive dual-channel market demand in the offline and online channels as follows:
3.3. Impact of Green and E-Commerce Activities on the Manufacturer’s Sales Channel Choice
To intuitively analyze the impact of consumers’ green preferences, the manufacturer’s green technology innovation, the retailer’s green promotional service, and consumers’ e-commerce preferences and free-riding behavior on the manufacturer’s sales channel choice, we assume that the online and offline prices remain unchanged, and we can obtain Table 3. Table 3 shows the following:
- When consumer green preference and product greenness increase, the lower price bound decreases, and the upper price bound remains unchanged. This means that as these two parameters (variables) increase, the manufacturer should open the online channel earlier but should not close the offline channel if at the beginning. This is the case because as , increases, and decrease, and remains the same. The increase in , means that consumers with green preferences are more willing to pay in offline and online channels. From and , we find that consumers’ willingness to pay increases more in the online channel than in the offline channel (). When , increases further, resulting in , some consumers can obtain a more positive surplus in the online channel than in the offline channel. Then, the manufacturer should open the online channel to sell products based on the offline channel. Now the offline market demand is , which has no relationship to , so the manufacturer maintains the offline channel.
- When the green promotional service level increases, the lower price bound decreases when and increases when , and the upper price bound increases. This means that as this variable increases, the manufacturer should open the online channel early if the degree of free riding exceeds e-commerce preferences. In addition, now, the manufacturer closes the offline channel later. Otherwise, the manufacturer should not open the online channel if the degree of free riding is lower than the e-commerce preference. This is the case because as increases, , and decrease at the same time. An increase in means that consumers can obtain more surplus from both offline and online channels. (a) When , from and , we easily find that consumers can obtain more positive surplus in the online channel than in the offline channel when . Now, when increases further, resulting in , some consumers can obtain a more positive surplus in the online channel than in the offline channel, and the manufacturer should open the online channel along with the offline channel. Meanwhile, from , the continual increase of causes it to decrease. This implies that more consumers can obtain a more positive surplus in the offline channel, while the upper price bound will increase. (b) When , from and , we easily find that consumers can obtain more positive surplus in the offline channel than from the online channel when , and the manufacturer does not open the online channel.
- If consumers’ e-commerce preferences and degree of free riding increase, the lower and upper price bounds decrease. This indicates that the manufacturer should open the online channel and close the offline channel earlier as the two parameters (variables) increase. This is the case because as , increases, remains the same, decreases, and increases. A decrease in means that more consumers can obtain a positive surplus from the online channel. As this value decreases further, which results in , some consumers can obtain more surplus in the online channel than in the offline channel, so the manufacturer should open the online channel along with the offline channel. The continual decrease in and continual increase in mean that an increasing number of consumers can obtain a more positive surplus in the online channel than in the offline channel. When , all consumers obtain a more positive surplus in the online channel than in the offline channel. Then, the manufacturer should close the offline channel and only operate the online channel.
4. Cooperative Models
To explore how the cooperative relationship affects green technology innovation and green promotional service levels as well as total supply chain profits, environmental improvements, consumer surplus, and social welfare, we construct three cooperative models (centralized, wholesale price, and green promotional service cost-sharing cooperation models) to conduct a comparative analysis.
4.1. Centralized Model (C Model)
The centralized cooperative model is the most effective model, which is difficult to realize in practice. However, we can use the results of the centralized system to judge the operational efficiency of some cooperative models and provide a means to improve their operation efficiencies. In the centralized model, all members aim to maximize the total supply chain profit, so we can consider a centralized decision maker. Based on this, stage 1 determines market demand through the development of green technology by the manufacturer and the implementation of green promotional services by the retailer. In stage 2, after obtaining market demand information, the centralized decision maker determines the online and offline channels’ retail price (when there is a pure offline channel, only the offline channel’s retail price is determined). The profit function of the centralized cooperation model in the pure offline channel and dual channel can be respectively expressed as follows:
In stage 1, the centralized decision maker determines product greenness and the green promotional service level. In stage 2, he determines the sales prices.
4.2. Wholesale Price Model (W Model)
Supply chain members are generally engaged in cooperative relationships with wholesale price contracts, which is more common than C model in real world. We assume that the manufacturer is the leader, and the retailer is the follower. As in the operation process of model C, in stage 1, we can determine the product market demand considering the development of green technology by the manufacturer and the implementation of green promotion services by the retailer. The difference lies in the fact that the manufacturer bears the green technology innovation cost, and the retailer bears the promotional service cost. In stage 2, after obtaining market demand information, the manufacturer sets the wholesale price and direct price in the online channel (when there is a pure offline channel, only the wholesale price is determined), and then the retailer sets the retail price in the offline channel. The profit functions of the manufacturer and retailer in the pure offline channel and dual-channel systems, respectively, are expressed as follows:
In stage 1, the manufacturer decides the level of product greenness, and then the retailer determines the green promotional service level. In stage 2, the manufacturer sets the wholesale price and direct price, and then the retailer sets the retail price.
4.3. Green Promotional Cost-Sharing Model (G Model)
In practice, training, support, awards and other behaviors among enterprises are important factors to promote cooperation [58]. In this paper, the manufacturer can incentivize the retailer to offer promotional services by sharing their promotional cost (e.g., Samsung trains promotional staff for retailers). In this model, both the leading manufacturer and the following retailer take their profits maximization as the decision-making target. In stage 1, after the manufacturer develops the green technology, the retailer carries out the green promotional service, and the manufacturer shares the cost of the green promotional service for the retailer to determine the level of market demand. In stage 2, after obtaining the market demand information, the manufacturer sets the online channel’s retail price and wholesale price (when there is a pure offline channel, only the wholesale price is determined), and the retailer sets the offline channel’s retail price. The profit functions of the manufacturer and retailer in the pure offline channel and dual-channel systems can be expressed as follows:
In stage 1, the manufacturer determines the level of product greenness and the proportion of the green promotional service cost shared with the retailer, and then the retailer determines the green promotional service level. In stage 2, the manufacturer sets the wholesale price and the online channel’s direct price, and then the retailer sets the offline channel’s retail price.
From the backward induction method, we present the equilibrium results for the pure offline and dual-channel supply chains based on the above cooperation models in Table 4. The proofs of the equilibrium results’ convexity verification under different models are given in Appendix A.
4.4. Impact of Cooperative Relationships on the Manufacturer’s Sales Channel Choice
- The lower and upper bounds (, ) are highest in the C model, the second highest in the G model, and the lowest in the W model. This indicates that a higher level of cooperation will lead to the latest opening of the online channel and the latest closing of the offline channel. This is the case because in the W model, opening the online channel earlier and closing the offline channel earlier can enable the manufacturer as the leader to obtain more profits, even if this damages the retailer’s profits. Although the G model improves the level of cooperation through service cost sharing, it is still impossible to make joint efforts to maximize the total supply chain profits. Thus, the C model with the highest level of cooperation will open the online channel and close the offline channel at the latest time.
- With an increase in the level of free riding, we find that similar to what is shown in Table 3, the lower bound decreases in different models. This is the case because in different cooperation models, an increase in the level of free riding will cause more consumers to shift to the online channel, which should be opened earlier. Meanwhile, with an increase in the level of free riding, the upper bound in the W model will decrease, while the G and C models will first decrease and then increase. This is the case because in the W model, more consumers turn to the online channel with an increase in the level of free riding, at which point the manufacturer closes the offline channel earlier to obtain more profits. In the G and C models, when the degree of free riding is not high, the manufacturer will choose to close the offline channel earlier as well; when the degree of free riding is high enough, the online channel’s revenue can be improved by closing the offline channel later through promotional service cost sharing and centralized cooperation.
- Figure 3 shows that with an increase in greenness preferences, the lower and upper bounds increase slightly. Different from Table 3, which keeps the retail price unchanged, we specifically analyze the influence of the equilibrium solution of the retail price, product greenness and green promotional service level on the upper and lower bounds under different models. The increase in the online channel’s retail price with increasing greenness preferences will undoubtedly improve the lower and upper bounds.
Figure 3.
Impact of green preferences and the level of free riding on the lower and upper bounds.

As shown in Figure 4, with the increase in consumers’ e-commerce preferences, the lower bound in the W model decreases, while it increases in the G and C models. The result is not exactly same as that shown in Figure 3. This is the case because with an increase in the level of cooperation, channel conflict will decrease. Thus, when consumers’ e-commerce preferences increase, the online channel’s retail price under the G and C models will improve more significantly than in the W model, causing the lower bound to increase with the increase in consumers’ e-commerce preferences. Meanwhile, when the consumer’s e-commerce preferences are low, opening the online channel in the W model will not only cause the manufacturer to obtain low revenues in the online channel but will also exacerbate channel conflict, leading to a decrease in the manufacturer’s profit, while in the G and C models, opening the online channel can improve both the manufacturer’s and the total supply chain’s profits due to the higher degree of cooperation. Similarly, when consumers’ e-commerce preferences continue to grow, the manufacturer in the W model will open the online channel earlier than in the G and C models because it can earn higher profits, even if channel conflicts hurt the retailer’s profits.
5. Comparative Analysis
Corollary 1.
The higher the level of cooperation is, the stronger product greenness and green promotional services will be in the pure offline and dual-channel systems, i.e., , , ,
Corollary 1 indicates that cooperative G model can not only encourage the retailer to improve the green promotional service level but also help the manufacturer enhance product greenness. However, relative to C model, there is still a gap in the level of cooperation. The proof is given in Appendix B.
We use numerical examples to verify and further analyze the above corollary. The numerical parameters used in this section and following sections are , , , , , and . Figure 5 shows the following:
- Similar to corollary 1, the higher the level of cooperation is, the stronger the greenness of products and the level of green promotional services are.
- With a change in parameters, , , , and are satisfied. These results suggest that: (1) in the dual-channel W and G models, the manufacturer has an incentive to invest more in green technology innovation in dual channels than in pure offline channels. This is the case because when the manufacturer can open the online channel, it can obtain more profits than it can from the pure offline channel, which favors input costs for green technology innovation. (2) In the dual-channel W model, the retailer can invest more in green promotional services in the pure offline channel than in the dual channels. In the G model, the opposite relation is present. This is the case because in the dual-channel W model, the manufacturer does not share green promotional costs with the retailer, and when consumers exhibit free-riding behaviors in dual channels, the incentive for the retailer to provide promotional services will be reduced.
- Under different cooperation models, product greenness increases with the increase in consumers’ preferences for green products. This is the case because product greenness can affect consumers. When consumers’ preferences for green products increase, the manufacturer can invest more in green technology innovation to bring more surplus to consumers to increase market demand and obtain more profits. Therefore, with the increase in consumers’ preferences for green products, manufacturers have an incentive to invest more in green technology innovation.
- Under different cooperation models, product greenness decreases with the increase in the cost rate of green technology innovation. The cost for the manufacturer to invest in green technology is . When the cost rate of green technology innovation increases, the level of product greenness promoted by the manufacturer with a certain cost decreases, which will then reduce the consumer surplus, further reduce market demand, and lessen the benefit to the manufacturer. Therefore, with the increase in the cost rate of green technology innovation, the manufacturer will have less incentive to invest in green technology innovation.
- Under different cooperation models, product greenness and the level of green promotional services decrease with the increase in the cost rate of green promotional services. This is the case because (1) in the dual-channel W model, with the increase in the cost rate of green promotional services, both the greenness of products provided by the manufacturer and the level of green promotional services provided by the retailer will decrease (, ), and the reduction in the online and offline channels’ retail prices (, ) is not enough to compensate for the negative impact on consumers. Therefore, consumer surplus will still decrease (Figure 7). This outcome will further lead to a decrease in market demand and a decrease in the profits of the manufacturer and retailer. In this way, an increase in the cost rate of green promotional services will reduce the enthusiasm of the manufacturer and retailer to improve product greenness and green promotional services. We obtain similar results from the dual-channel G and C models.
Corollary 2.
The higher the level of cooperation is, the higher the sales price and market demand are likely to be in pure offline and dual-channel systems, i.e., , , , , , , .
Corollary 2 indicates that the retail prices of the online and offline channels in the dual-channel G and C models are higher than those in the W model. This is the case because at a higher level of cooperation, a higher level of product greenness and stronger green promotional service improve consumer surplus, which causes the manufacturer and retailer to sell more products at a higher price and thus achieve better outcomes. In particular, we find that when exceeds a certain threshold, . This means that under the dual-channel W and C models, the retail price in the offline channel is affected by the level of green promotional services. Consumer surplus is greater when the level of green promotional services under the dual-channel C model is high. In this case, the manufacturer sets a higher retailer price in the offline channel in C model than in W model to obtain more profits. The proof is given in Appendix C.
Figure 6 shows that when exceeds a certain threshold, , echoing Corollary 2.
Figure 7 shows that consumers can obtain the highest consumer surplus under dual-channel C model, followed by dual-channel G model and dual-channel W model. This indicates that the higher the level of cooperation is, the higher the levels of green technology innovation and green promotional services are, which will lead to an increase in consumer surplus. On this basis, manufacturers and retailers can raise the prices of products in online and offline channels, respectively, which can compensate for the costs of green technology innovation and promotional services while increasing profits, and consumer surplus can be compensated for by improvements of product greenness and green promotional services. Under the influence of changes in consumer surplus, Figure 3 shows that the total market demand also conforms to this law. Therefore, we find that the total revenue sold by the manufacturer and retailer is highest under the dual-channel C model, moderate under the green promotional service cost-sharing cooperation model, and lowest under the wholesale price cooperation model.
As shown in Figure 8, when and change, , which indicates that the G model can improve the profits of the supply chain, but there is still a gap relative to the C model. To prove that the higher the level of cooperative is, the stronger social welfare () based on total supply chain profits (), total consumer surplus () and positive environmental improvements () becomes, based on the W model, Corollary 3 is obtained.
Corollary 3.
From the above analysis, the higher the level of cooperation is, the more efficient the supply chain is, namely,, , .
Corollary 3 indicates that the C model can achieve the highest total consumer surplus, positive externality and social welfare values followed respectively by the G and W models. The proof is given in Appendix D.
Consumer surplus is a remnant utility value, that is, the difference between the highest price accepted by the consumer and the actual price. The highest prices that consumers accept in the offline channel and dual channel are and , respectively, and the total consumer surplus can be expressed as and . Thus, the total consumer surplus under the three cooperation models can be written as follows. , , . We then have , .
Based on model W and assuming that its impact on the environment is , the environmental improvements driven by the C and G models are . We then have . From , we can conclude the corollary.
In conclusion, the operation efficiency of the W model is the lowest, while the G model improves. However, levels of green technology innovation and green promotional services are still lower than those of the C model, so the welfare level is still lower than that of the C model. Therefore, following C model as a reference, we use the revenue-cost sharing contract to coordinate and improve the operational efficiency of the dual-channel supply chain.
Corollary 4.
Figure 9 shows that when the degree of free riding increases, more consumers turn to the online channel to purchase the product at a lower price after obtaining the green promotional service in the offline channel.
- In the wholesale price contract cooperation model, retailers reduce the impact of free-riding behavior by reducing the offline channel’s retail price and green promotional service level. However, the surplus brought to consumers by the reduction of offline channel retail prices is not enough to make up for the loss to consumers from the reduction of the green promotional service level, reducing the market demand of offline channels. At the same time, the profit per unit of product obtained by the retailer will also decrease, so the retailer’s profit will decrease with an increase in free riding. In the green promotional service cost-sharing contract cooperation model, both the manufacturer and retailer can achieve Pareto improvement under the wholesale price contract cooperation model. With an increase in the degree of free riding, the promotional service level of retailers decreases briefly and then increases, because the manufacturer shares a higher proportion of the service cost, so the retailer has a greater incentive to improve the level of green promotional services. Although the retailer hopes to gain more profits by raising the offline channel’s retail price, this will not only reduce their market demand but also cause the manufacturer to raise the wholesale price, which will also reduce the retailer’s profits.
- In the wholesale price contract cooperation model, while consumers’ free-riding behavior increases the online channel’s market demand, the manufacturer increases the online channel’s retail price to obtain more profits in the online channel. The manufacturer also has a greater incentive to invest in green technology innovation. When the degree of free-riding continues to increase, affected by the retailers’ reduction of the offline channel’s retail price and the level of green promotional services, the manufacturer reduces the online channel’s retail price so that consumers can obtain more consumer surplus, but this measure cannot compensate for the loss of consumer surplus. At this point, the online channel’s profit per unit decreases, the online channel’s market demand decreases, the online channel’s profit decreases, and the incentive for manufacturers to invest in green technology innovation also decreases. In the green promotional service cost-sharing contract cooperation model, promotional service cost sharing causes the green promotional service level to rise with an increase in the degree of free riding. In this context, the manufacturer increases the online channel’s retail price to a certain extent while increasing the market demand to obtain more profits. At this point, the manufacturer has a greater incentive to invest in green technology innovation.
6. Revenue-Cost Sharing Coordination Model
Supply chain coordination refers to the design of appropriate incentive mechanism for separate entities to achieve decision alignment, to establish strategic partnerships between supply chain members and improve the efficiency of supply chain. At the same time, cooperation can be divided into perfect cooperation (centralized decision) and imperfect cooperation (wholesale price and green promotional service cost-sharing in this paper), and coordination is an effective means of imperfect cooperation to achieve perfect cooperation. In contrast to cooperation, coordination is an interactive, joint decision-making process in which independent entities more directly influence each other’s decisions [59]. Hence, coordination can sometimes be seen as the step after cooperation, as it needs formal and detailed contractual agreements [60]. For example, the video rental industry first achieved great success with the use of revenue-sharing contracts, which were later extended to other industries. When Dana et al. [61] studied revenue-sharing contracts, they found that such contracts could reduce the degree of price competition among multiple retailers and reduce conflicts of interest between manufacturers and retailers. Revenue-sharing contracts are coordinated such that the retailer delivers a percentage of the revenue to the manufacturer to obtain a lower wholesale price (generally, the price is equal to the production cost), and the retailer can sell products to consumers at a lower price and gain more market share.
Revenue-cost sharing contracts have two advantages. First, the manufacturer does not need to supervise the retailer to make decisions (such as decisions regarding the level of effort and selling price), so implementation is relatively simple and administrative costs are low. Therefore, we assume that the implementation cost of the contract is zero. Second, supply chain profits can be distributed between the manufacturer and retailer in any proportion, rendering the contract more flexible. Based on this, we consider the leading manufacturer who designs a revenue-cost sharing contract and cooperate with the retailer. Under the revenue-cost sharing contract (, ), the manufacturer wholesales products to retailers at the wholesale price and shares the sales revenue of online and offline channels with retailers in the proportions of and , respectively, as well as sharing the costs of green technology innovation and green promotional services. Therefore, the profit functions of the manufacturer and retailer under the revenue-cost sharing contract are as follows:
If the decision of the manufacturer and retailer under the revenue-cost sharing contract is the same as the decision made under dual-channel C model, the contract can perfectly coordinate the decision-making behavior of the manufacturer and retailer and improve the operational efficiency of the supply chain. We thus have lemma 1.
Lemma 1.
If the contract renders the profit function of each member the affine function of the profit of the centralized cooperation model, that is, if for any , there is , then the equilibrium decision of the centralized cooperation model constitutes a Nash equilibrium of the decision-making of each member, that is, the contract coordinates the supply chain.
Based on this, the manufacturer sets the same product greenness level and online channel retail price as in dual-channel C model and guides the retailer to achieve the same level of green promotional services and offline channel retail price as in dual-channel C model through a low wholesale price. Then, the efficiency of the supply chain under the revenue-cost sharing contract cooperation model will be the same as that of the dual-channel C model.
Corollary 5.
When the parameters of the cost-benefit sharing contract satisfy v, the dual-channel supply chain can be coordinated. When the revenue-cost sharing ratio satisfies condition , both the manufacturer and retailer can obtain Pareto-improved profits relative to the dual-channel model W. Similarly, when the parameters of the cost-benefit sharing contract satisfy , the pure offline channel supply chain can be coordinated. When the revenue-cost sharing ratio satisfies condition , both the manufacturer and retailer can obtain Pareto improved profits.
When , there is , . That is, the profit functions of the manufacturer and retailer are affine functions of the centralized cooperative model’s profit function. According to Lemma 1, the contract coordinates the decision-making behavior of the manufacturer and retailer. The following can then be obtained from and : When , both the manufacturer and retailer can obtain Pareto-improved profits relative to dual-channel model W by bargaining to determine the value of cost-benefit sharing ratio . Similarly, the results of the pure offline channel can then be obtained.
7. Conclusions
With an increase in consumers’ preferences for green products, an increasing number of enterprises have begun to engage in the innovation and production of green products. Regarding that there is currently no comprehensive study on green technology innovation and consumer free-riding behavior in the e-commerce environment, this paper links green innovation and product sales through two stages and discusses supply chain operation problems under different cooperation models. Stage 1 is the innovation and promotional period in which the manufacturer invests in green technology innovation and the retailer provides green services to open the market. Stage 2 is the production and sales period wherein the manufacturer produces products and sells them through the offline retail channel and his own online direct channel.
Through our modeling analysis, we find the following results. Product retail prices, consumers’ green preferences, and the green promotional service level are the main factors that affect the online and offline channels’ market demand. That is, enterprises should strengthen the input and publicity of green environmental protection, to improve the environmental awareness of consumers, which can improve the environmental performance and improve the economic benefits of each enterprise. Additionally, consumers’ e-commerce preferences and levels of free riding will cause the manufacturer to open the online channel and close the offline channel earlier. The product’s greenness and consumers’ preferences for it will also cause the manufacturer to open the online channel earlier. Regarding green promotional services, the opening of the online channel depends on the relationship between the degree of free riding and consumers’ e-commerce preferences and the closing of the offline channel will occur later. Therefore, in the e-commerce environment, retailers’ standardized management, and reasonable investment in green promotion services can well reduce free-riding behavior, expand offline market, and improve economic and environmental benefits. By comparing the G and C models, we find that the higher the level of cooperation is, the stronger product greenness and green promotional services are. Correspondingly, the higher the level of cooperation is, the stronger the economic, ecological and social benefits are. Therefore, from a regulator perspective, it is very necessary to implement the corresponding environmental policies to promote the cooperation level between enterprises and improve the level of social welfare. However, achieving a centralized level is impossible in reality, so we design a revenue-cost sharing contract to better incentivize the manufacturer and retailer to provide a higher greenness level and green promotional services. This study provides guidance for manufacturers’ channel selection and cooperation strategy when considering consumers’ green preference and free-riding behavior in the e-commerce environment and finds feasible solutions for the manufacturer and retailer to improve their product green level and green promotion service level, so as to achieve perfect cooperation.
There are a few directions that we would like to further explore. First, the service examined in this study is only provided by the retailer, but with the rapid development of e-commerce, online channel services are becoming increasingly common. Therefore, future study can incorporate the service into online channels, and then consider the existence of free riding in both channels. Second, this paper focuses on green technology innovation for only one-type product. However, in the actual operation process, green products can be classified as production intensive products and research and development (R&D) intensive products. Therefore, different product types can be considered into account. In addition, government policy, as a common and effective approach which can lead the manufacturer to better implement green production/R&D can also be introduced into our model in future research.
Author Contributions
Conceptualization, Z.M. and Y.Z.; methodology, Z.M.; software, Y.Z.; validation, Y.Z., H.S.; formal analysis, Z.M.; investigation, H.S.; resources, H.S.; data curation, Z.M.; writing—original draft preparation, Y.Z.; writing—review and editing, Y.Z.; visualization, Z.M.; supervision, H.S.; project administration, H.S.; funding acquisition, H.S. All authors have read and agreed to the published version of the manuscript.
Funding
This work was supported by outstanding Youth Innovation Team Project of Colleges and Universities in Shandong Province under Grant Nos. 2020RWG011 and the Natural Science Foundation of Shandong Province of China (grant number ZR2017MG015).
Institutional Review Board Statement
Not applicable.
Informed Consent Statement
Not applicable.
Data Availability Statement
Not applicable.
Conflicts of Interest
The authors declare no conflict of interest.
Appendix A
- Centralized cooperation model.
Through the standard backward induction, we first verify that is concave with respect to and through the Hessian determinant , , . Second, is strictly concave in and through the Hessian determinant if and only if , .
- 2.
- Wholesale price contract cooperation model.
Through the standard backward induction, we first verify that is concave with respect to through . Second, we can get that is strictly concave in and through the Hessian determinant , , . Third, is strictly concave in if and only if . Finally, is strictly concave in through .
- 3.
- Green promotion services cost-sharing contract cooperation model.
Through the standard backward induction, we first verify that is concave with respect to through . Second, we can get that is concave with respect to and through the Hessian determinant , , . Third, we should is concave with respect to if . Finally, is concave with respect to and through the Hessian determinant , , , where , , .
Appendix B
This section compares the product greenness and green promotion service under different cooperation model. We have:
Thus, we can get that , .
Appendix C
Compare the retail prices and market demand under different models respectively,
Compare the value between and , Compare the value between and , Compare the value between and , , . Thus, we can get .
Compare the value between and , . Thus, we can get .
Compare the value between and , , . Thus, we can get .
Appendix D
Total consumer surplus can be represented as . Because is positive, we can get:
Hence, .
In addition, , , and then we can get .
References
- Zhou, Y.; Hu, F.; Zhou, Z. Pricing decisions and social welfare in a supply chain with multiple competing retailers and carbon tax policy. J. Clean. Prod. 2018, 190, 752–777. [Google Scholar] [CrossRef]
- China Green Consumer Report 2016. Available online: https://wenku.baidu.com/view/fd968154f68a6529647d27284b73f242336-c319c.html (accessed on 4 May 2021).
- Hoejmose, S.U.; Roehrich, J.K.; Grosvold, J. Is doing more doing better? The relationship between responsible supply chain management and corporate reputation. Ind. Mark. Manag. 2014, 43, 77–90. [Google Scholar] [CrossRef]
- Grosvold, J.; Hoejmose, S.U.; Roehrich, J.K. Squaring the circle: Management, measurement and performance of sustainability in supply chains. Supply Chain Manag. 2014, 19, 292–305. [Google Scholar] [CrossRef]
- Hong, Z.F.; Guo, X.L. Green product supply chain contracts considering environmental responsibilities. Omega 2019, 83, 155–166. [Google Scholar] [CrossRef]
- Apple’s Environmental Progress Report. Available online: https://www.apple.com.cn/environment/ (accessed on 15 April 2021).
- Amann, M.; Roehrich, J.K.; Essig, M.; Harland, C. Driving sustainable supply chain management in the public sector: The importance of public procurement in the EU. Supply Chain Manag. 2014, 19, 351–366. [Google Scholar] [CrossRef] [Green Version]
- Brammer, S.; Walker, H.L. Sustainable procurement in the public sector: An international comparative study. Int. J. Opera. Prod. Manag. 2011, 31, 452–476. [Google Scholar] [CrossRef]
- Seuring, S.; Müller, M. From a literature review to a conceptual framework for sustainable supply chain management. J. Clean. Prod. 2008, 16, 1699–1710. [Google Scholar] [CrossRef]
- Supply Chain Partnership between Haier and Gome. Available online: https://wenku.baidu.com/view/ba45699830126edb6-f1aff00bed5b9f3f90f72a6.html (accessed on 8 May 2021).
- Adeinat, H.; Ventura, J.A. Integrated pricing and supplier selection in a two-stage supply chain. Int. J. Prod. Econ. 2018, 201, 193–202. [Google Scholar] [CrossRef]
- China Has Entered the Era of “Zero-Time Consumption”. Available online: https://baijiahao.baidu.com/s?id=1675267910035534-634&-wfr=spider&for=pc (accessed on 10 February 2021).
- Wu, D.; Ray, G.; Geng, X.; Whinston, A. Implications of Reduced Search Cost and Free Riding in E-Commerce. Mark. Sci. 2004, 23, 255–262. [Google Scholar] [CrossRef]
- Lester, G.T. Why Should Manufacturers Want Fair Trade? J. Law Econ. 1960, 3, 86–105. [Google Scholar]
- Jian, J.; Li, B.; Zhang, N.; Su, J. Decision-making and coordination of green closed-loop supply chain with fairness concern. J. Clean. Prod. 2021, 298, 126779. [Google Scholar] [CrossRef]
- Su, J.; Li, C.; Zeng, Q.; Yang, J.; Zhang, J. A Green Closed-Loop Supply Chain Coordination Mechanism Based on Third-Party Recycling. Sustainability 2019, 11, 5335. [Google Scholar] [CrossRef] [Green Version]
- Yu, X.N.; Lan, Y.F.; Zhao, R.Q. Strategic green technology innovation in a two-stage alliance: Vertical collaboration or co-development? Omega 2021, 98, 102116. [Google Scholar] [CrossRef]
- Wu, D.D.; Yang, L.; Olson, D.L. Green supply chain management under capital constraint. Int. J. Prod. Econ. 2019, 215, 3–10. [Google Scholar] [CrossRef]
- Wang, Y.; Yu, Z.; Jin, M. E-commerce supply chains under capital constraints. Electron. Commer. Res. Appl. 2019, 35, 100851. [Google Scholar] [CrossRef]
- Ranjan, A.; Jha, J. Pricing and coordination strategies of a dual-channel supply chain considering green quality and sales effort. J. Clean. Prod. 2019, 218, 409–424. [Google Scholar] [CrossRef]
- Ghosh, D.; Shah, J. Supply chain analysis under green sensitive consumer demand and cost sharing contract. Int. J. Prod. Econ. 2015, 164, 319–329. [Google Scholar] [CrossRef]
- Zhu, W.; He, Y. Green product design in supply chains under competition. Eur. J. Oper. Res. 2017, 258, 165–180. [Google Scholar] [CrossRef]
- Dey, K.; Roy, S.; Saha, S. The impact of strategic inventory and procurement strategies on green product design in a two-period supply chain. Int. J. Prod. Res. 2018, 57, 1915–1948. [Google Scholar] [CrossRef]
- Gao, J.; Xiao, Z.; Wei, H.; Zhou, G. Dual-channel green supply chain management with eco-label policy: A perspective of two types of green products. Comput. Ind. Eng. 2020, 146, 106613. [Google Scholar] [CrossRef]
- Chen, X.; Wang, X.J.; Zhou, M.M. Firms’ green R&D cooperation behaviour in a supply chain: Technological spillover, power and coordination. Int. J. Prod. Econ. 2019, 218, 118–134. [Google Scholar]
- Dey, K.; Saha, S. Influence of procurement decisions in two-period green supply chain. J. Clean. Prod. 2018, 190, 388–402. [Google Scholar] [CrossRef]
- Dong, C.; Liu, Q.; Shen, B. To be or not to be green? Strategic investment for green product development in a supply chain. Transp. Res. Part E Logist. Transp. Rev. 2019, 131, 193–227. [Google Scholar] [CrossRef]
- Chiang, W.K.; Dilip, C.; James, D. Direct marketing, indirect profits: A strategic analysis of dual-channel supply-chain design. Manag. Sci. 2003, 49, 1–20. [Google Scholar] [CrossRef] [Green Version]
- Lan, C.; Miao, Z.; Ji, H. Strategic Analysis of Dual-Channel Green Supply Chain with an Unreliable and Competitive Supplier. Sustainability 2021, 13, 5371. [Google Scholar] [CrossRef]
- Wang, Y.; Fan, R.; Shen, L.; Jin, M. Decisions and coordination of green e-commerce supply chain considering green manufacturer’s fairness concerns. Int. J. Prod. Res. 2020, 58, 7471–7489. [Google Scholar] [CrossRef]
- Chen, J.; Liang, L.; Yao, D.-Q.; Sun, S. Price and quality decisions in dual-channel supply chains. Eur. J. Oper. Res. 2017, 259, 935–948. [Google Scholar] [CrossRef]
- Wang, J.; Gao, X.; Wang, Z. Sustainable Supply Chain Decisions under E-Commerce Platform Marketplace with Competition. Sustainability 2021, 13, 4162. [Google Scholar] [CrossRef]
- Zhang, P.; He, Y.; Shi, C. (Victor) Retailer’s channel structure choice: Online channel, offline channel, or dual channels? Int. J. Prod. Econ. 2017, 191, 37–50. [Google Scholar] [CrossRef]
- Wang, C.; Leng, M.; Liang, L. Choosing an online retail channel for a manufacturer: Direct sales or consignment? Int. J. Prod. Econ. 2018, 195, 338–358. [Google Scholar] [CrossRef]
- Mukhopadhyay, S.K.; Zhu, X.; Yue, X. Optimal Contract Design for Mixed Channels under Information Asymmetry. Prod. Oper. Manag. 2008, 17, 641–650. [Google Scholar] [CrossRef]
- Rahmani, K.; Yavari, M. Pricing policies for a dual-channel green supply chain under demand disruptions. Comput. Ind. Eng. 2019, 127, 493–510. [Google Scholar] [CrossRef]
- Li, T.; Zhang, R.; Liu, B. Pricing decisions of competing supply chains under power imbalance structures. Comput. Ind. Eng. 2018, 125, 695–707. [Google Scholar] [CrossRef]
- Shi, S.; Sun, J.; Cheng, E. Wholesale or drop-shipping: Contract choices of the online retailer and the manufacturer in a dual-channel supply chain. Int. J. Prod. Econ. 2020, 226, 107618. [Google Scholar] [CrossRef]
- Huang, S.; Guan, X.; Chen, Y.-J. Retailer Information Sharing with Supplier Encroachment. Prod. Oper. Manag. 2018, 27, 1133–1147. [Google Scholar] [CrossRef]
- Ye, F.; Xie, Z.F.; Tong, Y.; Li, Y.N. Promised delivery time: Implications for retailer’s optimal sales channel strategy. Comput. Ind. Eng. 2020, 144, 106474. [Google Scholar] [CrossRef]
- Yang, W.; Zhang, J.; Yan, H. Impacts of online consumer reviews on a dual-channel supply chain. Omega 2021, 101, 102266. [Google Scholar] [CrossRef]
- Yan, N.; Liu, Y.; Xu, X.; He, X. Strategic dual-channel pricing games with e-retailer finance. Eur. J. Oper. Res. 2020, 283, 138–151. [Google Scholar] [CrossRef]
- Zhang, S.; Zhang, J.; Zhu, G. Retail service investing: An anti-encroachment strategy in a retailer-led supply chain. Omega 2019, 84, 212–231. [Google Scholar] [CrossRef]
- Pi, Z.Y.; Fang, W.G.; Zhang, B.F. Service and pricing strategies with competition and cooperation in a dual-channel supply chain with demand disruption. Comput. Ind. Eng. 2019, 138, 106–130. [Google Scholar] [CrossRef]
- Dan, B.; Xu, G.; Liu, C. Pricing policies in a dual-channel supply chain with retail services. Int. J. Prod. Econ. 2012, 139, 312–320. [Google Scholar] [CrossRef]
- Wang, L.; Song, H.; Wang, Y. Pricing and service decisions of complementary products in a dual-channel supply chain. Comput. Ind. Eng. 2017, 105, 223–233. [Google Scholar] [CrossRef]
- Li, X.; Li, Y.J.; Cai, X.Q.; Shan, J. Service Channel Choice for Supply Chain: Who is Better Off by Undertaking the Service? Prod. Opera. Manag. 2016, 25, 516–534. [Google Scholar] [CrossRef]
- Dan, B.; Zhang, S.; Zhou, M. Strategies for warranty service in a dual-channel supply chain with value-added service competition. Int. J. Prod. Res. 2017, 56, 5677–5699. [Google Scholar] [CrossRef]
- Baal, S.; Dach, C. Free riding and customer retention across retailers’ channels. J. Interact. Mark. 2005, 19, 75–85. [Google Scholar] [CrossRef]
- Xing, D.; Liu, T. Sales effort free riding and coordination with price match and channel rebate. Eur. J. Oper. Res. 2012, 219, 264–271. [Google Scholar] [CrossRef]
- Zhou, Y.-W.; Guo, J.; Zhou, W. Pricing/service strategies for a dual-channel supply chain with free riding and service-cost sharing. Int. J. Prod. Econ. 2018, 196, 198–210. [Google Scholar] [CrossRef]
- Dan, B.; Liu, C.; Xu, G.; Zhang, X. Pareto Improvement Strategy for Service-Based Free-Riding in a Dual-Channel Supply Chain. Asia Pac. J. Oper. Res. 2014, 31, 935–948. [Google Scholar] [CrossRef]
- He, R.; Xiong, Y.; Lin, Z. Carbon emissions in a dual channel closed loop supply chain: The impact of consumer free riding behavior. J. Clean. Prod. 2016, 134, 384–394. [Google Scholar] [CrossRef] [Green Version]
- Yan, N.N.; Zhang, Y.P.; Xu, X.; Gao, Y.L. Online finance with dual channels and bidirectional free-riding effect. Int. J. Prod. Econ. 2021, 231, 107834. [Google Scholar] [CrossRef]
- Luo, M.L.; Li, G.; Cheng, T.C.E. Free riding and coordination in a dual-channel supply chain in e-commerce. Int. J. Ship. Trans. Log. 2016, 8, 223–249. [Google Scholar] [CrossRef]
- Pu, X.; Gong, L.; Han, X. Consumer free riding: Coordinating sales effort in a dual-channel supply chain. Electron. Commer. Res. Appl. 2017, 22, 1–12. [Google Scholar] [CrossRef]
- Gulati, R.; Wohlgezogen, F.; Zhelyazkov, P. The Two Facets of Collaboration: Cooperation and Coordination in Strategic Alliances. Acad. Manag. Ann. 2012, 6, 531–583. [Google Scholar] [CrossRef]
- Dahlmann, F.; Röhrich, J.K. Sustainable supply chain management and partner engagement to manage climate change information. Bus. Strateg. Environ. 2019, 28, 1632–1647. [Google Scholar] [CrossRef]
- Wankmüller, C.; Reiner, G. Coordination, cooperation and collaboration in relief supply chain management. J. Bus. Econ. 2019, 90, 239–276. [Google Scholar] [CrossRef] [Green Version]
- Saab, D.J.; Tapia, A.; Maitland, C.; Maldonado, E.; Tchouakeu, L.-M.N. Inter-organizational Coordination in the Wild: Trust Building and Collaboration Among Field-Level ICT Workers in Humanitarian Relief Organizations. Volunt. Int. J. Volunt. Nonprofit Organ. 2012, 24, 194–213. [Google Scholar] [CrossRef]
- Dana, J.D.; Spier, K.E. Revenue sharing and vertical control in the video rental industry. J. Ind. Econ. 2001, 49, 223–245. [Google Scholar] [CrossRef]
Figure 1.
Operation process of the two-stage supply chain considering the e-commerce sales channel.

Figure 2.
Market demand in pure offline (a), dual-channel (b) and pure online (c) systems.

Figure 4.
Impact of e-commerce preferences on the lower and upper bounds.

Figure 5.
Effect of , and on , under different cooperation models in the pure offline and dual channels.
Figure 5.
Effect of , and on , under different cooperation models in the pure offline and dual channels.

Figure 6.
Impact of and on the pricing decisions of W and C models.

Figure 7.
Consumer surplus when purchasing products through offline or online channels under different cooperation models.
Figure 7.
Consumer surplus when purchasing products through offline or online channels under different cooperation models.

Figure 8.
Total profits of different cooperative models under the influence of and .

Figure 9.
Impact of on the equilibrium decisions and profits under dual-channel W model.


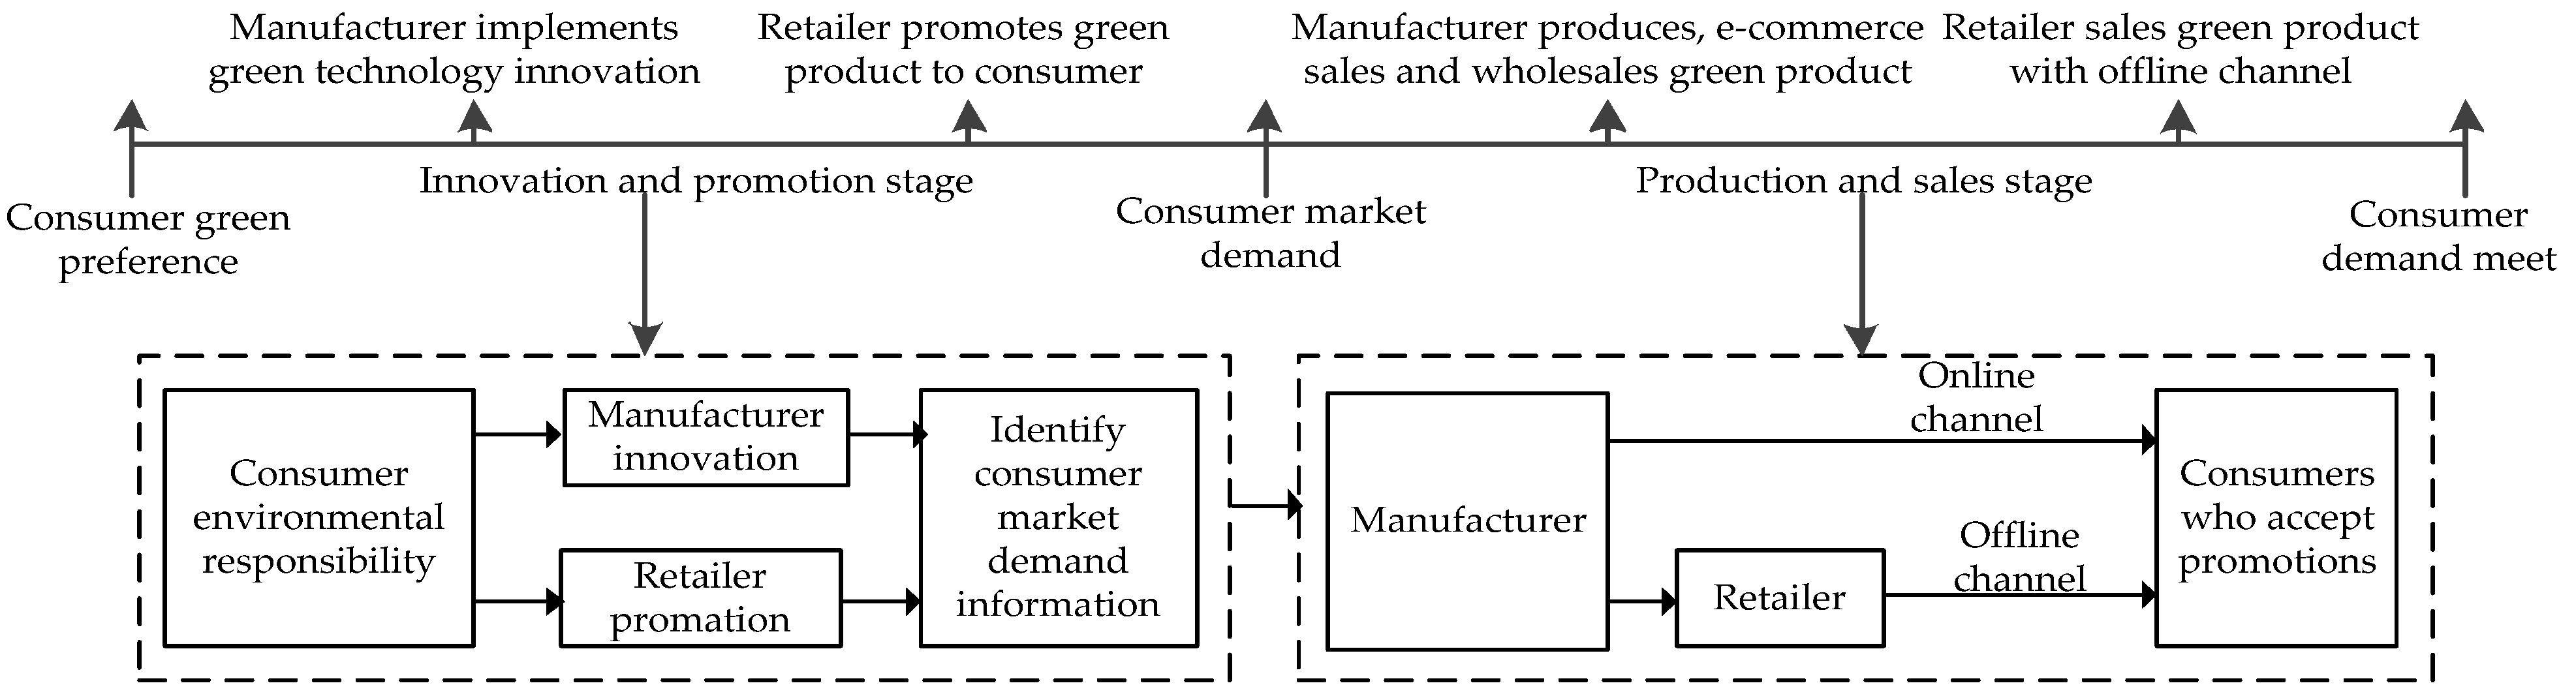
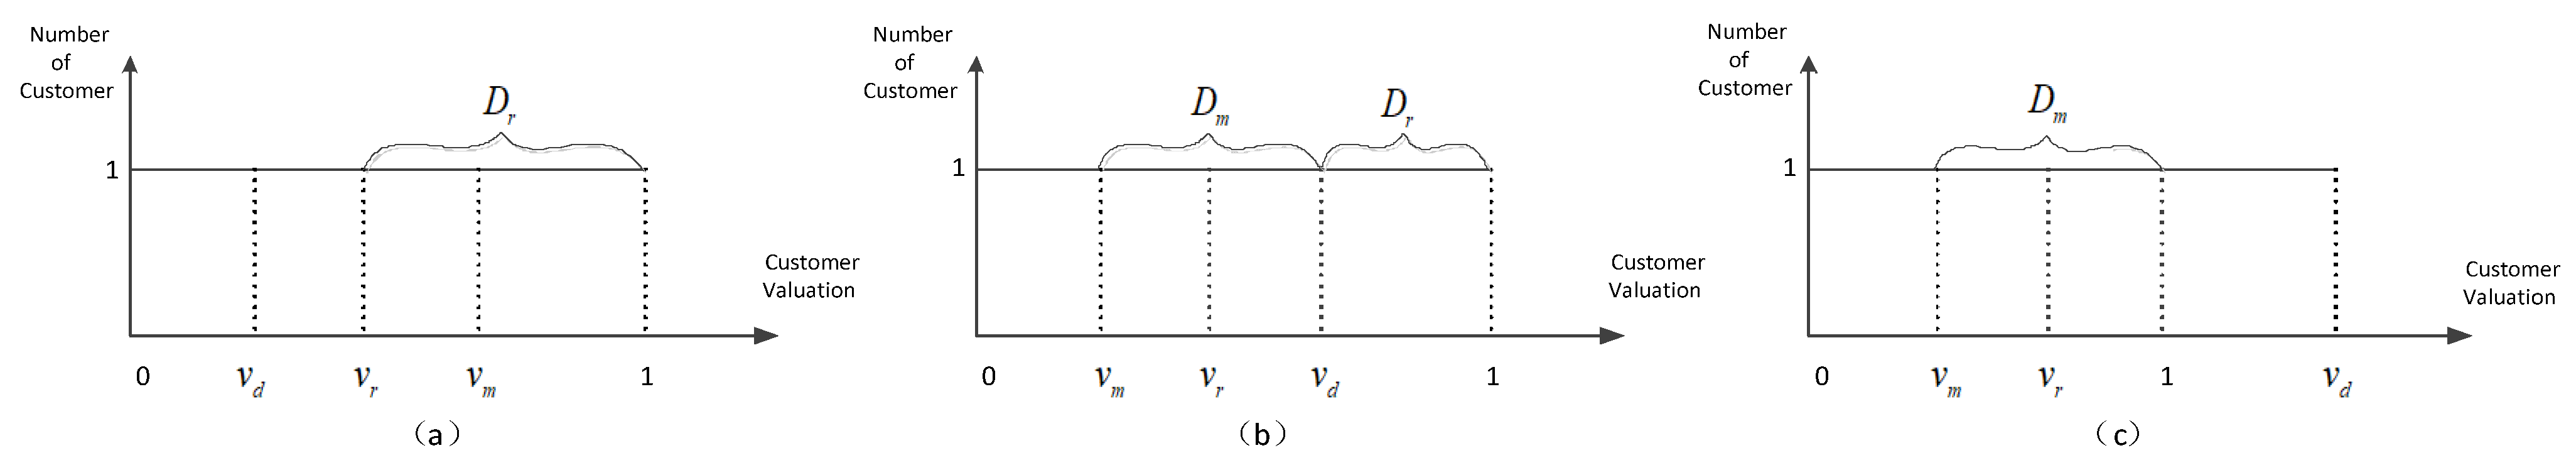
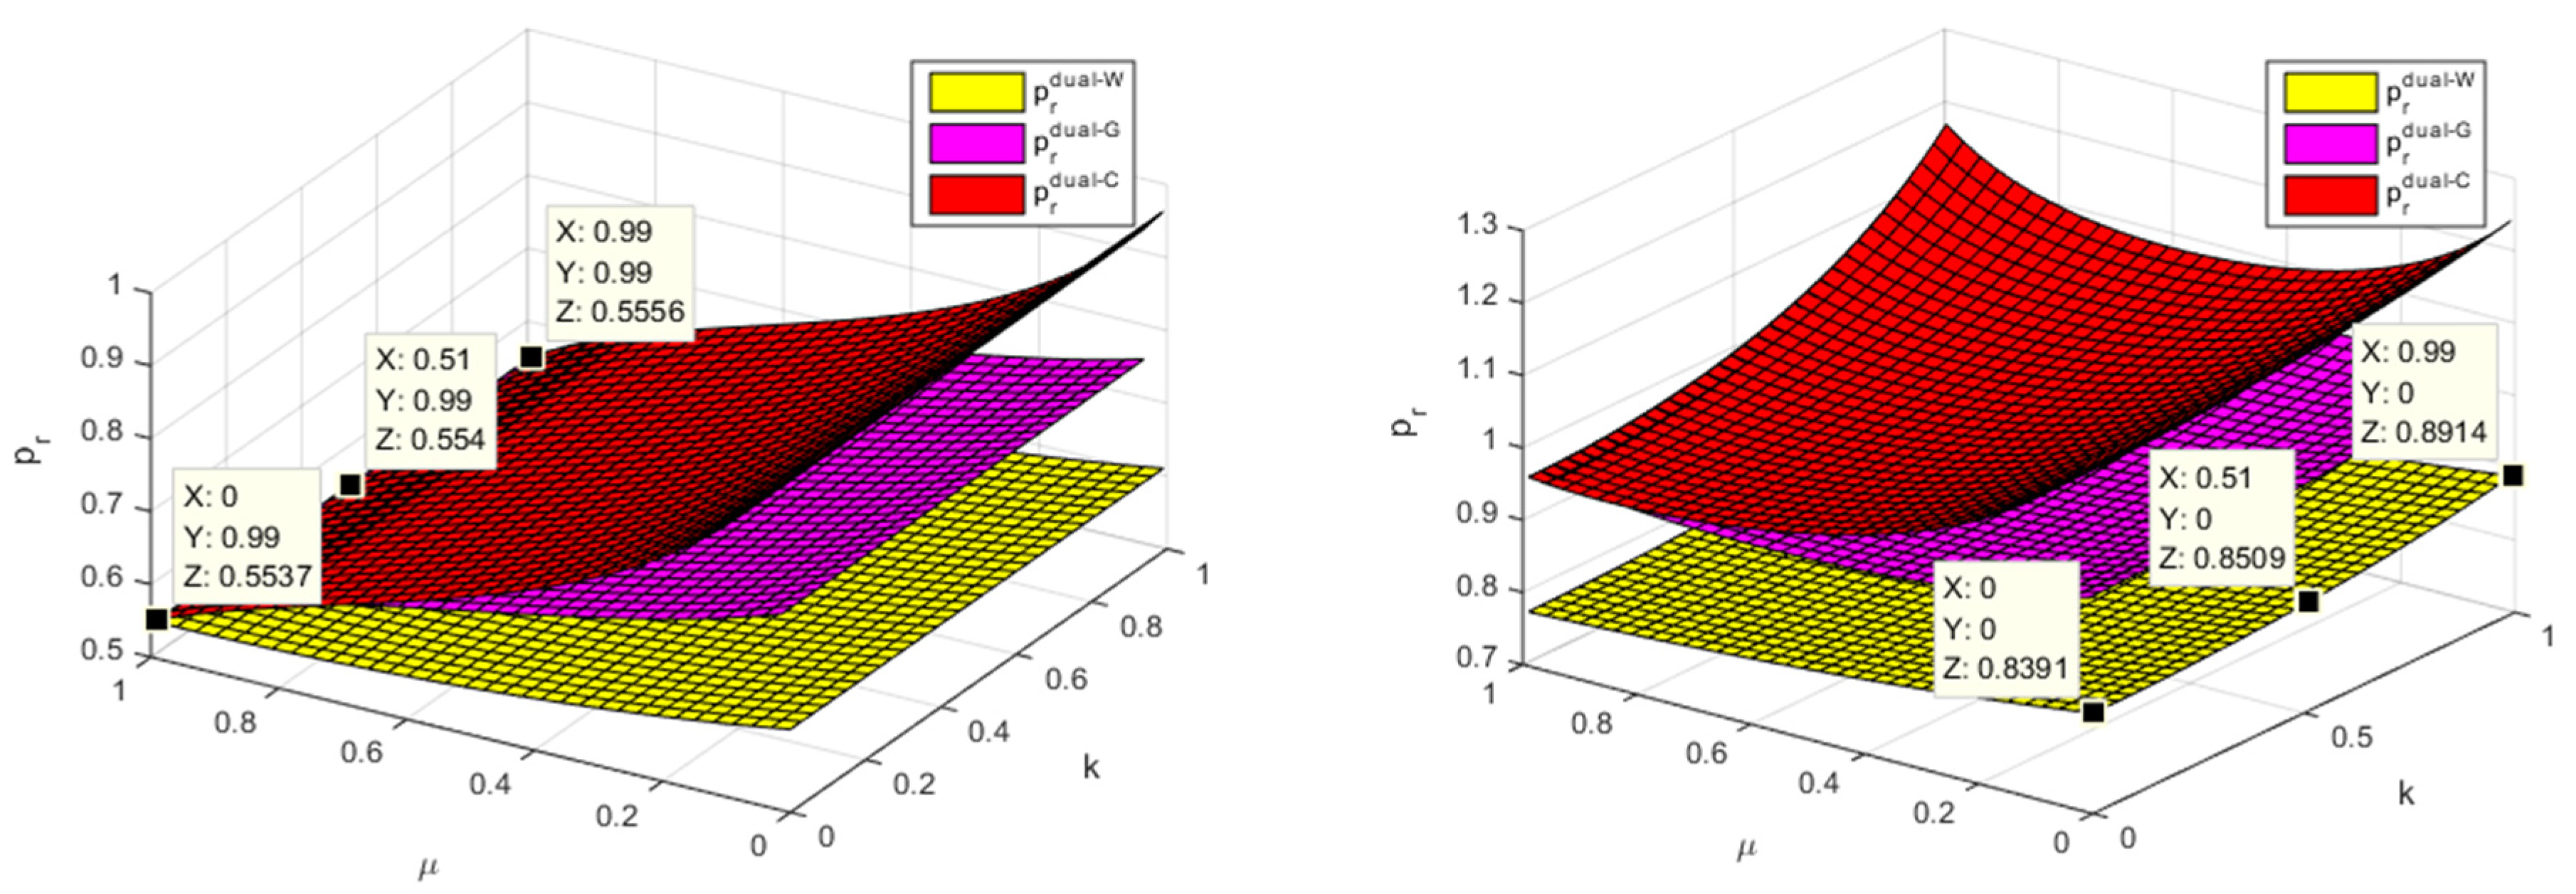
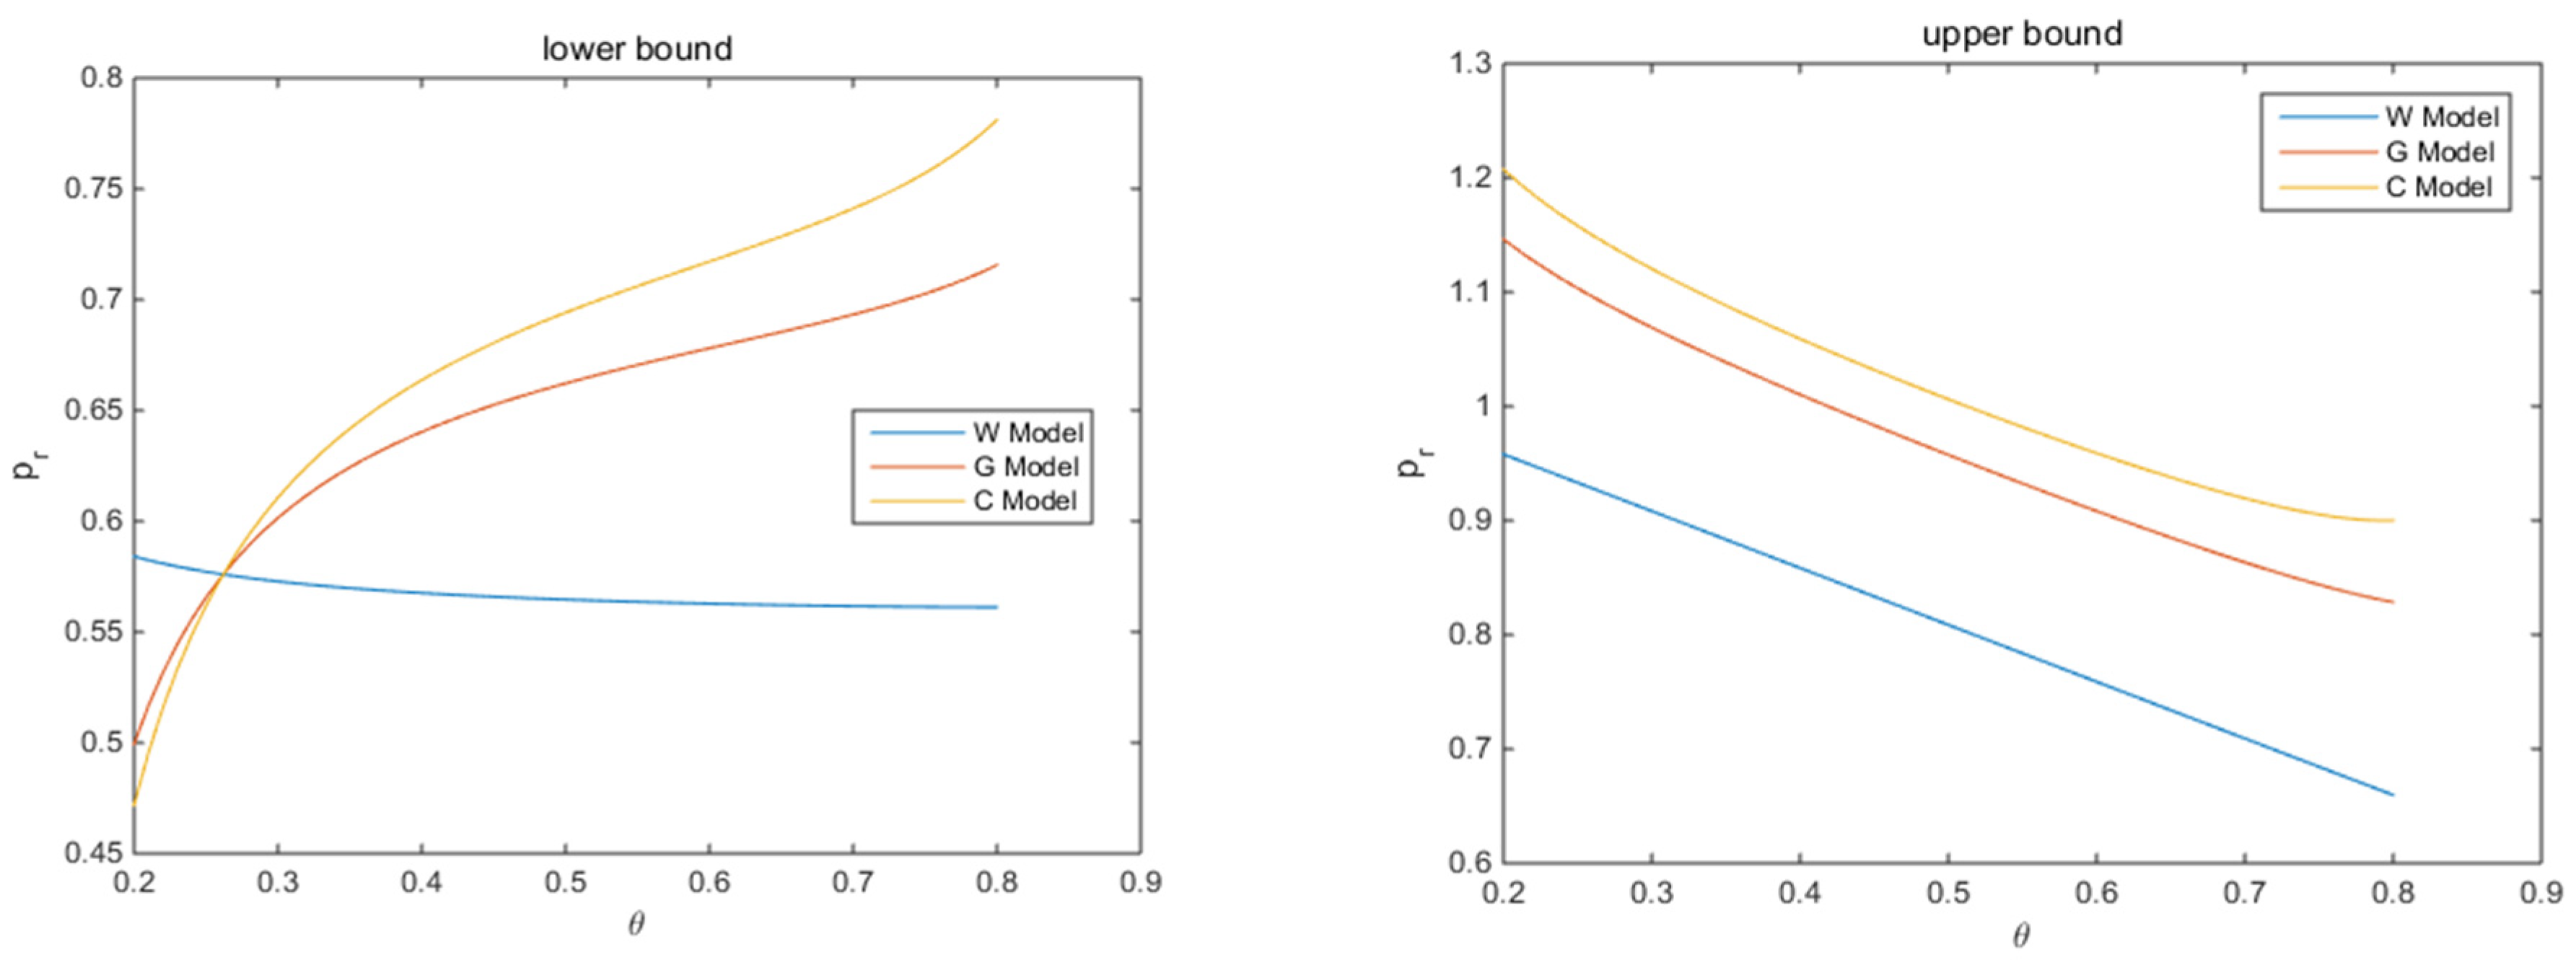
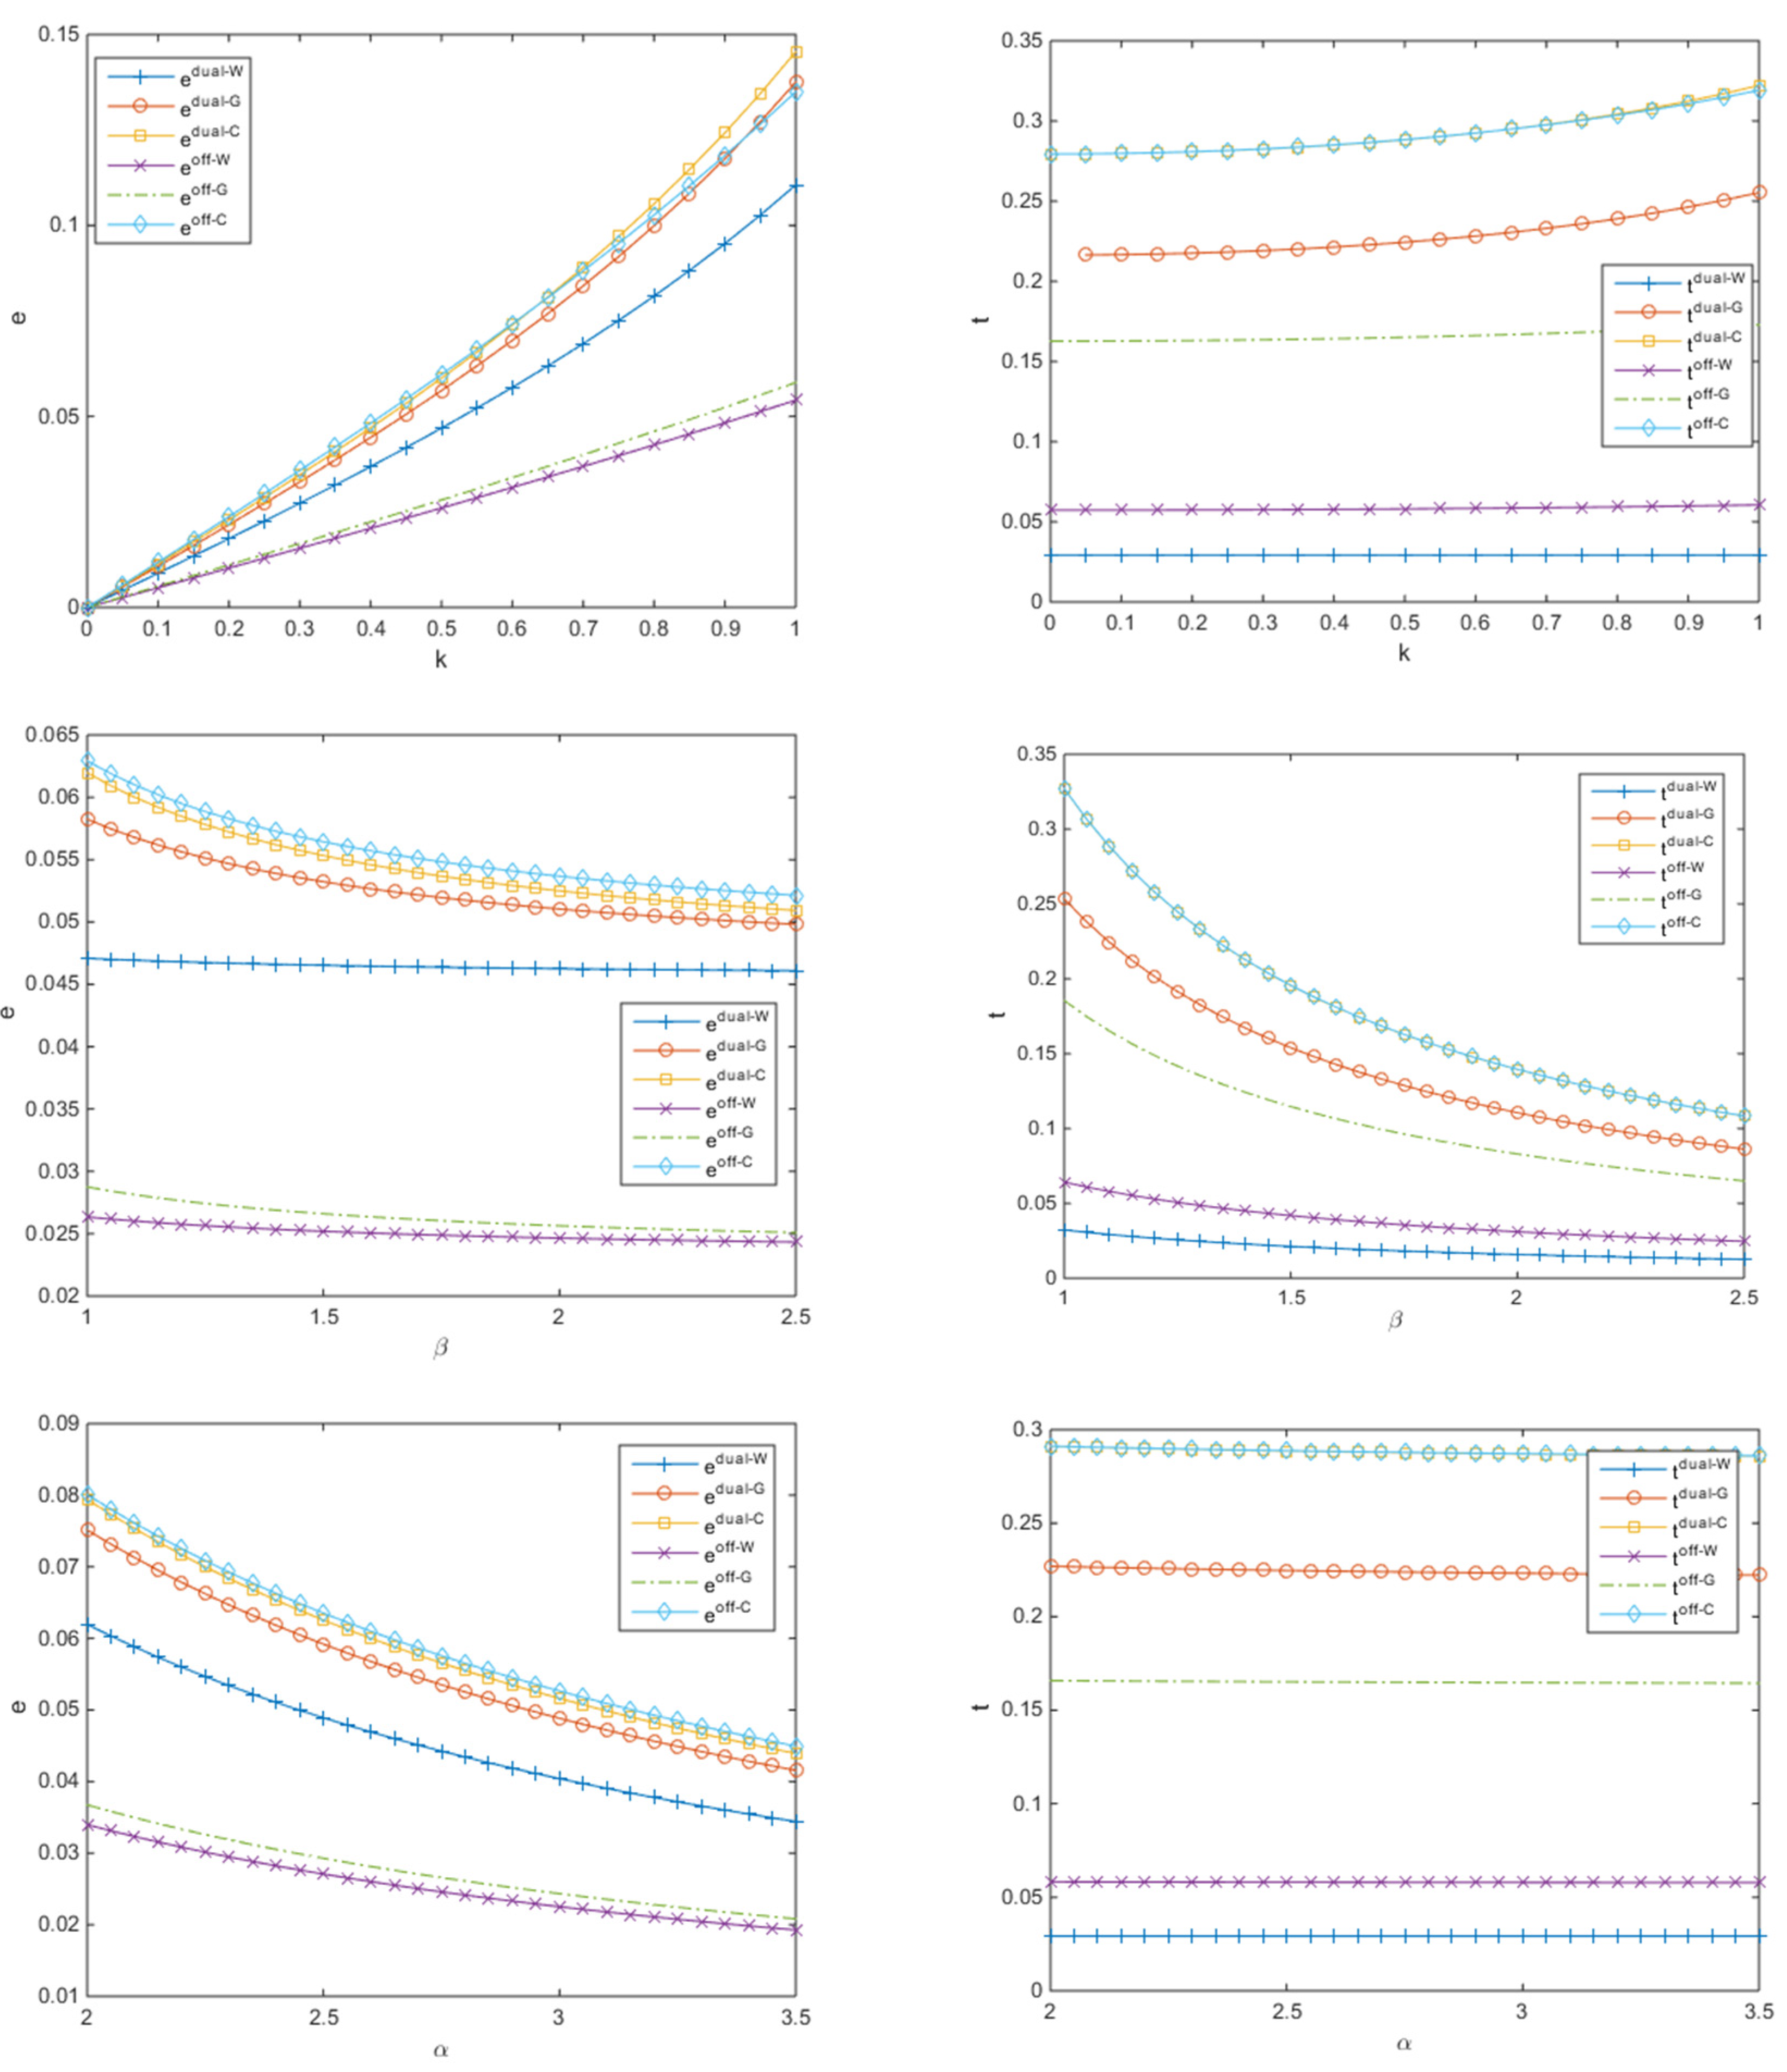
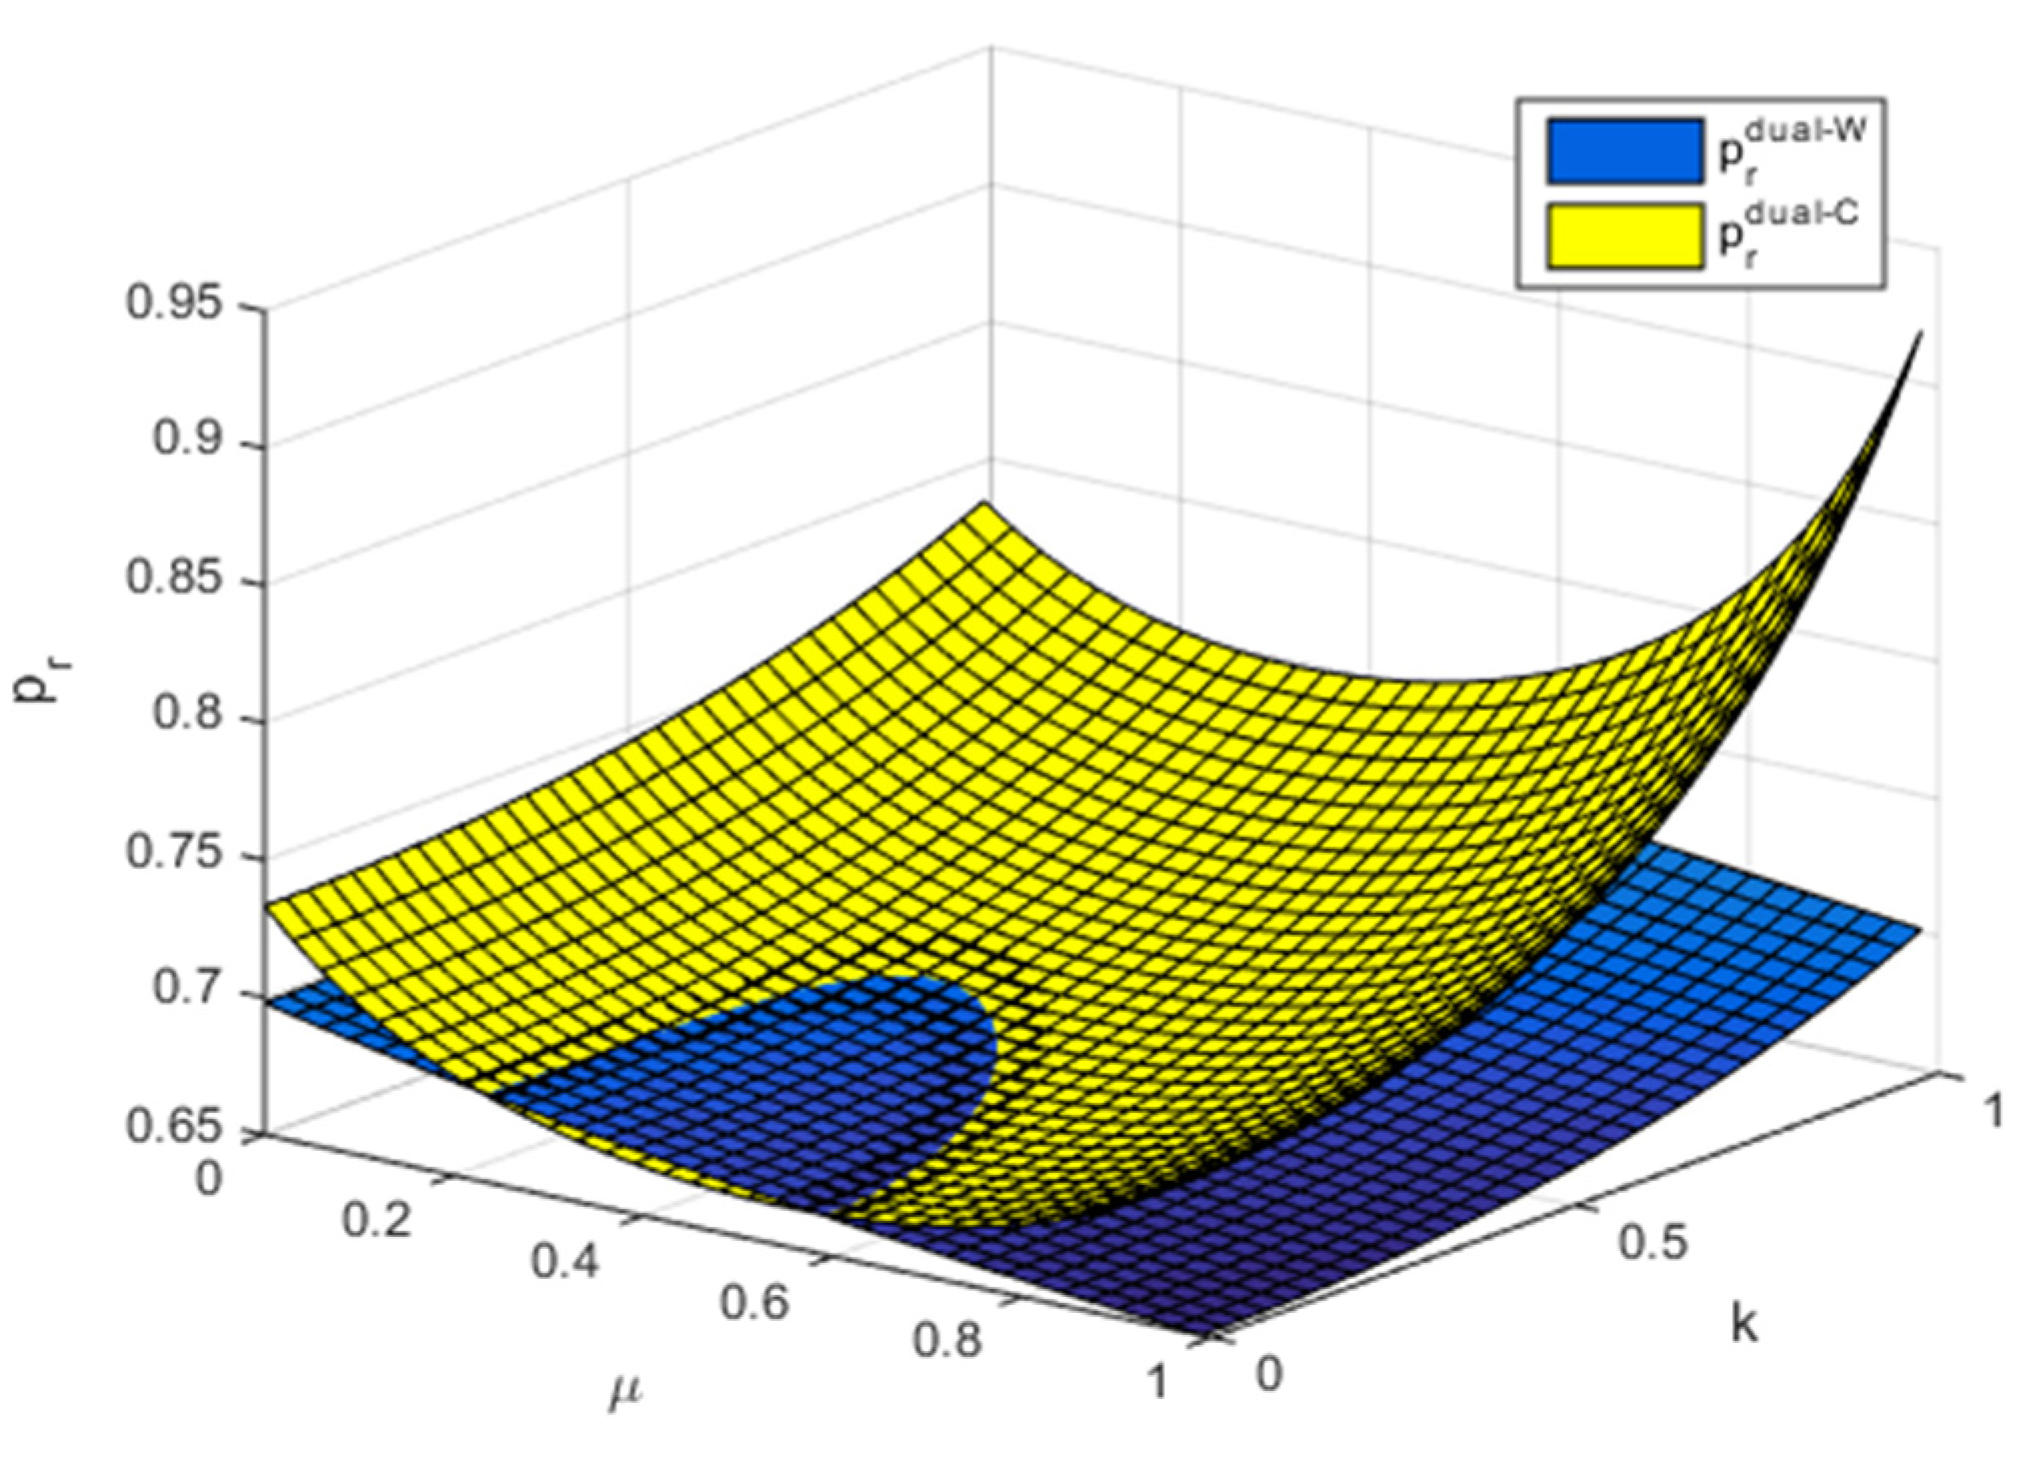
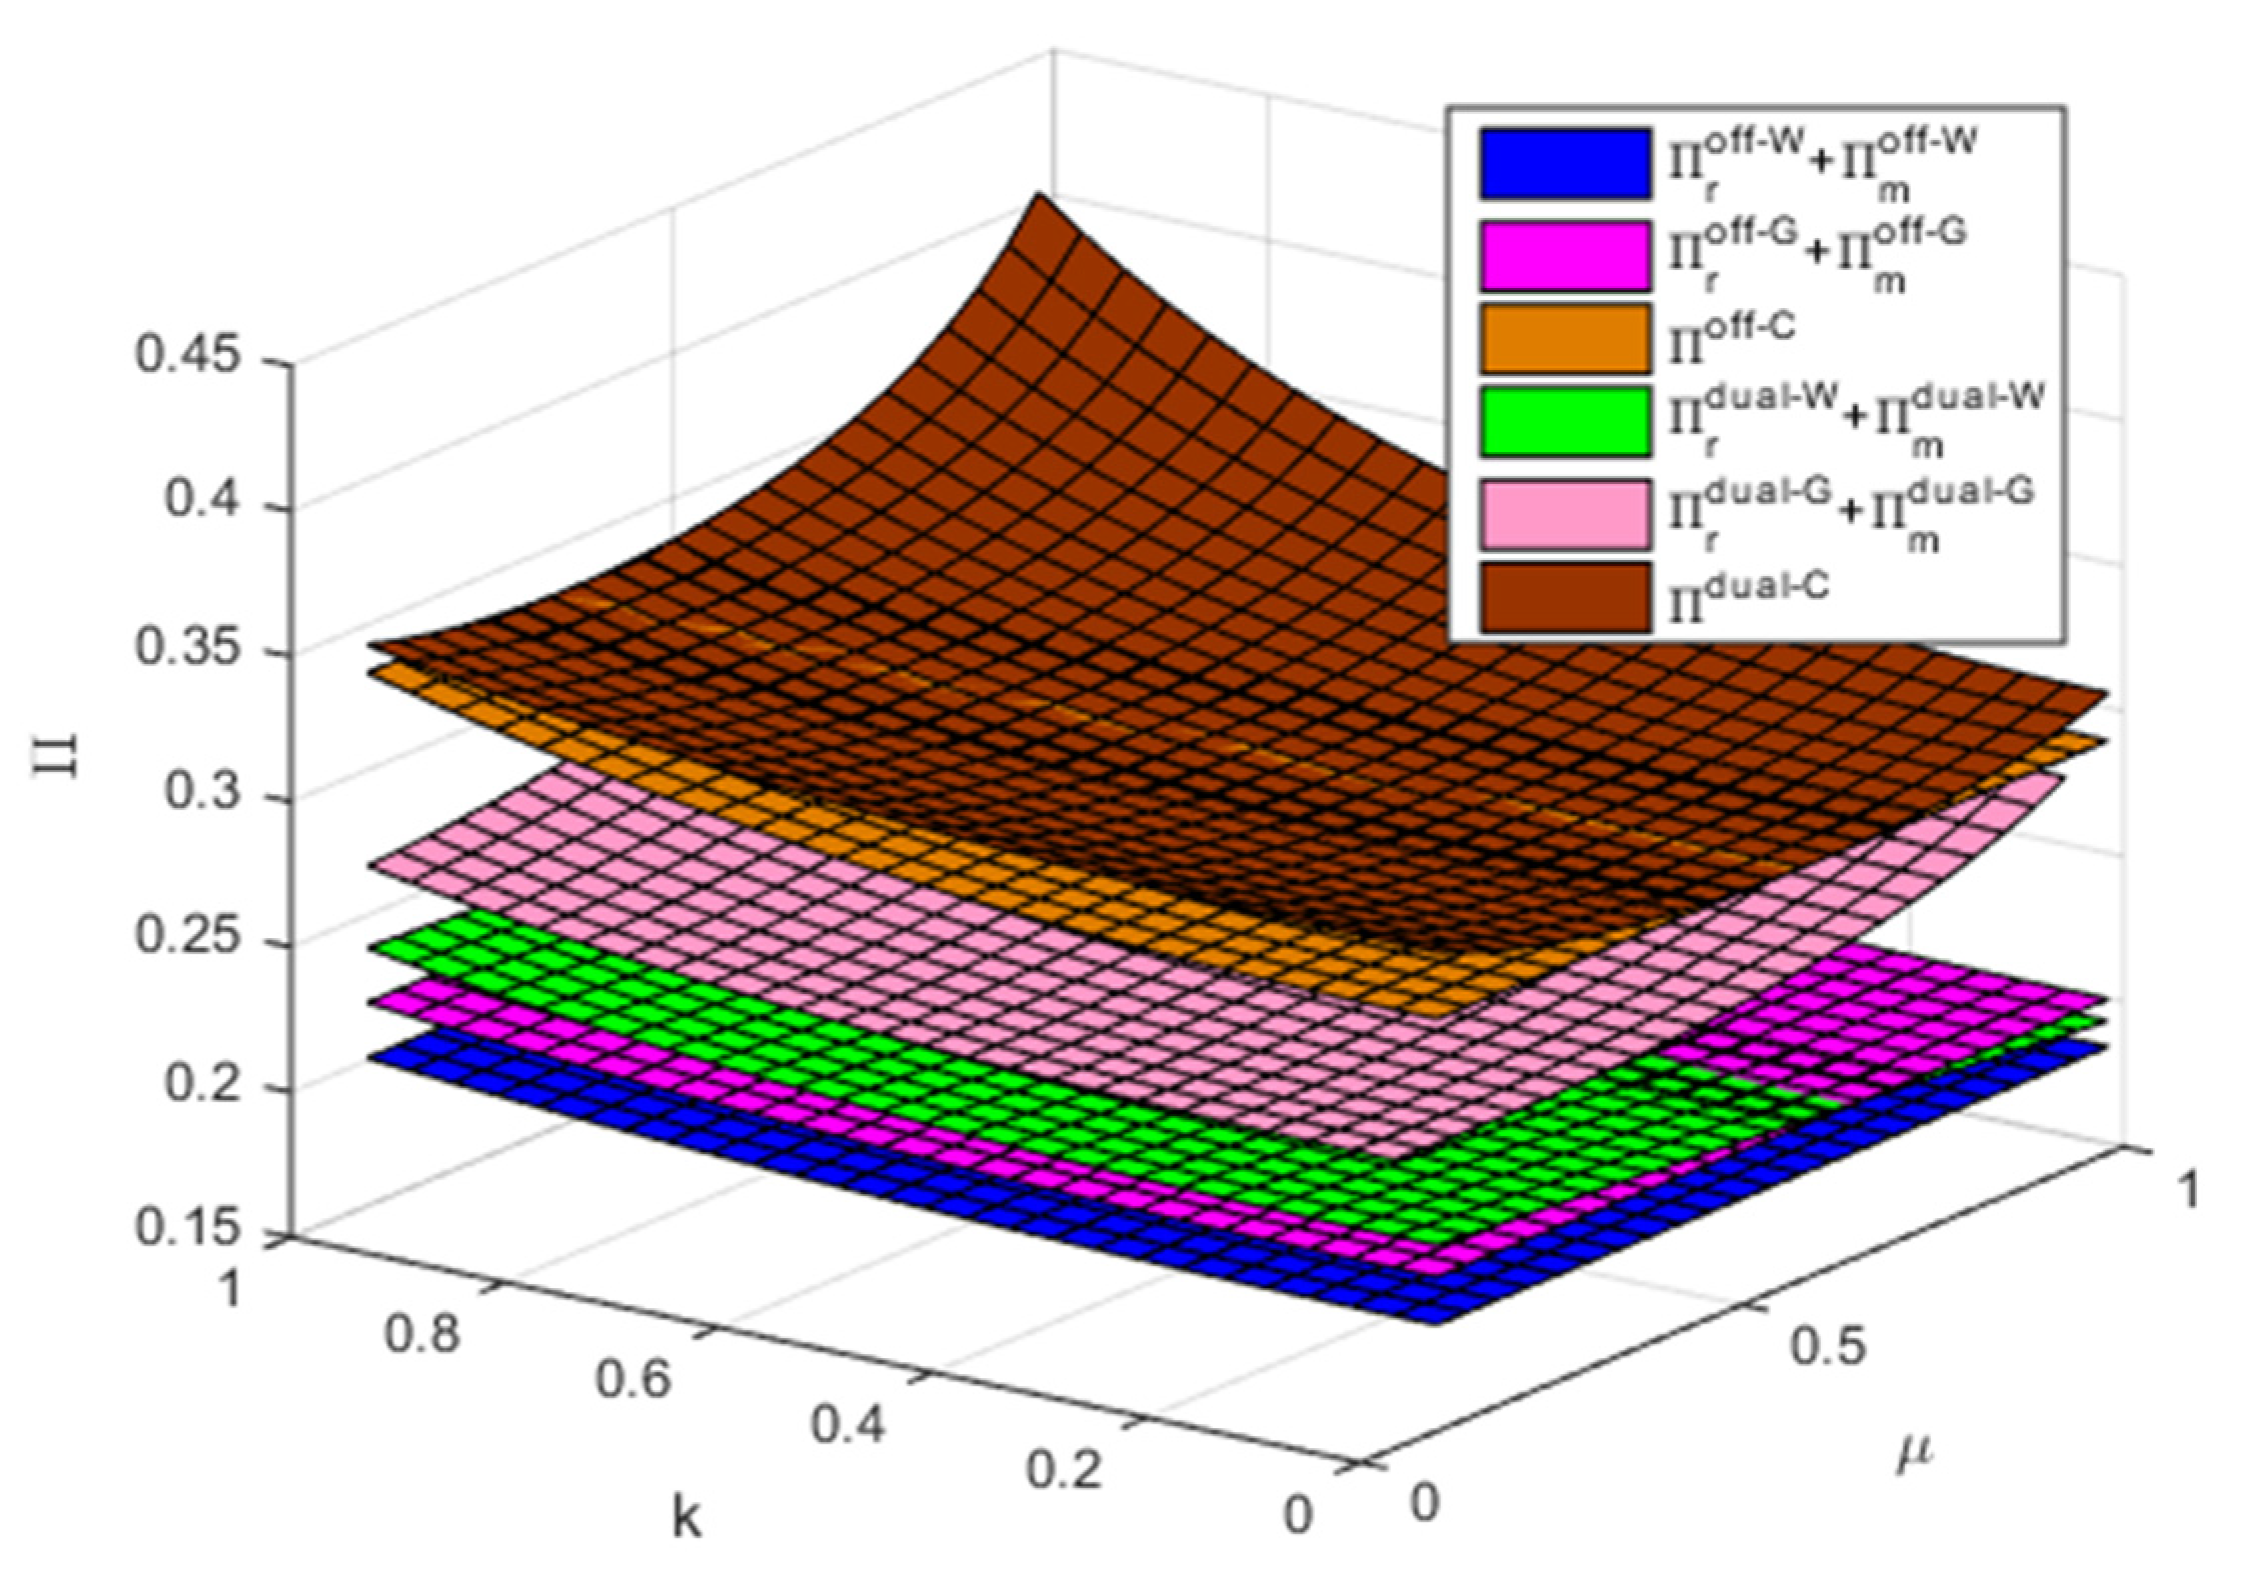
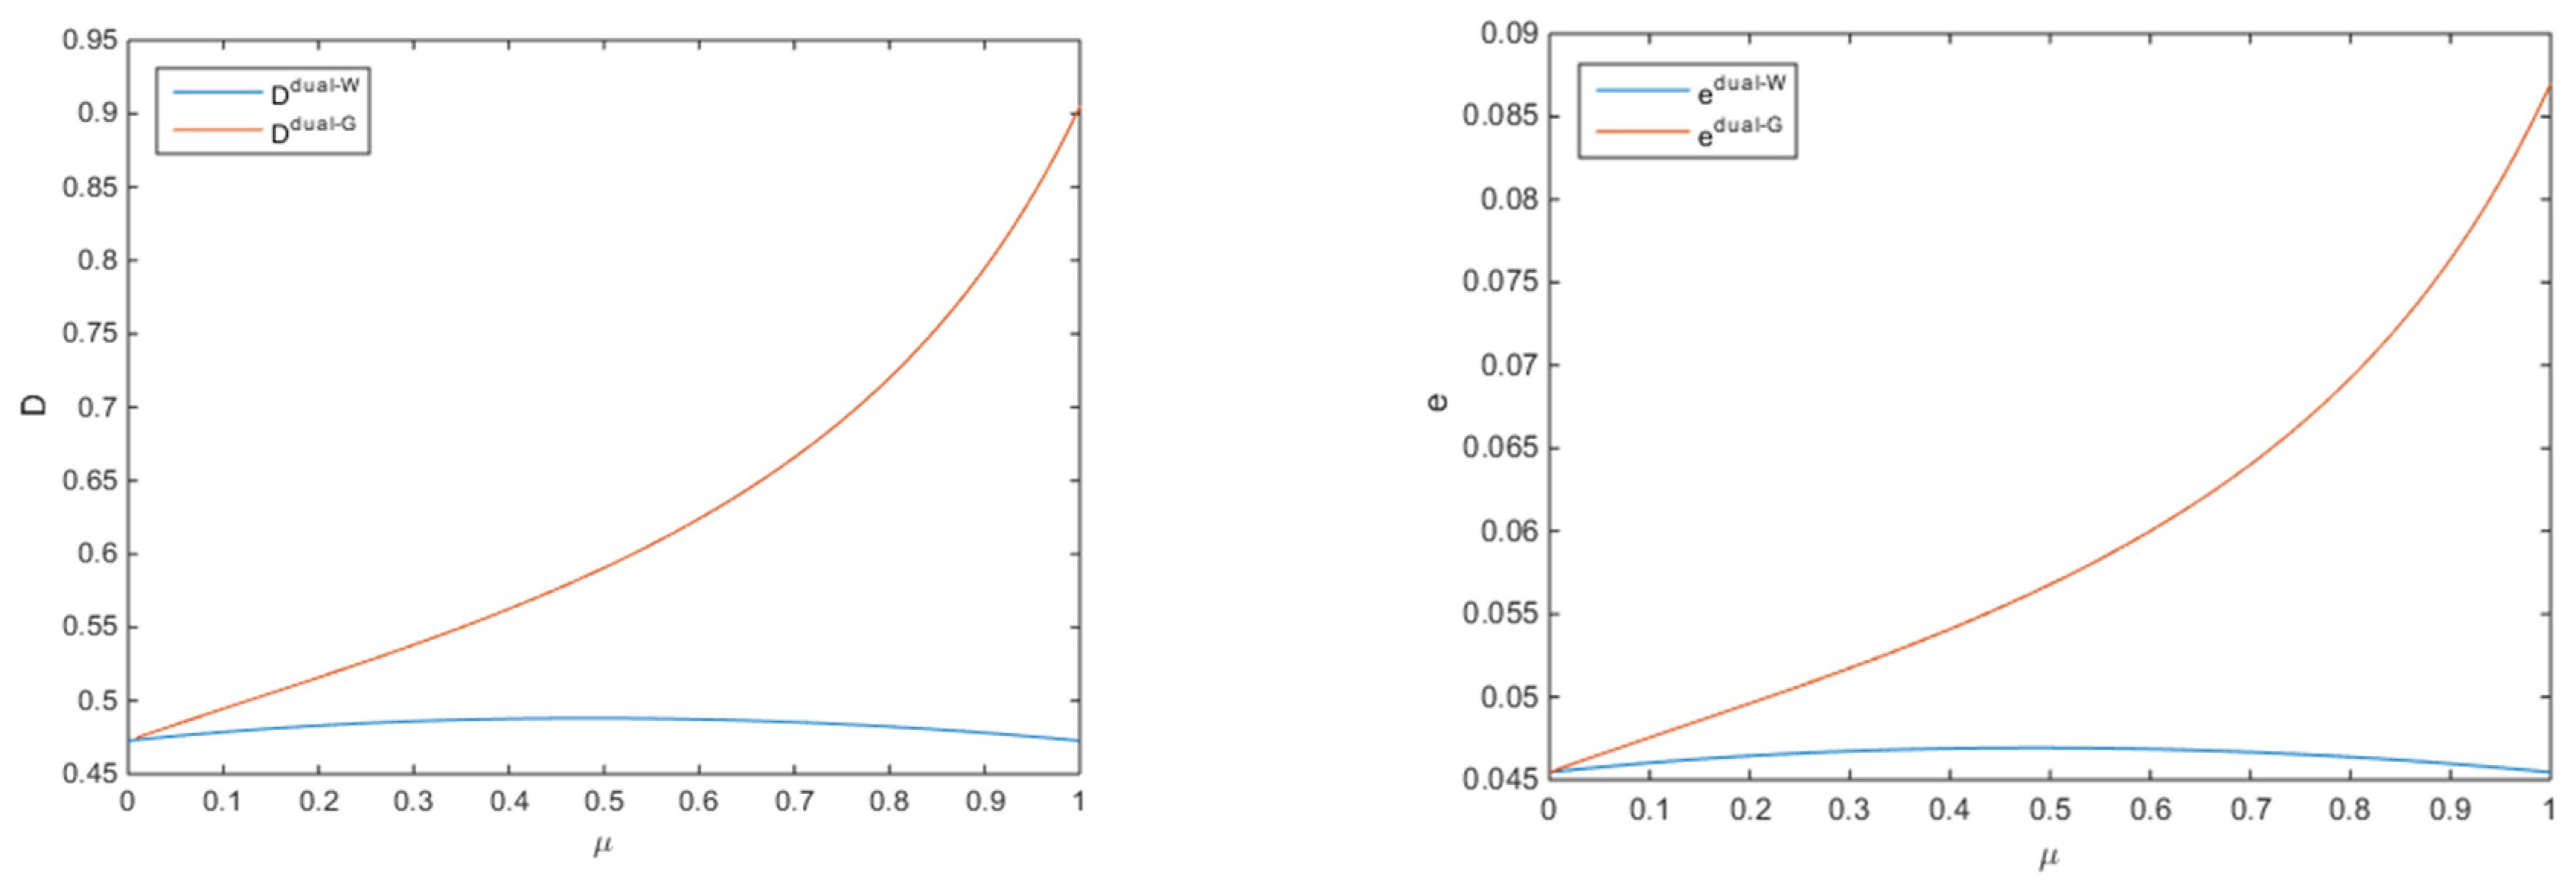
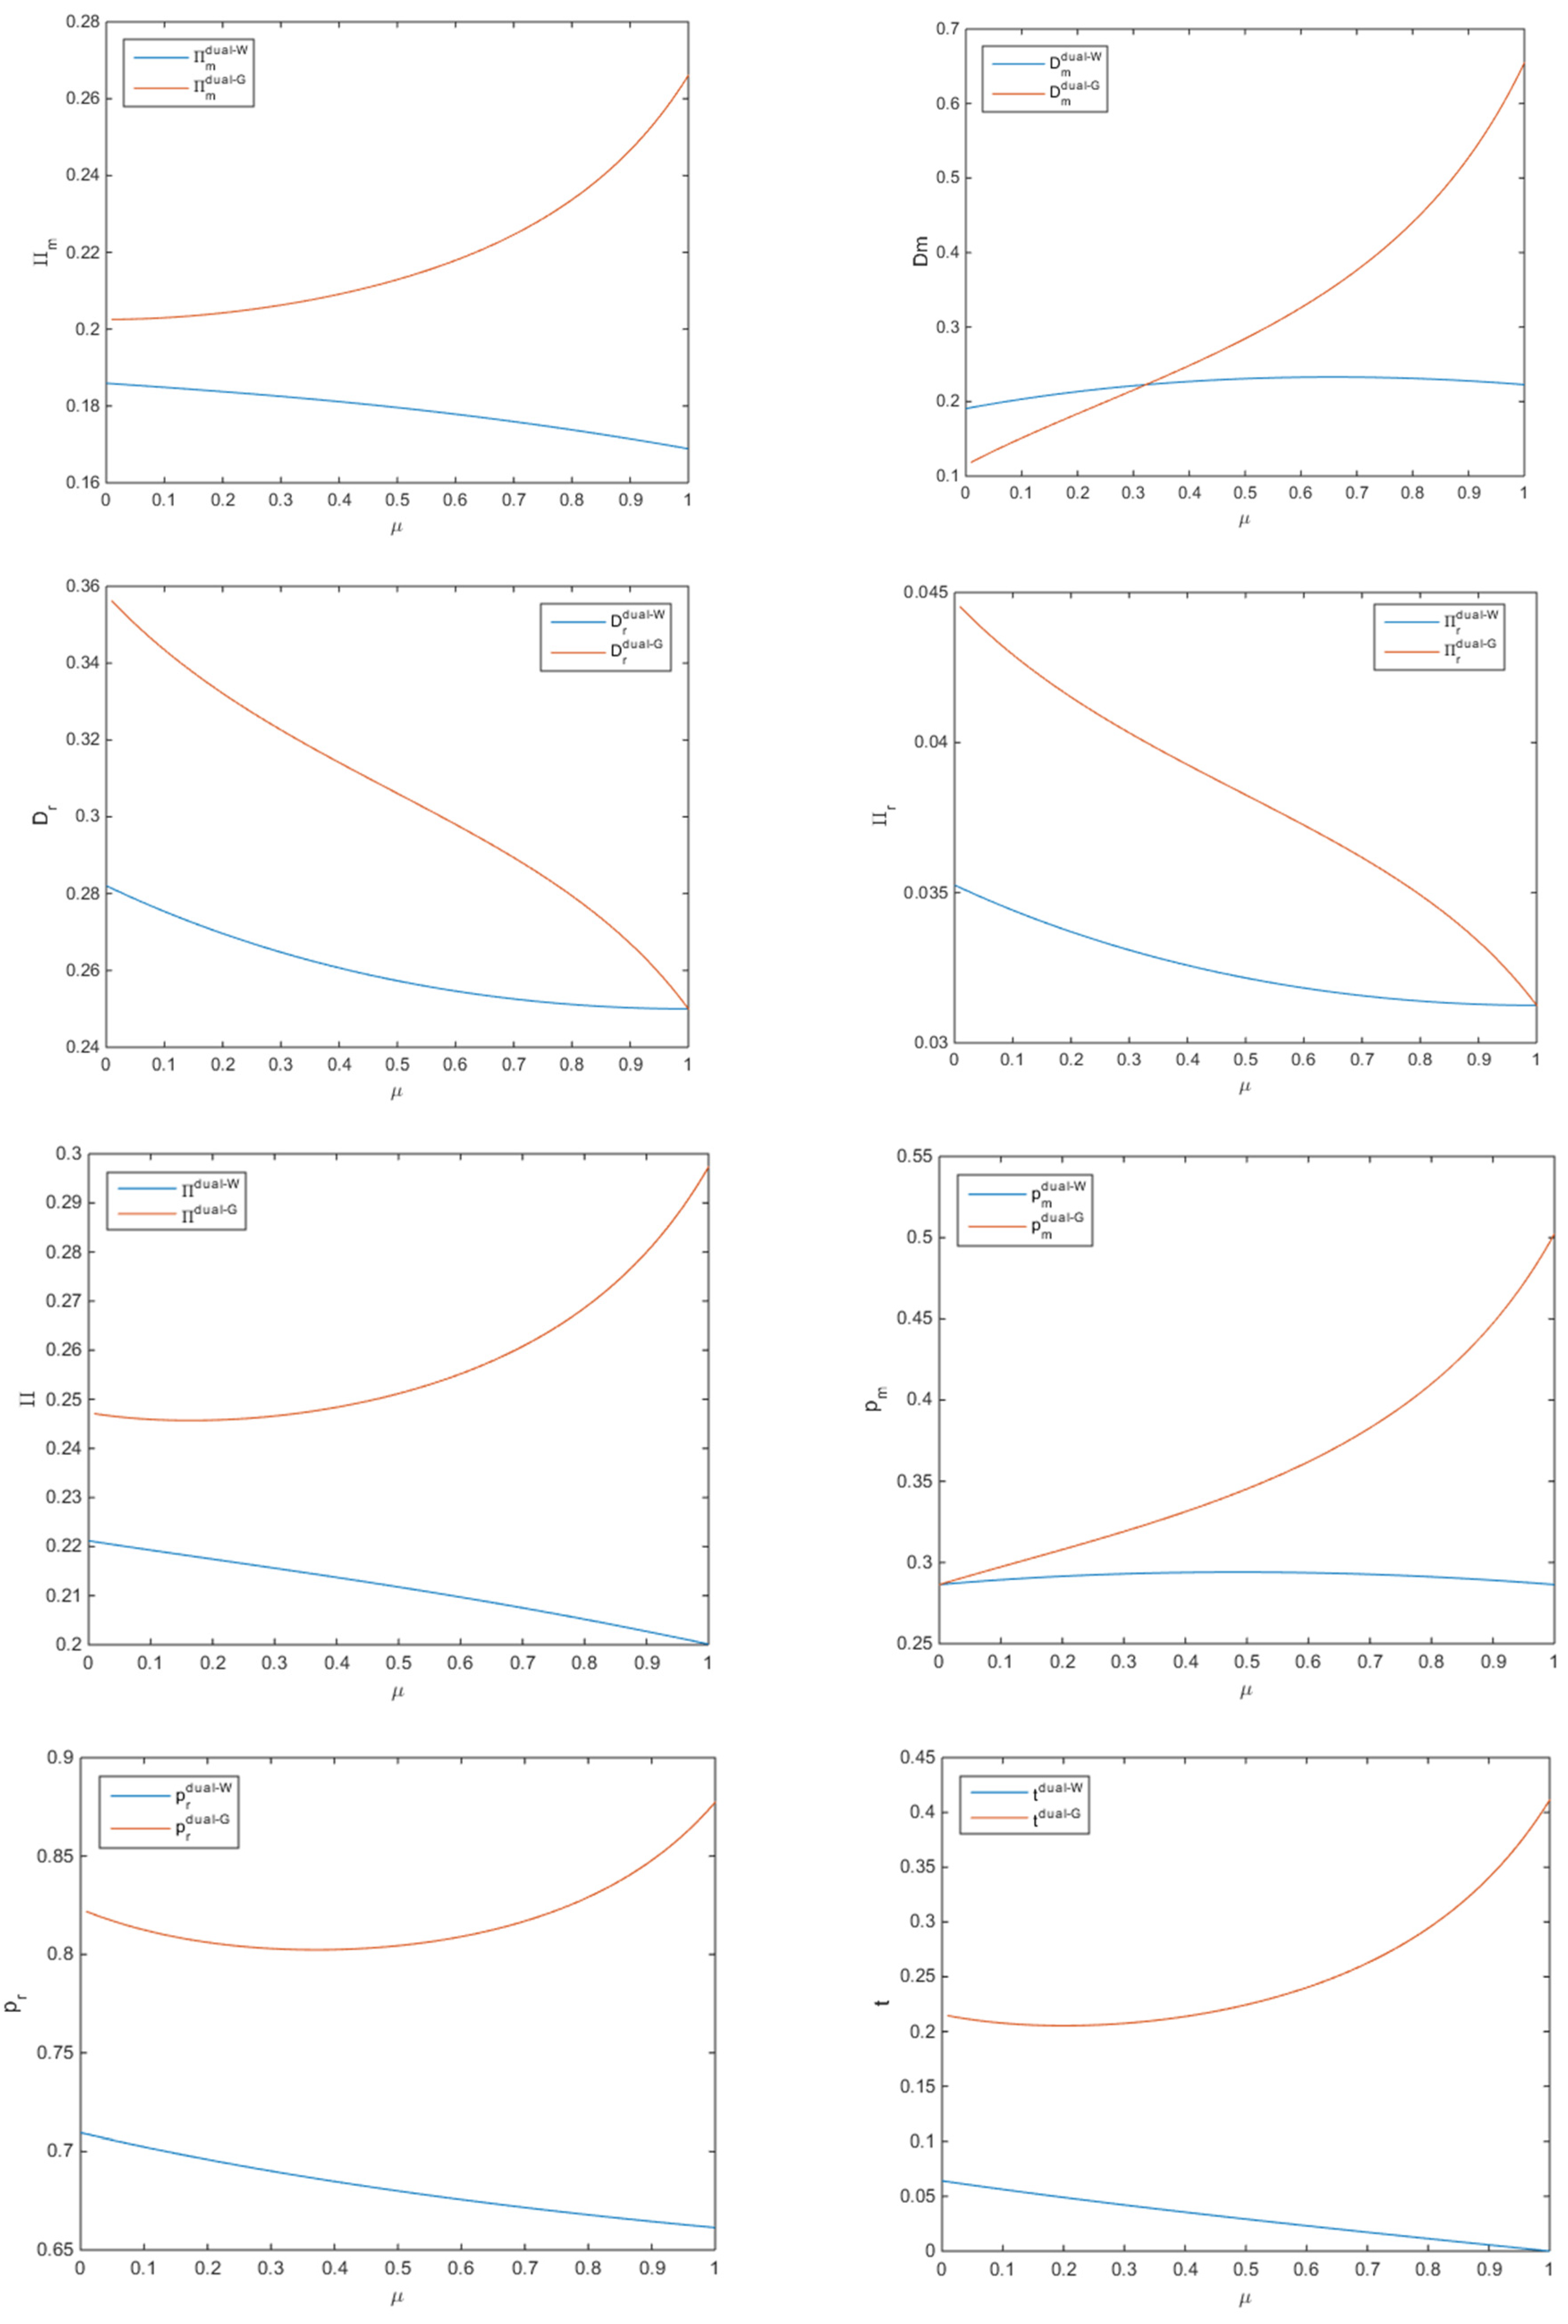
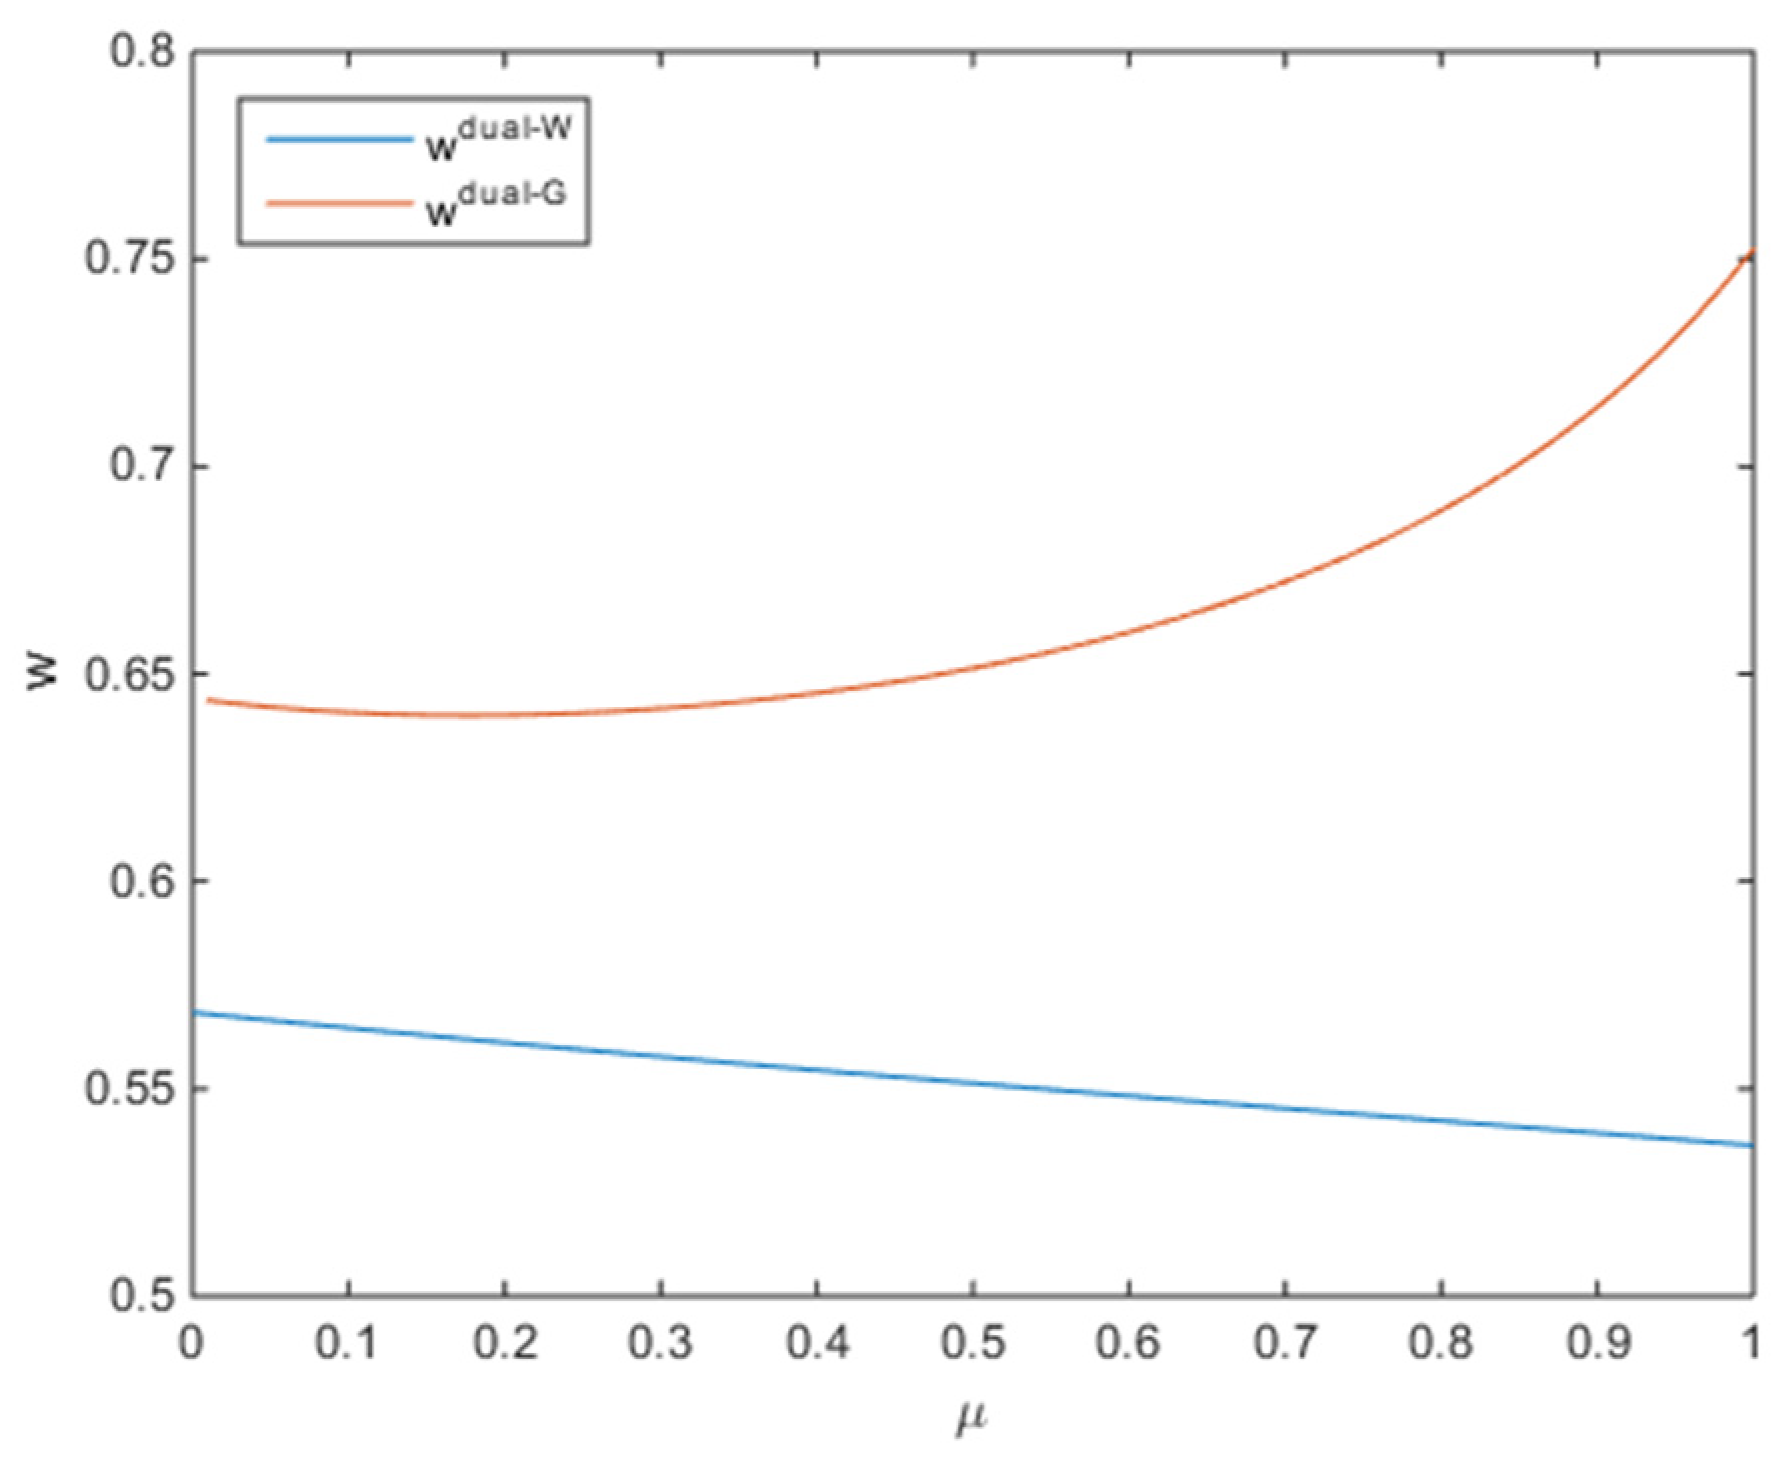
Table 1.
Articles related to our study.
| Researchers | Cooperative Strategy | Green Production (GP)/R&D (GI) | Promotional Service(S)/Free Riding(F) | E-Channel | Social Welfare |
|---|---|---|---|---|---|
| Xu C. (2019); Taleizadeh A. (2018) | √ | GI | |||
| Xu Y. (2018) | GI | √ | |||
| Kavian R. (2019) | GP | √ | |||
| Dey K. (2019); Gao J. (2020) | GP/GI | √ | |||
| Zhu W. (2017); | GP/GI | ||||
| Hong Z. (2019) | GI | S | √ | ||
| Ranjan A. (2019) | GI | S | √ | ||
| Dan B. (2012); Wang L. (2017); Dan B. (2018); Zhang S. (2019) | S | √ | |||
| Pi Z. (2019) | √ | S | √ | ||
| He R. (2016) | GP | S/F | √ | √ | |
| Wu D. (2004) | S/F | √ | √ | ||
| Xing D. (2012); Dan B. (2014); Luo M. (2016); Zhou, Y. (2018); Pu X. (2017) | S/F | √ | |||
| Our Work | √ | GI | S/F | √ | √ |
Table 2.
Notations and their definitions.
| Notations | Definition |
|---|---|
| Superscripts | |
| is a pure offline or dual-channel sales model | |
| denotes the wholesale price (), green promotional service cost-sharing () or centralized () cooperation | |
| Subscripts | |
| Retailer’s variables | |
| Manufacturer’s variables | |
| Decision Variables | |
| Product greenness in sales channel in model | |
| Green promotional service level in sales channel in model | |
| wi−j | Wholesale price in sales channel in model |
| Offline channel price in sales channel in model | |
| Online channel price in sales channel in model | |
| Sharing proportion of the promotional service cost in sales channel in model | |
| Parameters | |
| Production cost | |
| Cost rate of green technology innovation | |
| Cost rate of green promotional service | |
| Consumer utility | |
| Consumers’ e-commerce preference | |
| Consumers’ green preference | |
| Online consumers’ sensitivity to green promotional services | |
| Consumer surplus | |
| Offline channel market demand in sales channel in model | |
| Online channel market demand in sales channel in model | |
| Manufacturer’s profit in sales channel in model | |
| Retailer’s profit in sales channel in model | |
| System profit in sales channel in model |
Table 3.
Impact of green and e-commerce variables on the lower and upper bounds.
| ↗ | ↘ | → |
| ↗ | ↗ | |
| ↗ | ↘ | ↘ |
Table 4.
Equilibrium results of the three cooperative models.
| Centralized cooperation model | Offline channel | , , , . |
| Dual-channel | , , , , , . | |
| Wholesale price cooperation model | Offline channel | , , , , . |
| Dual-channel | , , , , , , . | |
| Green promotional service cost-sharing cooperation model | Offline channel | , , , , . |
| Dual-channel | , , , , , , , . |
Publisher’s Note: MDPI stays neutral with regard to jurisdictional claims in published maps and institutional affiliations. |
© 2021 by the authors. Licensee MDPI, Basel, Switzerland. This article is an open access article distributed under the terms and conditions of the Creative Commons Attribution (CC BY) license (https://creativecommons.org/licenses/by/4.0/).
Share and Cite
MDPI and ACS Style
Mu, Z.; Zheng, Y.; Sun, H. Cooperative Green Technology Innovation of an E-Commerce Sales Channel in a Two-Stage Supply Chain. Sustainability 2021, 13, 7499. https://0-doi-org.brum.beds.ac.uk/10.3390/su13137499
AMA Style
Mu Z, Zheng Y, Sun H. Cooperative Green Technology Innovation of an E-Commerce Sales Channel in a Two-Stage Supply Chain. Sustainability. 2021; 13(13):7499. https://0-doi-org.brum.beds.ac.uk/10.3390/su13137499
Chicago/Turabian StyleMu, Zongyu, Yuangang Zheng, and Hao Sun. 2021. "Cooperative Green Technology Innovation of an E-Commerce Sales Channel in a Two-Stage Supply Chain" Sustainability 13, no. 13: 7499. https://0-doi-org.brum.beds.ac.uk/10.3390/su13137499
Note that from the first issue of 2016, this journal uses article numbers instead of page numbers. See further details here.