
Patterns of Urban Shrinkage: A Systematic Analysis of Romanian Cities (1992–2020)


Department of Geography, Faculty of Geography and Geology, ‘Alexandru Ioan Cuza’ University of Iași, 700506 Iași, Romania
*
Author to whom correspondence should be addressed.
Sustainability 2021, 13(13), 7514; https://0-doi-org.brum.beds.ac.uk/10.3390/su13137514
Submission received: 17 May 2021
/
Revised: 26 June 2021
/
Accepted: 30 June 2021
/
Published: 5 July 2021
(This article belongs to the Section Sustainable Urban and Rural Development)
Abstract
:EU post-socialist countries are nowadays the epicenter of urban shrinkage, despite economic growth trajectories reported during the last decades. However, systematic assessments of urban shrinkage patterns for this part of the continent are surprisingly insufficiently addressed in the literature, and the relationship between urban demographic decline/growth and economic decline/growth is still to be understood. This paper first delivers a state-of-the-art of the peculiarities of urban shrinkage in East-Central EU countries. Secondly, it employs an analysis grid to assess severity, prevalence, persistence, speed and regional incidence of urban decline in Romania—one of the most affected post-socialist countries within the European Union. Thirdly, it explores the statistical association between urban shrinkage severity and economic growth, on one hand, and between urban shrinkage severity and municipality revenues, on the other. Results show that urban shrinkage is currently increasing in prevalence and severity among Romanian cities, thus continuing an alarming trend that started in 1990. Secondly, the results pinpoint a statistically significant association between demographic shrinkage, local economic output and municipalities’ own-source revenues. However, the size effects are rather weak, suggesting a more nuanced relationship between economic and demographic urban growth than that predicted by some theories of urban change.
1. Introduction
Two hundred years ago, humanity embarked on a road leading to unprecedented levels of urbanization, a historic voyage that is still to be completed. Nowadays, slightly more than half of the world population lives in cities, with predictions stating that the figures will rise to 68% by 2050 [1]. Cities (especially the largest ones) are currently the winners of globalization [2,3,4,5], the source of most innovation [6], and, broadly speaking, the most socially and economically dynamic places on earth. However, beyond these eye-catching facts, a ‘quiet’ process [7,8] of urban demographic shrinkage has been unfolding for some time, though in different shapes and with different intensities from country to country. In the US, at least 35% of all US cities larger than 10,000 inhabitants shrunk between 1980 and 2010 [9]. In the EU, 22% of urban areas larger than 10,000 inhabitants shrunk between 1961 and 2011 [10]. In 36 European countries, 19.8% of cities greater than 5000 inhabitants underwent shrinkage between 1990 and 2010 [11]. Urban shrinkage is also becoming a challenge even in rapidly urbanising countries such as China [12,13] and India [14]. However, during the last three decades, it is the post-socialist Europe that has suffered the most from urban decline [15,16,17], both in terms of prevalence and severity of urban shrinkage, with Baltic states, Bulgaria and Romania reporting that more than 70% of their cities shrunk between 1990 and 2010 [11]. Urban shrinkage has become ‘the other facet of urbanisation’ [18], which is expected to continue in the future [19], if not to become an even more widespread phenomenon [15]. Overall, researchers are now acknowledging its significant prevalence and are well aware that it is not a temporary phenomenon, but rather a certainty for the future of urban trends, especially in East-Central Europe.
Against this background, one significant stream of research aims at detecting patterns of urban shrinkage (mostly in respect to distributional issues). Some results stand out due to the large geographical areas covered and insightful findings on the prevalence and severity of urban shrinkage phenomena in an international setting [10,11,16,20,21]. Other studies significantly advanced the understanding of urban shrinkage phenomena for the case of particular countries, such as USA [9,22,23,24], France [25], UK [26], Portugal [27], etc., by concluding on the existence of variegated trajectories of urban shrinkage, and different distributional patterns and severities between countries.
However, there is still more to uncover regarding the patterns of urban shrinkage. Surprisingly, at least to our knowledge, no studies aimed at assessing patterns in a very systematic way for the whole range of cities in any of the post-socialist countries. Extant literature gives insights with respect to urban shrinkage patterns for particular categories of cities, such as large cities in Romania [28] or small cities in Hungary [29,30]. However, none took a systematic approach aimed at a comprehensive and simultaneous analysis of urban shrinkage across the whole spectrum of cities in a given country by employing a precise set of criteria that define urban shrinkage. An example of this is the analysis grid advanced by Robert Beauregard [31]—an analysis grid that integrates prevalence, persistence, severity, and regional incidence of urban shrinkage.
More recently, however, another stream of research has emerged by challenging the ‘traditional’ understanding of urban shrinkage. It questions the relevance of defining urban shrinkage on the sole basis of demographic decline, and therefore advocates for a more nuanced and widened conceptualization of urban shrinkage [32]. It also questions the implicit ‘association of growth with success and shrinkage with failure’ [33,34,35], as well as the relevance of old theories of urban growth in explaining urban shrinkage in general [32] or urban shrinkage for the particular case of post-socialist countries [36]. Some very recent empirical studies have been conducted on these issues, with results confirming the absence of causality/association between population and economic trajectories of cities [9,22]. However, according to our knowledge, such empirical studies have been conducted primarily on western developed countries, whilst the relationship between economic and demographic urban decline in post-socialist cities remains mostly understudied (one exception being [37]).
The current paper aims at attaining three objectives. First, it aims at delivering a state-of-the-art of the peculiarities of urban shrinkage in East-Central EU countries. Secondly, it analyzes the patterns of urban shrinkage in Romania, one of the most affected countries in post-socialist Europe. In order to attain this objective, the following questions are to be answered: Which are the patterns of urban shrinkage in Romania in terms of prevalence, persistence, severity, speed, and regional incidence? Is urban shrinkage currently increasing or decreasing in severity and prevalence? Determining patterns of urban growth/decline across the whole spectrum of cities in a country should be a crucial objective of urban and regional research. Thirdly, the current paper statistically explores the interplay between urban shrinkage severity and economic growth, on the one hand, and between urban shrinkage severity and municipality revenues, on the other. This approach will empirically test existing theories while also providing input for current debates concerning national and local policies dealing with urban shrinkage.
The paper is structured as follows. The second section provides a state-of-the-art concerning patterns of urban shrinkage in seven East-Central EU countries. The third section introduces the data and methods employed for inquiring patterns of urban shrinkage in Romania, as well as the rudiments of population statistics as they are highly relevant in thoroughly inquiring urban decline. The fourth section introduces the results concerning the prevalence, persistence, severity, and regional incidence of urban shrinkage among all Romanian cities and the statistical association between demographic shrinkage and economic decline. The fifth section discusses the results along with their theoretical and policy implications. The sixth section concludes the study.
2. Urban Shrinkage in Post-Socialist EU Countries: An Overview
For the last three decades, countries of East-Central Europe have been known for undergoing the complex process of post-socialist transition [35,38,39], a process which included, inter alia, dramatic demographic changes and a rather abrupt shift from a state planned-economy to various forms of neoliberal economic doctrine [40,41]. The process has been accompanied, and followed by an ever-deepening integration into the EU and the global markets, with capital and large cities being the most resilient places, both economically and demographically. The largest cities have significantly performed in economic terms and thus became the icon of their regions [42,43], with some of them performing well above the EU average. However, they constitute only a fraction of the urban world of post-socialist countries. Beyond them, hundreds of other cities and towns did not manage to cope with recent demographic and economic transformations and hence started to shrink, leading to a phenomenon that captured the attention of researchers.
Researchers have studied the complex process of urban shrinkage for about two decades, either as part of broader studies aiming at understanding the overall local and regional demographic shrinkage [44], or as part of studies trying to understand the dramatic events of deindustrialization in various urban settings [45,46]. More recently, however, there has been a shift in understanding urban demographic decline as a relatively distinct process from the overall demographic decline and, as a process with causes that stretch beyond deindustrialization and second demographic transition. Such empirical studies have been conducted for various geographical settings: cities from various countries for the purpose of international comparisons [16,20,47], the whole spectrum of cities within a particular country [45,48,49,50], and case studies of particular cities [51,52,53,54,55] or groups of cities within a specific country [28,56,57,58,59].
However, one may notice that only a few cities from East-Central Europe constitute the vast majority of case studies. Studies on large cities prevail, as already noticed by researchers [60,61], though some of the very recent research tried to fill this gap by focusing on the particular cases of small and medium towns [29,30,62], or by looking at the whole spectrum of European cities, including small and medium cities from East-Central Europe (e.g., [10,11,21]). One particular challenge of these diverse approaches is that findings are hardly comparable. Nevertheless, they still allow us to isolate a few specificities that characterize (patterns of) urban shrinkage in eastern EU countries: (i) urban shrinkage impacted the region in a significantly more severe manner compared to other regions of the world; (ii) shrinking cities face their own specific challenges that differ from their counterparts from other regions of the world, most notably in regard to the main determinants and contextual conditions, and (iii) urban demographic shrinkage is a silent and undebated process, being eclipsed by the overall economic growth.
2.1. Highest Currently Recorded Prevalence and Severity among World Regions
EU post-socialist countries are currently among the most affected countries in the world by overall population decline [63]. Hence, it should be no surprise that they stand out as having, by far, the highest prevalence of urban shrinkage. Recent studies showed that, between 1990 and 2010, the first 12 most affected European countries by urban shrinkage (out of a total of 36 countries) are all located in East-Central Europe [11]. According to the same study, 90% of cities in Latvia shrunk between 1990 and 2010. Still, a very high prevalence is also reported for Lithuania, Estonia, Romania, Bulgaria (>70%), Serbia, The Czech Republic, Croatia (>50%), Hungary, Slovenia, Slovakia and Poland (>30%) [11]. Another particular aspect describing shrinkage in East Central EU countries is the unusual speed of the process. Compared to their western counterparts, post-socialist cities have experienced extremely severe shrinkage in a very short period of time [16]. Consequently, it should be no surprise that cities from this part of the continent are now considered the ‘new European pole of shrinkage’ [61].
2.2. A Particular Mix of Determinants within a Particular Context
Opening a discussion about particular determinants of urban shrinkage in East-Central European countries will inevitably touch on the controversial issue of the existence of a post-socialist condition of cities from this part of the world [35]. Sonia Hirt [35] explains and elaborates on the differences between two schools of thought on this issue: the ecological and the historical schools. The former advocates, explicitly or implicitly, for the existence of a socialist (and then of a post-socialist) city, arguing that the mode of production in post-socialist countries has been fundamentally different from the one in capitalist countries, and that this has led to fundamentally different urban spatial structures and fundamentally different problems to be solved during post-socialist transition. On the contrary, the latter school of thought interprets the difference between the (post)socialist city and its capitalist counterpart as being only secondary to their similarities, stating that both categories of cities undergo the same processes (industrialization, deindustrialization, suburbanization etc.), and, if differences emerge, then these differences are due to some of the cities lagging behind the others.
Following the current literature review, we argue that the existing literature suggests that urban shrinkage in East-Central Europe has rather similar causes to other parts of the world: deindustrialization [45], suburbanization [64], second demographic transition [30], emigration, spatial peripheralization processes [65], as well as policies implemented at national and local levels [66]. However, what differs from their western counterparts is the relative importance of each of the causes, their overall mix, the synergy between different causes, and the contextual conditions under which the shrinkage is taking place. Deindustrialization has happened in a more abrupt way (following the so-called “shock therapy”). Birth rates have fallen to be among the lowest in the world, whilst emigration and spatial polarization processes are significantly more acute in East-Central Europe compared to other parts of the EU. Furthermore, findings from recent studies [64,66] suggest that neoliberal policies implemented in East-Central European countries might also explain why cities from this part of the continent continue to demographically shrink, in contrast to some of their western counterparts that benefited from generous welfare policies and regained demographic growth.
2.3. A Silent Process Eclipsed by Economic Growth
Surprisingly, urban shrinkage is not a hot debate in most of the Eastern EU countries despite being the region of the world that is most affected by this phenomenon [44,56]. This situation even inspired some east European researchers to label urban shrinkage as being the “unspoken challenge of spatial planning” [67]. But why is this happening? Scholars have brought various explanations for this paradoxical situation. For the Lithuanian case, researchers argue that the growing economy is one of the excuses for the government not to take any steps in managing the issue of population decline [44]. For the Slovakian case, researchers state that urban shrinkage is not perceived according to the gravity it represents due to, inter alia, the wide-scale decentralisation, which may have resulted in shrinking problems being perceived as “problems of individual local self-governments” [56] (p. 4).
In the Romanian case, others argue that shrinking cities are not included in policies and strategies as an important and distinct matter because this phenomenon is considered to be mainly related to the overall population decline that started after 1990 [68]. Another explanation put forward by scholars might be the lack of national urban policies in most of the post-socialist countries (at least until very recently), a situation that might have prevented governments from fully grasping the problem and taking appropriate measures, though issues of urban shrinkage could have been addressed in the context of current programming and planning framework, including by mobilizing EU funds [56].
However, it may be worth mentioning that the insufficient acknowledgement of urban shrinkage is not a characteristic only to Eastern EU countries. Urban shrinkage is also silently affecting cities in Canada [7], France and the UK [8]. What is different is the explanation behind this rather quiet process: whereas urban shrinkage in France and UK is eclipsed by overall population growth at a national level, in East-Central Europe, it occurred in the shadows of more general problems related to post-socialist transition during the 1990, and has afterwards been eclipsed by the important economic growth during the 2000s and 2010s, as well as by the dominant neoliberal discourse, which prioritises economic growth to the detriment of a more integrated approach of urban development. In this context, perhaps the only exception is Eastern Germany, where, during the first years of the 2000s, urban shrinkage overlapped with oversupply on the housing market [69,70], leading to around 1,000,000 abandoned apartments [69]. This situation triggered a wide public debate, followed by extensive policies supported by massive investments [69], and a considerable wave of research that tried to deepen the knowledge on shrinking cities.
2.4. Context and Particularities of Romanian Urban Shrinkage
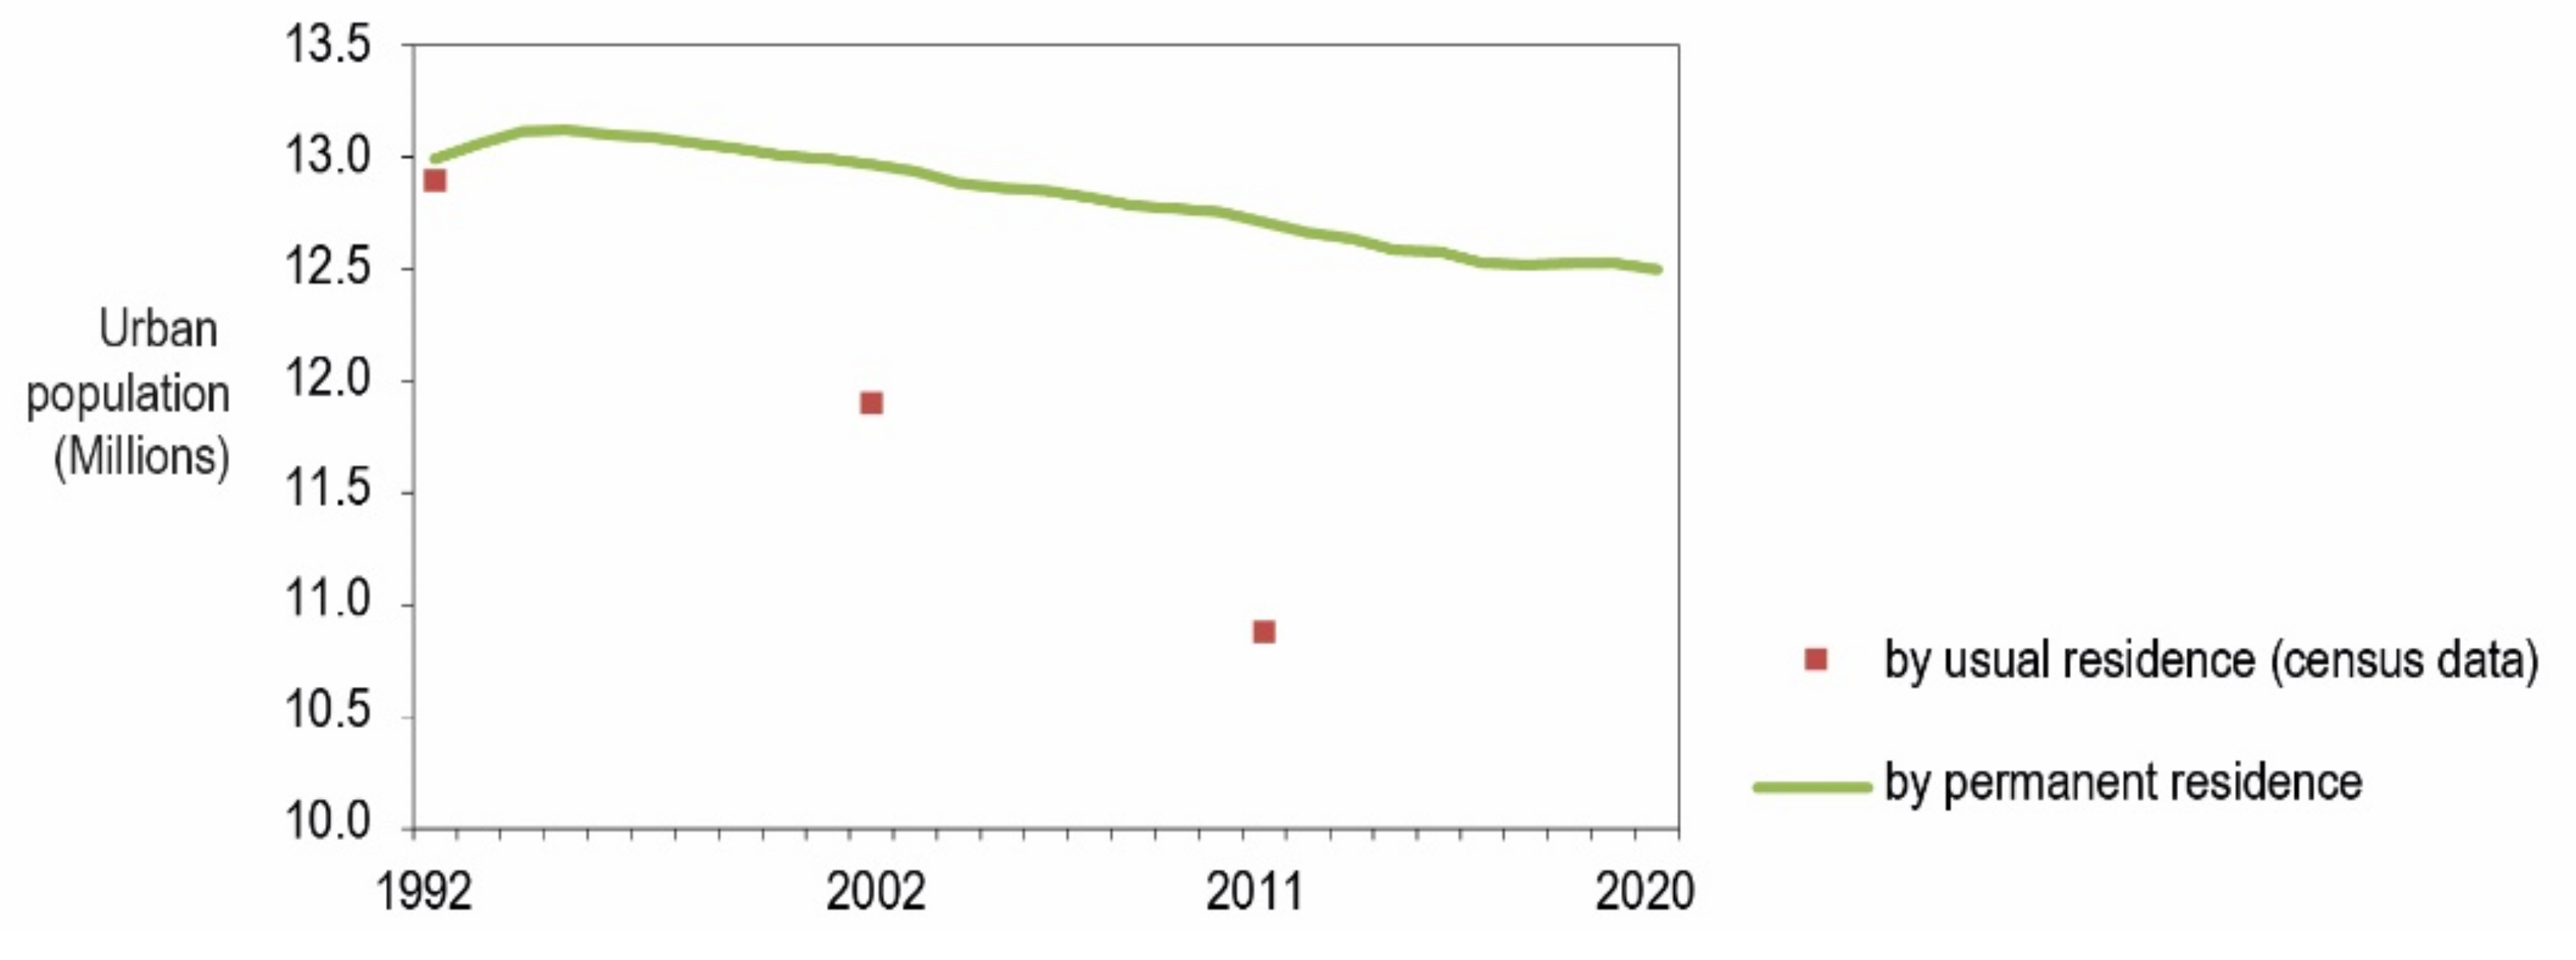
The Romanian urban system has common characteristics with its post-socialist neighbors: accelerated urbanization during the communist period, an unaccomplished urban transition that halted during the 1980s, and profound post-socialist transformations, with growing inequalities and increasing peripheralization processes. However, it also displays some peculiarities: the lowest share of urban population (54%) among East-Central European countries of the EU, a relatively high number of small cities with rather rural characteristics [71], and particular urbanization policies [72]. Against this background, following the year 1994, Romanian urban population has entered a dramatic declining trajectory (Figure 1), due to falling birth rates, emigration, deindustrialization [45,72] and ‘back to the village’ movement [60,73,74] during the late 1990s, but also due to suburbanization [72,75], emigration and still very low birth rates following the year 2000. Consequently, these processes have set the ground for high prevalence, persistence and severity of urban shrinkage phenomena.
3. Exploring Urban Shrinkage: Data and Methods
3.1. Operational Definitions of Urban Shrinkage
For most of the scientific community, urban shrinkage refers to “a concomitant process of demographic and economic decline with a structural impact on two constitutive elements of the city, the density of the population and its economic functions, thus generating considerable social effects” [76]. For other researchers, urban shrinkage is a distinct phase of the adaptive cycle model, corresponding to the periods of conservation and release [28]. However, when it comes to measuring urban shrinkage in comparative studies, such conceptualization are significantly simplified. Operational definitions call for proxies that generally conceptualize urban shrinkage in a rather straightforward manner as being either (i) population loss, (ii) negative changes in a set of various urban demographic variables, or (iii) a combination between demographic and economic decline. The vast majority of studies measure urban shrinkage as population loss, as a city’s population has long been acknowledged to be the ‘core indicator of city shrinkage’ [77], and a reliable indicator of the city’s attractiveness [31]. Population change is unsurprisingly the main indicator employed in international comparative studies [10,11,16,20], but it also dominates studies on groups of cities from within the same country. Most probably, the reason for this has to do with demographical data availability compared to data reflecting other dimensions of urban decline.
The second group of studies conceptualize urban shrinkage as a more complex demographic change over time, and hence measure it by employing a mix of demographical variables to detect types of urban shrinkage. For example, a study on Romania [28] employs six variables that the authors call markers of urban decline in order to create a typology of shrinking Romanian cities: natural loss of population, migratory loss of population, number of years with decreasing population, evolution of the ageing index, the decrease in the total number of employees, and the decrease in the total population of metropolitan areas. A third and last stream of research understands urban shrinkage as a combination between population loss and economic decline. However, studies that measure urban shrinkage using a combination of demographic and economic indicators are extremely rare. Despite this fact, a growing interest in this issue has emerged during the last years [9,22], with findings showing that cities can economically strive amidst population loss, thus suggesting that a relationship connection between population loss and economic decline might be very weak or not exist at all (contrary to what was previously thought).
The current study first measures urban shrinkage as population loss and then compares it to changes in economic output and own-source revenues of municipalities, with the final purpose of testing if there is an association between the economic and the demographic trajectories of Romanian cities.
3.2. Technical Challenges
Assessing urban shrinkage over long periods of time also raises some technical and methodological issues, such as (i) the reliability of demographical data, (ii) the changing number of cities in a country, and (iii) the changing nature of urban morphology and of cities’ administrative borders.
3.2.1. Reliability of Demographical Data
Population loss is harder to compute than it may seem at first glance if one searches for a reliable picture of demographical realities. City population may be considered either the one registered at census once every 10 years, or the one provided by statistical institutes on a yearly basis (register data). Census data is by far the most reliable. However, census data is available for every ten years (for the Romania case—only for 1992, 2002 and 2011), whilst shrinkage patterns should be analyzed in a more detailed manner by employing longitudinal data on a yearly basis. Table 1 gives an overview of the demographic data availability and reliability for the particular case of Romania.
The current study will rely on census population for assessing patterns of urban shrinkage during 1992–2011, as well as on population by permanent residence (register data) for more in-depth detail of trajectories of urban shrinkage (on a year-by-year basis) and for a longer period of time. However, it is worth mentioning that there are significant differences in reliability between the two data sets (Table 1 and Appendix A), differences that are worthy of being kept in mind when analysing urban shrinkage. First, significant difference between census population and population by permanent residence is currently the norm, with permanent resident population being generally higher than the census population (for some cities, this difference can go up to 48% higher—Appendix B), due to temporary emigration that is not captured by register data. Second, differences between census population and population by permanent residence increased over the last decades. For the 320 municipalities under study, permanent resident population is reported to be higher than census population by 0.7% in 1992, by 8.9% in 2002, and by 17.0% in 2011 (Appendix A).
Therefore, register data, in our case population by permanent residence, is becoming increasingly erroneous over time, most likely because of the increasing spatial mobility of population (unregistered international and internal migration). Therefore, when permanent resident population is the proxy employed to assess urban shrinkage, the severity of urban shrinkage for most of the Romanian cities might be seriously under-estimated, especially for the recent decades. However, over-estimations might also exist, though not as frequent as the under-estimation cases (Appendix A). The relative unreliability of register data is not a characteristic only for Romania, but also for Slovakia and the Czech Republic [61], Estonia [78], and most likely for other (East-Central European) countries as well.
3.2.2. The Changing Number of Cities
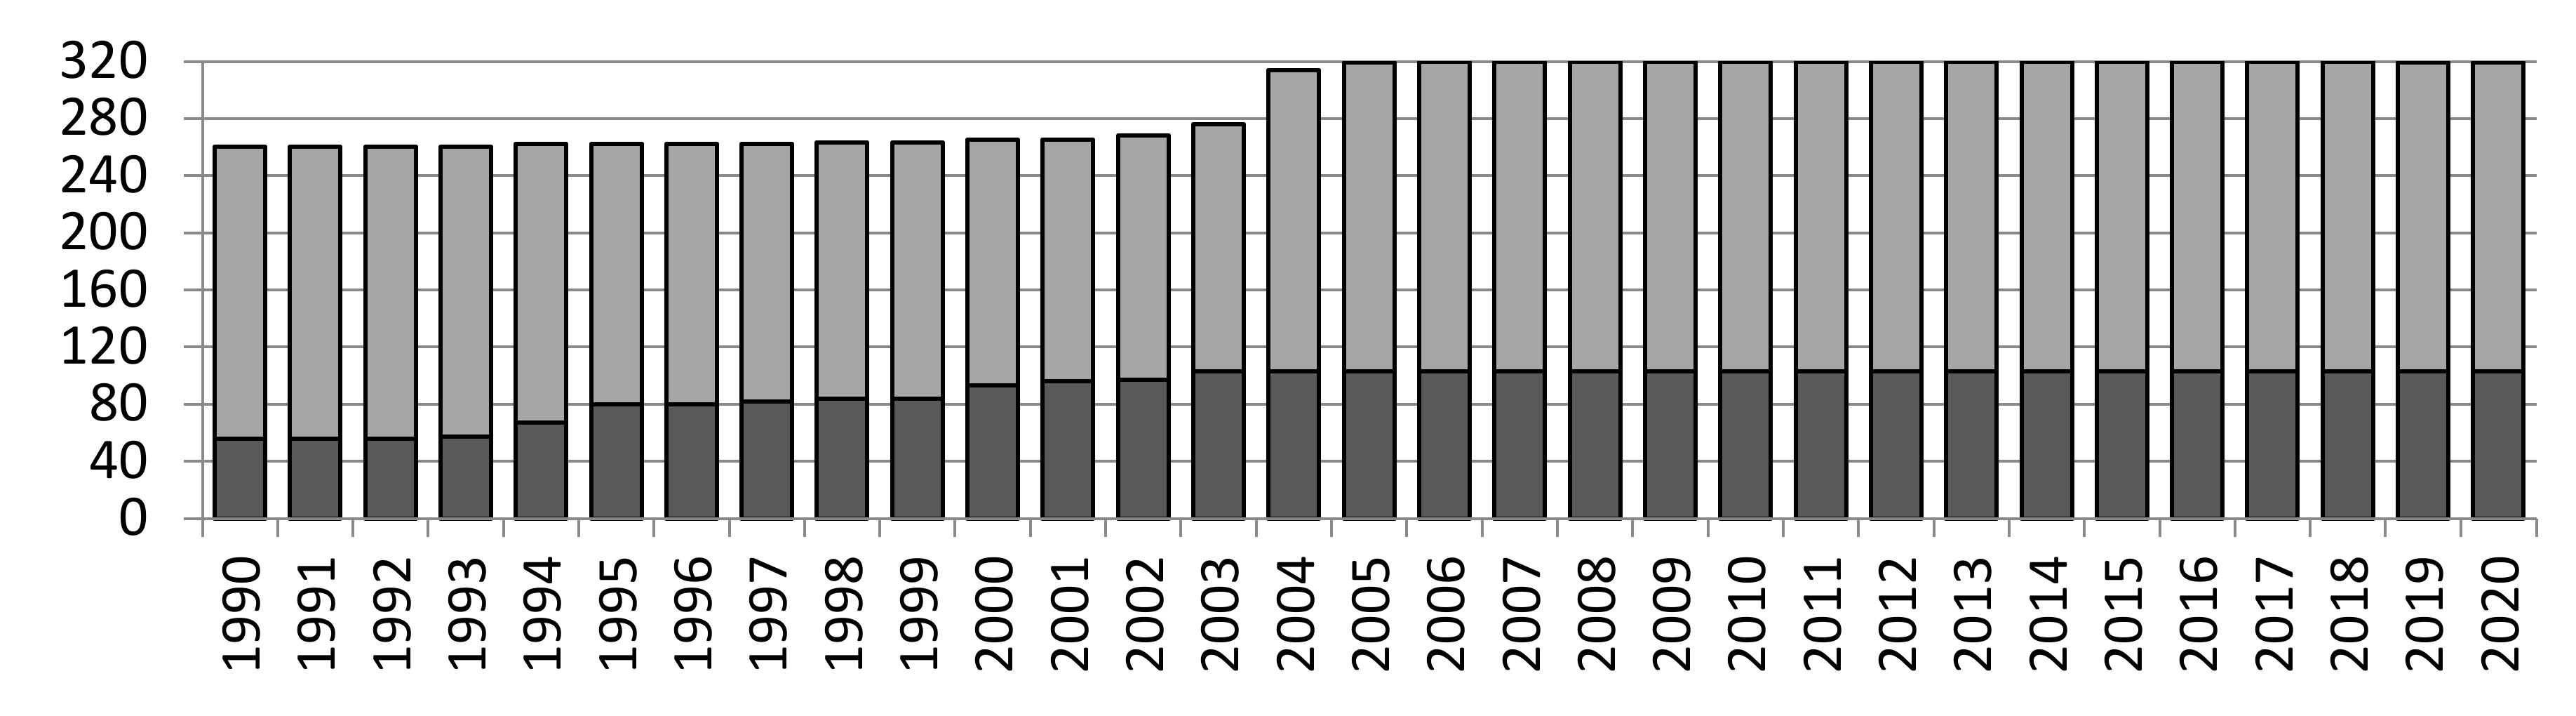
The number of Romanian cities increased from 260 in 1992 to 320 in 2006 and later declined to 319, in 2019 (Appendix C gives an overview of the changing number of cities and towns during 1992–2020). All data employed in this paper considers the maximum number of Romanian cities during the analysed period (that is, 320 cities and towns). In other words, localities that were granted urban status during the second part of the analysed period have been integrated into our analysis for the entire period of 1992–2020. Thus, our analysis considered that Romania had 320 ‘cities’ both in 1992, and in 2020, although their number changed over time.
3.2.3. The Changing Nature of Urban Morphology and City Administrative Borders
Data employed in this paper for assessing urban shrinkage only concern the core cities. This might be very questionable at first glance, and we acknowledge the significant morphological transformations that have taken place throughout the last decades, most notably due to processes of suburbanization [75]. However, the urban population is still being considered as only the one living in core cities and core-cities are relevant in fiscal and political terms in their own right; hence, their growth/shrinkage is worth further analysis.
On the other hand, even core cities might change their administrative border, by incorporating new localities or by dividing themselves into more distinct administrative unites. During 1992–2020, two Romanian cities incorporated into their administrative border communes from their closest vicinity, and other eight cities lost parts of their administrative areas to newly declared local administrative units. This research incorporated all these changes and recalculated/re-aggregated data when this was the case in order for the longitudinal analysis to make sense.
3.3. Methodological Approach
This paper assesses patterns of urban shrinkage by employing a mix of research methods chosen in accordance with the two main research objectives.
First, patterns of urban shrinkage have been scrutinized by operationalizing a conceptual lexicon advanced by Robert Beauregard [31]. As such, we thoroughly inquired prevalence, persistence, severity and speed of Romanian urban shrinkage, while also distinguishing between absolute and relative shrinkage (Table 2). Also, the current research created a typology of Romanian cities based on their demographic trajectories, where inflection points had been central criteria in establishing the typology. For this purpose, hierarchical cluster analysis has been employed (a method that has been previously used by [9] for the same purpose), followed by further manual operations that spitted/recombined various categories of cities so that each category of cities reflects particular trajectories as accurate as possible. Finally, spatial patterns of urban shrinkage have been assessed in two different manners. On the one hand, descriptive statistics have been computed on the prevalence and persistence of urban shrinkage by large historical regions. On the other hand global Moran’s statistics have been employed to explore whether shrinking/growing cities tend to form spatial clusters irrespective of the historic/administrative region they belong to.
The second research objective (aiming at determining whether the demographical decline is significantly associated with economic decline and with changes in local revenues) has been attained by conducting cross-tabulations and by computing Pearson Chi-Square statistics.
4. Results
4.1. Prevalence
Results indicate an extremely high prevalence of urban shrinkage, irrespective of the thresholds employed (Table 3). While a decline of two consecutive years may not indicate an alarming situation, a decline of at least five consecutive years is generally considered a marker of structural transformations [11,79]. Prevalence values of 72% (for 1992–2011) and 83% (for 1992–2020) regarding the decline of at least five consecutive years point out dramatic structural changes across the vast majority of Romanian cities. Furthermore, the prevalence computed based on various thresholds of severity pictures the same reality, with the vast majority of cities undergoing absolute decline at rates higher than 0.15% p.a.
It is also interesting to note that there are significant differences in results given by the two different datasets (census data vs. register data for the period 1992–2011). Overall, results clearly indicate a significantly more prevalent phenomenon of absolute shrinkage when measured according to census data, compared to the situation when it is measured by computing register data. Prevalence of absolute shrinkage measured using census data is between 1.3 and 2.4 higher than prevalence measured using register data (291 vs. 217 cities with CAGR < 0 p.a.; 280 vs. 169 cities with CAGR < −0.15 p.a.; 266 vs. 113 cities with CAGR < −0.30 p.a.). Taking into consideration that census data is the most reliable (Table 1, Appendix A), one may conclude that the prevalence of absolute urban shrinkage is significantly underestimated when assessed using register data, although not for all cities (Appendix A).
4.2. Persistence of Urban Shrinkage
The temporality of urban shrinkage is particularly important. Urban shrinkage effects are more severe as the shrinkage extends over a longer period of time. In order to have a glimpse of the duration of urban shrinkage, Romanian cities have been classified into four categories: (i) no urban shrinkage (no shrinkage episode for more than one year), (ii) short-term shrinkage (population decline registered for at least two years, but no longer than four years), (iii) medium-term shrinkage (population decline recorded for five to 14 years), (iv) long-term shrinkage (population decline recorded for at least 15 years). Moreover, the classifications have been obtained by employing four different computation methods (Figure 2).
Figure 2 shows that, overall, long-term shrinkage is, by far, the most prevalent form of urban shrinkage for all categories of cities, though—according to two of the four methodological approaches (Figure 2a,c)—medium-term shrinkage appears to be more prevalent in the case of small and largest cities. Results also show that high prevalence of long-term shrinkage is most characteristic to medium and large cities, irrespective of the methodological approach (Figure 2a–d). Furthermore, it is worth mentioning that, for the particular case of absolute shrinkage, around 50% of medium and large cities shrunk for at least 20 consecutive years (Figure 2a). Even more of these cities (70% of medium cities and around 75% of large cities) have been declining for at least 20 years of the entire analyzed period (not necessary consecutive years—Figure 2b).
4.3. Severity
Figure 3a shows that, during 1992–2020, almost 70% of all cities have been affected by mild, moderate or severe shrinkage. The value is still high (52%) when statistics are computed for relative shrinkage (>50% according to Figure 3b). Results also show that severe shrinkage is most characteristic for small and medium cities, and least characteristic for largest cities. However, these data only offer an overview of the shrinkage phenomenon for the entire period between 1992 and 2020. Hence, it would be interesting to find out at what moment Romanian cities registered the most severe urban shrinkage, and which the current trends are.
4.4. Temporal Patterns and Trajectories of Urban Shrinkage
Figure 4 clearly shows that the number of growing cities has continuously fallen during the last three decades (Figure 4a). It decreased from almost 140 cities, that were growing in absolute terms during 1992–1997, to only 60 growing cities during 2016–2020. In the meantime, the number of severely shrinking cities has been steadily growing (Figure 4e), from 30 cities during 1992–1997 to almost 160 cities in 2016–2020. Again, these figures have been computed based on register data (the census data not being available on a year-by-year basis). Hence, Figure 4 likely underestimates the prevalence of shrinking cities. Furthermore, the underestimation is very likely to have increased over time (as Appendix A suggests).
Another way of looking at urban shrinkage over time is by identifying the most prevalent trajectories of urban decline. A typology of urban shrinkage trajectories thus obtained is indispensable for properly understanding patterns of urban shrinkage. Table 4 gives an overall image on the matter. It shows that, among all possible types of shrinkage trajectories, the continuous or almost continuous one is the most prevalent (34.4% of all cases). Furthermore, Appendix F delivers a detailed image of such trajectories, showing not only high incidences of declining trajectories, but also the fact that the turn-about from declining to growth is rare and rather tenuous.
4.5. Spatial Patterns of Urban Shrinkage
Moran’s statistics (Table 5) show that cities form regional clusters which are statistically significant for all periods (p < 10−6), except for the period 2002–2006. Furthermore, results are consistent whether one looks at spatial clusters from a severity or persistence standpoint. Shrinking cities are thus not randomly distributed across territory.
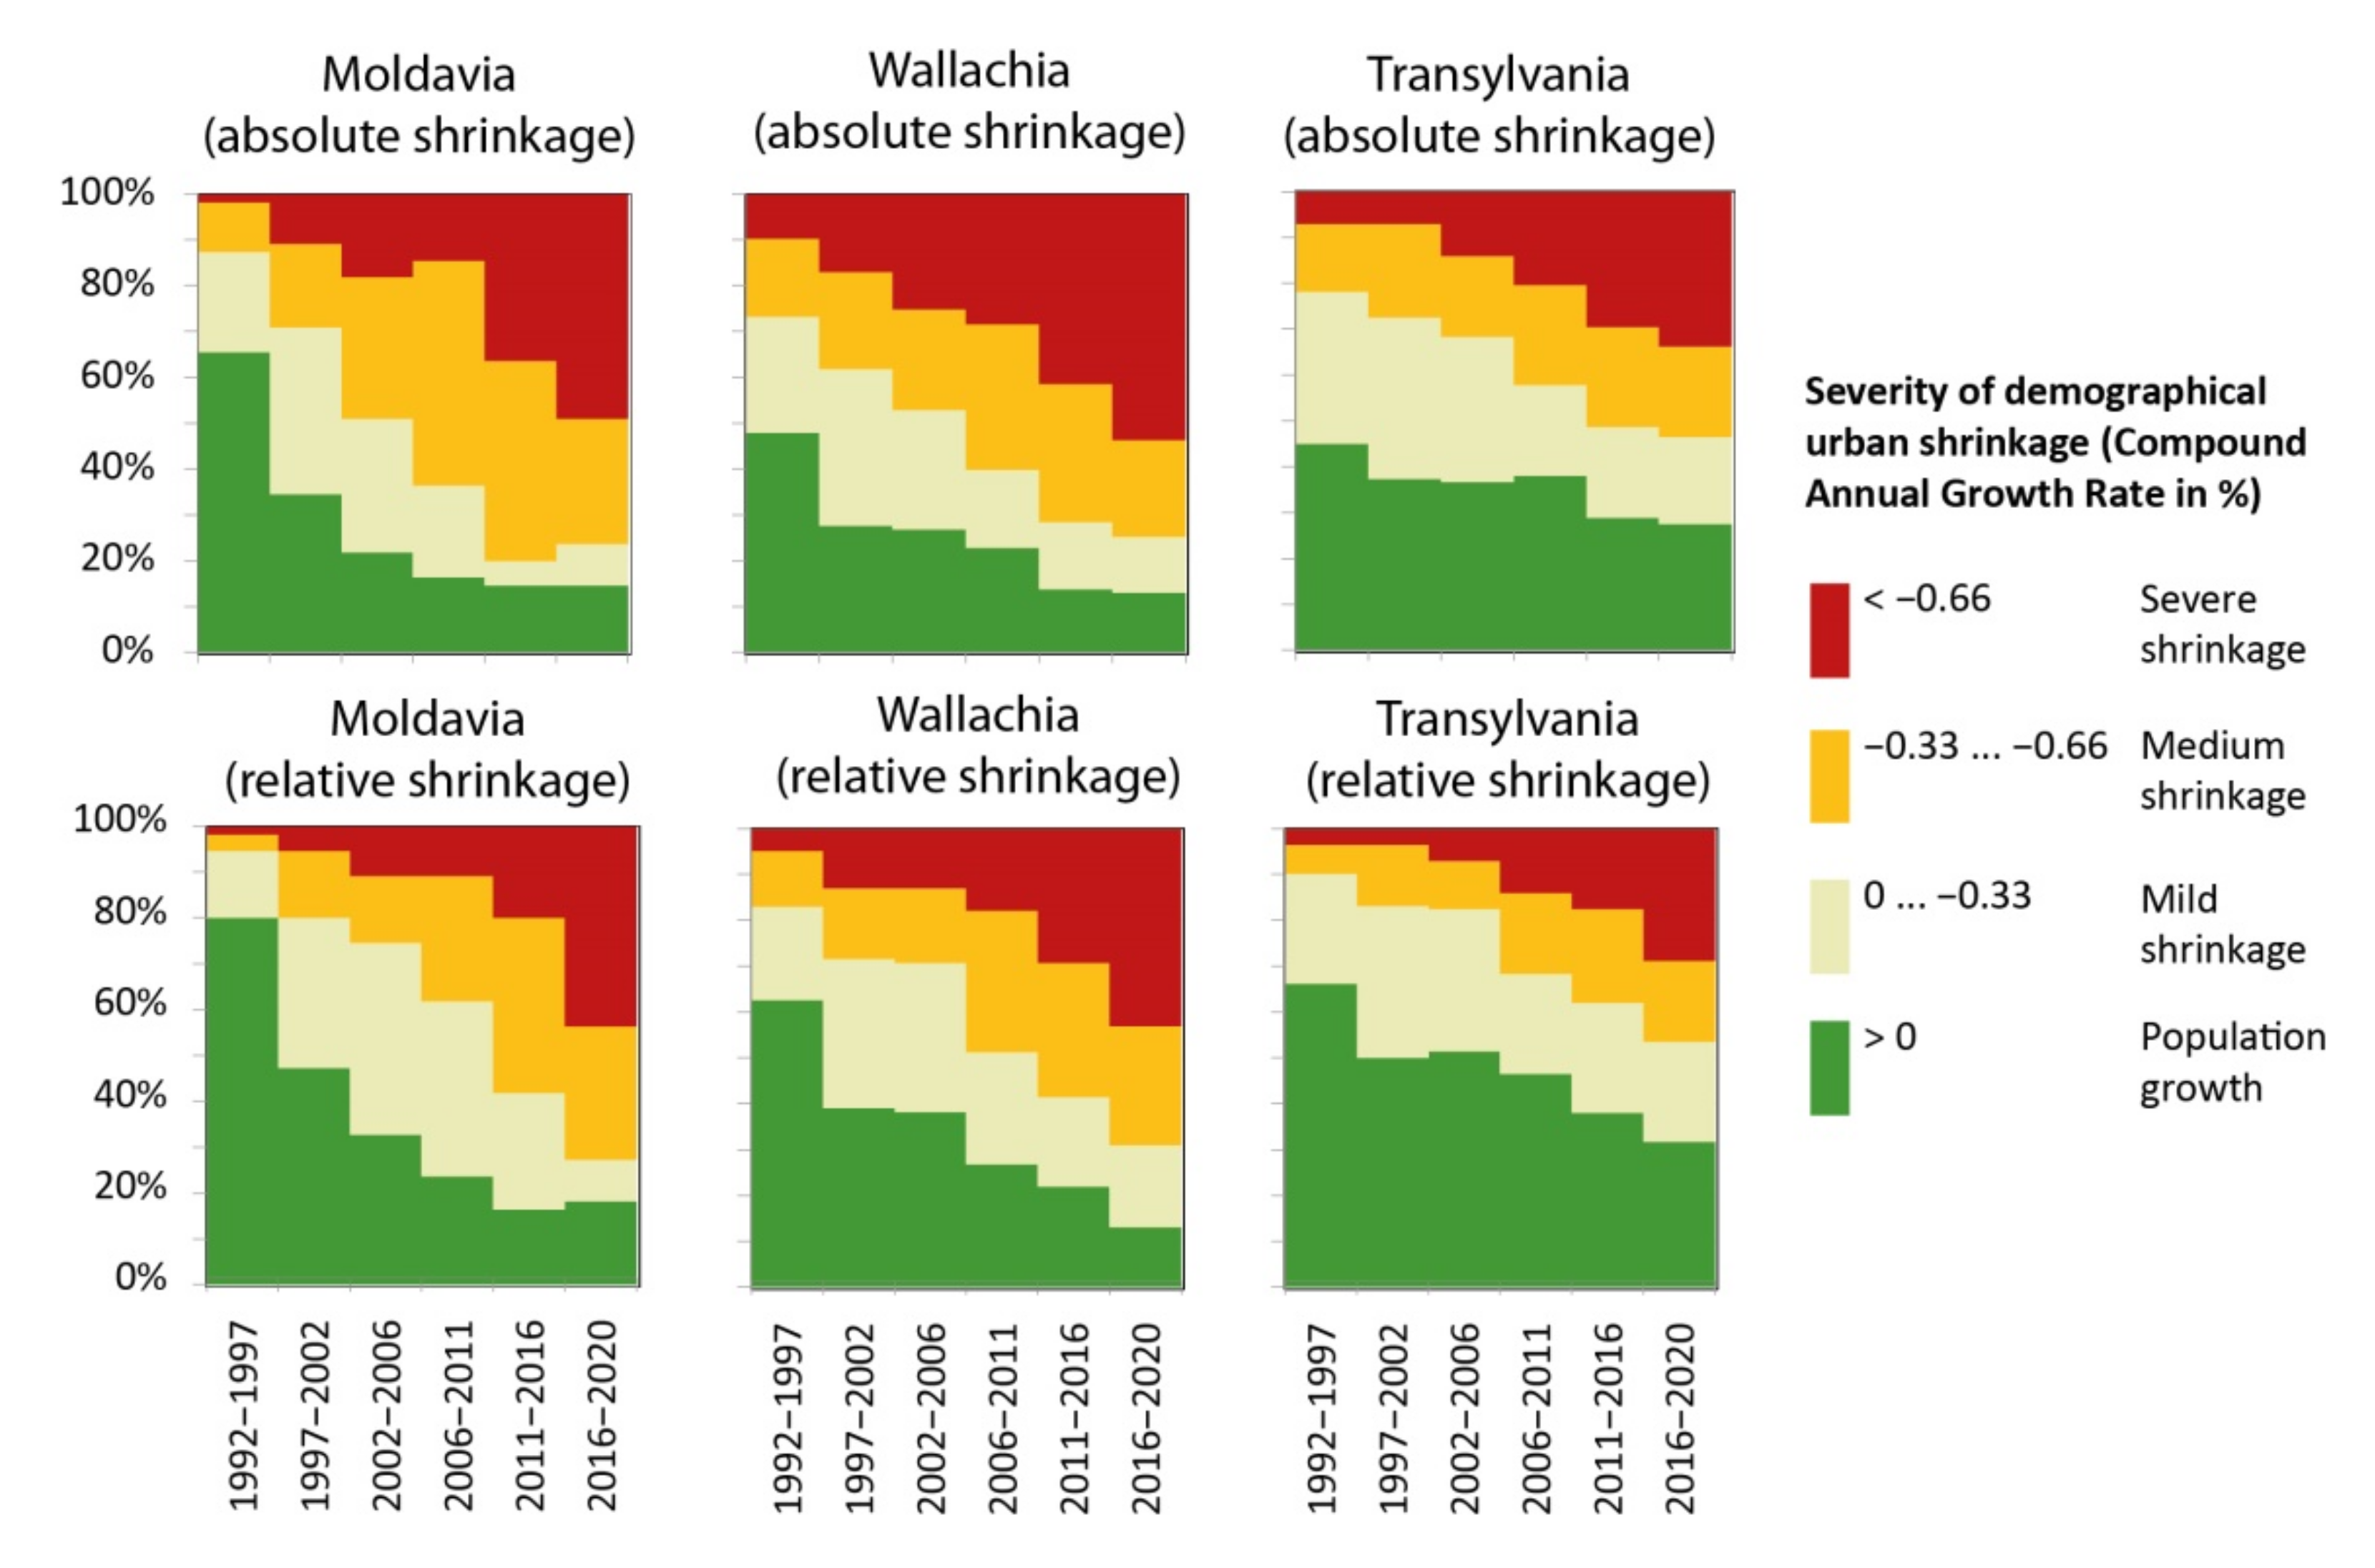
Results delivered by Moran’s statistics are in line with descriptive statistics of urban shrinkage prevalence by historical region. Figure 5 shows that cities from Transylvania are, overall, doing better than cities from other historical regions. However, all three historical regions display trends of a dramatic increase in severe shrinkage prevalence.
4.6. Demographical Shrinkage vs. Economic Decline
Chi-Square tests show that severity of demographic shrinkage is significantly associated with the percentage change in the number of firms (legal entities) (Chi-Square = 42.799, df = 3, p < 10−3), suggesting that demographic shrinkage is associated with economic shrinkage. However, although the association is significant, it is rather weak (Φ = 0.366, p < 10−3). Table 6 shows that numerous cities (n = 95, or 74.8% of the total number of cities reporting severe shrinkage) report severe demographical shrinkage despite a growing number of firms. Conversely, some cities are demographically growing whilst reporting a declining number of firms (n = 2, or 6.7% of those that are demographically growing). However, the number of firms is a very weak proxy for economic performance. Hence, we further tested for associations between severity of shrinkage and cities’ overall turnover (Table 7). This time results show that cities’ overall turnover is not significantly associated with demographical decline (Chi-Square = 5.512, df = 3, p = 0.138). Around 94.5% of economically declining cities are also demographically declining, but 89.8% of economically growing cities are demographically declining (Table 7).
4.7. Demographical Shrinkage vs. Cities’ Own-Source Revenues
Romania has witnessed significant economic development between 2009 and 2018. Against this background, it is not surprising that 316 out of 320 analysed cities have seen an absolute increase in own-source revenues. Consequently, one cannot speak of shrinkage in local revenues of Romanian cities. Hence, in order to conduct cross-tabulations, we have classified Romanian cities in two broad categories based on the percentage change in local own-source revenues between 2009 and 2018: those that have seen a slight increase in their revenues (<50%, i.e., 56.6% of all cities), and those that report a significant increase (>50%, i.e., 43.4% of all cities) (Table 8). Cross-tabulations and Chi-square test (Table 8) show that local revenues are significantly associated with the severity of demographic shrinkage (Chi-Square = 30.63, df = 3, p < 10−3), though the size effect is rather low (Φ = 0.399, p < 10−3). However, severe shrinkage coexisting with increases in local revenues higher than 50% are very frequent (52.1% of all cases of severe shrinkage).
5. Discussion
The literature review on East-Central European urban shrinkage has shown that the golden age of urban growth is over and the demographical projections of most of the EU countries show that the decline in urban population is going to be the norm in the future. Papers that have been reviewed are overwhelmingly empirical, with most of them confirming the predictions made by Jiří Musil at the beginning of 1990 [80]. However, the overwhelming number of empirical studies on Eastern EU countries calls for advancing the theoretical debate on urban shrinkage. This could be done by updating old attempts, like the model of urban shrinkage advanced by Jürgen Friedrichs [81], or by better linking findings from urban shrinkage literature with findings from urban growth literature (not always connected in existing studies). Another way of further investigating the subject could be by multiplying studies confronting empirical findings with existing theories of urban growth, as some previous studies have already done [16,27].
The first part of the empirical results of our research confirms the dramatic prevalence of shrinkage phenomenon among Romanian cities. The increasing severity and prevalence of urban shrinking over the last three decades clearly suggests that the Romanian urban shrinkage has not been a temporary phenomenon caused by deindustrialization, nor one that affects only cities that are suffering from suburbanization. Furthermore, results suggest that Romanian urban shrinkage is significantly more severe and prevalent than similar processes in Slovakia [56] or Poland [50], being comparable to those in Lithuania [11] or other Baltic states.
Another significant empirical finding of the current study—rather overlooked by previous studies—is the dramatic increase in severe urban shrinkage prevalence over the last three decades. This trend pinpointed by results reported in this paper suggests that urban demographical decline was not a temporary problem caused only by deindustrialization, back-to-village migration and post-socialist transition that acted mainly during the 1990s and early 2000s, and by the second demographic transition (leading to very low birth rates across the entire period). Most probably, some other factors are currently fuelling the process with continuously increasing force. Increasing suburbanization following the year 2000 is one major factor suggested by previous studies [82,83]. However, suburbanization mostly affects cities above 50,000 inhabitants [75], which constitute only a fraction of Romanian cities (Appendix E). Hence, suburbanization alone cannot explain the high prevalence of urban shrinkage nor the dramatic increase in severe urban shrinkage prevalence across the whole spectrum of Romanian cities. Peripheralization processes (including inter-urban migration and emigration) might be another factor at play, as suggested by researchers [84]. Overall, although causes of urban shrinkage are generally considered to be known, results reported in the current paper, concerning the dramatic increase in severe urban shrinkage prevalence, call for a thorough assessment of the current mix of determinants of urban shrinkage, as well as the changes in the mix of determinants from one period to another.
The spatial pattern of urban shrinkage reported in this paper raises further questions. On the one hand, the spatially clustered pattern calls for a further inquiry into the geographical location of clusters and the explanation behind them. On the other hand, the fact that cities from Transylvania are, overall, performing slightly better than cities from other historical regions suggests that the superior economic performances of western regions (as shown by [85,86,87,88,89,90]) might be linked to a slightly better demographical resilience. Inspired by these results, and acknowledging that one cannot determine a statistical relationship with a satisfying significance level by inferring from a comparison of only three historical regions, our discussion will further elaborate on the implication of the statistical (lack of) association between economic and demographic decline at the city level.
Inconclusive results concerning the relationship between economic and demographical decline at the city level—as have been reported in this paper—have considerable theoretical implications. They provide rather weak evidence in support of theories stating that economic and demographic growth/decline is reinforcing each other. Although results vary slightly, with some economic proxies being more linked to demographical trajectories than others, the Romanian cities show that urban population loss can coexist with economic absolute and relative economic performance. These findings support an important stream of research that emerged during the last five years, with theoretical papers calling for testing this hypothesis [32], as well as findings that confirm the existence of such a weak association in very diverse places, as are the cases of United States [9,22] and Poland [37]. However, one should interpret the results with caution, as they only express the statistical association between population change and economic growth for only one decade (2008–2018), which furthermore has been marked by a global economic crisis and which may not be relevant at historical scale.
The results presented in this paper also have practical implications. First, they indicate that urban shrinkage is not a temporary phenomenon for most of the cities, thus calling for urban policy measures adapted to a decreasing urban population in the near future. Declining cities should rather plan for reduced coverage of some public services, while increasing their quality, as well as the overall quality of life of their decreasing number of citizens. Secondly, the results showing the existence of a significant number of cities that have declined both economically and demographically during the last decade are alarming, especially when these cities are geographically clustered. Keeping social and territorial cohesion will ultimately depend on helping lagging cities keep the pace with current economic trends and opportunities and thus limiting their demographical shrinkage.
The approach leading to the results discussed above is not without limitations. One main limitation is that the analysis only looked at the core cities, thus ignoring and highly significant processes of suburbanization. Indeed, following the fall of communism, Romanian cities have been significantly affected by ‘rapid and chaotic suburbanization’. The first stage of suburbanization, until 2000, implied marginal residential suburbanization, while after 2000, there was a rapid residential and commercial suburbanization, mainly implying the development of new suburban areas around large cities in wealthy areas, mainly in Bucharest and cities from Transylvania [68,72]. Hence, there is no doubt that suburbanization has affected major cities, but its impact is very limited (if it exists at all) for the case of small cities that constitute the vast majority of the urban cities that we have studied in the current paper (63% are small cities under 20,000 inhabitants, and 85% of all Romanian cities are smaller than 50,000 inhabitants). Consequently, we would argue that, at least in the case of the current paper, suburbanization may not be the major determinant of the high prevalence of urban shrinkage. On the other hand, approaching the issue of causes of urban shrinkage would require not only a thorough analysis of suburbanization, but also of other major processes that trigger urban decline (inter-urban migration, emigration, peripheralization, declining birth rates, deindustrialization), and this goes beyond the three objectives stated in the introduction of the current paper. However, core cities still deserve to be studied in their own right due to their fiscal and political stakes.
Another limitation comes from the fact that the current study (most notably, computations of persistence of urban shrinkage and the exploration of the relationship between demographic and economic trajectories) has been conducted by employing register data. Employing register data is posing some limitations on the reliability of the results, as recent trends in residential patterns in big cities from East-Central Europe (including Romania) are not accurately captured by official statistics [61,78]. This means that in the case of large cities, in-migration could be largely underestimated, but emigration is also underestimated.
On the other hand, in the case of unattractive cities, out-migration and emigration are in turn underestimated in official register data. Data reliability issues are further complicated by a particular Romanian phenomenon, consisting in formal granting of Romanian citizenship to citizens of the Republic of Moldova, who — to a large degree — use it as an instrument for emigrating to western countries of the EU. Hence, they are registered as having their permanent residence in Romania (mostly probably in cities), while, in reality, they have emigrated to western countries of the EU. However, this is the best available local level data. At the same time, in order to address this limitation, this study also tried to ameliorate the quality of the findings by alternatively employing census data to the extent to which it has been possible.
6. Conclusions
This paper contributed to the ongoing debates on urban shrinkage in three different manners. First, following a narrative literature review, it highlighted the particularities of East-Central European urban shrinkage. It showed that, beyond displaying the highest currently recorded prevalence and severity of urban shrinkage among world regions, East-Central European demographic shrinkage has the particularity to be rather a silent and unnoticed process eclipsed by economic growth. However, urban shrinkage in East-Central Europe shares some similar causes to other parts of the world, with the notable difference that their intensity was/is considerably higher compared to their western counterparts, and that it happened in a particular context marked by post-socialist transition, and neoliberal dominant policy, which may have exacerbated its severity. But at the same time, urban shrinkage in the East-Central Europe manifested in a context marked by a different housing market (with a shortage on the offer side) that prevented some of the negative consequences that have been seen in most affected western cities.
Secondly, and against this background, the paper scrutinized urban shrinkage patterns in Romania by employing a conceptual lexicon borrowed from Robert Beauregard and by using alternative measures of urban shrinkage and multiple datasets. Romanian urban demographical shrinkage is much more prevalent than one may expect, even for an East-Central European country, and long-term shrinkage (persistence equal or higher than 15 years) constitutes the most prevalent form of urban shrinkage, affecting between 1/3 and 2/3 of all Romanian cities (depending on the measurement method). Interestingly, the share of cities undergoing severe shrinkage has constantly increased throughout the last three decades, a trend that has also been reported—with rather slight differences ‒ for every historical region of Romania. Overall, the paper adds to the literature detailed empirical evidence on the dramatic persistence and prevalence of urban shrinkage in one of the most affected post-socialist countries, while also highlighting the current exacerbation of urban shrinkage, a problem that was initially perceived as a temporary phenomenon.
Thirdly, the paper tackled the salient issue of the relationship between population loss and economic growth of shrinking cities. It adds some empirical insights to the literature from the Romanian case, suggesting that the relationship exists, but it is rather weak. The coexistence of demographic shrinkage with economic growth, as well as their still unclear relationship, calls for in-depth investigation. The acquisition of knowledge concerning the interdependencies between demographic change and economic growth of cities is of considerable importance for designing better strategies.
Further studies could also expand the analysis by assessing urban shrinkage beyond population trajectories in core cities, i.e., by assessing demographic trends at the level of metropolitan/functional urban areas. Furthermore, future studies could focus on the relationship between demographic and economic growth/decline. This could help researchers and policymakers gain a more accurate and complete image of multiple and multidimensional forms of urban growth and decline.
Author Contributions
Conceptualization, M.E.; methodology, M.E.; validation, M.E.; formal analysis, M.E., A.C.; investigation, M.E., A.C., A.L.; data curation, M.E., A.L.; writing—original draft preparation, M.E., A.C.; writing—review and editing, M.E., A.C.; visualization, M.E.; supervision, M.E.; funding acquisition, M.E., A.C. All authors have read and agreed to the published version of the manuscript.
Funding
This research was funded by the Department of Geography (Alexandru Ioan Cuza University of Iasi). First author’s work was supported by a grant of Ministry of Research and Innovation, CNCS-UEFISCDI, project number PN-III-P4-ID-PCCF-2016-0166, within PNCDI III project ReGrowEU - Advancing ground-breaking research in regional growth and development theories, through a resilience approach: towards a convergent, balanced and sustainable European Union.
Data Availability Statement
Data is available upon request.
Acknowledgments
We would like to thank the two anonymous reviewers for their constructive comments that helped us improve the quality of the manuscript, most notably the quality of writing, by highlighting missing information/explanations that we further added/adjusted.
Conflicts of Interest
The authors declare no conflict of interest.
Appendix A

Table A1.
Overall differences between population by permanent residence (register data) and population by usual residence (census data).
Table A1.
Overall differences between population by permanent residence (register data) and population by usual residence (census data).
| Population of All 320 Cities 1 | |||
|---|---|---|---|
| 1992 | 2002 | 2011 | |
| Population by permanent residence (register data) | 12,992,864 | 12,967,664 | 12,726,168 |
| Population by usual residence (census data) | 12,901,293 | 11,904,031 | 10,879,723 |
| Absolute difference between population at census and population by permanent residence (register data) | −91,571 | −1,063,633 | −1,846,445 |
| Relative difference between population at census and population by permanent residence (%) | −0.71 | −8.94 | −16.97 |
| Number of cities1 with population by permanent residence (register data) > population by usual residence (census data) | 192 | 284 | 300 |
| Number of cities1 with population by usual residence (census data) > population by permanent residence (register data) | 128 | 36 | 20 |
1 The 320 cities represent all Romanian cities (LAU2) that existed at least for some years during 1992–2020. Localities that were granted urban status during the analysed period have been integrated into our analysis for the entire period of 1992–2020. In other words, our analysis considered that Romania had 320 cities both in 1992, and in 2020, though the number of cities fluctuated over time (see also Appendix C). Growing differences between population at census and population by permanent residence suggest that the assessment of urban shrinkage by using register data under-estimates urban shrinkage for most of the cities (284 out of 320 cities in 2002, 300 out of 320 cities in 2011).
Appendix B
Table A2.
Top ten cities with largest relative differences between population by usual residence (census data) and population by permanent residence (register data) as of 2011.
Table A2.
Top ten cities with largest relative differences between population by usual residence (census data) and population by permanent residence (register data) as of 2011.
| City | Absolute Difference (No. of Inhabitants) | Relative Difference (% of City Size) 1 | ||||
|---|---|---|---|---|---|---|
| 1992 | 2002 | 2011 | 1992 | 2002 | 2011 | |
| Buhuși | −720 | −3679 | −7049 | −3.33 | −19.63 | −48.41 |
| Roman | 1160 | −11,727 | −22,855 | 1.44 | −16.93 | −45.07 |
| Agnita | −697 | −2007 | −3755 | −5.66 | −18.42 | −43.09 |
| Negrești-Oaș | −644 | −3076 | −5071 | −3.87 | −22.18 | −42.73 |
| Măcin | −545 | −1370 | −3341 | −4.50 | −12.89 | −40.52 |
| Onești | 738 | −8270 | −15,708 | 1.25 | −16.08 | −40.10 |
| Piatra Neamț | −624 | −20,324 | −33,614 | −0.51 | −19.37 | −39.52 |
| Balan | −199 | −1664 | −2393 | −1.82 | −21.06 | −39.13 |
| Bicaz | −882 | −1060 | −2535 | −10.28 | −12.58 | −38.74 |
| Bacău | 5182 | −29,758 | −51,941 | 2.53 | −16.96 | −35.99 |
1 How to read data: A value of −48.41% indicates that the population, as it has been counted at the 2011 census, is 48.41% smaller compared to population by permanent residence as it is recorded in register datasets.
Appendix C
Figure A1.
Evolution of the number of cities in Romania. In Romania, a locality gains status of city by law, following a political decision and according to a set of criteria related to urban infrastructure and amenities, but not to urban population. Thus, rural communes can have more than 10,000 inhabitants, while cities may count less than 2000 inhabitants. Rural communes that were granted urban status between 2002 and 2006 have also been integrated into our analysis for the entire period of 1992–2020. In other words, our analysis considered that Romania had 320 cities both in 1992 and in 2020. Light gray = number of cities; Dark gray = number of cities with a spacial status called “municipiu”.

Appendix D
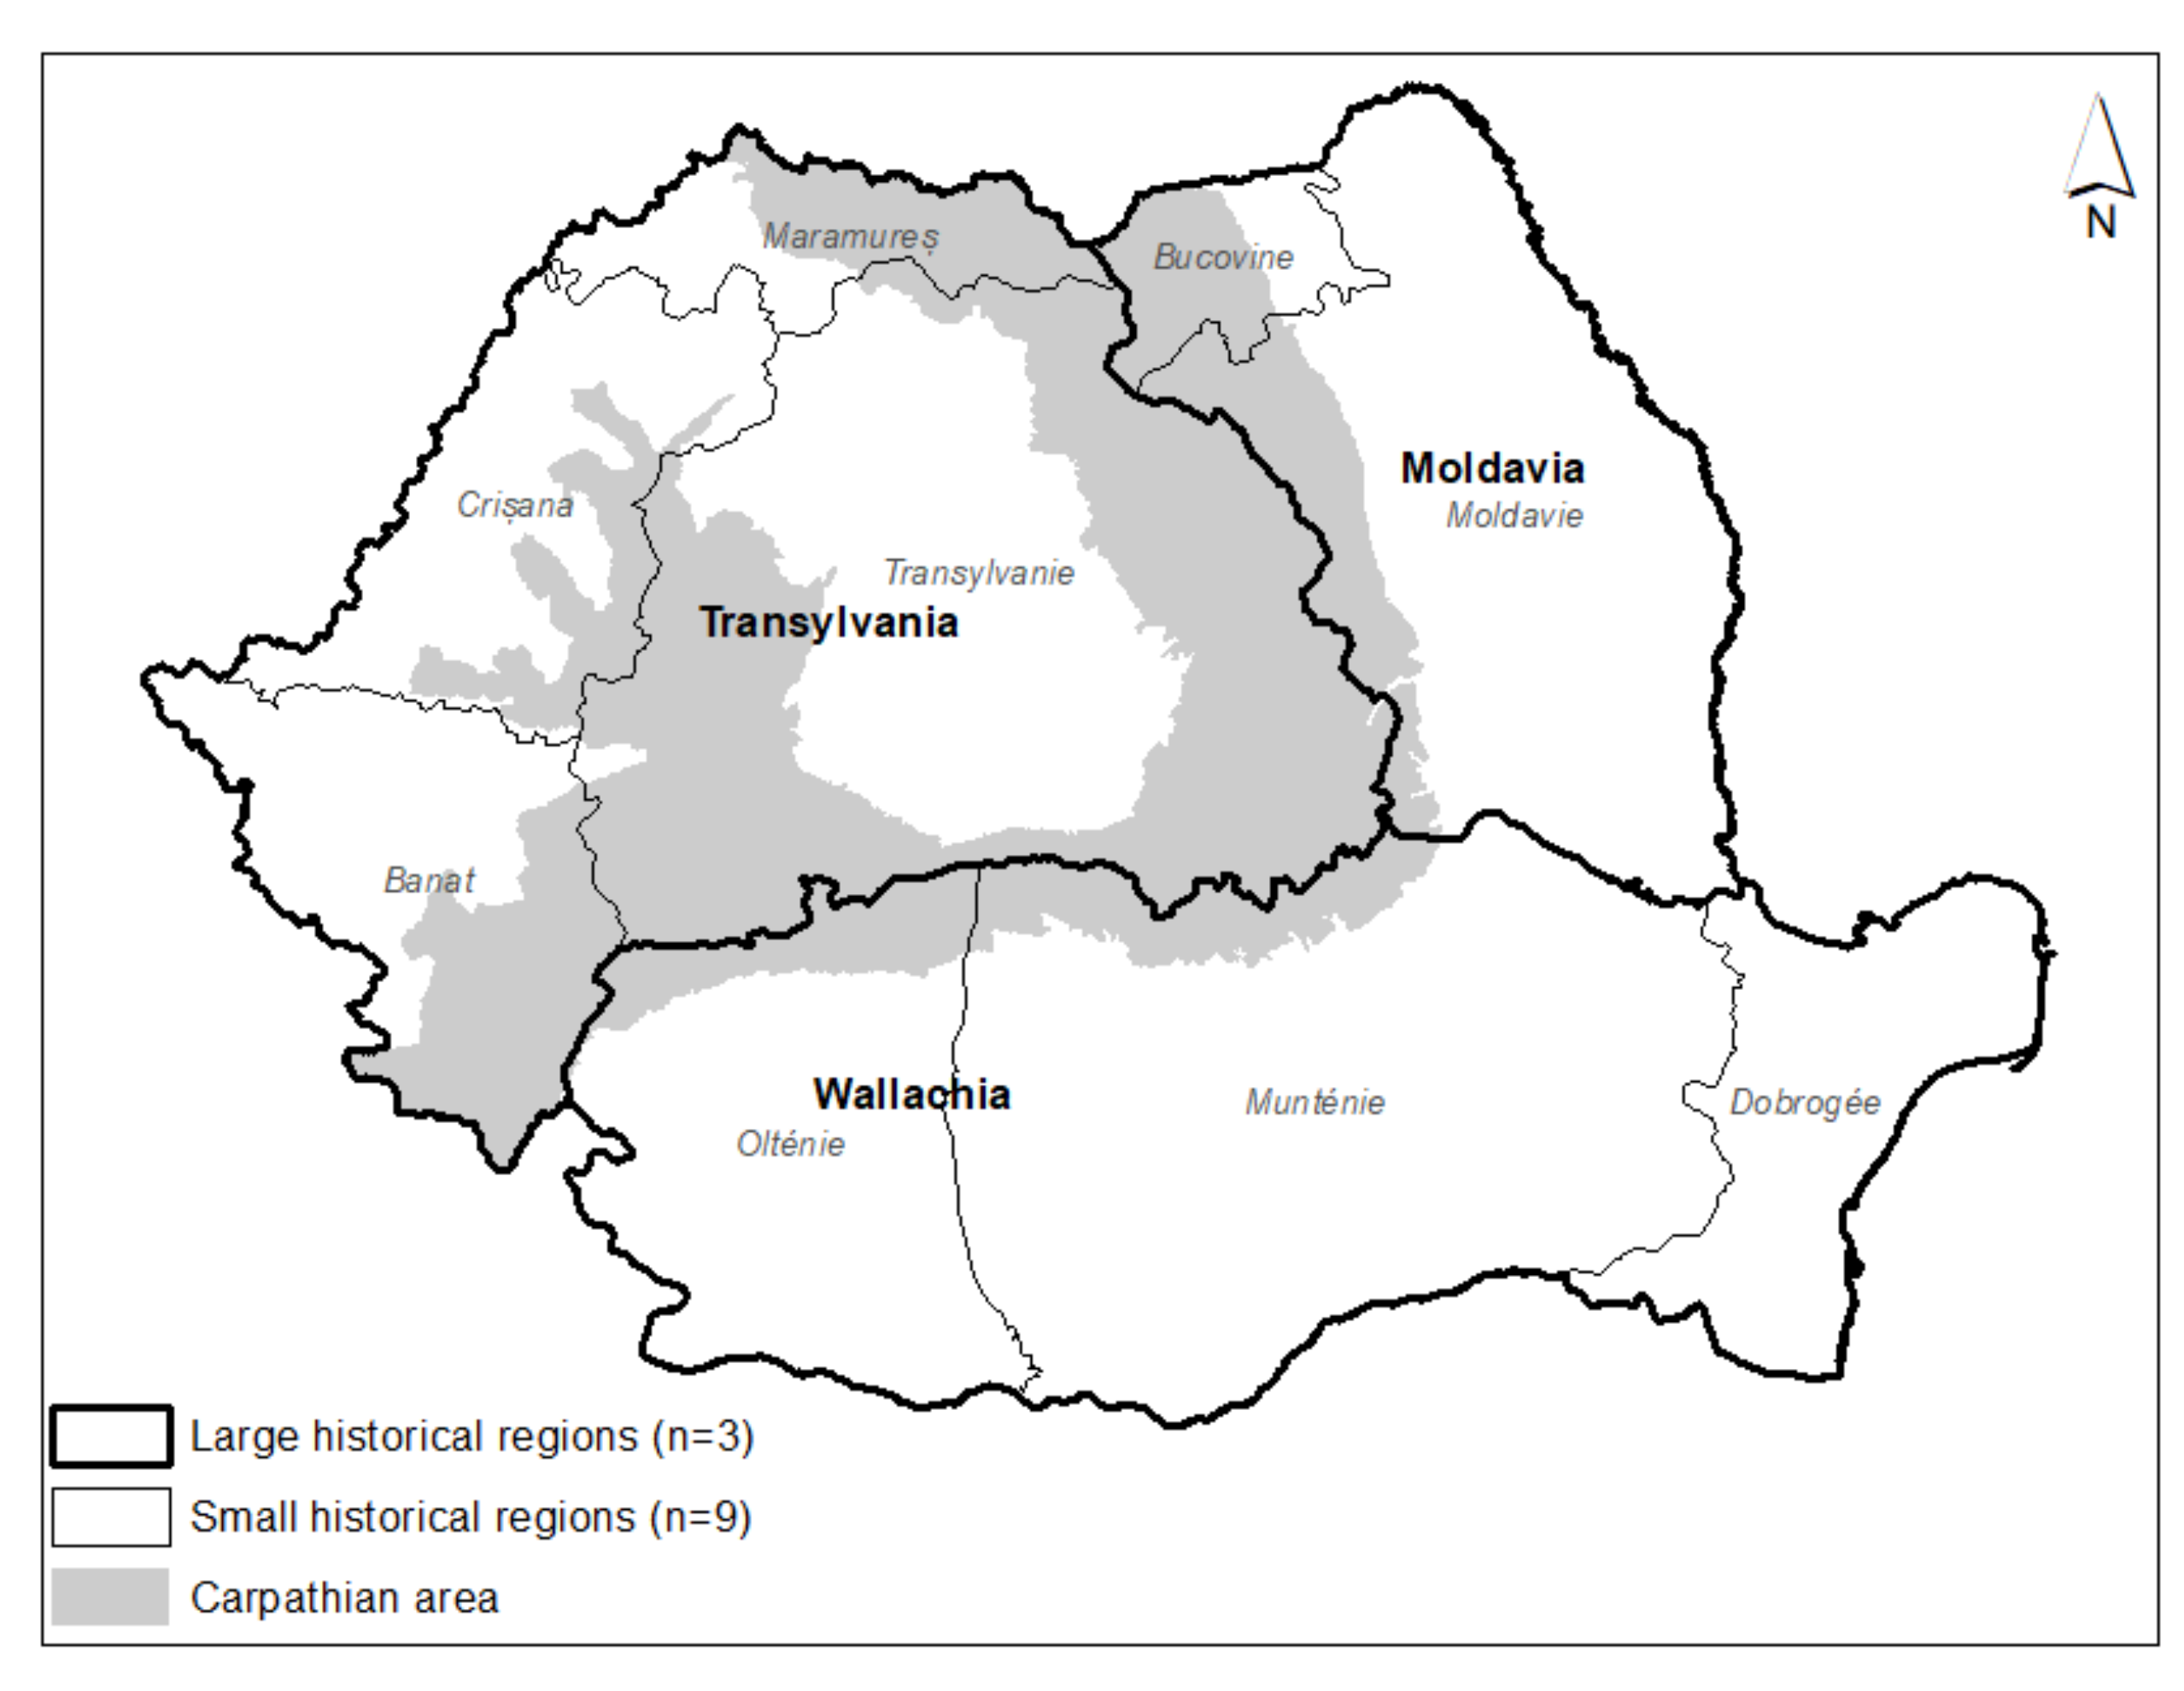
Figure A2.
Historical regions of Romania. Source: Authors.

Appendix E
Table A3.
Thresholds used for classifying cities into categories by size.
| Population Thresholds (Inhabitants at Zenith) | No of Cities | Share in the Total No of Cities (%) | |
|---|---|---|---|
| Small cities | ≤19,999 | 203 | 63 |
| Medium cities | 20,000–49,999 | 69 | 22 |
| Large cities | 50,000–199,999 | 36 | 11 |
| Largest cities | ≥200,000 | 12 | 4 |
| TOTAL | 320 | 100 |
Appendix F
Figure A3.
Typology of urban shrinkage trajectories among all Romanian cities. Source: Authors. T = trajectory type, n = number of cities falling into that particular trajectory type.
Figure A3.
Typology of urban shrinkage trajectories among all Romanian cities. Source: Authors. T = trajectory type, n = number of cities falling into that particular trajectory type.

References
- United Nations World Urbanization Prospects. The 2018 Revision; United Nations: New York, NY, USA, 2019; p. 126. [Google Scholar]
- Rodríguez-Pose, A.; Crescenzi, R. Mountains in a flat world: Why proximity still matters for the location of economic activity. Camb. J. Reg. Econ. Soc. 2008, 1, 371–388. [Google Scholar] [CrossRef]
- Glaeser, E. Triumph of the City; Pan Books: London, UK, 2012. [Google Scholar]
- Glaeser, E.; Kourtit, K.; Nijkamp, P. Urban Empires: Cities as Global Rulers in the New Urban World; Routledge: New York, NY, USA, 2020; ISBN 978-0-429-89236-3. [Google Scholar]
- Cristea, M.; Mare, C.; Moldovan, C.; China, A.; Farole, T.; Vințan, A.; Park, J.; Garrett, P.; Ionescu-heroiu, M. Orașe Magnet-Migrație Și Navetism În România; World bank: Bucharest, Romania, 2017; p. 494. [Google Scholar]
- Balland, P.-A.; Jara-Figueroa, C.; Petralia, S.G.; Steijn, M.P.A.; Rigby, D.L.; Hidalgo, C.A. Complex Economic Activities Concentrate in Large Cities. Nat. Hum. Behav. 2020, 4, 248–254. [Google Scholar] [CrossRef] [PubMed] [Green Version]
- Hartt, M. Quietly Shrinking Cities: Canadian Urban Population Loss in an Age of Growth; UBC Press: Vancouver, BC, Canada, 2021; ISBN 978-0-7748-6619-4. [Google Scholar]
- Cunningham-Sabot, E.; Fol, S. Shrinking Cities in France and Great Britain : A Silent Process? In The Future of Shrinking Cities: Problems, Patterns and Strategies of Urban Transformation in a Global Context; Institute of urban and Regional Development University of California: Berkeley, CA, USA, 2009; pp. 24–35. [Google Scholar]
- Hartt, M. The Prevalence of Prosperous Shrinking Cities. Ann. Am. Assoc. Geogr. 2019, 109, 1651–1670. [Google Scholar] [CrossRef]
- Guérois, M.; Bretagnolle, A.; Pavard, A.; Gourdon, P.; Zdanowska, N. Following the Population of European Urban Areas in the Last Half Century (1961-2011): The TRADEVE Database. Cybergeo Eur. J. Geogr. 2019. document 891. [Google Scholar] [CrossRef]
- Wolff, M.; Wiechmann, T. Urban Growth and Decline: Europe’s Shrinking Cities in a Comparative Perspective 1990–2010. Eur. Urban Reg. Stud. 2018, 25, 122–139. [Google Scholar] [CrossRef]
- He, S.Y. When growth grinds to a halt: Population and economic development of resource-depleted cities in China. In Shrinking Cities: A Global Perspective; Richardson, H.W., Nam, C.W., Eds.; Routledge & CRC Press: New York, NY, USA, 2014; pp. 152–168. [Google Scholar]
- Jiang, Z.; Zhai, W.; Meng, X.; Long, Y. Identifying Shrinking Cities with NPP-VIIRS Nightlight Data in China. J. Urban Plan. Dev. 2020, 146, 04020034. [Google Scholar] [CrossRef]
- Ganapati, S. The paradox of shrinking cities in India. In Shrinking Cities: A Global Perspective; Richardson, H.W., Nam, C.W., Eds.; Routledge & CRC Press: New York, NY, USA, 2014; pp. 169–181. [Google Scholar]
- Großmann, K.; Bontje, M.; Haase, A.; Mykhnenko, V. Shrinking Cities: Notes for the Further Research Agenda. Cities 2013, 35, 221–225. [Google Scholar] [CrossRef]
- Mykhnenko, V.; Turok, I. East European Cities—Patterns of Growth and Decline, 1960–2005. Int. Plan. Stud. 2008, 13, 311–342. [Google Scholar] [CrossRef]
- Olsen, A.K. Shrinking Cities: Fuzzy Concept or Useful Framework? Berkeley Plan. J. 2013, 26, 107–132. [Google Scholar] [CrossRef] [Green Version]
- Long, Y.; Gao, S. (Eds.) Shrinking Cities in China: The Other Facet of Urbanization. In The Urban Book Series; Springer: Singapore, 2019; ISBN 9789811326455. [Google Scholar]
- Rieniets, T. Shrinking Cities: Causes and Effects of Urban Population Losses in the Twentieth Century. Nat. Cult. 2009, 4, 231–254. [Google Scholar] [CrossRef]
- Turok, I.; Mykhnenko, V. The Trajectories of European Cities, 1960–2005. Cities 2007, 24, 165–182. [Google Scholar] [CrossRef]
- Gourdon, P.; Bretagnolle, A.; Guérois, M.; Pavard, A. Des petites villes davantage touchées par la décroissance ? Comparaison des trajectoires démographiques à l’échelle européenne (1961–2011). Belg. Rev. Belge Géographie 2019. [Google Scholar] [CrossRef] [Green Version]
- Hartt, M. The Diversity of North American Shrinking Cities. Urban Stud. 2018, 55, 2946–2959. [Google Scholar] [CrossRef]
- Beauregard, R.A. Urban Population Loss in Historical Perspective: United States, 1820–2000. Environ. Plan. Econ. Space 2009, 41, 514–528. [Google Scholar] [CrossRef]
- Weaver, R.; Bagchi-Sen, S.; Knight, J.; Frazier, A.E. Shrinking Cities: Understanding Urban Decline in the United States, 1st ed.; Routledge: London, UK; New York, NY, USA, 2016; ISBN 978-1-138-79686-7. [Google Scholar]
- Wolff, M.; Fol, S.; Roth, H.; Cunningham-Sabot, E. Shrinking Cities: Measuring the Phenomenon in France. Cybergeo Eur. J. Geogr. 2017. [Google Scholar] [CrossRef]
- Pike, A.; MacKinnon, D.; Coombes, M.; Champion, T.; Bradley, D.; Cumber, A.; Robson, L.; Wymer, C. Uneven Growth: Tackling City Decline; Joseph Rowntree Foundation: York, UK, 2016; p. 72. [Google Scholar]
- Alves, D.; Barreira, A.P.; Guimarães, M.H.; Panagopoulos, T. Historical Trajectories of Currently Shrinking Portuguese Cities: A Typology of Urban Shrinkage. Cities 2016, 52, 20–29. [Google Scholar] [CrossRef] [Green Version]
- Bănică, A.; Istrate, M.; Muntele, I. Challenges for the Resilience Capacity of Romanian Shrinking Cities. Sustainability 2017, 9, 2289. [Google Scholar] [CrossRef] [Green Version]
- Pirisi, G.; Trócsányi, A. Shrinking Small Towns in Hungary: The Factors behind the Urban Decline in ‘Small Scale’. Acta Geogr. Univ. Comen. 2014, 58, 131–147. [Google Scholar]
- Pirisi, G.; Trócsányi, A.; Makkai, B. Shrinking Small Towns in Hungary: The Factors behind the Urban Decline in ‘Small Scale’.....Pirisi, Gábor, and András Trócsányi. Ann. Univ. Paedagog. Cracoviensis 2015, 8, 12–28. [Google Scholar]
- Beauregard, R.A. Shrinking Cities in the United States in Historical Perspective: A Research Note. In The Future of Shrinking Cities: Problems, Patterns and Strategies of Urban Transformation in a Global Context; Institut of urban and Regional DevelopmentUniversity of California: Berkeley, CA, USA, 2009; pp. 61–68. [Google Scholar]
- Bernt, M. The Limits of Shrinkage: Conceptual Pitfalls and Alternatives in the Discussion of Urban Population Loss. Int. J. Urban Reg. Res. 2016, 40, 441–450. [Google Scholar] [CrossRef]
- Mallach, A. What We Talk about When We Talk about Shrinking Cities: The Ambiguity of Discourse and Policy Response in the United States. Cities 2017, 69, 109–115. [Google Scholar] [CrossRef]
- Hollander, J.B. Can a City Successfully Shrink? Evidence from Survey Data on Neighborhood Quality. Urban Aff. Rev. 2011, 47, 129–141. [Google Scholar] [CrossRef]
- Hirt, S. Whatever Happened to the (Post)Socialist City? Cities 2013, 32, S29–S38. [Google Scholar] [CrossRef]
- Haase, A.; Rink, D.; Grossmann, K. Shrinking Cities in Post-Socialist Europe: What Can We Learn from Their Analysis for Theory Building Today? Geogr. Ann. Ser. B Hum. Geogr. 2016, 98, 305–319. [Google Scholar] [CrossRef]
- Wichowska, A. Economic Aspects of Shrinking Cities in Poland in the Context of Regional Sustainable Development. Sustainability 2021, 13, 3104. [Google Scholar] [CrossRef]
- Stanilov, K. The Post-Socialist City: Urban Form and Space Transformations in Central and Eastern Europe after Socialism; Springer Science & Business Media: Berlin/Heidelberg, Germany, 2007; ISBN 978-1-4020-6053-3. [Google Scholar]
- Sýkora, L.; Bouzarovski, S. Multiple Transformations: Conceptualising the Post-Communist Urban Transition. Urban Stud. 2012, 49, 43–60. [Google Scholar] [CrossRef] [Green Version]
- Hirt, S.; Sellar, C.; Young, C. Neoliberal Doctrine Meets the Eastern Bloc: Resistance, Appropriation and Purification in Post-Socialist Spaces. Eur. Asia Stud. 2013, 65, 1243–1254. [Google Scholar] [CrossRef]
- Tsenkova, S. Beyond transitions: Understanding urban change in post-socialist cities. In The Urban Mosaic of Post-Socialist Europe: Space, Institutions and Policy, Contributions to Economics; Tsenkova, S., Nedović-Budić, Z., Eds.; Physica-Verlag HD: Heidelberg, Germany, 2006; pp. 21–50. ISBN 978-3-7908-1727-0. [Google Scholar]
- Bourdin, S. Pour une approche géographique de la convergence. LEspace Geogr. 2013, 42, 270–285. [Google Scholar] [CrossRef]
- Bourdin, S. La Différenciation Spatiale de l’intégration Régionale En Europe Centrale et Orientale. In Proceedings of the CIST2014—Fronts et frontières des sciences du territoire, Collège international des sciences du territoire (CIST), Paris, France, 17–18 March 2014; pp. 39–46. [Google Scholar]
- Ubarevičienė, R.; van Ham, M.; Burneika, D. Shrinking Regions in a Shrinking Country: The Geography of Population Decline in Lithuania 2001–2011. Urban Stud. Res. 2016, 2016, e5395379. [Google Scholar] [CrossRef]
- Popescu, C. Deindustrialization and Urban Shrinkage in Romania. What Lessons for the Spatial Policy? Transylv. Rev. Adm. Sci. 2014, 10, 181–202. [Google Scholar]
- Ivan, I.; Horák, J. Population Changes Caused by Industrialization and Deindustrialization—Comparison of Ostrava and Glasgow. Geogr. Časopis 2011, 63, 113–132. [Google Scholar]
- Haase, A.; Bernt, M.; Großmann, K.; Mykhnenko, V.; Rink, D. Varieties of Shrinkage in European Cities. Eur. Urban Reg. Stud. 2016, 23, 86–102. [Google Scholar] [CrossRef]
- Jaroszewska, E.; Stryjakiewicz, T. Drivers, Scale, and Geography of Urban Shrinkage in Poland and Policy Responses. J. Urban Plan. Dev. 2020, 146, 05020021. [Google Scholar] [CrossRef]
- Stryjakiewicz, T. The Process of Urban Shrinkage and Its Consequences. Rom. J. Reg. Sci. 2013, 7, 29–40. [Google Scholar]
- Zborowski, A.; Soja, M.; Łobodzińska, A. Population Trends in Polish Cities—Stagnation, Depopulation or Shrinkage? Pr. Geogr. 2012, 130, 7–28. [Google Scholar]
- Bleha, B.; Buček, J. The Decade of Shrinkage in Bratislava at the Turn of Centuries: An Attempt for Explanation. Acta Geogr. Univ. Comen. 2015, 59, 161–172. [Google Scholar]
- Stryjakiewicz, T.; Ciesiółka, P.; Jaroszewska, J. Urban shrinkage and the post-socialist transformation: The case of Wałbrzych (Poland). In Demographic Change and Local Development Shrinkage, Regeneration and Social Dynamics; Martinez-Fernandez, C., Kubo, N., Noya, A., Weyman, T., Eds.; OECD: Paris, France, 2012; pp. 79–84. [Google Scholar]
- Slach, O.; Bosák, V.; Krtička, L.; Nováček, A.; Rumpel, P. Urban Shrinkage and Sustainability: Assessing the Nexus between Population Density, Urban Structures and Urban Sustainability. Sustainability 2019, 11, 4142. [Google Scholar] [CrossRef] [Green Version]
- Rumpel, P.; Slach, O. Shrinking cities in central Europe. In Transitions in Regional Science—Regions in Transition: Regional Research in Central Europe; Herrschel, T., Dostál, P., Raška, P., Koutský, J., Eds.; Wolters Kluwer: Riverwoods, IL, USA, 2014; pp. 142–155. [Google Scholar]
- Slach, O.; Nováček, A.; Bosák, V.; Krtička, L. Mega-Retail-Led Regeneration in the Shrinking City: Panacea or Placebo? Cities 2020, 104, 102799. [Google Scholar] [CrossRef]
- Buček, J.; Bleha, B. Urban Shrinkage as a Challenge to Local Development Planning in Slovakia. Morav. Geogr. Rep. 2013, 21, 2–15. [Google Scholar] [CrossRef] [Green Version]
- Musiał-Malago, M. The Process of Urban Shrinking in Poland. Stud. Miej. 2016, 24, 91–106. [Google Scholar]
- Constantinescu, I.P. Shrinking Cities in Romania: Former Mining Cities in Valea Jiului. Built Environ. 2012, 38, 214–228. [Google Scholar] [CrossRef]
- Kocur-Bera, K.; Szuniewicz, K. Socio-Spatial Aspects of Shrinking Municipalities: A Case Study of the Post-Communist Region of North-East Poland. Sustainability 2021, 13, 2929. [Google Scholar] [CrossRef]
- Popescu, C. ‘Back to the Village’: The Model of Urban Outmigration in Post-Communist Romania. Eur. Plan. Stud. 2020, 28, 1200–1218. [Google Scholar] [CrossRef]
- Steinführer, A.; Bierzynski, A.; Großmann, K.; Haase, A.; Kabisch, S.; Klusácek, P. Population Decline in Polish and Czech Cities during Post-Socialism? Looking Behind the Official Statistics. Urban Stud. 2010, 47, 2325–2346. [Google Scholar] [CrossRef] [PubMed]
- Cercleux, A.-L.; Merciu, F.-C.; Bogan, E.; Merciu, G.-L. Demographic Transformations after 1990 in Romanian Small and Medium-Sized Industrial Towns. Analale Univ. Bucuresti Ser. Geogr. 2019, 165–180. [Google Scholar] [CrossRef]
- Vollset, S.E.; Goren, E.; Yuan, C.-W.; Cao, J.; Smith, A.E.; Hsiao, T.; Bisignano, C.; Azhar, G.S.; Castro, E.; Chalek, J.; et al. Fertility, Mortality, Migration, and Population Scenarios for 195 Countries and Territories from 2017 to 2100: A Forecasting Analysis for the Global Burden of Disease Study. Lancet 2020, 396, 1285–1306. [Google Scholar] [CrossRef]
- Rink, D.; Couch, C.; Haase, A.; Krzysztofik, R.; Nadolu, B.; Rumpel, P. The Governance of Urban Shrinkage in Cities of Post-Socialist Europe: Policies, Strategies and Actors. Urban Res. Pract. 2014, 7, 258–277. [Google Scholar] [CrossRef]
- Lang, T. Shrinkage, Metropolization and Peripheralization in East Germany. Eur. Plan. Stud. 2012, 20, 1747–1754. [Google Scholar] [CrossRef]
- Haase, A.; Bontje, M.; Couch, C.; Marcinczak, S.; Rink, D.; Rumpel, P.; Wolff, M. Factors Driving the Regrowth of European Cities and the Role of Local and Contextual Impacts: A Contrasting Analysis of Regrowing and Shrinking Cities. Cities 2021, 108, 102942. [Google Scholar] [CrossRef]
- Batunova, E.; Gunko, M. Urban Shrinkage: An Unspoken Challenge of Spatial Planning in Russian Small and Medium-Sized Cities. Eur. Plan. Stud. 2018, 26, 1580–1597. [Google Scholar] [CrossRef]
- Stănuș, C.; Pop, D.; Dragoman, D.; Zimmermann, K.; Fedeli, V. Changing urban system, changing urban policy: Romania since 1989. In A Modern Guide to National Urban Policies in Europe; Edward Elgar Publishing: Cheltenham, UK, 2021; pp. 195–215. ISBN 978-1-83910-905-8. [Google Scholar]
- Rink, D. Urban Shrinkage as a Problem of Post-Socialist Transformation. The Case of Eastern Germany. Sociol. Rom. 2011, 9, 20–34. [Google Scholar]
- Michelsen, C.; Weiß, D. What Happened to the East German Housing Market? A Historical Perspective on the Role of Public Funding. Post-Communist Econ. 2010, 22, 387–409. [Google Scholar] [CrossRef]
- Sîrodoev, I.; Schvab, A.C.; Ianoș, I.-L.; Ion, F. Rural Towns in Romania: A Reality Asking for Specific Sustainable Development Policies. Carpathian J. Earth Environ. Sci. 2015, 10, 147–156. [Google Scholar]
- Dumitrache, L.; Zamfir, D.; Nae, M.; Simion, G.; Stoica, I.V. The Urban Nexus: Contradictions and Dilemmas of (Post)Communist (Sub)Urbanization in Romania. Hum. Geogr. 2016, 10, 39–58. [Google Scholar] [CrossRef] [Green Version]
- Hirschhausen, B.V. Les Nouvelles Campagnes Roumaines: Paradoxes d’un Retour Paysan; Belin: Paris, France, 1997; ISBN 978-2-7011-2283-0. [Google Scholar]
- Benedek, J. Amenajarea Teritoriului Și Dezvoltarea Regională; Presa Universitară Clujeană: Cluj-Napoca, Romania, 2004. [Google Scholar]
- Iatu, C.; Eva, M. Spatial Profile of the Evolution of Urban Sprawl Pressure on the Surroundings of Romanian Cities (2000-2013). Carpathian J. Earth Environ. Sci. 2016, 11, 79–88. [Google Scholar]
- Cunningham-Sabot, E.; Roth, E.; Fol, S.; Elissalde, B. Urban Shrinkage. In Hypergeo; Elissalde, B., Ed.; GDR Libergeo: Paris, France, 2014; Available online: www.hypergeo.eu (accessed on 1 July 2021).
- He, S.Y.; Lee, J.; Zhou, T.; Wu, D. Shrinking Cities and Resource-Based Economy: The Economic Restructuring in China’s Mining Cities. Cities 2017, 60, 75–83. [Google Scholar] [CrossRef]
- Tammaru, T.; Sjoberg, O. On the Move: Explaining Migration Patterns in Estonia during the Transition Period. Int. J. Popul. Geogr. IJPG 1999, 5, 241–260. [Google Scholar] [CrossRef]
- Hoekveld, J.J. Time-Space Relations and the Differences between Shrinking Regions. Built Environ. 2012, 38, 179–195. [Google Scholar] [CrossRef]
- Musil, J. Changing Urban Systems in Post-Communist Societies in Central Europe: Analysis and Prediction. Urban Stud. 1993, 30, 899–905. [Google Scholar] [CrossRef]
- Friedrichs, J. A Theory of Urban Decline: Economy, Demography and Political Elites. Urban Stud. 1993, 30, 907–917. [Google Scholar] [CrossRef]
- Grigorescu, I.; Mitrică, B.; Mocanu, I.; Ticană, N. Urban Sprawl and Residential Development in the Romanian Metropolitan Area. Rev. Roum. Géographie 2012, 56, 43–59. [Google Scholar]
- Grigorescu, I.; Mitricǎ, B.; Kucsicsa, G.; Popovici, E.-A.; Dumitraşcu, M.; Cuculici, R. Post-Communist Land Use Changes Related to Urban Sprawl in the Romanian Metropolitan Areas. Hum. Geogr. 2012, 6, 35–46. [Google Scholar] [CrossRef] [Green Version]
- Sorcaru, I.A. Urban Depopulation in Romania. Econ. Appl. Inform. 2020, 39–48. [Google Scholar] [CrossRef]
- Mitrică, B.; Grigorescu, I.; Săgeată, R.; Mocanu, I.; Dumitraşcu, M. Territorial development in Romania: Regional disparities. In Dilemmas of Regional and Local Development; Routledge: London, UK, 2020; ISBN 978-0-429-43386-3. [Google Scholar]
- Groza, O. Industrie, système économiques et territoies. In Les territoires centre-européens. Dilemmes et défis. L’Europe médiane en question; Rey, V., Ed.; La Découverte: Paris, France, 1998; pp. 184–213. [Google Scholar]
- Kurko, I. Regional Disparities in the Transition Period. Rom. Rev. Reg. Stud. 2009, 5, 23–30. [Google Scholar]
- Goschin, Z. Exploring Regional Economic Convergence in Romania. A Spatial Modeling Approach. East. J. Eur. Stud. 2017, 8, 127–146. [Google Scholar]
- Benedek, J. Spatial Differentiation and Core-Periphery Structures in Romania. East. J. Eur. Stud. 2015, 6, 49–61. [Google Scholar]
- Kurko, I.; Benedek, J. Spatial Patterns of Local Income Inequalities. J. Settl. Spat. Plan. 2018, 9, 77–91. [Google Scholar]
Figure 1.
Evolution of Romanian urban population between 1992 and 2020.

Figure 2.
Persistence of urban shrinkage between 1992 and 2020, by city size (see Appendix E for details regarding thresholds for classifying cities in four categories by size) and by four different assessment methods: (a) persistence of absolute shrinkage measured by taking into consideration only consecutive years of declining population; (b) persistence of absolute shrinkage measured by taking into consideration the number of years of declining population; (c) persistence of relative shrinkage measured by taking into consideration only consecutive years of declining population; (d) persistence of relative shrinkage measured by taking into consideration the number of years of declining population.

Figure 3.
The severity of urban shrinkage between 1992 and 2020 by size of the city: (a) absolute shrinkage; (b) relative shrinkage.
Figure 3.
The severity of urban shrinkage between 1992 and 2020 by size of the city: (a) absolute shrinkage; (b) relative shrinkage.

Figure 4.
Evolution of the number of cities by the severity of urban shrinkage (continuous line shows absolute growth/shrinkage; dashed line displays relative growth/shrinkage); (a) number of growing cities (CAGR > 0.15% p.a.); (b) number of stagnating cities (CAGR between −0.15 and 0.15% p.a.); (c) number of mildly shrinking cities (CAGR between −0.3 and −0.15% p.a.); (d) number of moderately shrinking cities (CAGR between −0.60 and −0.30% p.a.); (e) number of severely shrinking cities (CAGR < −0.60% p.a.).

Figure 5.
Prevalence and severity of urban shrinkage by large historical regions (map of Romanian historical regions shown in Appendix D). Source: Authors.
Figure 5.
Prevalence and severity of urban shrinkage by large historical regions (map of Romanian historical regions shown in Appendix D). Source: Authors.

Table 1.
Data availability and reliability.
| Demographical Data | Definition | Data Availability | Data Reliability * | |
|---|---|---|---|---|
| Temporal | Geographical Level 1 | |||
| Population by permanent residence | The total number of people with Romanian citizenship that declare their permanent residence on the territory of Romania (as it appears on each person’s identity card and as it is registered by the administrative bodies of the state). ** | Available on a year-by-year basis 1992–2020 | City level (LAU2) | Lowest |
| Population by usual residence | The total number of people, regardless of their nationality, who have their usual residence in Romania. The usual residence may differ from the permanent residence (that appears on the identity card) and it is necessary for a person to have continuously lived for at least 12 months in a particular area for it to be considered their usual residence. The value is generally estimated by the National Institute of Statistics based on the Population Census. *** | Available on year-by-year basis 2003–2020 | County level | Moderate |
| Census population (usual resident population) | The total number of people, regardless of their nationality, who have their usual residence in Romania. The usual residence may differ from the permanent residence (that appears on the identity card) and it is necessary for a person to have continuously lived for at least 12 months in a particular area for it to be considered their usual residence. Unlike the population by usual residence, the census data is collected on the field and hence it has the highest reliability. | 1992, 2002, 2011 | City level (LAU2) | Highest |
1 Lowest administrative level available; * Reliability refers in this case to the extent to which the statistical data corresponds to the reality that is to be found in the territory for a particular period of time; ** As defined by the National Institute of Statistics, Tempo-Online database, in the metadata section for Table POP107A; *** As defined by the National Institute of Statistics, Tempo-Online database, in the metadata section for Table POP105A.
Table 2.
Parameters of the analysis grid of urban shrinkage.
| Definition | Methods/Indexes Employed | Type of Shrinkage Assessed | ||
|---|---|---|---|---|
| Absolute 1 | Relative 2 | |||
| Prevalence | Commonness of the process among the entire spectrum of cities | Index of prevalence * | Y | Y |
| Persistence | Duration in time | No of years of declining population | Y | Y |
| Severity | Absolute (or relative) loss of population | % change in population | Y | Y |
| Speed | Population change per unit of time | Compound annual growth rate | Y | Y |
| Temporal patterns | Typology of demographic trajectories | Hierarchical Cluster Analysis | Y | N |
| Spatial patterns | Spatial and regional concentration of urban shrinkage incidence | Global spatial autocorrelation | Y | - |
| Prevalence & severity by regions | Y | Y | ||
Source: Authors. * The concepts of prevalence (including the index), persistence, severity have been taken from Beauregard (2009); 1 Absolute shrinkage refers to the situation when a city is losing population; 2 Relative shrinkage refers to the situation when a city is losing population at speeds higher than the national average (or it is growing at speeds lower than the national average) [here national population includes both rural and urban population].
Table 3.
Number of shrinking cities and prevalence (% of shrinking cities from the total number of cities) computed based on various criteria and datasets.
Table 3.
Number of shrinking cities and prevalence (% of shrinking cities from the total number of cities) computed based on various criteria and datasets.
| Category of Criteria | Criteria 1 | Criteria 2 | 1992–2011 [Census Data] | 1992–2011 [Register Data] 2 | 1992–2020 [Register Data] 2 |
|---|---|---|---|---|---|
| Persistence of shrinkage | ≥2 consecutive years ≥2 consecutive years | Absolute3 Relative4 | - - | 294 (92%) 276 (86%) | 304 (95%) 293 (92%) |
| ≥5 consecutive years | Absolute | - | 230 (72%) | 267 (83%) | |
| ≥5 consecutive years | Relative | - | 189 (59%) | 239 (75%) | |
| ≥10 consecutive years | Absolute | - | 144 (45%) | 204 (64%) | |
| ≥10 consecutive years | Relative | - | 90 (28%) | 168 (53%) | |
| Severity/Speed of shrinkage | CAGR 1 < 0% p.a. | Absolute | 291 (91%) | 217 (68%) | 239 (75%) |
| CAGR 1 < 0% p.a. | Relative | 164 (51%) | 165 (52%) | 197 (62%) | |
| CAGR 1 < −0.15% p.a. | Absolute | 280 (88%) | 169 (53%) | 200 (63%) | |
| CAGR 1 < −0.15% p.a. | Relative | 129 (40%) | 110 (34%) | 161 (50%) | |
| CAGR 1 < −0.30% p.a. | Absolute | 266 (83%) | 113 (35%) | 161 (50%) | |
| CAGR 1 < −0.30% p.a. | Relative | 95 (30%) | 73 (23%) | 102 (32%) |
Notes: 1 CAGR = cumulative annual growth rate of population. Values in brackets represent the prevalence (share of shrinking cities among the 320 cities included in the analysis); 2 Population by permanent residence.
Table 4.
Frequency of population trajectory types among the 320 Romanian cities.
| Type of Trajectory | Share among Cities |
|---|---|
| Continuous or almost continuous shrinkage | 34.4% |
| Episodic shrinkage | 22.5% |
| (Short) growth followed by continuous shrinkage | 20.9% |
| Continuous or almost continuous growth | 8.8% |
| Other/various trajectories | 13.4% |
| Total | 100% |
Source: Authors. Note: computations are based on population by permanent residence (register data), which might increasingly and significantly underestimate population loss for more recent periods (see also Appendix A).
Table 5.
Global spatial autocorrelation (Moran’s statistics).
| Severity | Duration | |||||
|---|---|---|---|---|---|---|
| I | z-Score | p-Value | I | z-Score | p-Value | |
| 1992–1997 | 0.149 | 6.709 | 0.000 | 0.176 | 7.824 | 0.000 |
| 1997–2002 | 0.181 | 8.102 | 0.000 | 0.118 | 5.261 | 0.000 |
| 2002–2006 | 0.027 | 1.409 | 0.159 | 0.147 | 6.562 | 0.000 |
| 2006–2011 | 0.228 | 10.773 | 0.000 | 0.197 | 8.711 | 0.000 |
| 2011–2016 | 0.292 | 13.791 | 0.000 | 0.202 | 8.936 | 0.000 |
| 2016–2020 | 0.249 | 11.407 | 0.000 | 0.229 | 10.154 | 0.000 |
| 1992–2020 | 0.240 | 10.878 | 0.000 | 0.212 | 9.369 | 0.000 |
Source: Authors. Parameters: inverse distance, 68 km threshold, Euclidian distance.
Table 6.
Cross-tabulation between demographic trajectory and percentage change in the number of firms (2008–2018).
Table 6.
Cross-tabulation between demographic trajectory and percentage change in the number of firms (2008–2018).
| Demographic Trajectory | Economic Trajectory (Percentage Change in the Number of Firms) | Total | |
|---|---|---|---|
| Declining | Growing | ||
| Growth | 2 | 28 | 30 |
| Mild Shrinkage | 8 | 17 | 25 |
| Moderate Shrinkage | 9 | 34 | 43 |
| Severe Shrinkage | 127 | 95 | 222 |
| Total | 146 | 174 | 320 |
Notes: Chi-Square = 42.799 (0 cells have expected count less than 5), df = 3, p < 10−3, Φ = 0.366, p < 10−3.
Table 7.
Cross-tabulation between demographic trajectory and percentage change in city’s overall turnover (2008–2018).
Table 7.
Cross-tabulation between demographic trajectory and percentage change in city’s overall turnover (2008–2018).
| Demographic Trajectory | Economic Trajectory (Percentage Change in City’s Overall Turnover) | Total | |
|---|---|---|---|
| Declining | Growing | ||
| Growth | 3 | 27 | 30 |
| Mild shrinkage | 1 | 24 | 25 |
| Moderate shrinkage | 10 | 33 | 43 |
| Severe shrinkage | 41 | 181 | 222 |
| Total | 55 | 265 | 320 |
Notes: Chi-Square = 5.512 (1 cell has expected count less than 5), df = 3, p = 0.138, Φ = 0.131, p = 0.138.
Table 8.
Cross-tabulation between demographic trajectory and percentage change in local revenues (2009–2018).
Table 8.
Cross-tabulation between demographic trajectory and percentage change in local revenues (2009–2018).
| Demographic Trajectory | Percentage Change in Local Revenues | Total | |
|---|---|---|---|
| <50% Increase | >50% Increase | ||
| Growth | 12 | 18 | 30 |
| Mild shrinkage | 13 | 12 | 25 |
| Moderate shrinkage | 10 | 33 | 43 |
| Severe shrinkage | 146 | 76 | 222 |
| Total | 181 | 139 | 320 |
Notes: Chi-Square = 30.630 (0 cells have expected count less than 5), df = 3, p < 10−3, Φ = 0.399, p < 10−3.
Publisher’s Note: MDPI stays neutral with regard to jurisdictional claims in published maps and institutional affiliations. |
© 2021 by the authors. Licensee MDPI, Basel, Switzerland. This article is an open access article distributed under the terms and conditions of the Creative Commons Attribution (CC BY) license (https://creativecommons.org/licenses/by/4.0/).
Share and Cite
MDPI and ACS Style
Eva, M.; Cehan, A.; Lazăr, A. Patterns of Urban Shrinkage: A Systematic Analysis of Romanian Cities (1992–2020). Sustainability 2021, 13, 7514. https://0-doi-org.brum.beds.ac.uk/10.3390/su13137514
AMA Style
Eva M, Cehan A, Lazăr A. Patterns of Urban Shrinkage: A Systematic Analysis of Romanian Cities (1992–2020). Sustainability. 2021; 13(13):7514. https://0-doi-org.brum.beds.ac.uk/10.3390/su13137514
Chicago/Turabian StyleEva, Mihail, Alexandra Cehan, and Alexandra Lazăr. 2021. "Patterns of Urban Shrinkage: A Systematic Analysis of Romanian Cities (1992–2020)" Sustainability 13, no. 13: 7514. https://0-doi-org.brum.beds.ac.uk/10.3390/su13137514
Note that from the first issue of 2016, this journal uses article numbers instead of page numbers. See further details here.