
Smart Evaluation of Green Campus Sustainability Considering Energy Utilization


1
Educational Technology and Information Center, HeiLongJiang BaYi Agricultural University, Daqing 163000, China
2
School of Economics and Management, Hubei University of Science and Technology, Xianning 437100, China
3
Department of Information Management, Oriental Institute of Technology, New Taipei 224, Taiwan
4
School of Management, Hebei GEO University, Shijiazhuang 050031, China
5
Strategy and Management Base of Mineral Resources in Hebei Province, Hebei GEO University, Shijiazhuang 050031, China
*
Author to whom correspondence should be addressed.
Sustainability 2021, 13(14), 7653; https://0-doi-org.brum.beds.ac.uk/10.3390/su13147653
Submission received: 11 May 2021
/
Revised: 30 June 2021
/
Accepted: 3 July 2021
/
Published: 8 July 2021
(This article belongs to the Special Issue Advanced Intelligent Technologies in Sustainable Energy Forecasting and Economical Applications)
Abstract
:With the change in energy utilization, a fast and accurate evaluation method is of great importance to promote green campus sustainability. In order to improve the feasibility and timeliness of evaluation, an intelligent evaluation model based on dynamic Bayesian inference and adaptive network fuzzy inference system (DBN-ANFIS) is proposed. Firstly, from the perspective of sustainability and considering the changes in energy utilization, a green campus evaluation index system is constructed from four levels: campus resource utilization, campus environment creation, campus usage management, and campus eco-efficiency. On this basis, the parameters of the adaptive network fuzzy inference system (ANFIS) are optimized based on dynamic Bayesian inference (DBN), so as to apply the modified model to the green campus evaluation work of the Spark big data operation platform. Finally, the scientificity of the model proposed in this paper is verified through example analysis, which is conducive to the real-time and effective evaluation of green campus sustainability and provides scientific and rational decision support to improve its management.
1. Introduction
The field of sustainability research continues to expand, from the natural environment to the economic, social, and educational fields [1]. The sustainability of campuses, as an important part of society, is particularly important. However, most schools currently face problems such as high resource consumption, high energy consumption levels, and significant negative impacts on the environment [2]. In China, for example, the average water consumption per student and the average energy consumption are much higher than the per capita level in China, and nearly 15% of the total urban domestic water consumption is consumed in primary and secondary schools, while the total energy consumption of campuses accounts for about 5% of the total national building energy consumption, and the proportion is gradually increasing [3]. The green campus, as a necessary way to solve this problem, has become an important issue in the field of sustainable development [4]. There are still controversies about what issues should be addressed for a campus to be considered as a sustainable green campus, and the definition of the sustainable status of a green campus and the evaluation criteria for campus sustainability are particularly important [5]. The current green campus evaluation system still suffers from unclear evaluation indexes and lack of authoritative criteria, mostly favors qualitative evaluation, and lacks quantitative evaluation. This paper takes the green campus of primary and secondary schools as the research object and constructs an intelligent evaluation model with the problems they have in sustainable development as the starting point. Thus, quantitative analysis and evaluation are completed.
The sustainability of campus as a social subsystem and its sustainability evaluation are crucial to advance the sustainability of the whole society [6]. For example, leadership in energy and environmental design (LEED), developed by the United States Green Building Council (USGBC), is an evaluation standard based on LEED for New Construction, which adds classroom instruction, master planning, mold growth prevention, and environmental assessment of campus sites and is developed specifically for schools [7]. The evaluation criteria include sustainable site planning, water efficiency, natural environment and energy, materials and resources, indoor environmental quality, design innovation and area preference, integrated design, selection, and transportation. The evaluation is based on the premise of the whole life cycle of the building, with the goal of improving the whole process from the overall planning and design of the building and environment, construction, and operation management [8]. The German Good Company launched the Sustainable Pathways Toolkit, which provides a comprehensive evaluation of multiple dimensions such as energy, water, resource recycling, waste, electronics, paper, landscape maintenance, human retrofitting, environmental safety, and indoor air quality, with the disadvantage that it lacks a scoring system, makes intercampus comparisons difficult, and the evaluation indicators are comprehensive but cumbersome to classify [9]. The evaluation tool, the Sustainability Evaluation Questionnaire, introduced by the University Leaders for a Sustainable Future (ULSF), specifically covers environmental education curriculum, academic research results, operation and management, school staff training, social services, student participation, environmental advocacy, responsibility, and planning for sustainable development, but the evaluation results can only reflect the relative sustainability of the school, not the real campus level of green campus construction [10]. The Green Campus Evaluation Criteria promulgated by the China Green Building Council in 2013 includes three types of evaluation indicators: control items, general items, and excellent items, which evaluate green campuses in seven aspects: land saving, energy, water resources, material resources, management implementation, education, and publicity. However, there are problems such as more indicators and difficulty in implementing the evaluation [11]. Through the above comparison, it can be found that the current green campus evaluation methods are biased toward qualitative evaluation and descriptive evaluation, make interschool comparisons difficult, and are limited in applicability and coverage. Therefore, this paper intends to draw on the existing evaluation system, construct a green campus evaluation index system under the perspective of sustainable development, and conduct evaluation research using quantitative methods.
In addition, in the current research work on sustainability evaluation, the evaluation methods used are mainly hierarchical analysis [12], fuzzy comprehensive evaluation [13], gray evaluation method [14], ideal solution method [15], etc. These methods are mostly influenced by subjective factors and cannot fully guarantee the objectivity of the green campus sustainability assessment process and results [16]. The objective evaluation methods also only consider the degree of variation of indicators in the overall index and the degree of influence on other indicators and fail to assign different weights to different assessment objects [17]. Therefore, this paper introduces the self-learning comprehensive evaluation method, which is the application of self-learning techniques in evaluation. Its advantages are that it does not require human intervention, can completely exclude human factors, and has a strong learning ability to meet the self-adaptability of the evaluated object, thus improving the relevance of the evaluation [18]. ANFIS based on DBN not only has the adaptive and learning ability of neural networks, but also makes the nodes and weights of neural networks have a clear physical meaning [19]. DBN bases statistical inference on the posterior distribution, and using dynamic Bayesian inference for ANFIS can focus on the probability distribution of the entire parameter space, adaptively adjust the size of the regularization parameters during network training, and make the regularization parameters optimal [20]. It also theoretically increases the robustness and generalization ability of ANFIS networks, making the model more accurate [21].
Based on the above, this paper attempts to construct a complete scientific evaluation index system from the perspective of sustainable development and adopts the ANFIS improved by DBN to evaluate the green campus. The remaining parts of the article are arranged as follows: Section 2 designs the green campus evaluation index system from the perspective of sustainable development, which contains four dimensions: campus resource utilization, campus environment creation, campus usage management, and campus eco-efficiency. Section 3 develops an intelligent evaluation method based on ANFIS, and the parameters of the ANFIS model are optimized based on DBN, so as to establish an intelligent evaluation model based on DBN-ANFIS and apply it to the evaluation of green campus with the Spark big data running platform. Section 4 selects the calculation examples to verify the accuracy and validity of the proposed model. Section 5 summarizes the research results of the paper.
2. Evaluation Index System Construction
The green campus evaluation index system from the perspective of sustainable development is based on the existing green campus evaluation index system and establishes a relatively perfect evaluation mechanism for the subsequent sustainable development of green campuses from different starting points. The green campus evaluation index system in this paper is based on the theory of sustainable development, combined with the contents of other relevant advanced evaluation systems [22,23,24], and at the same time, the problems in the current situation of sustainable development of green campus are considered, and the four criteria level evaluation indexes about green campus evaluation from the perspective of sustainable development are summarized and organized. The current paper will introduce the evaluation indexes of each tier in a more detailed way.
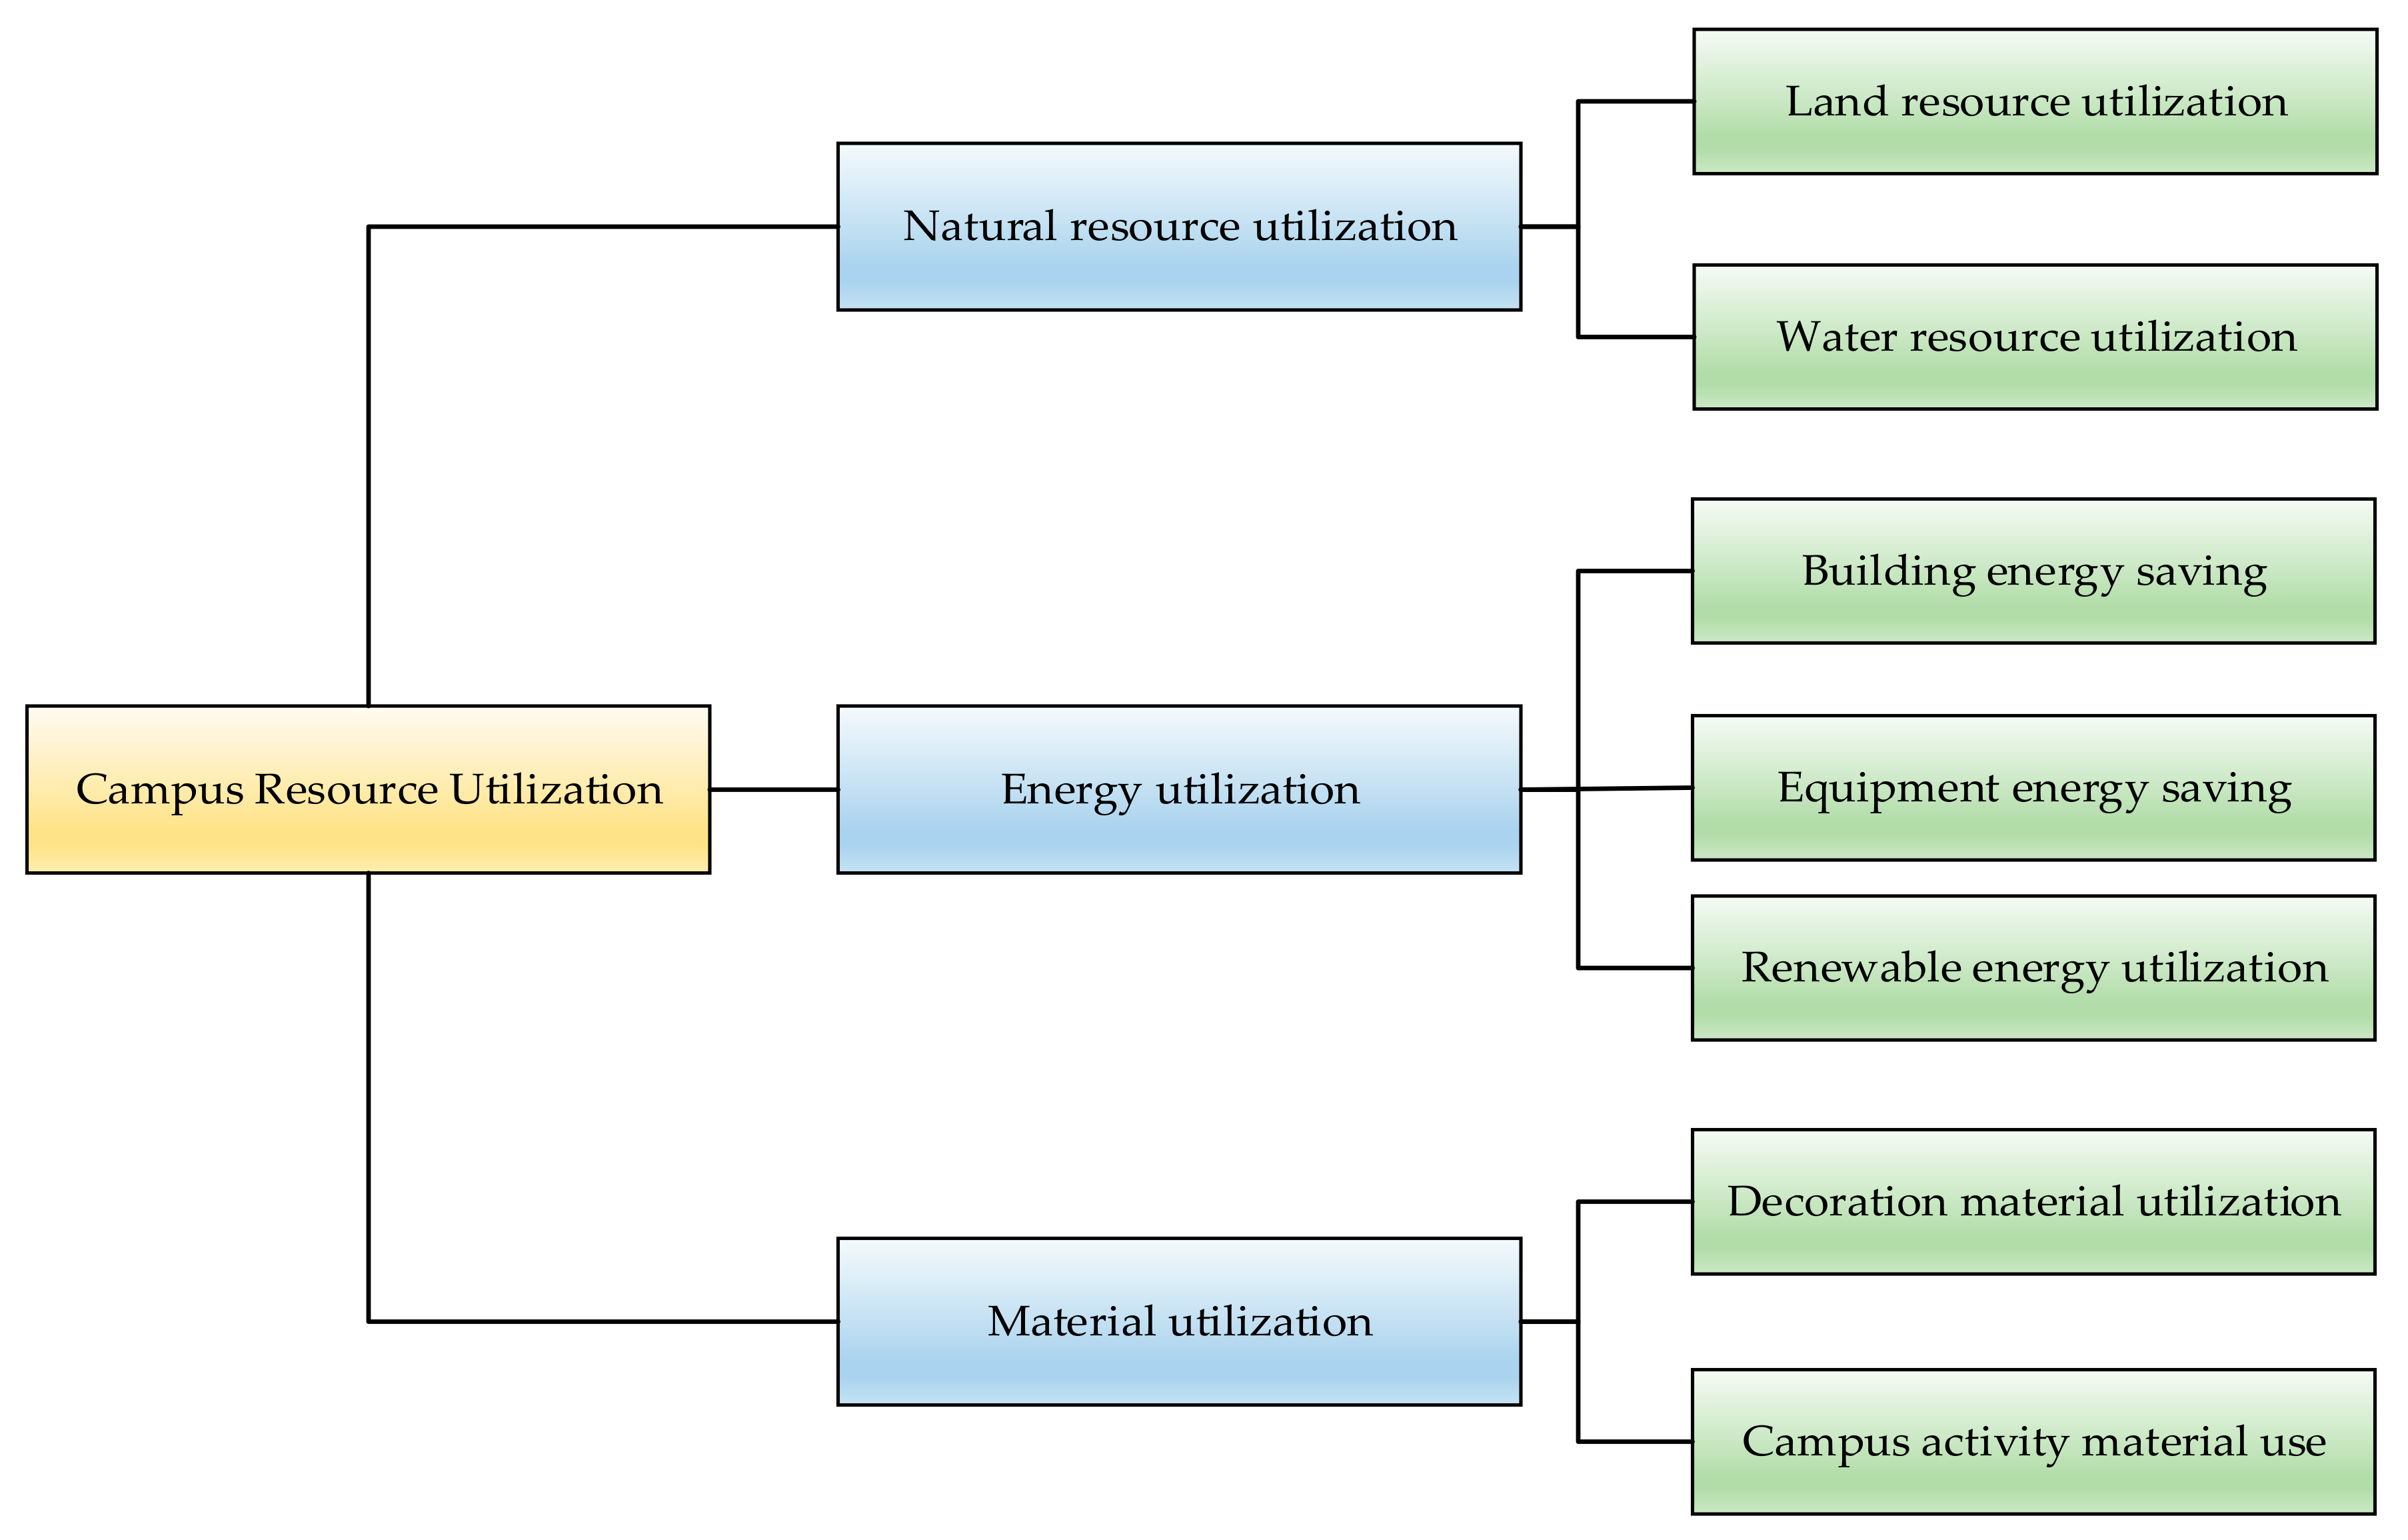
2.1. Campus Resource Utilization Indicators
The campus resource utilization index, as a guideline layer, is subdivided into three components: natural resource utilization, energy utilization, and material utilization, and the subdivided indexes are shown in Figure 1. The natural resource utilization is divided into land resource utilization and water resource utilization; energy utilization is divided into building energy saving, equipment energy saving, and renewable energy utilization; material utilization is divided into decoration material utilization and campus activity material use.
In the process of campus design, the utilization of land resources, including above- and belowground parts, is determined according to relevant policies and laws. The basic economic indicators of the project site have been determined, mainly reflected in the size of above- and belowground floor area, overall volume ratio, number of parking spaces, building density, green space ratio, etc. The use of water resources accounts for a large part of the later operation in the construction process of the campus project. In the design evaluation, it is more about planning the scope and source of water use, water pipelines and water equipment, etc. In the campus operation, the benefit of water resources is the saving and reasonable redevelopment of water resources after the completion of the construction, which involves the evaluation of the effect of water equipment, the reasonable use of nonmunicipal water, mainly the long-term use of water-saving appliances, the renewal of irrigation of campus greenery, the use of rainwater, etc.
Energy utilization is a field involved in all phases of campus projects in planning, design, construction, and operation, and it has an important impact on the sustainable development of green campuses. In the planning and design stage, according to the relevant requirements and regulations of different regions, different degrees of energy-saving design are required; for example, some regions require the comprehensive energy-saving index of public buildings to reach 65%, and the design of renewable energy sources such as solar energy and air energy as well as water-saving equipment and energy-saving lamps and lanterns in the same regions are also reflected in the green building design scheme. The three indexes of building energy saving, equipment energy saving and renewable energy use are all dynamically reflected in the green campus operation. The material utilization is mainly targeted at the comprehensive evaluation of the safety, durability, and environmental protection of the decoration materials and campus activity materials used in the sustainable development of the campus.
2.2. Campus Environment Creation Indicators
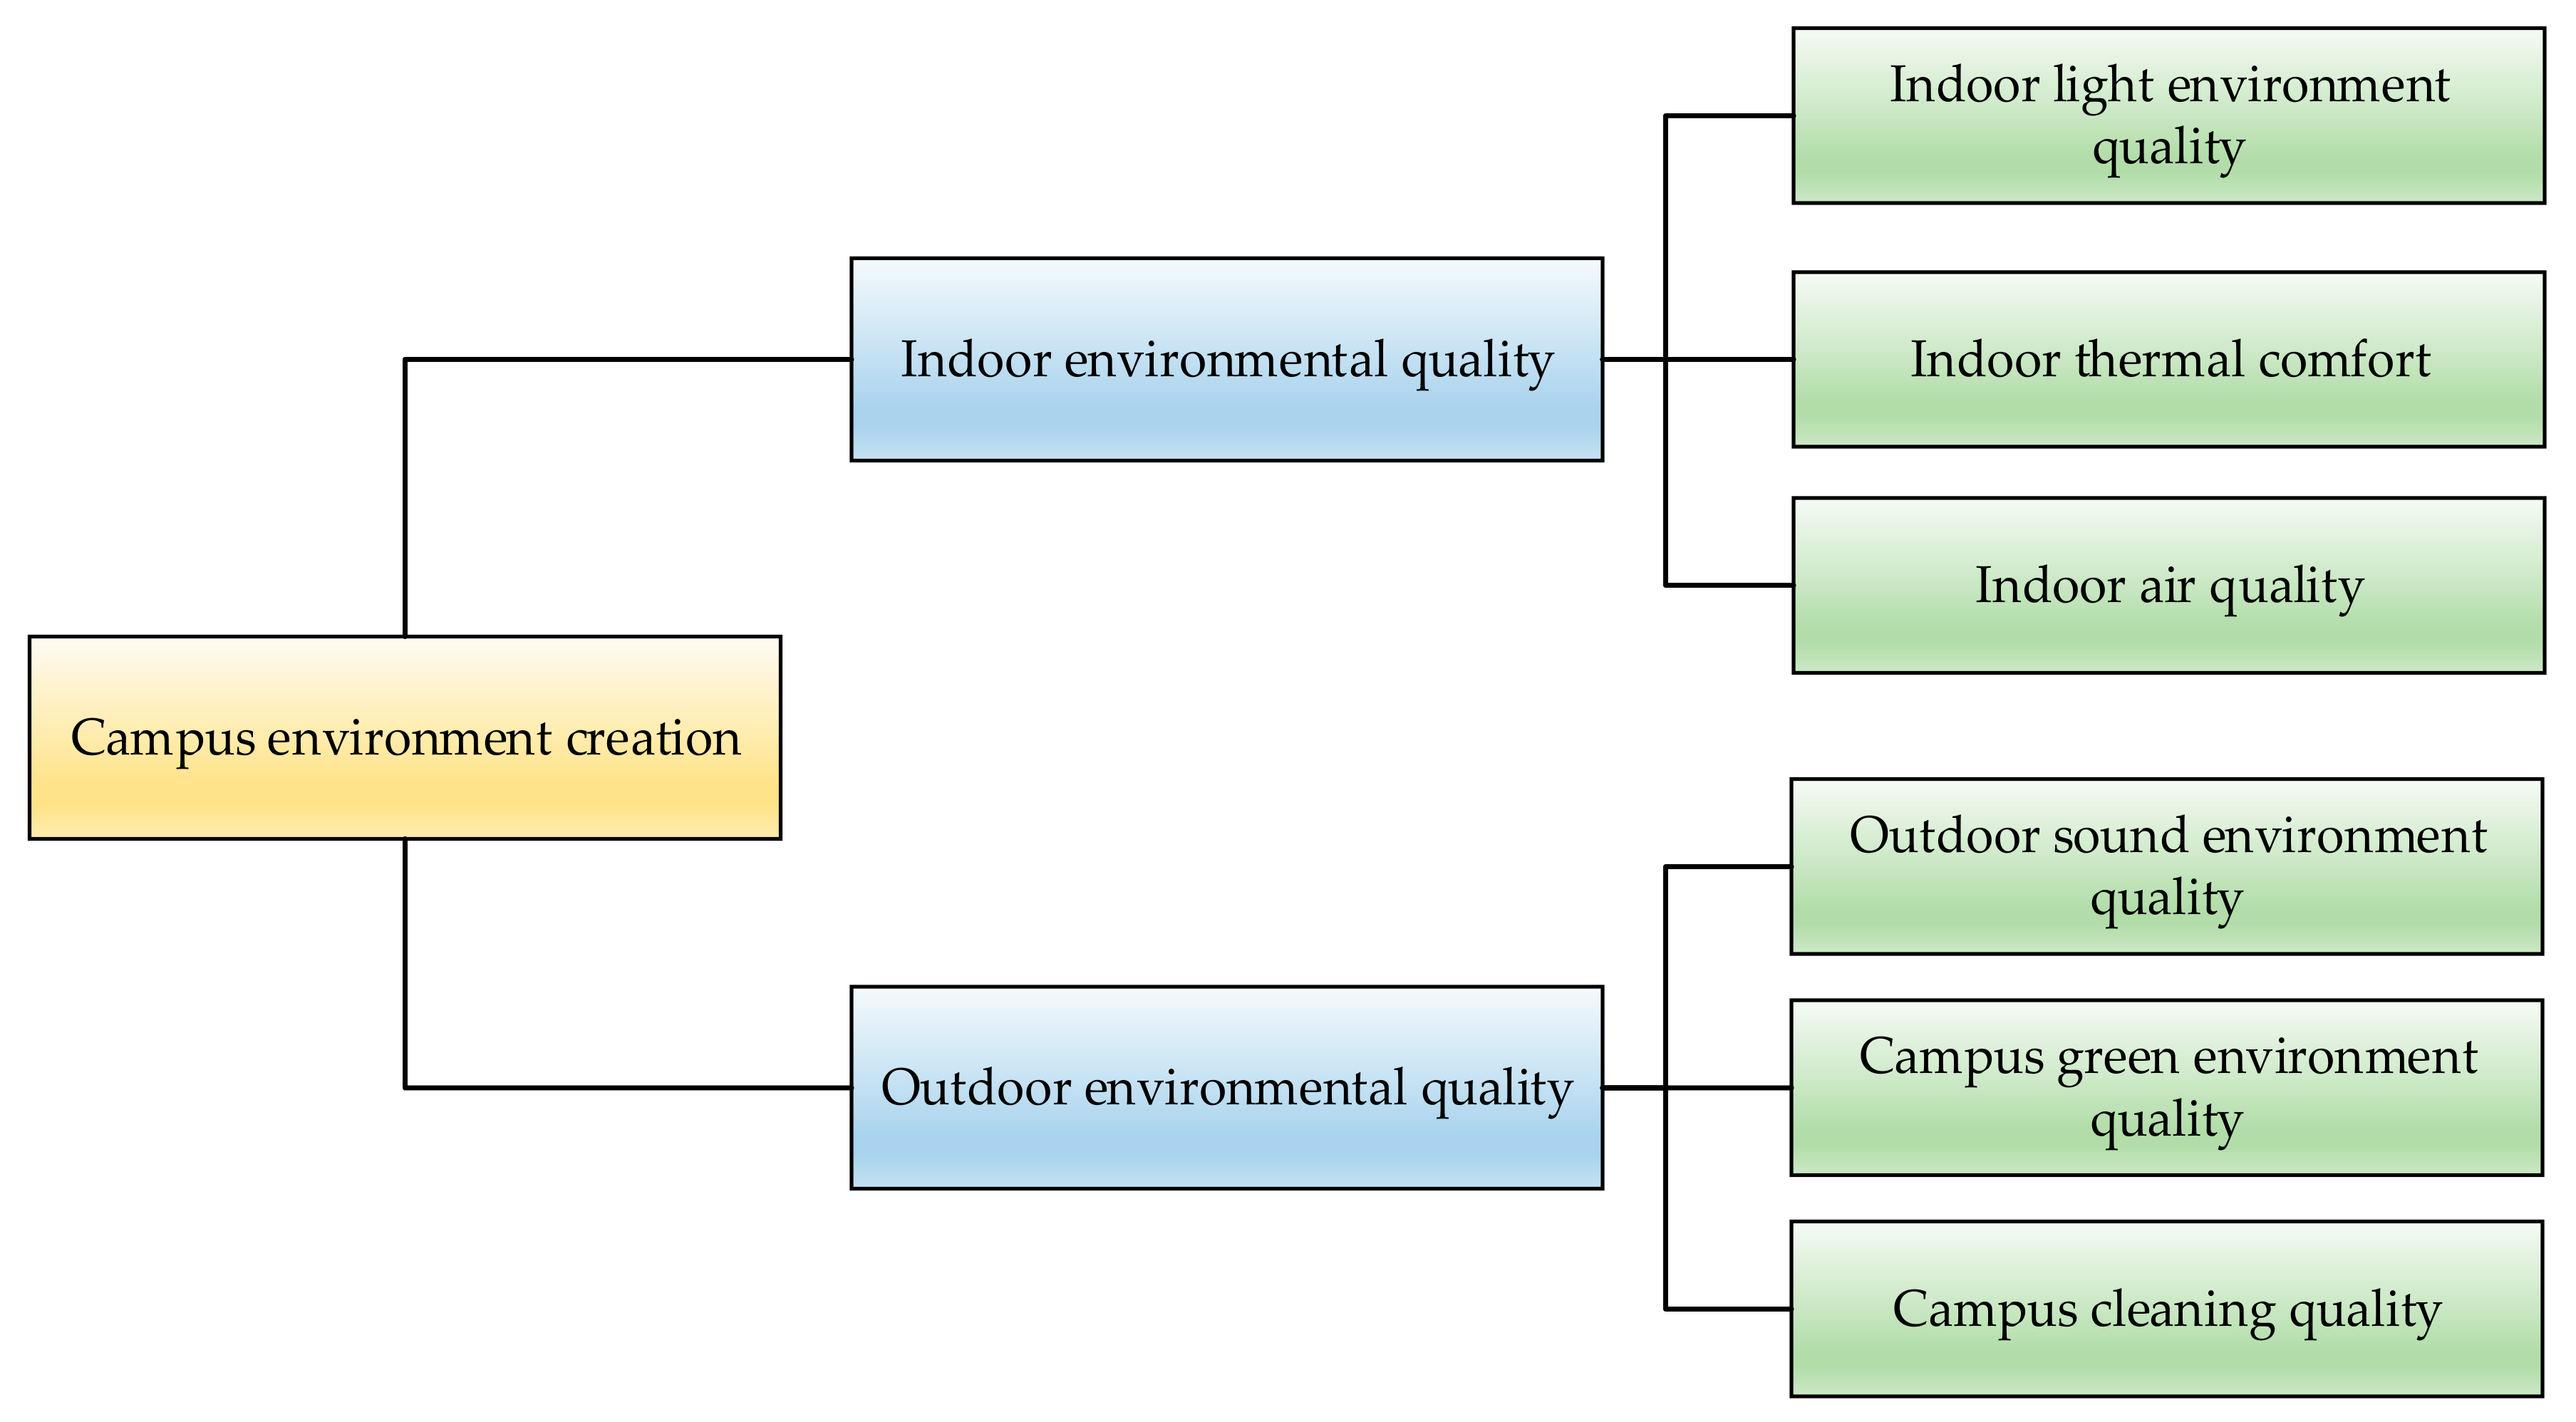
The campus environment creation index, as a guideline layer, is refined into two pieces of content: indoor environmental quality and outdoor environmental quality, and the refined index is shown in Figure 2. The indoor environment quality is divided into indoor light environment quality, indoor thermal comfort, and indoor air quality; the outdoor environment quality is divided into outdoor sound environment quality, green environment quality, and cleaning quality.
The campus environment is a dialogue between the building and the environment and creating a beautiful campus environment is one of the foundations for the sustainable development of green campuses. The quality of the indoor environment refers to the evaluation mainly for the teaching place and the campus office interior. Indoor light-environment-related content such as visual field visibility, glare control, natural lighting, and other related influencing factors have targeted scoring items and requirements. The main organ by which human beings obtain information is the eyes, and the efficiency of visual information transmission will be restricted by the light environment, so the quality of the indoor light environment is one of the most important influencing factors in the process of teaching activities. The indoor thermal comfort index is proposed as a comprehensive evaluation for the warmth and comfort of campus users. The indoor air quality index is a comprehensive evaluation for the organization of indoor natural ventilation airflow, indoor ventilation efficiency, air pollutants in the main functional rooms, etc. It is a dynamic impact index in the process of sustainable development of a green campus and is closely related to campus users. The outdoor sound environment is more important than the outdoor wind environment and outdoor thermal environment in the campus operation stage, so it is separately evaluated as one of the subindicators. Campus green environment quality is a comprehensive evaluation index of campus greenery maintenance, public green space maintenance, and greenery plant configuration. Campus greening can provide a good environment for campus users to study, live, and work. At the same time, cultivating rich plant configurations can also enrich students’ scientific knowledge and improve their ability to understand nature.
Campus cleaning is a daily part of campus operation. The cleaning of campus buildings, the cleaning of campus roads and squares, and the collection and disposal of daily garbage are all important influencing factors for the creation of the entire campus environment and the sustainable development of a green campus and therefore serve as one of the subindicators for the creation of the campus environment.
2.3. Campus Usage Management Indicators
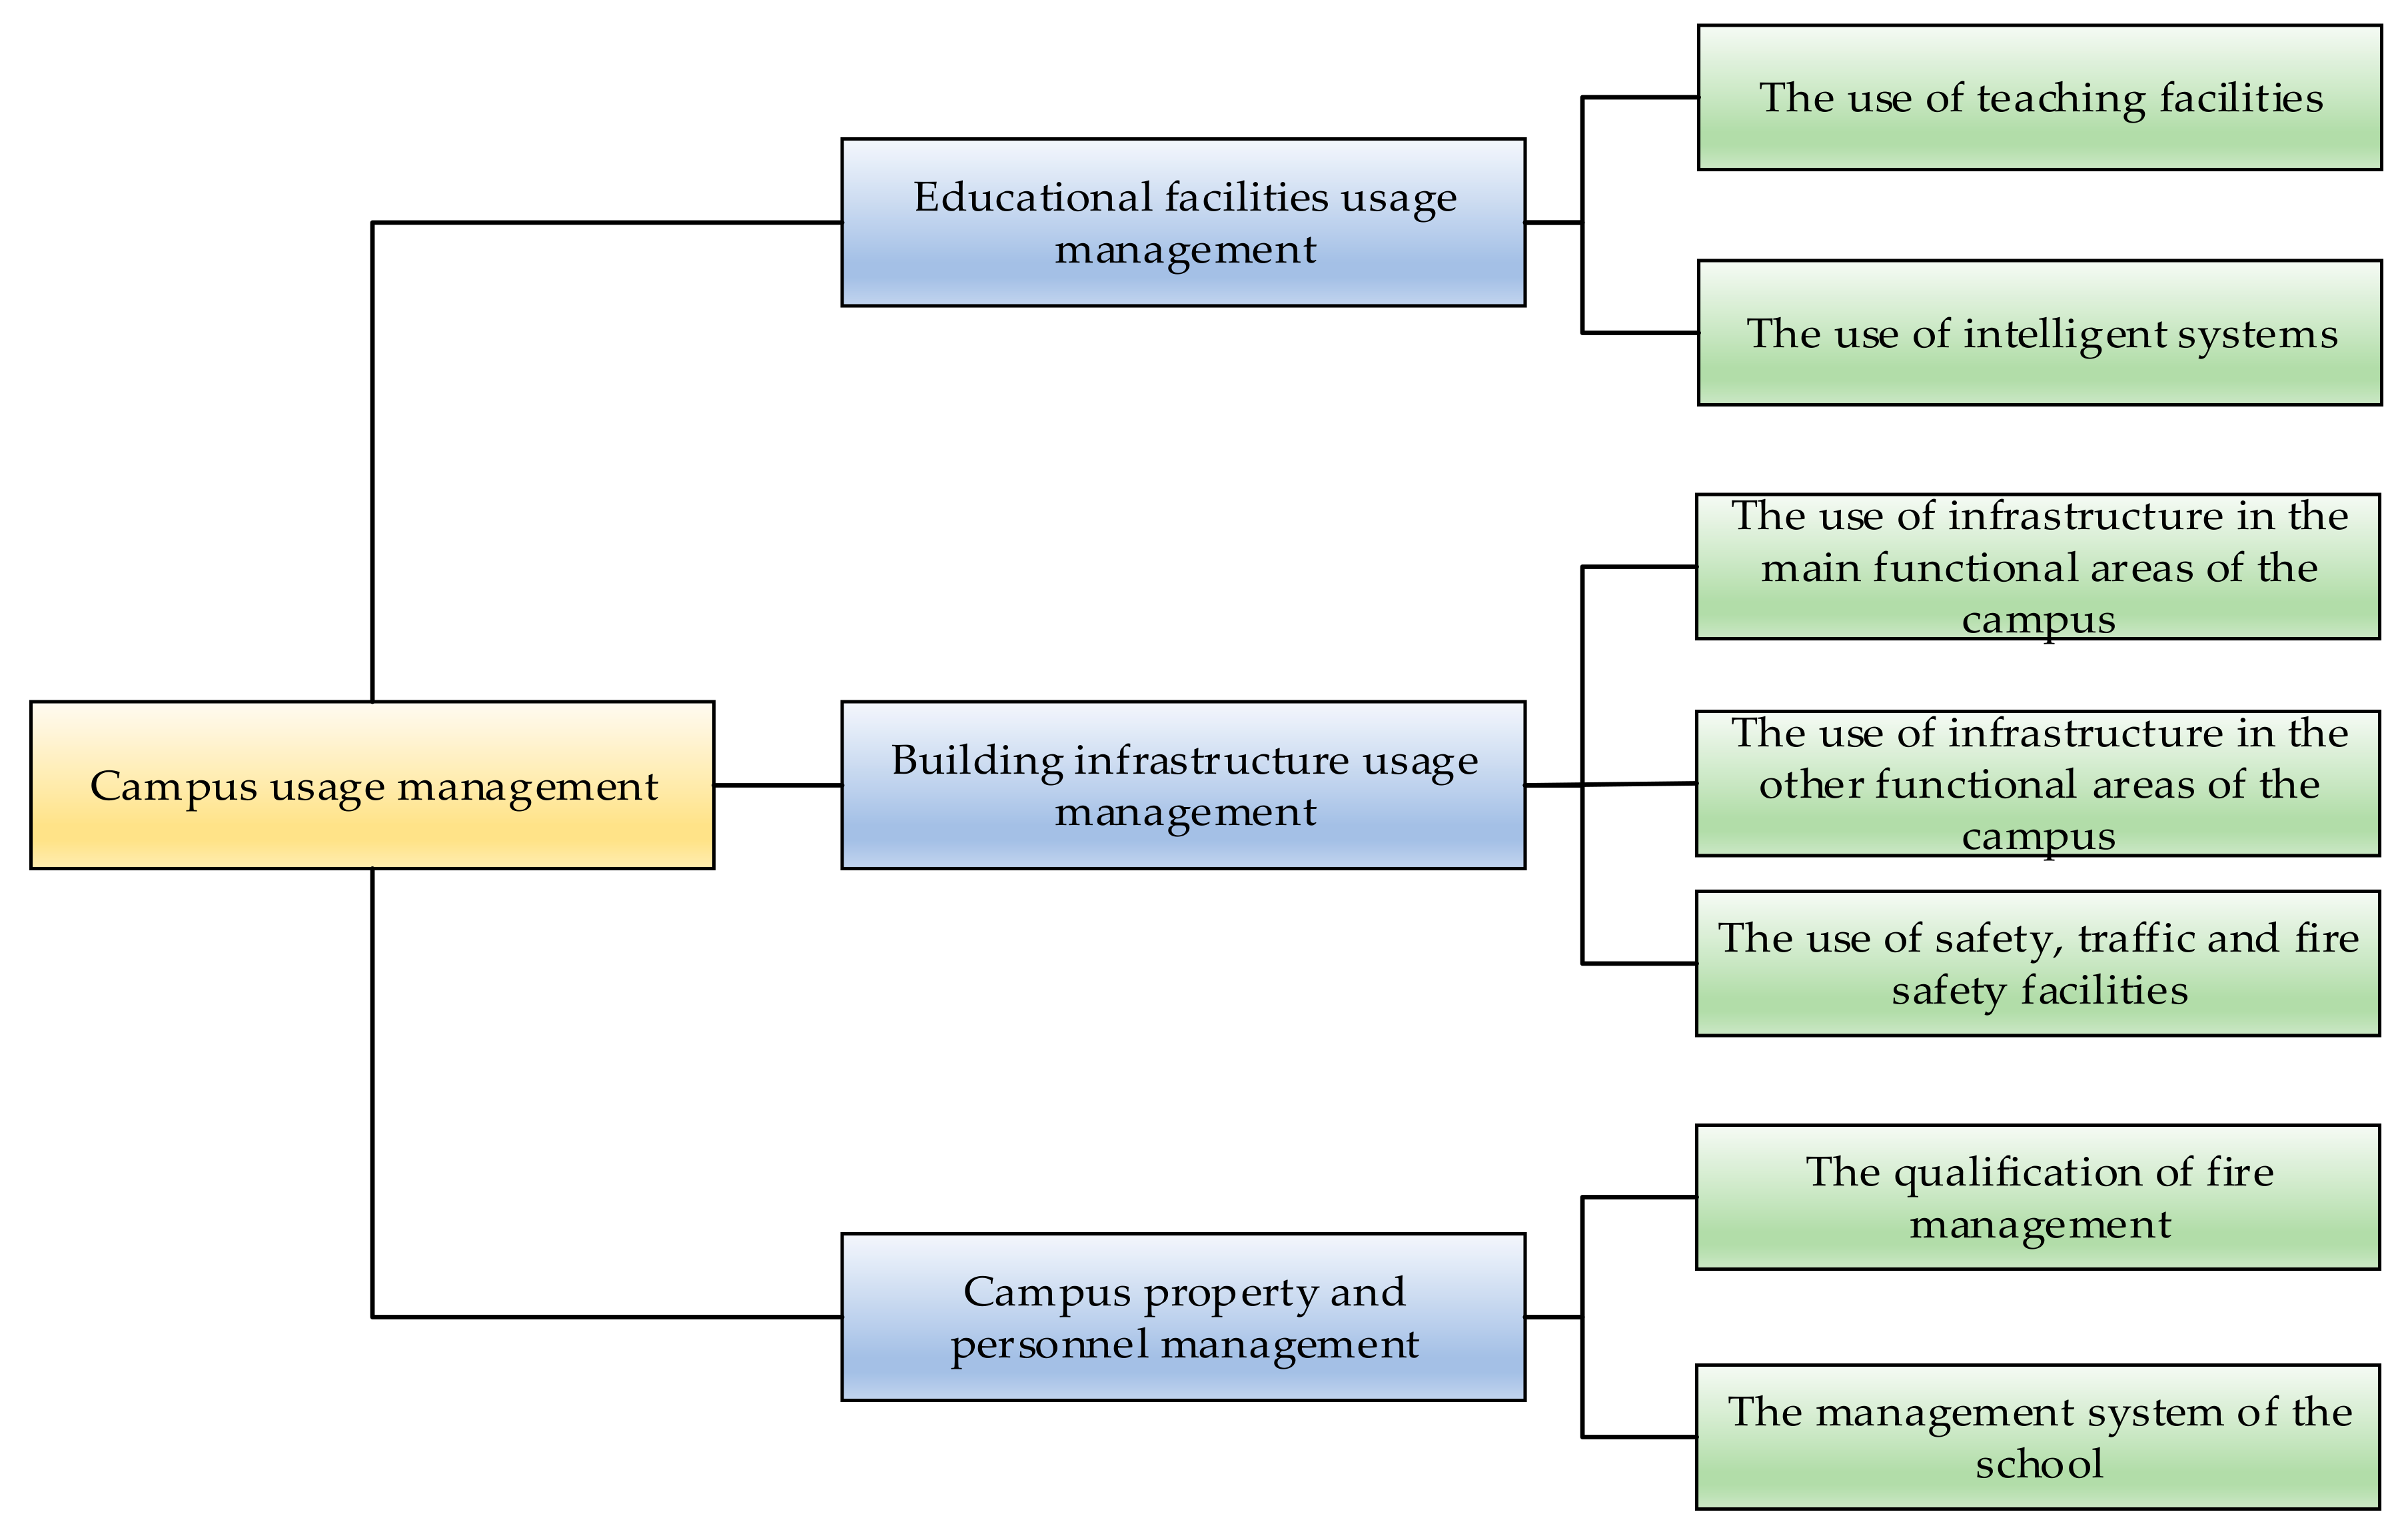
As a guideline layer, the campus usage management indexes are divided into three parts: educational facilities usage management, building infrastructure usage management, and campus property and personnel management, as shown in Figure 3. The educational facilities usage management is divided into the use of teaching facilities and intelligent systems. The use management of building infrastructure is divided into the use of infrastructure in the main functional areas of the campus; the use of infrastructure in the other functional areas of the campus; and the use of safety, traffic, and fire safety facilities. The management of campus property and personnel is divided into the qualification of fire management and the management system of the school.
The main functional area of campus daily operation is the teaching area, and the use of teaching facilities is the core of the use management of education-type facilities. In the campus design specifications, different functional classrooms have different teaching facilities requirements. In addition to basic teaching facilities such as blackboard lecterns, broadcasting speakers, and lockers, general classrooms are currently required to have multimedia projection equipment, display gardens, and other facilities. Other classrooms such as science experiments, art, music, dance, and other classrooms have different teaching facilities requirements according to the function. Configuration content, audition equipment dark line arrangement, the complete function of the facilities, frequency of use, etc. are the influencing factors of the use of teaching facilities indicators. The use evaluation index of teaching facilities is a comprehensive evaluation of the basic equipment and facilities of the main teaching rooms. The intelligent system utilization index is based on the background of the current mobile Internet environment and the current information environment of primary and secondary schools. At present, the Internet has been closely integrated with the whole society, and the application of the Internet on the campus has become more and more extensive. The use of smartphones and smartwatches by primary and secondary school students has become the norm, and the trend of using intelligent system devices such as open monitoring of primary and secondary school classrooms, Internet distance learning, and body sensing monitoring of primary and secondary school students combined with 5G Internet of Things is gradually emerging. Therefore, the use of the intelligent system as one of the operation evaluation indexes is a way to comply with the current development of the times and an area that is not perfect in the evaluation system of green building and green campus sustainability.
The establishment of campus property and personnel management indicators is based on the sustainable operation of green buildings and green campuses, and the evaluation is made for the management mode of campus operation, which does not involve the merits of educational outcomes for primary and secondary school students on campus. The determination of school management qualification indicators comes from the provisions in the relevant evaluation standards, and school management is required to obtain certification of relevant management systems and qualifications. The indicators of the school management system and management qualification complement each other and are a comprehensive evaluation of influencing factors such as sustainable operation management system of green campus, training of relevant personnel in campus operation, and coordination and management of various departments in campus operation.
2.4. Campus Eco-Efficiency Indicators
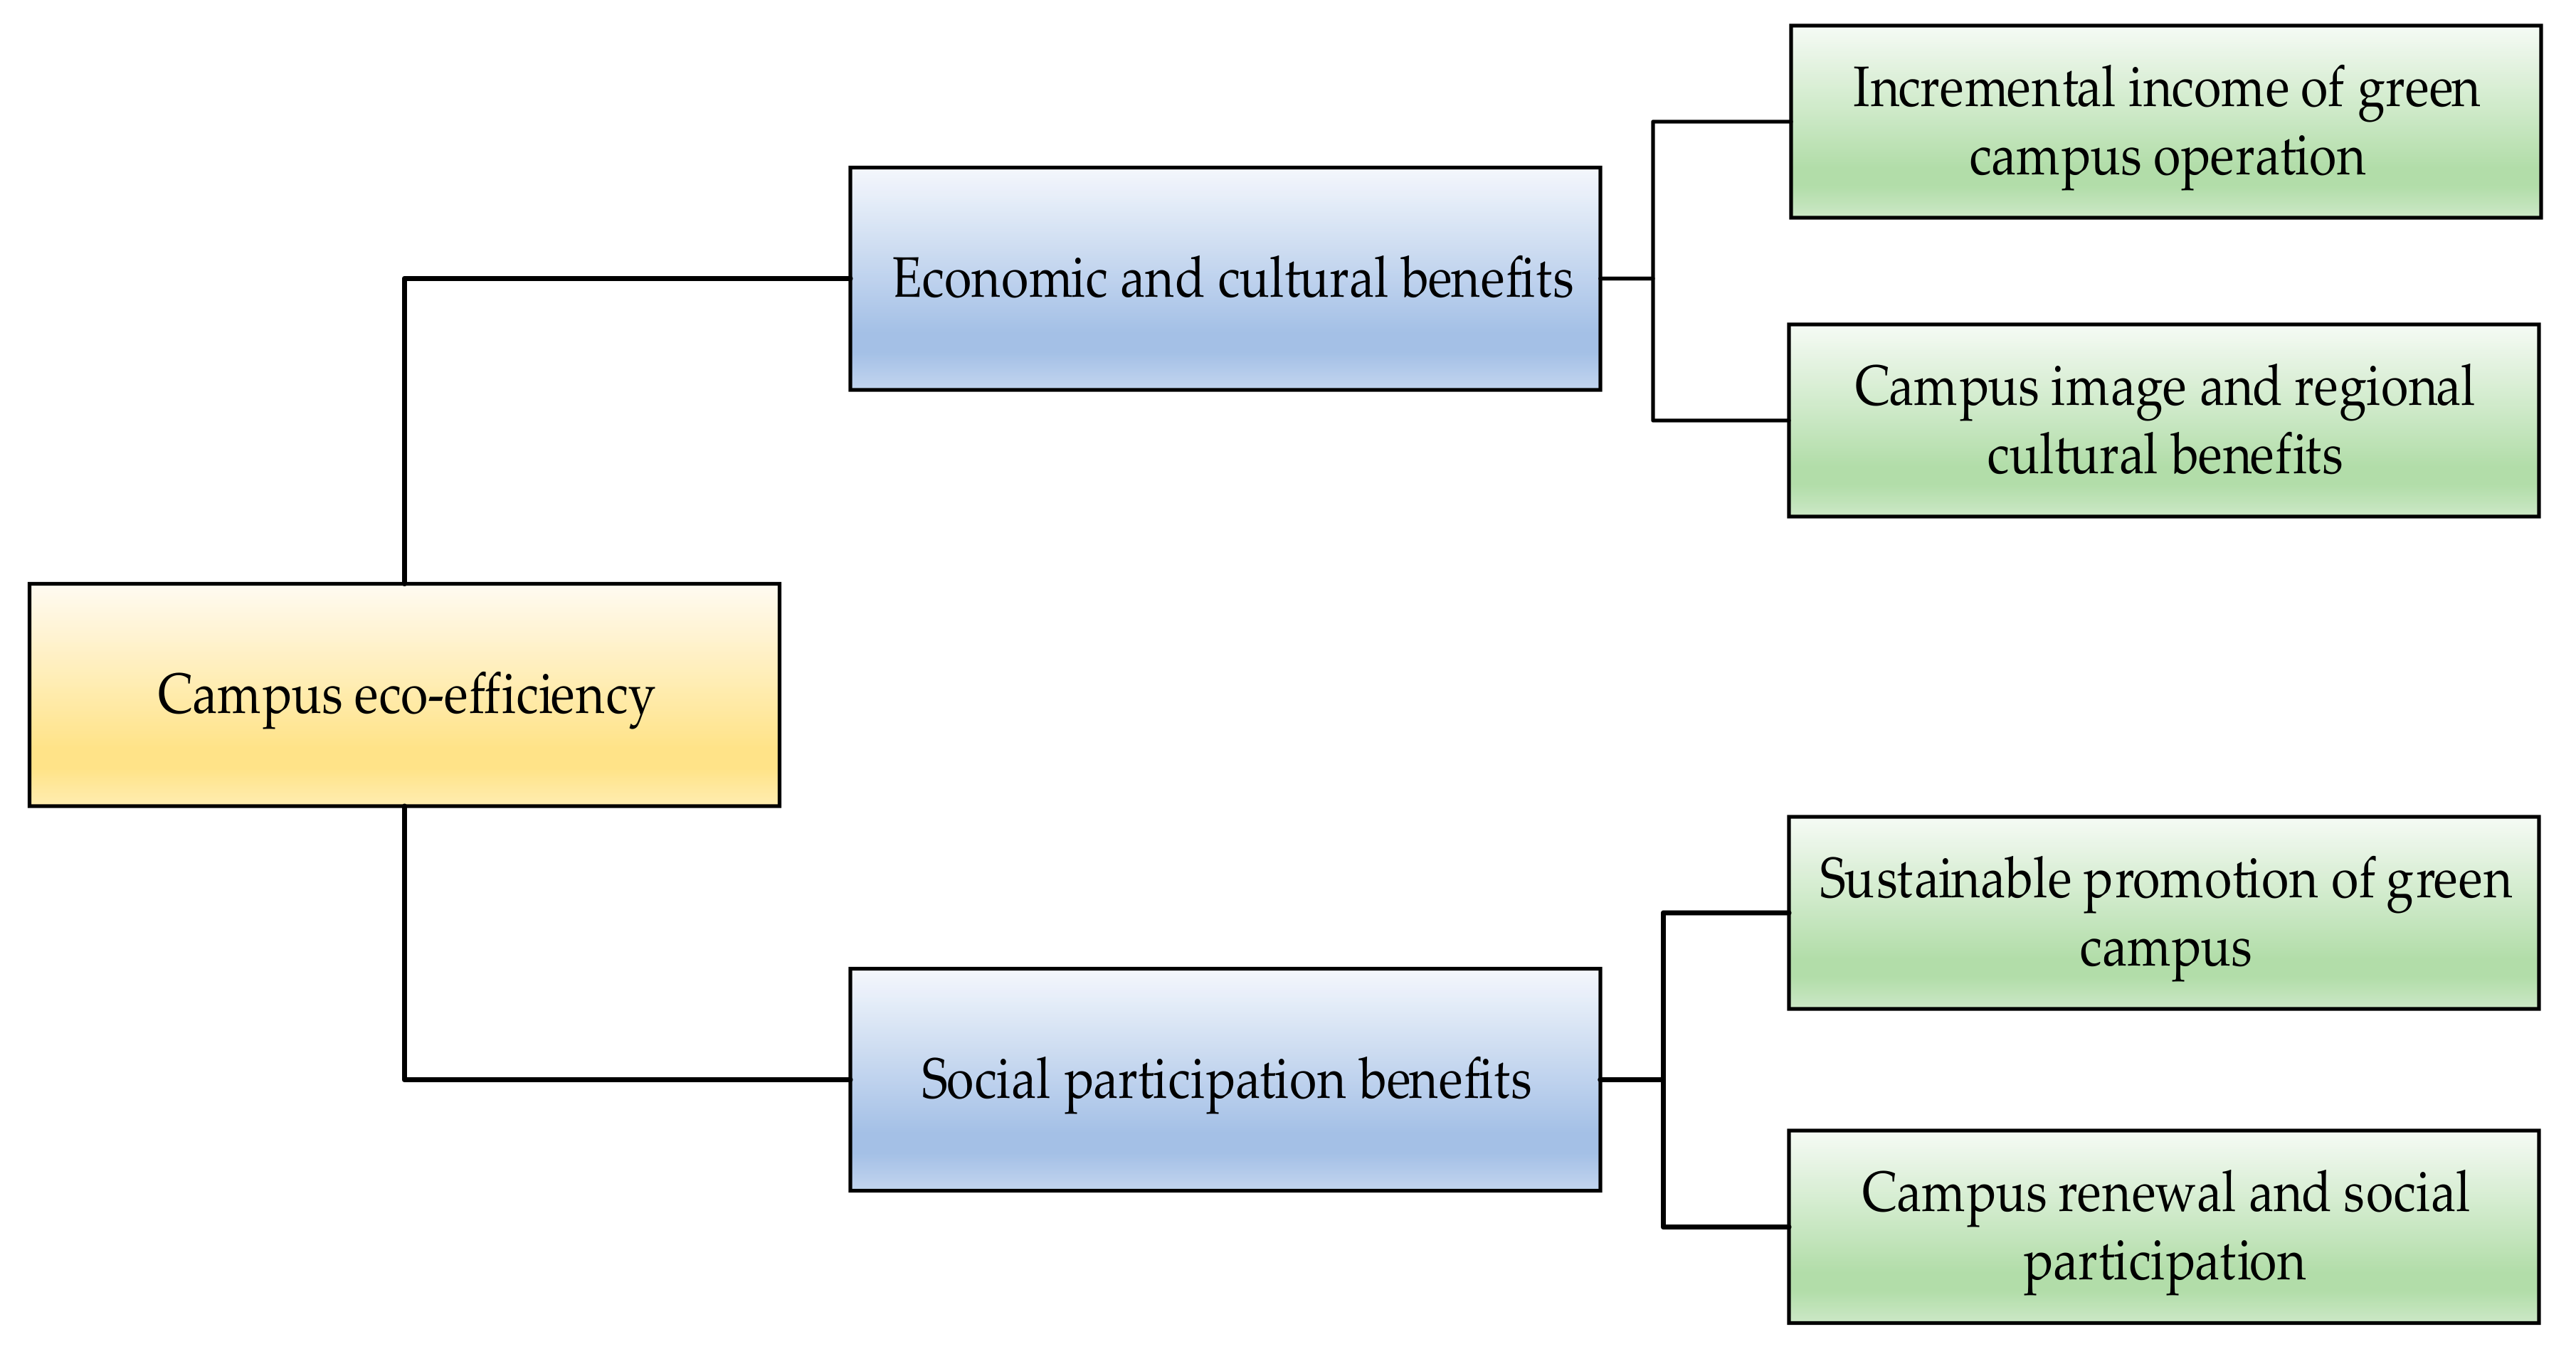
The campus eco-benefit index, as a guideline layer, is subdivided into two components: economic and cultural benefits and social participation benefits, and the subdivided indexes are shown in Figure 4. The economic and cultural benefits are divided into incremental income of green campus operation and campus image and regional cultural benefits; social participation benefits are divided into sustainable promotion of green campus and campus renewal and social participation.
Campus eco-efficiency indicators are evaluated in terms of both economic and cultural and social benefits. In the evaluation of green building design, economic benefits mainly refer to the balance between the construction cost of green building measures and the benefits recovered later. The design and construction of green buildings have matured in the understanding of incremental costs, but the operational incremental costs are still vague. The incremental benefits of green campus operation are not only reflected in the economic benefits, but also have the content of cultural benefits. As a special large public building, the school’s image and regional mark is a signifier of different cities and regions. Taking the economic and cultural benefit index as one of the target layers can make the sustainable operation of a green campus more detailed.
Social participation benefit indicators mainly refer to the public benefits of participation in the whole life cycle of the green campus. Based on the original evaluation system, the educational promotion category is reorganized and incorporated into the campus operation evaluation system as a sustainable promotion subindex of the green campus. Meanwhile, the indicators of campus renewal and social participation are added. During the whole life cycle of a green campus, campus renovation and expansion and renewal are inevitable, and the needs of society keep changing. As a dynamic process, the sustainable operation of a green campus can be revised and tested through this index, and public participation can be increased to encourage the public to participate in the sustainable operation of the green campus.
3. Green Campus Assessment Model Based on DBN-ANFIS
3.1. Dynamic Bayesian Model
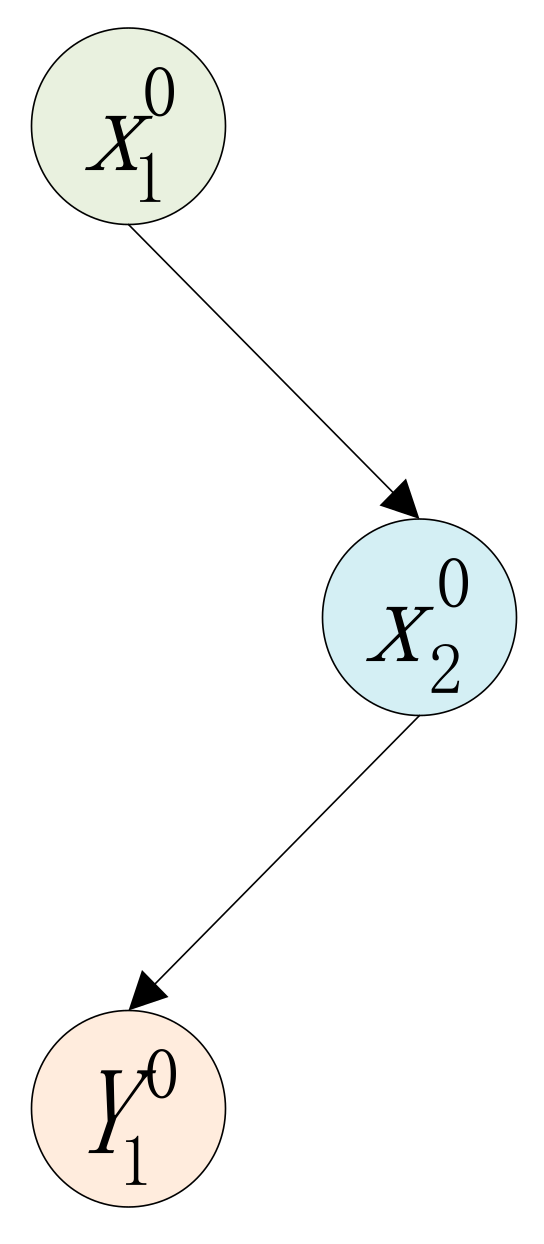
Dynamic Bayesian models are probability-based, combining the original static Bayesian structure with temporal information while forming a new stochastic model with the ability to handle time-series data, based on Bayes’ theorem and Bayes’ formula, which reacts to the influence of temporal factors on the probability of events [25].
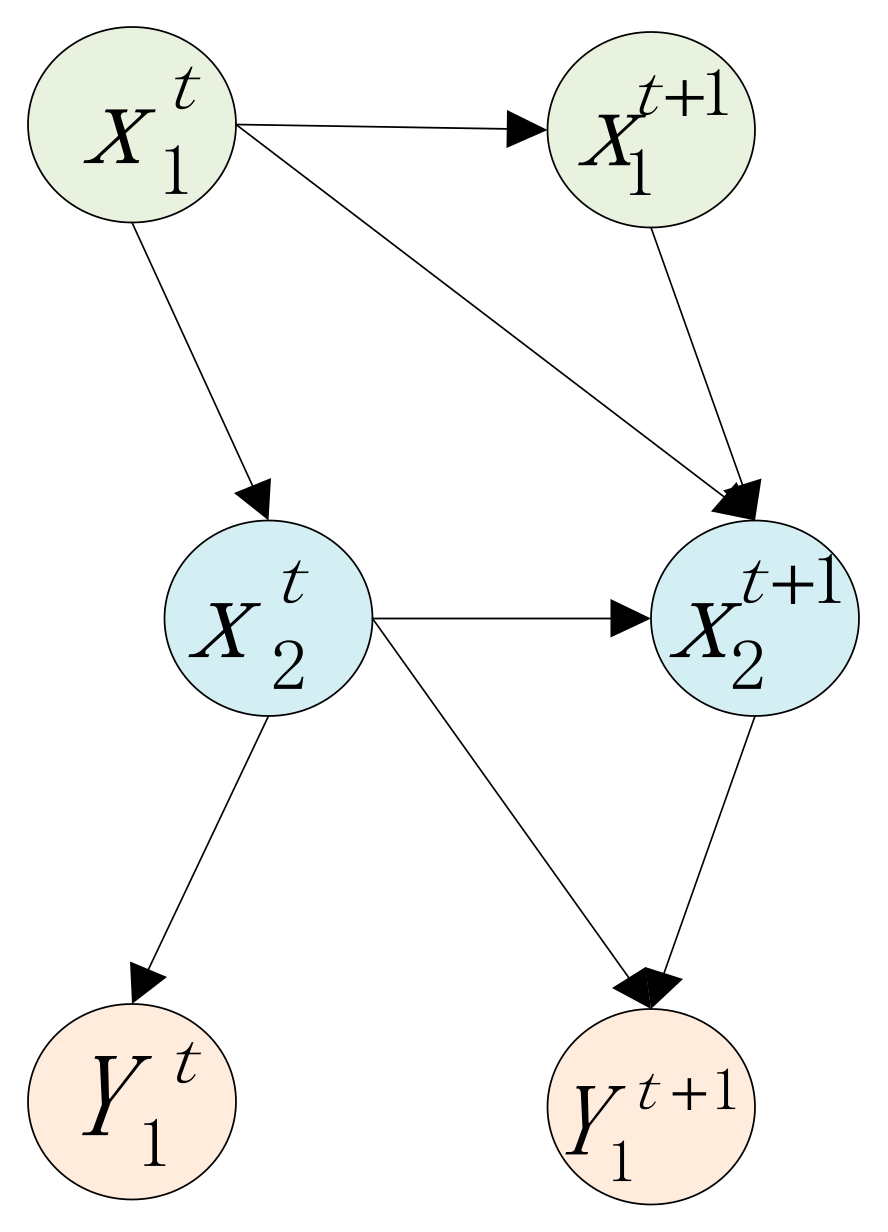
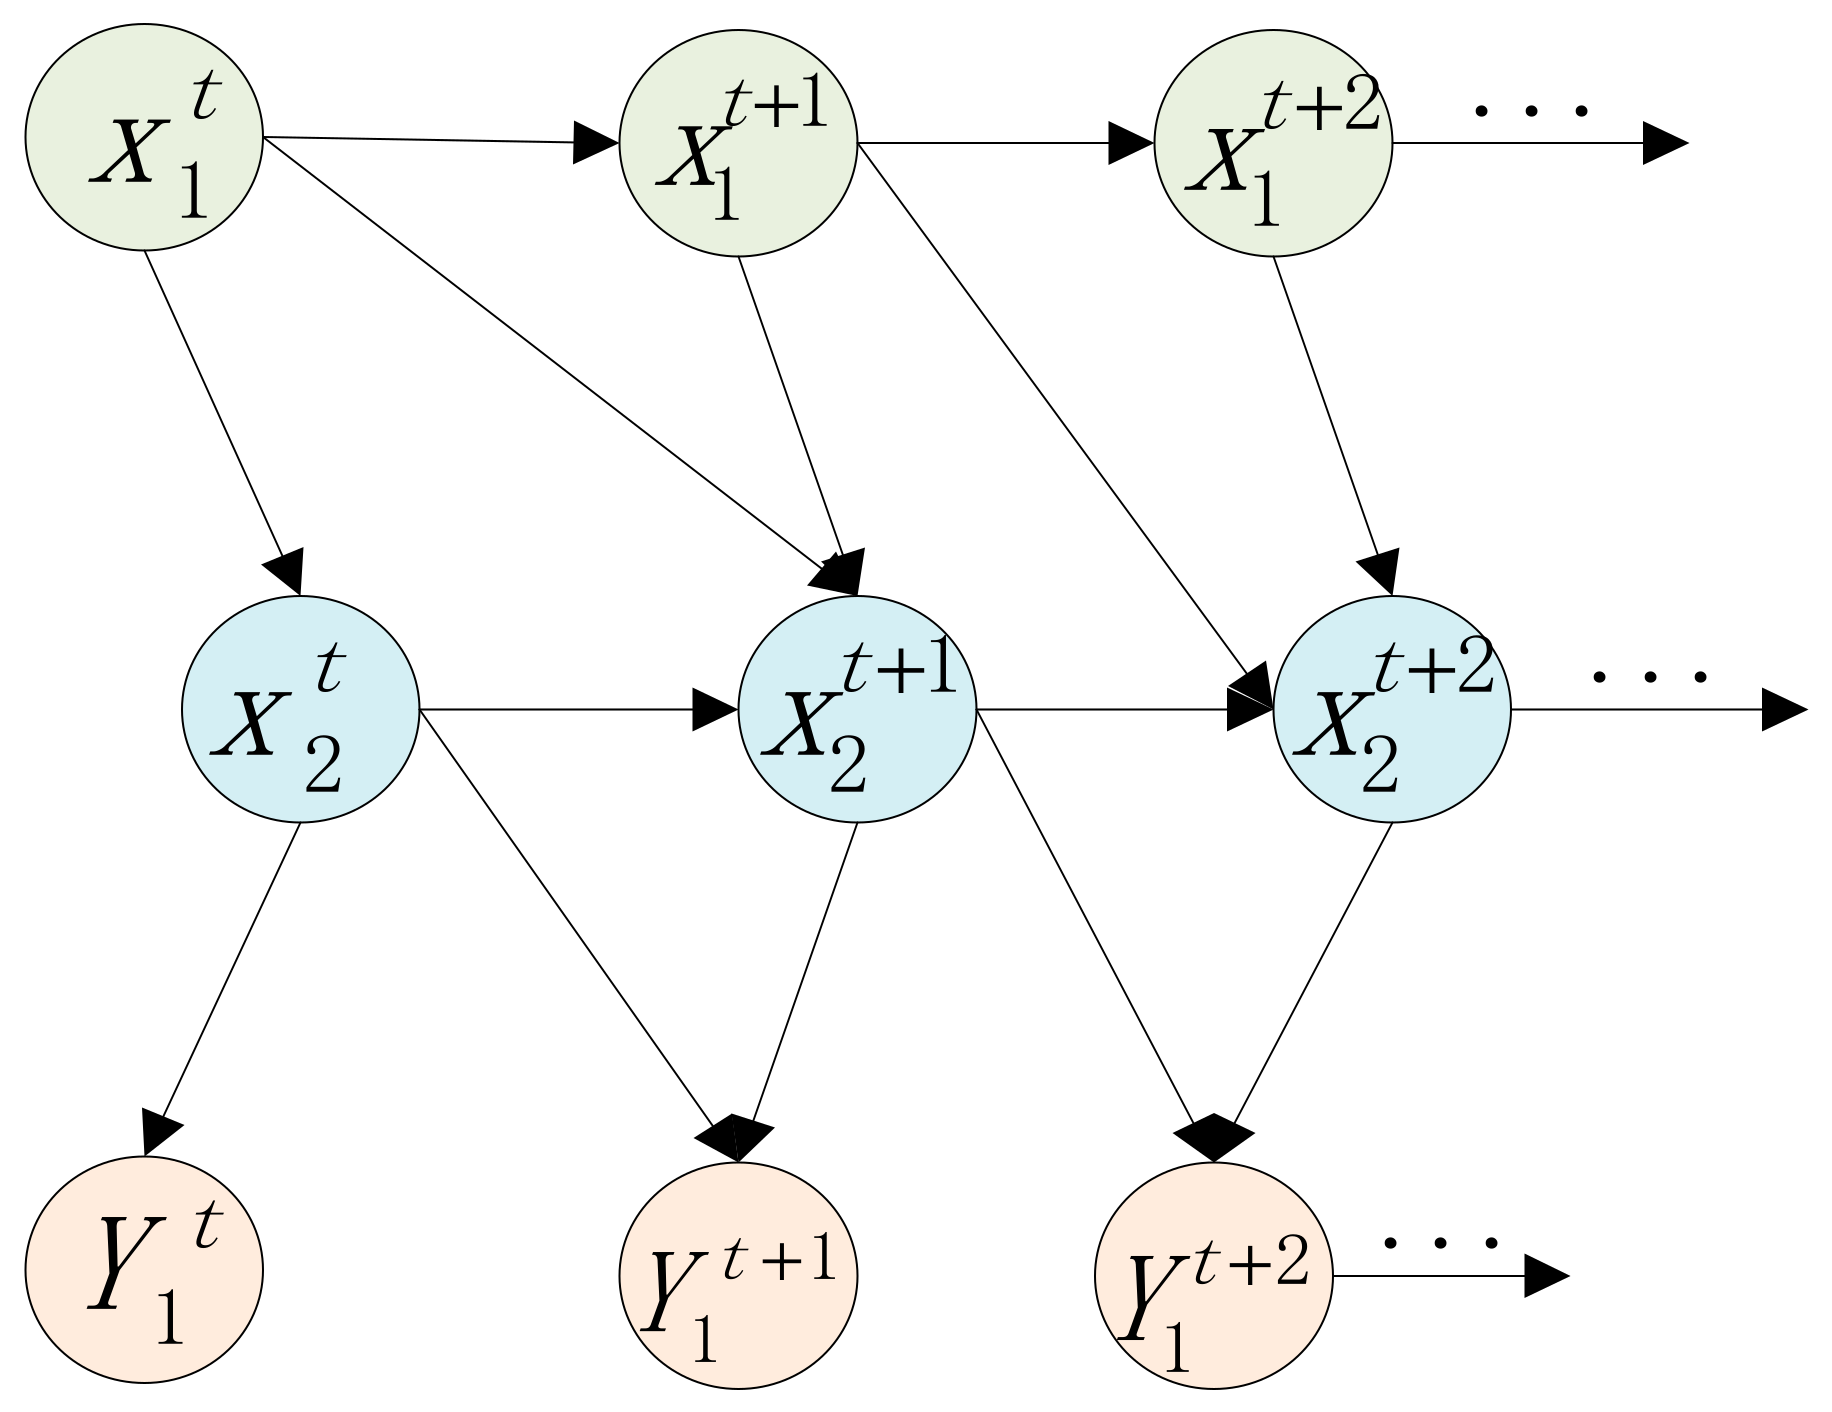
The dynamic Bayesian model is an extension of the static Bayesian model in time, as shown in Figure 5, Figure 6 and Figure 7. Due to the addition of the time factor, the dynamic Bayesian model has temporal characteristics in addition to the basic properties of the Bayesian model, which makes the problem have a backward and forward continuity in the reasoning process, and this reasoning method is then more consistent with the development of objective things [26].
Set to be the set of attributes that change with time, to denote the value of the ith attribute at moment t, and . In order to be able to represent the trajectory of change in the Bayesian structure as the event changes, a probability distribution over the random variable is required, and the entire trajectory of change satisfies the Markov chain model.
That is, the state of the events at moment depends only on the state at moment . The topology of the model, the causal relationships between variables, and the set of variables must be the same in each time period to build a dynamic Bayesian model. Two important parts need to be defined first, namely the prior structure and the transfer structure.
- (1)
- The prior structure represents the distribution structure of the initial state .
- (2)
- The transfer structure denotes the probability of transfer at all times.
A dynamic Bayesian structure is defined by an infinite topology of conforming variables at infinite time. In fact, dynamic Bayesian networks can be obtained by reasoning over finite time intervals . At time , the parents of the event attributes are those nodes formulated in the prior structure; at time , the parents of the event attributes are the nodes at time and , thus allowing the conditional distribution of these variables to be obtained using a similar approach. Then, given the dynamic Bayesian model, the joint probability distribution over the variables is as follows:
where can be obtained computationally from the transfer structure. The dynamic Bayesian network responds to the change of dependence between variables over time through the topology, which can not only probabilistically model the dependence between different characteristics of variables, but also better represent the relationship between the characteristics of variables in time as well. In addition, arbitrarily adding or deleting the network topology does not affect the correlation between variables, and the network structure has strong robustness and flexibility. The dynamic Bayesian structure uses the collected temporal information to update the topology, prior distribution, and conditional probabilities. The inference process of this structure has successive continuity, and the increase in temporality is more consistent with the objective world law, which effectively reduces the uncertainty in the fusion of different levels of information.
3.2. Adaptive Network-Based Fuzzy Inference System
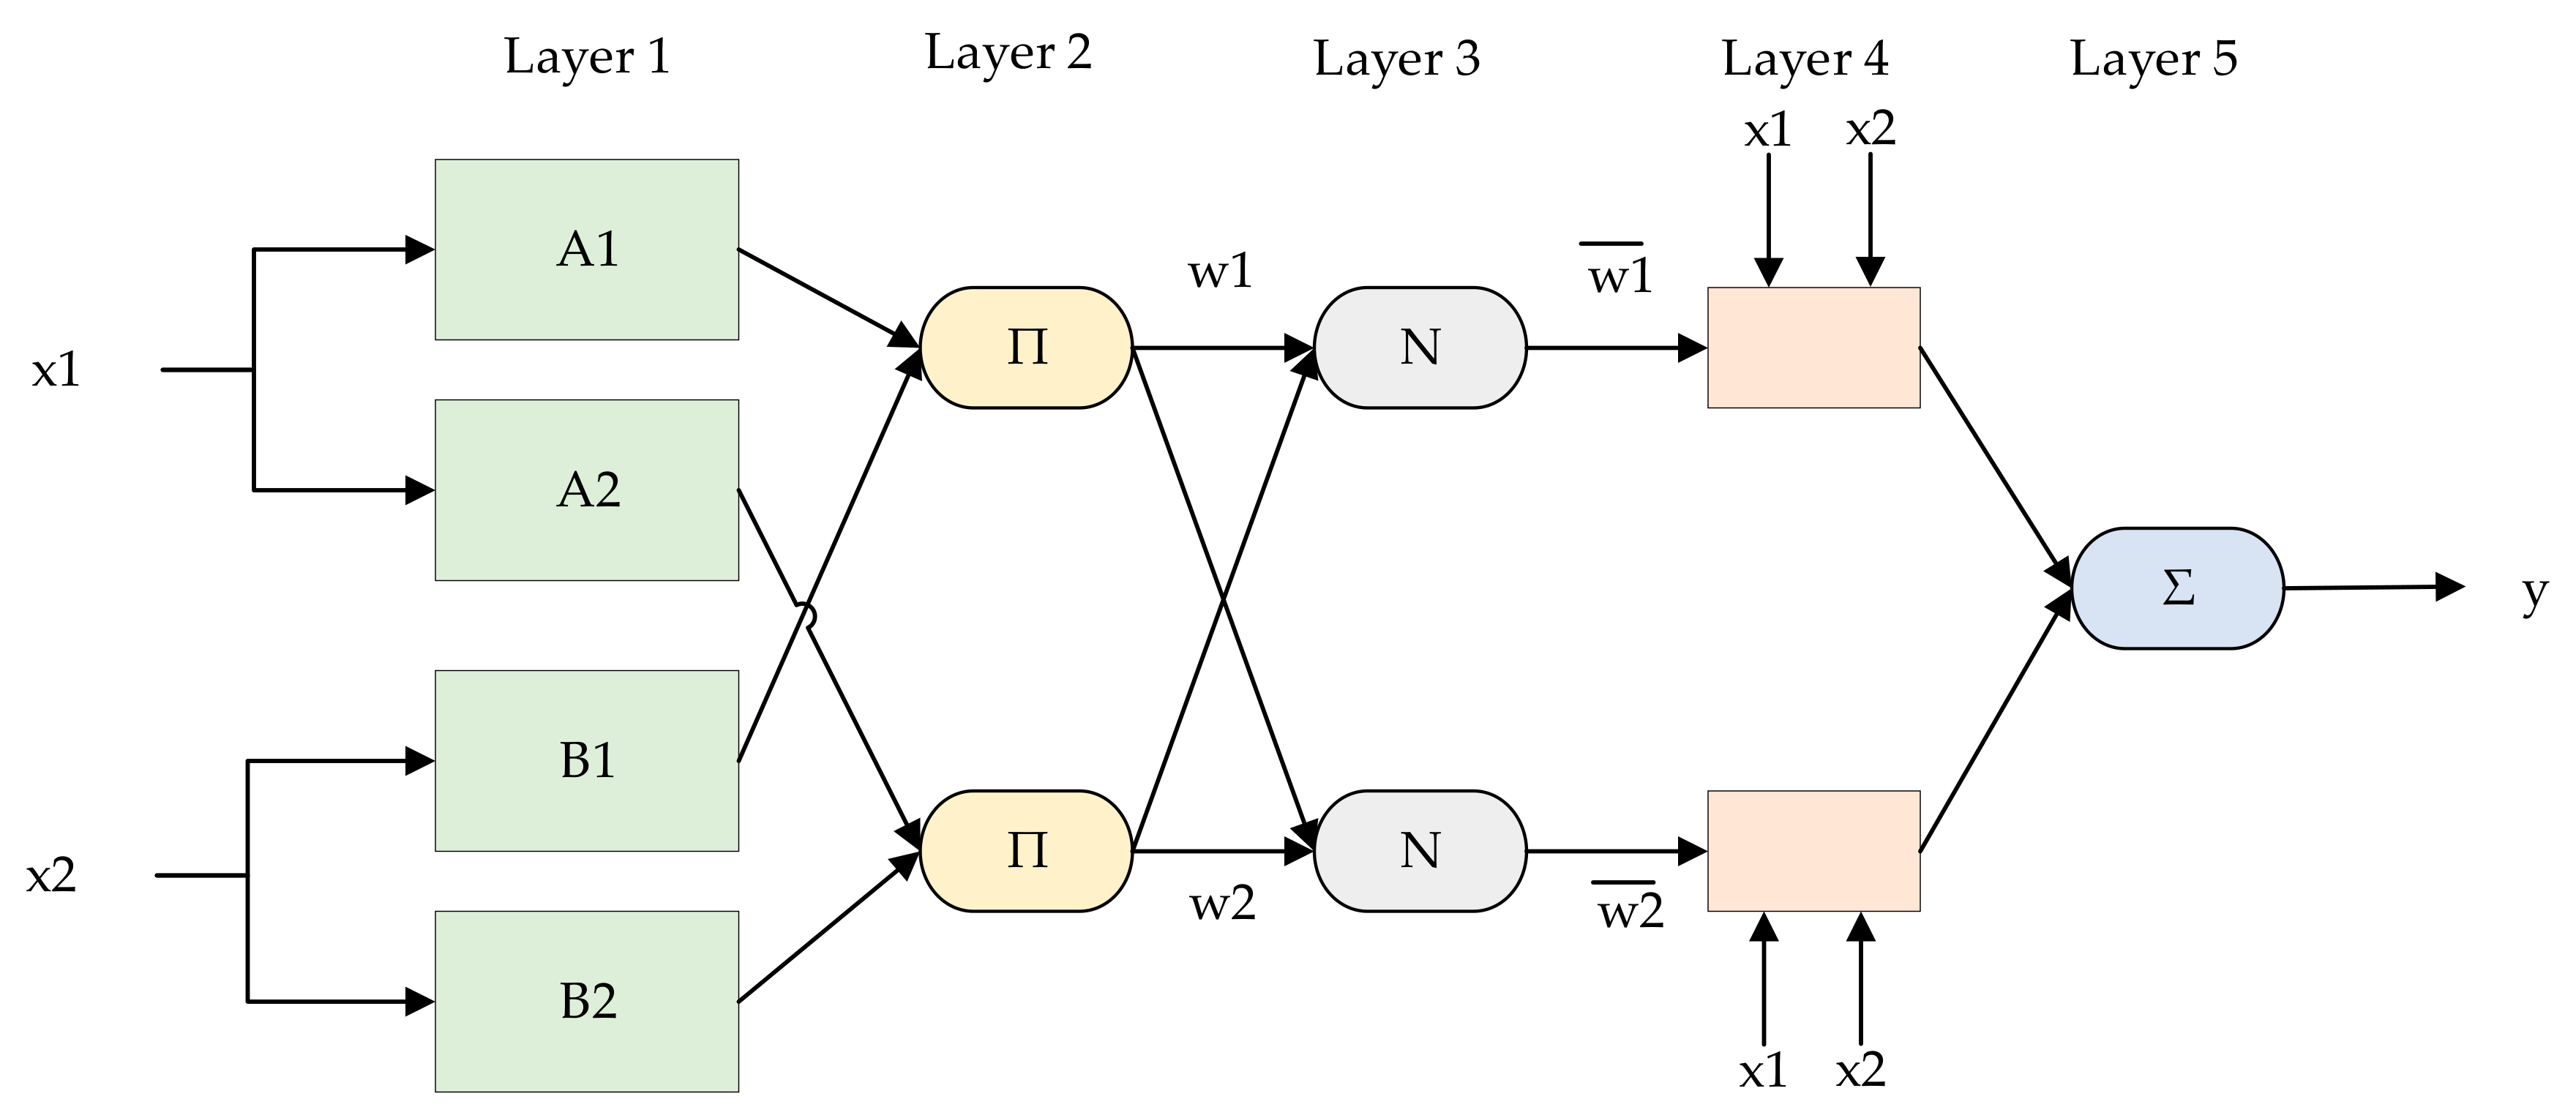
ANFIS is a system that combines fuzzy inference and neural networks, which are able to build fuzzy inference systems by adaptive modeling based on a large amount of sample data [27]. ANFIS first assumes a parametric fuzzy structure and then uses the data to train the fuzzy inference system (FIS), which in turn corrects the affiliation function according to some selected error criterion. The ANFIS model is able to improve the traditional subjective design of the graph of the affiliation function to minimize the error by automatically adjusting the parameters of the graph of the affiliation function based on the established fuzzy rules through the system’s own training and learning process to adapt it to the combination of input and output relations of the model. The typical structure of the model is shown in Figure 8.
and are the inputs to the system and is the output of the inference system; both are available data pairs. Each node in the same layer of the network has a similar function, and the output of the ith node in the first layer is denoted by , and so on.
3.3. DBN-ANFIS
Dynamic Bayesian inference uses experience and knowledge as a priori information to make inferences in time series by combining current sample information, continuously refining previous experience and knowledge, and correcting the previous distribution results. Thus, the continuous correction makes it more and more accurate for parameter estimation. The basic formula of dynamic Bayesian inference can be expressed as follows:
where can be interpreted as the corrected probability value at time, as the cognitive probability value at time, and as the result of the adjustment of .
In general, a typical feedforward neural network error performance function is the mean square error function, and here the error function is assumed to be .
where is the total number of samples; is the error.
In order to correct the error performance function, an additional term is added, which includes the network power, the mean squared difference of the threshold. That is:
where and are the regularization parameters; , are the network weights.
The posterior distribution of and according to the dynamic Bayes theorem is shown as follows:
Since it is not related to the normalization factor in Equation (6), is often called the significance of and . Therefore, if the posterior distribution of and is maximized, the likelihood function needs to be maximized.
The dynamic Bayesian approach focuses on the probability distribution of the weights (thresholds) over the entire weight space. If the network structure (mainly the number of neurons in the hidden layer) is denoted by , the posterior distribution of the weights is , according to Bayes’ theorem, if the prior distribution of the weights (thresholds) is known in the absence of sample data when the network structure has been determined and the sample data set is available.
The prior distribution of network weights obeys the Gaussian distribution:
where .
The likelihood function can be written as follows:
Then, the posterior distribution of weights can be obtained as follows:
Still using Bayesian inference to optimize the hyperparameters at time and , the posterior distribution needs to be found as follows:
Since the normalization factor is independent of the hyperparameters and , the problem of finding the maximum posterior distribution is transformed into finding the maximum likelihood function and thus yields:
Bringing Equations (9), (10), and (12) into Equation (14), the following equation can be obtained:
Assume that the weight of when taking the minimum value is and subject to a Taylor expansion near .
Bringing Equation (16) to Equation (15) and using the maximum likelihood principle, the optimal hyperparameters of the group and are obtained as:
where is the number of effective parameters; is the total number of network parameters, in general; and the range of is .
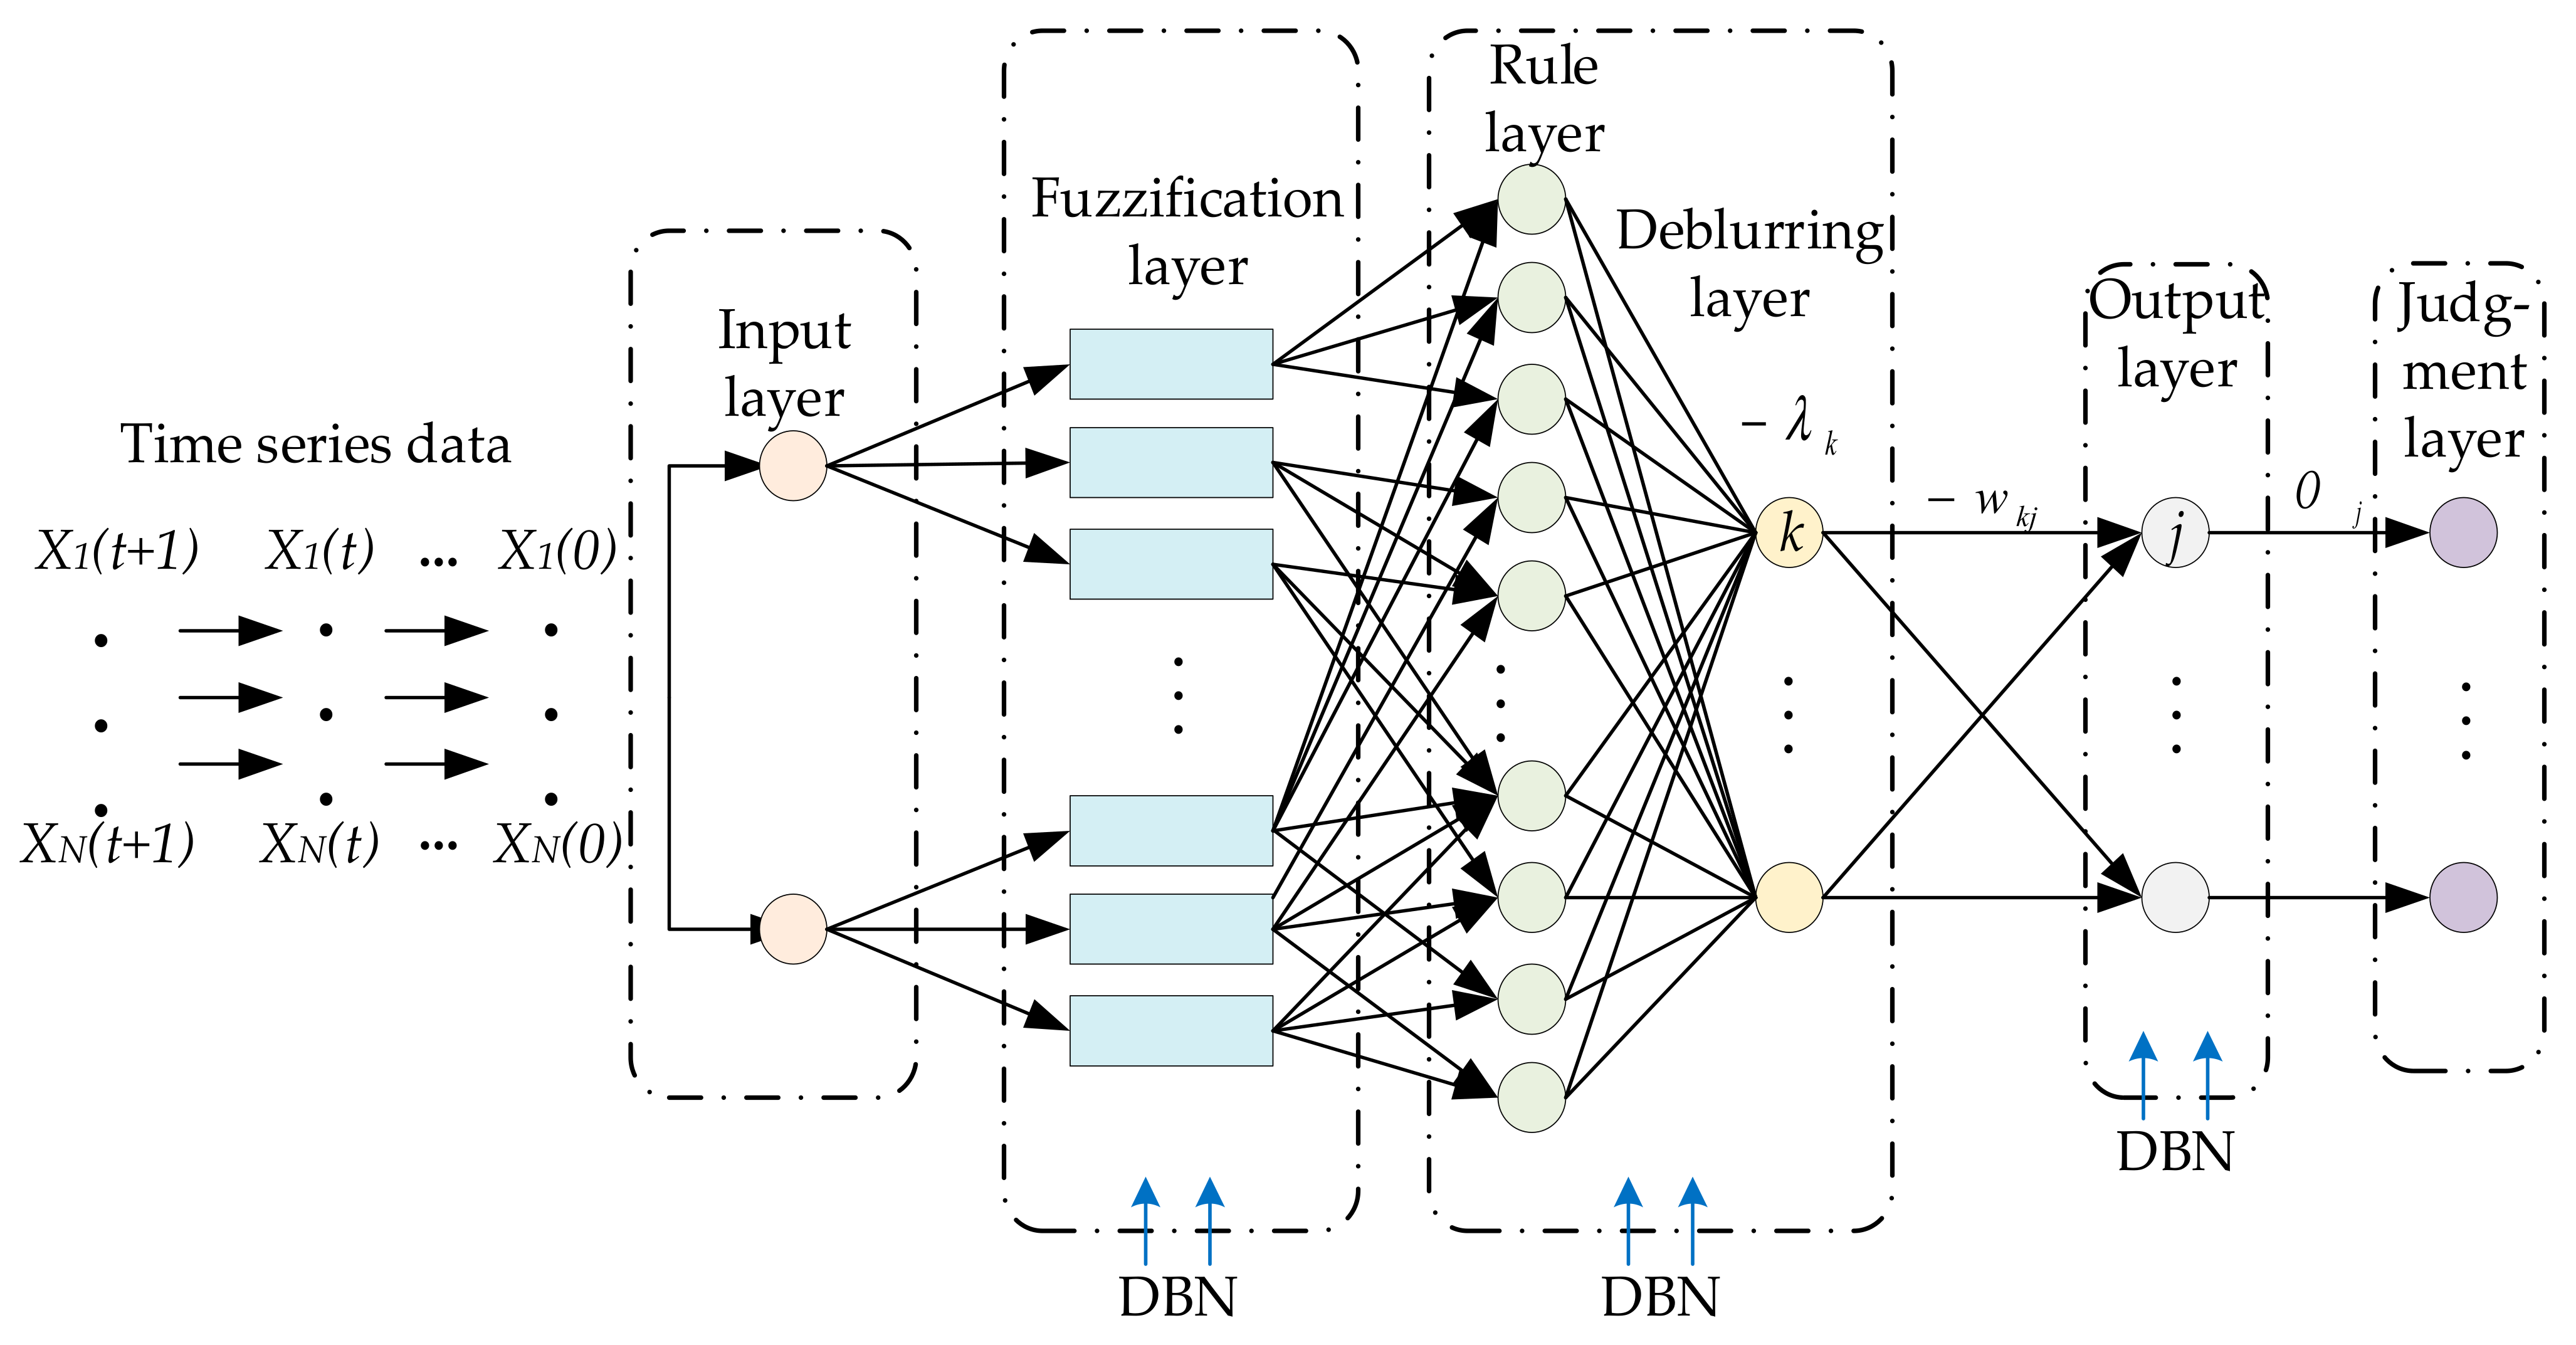
The schematic diagram for dynamic Bayesian ANFIS is shown in Figure 9.
3.4. The Process of Green Campus Evaluation Model Based on DBN-ANFIS under Spark Big Data Platform
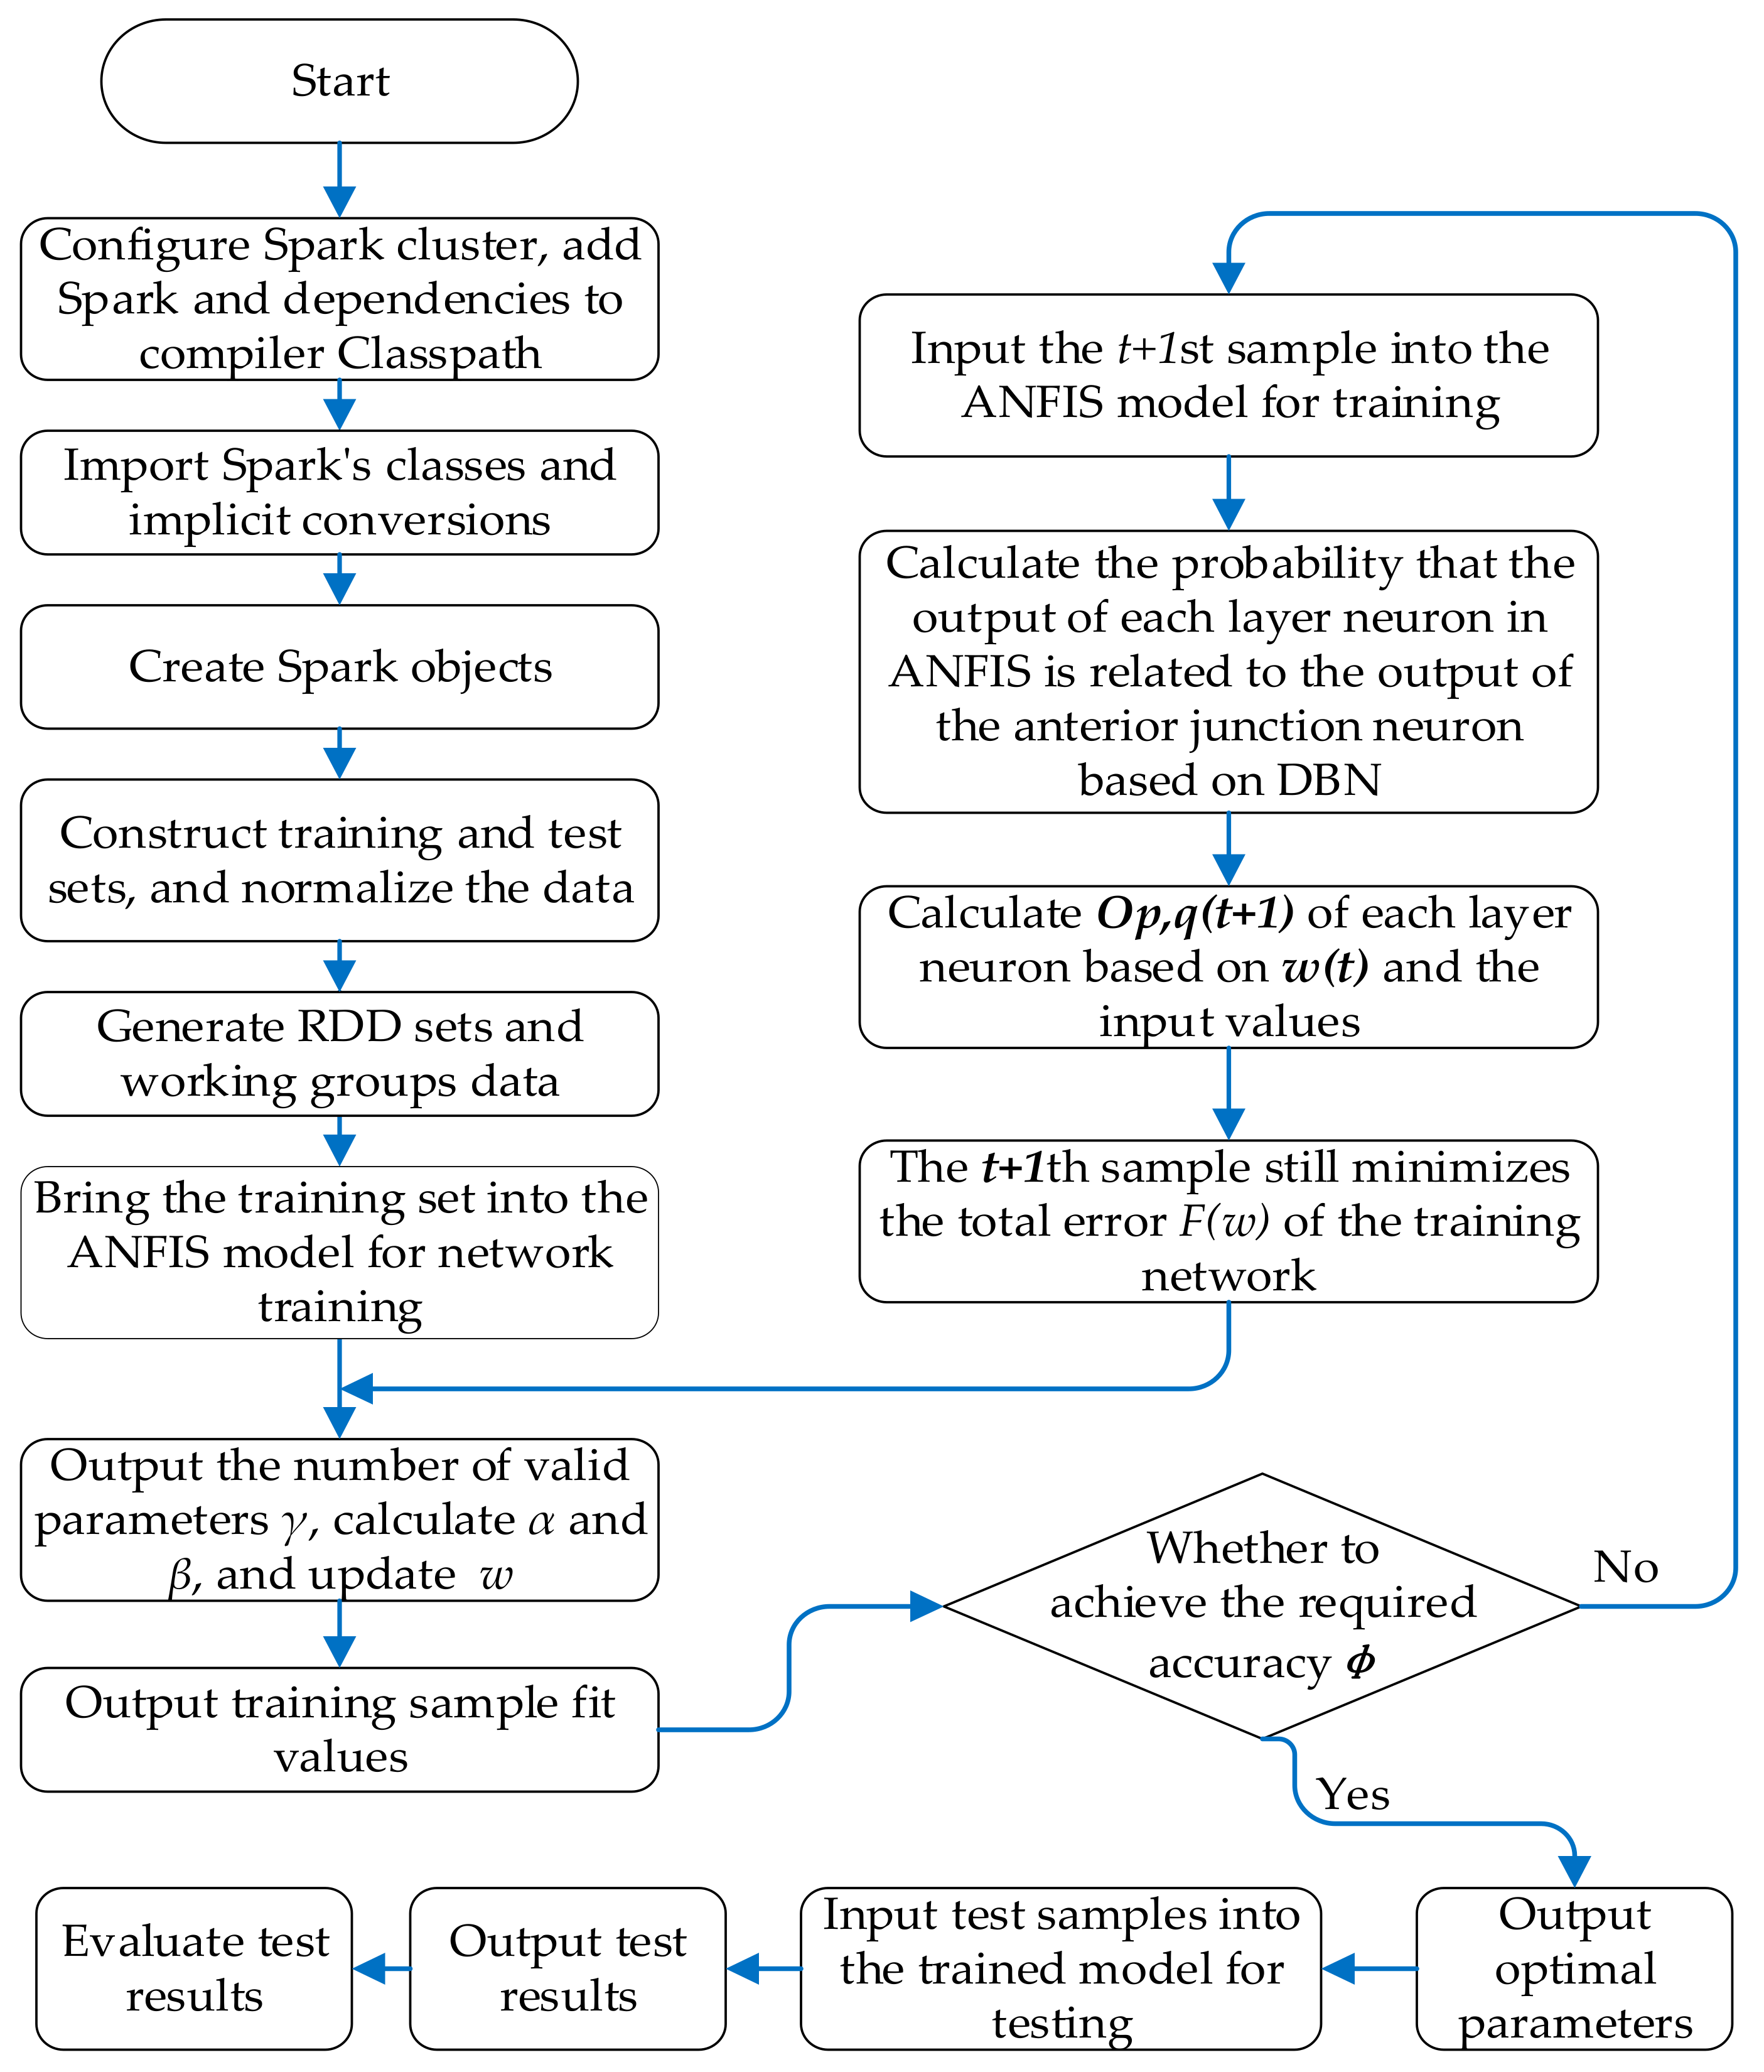
In general, the green campus construction and operation status covariates from the perspective of sustainable development change over time, and the index data have dynamic changes. If the covariates with large data volume are directly input into the DBN-ANFIS model, it will cause problems such as slow operation efficiency of the assessment model and inaccurate status assessment. Therefore, for the assessment work of green campus with large data volume, the DBN-ANFIS model constructed in this paper is placed on Spark big data platform to run [28], in order to improve the processing efficiency and model accuracy of the data. The computational flow of the DBN-ANFIS green campus assessment model based on the Spark big data platform is shown in Figure 10. According to Figure 10, the general steps of the green campus assessment model using DBN-ANFIS are illustrated as follows:
Step 1: Parameter initialization operation. Given N sets of sample inputs , where n is the number of evaluation indicators, the corresponding output for each set of samples is , where indicates the evaluation value of green campus, is the evaluation grade and , and is the color marker and . Initialize the hyperparameters , ; initialize the network weights according to the prior distribution; choose Gaussian function as the affiliation function, and set the training number as .
Step 2: The th (initial value of is taken as 0) sample is input to the ANFIS model layer by layer, the network is trained to minimize the total error , and the number of valid parameters is calculated. The hyperparameters at the time are obtained with Equations (7) and (8), and the network weights are updated according to the current hyperparameters.
Step 3: The (t + 1)th sample input is fed into ANFIS layer by layer. At this moment, it should be noted that the output of each layer neuron is not only related to the input at the current moment, but also closely related to the output of the previous neuron of the tth sample, namely , where p is the number of layers, q is the number of neurons in the qth layer, and u is the number of neurons in the (q − 1)th layer. The probability of each neuron in each layer with the neuron associated with the previous layer is calculated according to DBN, and the output of the current neuron is calculated utilizing the internal activation function with the updated weights. The hyperparameter sum is obtained and the network weights are updated.
Step 4: Determine whether the termination condition is reached. If the condition is not reached, input the next set of samples to continue training the network in a loop. If the termination condition is reached, the loop is jumped out and the optimal hyperparameters are obtained.
Step 5: Bring the test data into the trained network model and obtain the corresponding output. The evaluation level is determined according to the green campus evaluation value, and the corresponding improvement plan is formulated and adopted.
4. Simulation Analysis
In this study, 1000 schools were selected for the validation and analysis of the DBN-ANFIS model. Data from 850 of these schools were randomly selected as training samples, and data from the remaining 150 schools were used as test samples. Based on the construction of the green campus sustainability evaluation index system, each index was further analyzed and the scores corresponding to each grade of the evaluation index are shown in Table 1. Through research and data collection in the field, the relevant data of the sample schools were collected and organized, while 15 experts were invited to score the indicators according to Table 1, and then these scores were summarized and averaged to obtain the data of each indicator.
The original data were normalized and inputted into the DBN-ANFIS system with the following normalization formula:
where is the normalized data, is the original data, is the maximum value of the sample data, and is the minimum value of the sample data. The partially normalized data are shown in Table 2.
According to the normalized data, the range values of both input X and output Y were set to [0,1]. Under the premise of satisfying certain accuracy, only two fuzzy values are taken for each input variable, the fuzzy affiliation function was set as Gaussian function, and the set rule was 256. The error accuracy was set to , the maximum training number was 1000, and the initialization hyperparameters were and .
Table 3 displays the partial calculation results of the proposed model in this paper. Owing to the limited space, Table 3 only displays the computational results of partial test samples, and all the computational results of the test samples can be found in Section 5. It can be seen that the recognition rate of the DBN-ANFIS model for green campus evaluation level and color logo is 97.33%, and there are only four samples with wrong recognition, including one HG sample, two SG samples, and one MG sample. This indicates that the performance of the model proposed in this paper is satisfactory.
5. Discussion
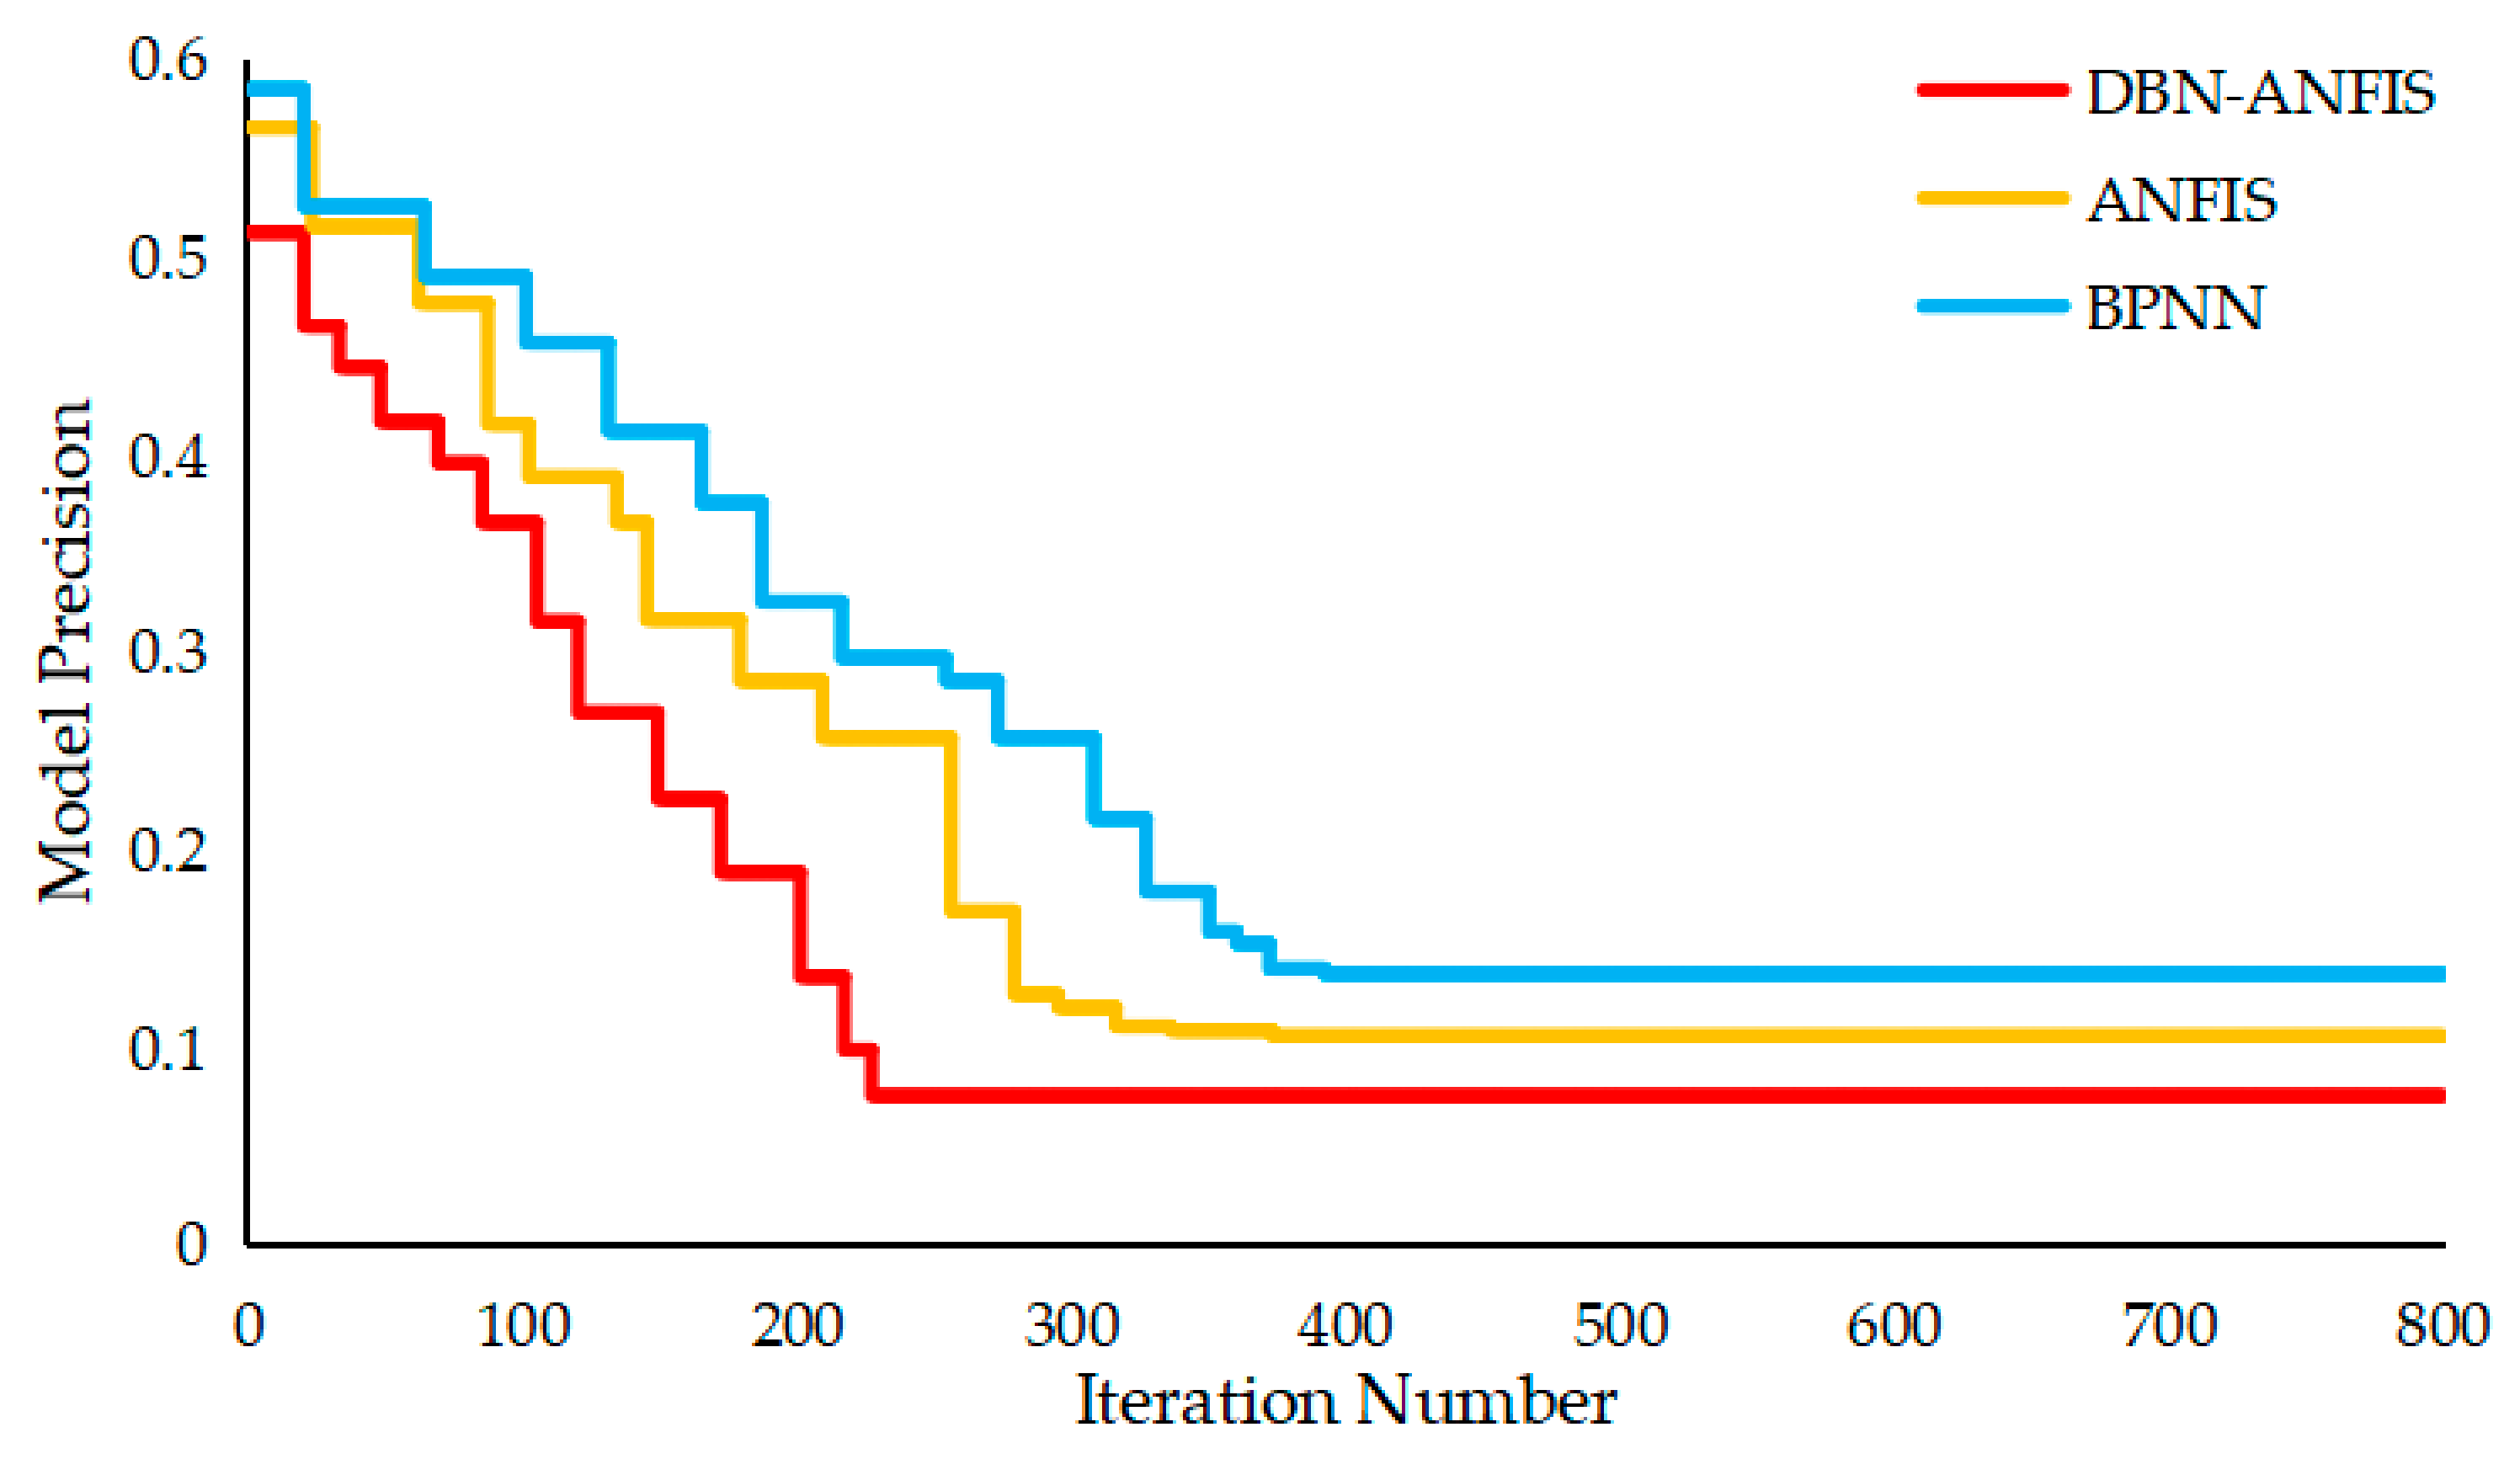
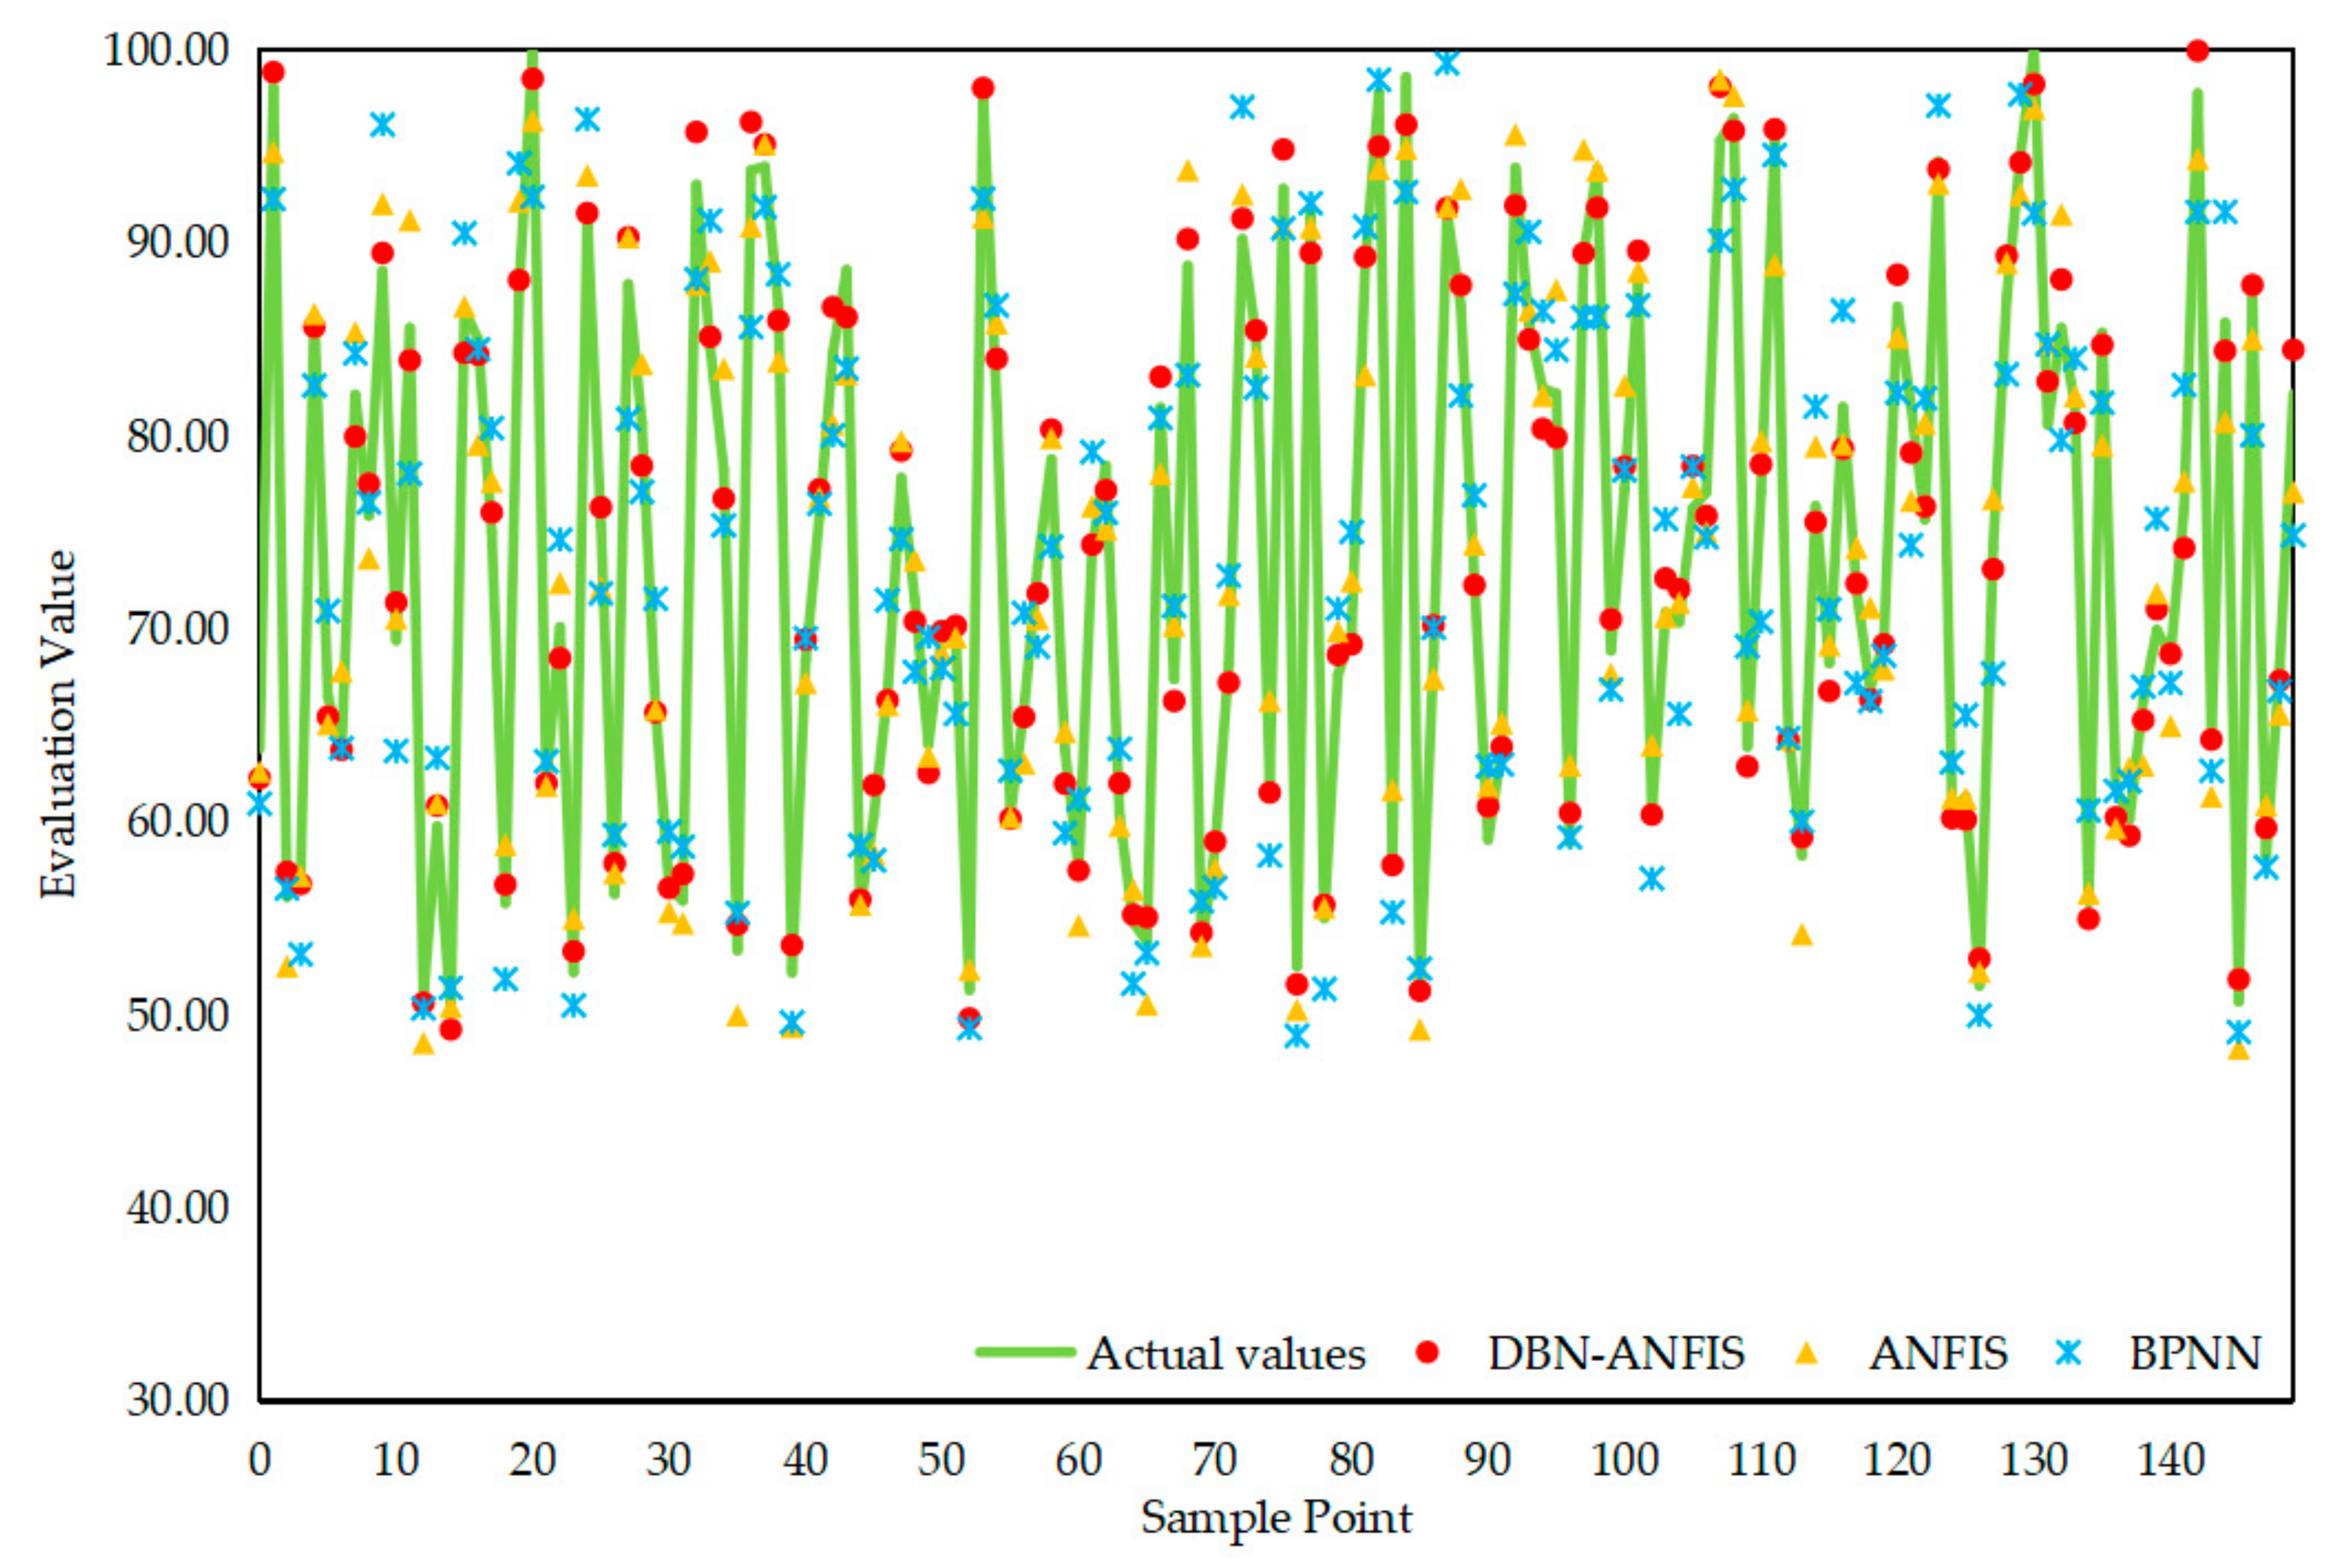
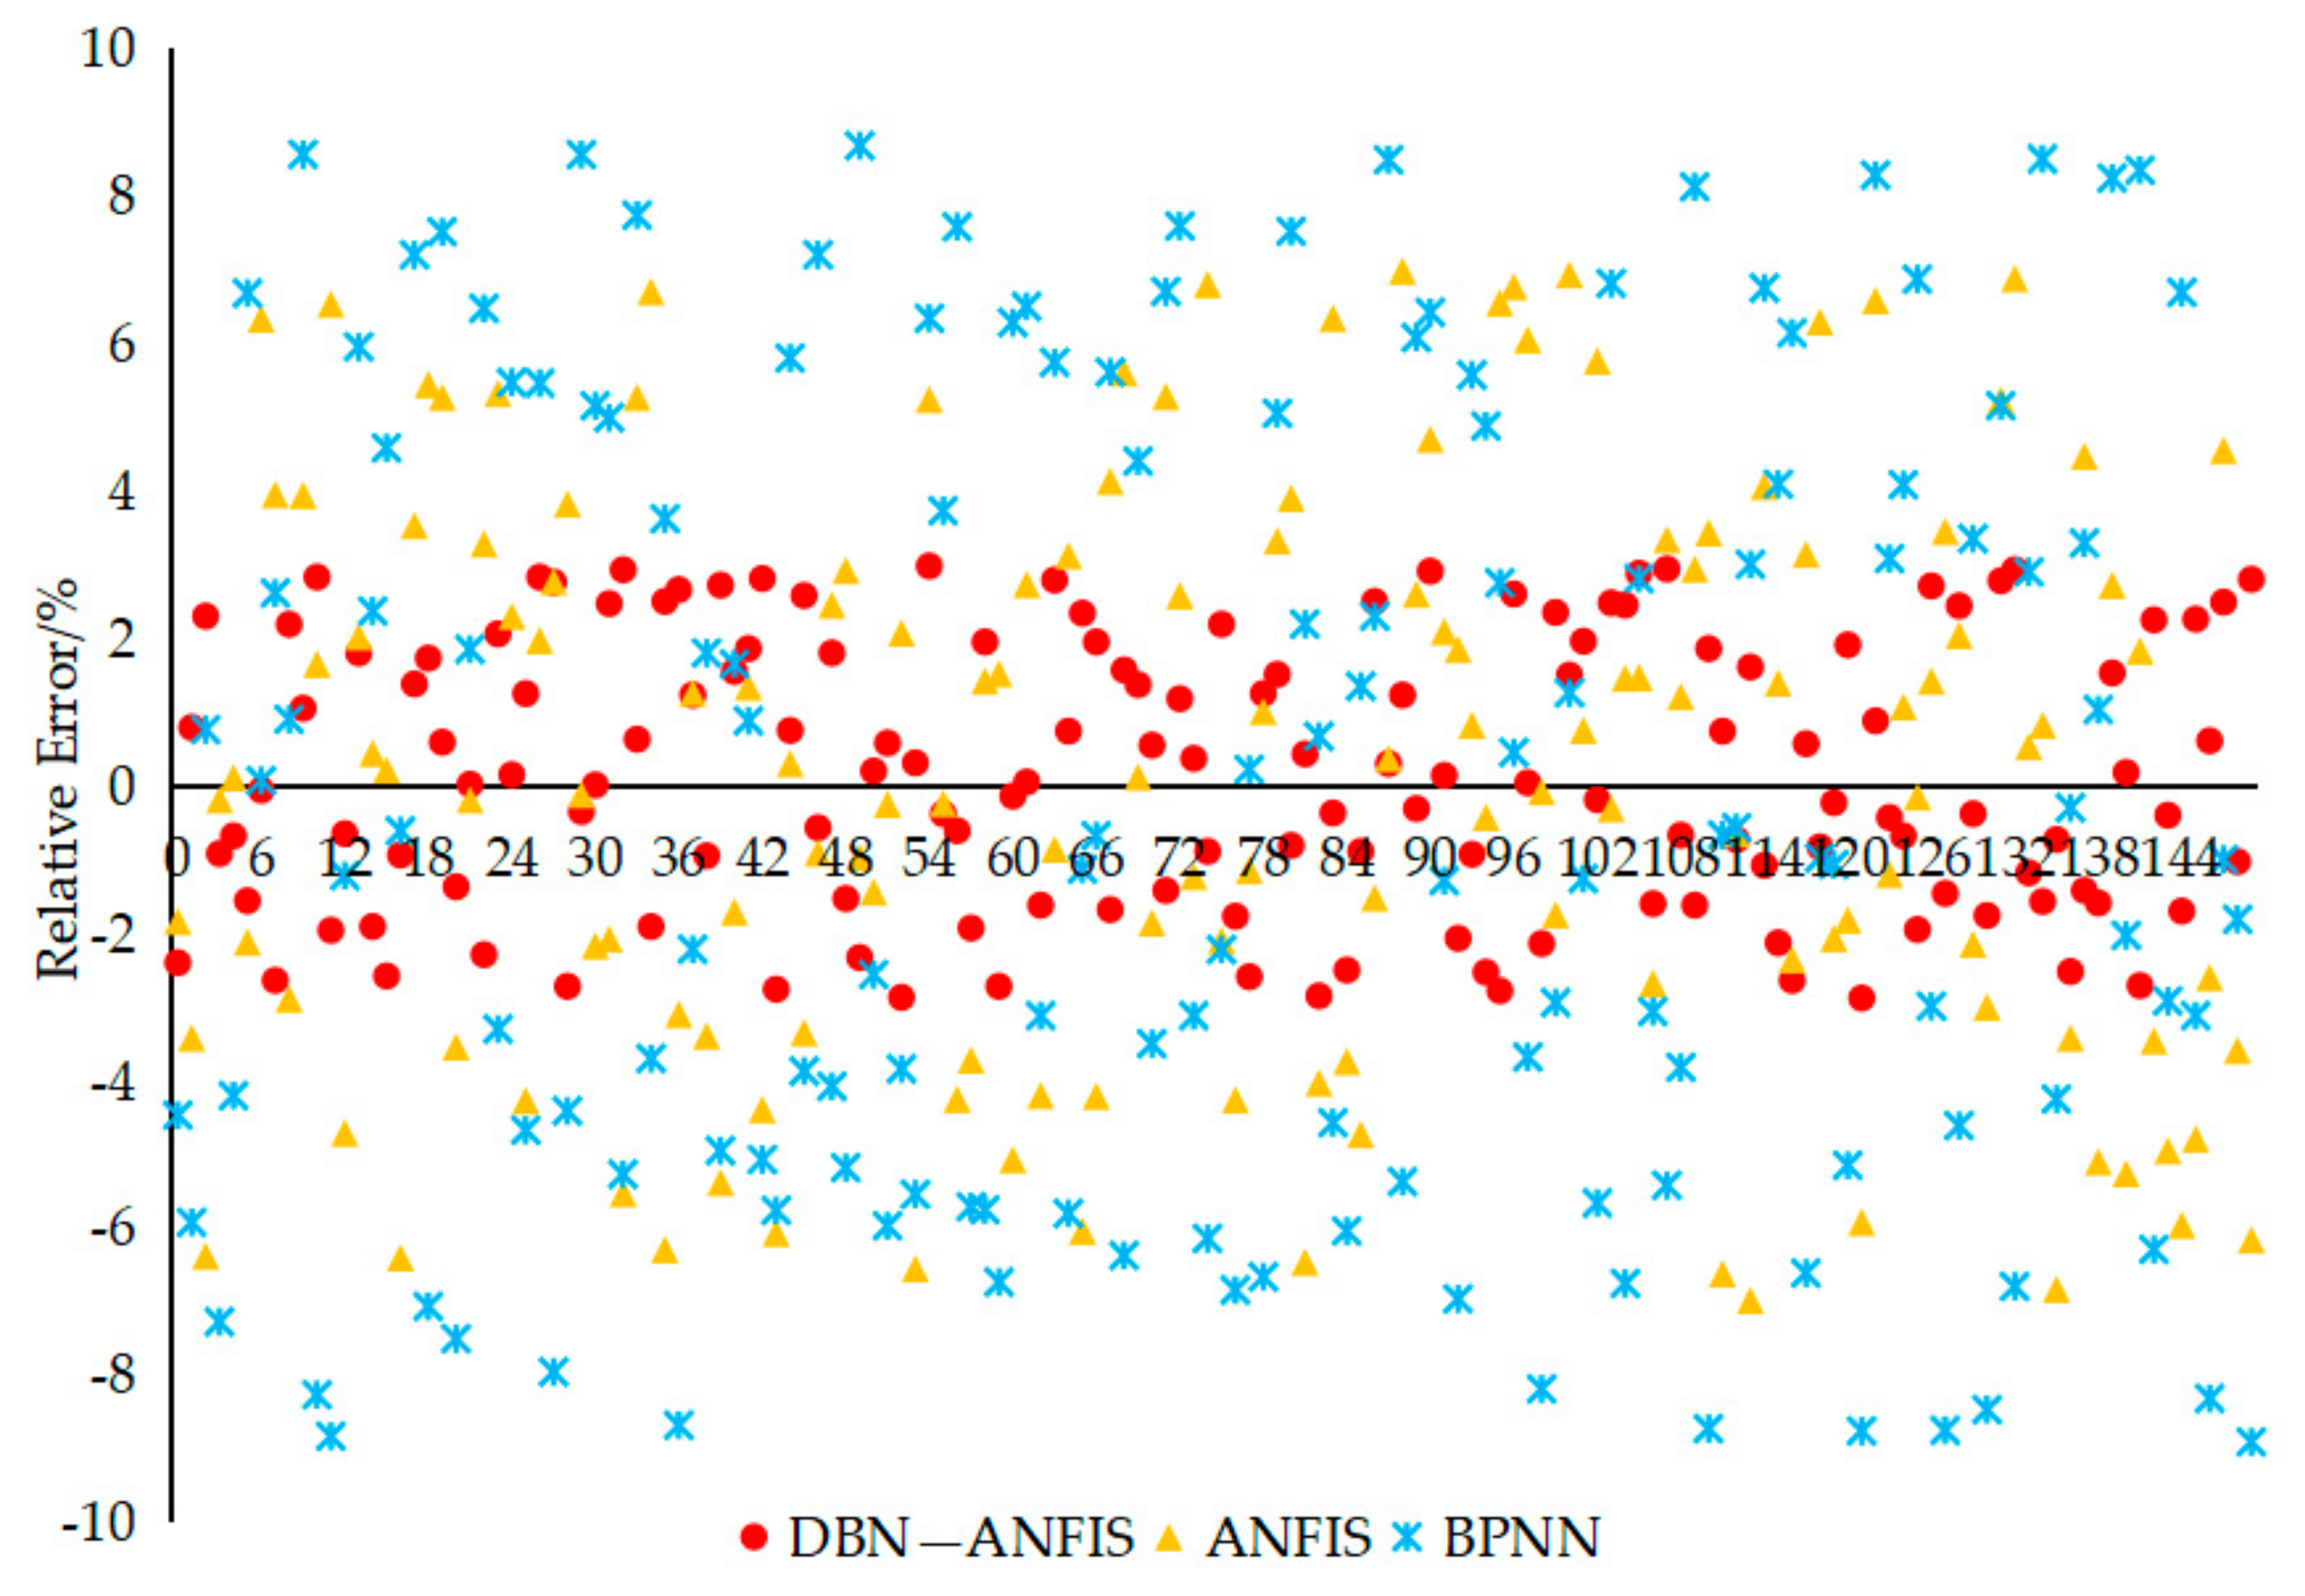
To verify the effectiveness and feasibility of the DBN-ANFIS model, it is compared with the common ANFIS model and the backpropagation neural network (BPNN) model. BPNN model is the classical artificial neural network model, so BPNN is chosen as the comparison model in this paper. The iterative effect of different intelligent models is shown in Figure 11. Figure 12 shows the comparison of the test results of different models with the actual values. Figure 13 shows the relative error plot of each intelligent model. The specific test results are given in Table 4. Due to the restricted space, Table 4 only shows the calculation results of partial test samples, and all the calculation results of the test samples can be observed in Figure 12.
As can be seen in Figure 11, the convergence times of DBN-ANFIS model, ANFIS model, and BPNN model are 229, 375, and 392, respectively, and the achieved model accuracy is 0.0769, 0.1059, and 0.1372, respectively. The convergence times and model accuracy of the DBN-ANFIS model are better than those of the ANFIS and BPNN models, indicating that the convergence speed and global search ability of DBN-ANFIS are better than those of the other two models. The improvement of DBN helps to improve the global fitting ability of the ANFIS model, which enables the algorithm to converge quickly and achieve the expected accuracy during sample training, thus enhancing the robustness of the ANFIS model.
From Figure 12, it can be seen that the gap between the DBN-ANFIS model and the actual values is much smaller than that for the ANFIS model and the BPNN model, and the degree of correlation between the test value curve and the actual value curve is higher; the accuracy for green campus assessment is higher and closer to the reality. The gap between the actual values and the test values of the ANFIS model is slightly smaller than that of the BPNN model, indicating that the ANFIS model is slightly more accurate than the BPNN model. The accuracy of the ANFIS model in green campus assessment is slightly higher than that of the BPNN model. The relative error results shown in Figure 13 also verify the above conclusion. As shown in Figure 13, the red relative error curve of the DBN-ANFIS model is closer to the horizontal axis, and the relative error fluctuation is the smallest, indicating that its overall error is smaller than the other two models. The purple relative error curve of the ANFIS model is generally slightly lower than that of the BPNN model, and the overall fluctuation of the curve is smaller than that of the BPNN, indicating that the prediction accuracy of the ANFIS model is slightly higher than that of the BPNN model, but the difference is not significant.
As shown in Table 4, the mean absolute percentage error (MAPE) of the DBN-ANFIS model is 2.66%, which is smaller than the 4.39% and 4.67% of the ANFIS and BPNN models. In addition, the mean square error (MSE) of DBN-ANFIS model is 0.16, which is also smaller than that of ANFIS model (0.72) and BPNN model (0.76). The smaller MSE value indicates that the DBN-ANFIS model has higher accuracy and stability in predicting the output values . In addition, the recognition rate of DBN-ANFIS model for green campus evaluation level and color mark was 97.33%, and the number of misidentified samples was 4, including 1 HG sample, 2 SG samples, and 1 MG sample. The recognition rate of ANFIS model was 91.33%, and the number of misidentified samples was 13, including 2 HG samples, 3 SG samples, 3 MG samples, 3 NG samples, and 2 LG samples. The recognition rate of the BPNN model was 90.67%, and the number of incorrectly identified samples was 14, including 2 HG samples, 2 SG samples, 2 MG samples, 4 NG samples, and 3 LG samples. The above data show that the DBN-ANFIS model has higher recognition accuracy than ANFIS and BPNN models for evaluation levels and color marks, especially for NG and LG levels.
In summary, this paper optimizes the ANFIS model parameters based on DBN to reduce the evaluation error. The experimental study verifies the validity and stability of the developed model. Meanwhile, the intelligent evaluation method has advantages in reducing workload, improving efficiency, and fast computation. In future research work, choosing more intelligent models to evaluate green campuses and applying the intelligent models constructed in this paper to the evaluation of other objects are important research directions for us. Furthermore, the campus life cycle assessment should be considered in the next step of the study.
6. Conclusions
This paper designs a green campus evaluation index system from the perspective of sustainable development and proposes an evaluation model based on DBN-ANFIS. First, the green campus evaluation index system is constructed from four dimensions of campus resource utilization, campus environment creation, campus usage management, and campus ecological benefits based on the perspective of sustainable development, and the core requirements and necessary guarantees for the sustainable development of a green campus are found. Then, this paper optimizes the parameters of the ANFIS model using DBN to establish an intelligent evaluation model based on DBN-ANFIS, and it is applied to the green campus evaluation work with the Spark big data operation platform to obtain quantitative evaluation results quickly and accurately from the perspective of modern intelligent evaluation methods. The scientificity and accuracy of the evaluation model proposed in this paper are verified through the analysis of arithmetic cases, which shows that the model proposed in this paper can not only reduce the subjectivity in the evaluation process, but also facilitate a more objective and comprehensive evaluation of the target. At the same time, it can achieve a fast and accurate evaluation. The DBN-ANFIS model has the smallest MAPE and MSE, which indicates that the intelligent evaluation model constructed in this paper has the strongest fitting and learning ability. The improvement of DBN helps to improve the global fitting ability of the ANFIS model, which enables the algorithm to converge quickly and reach the expected accuracy during sample training, thus improving the performance of the ANFIS model.
Author Contributions
Conceptualization, Y.X.; methodology, H.Z.; software, D.Z.; validation, H.Z.; formal analysis, H.Z.; investigation, H.Z.; resources, Y.X.; data curation, D.Z.; writing—original draft preparation, H.Z. and Y.L.; writing—review and editing, D.Z.; visualization, Y.X.; supervision, W.-C.H. All authors have read and agreed to the published version of the manuscript.
Funding
This work is supported by Natural Science Foundation of Hebei Province, China (Project No. G2020403008) and the Ministry of Education of Humanities and Social Science project, China (Project No. 17YJC630191).
Institutional Review Board Statement
Not applicable. This study did not require ethical approval.
Informed Consent Statement
Not applicable. Informed consent was obtained from all subjects involved in the study.
Data Availability Statement
Not applicable.
Conflicts of Interest
The authors declare no conflict of interest.
Abbreviations
| ANFIS | Adaptive network fuzzy inference system |
| BPNN | Backpropagation neural network |
| DBN | Dynamic Bayesian inference |
| FIS | Fuzzy inference system |
| LEED | Leadership in energy and environmental design |
| MAPE | Mean absolute percentage error |
| MSE | Mean square error |
| USGBC | United States Green Building Council |
| USGBC | United States Green Building Council |
References
- González García, E.; Colomo Magaña, E.; Cívico Ariza, A. Quality Education as a Sustainable Development Goal in the Context of 2030 Agenda: Bibliometric Approach. Sustainability 2020, 12, 5884. [Google Scholar] [CrossRef]
- Gholami, H.; Bachok, M.F.; Saman, M.Z.M.; Streimikiene, D.; Sharif, S.; Zakuan, N. An ISM Approach for the Barrier Analysis in Implementing Green Campus Operations: Towards Higher Education Sustainability. Sustainability 2020, 12, 363. [Google Scholar] [CrossRef] [Green Version]
- Teah, H.S.; Yang, Q.; Onuki, M.; Teah, H.Y. Incorporating External Effects into Project Sustainability Assessments: The Case of a Green Campus Initiative Based on a Solar PV System. Sustainability 2019, 11, 5786. [Google Scholar] [CrossRef] [Green Version]
- Tiyarattanachai, R.; Hollmann, N.M. Green Campus initiative and its impacts on quality of life of stakeholders in Green and Non-Green Campus universities. Springerplus 2016, 5, 84. [Google Scholar] [CrossRef] [PubMed] [Green Version]
- Devitama, F.F.; Paramita, B.; Ardiani, N.A. Planning and Designing UPI Science and Techno Park as a Green Campus Center in Universitas Pendidikan Indonesia. IOP Conf. Ser. Earth Environ. Sci. 2020, 520, 012021. [Google Scholar] [CrossRef]
- Baj, N.R.; Majid, M.A.; Anwar, S. Green Campus Governance for Promoting Sustainable Development in Institutions of Higher Learning-Evidence from a Theoretical Analysis. World Rev. Sci. Technol. Sustain. Dev. 2020, 16, 141–168. [Google Scholar]
- Clements, J.S. Acoustical design of schools on military bases: Meeting the needs of DoDEA’s 21st century school Initiative and LEED acoustical requirements. J. Acoust. Soc. Am. 2015, 137, 2392. [Google Scholar] [CrossRef]
- Doggett, F.M. Classroom acoustics in a Leadership in Energy and Environmental Design (LEED) certified school. J. Acoust. Soc. Am. 2004, 116, 2585. [Google Scholar] [CrossRef]
- Good Company. Sustainability Assessment of Vassar College: Detailed Findings; Good Company: Eugene, OR, USA, 2003; pp. 4–26. [Google Scholar]
- Reid, A.; Petocz, P. University Lecturers’ Understanding of Sustainability. High. Educ. 2006, 51, 105–123. [Google Scholar] [CrossRef]
- Liu, S.; Xu, W.; Yan, X.; Zhu, Z. Research on the Construction Strategy of University Teaching Space on the Evaluation Standard of Green Campus—Take a University in Wuhan as an Example. Archit. Cult. 2019, 189, 108–110. [Google Scholar]
- Liao, L.; Chen, B.; Zou, F.; Li, S.E.; Liu, J.; Wu, X.; Dong, N. Hierarchical quantitative analysis to evaluate unsafe driving behavior from massive trajectory data. IET Intell. Transp. Syst. 2020, 14, 849–856. [Google Scholar] [CrossRef]
- Wu, Y.; Zhang, T. Risk Assessment of Offshore Wave-Wind-Solar-Compressed Air Energy Storage Power Plant through Fuzzy Comprehensive Evaluation Model. Energy 2021, 223, 120057. [Google Scholar] [CrossRef]
- Altintas, K.; Vayvay, O.; Apak, S.; Cobanoglu, E. An Extended GRA Method Integrated with Fuzzy AHP to Construct a Multidimensional Index for Ranking Overall Energy Sustainability Performances. Sustainability 2020, 12, 1602. [Google Scholar] [CrossRef] [Green Version]
- Chizhkov, V.P.; Boitsov, V.N. Method for performing a single act of the reversible separation of ideal solution components. Russ. J. Phys. Chem. 2017, 91, 1127–1131. [Google Scholar] [CrossRef]
- Liang, Y.; Niu, D.; Hong, W.-C. Short Term Load Forecasting Based on Feature Extraction and Improved General Regression Neural Network model. Energy 2019, 166, 653–663. [Google Scholar] [CrossRef]
- Wang, Z.; Zhang, Z.; Chen, X.; Jin, X. An Optimization Method of Precision Assembly Process Based on the Relative Entropy Evaluation of the Stress Distribution. Entropy 2020, 22, 137. [Google Scholar] [CrossRef] [Green Version]
- Liang, Y.; Niu, D.; Cao, Y.; Hong, W.C. Analysis and modeling for China’s electricity demand forecasting using a hybrid method based on multiple regression and extreme learning machine: A view from carbon emission. Energies 2016, 9, 941. [Google Scholar] [CrossRef] [Green Version]
- Wang, S.; Zhang, S.; Wu, T.; Duan, Y.; Zhou, L.; Lei, H. FMDBN: A first-order Markov dynamic Bayesian network classifier with continuous attributes. Knowl. Based Syst. 2020, 195, 105638. [Google Scholar] [CrossRef]
- Subhrajit, S.; Pratama, M.; Suresh, S. Bayesian Neuro-Fuzzy Inference System (BaNFIS) for Temporal Dependency Estimation. IEEE Trans. Fuzzy Syst. 2020, 99, 1. [Google Scholar] [CrossRef]
- Xu, P.; Babanezhad, M.; Yarmand, H.; Marjani, A. Flow visualization and analysis of thermal distribution for the nanofluid by the integration of fuzzy c-means clustering ANFIS structure and CFD methods. J. Vis. 2020, 23, 97–110. [Google Scholar] [CrossRef]
- Azar, E.; Al Ansari, H. Framework to investigate energy conservation motivation and actions of building occupants: The case of a green campus in Abu Dhabi, UAE. Appl. Energy 2017, 190, 563–573. [Google Scholar] [CrossRef]
- Wu, P.; Song, Y.; Shou, W.; Chi, H.; Chong, H.Y.; Sutrisna, M. A comprehensive analysis of the credits obtained by LEED 2009 certified green buildings. Renew. Sustain. Energy Rev. 2017, 68, 370–379. [Google Scholar] [CrossRef]
- Zhu, B.; Dewancker, B. A case study on the suitability of STARS for green campus in China. Eval. Program Plan. 2021, 84, 101893. [Google Scholar] [CrossRef]
- Yang, S.; Choi, J.W.; Singer, A.C. A Bayesian dynamic time warping approach for nonuniform Doppler paths in acoustic multipath channel. J. Acoust. Soc. Am. 2020, 148, 2625. [Google Scholar] [CrossRef]
- Cai, B.; Shao, X.; Liu, Y.; Kong, X.; Wang, H.; Xu, H.; Ge, W. Remaining Useful Life Estimation of Structure Systems Under the Influence of Multiple Causes: Subsea Pipelines as a Case Study. IEEE Trans. Ind. Electron. 2020, 67, 5737–5747. [Google Scholar] [CrossRef]
- Dashti, A.; Mazaheri, O.; Amirkhani, F.; Mohammadi, A.H. Molecular descriptors-based models for estimating net heat of combustion of chemical compounds. Energy 2021, 217, 119292. [Google Scholar] [CrossRef]
- Qiao, B.; Hu, B.; Zhu, J.; Wu, G.; Giraud-Carrier, C.; Wang, G. A top-k spatial join querying processing algorithm based on spark. Inf. Syst. 2020, 87, 101419.1–101419.11. [Google Scholar] [CrossRef]
Figure 1.
Campus resource utilization indicators.

Figure 2.
Campus environment creation indicators.

Figure 3.
Campus usage management indicators.

Figure 4.
Campus eco-efficiency indicators.

Figure 5.
The Bayesian structure.

Figure 6.
The dynamic Bayesian structure.

Figure 7.
The extended dynamic Bayesian structure.

Figure 8.
The basic structure for ANFIS.

Figure 9.
The schematic diagram for dynamic Bayesian ANFIS.

Figure 10.
The process of green campus evaluation based on DBN-ANFIS.

Figure 11.
The convergence curve for each model.

Figure 12.
The comparison between actual values and testing values of each model.

Figure 13.
The comparison chart of relative errors of each model.


Table 1.
The evaluation grade of each index.
| Index | Index Number | Evaluation Grade | ||||
|---|---|---|---|---|---|---|
| HG | SG | MG | NG | LG | ||
| Land resource utilization | x1 | (90, 100] | (80, 90] | (60, 80] | (50, 60] | [0, 50] |
| Water resource utilization | x2 | (90, 100] | (80, 90] | (60, 80] | (50, 60] | [0, 50] |
| Building energy saving | x3 | (90, 100] | (80, 90] | (60, 80] | (50, 60] | [0, 50] |
| Equipment energy saving | x4 | (90, 100] | (80, 90] | (60, 80] | (50, 60] | [0, 50] |
| Renewable energy utilization | x5 | (90, 100] | (80, 90] | (60, 80] | (50, 60] | [0, 50] |
| Decoration material utilization | x6 | (90, 100] | (80, 90] | (60, 80] | (50, 60] | [0, 50] |
| Campus activity material use | x7 | (90, 100] | (80, 90] | (60, 80] | (50, 60] | [0, 50] |
| Indoor light environment quality | x8 | (90, 100] | (80, 90] | (60, 80] | (50, 60] | [0, 50] |
| Indoor thermal comfort | x9 | (90, 100] | (80, 90] | (60, 80] | (50, 60] | [0, 50] |
| Indoor air quality | x10 | (90, 100] | (80, 90] | (60, 80] | (50, 60] | [0, 50] |
| Outdoor sound environment quality | x11 | (90, 100] | (80, 90] | (60, 80] | (50, 60] | [0, 50] |
| Campus green environment quality | x12 | (90, 100] | (80, 90] | (60, 80] | (50, 60] | [0, 50] |
| Campus cleaning quality | x13 | (90, 100] | (80, 90] | (60, 80] | (50, 60] | [0, 50] |
| The use of teaching facilities | x14 | (90, 100] | (80, 90] | (60, 80] | (50, 60] | [0, 50] |
| The use of intelligent systems | x15 | (90, 100] | (80, 90] | (60, 80] | (50, 60] | [0, 50] |
| The use of infrastructure in the main functional areas of the campus | x16 | (90, 100] | (80, 90] | (60, 80] | (50, 60] | [0, 50] |
| The use of infrastructure in the other functional areas of the campus | x17 | (90, 100] | (80, 90] | (60, 80] | (50, 60] | [0, 50] |
| The use of safety, traffic, and fire safety facilities | x18 | (90, 100] | (80, 90] | (60, 80] | (50, 60] | [0, 50] |
| The qualification of fire management | x19 | (90, 100] | (80, 90] | (60, 80] | (50, 60] | [0, 50] |
| The management system of the school | x20 | (90, 100] | (80, 90] | (60, 80] | (50, 60] | [0, 50] |
| Incremental income of green campus operation | x21 | (90, 100] | (80, 90] | (60, 80] | (50, 60] | [0, 50] |
| Campus image and regional cultural benefits | x22 | (90, 100] | (80, 90] | (60, 80] | (50, 60] | [0, 50] |
| Sustainable promotion of green campus | x23 | (90, 100] | (80, 90] | (60, 80] | (50, 60] | [0, 50] |
| Campus renewal and social participation | x24 | (90, 100] | (80, 90] | (60, 80] | (50, 60] | [0, 50] |
Table 2.
Partial standardized data for green campus assessment.
| Index Number | S1 | S2 | S3 | … | S500 | S501 | S503 | … | S998 | S999 | S1000 |
|---|---|---|---|---|---|---|---|---|---|---|---|
| x1 | 0.8636 | 0.5455 | 0.5000 | … | 0.6364 | 0.7273 | 0.3636 | … | 0.7727 | 0.3182 | 0.4545 |
| x2 | 0.8182 | 0.8182 | 1.0000 | 0.2727 | 0.3182 | 0.6364 | 0.2273 | 1.0000 | 0.1364 | ||
| x3 | 0.9565 | 0.3043 | 0.9130 | 0.5217 | 1.0000 | 1.0000 | 1.0000 | 0.5652 | 0.7391 | ||
| x4 | 0.2917 | 0.6667 | 0.1250 | 0.2083 | 0.7500 | 0.3333 | 1.0000 | 1.0000 | 0.1250 | ||
| x5 | 0.3659 | 0.1220 | 0.1707 | 0.5122 | 0.6585 | 0.8537 | 0.6585 | 0.5610 | 0.0732 | ||
| x6 | 0.9600 | 0.6000 | 0.2000 | 0.5600 | 0.5600 | 1.0000 | 0.0400 | 0.2000 | 0.7600 | ||
| x7 | 0.3478 | 1.0000 | 0.1739 | 1.0000 | 0.2609 | 0.5217 | 0.8696 | 1.0000 | 0.7391 | ||
| x8 | 1.0000 | 0.3750 | 0.0833 | 0.0833 | 0.5833 | 1.0000 | 0.7500 | 0.5417 | 1.0000 | ||
| x9 | 0.4400 | 1.0000 | 0.6000 | … | 0.8400 | 0.2800 | 0.2000 | … | 0.0800 | 0.0800 | 0.0800 |
| x10 | 0.5385 | 0.8462 | 0.2821 | 1.0000 | 0.4872 | 0.1282 | 0.6410 | 0.5897 | 1.0000 | ||
| x11 | 0.2500 | 0.5833 | 1.0000 | 1.0000 | 0.8333 | 0.7917 | 0.6250 | 0.9167 | 0.5833 | ||
| x12 | 0.6923 | 0.5385 | 0.9487 | 0.4872 | 0.4359 | 0.6923 | 0.6410 | 0.2308 | 1.0000 | ||
| x13 | 0.4419 | 0.8605 | 0.0698 | 1.0000 | 0.5814 | 0.4419 | 0.7209 | 0.2558 | 0.0233 | ||
| x14 | 0.3000 | 0.4000 | 1.0000 | 0.5000 | 0.2000 | 0.3000 | 0.2500 | 1.0000 | 0.3000 | ||
| x15 | 0.5909 | 0.7727 | 0.0909 | 0.7727 | 0.7273 | 0.4091 | 0.5455 | 1.0000 | 0.8182 | ||
| x16 | 0.0000 | 1.0000 | 0.8800 | 0.6400 | 0.9600 | 1.0000 | 0.7600 | 0.6400 | 0.9600 | ||
| x17 | 0.9149 | 1.0000 | 0.0213 | … | 0.5319 | 0.6596 | 0.4894 | … | 0.4894 | 0.9149 | 0.3617 |
| x18 | 0.2727 | 0.9091 | 0.1818 | 0.3182 | 0.0455 | 1.0000 | 0.6364 | 0.4091 | 0.2273 | ||
| x19 | 0.6000 | 0.9000 | 0.0500 | 0.8000 | 0.1500 | 1.0000 | 0.3000 | 1.0000 | 0.6000 | ||
| x20 | 0.1250 | 0.1667 | 0.1667 | 0.7083 | 1.0000 | 0.2917 | 0.5000 | 0.7917 | 0.2917 | ||
| x21 | 0.1837 | 0.0204 | 0.1429 | 0.9592 | 0.4286 | 0.2653 | 1.0000 | 0.2653 | 0.8776 | ||
| x22 | 1.0000 | 1.0000 | 0.8298 | 0.7021 | 0.5319 | 0.6170 | 0.2766 | 0.9149 | 1.0000 | ||
| x23 | 0.8222 | 0.0222 | 1.0000 | 0.6000 | 0.2889 | 1.0000 | 0.0222 | 0.1556 | 0.9556 | ||
| x24 | 0.3750 | 0.5833 | 0.9583 | 0.2917 | 0.1667 | 0.3750 | 0.5417 | 0.1667 | 0.6667 |
Table 3.
Partial test results of the proposed model.
| Sample | Actual Value | The Proposed Model | ||
|---|---|---|---|---|
| Test Value | Evaluation Grade | Color | ||
| 1 | 68.58 | 68.70 | MG |  |
| 2 | 76.25 | 74.18 | MG | |
| 3 | 97.73 | 99.93 | HG |  |
| 4 | 64.52 | 64.26 | MG | |
| 5 | 85.85 | 84.39 | SG |  |
| 6 | 50.70 | 51.85 | NG |  |
| 7 | 87.27 | 87.80 | SG | |
| 8 | 58.23 | 59.68 | NG | |
| 9 | 68.02 | 67.32 | MG | |
| 10 | 82.15 | 84.45 | SG | |
| Recognition rate | 97.33% | |||
| Error rate | 2.67% | |||
Table 4.
Test results of the three models.
| Sample | Actual Value | DBN-ANFIS | ANFIS | BPNN | ||||||
|---|---|---|---|---|---|---|---|---|---|---|
| Test Value | Evaluation Grade | Color | Test Value | Evaluation Grade | Color | Test Value | Evaluation Grade | Color | ||
| 1 | 68.58 | 68.70 | MG | | 64.97 | MG | | 67.19 | MG | |
| 2 | 76.25 | 74.18 | MG | | 77.65 | MG | | 82.62 | SG | |
| 3 | 97.73 | 99.93 | HG | | 94.35 | HG | | 91.58 | HG | |
| 4 | 64.52 | 64.26 | MG | | 61.33 | MG | | 62.64 | MG | |
| 5 | 85.85 | 84.39 | SG | | 80.73 | SG | | 91.59 | HG | |
| 6 | 50.70 | 51.85 | NG | | 48.27 | LG |  | 49.12 | LG | |
| 7 | 87.27 | 87.80 | SG | | 85.00 | SG | | 80.02 | SG | |
| 8 | 58.23 | 59.68 | NG | | 60.88 | MG | | 57.65 | NG | |
| 9 | 68.02 | 67.32 | MG | | 65.58 | MG | | 66.79 | MG | |
| 10 | 82.15 | 84.45 | SG | | 77.09 | MG | | 74.84 | MG | |
| MAPE | 2.66% | 4.39% | 4.67% | |||||||
| MSE | 0.16 | 0.72 | 0.76 | |||||||
| Recognition rate | 97.33% | 91.33% | 90.67% | |||||||
| Error rate | 2.67% | 8.67% | 9.33% | |||||||
Publisher’s Note: MDPI stays neutral with regard to jurisdictional claims in published maps and institutional affiliations. |
© 2021 by the authors. Licensee MDPI, Basel, Switzerland. This article is an open access article distributed under the terms and conditions of the Creative Commons Attribution (CC BY) license (https://creativecommons.org/licenses/by/4.0/).
Share and Cite
MDPI and ACS Style
Zhao, H.; Xu, Y.; Hong, W.-C.; Liang, Y.; Zou, D. Smart Evaluation of Green Campus Sustainability Considering Energy Utilization. Sustainability 2021, 13, 7653. https://0-doi-org.brum.beds.ac.uk/10.3390/su13147653
AMA Style
Zhao H, Xu Y, Hong W-C, Liang Y, Zou D. Smart Evaluation of Green Campus Sustainability Considering Energy Utilization. Sustainability. 2021; 13(14):7653. https://0-doi-org.brum.beds.ac.uk/10.3390/su13147653
Chicago/Turabian StyleZhao, Hongmei, Yang Xu, Wei-Chiang Hong, Yi Liang, and Dandan Zou. 2021. "Smart Evaluation of Green Campus Sustainability Considering Energy Utilization" Sustainability 13, no. 14: 7653. https://0-doi-org.brum.beds.ac.uk/10.3390/su13147653
Note that from the first issue of 2016, this journal uses article numbers instead of page numbers. See further details here.