1. Introduction
Recently, due to the high reliability, and the growing penetration of the distributed energy resources systems (DERS) into the power systems [
1,
2,
3], a new concept called microgrid, which attracted a variety of researchers has been introduced [
4,
5]. A microgrid which can be explained as a low-voltage network with loads and different small-scale production systems can generate the demanded heat and power of the local loads. Increasing the usage of renewable energy sources (RESS) has led to an increase in the need for lateral services i.e., spinning reserve, frequency regulation, and controlling ramp rates, which practically increase the operation cost [
6]. In this sense, it is worth mentioning that DRP is an important tool in the planning and operation of microgrids. DRP can change the electrical energy consumption from the normal pattern of consumers’ power demand following the electricity price changes at different times, or also to pay incentives for lower energy consumption in cases with the high wholesale power price or compromised system’s reliability [
7]. DRP with the ability to correct the consumption pattern can play a key role in energy supply and balance consumption and production [
8]. Therefore, considering the active and effective role of microgrids in a restructured power system, planning and optimal energy management in the new environment require extensive research and analysis. In this regard, this research addresses the optimum management of a microgrid in the presence of DERs and DRPS to reduce costs of operation and emission using the whale optimization algorithm (WOA) method. ¬The simulation findings indicate that the WOA has a high competitive ability in comparison to the existing meta-heuristic algorithms in terms of optimization answers, convergence speed, and presenting the result more sensibly. It has also been determined that the use of DRPS has a significant impact on the costs of operation and emissions. This paper is categorized as follows,
Section 2 discusses a literature review of the demand response programs in the microgrid.
Section 3 discuss the problems and objectives of the proposed algorithm. It will be followed by demand response model, optimization methods, case of study, results, and finally the conclusion.
Table 1 and
Table 2 are the list of acronyms and list of symbols respectively.
2. Literature Review
In this section, numerous studies that have been performed on the exploitation of microgrids in literature are reviewed. In [
9], modeling various types of DRPs is considered in terms of the price elasticity of demand and the idea of customer profit. Besides, the DRPs implementation effect on the operation of grid-associated microgrids is studied. Furthermore, various scenarios are provided to model the different sources of uncertainties in microgrids, i.e., generation components failure, random outages of upstream line and transmission lines, error in predicting load demand, ambiguity in producing renewable-based (solar and wind) distributed generation components, and the likelihood of not responding the customers to the arranged disruptions. The optimum operation of a microgrid in a grid-connected state has been studied in [
10]. DRPS are utilized in this work considering time-of-use (TOU), price schemes, and emergency demand response programs (EDRPs). The combined integer linear programming is utilized for simulation purposes. In [
11], a new reserve scheduling and stochastic energy management technique is provided for a microgrid considering different kinds of DRPS. In the suggested method, all kinds of commercial, industrial and residential customers can take part in DRPS including either reserve or energy scheduling.
Similarly, modeling the ambiguities associated with the RESs is performed through appropriate probability distribution functions as they are controlled by reserve offered by the distributed load and generations. Daily optimum scheduling problem of the networked microgrids regarding the intermittent nature of the load and generation is studied in the proposed energy management system (EMS) in [
12]. The optimum scheduling model, which is a combination of RTP and TOU price schemes of DRPs is solved utilizing a metaheuristic algorithm considering ambiguities of renewable energy sources and loads. Grid peak-shaving utilizing peak-time rebate structure demand response for microgrid energy administration is provided in [
13]. The highest profit for the microgrid with DRP such as manageable loads, diesel generators, and battery storage is obtained with this approach. This approach results in optimum microgrid energy management. This results in a lower cost of the main grid in comparison to other peak-shaving traditional programs. The peak-time rebate structure includes peak-time rebate incentive rewards and manageable loads demand response participation. In [
14], a microgrid with RESs and fuel/battery microturbine, via the help of the multi-purpose algorithm adaptively modified particle swarm optimization (AMPSO), has been used. In its formularization, a non-linear model was used aiming at minimizing the cost and emission of the greenhouse gases, simultaneously. In [
15], modeling an intelligent park microgrid is considered as containing photovoltaic (PV) power generation, integrated cooling/heating, and power system, responsive loads, and energy storage systems. The goal is to investigate the optimum operation approach of these components by considering the price-oriented demand reaction. In this sense, an enhanced model for the microgrid’s economic operation is made which chiefly aims at minimizing the microgrid’s operating cost and making complete utilization of clean energy regarding demand response and the distributed power generation. The genetic algorithm (GA) is used to solve this optimizing problem. Besides, the DRP and the clean energy utilization strategy determine the best solution for the best operation approach. In [
16], the authors provide a multi-objective optimization model to achieve the Pareto solutions taking into account both the emission and generation fuel costs. Nevertheless, both methods may lead to high financial and environmental costs. The concurrent arrangement of electrical vehicles and responsive loads is studied in [
17] to decrease the emission and operation cost by the existing PV and wind powers in a microgrid. The suggested technique uses the electrical vehicles for peak-shaving and modifying the load curve while employing the responsive loads to meet the reserves required for compensating the intrinsic ambiguities of PV and wind powers. Additionally, an established two-stage model is suggested in order to determine the microgrid’s anticipated operation cost. The effect of the participation level of customers in EDRP and the influence of illogical incentive values in the implementation of EDRP on the operation of the microgrid are provided in [
18]. Microgrid operation is investigated in [
19] from a technical point of view. An economic operation approach for a grid-linked microgrid is suggested in [
20] to minimize the operation cost for the operation course of 24 h ahead. In [
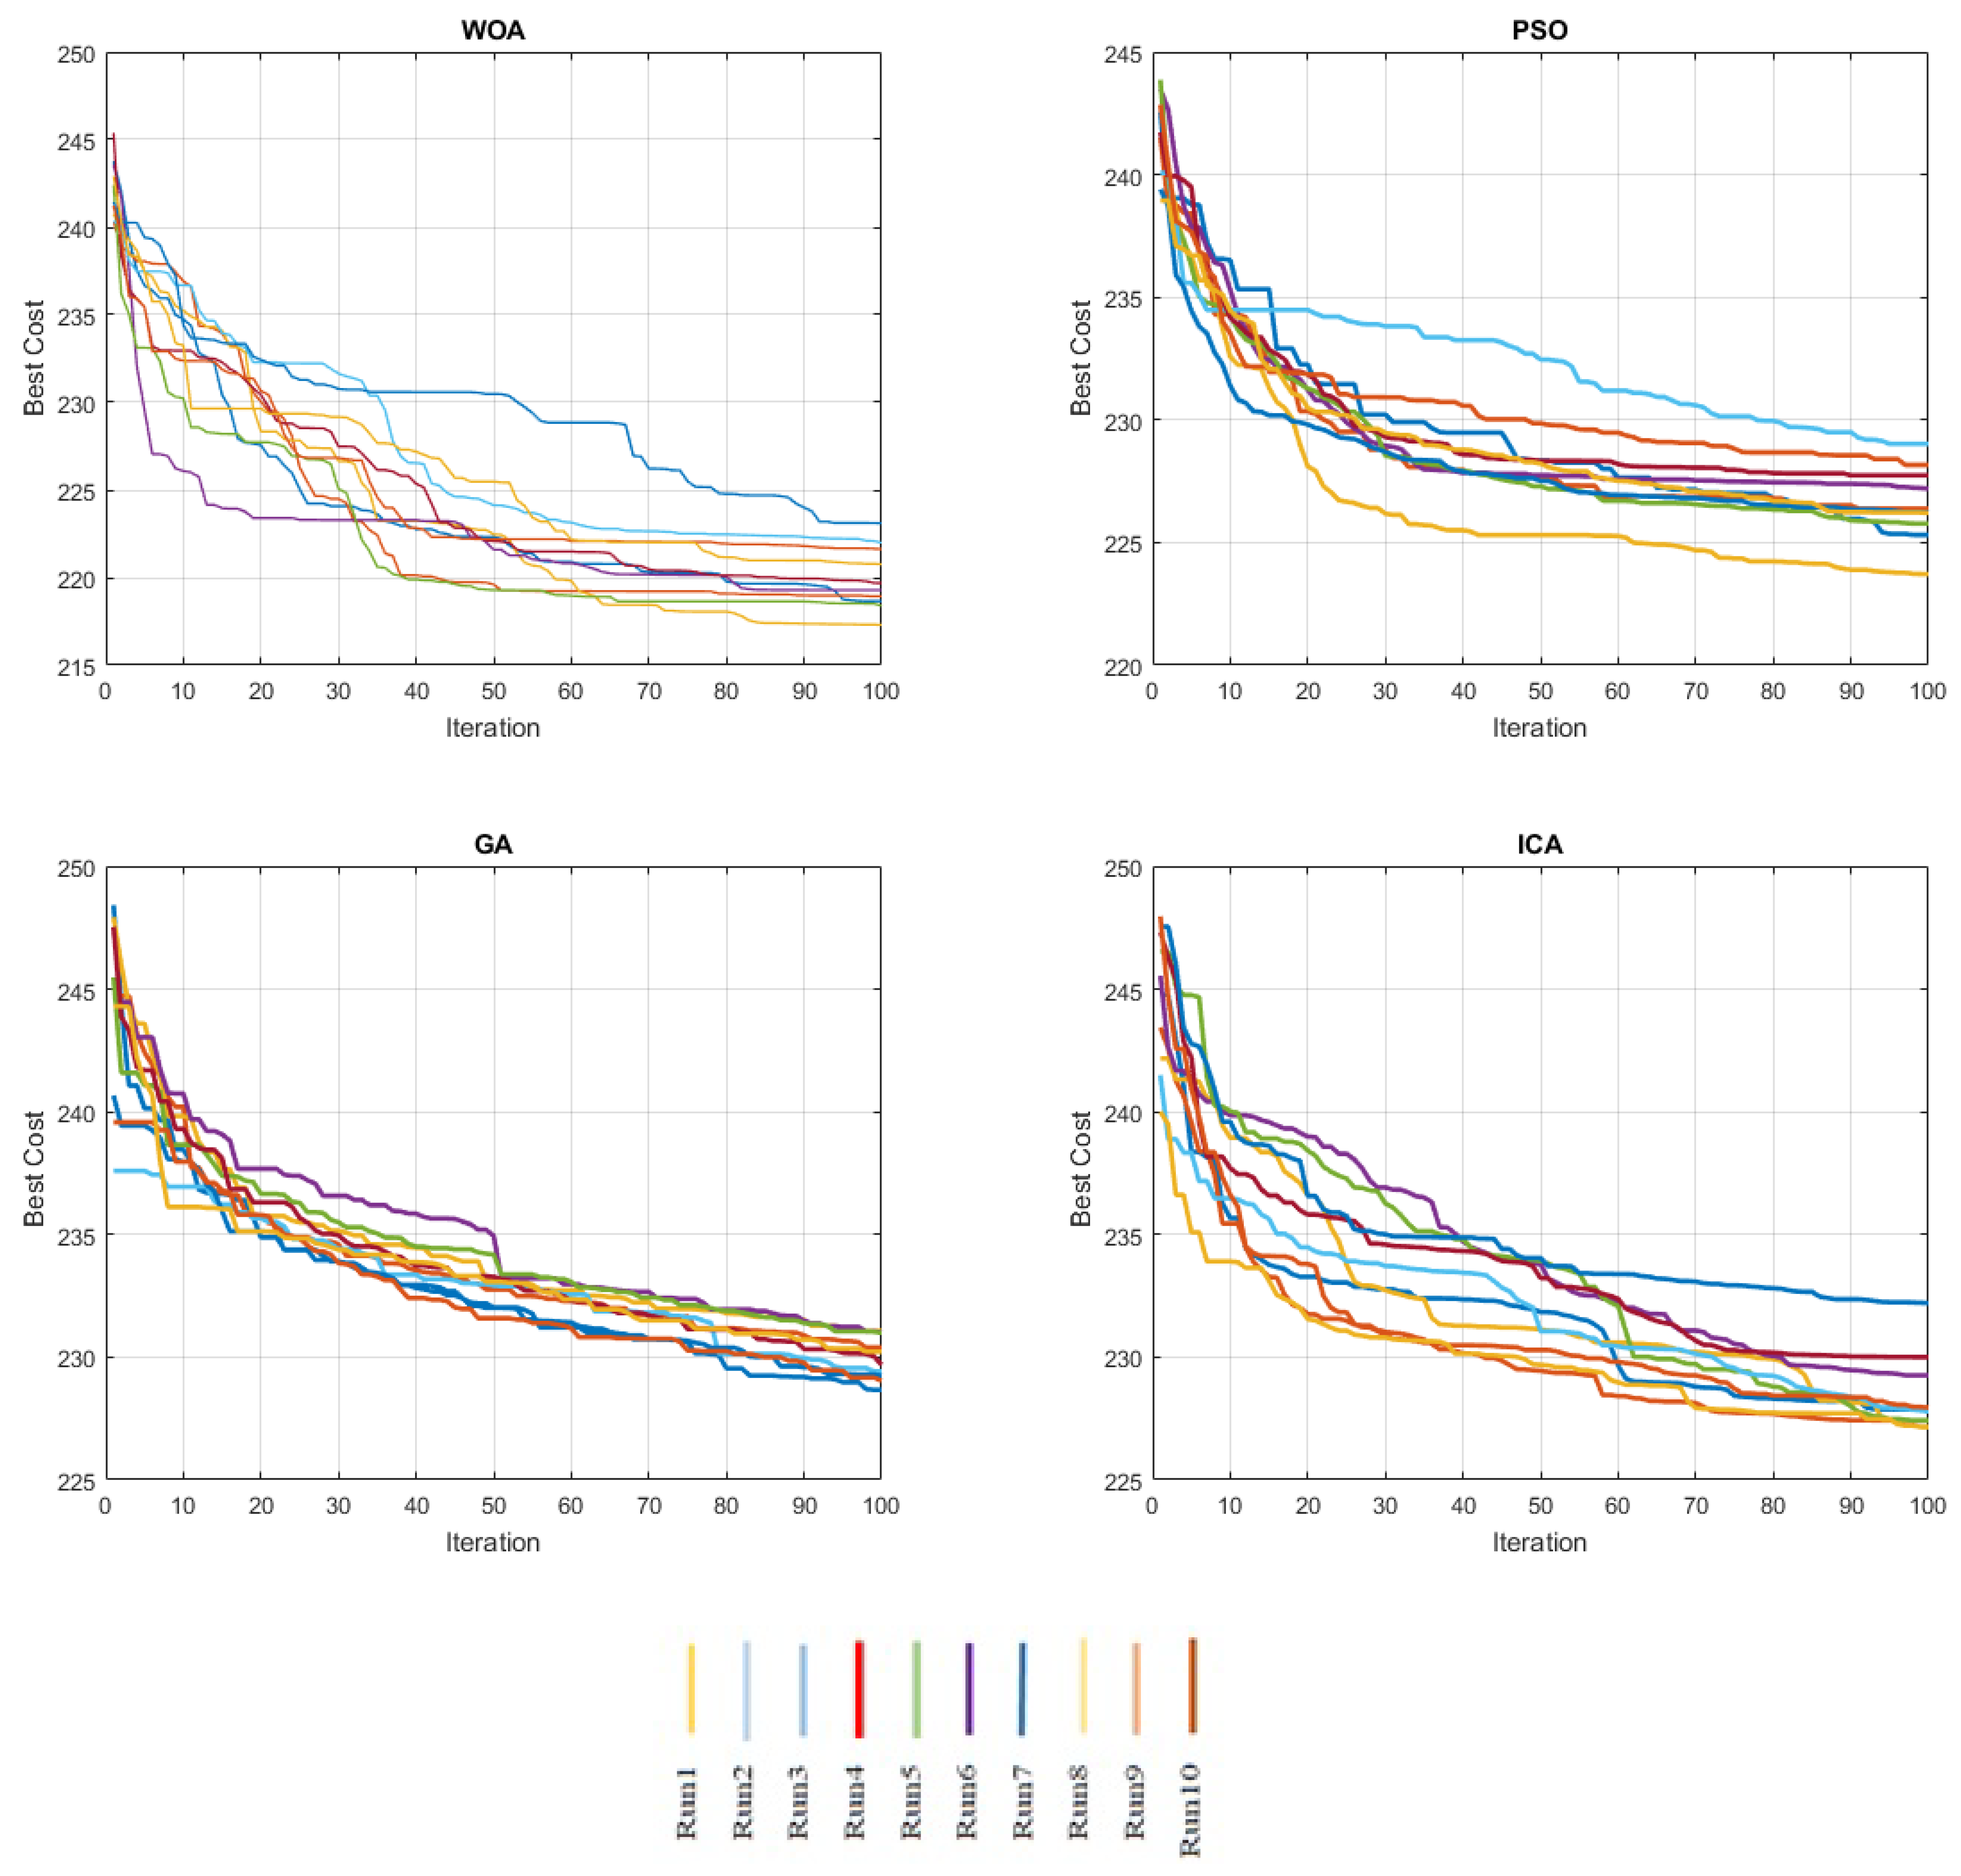
21], the optimal power is calculated requiring a generation by the units in a microgrid to minimize the entire generation cost at the consumer’s premises and enhance to minimize the entire generation cost at the consumer’s premises and enhance the system’s steady-state condition. In this paper, the scheduling optimization problem in microgrids, including operating and emissions costs, is studied while considering DRPs. Besides, technical, economic, and environmental issues of the microgrid are taken into account. The optimization problem is solved utilizing the WOA in the MATLAB environment. The results show that the WOA outperforms particle swarm optimization (PSO), imperialist competitive algorithm (ICA), and GA in solving the microgrid scheduling problem. It has also been determined that the use of DRPS has a significant impact on the costs of operation and emissions. In [
9], energy management strategies (EMS) and system optimization were reviewed for wind energy and a stand-alone photovoltaic system combined with fuel cells. By integrating the system enhancement and EMS ARE, it is not common to discourse them separately in terms of system-level design.
Hence, this study deals with a discussion on the general optimization formulation framework and the categorization and reviewing a different kind of optimizing technique.
The impact of implementing the Time-of-Use Demand Response Program (TOU-DRP) on a separated microgrid was analyzed in [
22] by taking into account various capacities of the installed wind power with and without energy storage unit. In this sense, various levels of participation of the customers in TOU-DRP, its impacts on operation cost, wind power spillage, and the unserved energy are comprehensively examined. In [
23], optimal energy setting up of a stand-alone microgrid under system ambiguities is assessed and, then, numerous operational strategies are examined to study the system performance. The suggested optimization energy management system is mainly aimed at improving the energy use efficiency and also, decreasing the system fuel cost and gas emissions decrease through designing generations of energy resources every hour for the next day. To minimize the created emission and operation costs, the system is modeled as a constrained single-objective optimization problem. The objective in [
24] is a techno-economic analysis of energy, optimal sizing as well as a cost-effective stand-alone multi-carrier microgrid. In this regard, a long-term planning approach is stated considering reliability considerations and battery degradation. Using particle swarm optimization, the optimization problem is solved. In [
25], the interconnected microgrids’ operation is concentrated. In energy management, a step-wise demand response program (DRP) is taken into account to obtain a cost-effective operation. Moreover, for the power exchange between the interconnected microgrids, a novel pricing model is presented in terms of microgrid marginal pricing. In [
26], provided a novel hybrid microgrid energy management strategy, which includes demand response and internal power market with multiple market configurations. This planning consists of interactions between incentive strategies, microgrids, and consumers. This is a stochastic linear programming technique with emission, demand cost and microgrid cost as the objective functions, where energy price, loads, wind speed and solar radiation considered as undefined factors. Microgrid system renewable energy resources economic, environmental and reliability benefits are evaluated in [
27]. This research focused on improving microgrid system green technologies benefits by minimizing annual load loss cost, cost of energy, life-cycle GHG emission cost and life-cycle cost. Operational model of microgrid consists of different generation resources connected to grid is developed in [
28]. The suggested technique is solved with set of Pareto solutions obtained using weighted sum method. ELECTRE and paired comparison matrix technique resulted in operator preferences best operation status. Hybrid AC/DC microgrids including multiple fuel options scheduling algorithm is discussed in [
29]. Particle swarm optimization multi-objective function consists of gas emission and operational cost.
6. Case Study and Simulation Results
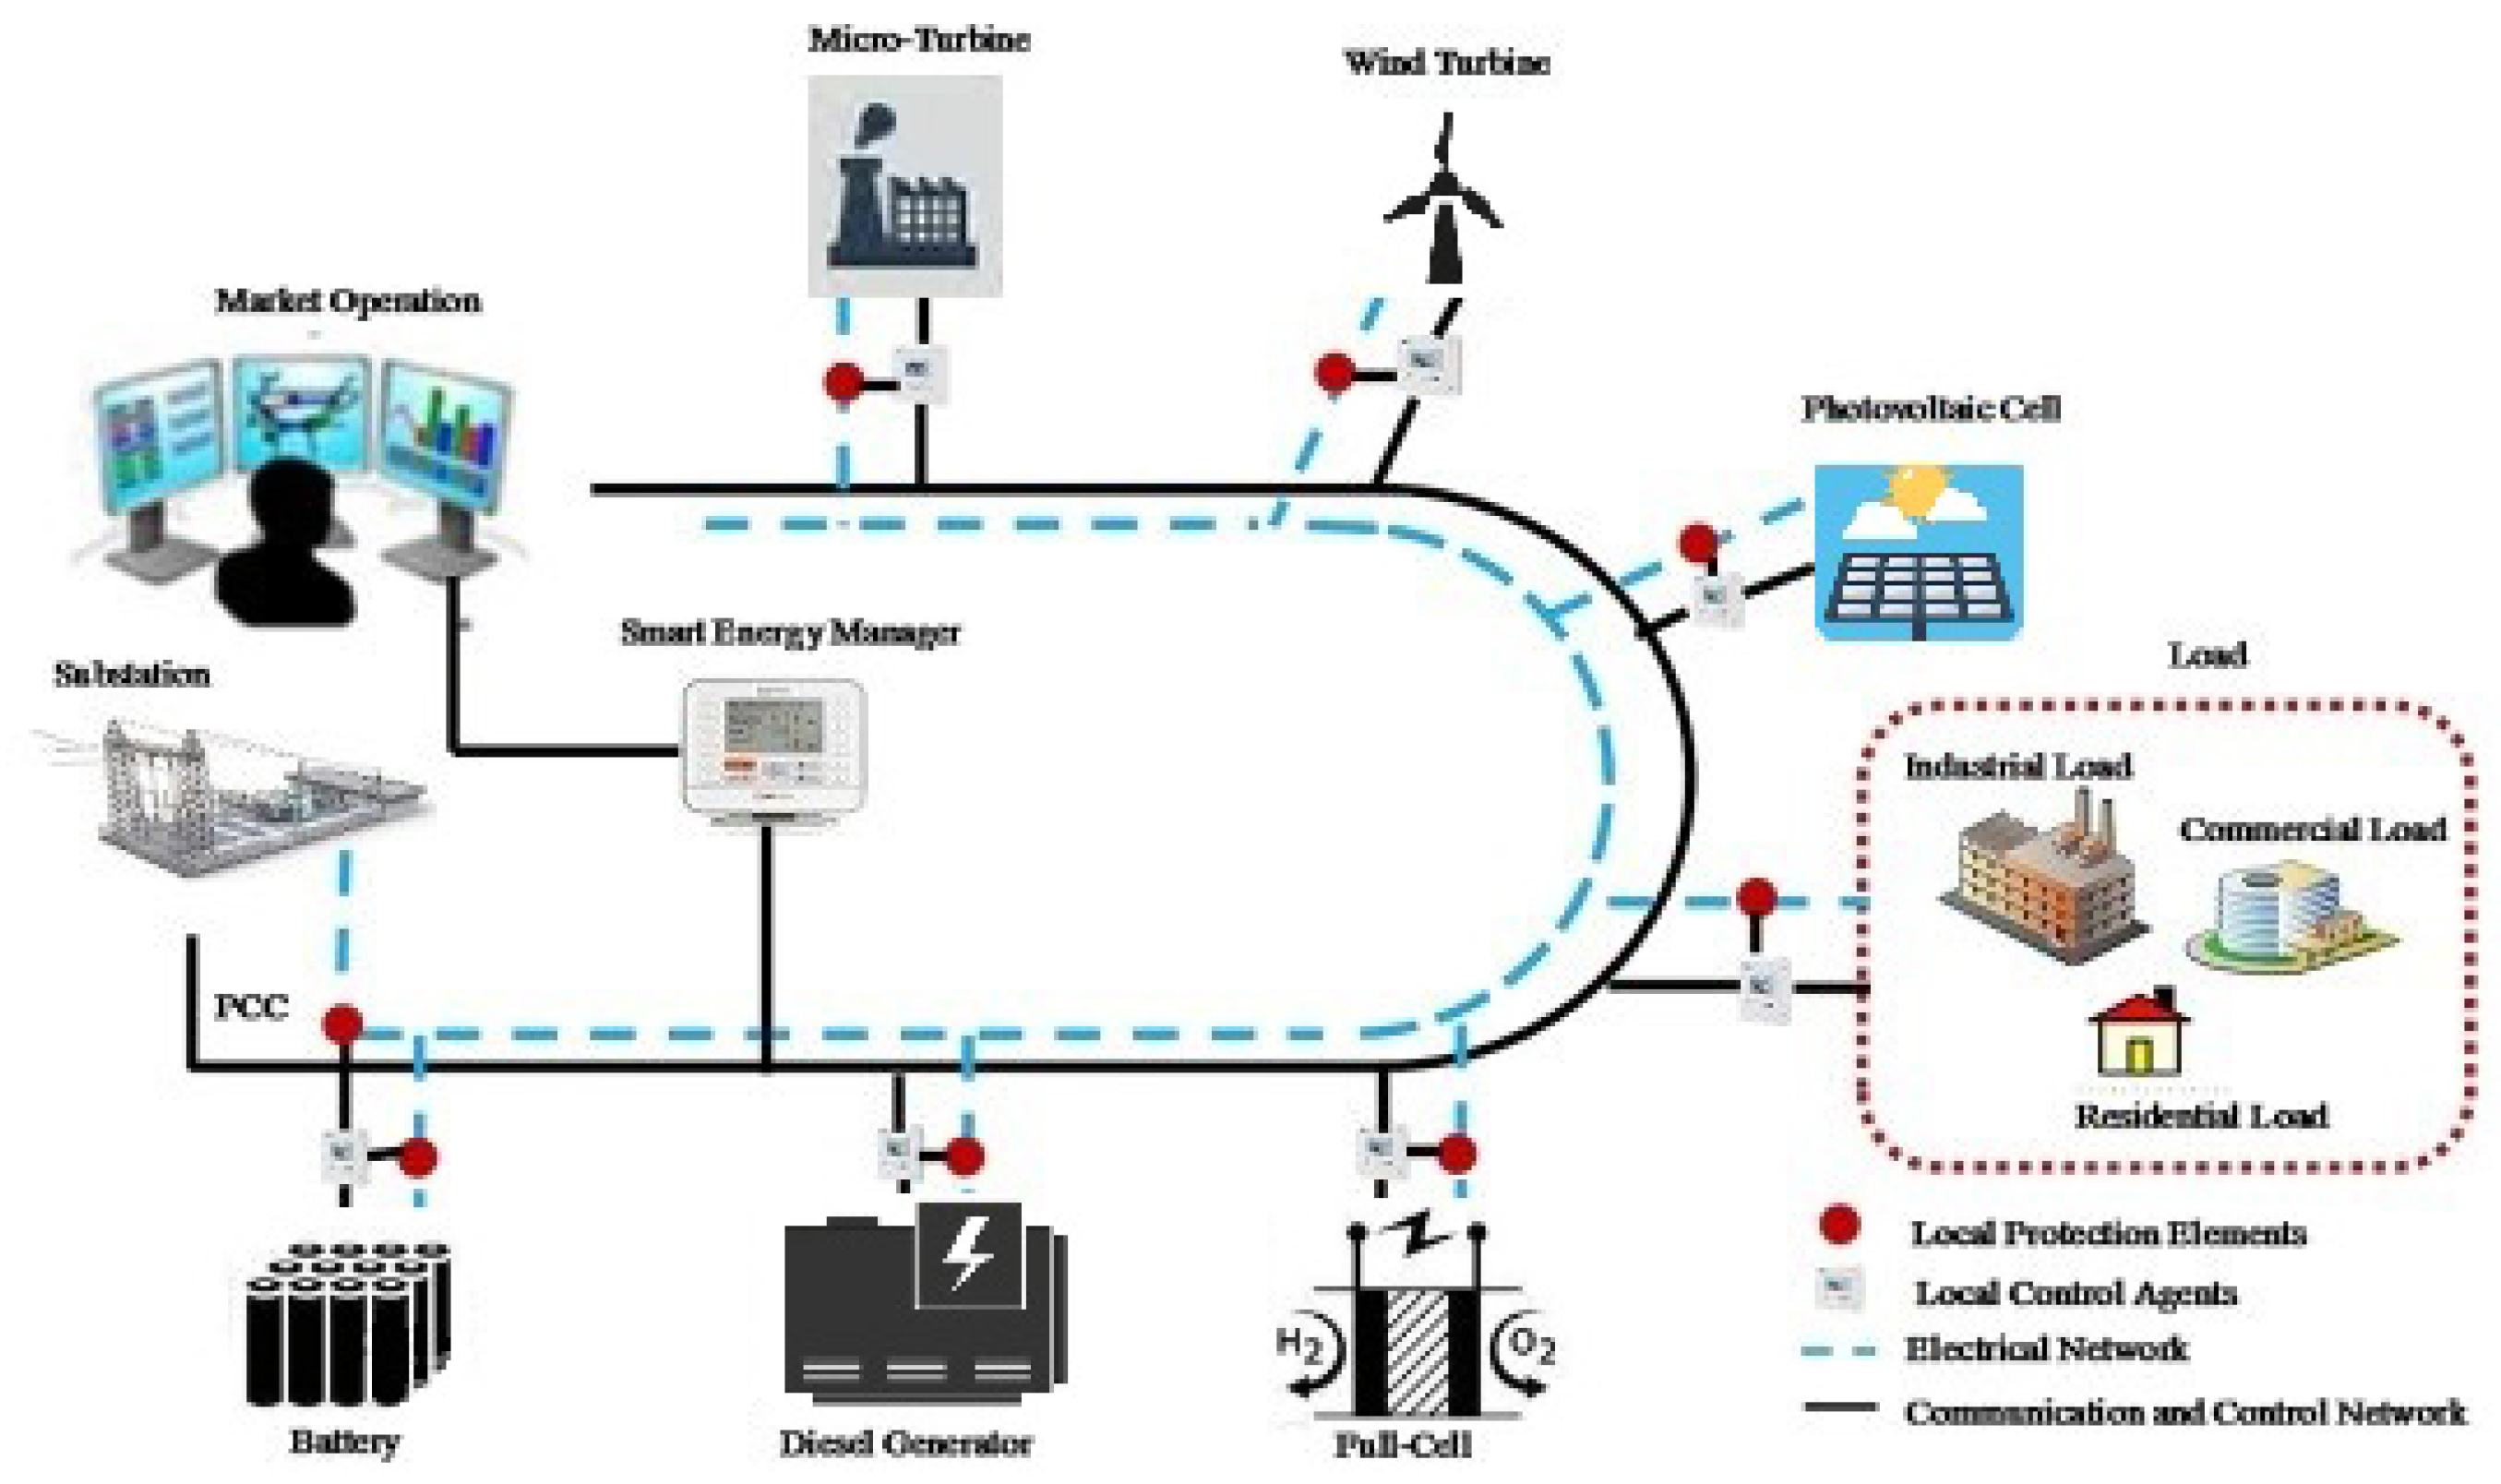
The microgrid structure is represented in
Figure 1. According to this figure, it is clear that microgrid includes diesel generator (DG), fuel cell (FC), microturbine (MT), wind turbine (WT), and photovoltaic (PV) distributed generation resources. Besides, in the microgrid structure, a battery is used as an energy storage system. The cost and coefficients of different resources are presented in
Table 3.
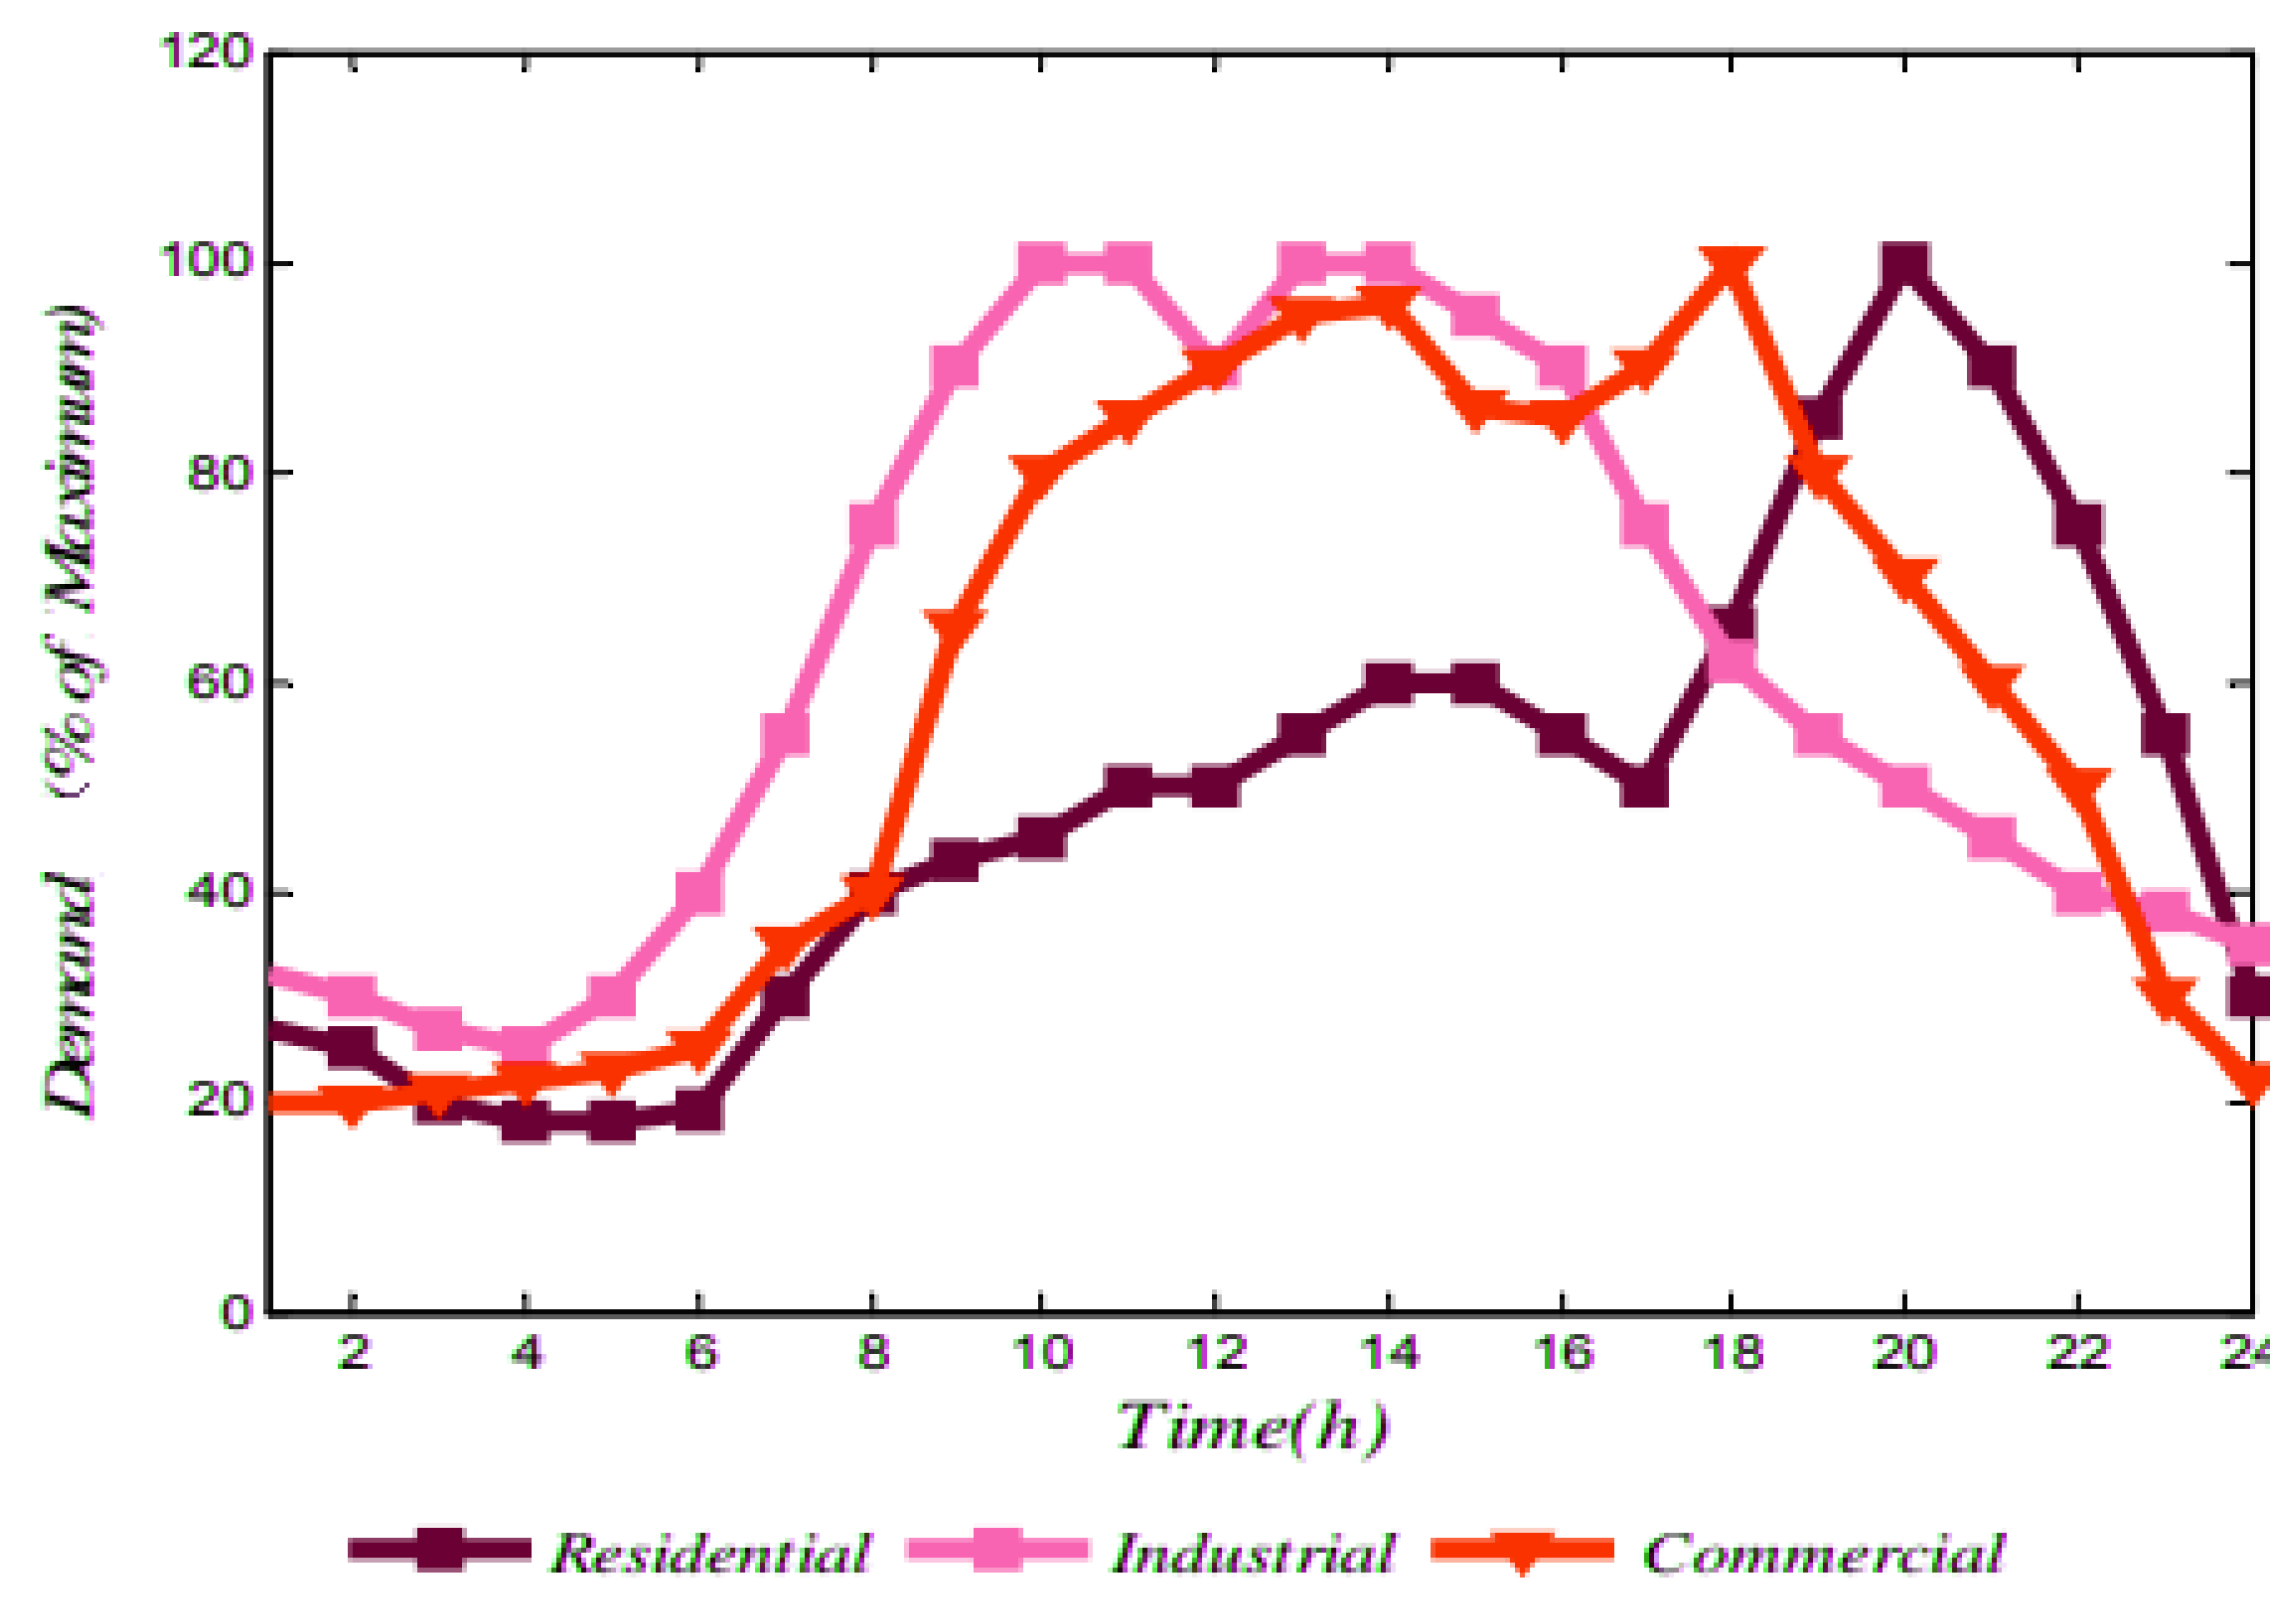
Regarding
Figure 2, microgrid loads are divided into three types of RCs, CCs and ICs.
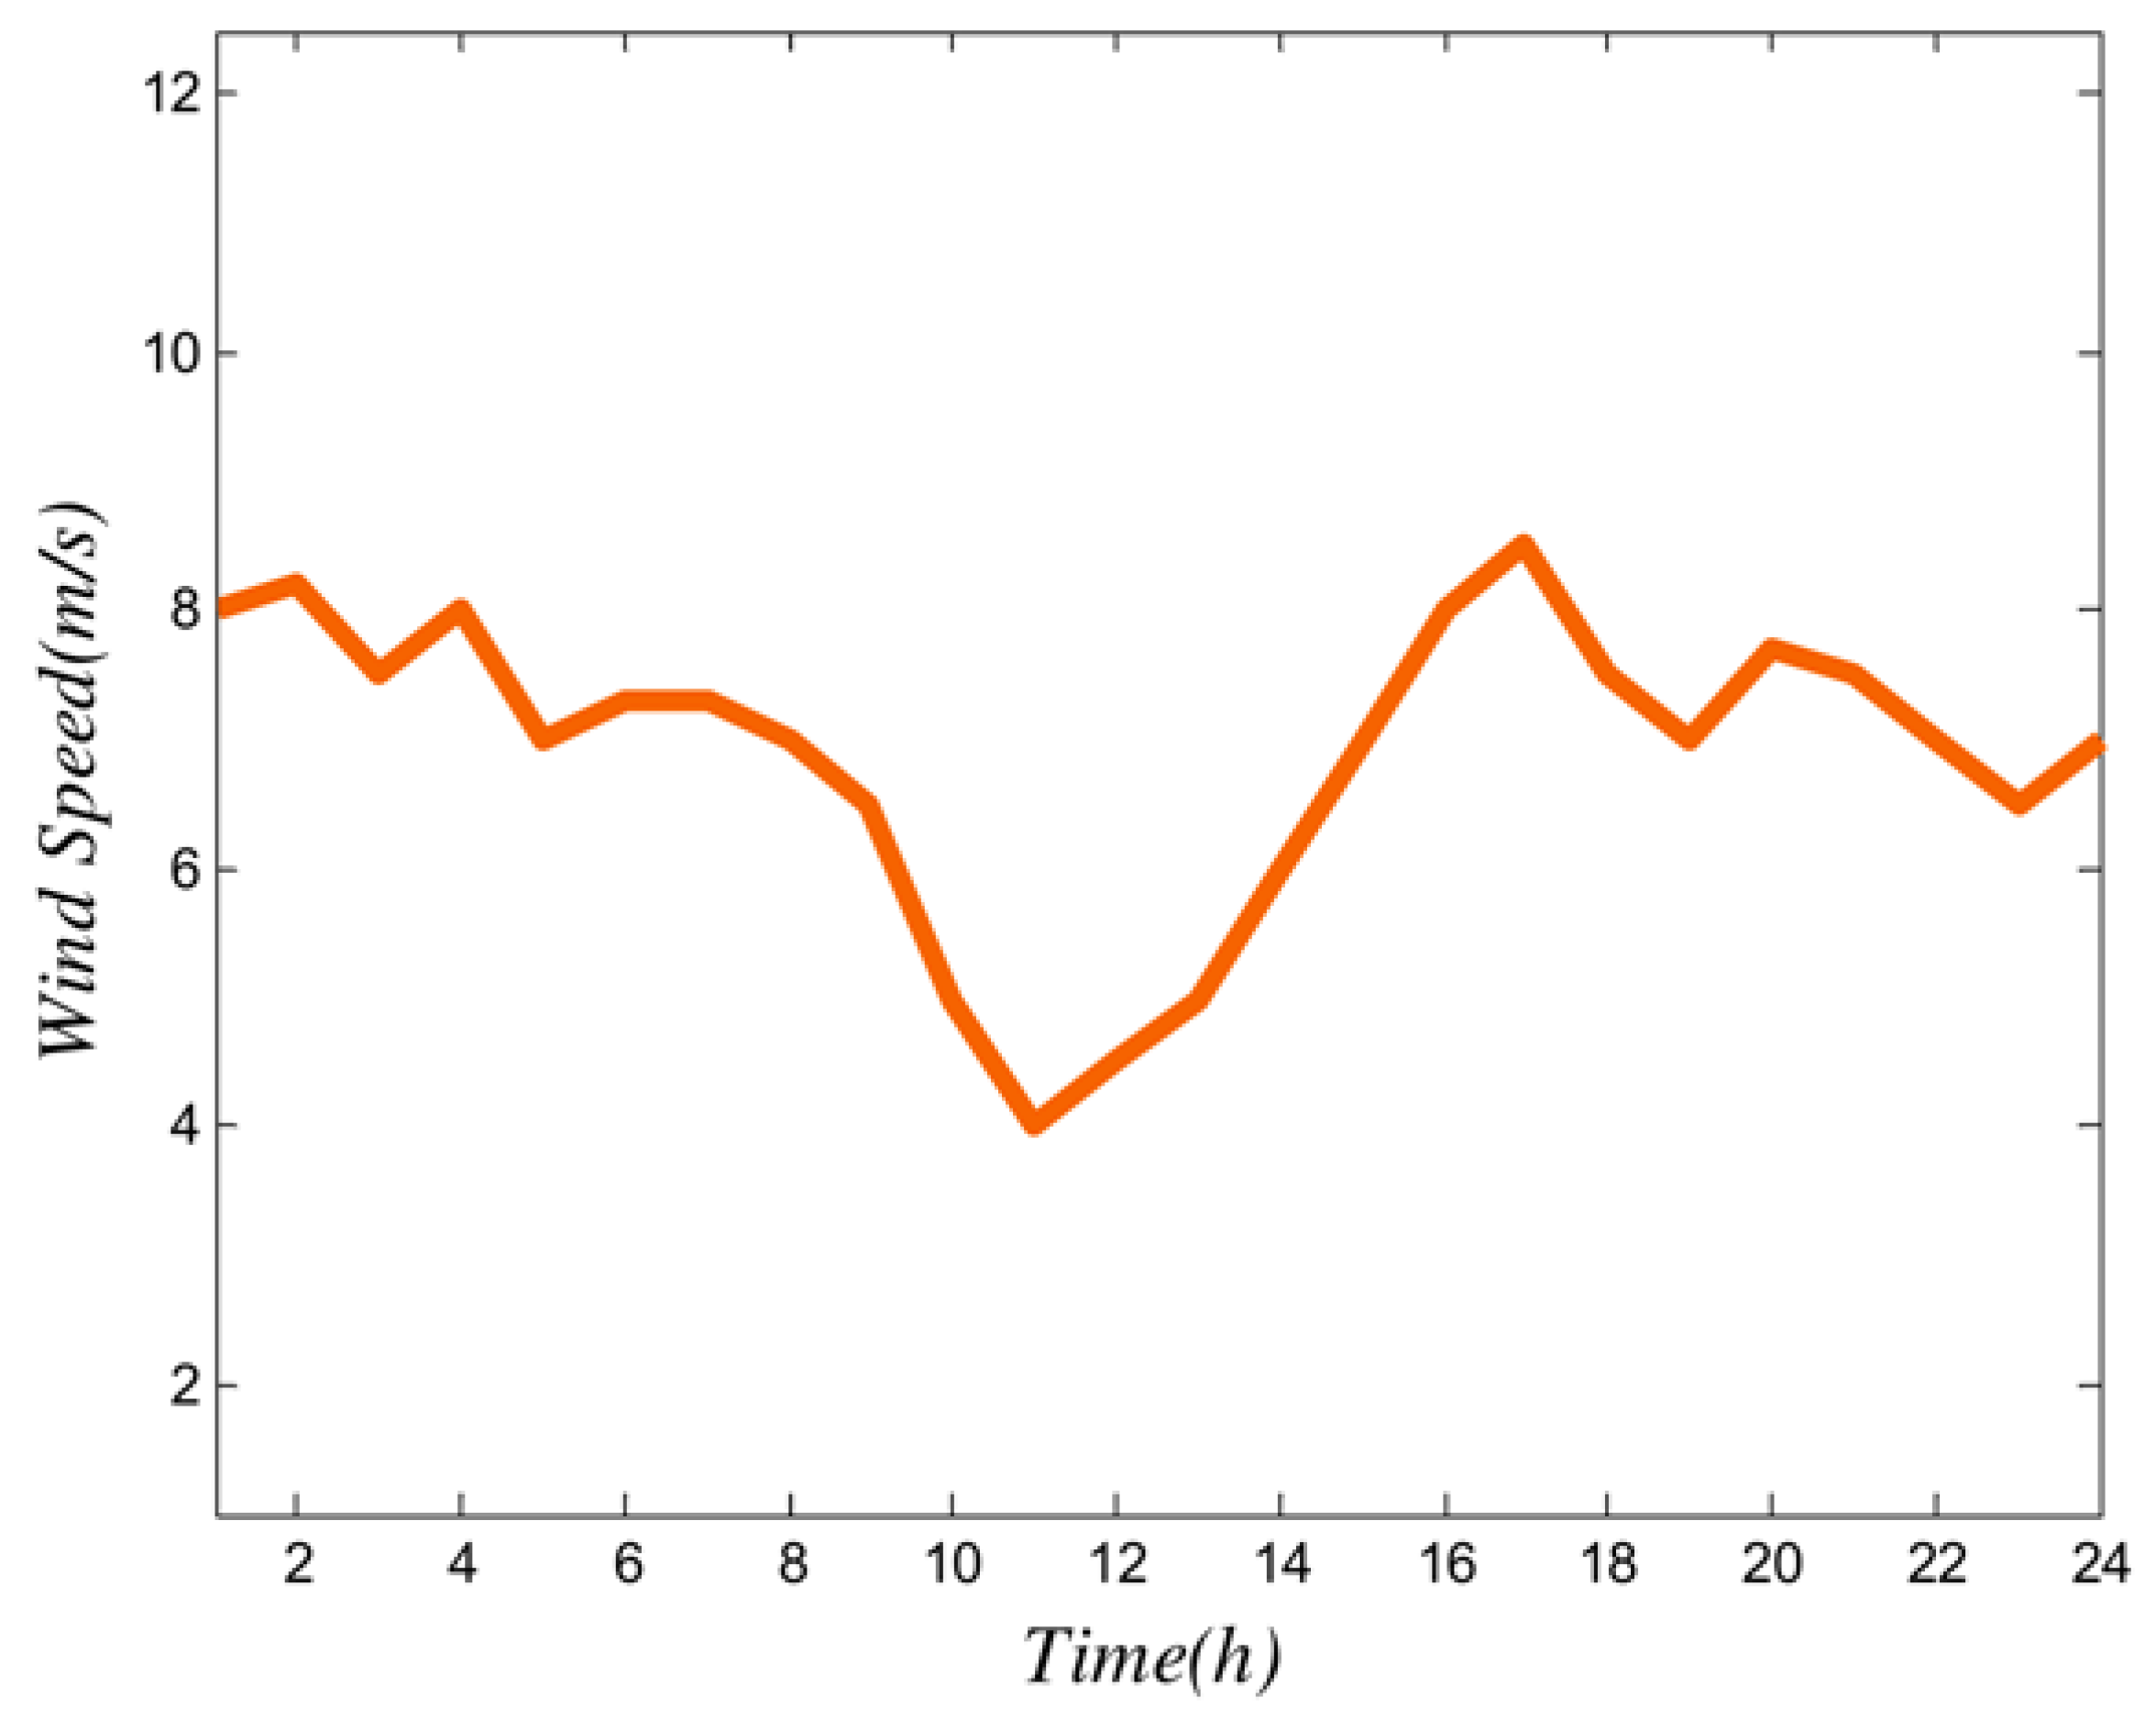
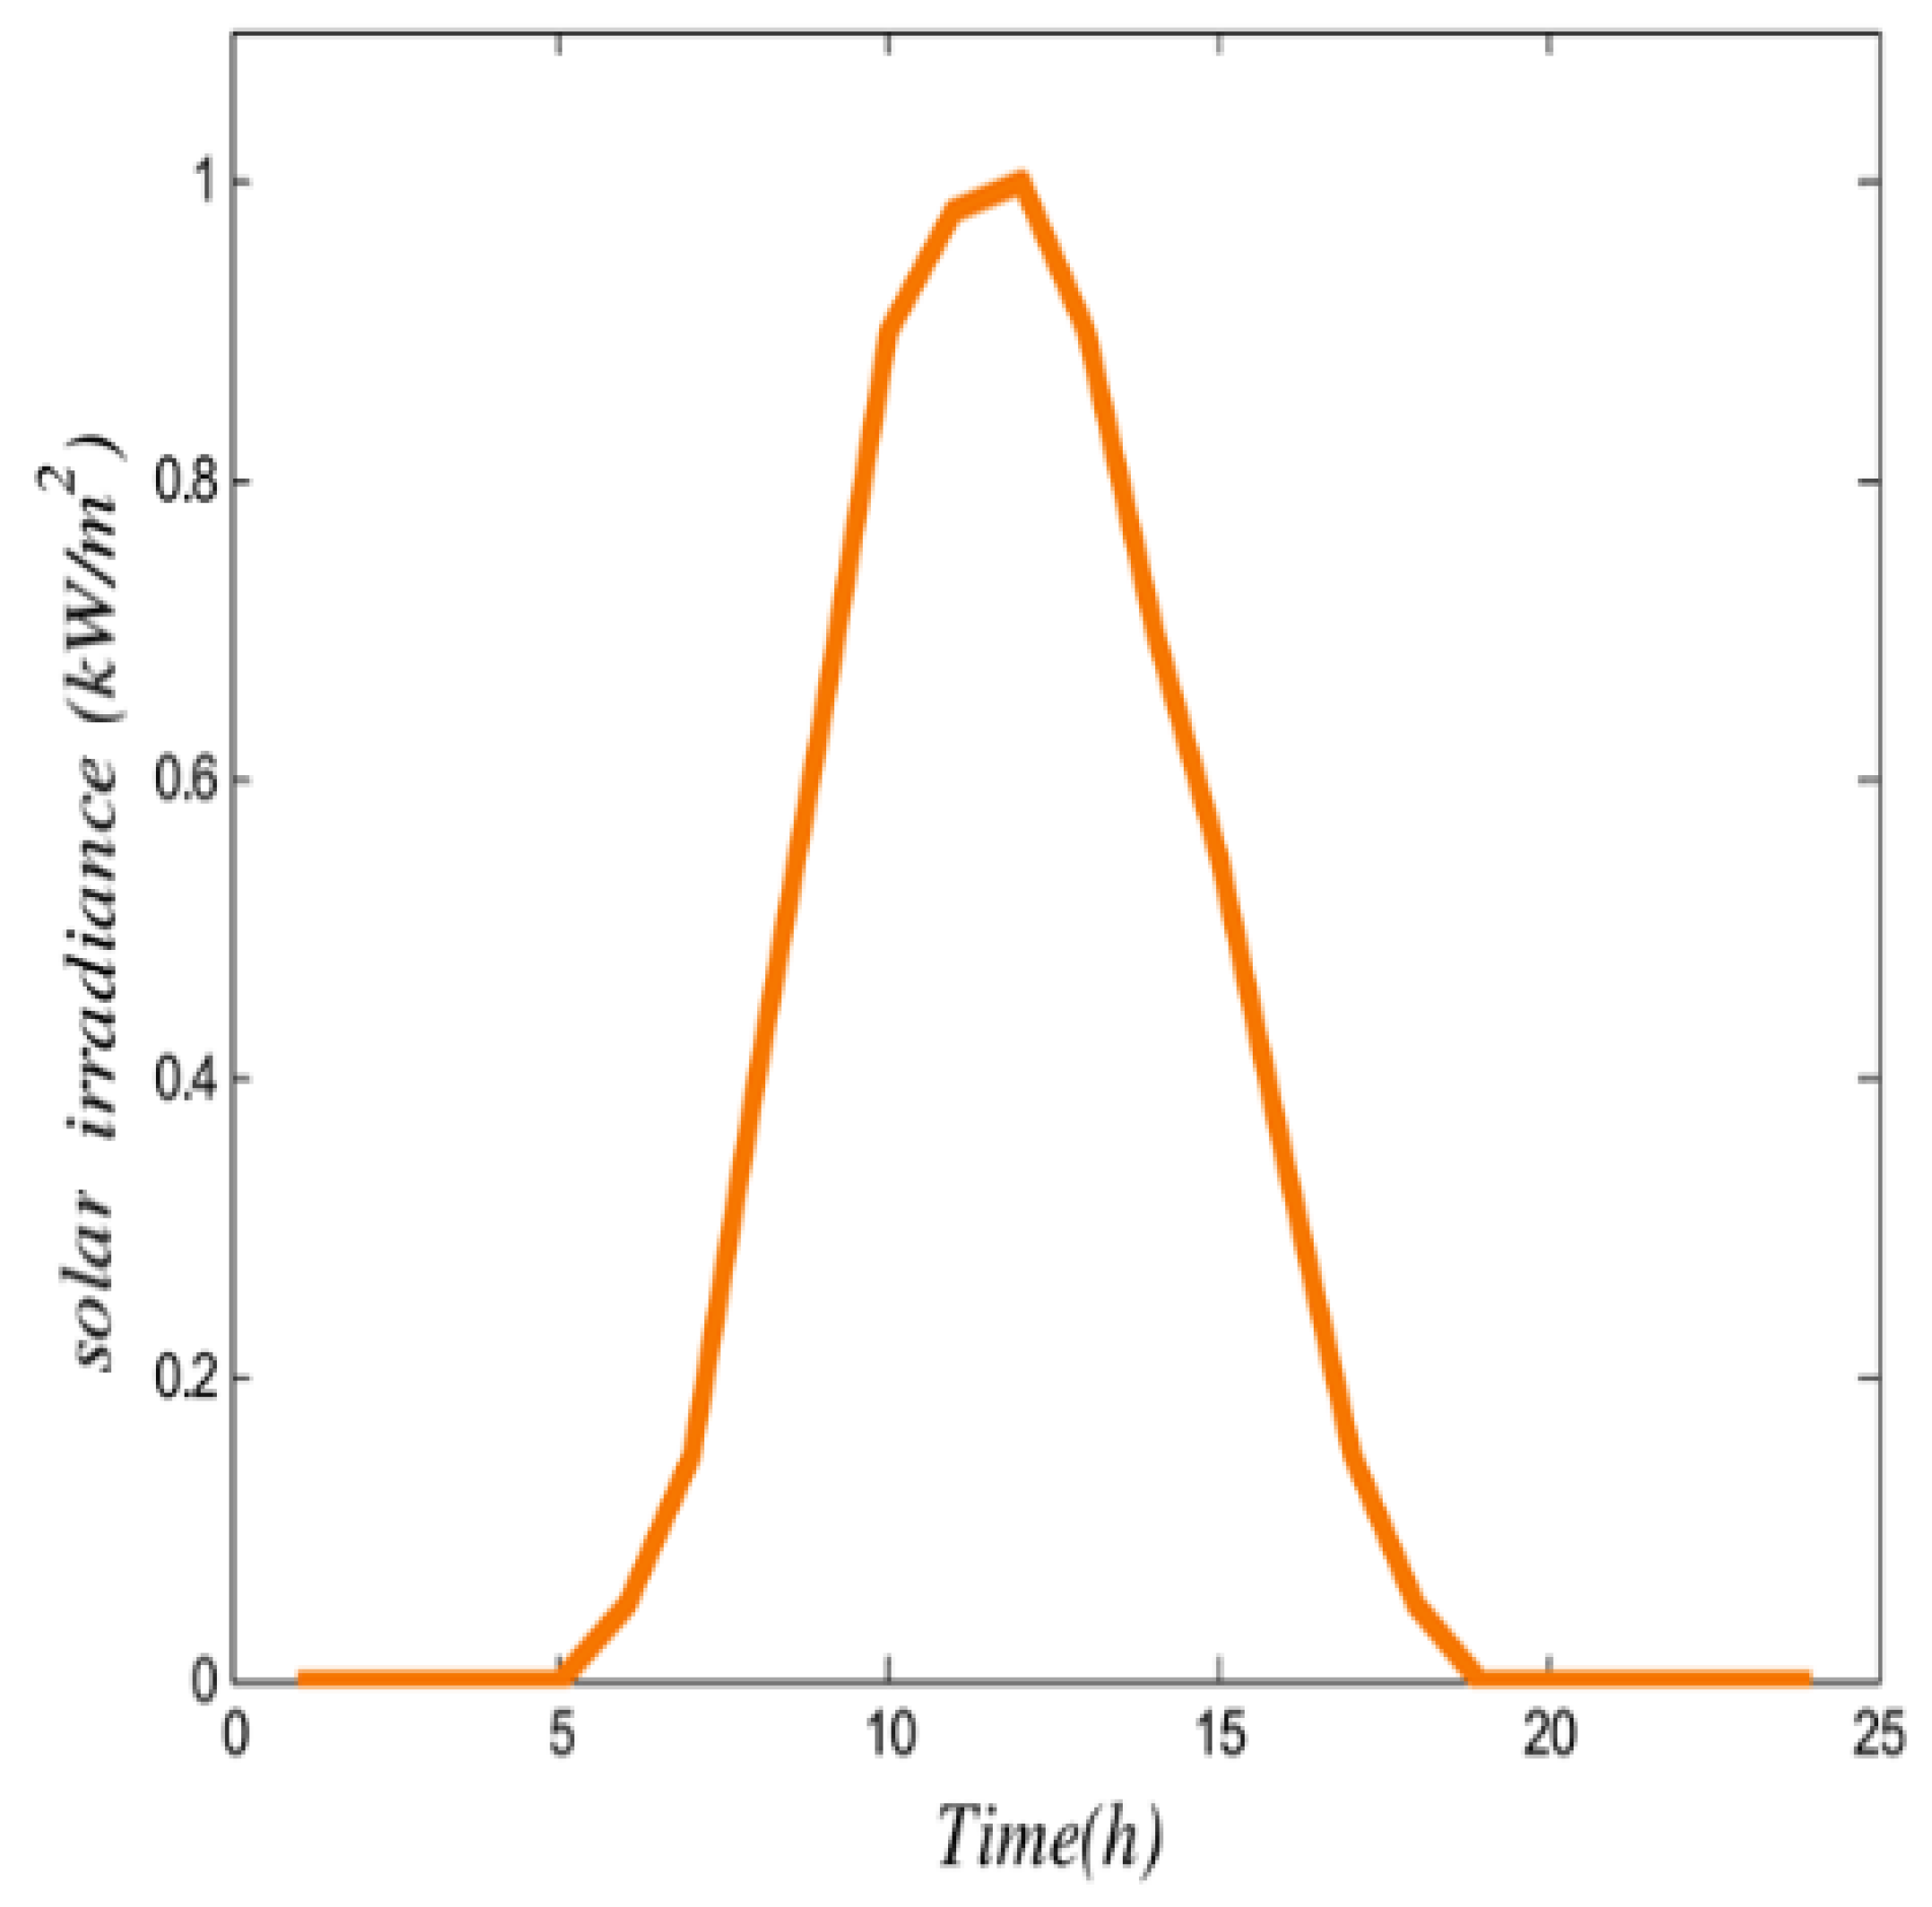
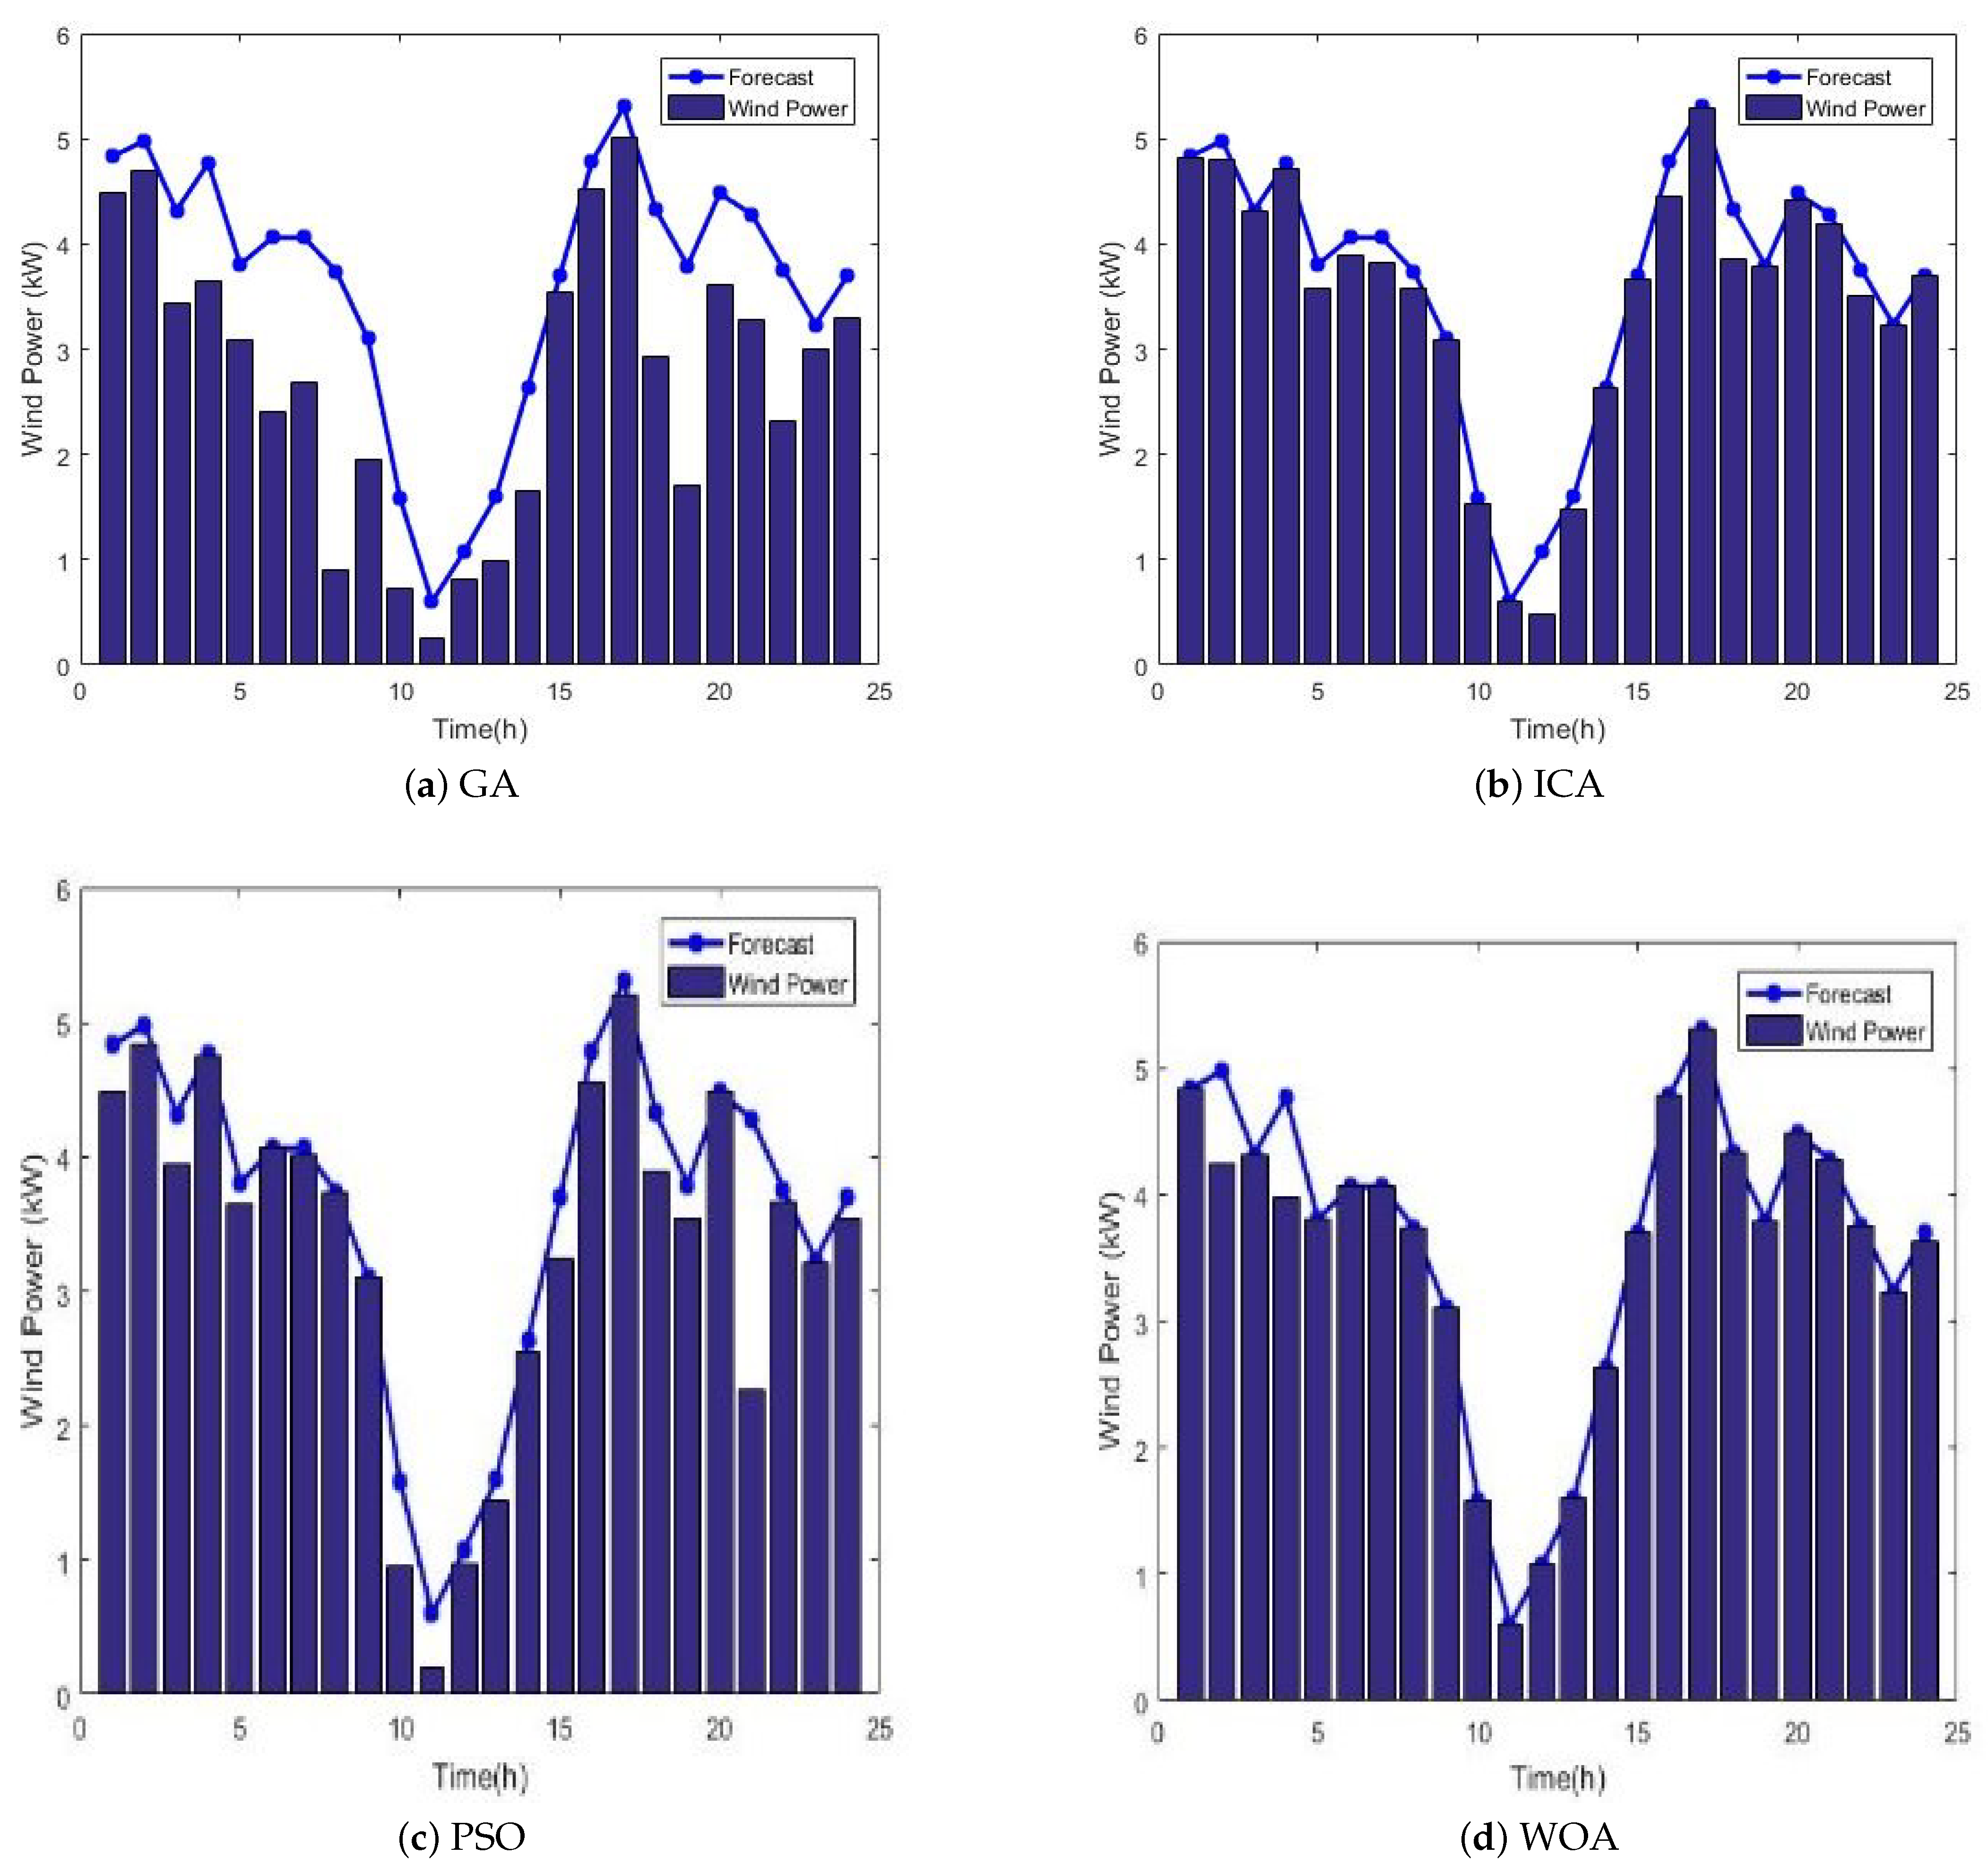
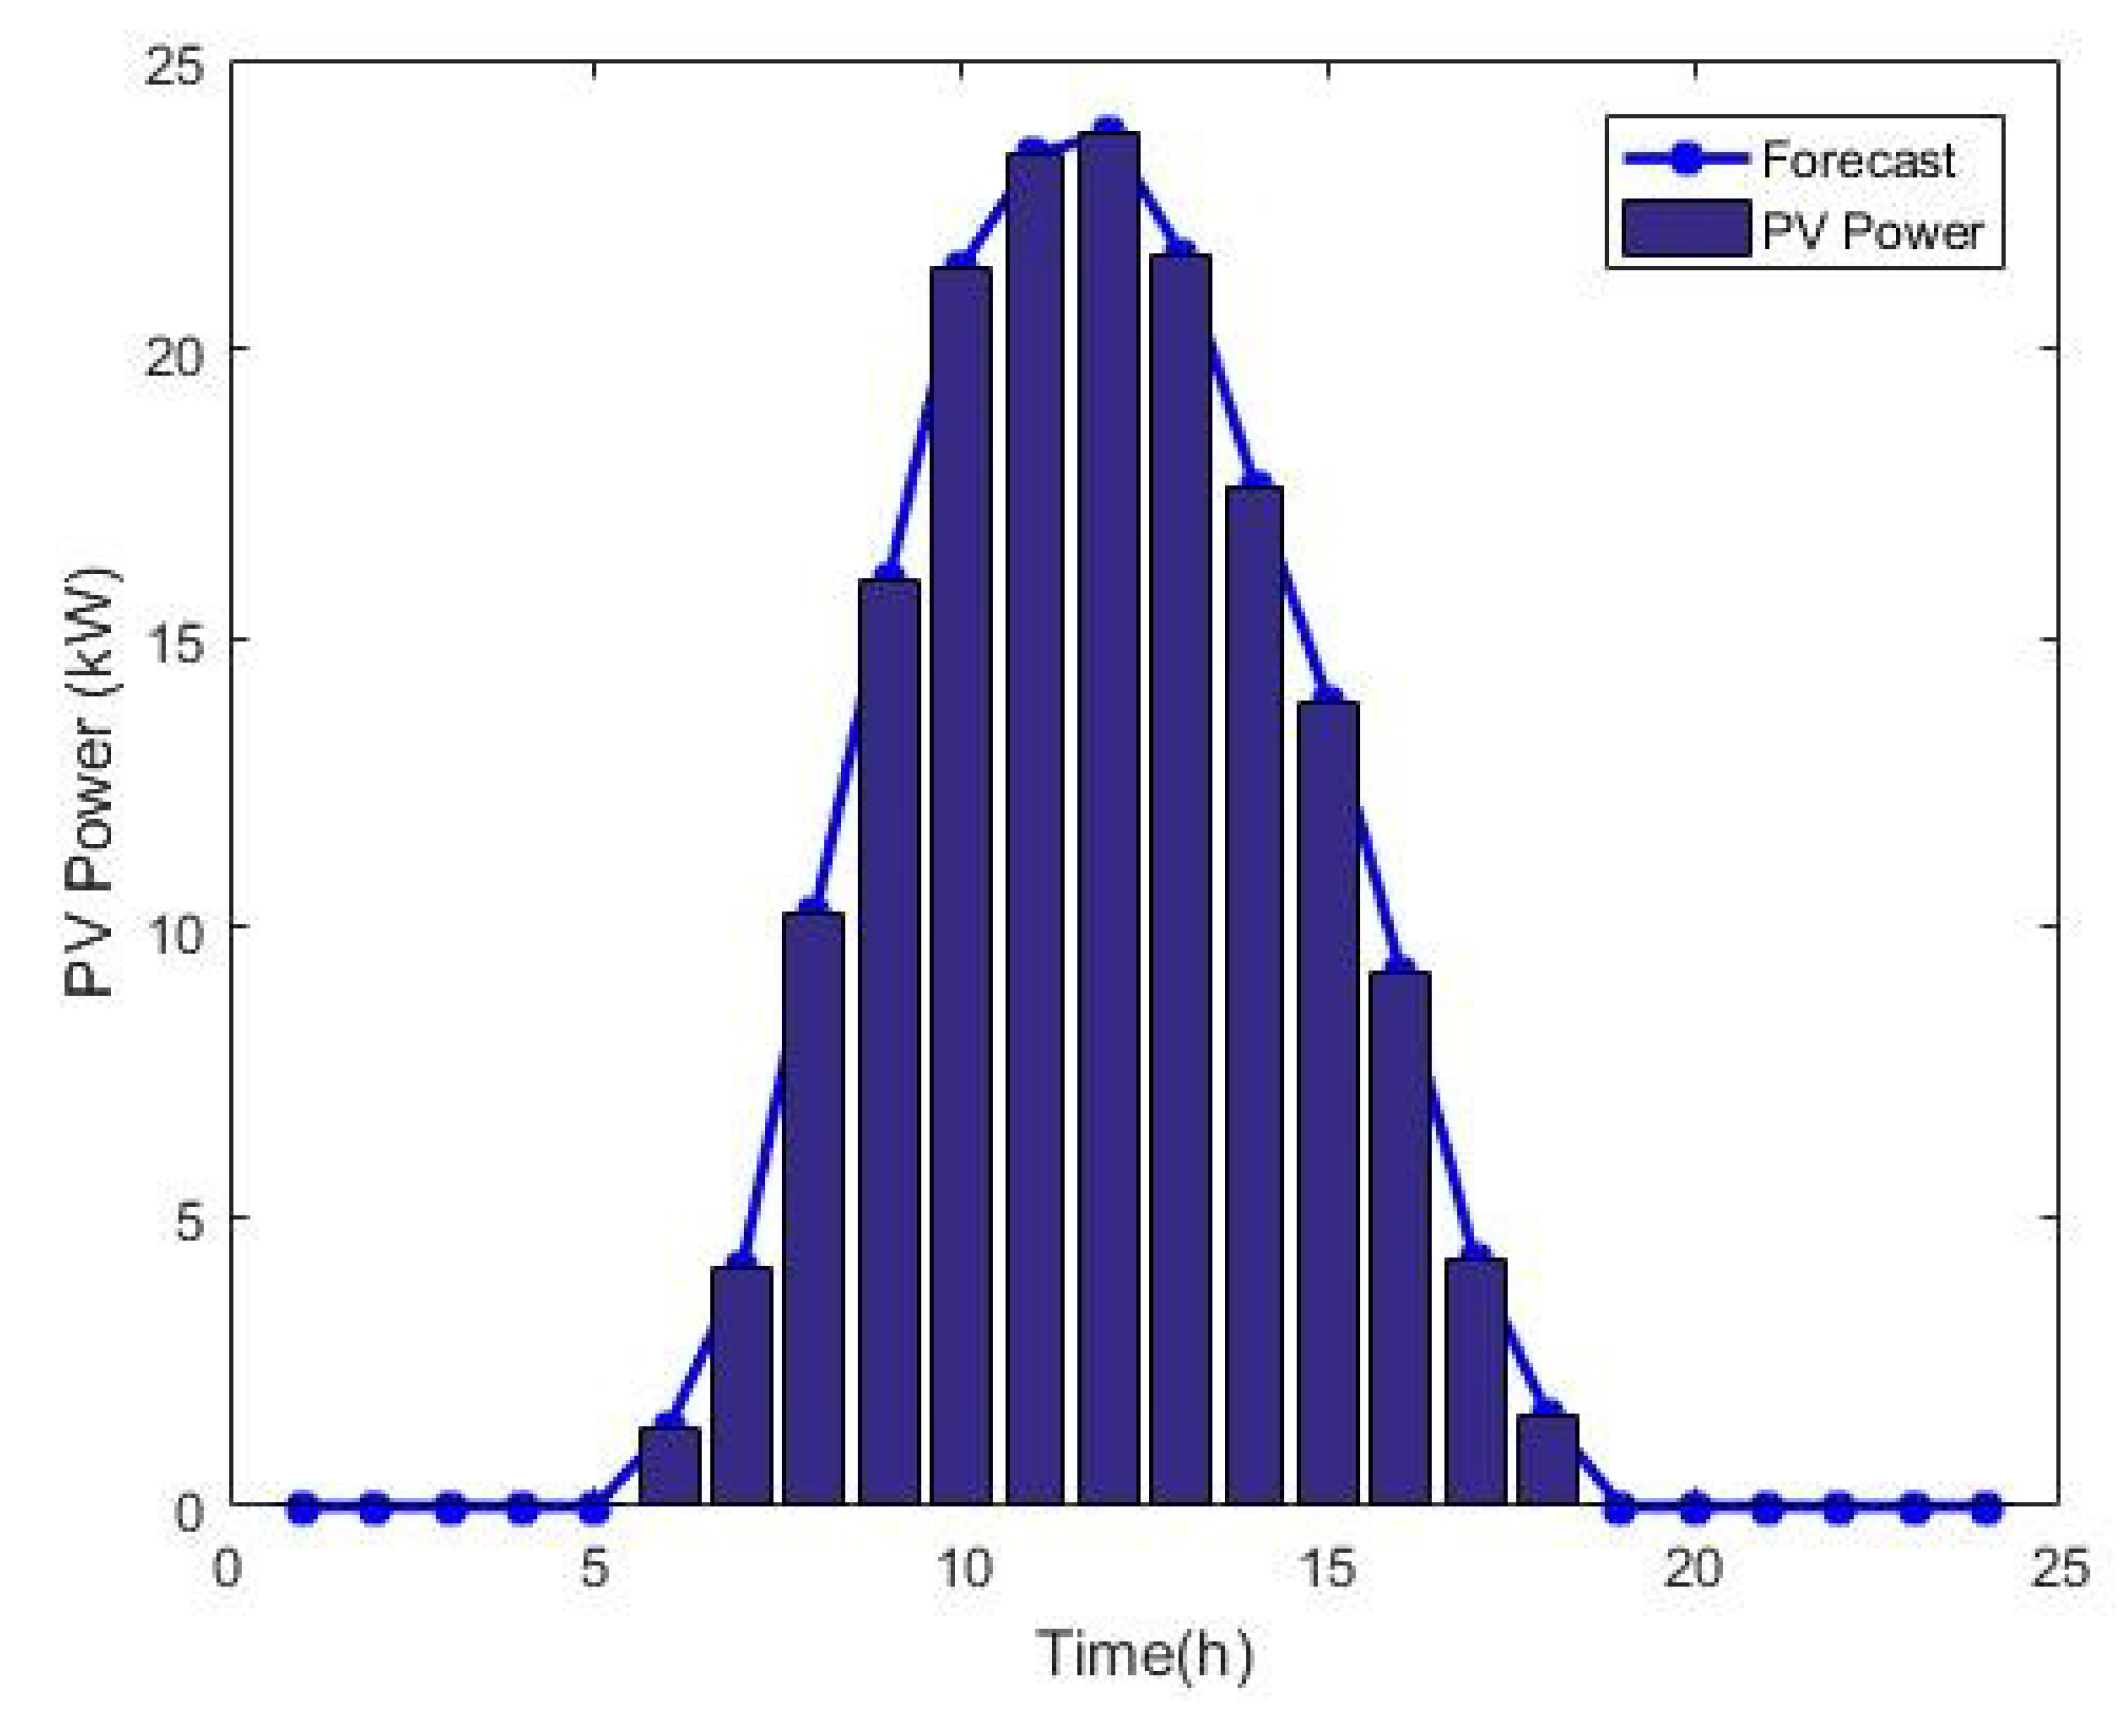
In the selected microgrid, a WT with a nominal capacity of 15 kW, cut-in speed 3.5 m/s, nominal speed 17.5 m/s, and cut-off speed 18 m/s is considered. In
Figure 3, the average wind speed predicted for the next 24 h is shown. The used PV capacity is 25 Kw which is of the SOLAREX MSX type. The amount of sunlight in the considered location for the next 24 h is also shown in
Figure 4. Based on
Figure 3 and
Figure 4, the predicted power of WT and PV for the next 24 h, can be calculated using the mathematical relations presented in
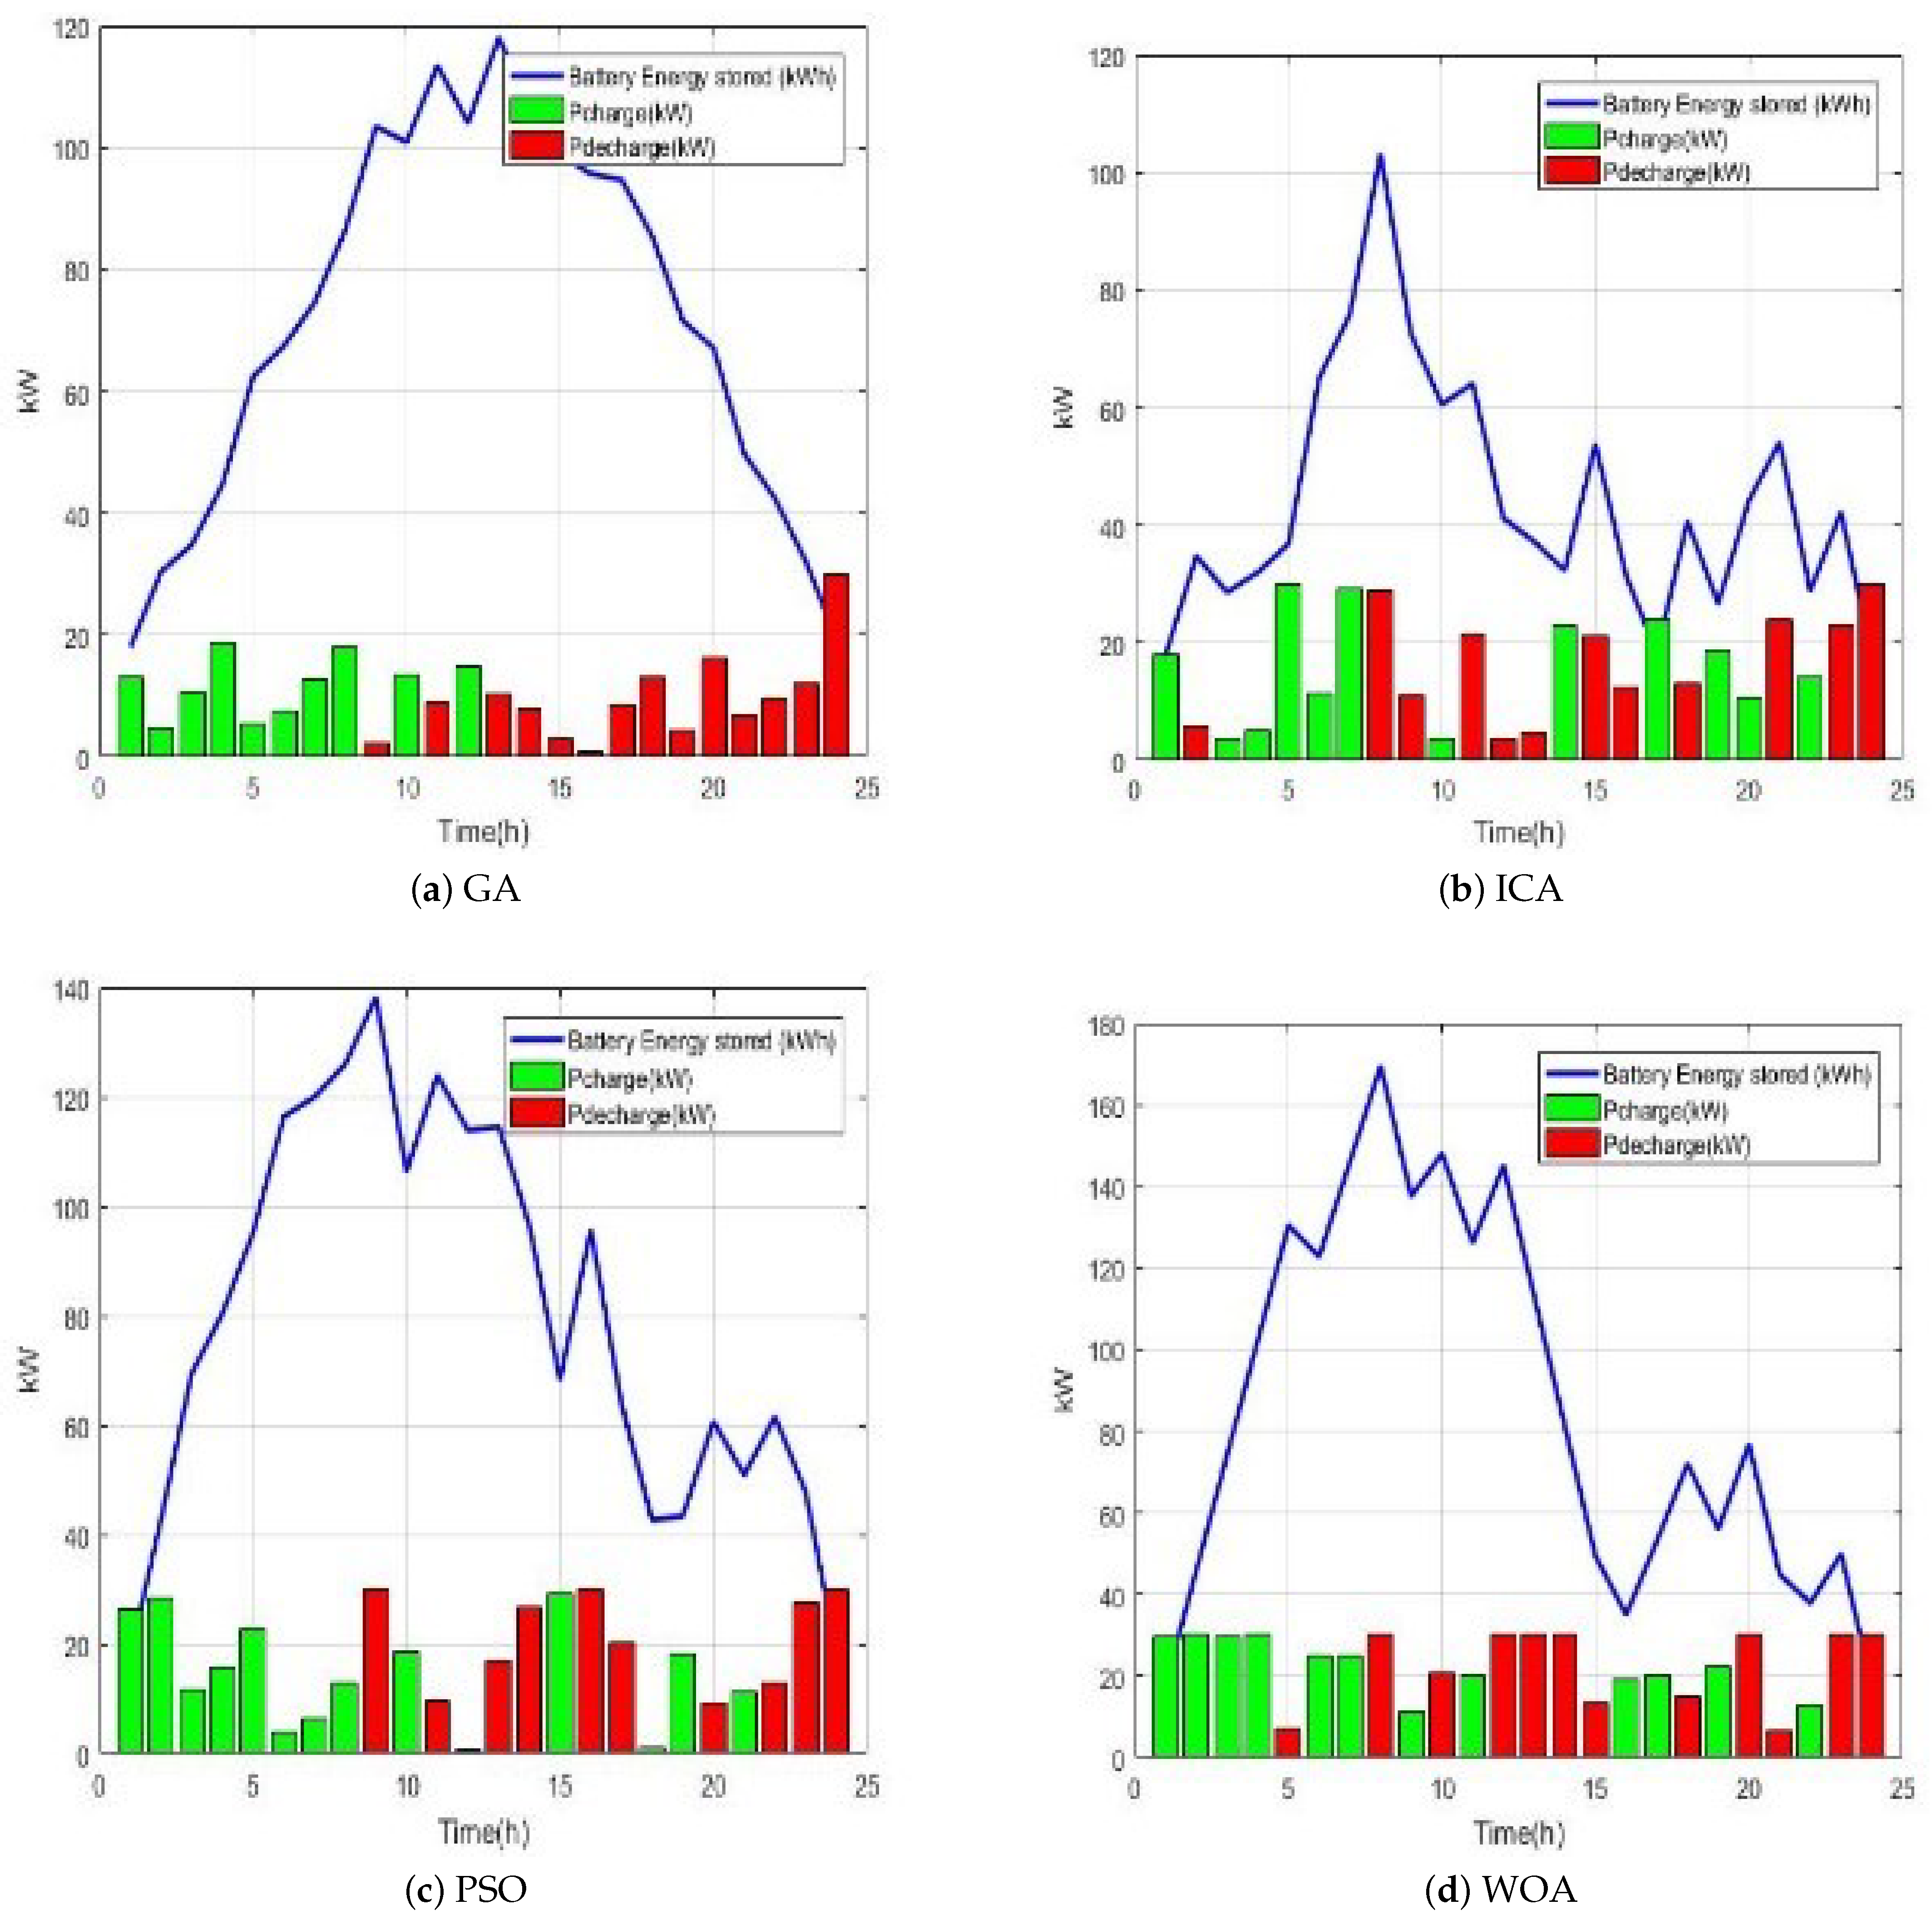
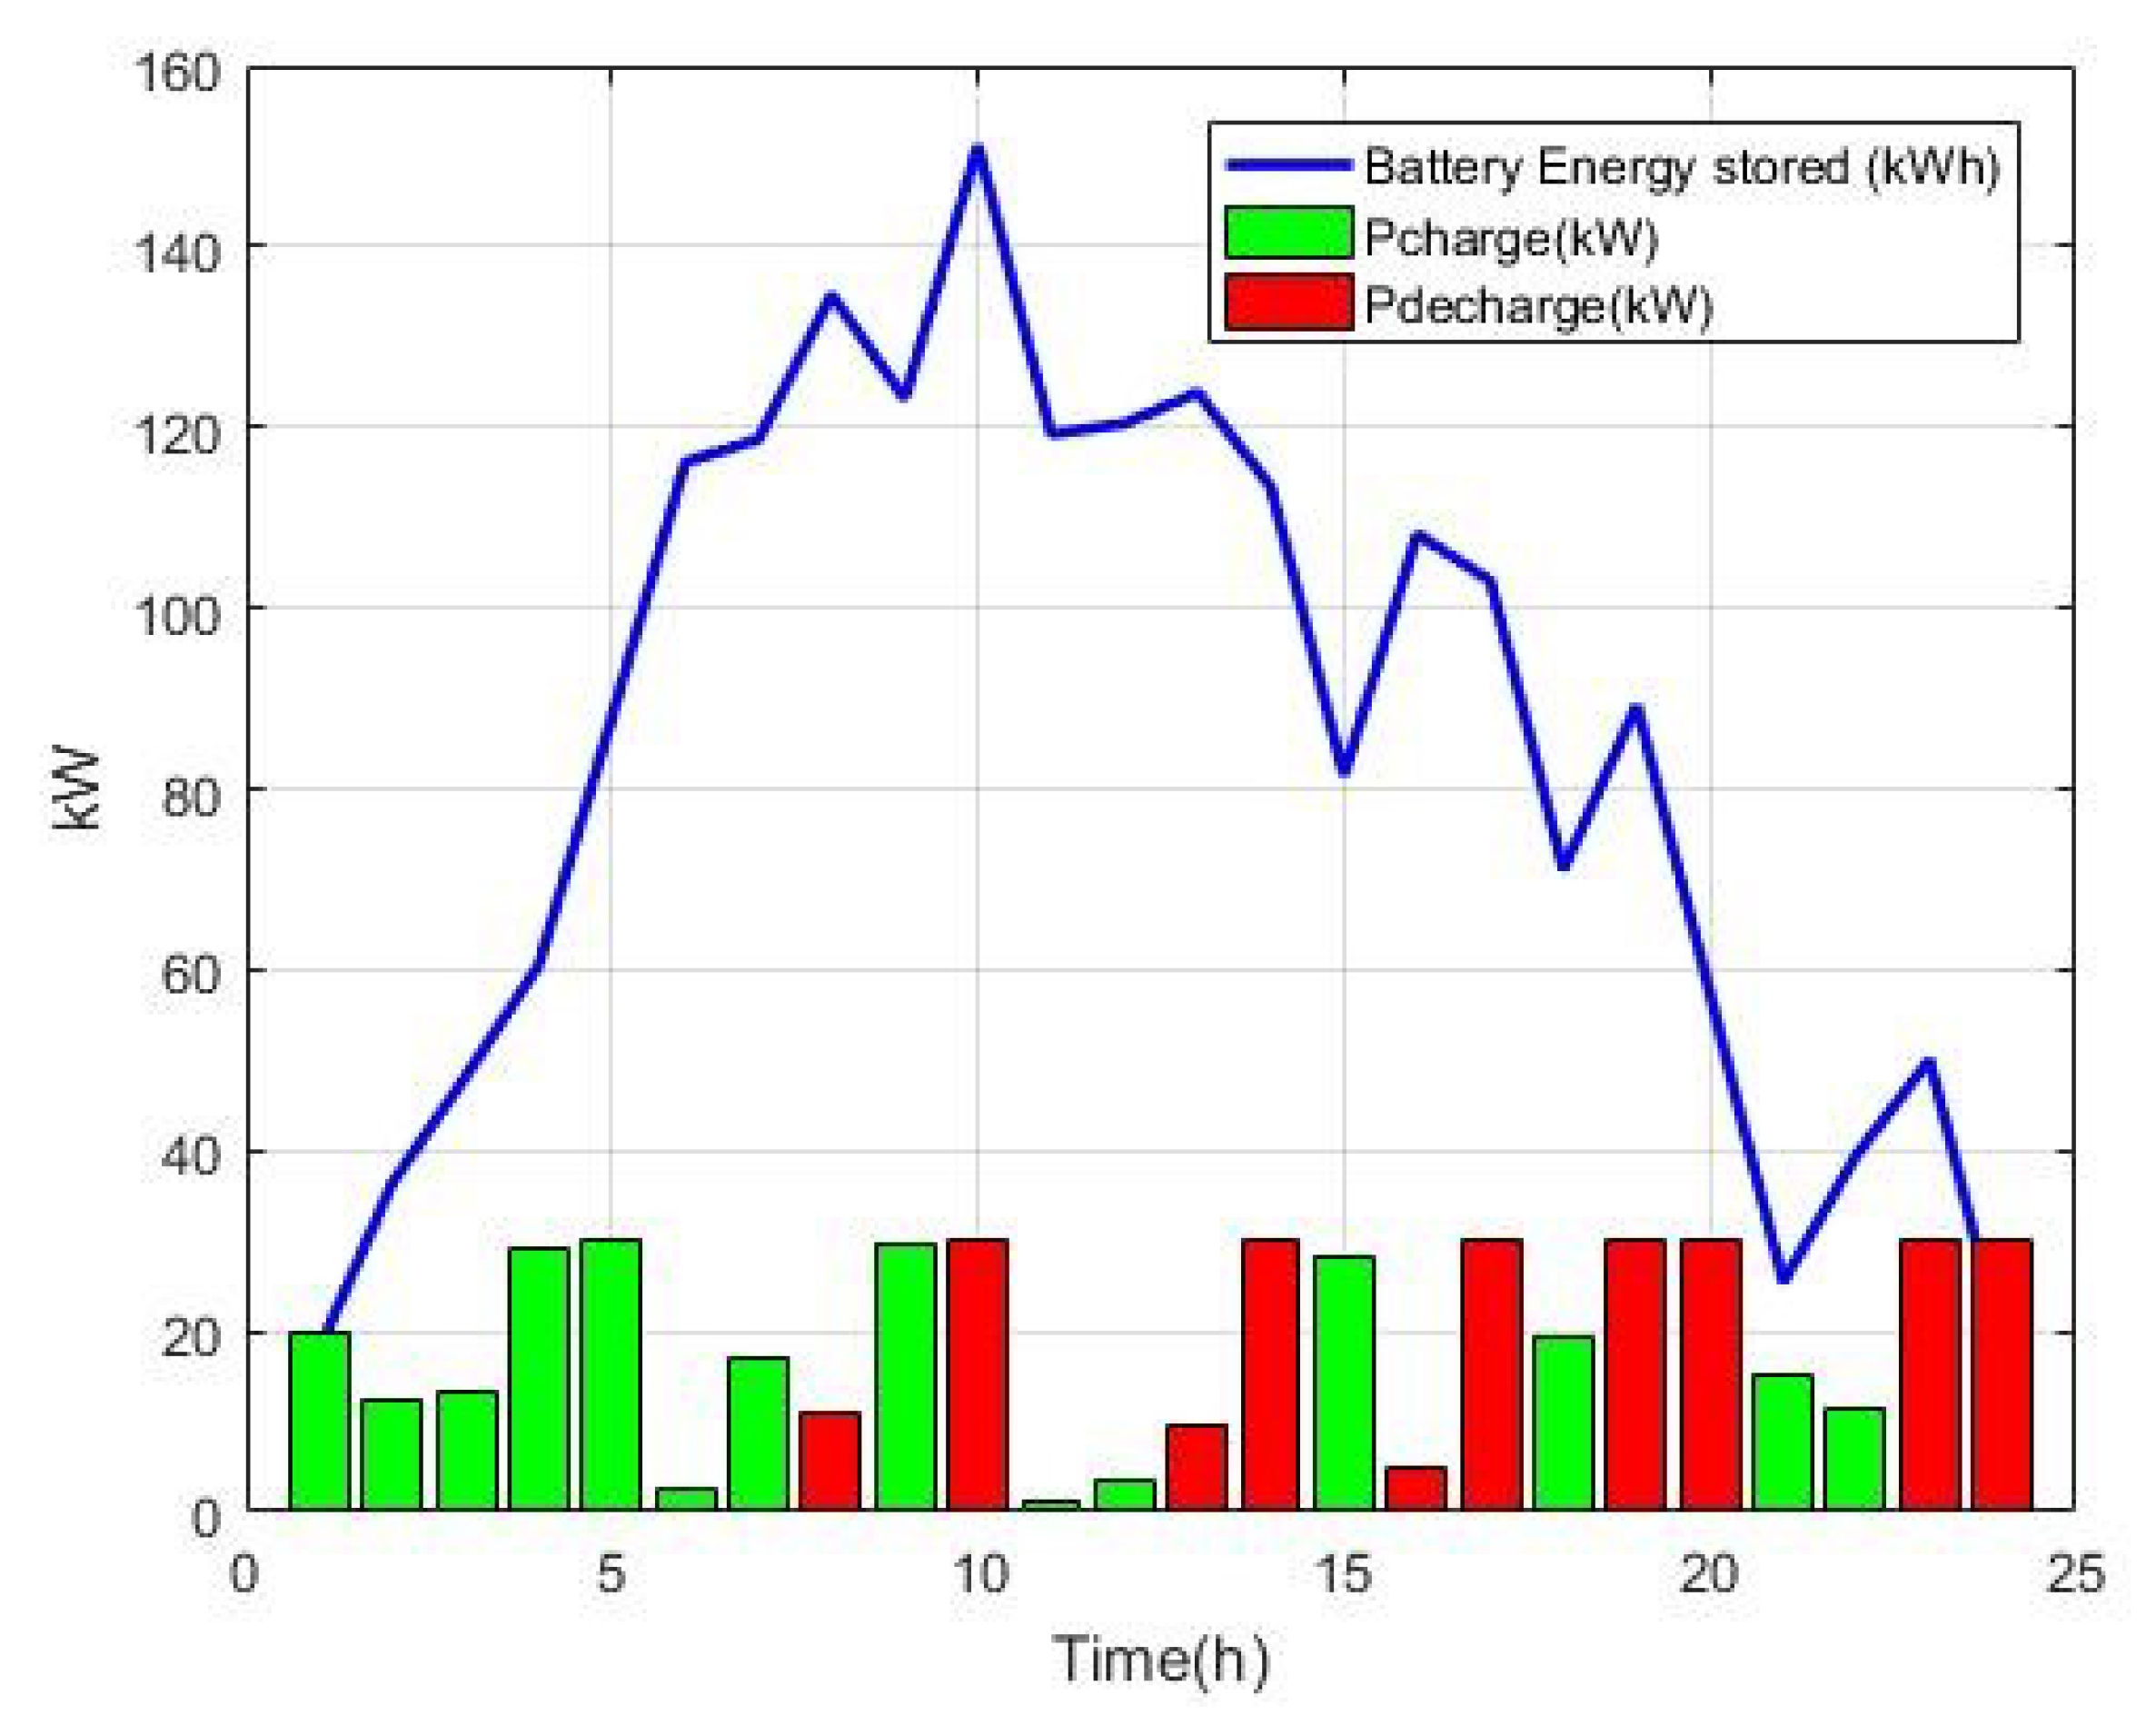
Section 3. In calculating the output power of WT and PV, it is supposed that the power factor of these sources is one and does not produce reactive power. In the chosen microgrid, the minimum and maximum storage levels are set to 10% and 100% of the battery of 180 kWh capacity, respectively. Battery charging and discharging efficiency is also considered 94% [
33]. According to
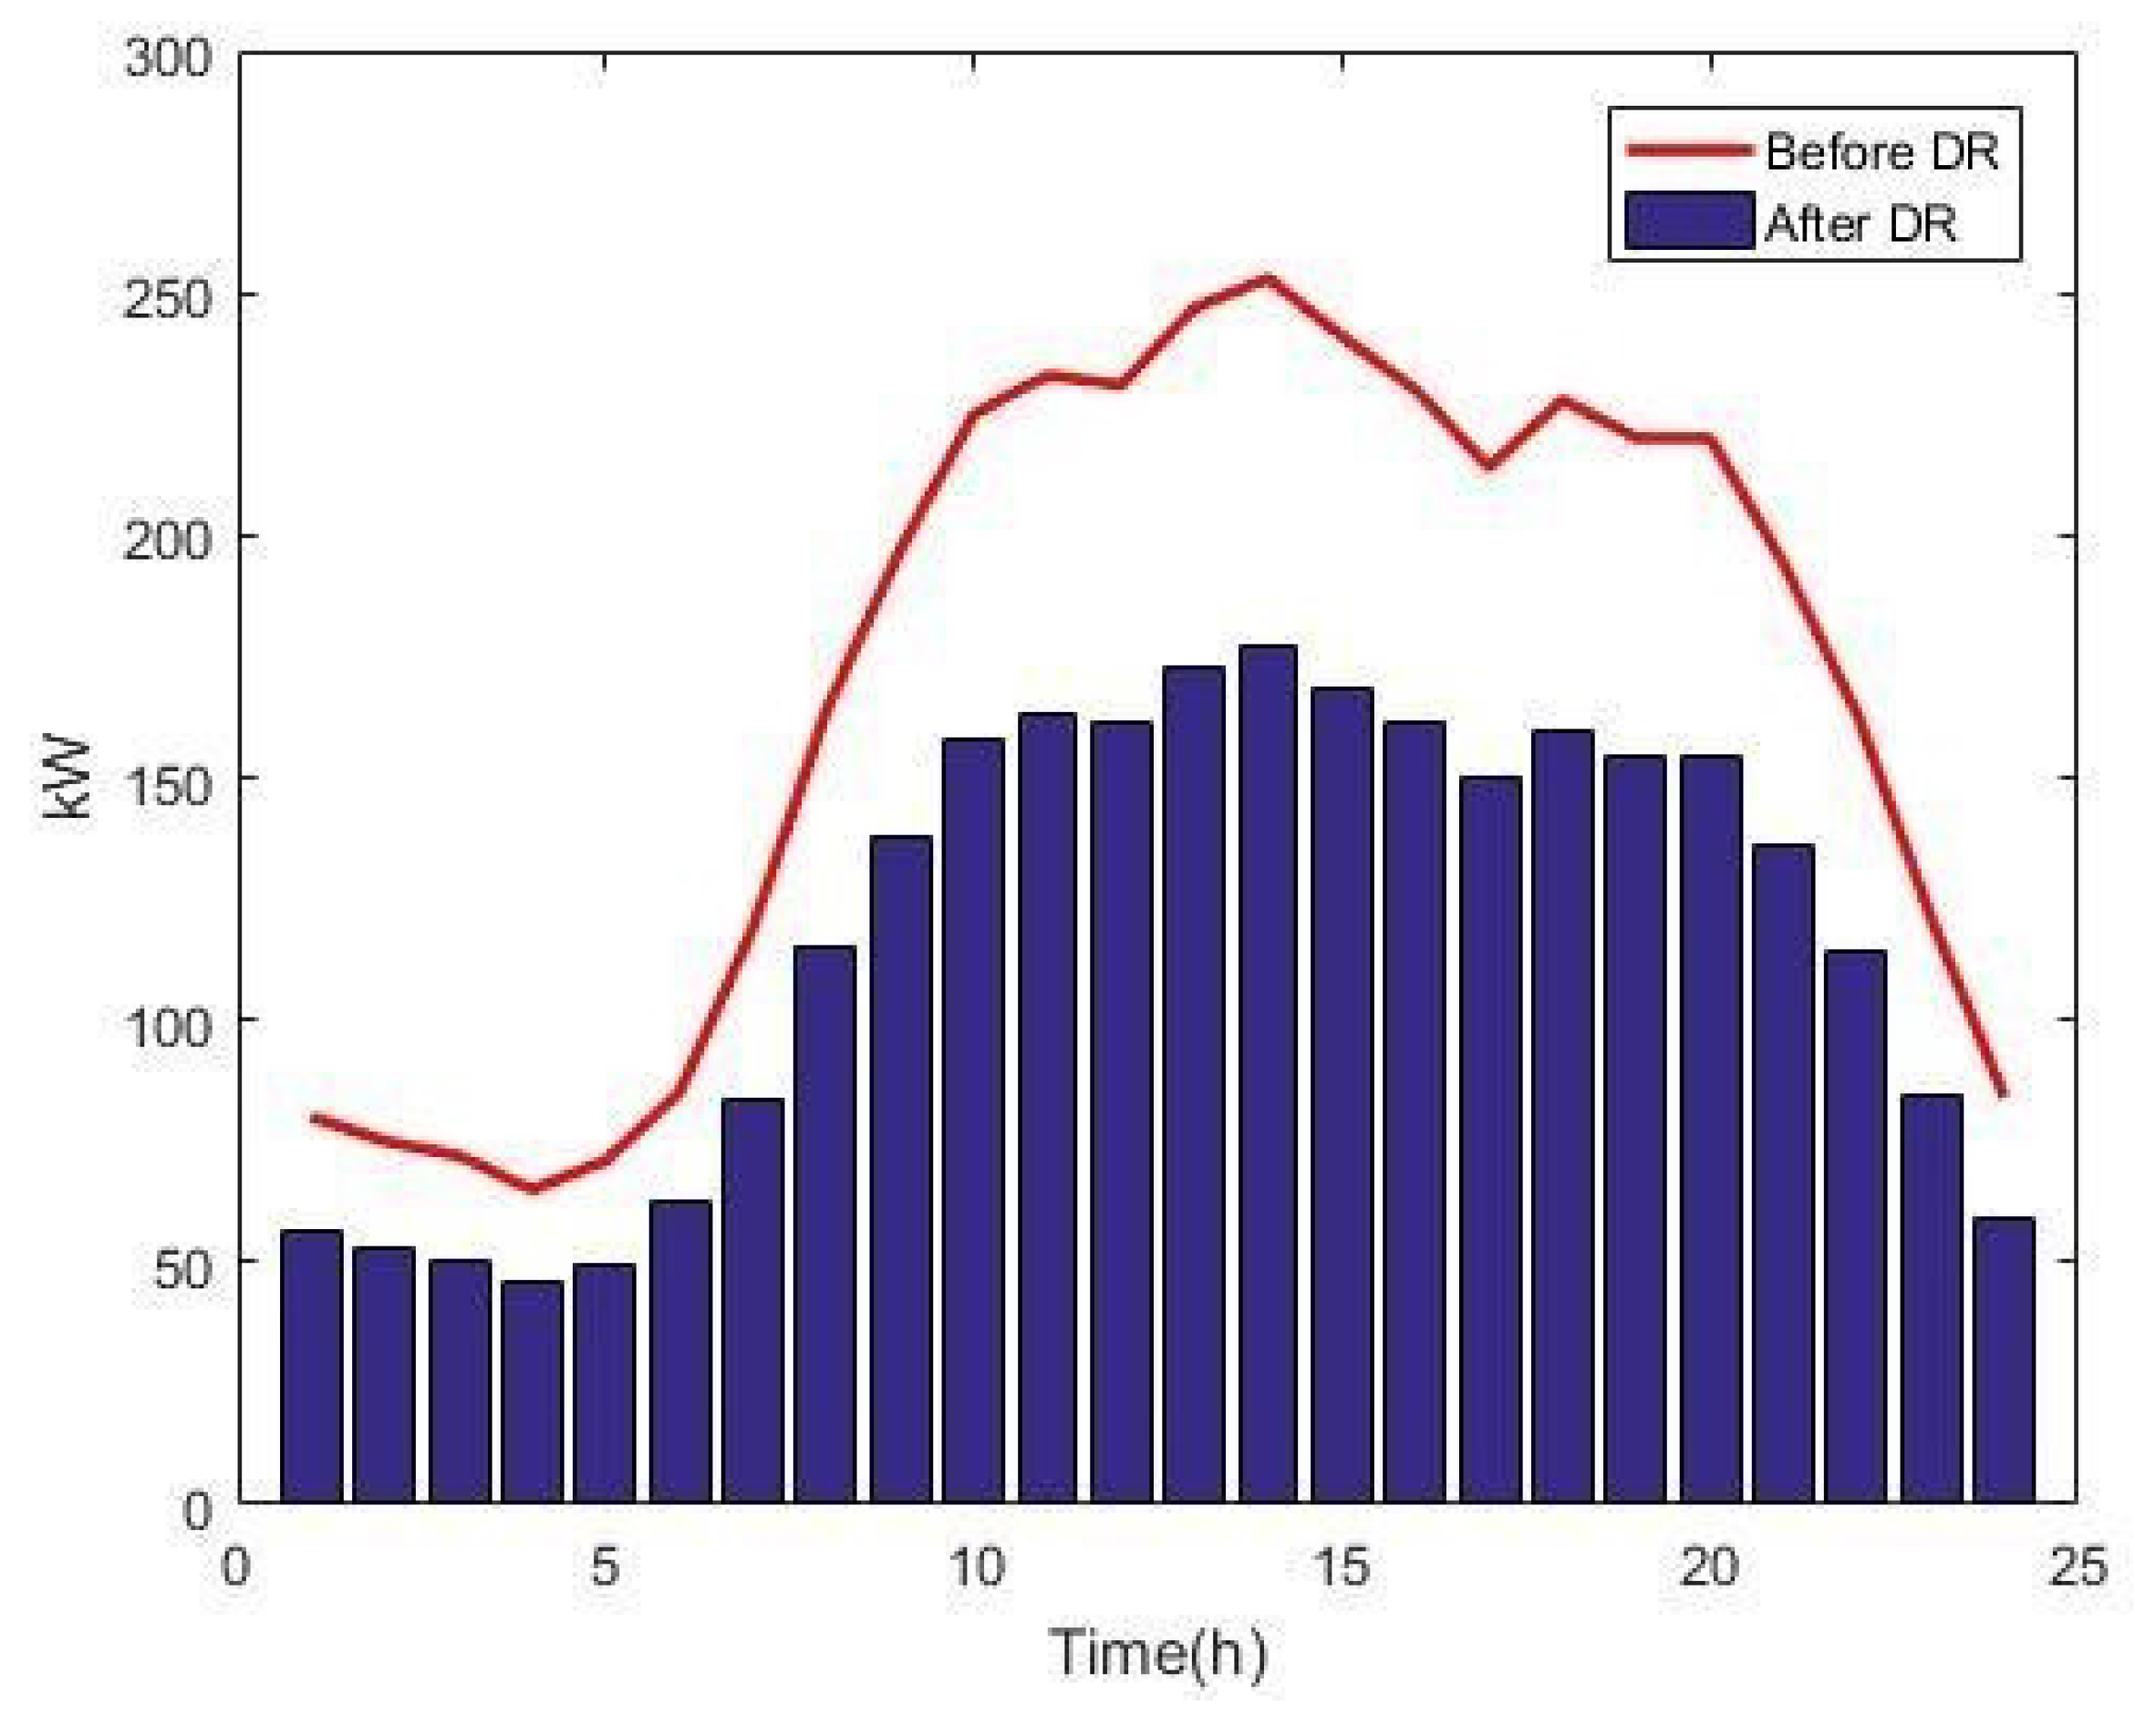
Table 3, the maximum discharge and charge power of the battery is also 30 kW, which is equivalent to one-sixth of the capacity of the battery. The suggested packages for DRP [
35] are represented in
Table 4. A maximum of 30% participate is assumed in these programs.


 ,
, 


