1. Introduction
In the current urban development process, to meet the concept of sustainable development, the management of land development is usually strengthened to promote the efficient use of land resources. The reasonable development of the land market, as a provider of various activities in the city, can not only play an important role in the sustainable development of the city but also promote the development of the city’s economy. In addition, the land market is inseparable from land resources, and it is necessary to fully consider how to protect land resources, maintain the ecological balance, and promote urban economic development. Land has long been regarded as a primary component of production, and it is also an important means of capital accumulation [
1,
2,
3,
4,
5]. In China, the political system and the sharp focus on rapid economic development have led to the governments exercising strong control over key elements such as land resources [
6,
7,
8]. Several studies have proven that the optimal use of land resources can be achieved through effective governmental control and the orderly operation of the market. Therefore, deepening the reform of market-oriented land allocation and building a highly efficient market-oriented land allocation system are conducive to activating economic development and inevitable requirements for improving the market economic system.
To improve China’s market economy system, it is necessary to construct a land market system that can accelerate the formation of a new development pattern with broad circulation as the main body and the mutual promotion of domestic and international cycles. At the same time, the land market exhibits heterogeneity in the spatial and temporal patterns. It is important to study the spatial and temporal pattern succession of land marketization in each region to carry out land marketization reform. To regulate the land market effectively and ensure rational allocation of land resources, it is critical to carry out relevant research on land marketization. The existing studies indicate that many scholars use a combination of theory and empirical methods to explore the problems in the construction and development of a land market. Ferenczi [
9] analyzes the role of clear property rights, sufficient information, and government regulation in the healthy operation of the land market during economic transformation. Miyake [
10] uses a quantitative method to develop the land market by establishing a competitive land market equilibrium and a discrete model that is representative of the land market. In Miyake’s study, the health of the land market is judged based on economic development and changes in land use. Abay Kibrom [
11] uses nationally representative survey data from Ethiopia, Malawi, and Tanzania to analyze and study the land area, market participation rate, and land price changes and how the land market will react. Xu Shi [
12] carried out standardized processing based on existing land marketization measurement methods and used statistical model analysis to measure China’s primary land market transaction data, exploring the characteristics of temporal and spatial differences in the degree of land marketization in China. Qu Futian [
13] sheds light on the marketization of land and its price formation mechanism based on an overview of the non-agriculturalization of agricultural land in China and discusses the impact of prices in various land markets [
14,
15] on the non-agriculturalization of agricultural land. Based on the perspective of the land market transaction structure, Song Yang et al. used comprehensive spatial analysis models to analyze land marketization in the Yellow River Basin [
16]. Research on land markets has been increasing, but little attention has been paid to the trend of land supply under marketization and non-market mechanisms within the land market. Land market research tends to be conducted on a spatial scale and the topic is mostly studied at the national level. Economically developed areas at the regional level [
17,
18,
19,
20,
21,
22,
23] constitute the most researched areas. Thus, it is urgent that we conduct research on land marketization in prefecture-level cities in the northwest region, including Shaanxi, to promote land marketization in the central and western regions. However, there is a dearth of spatial trend research, and the application of such trend models could serve to enrich and expand land marketization system research.
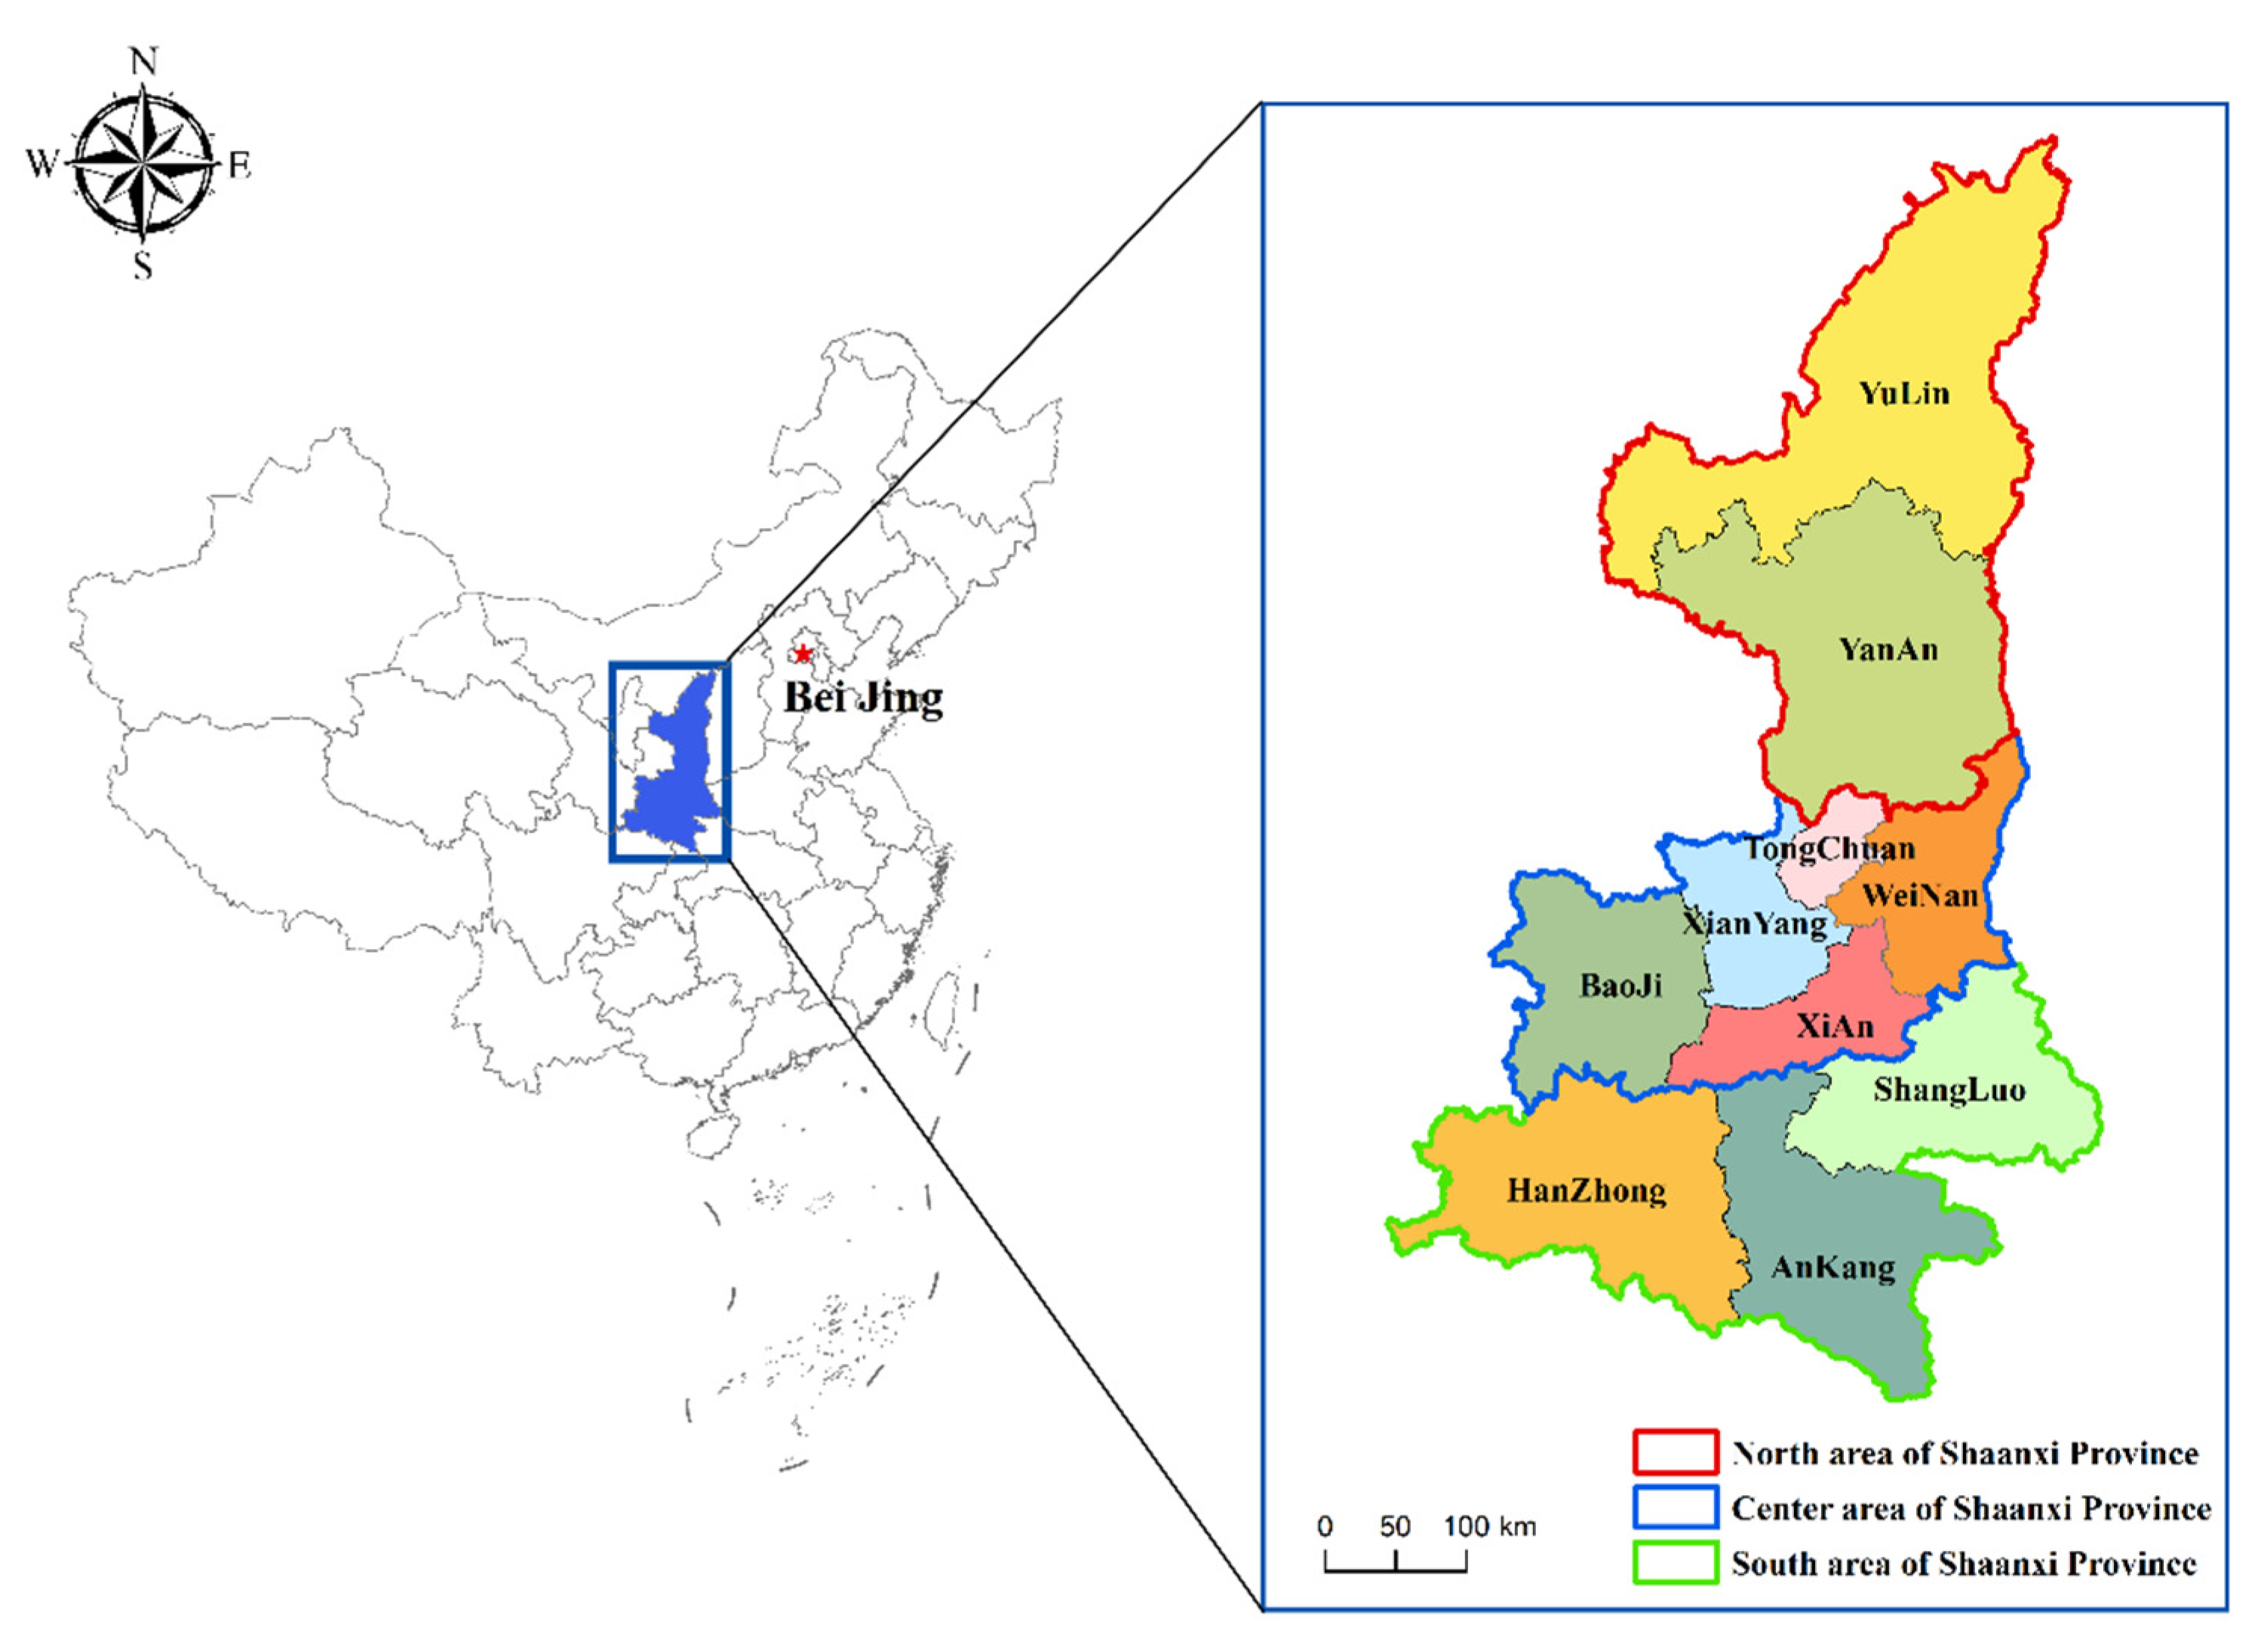
Therefore, to promote the sustainable and healthy development of land, this study investigates the question of how a land marketization system could be built using data from the land market monitoring system in Shaanxi Province from 2008 to 2019. The Mann–Kendall Test (MKT) is used to show the change in land transactions in the average trading area using three ways of supplying land (Bidding–Listing–Auction (B-L-A), protocol, and allocation). The degree of land marketization was quantitatively measured by a standardized treatment, and the temporal and spatial pattern succession of land marketization was further analyzed. This revealed that using the B-L-A method to obtain land was a more suitable reflection of the market mechanism. We determine the land-marketization-influencing factors by taking foreign direct investment, non-agricultural output ratio, per capita disposable income, fixed asset investment, and urbanization development level as influencing factors and exploring these driving mechanisms.
3. Result Analysis
3.1. Trend Analysis of Area (Land Size) of Land Supply
Since land supply is executed through three transaction modes (B-L-A, protocol, and allocation), three trend analyses were conducted to calculate average areas of land supply through each mode in 10 prefecture-level cities from 2008 to 2019 (see
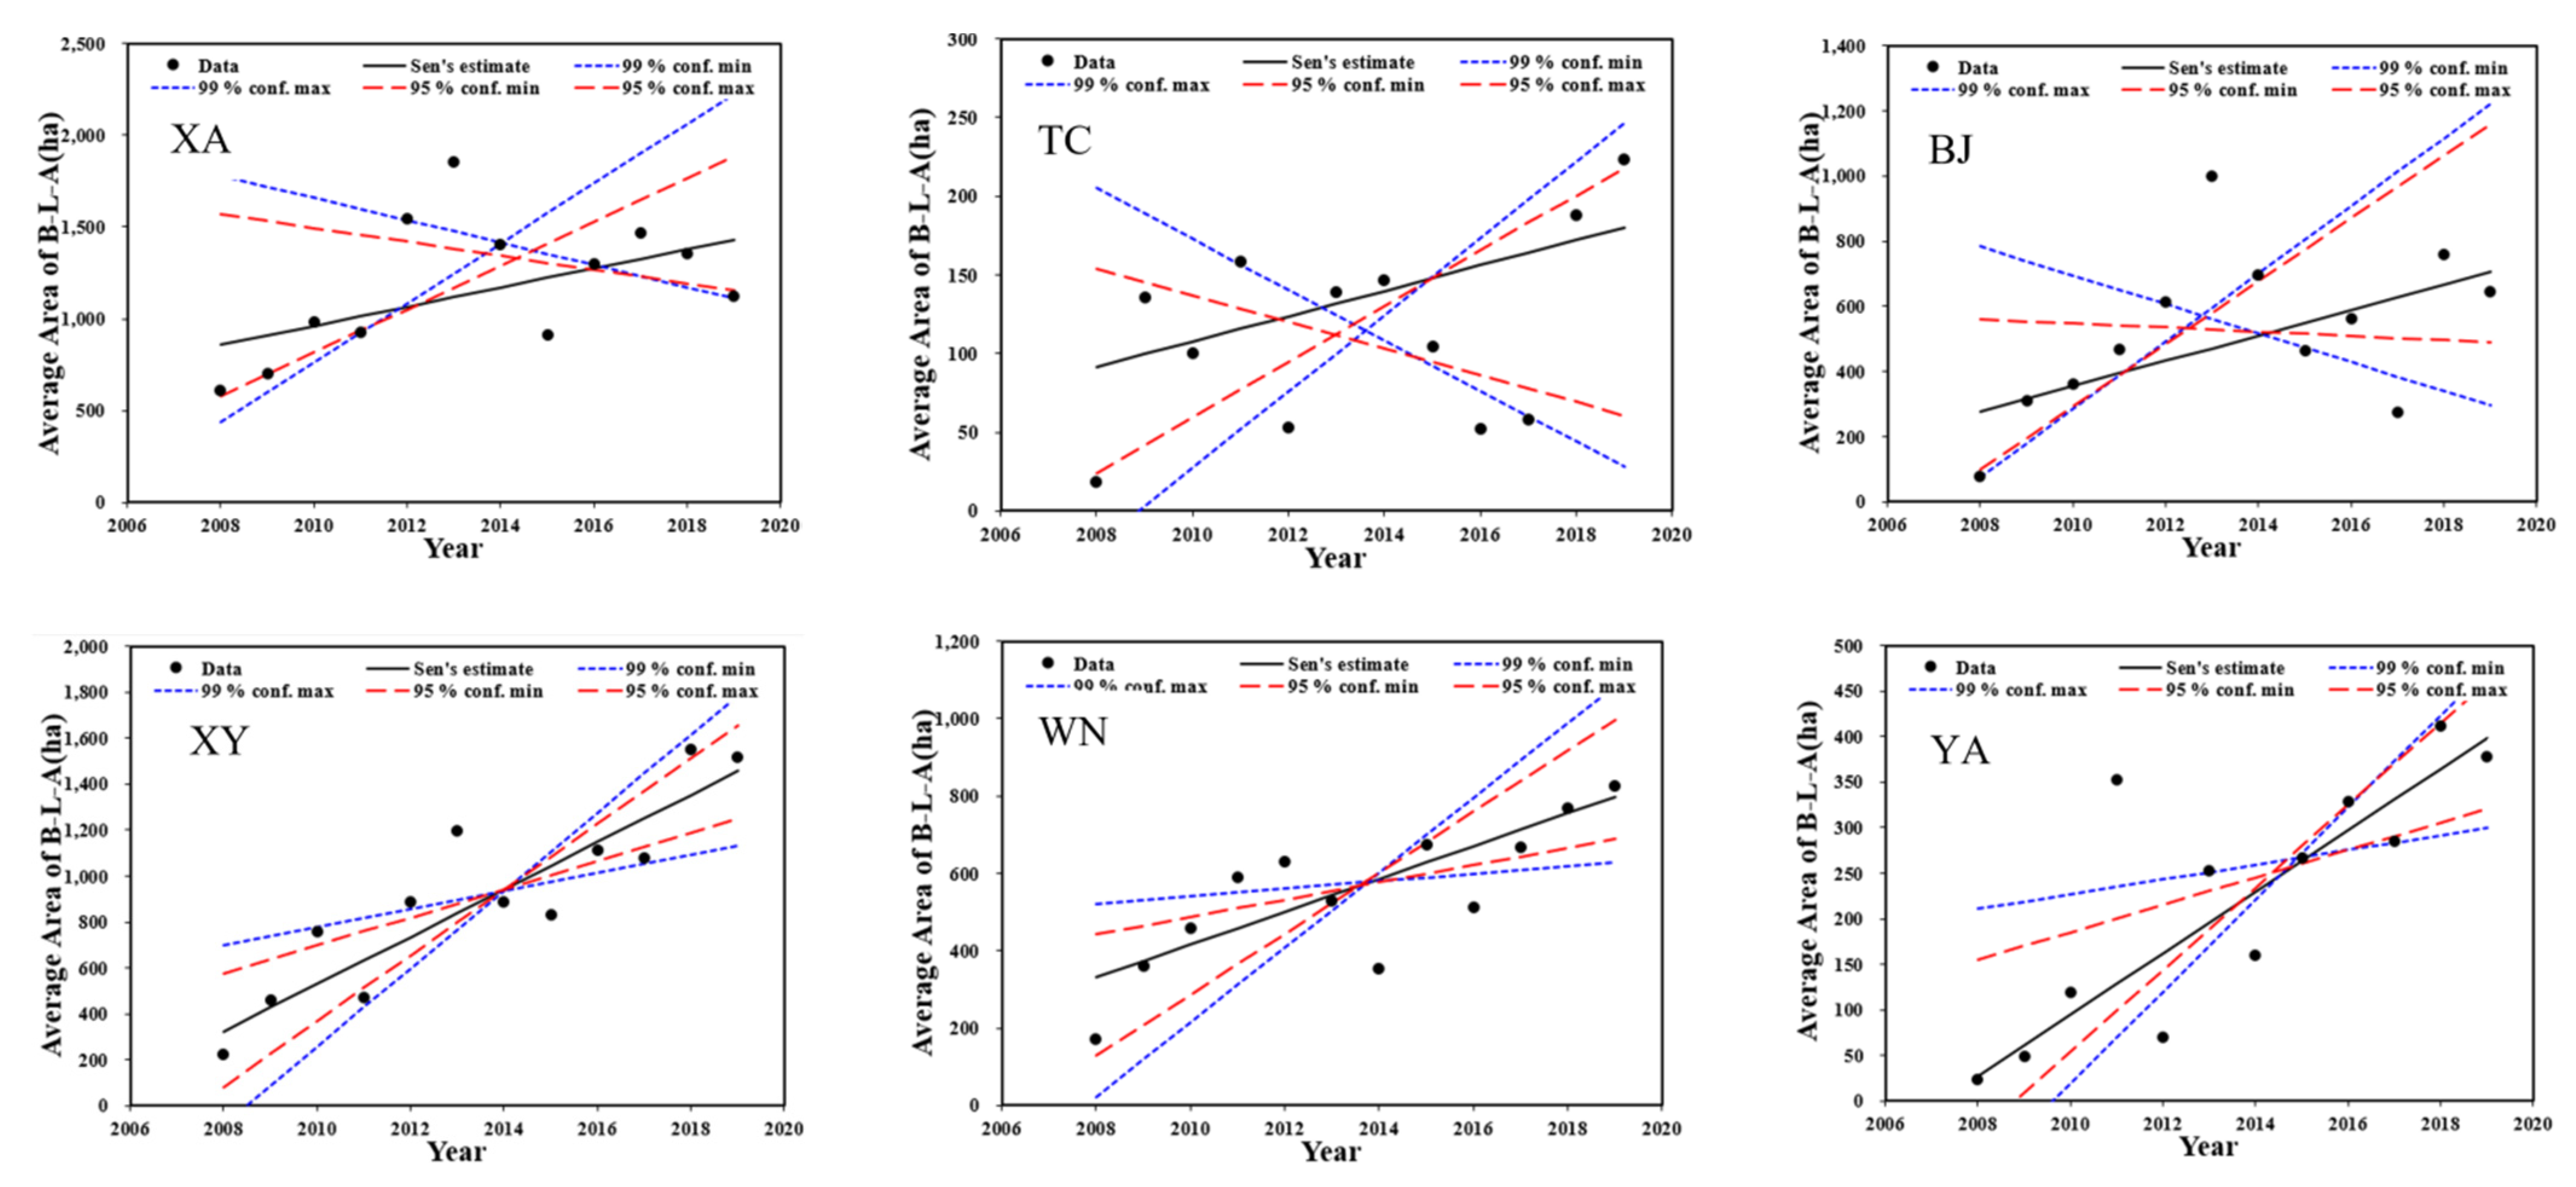
Table 2). The average area sold through B-L-A in the 10 cities shows a significant increasing trend, and the allocation and protocol methods are heterogeneous due to the different needs of the cities regarding construction land. Thus, the proportion of B-L-A increased and the overall level of marketization improved in Shaanxi Province.
Figure 2 shows the change trend of the mean area in the B-L-A mode. The increasing trends of XY and YA are the most obvious. XY increases from 200 hm
2 to 1600 hm
2 and is closely distributed around the trend line. YA increases from less than 50 hm
2 to 400 hm
2, with an increase of nearly 700%. YL and SL exhibit a slow upward trend.
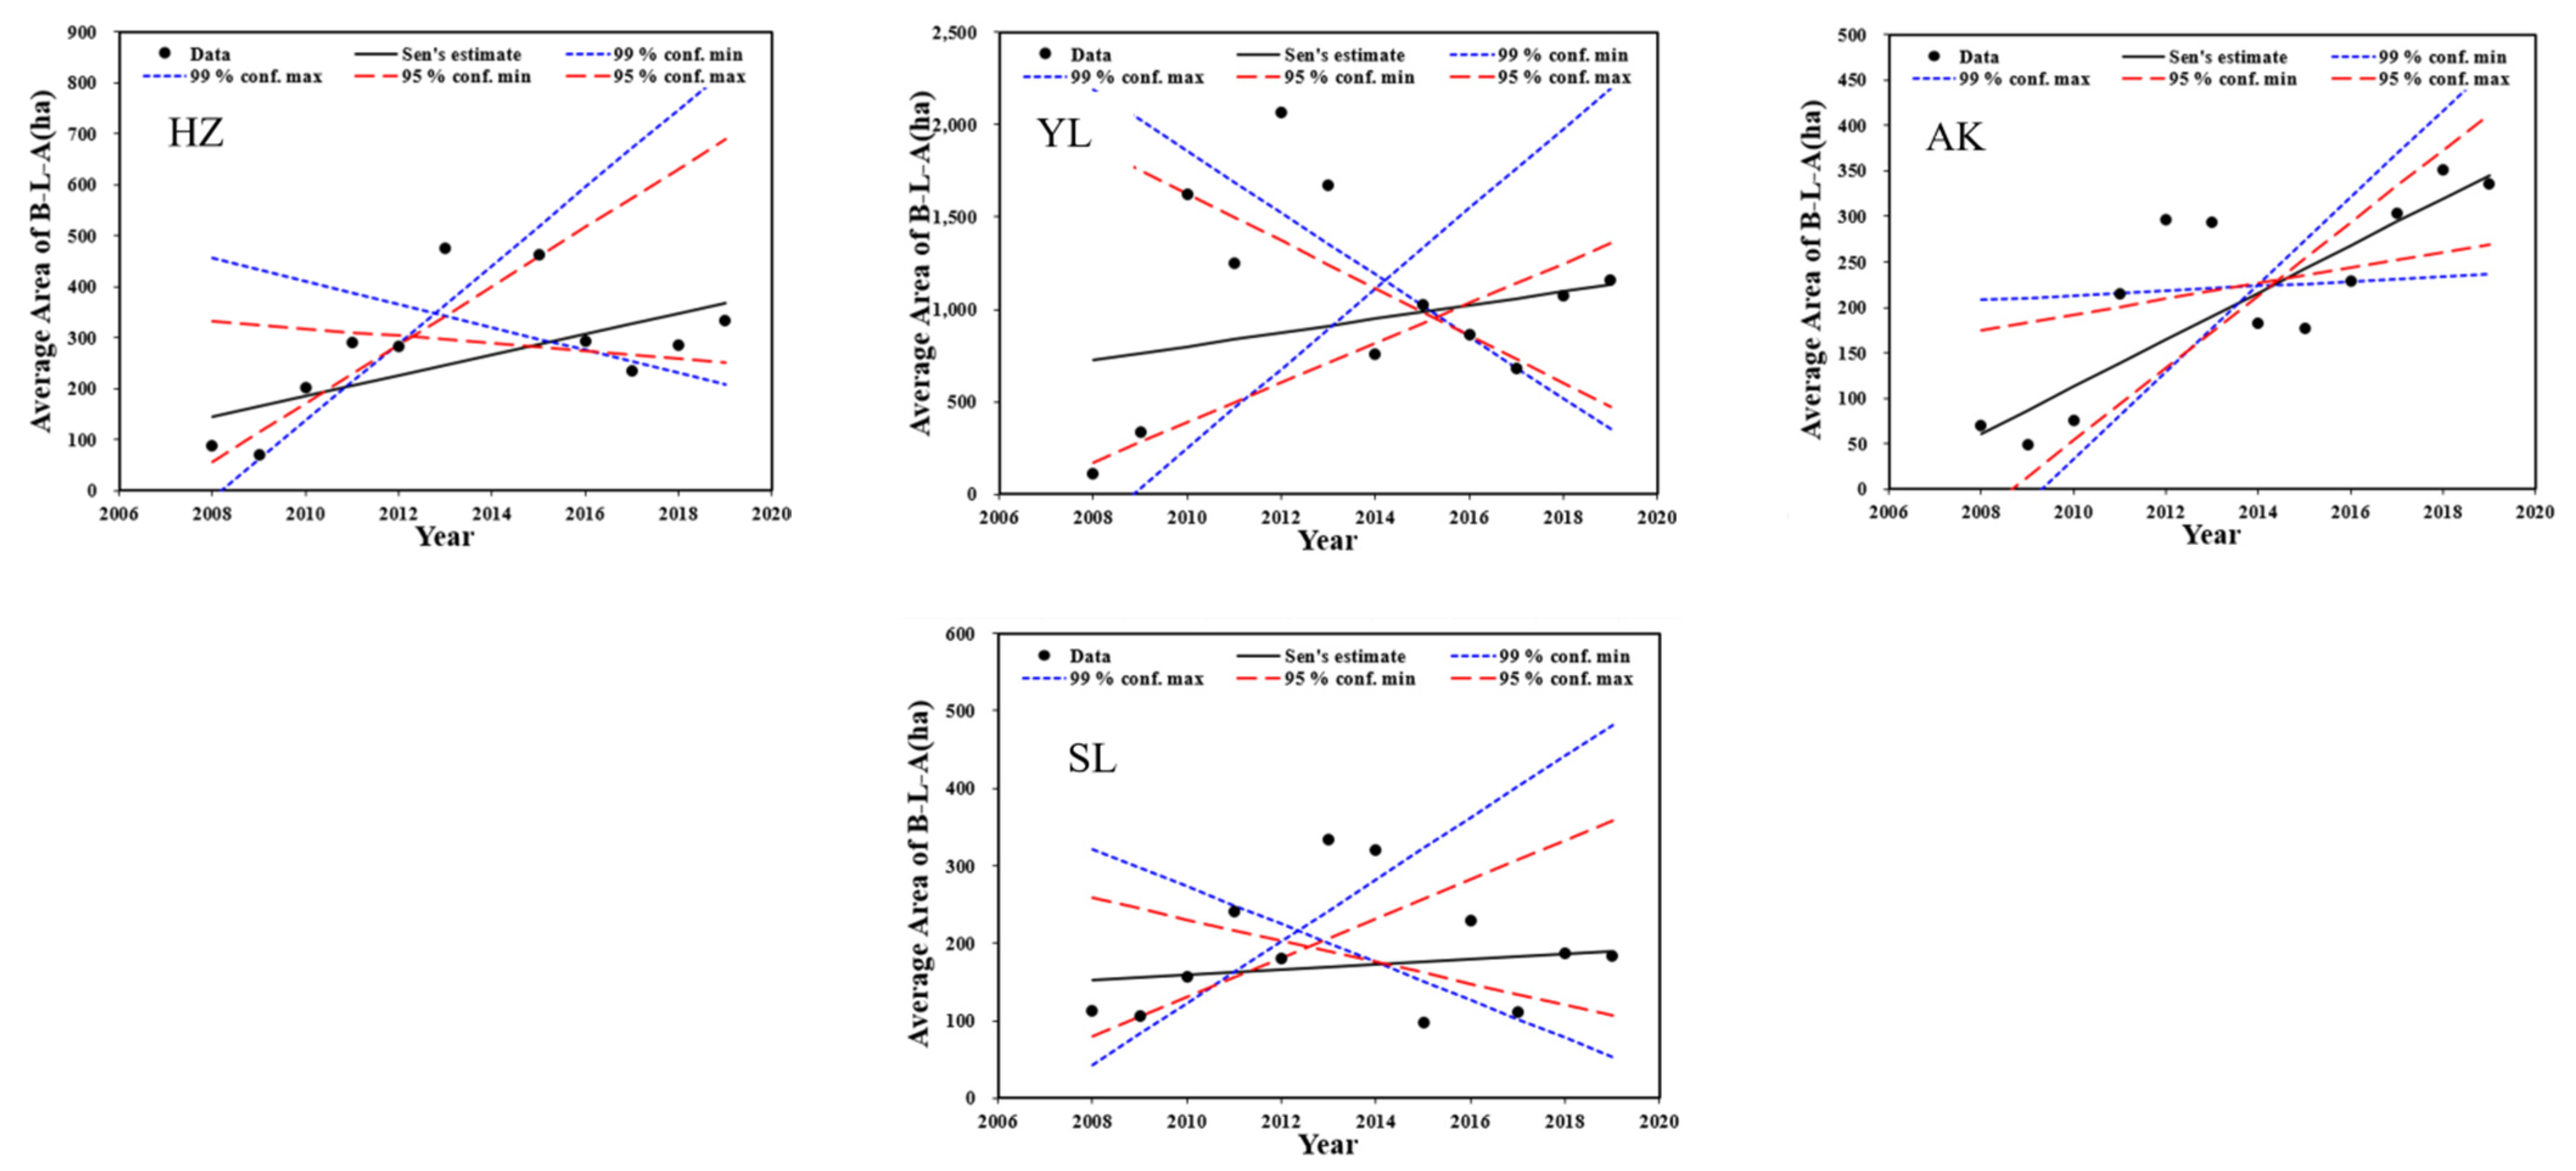
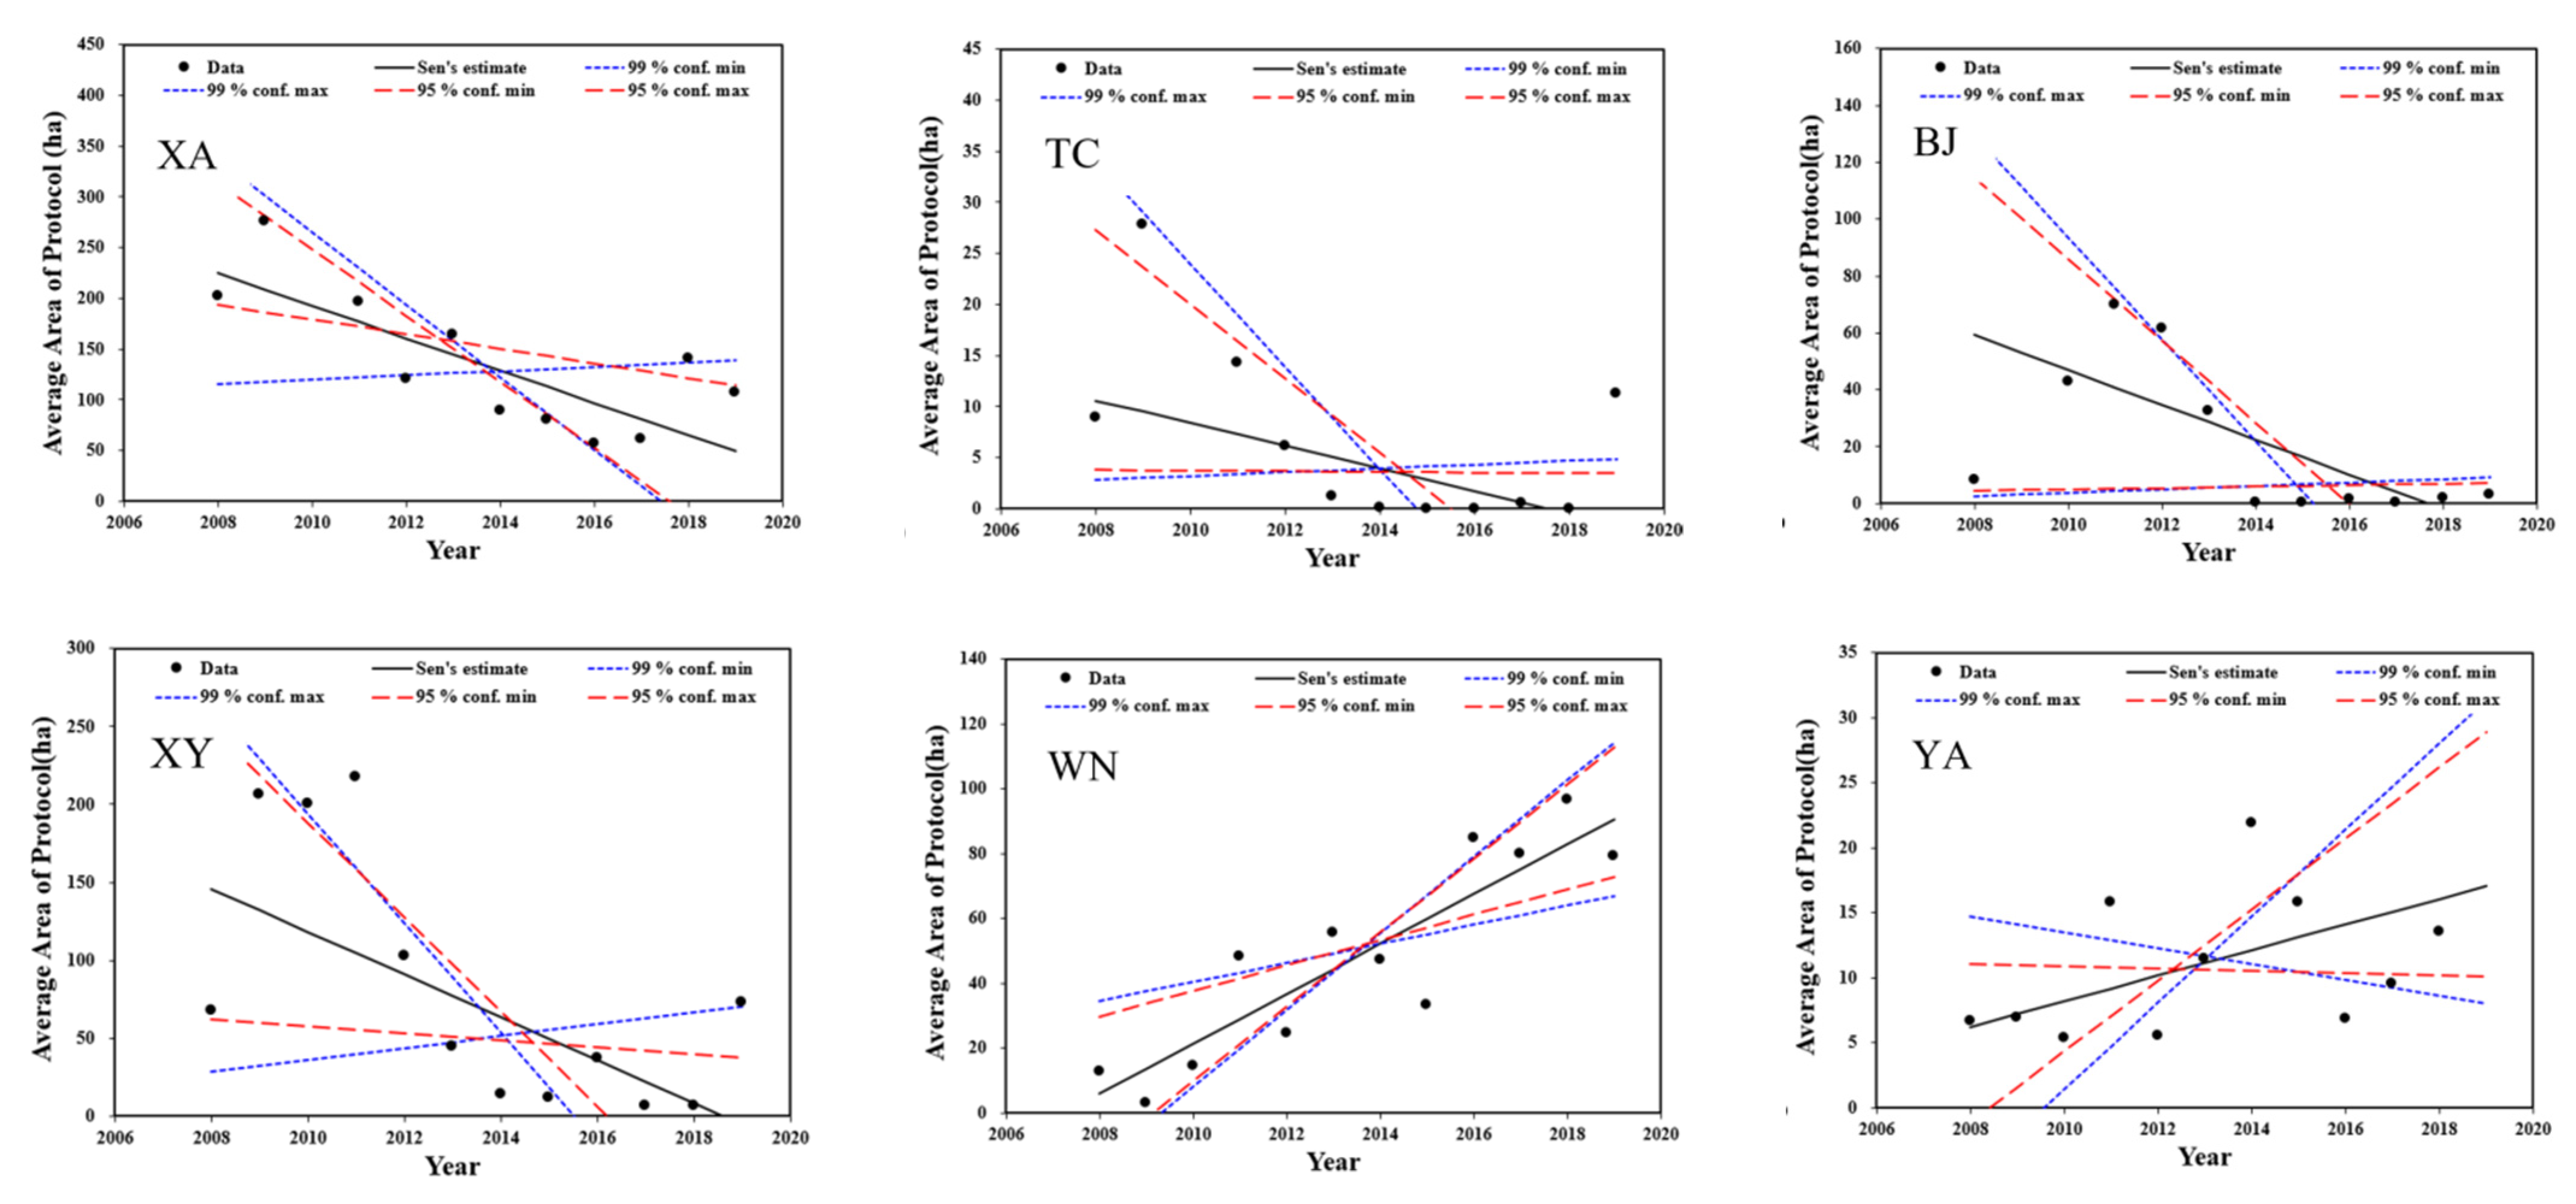
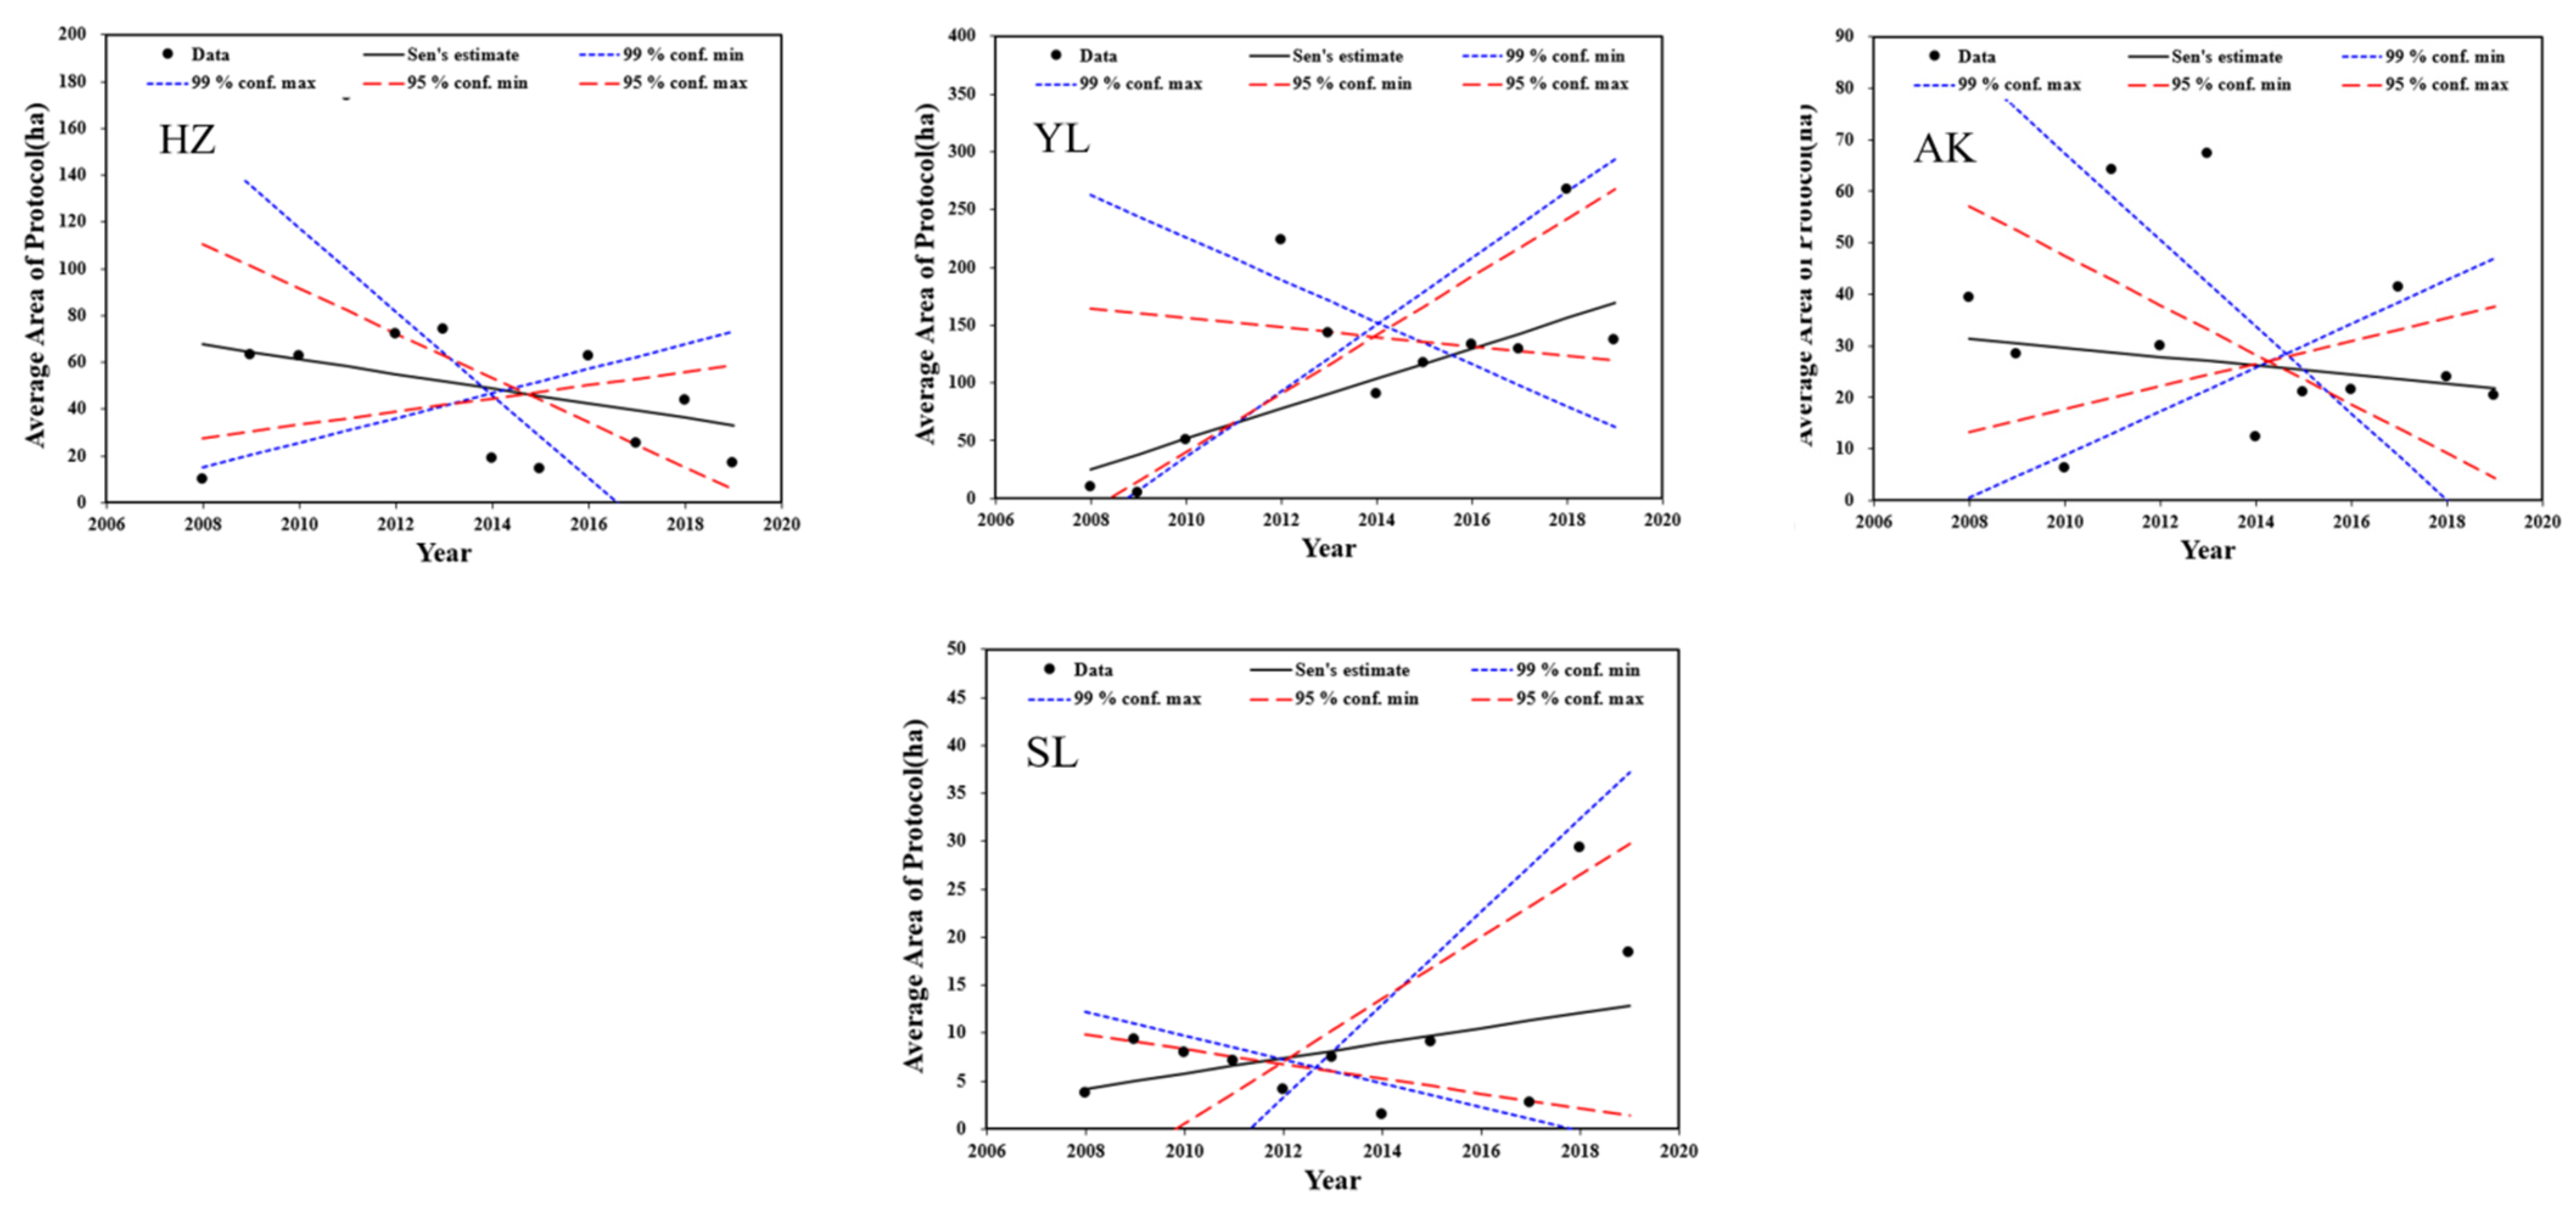
As
Figure 3 shows, there are regional differences in the average trend pertaining to land area in the protocol mode. XA, TC, BJ, XY, HZ, and AK show a significant decreasing trend, and WN, YA, YL, and SL show an increasing trend. TC and BJ were close to zero from 2013 to 2018; AK shows a gentle decreasing trend and is scattered around the trend line.
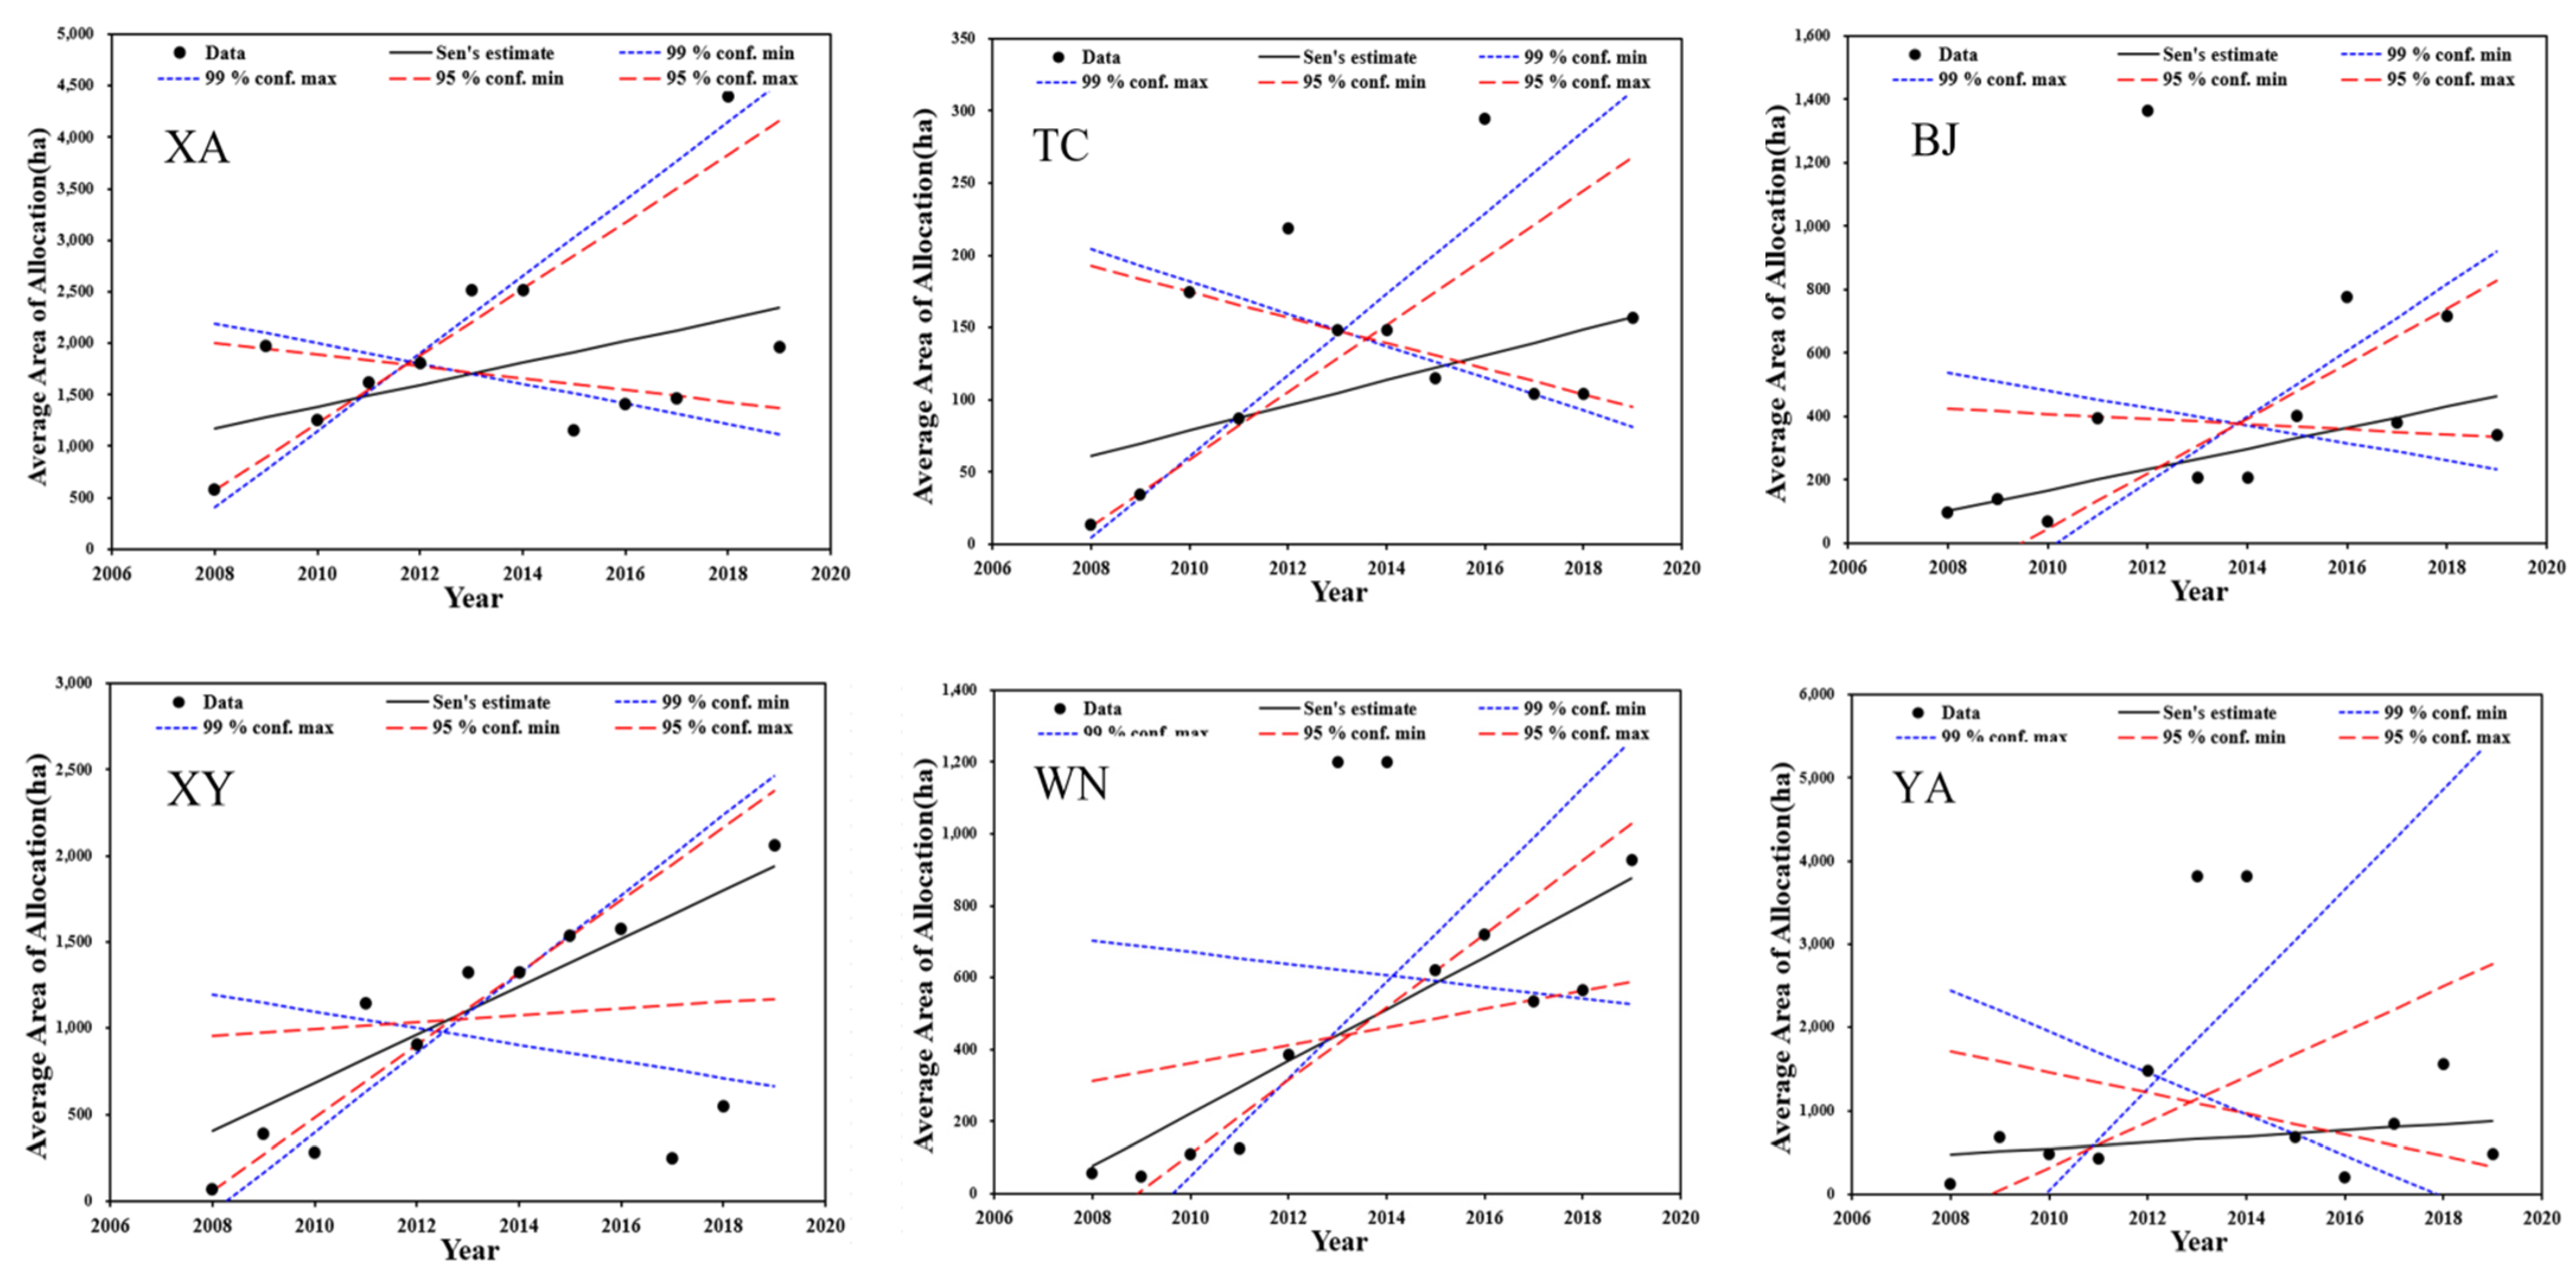
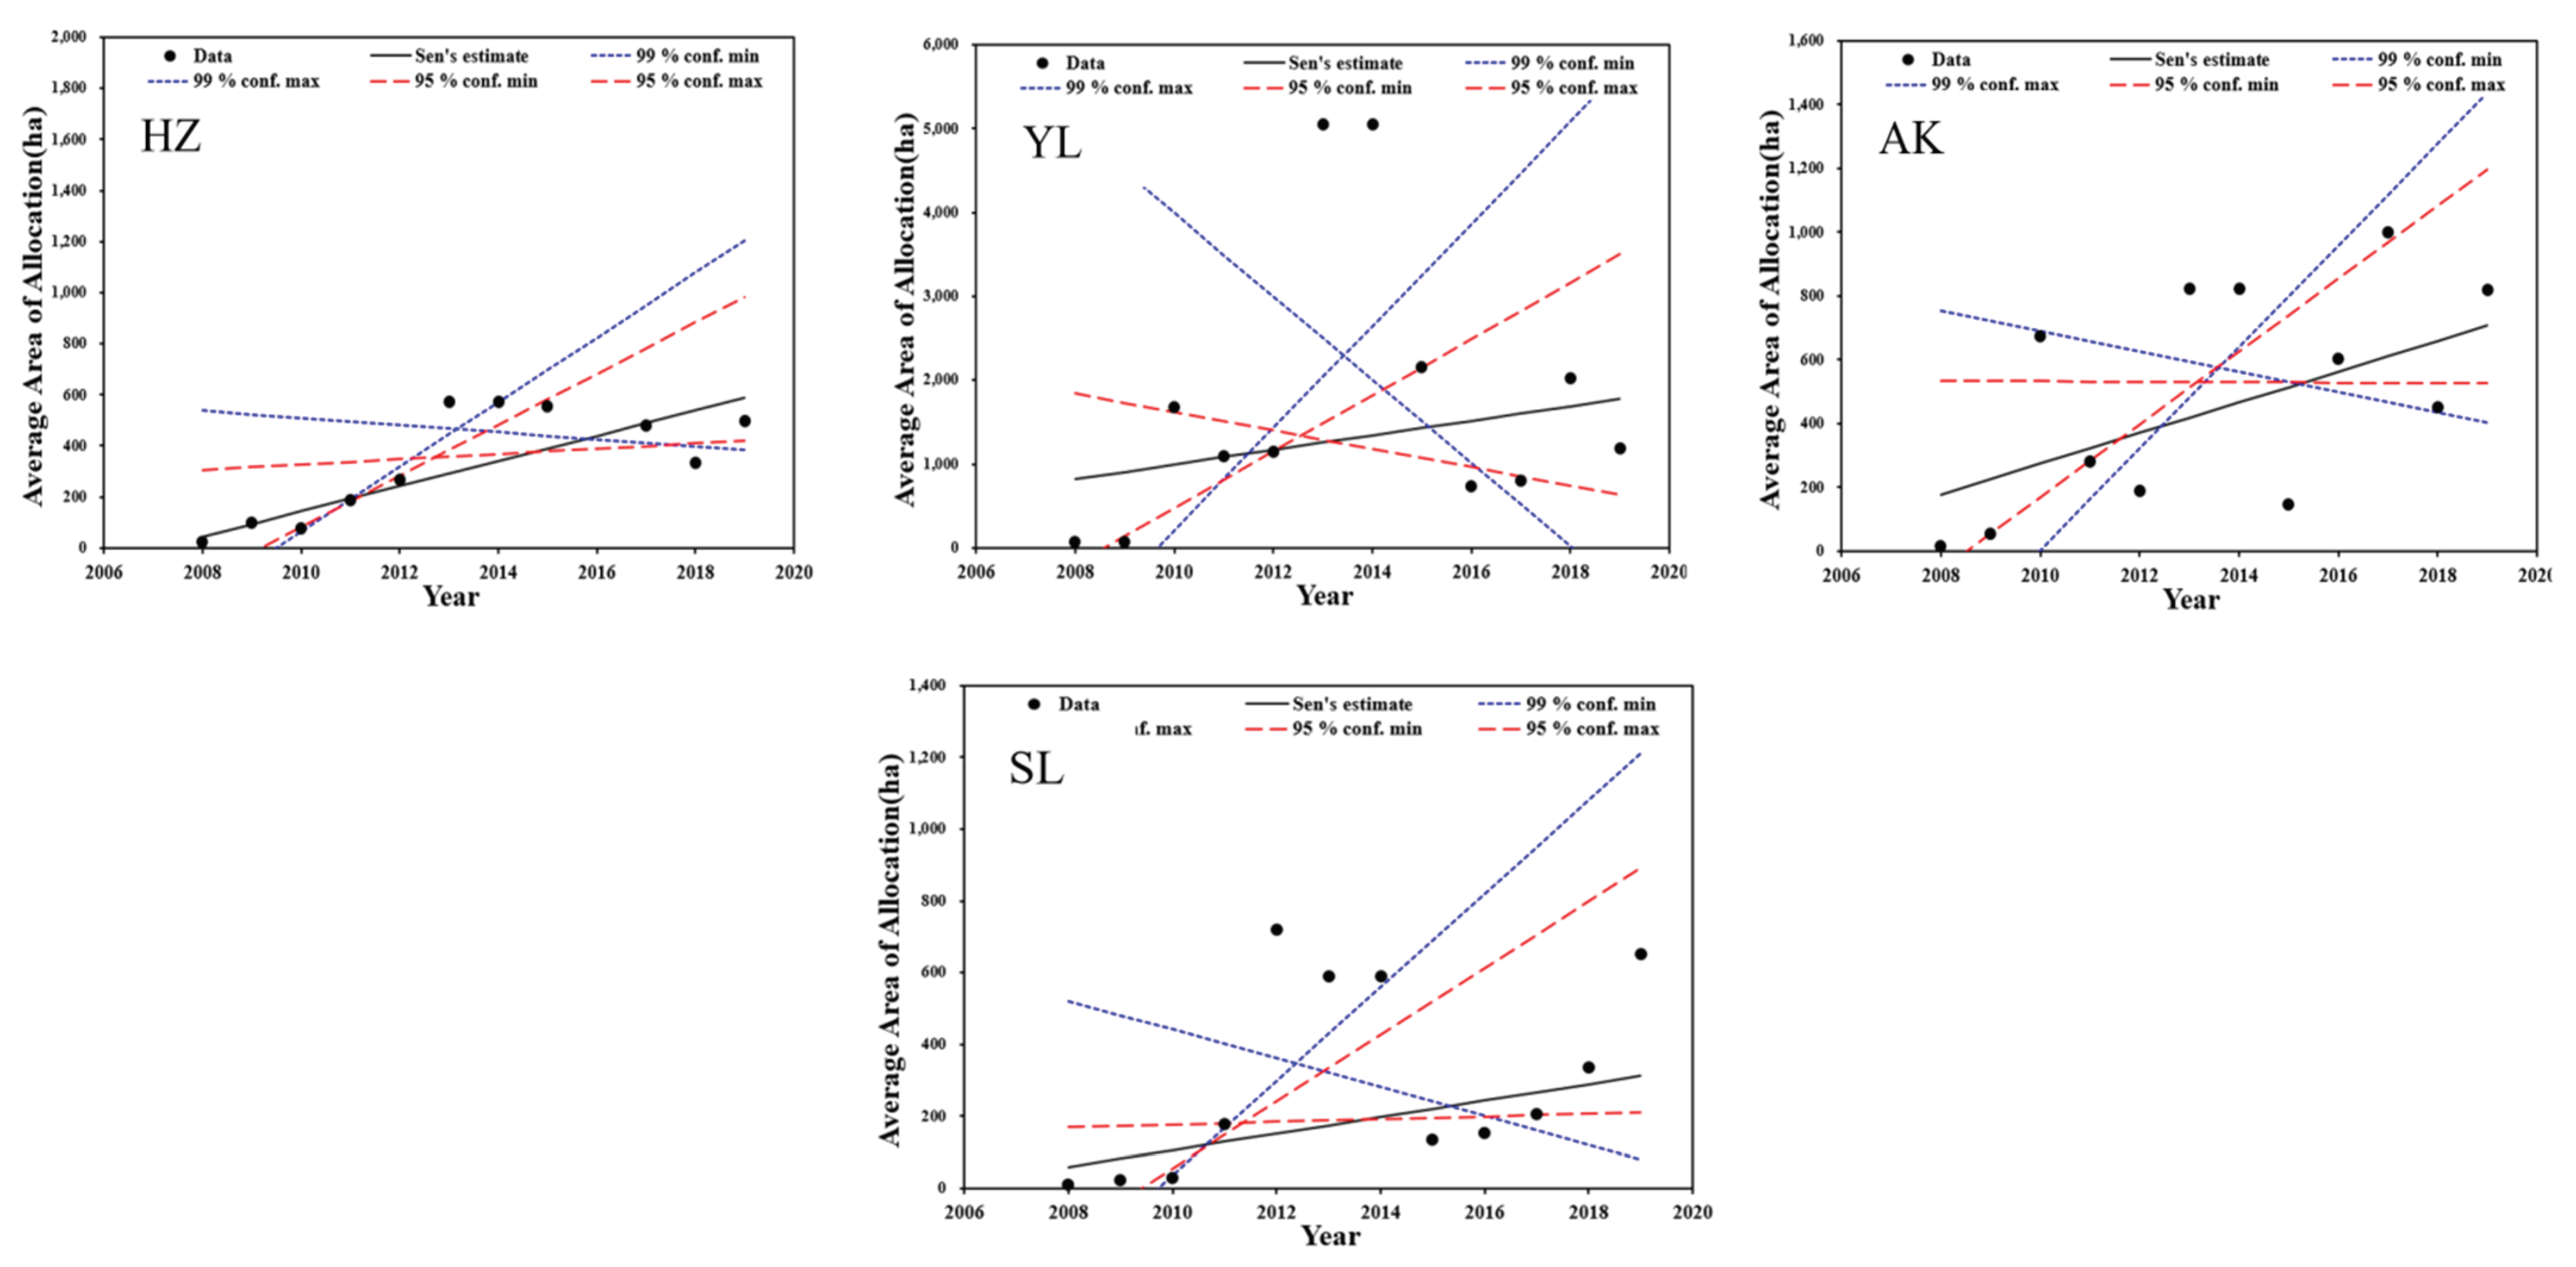
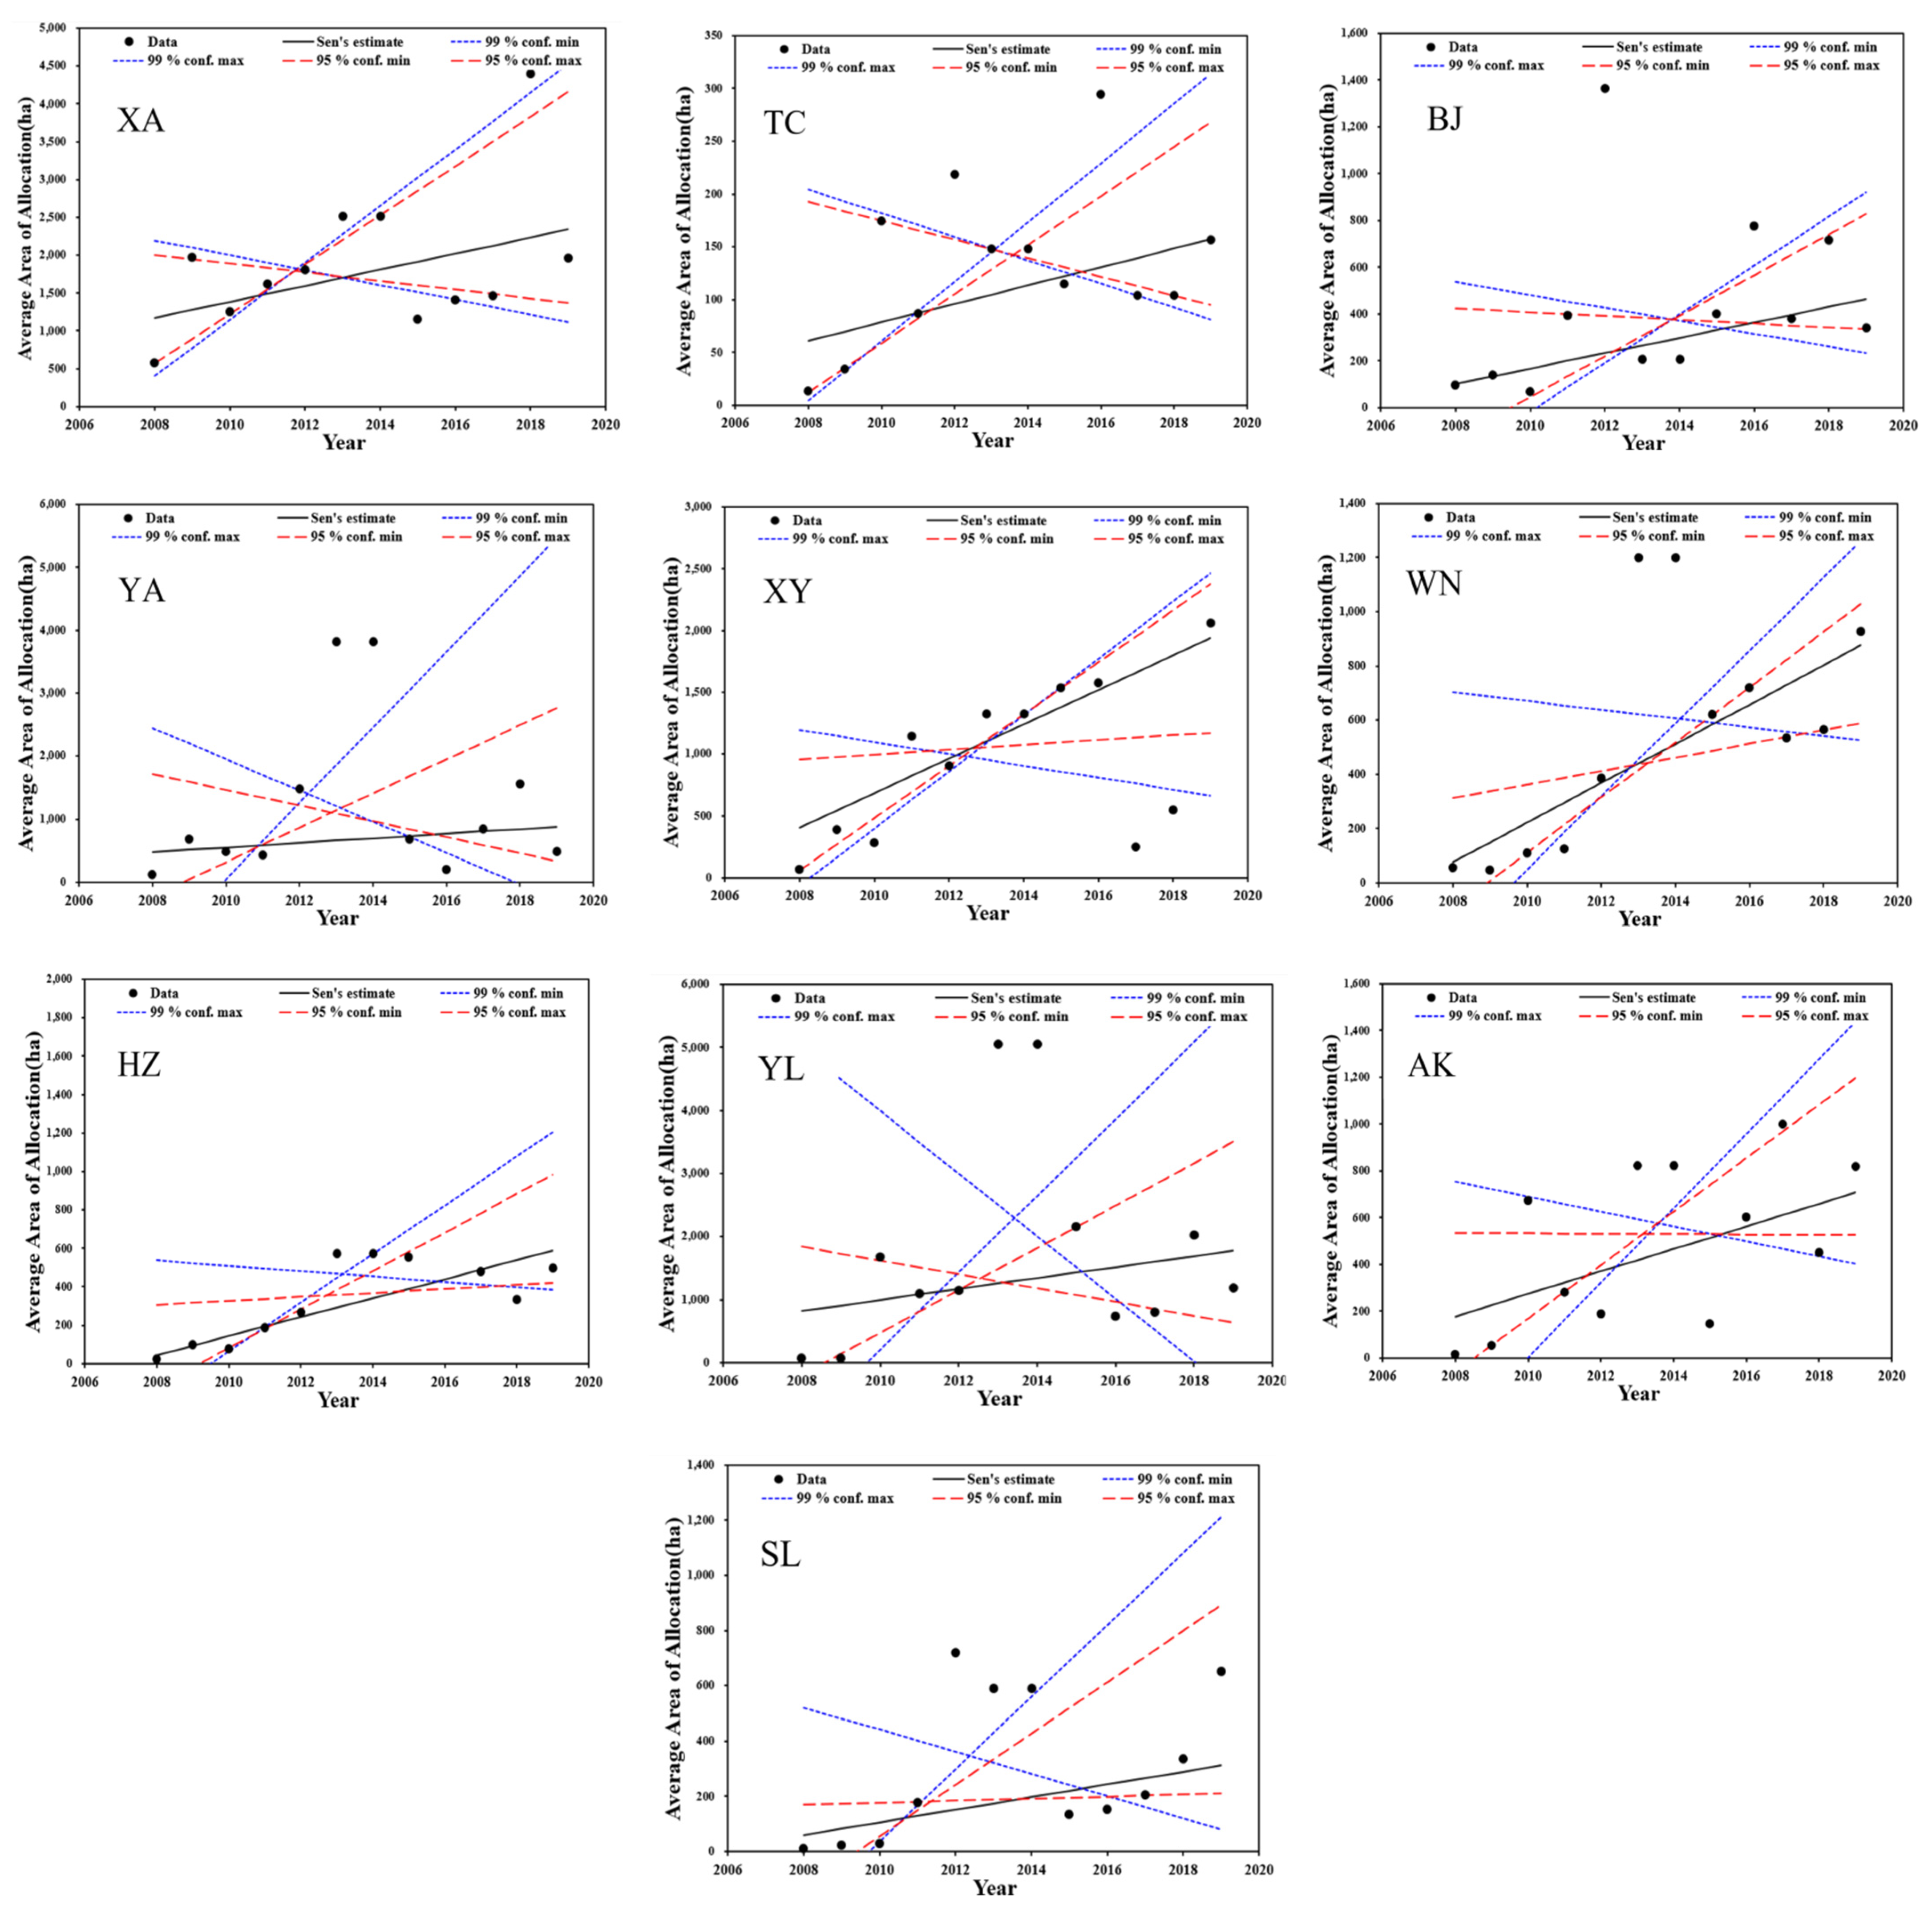
The average land area by the allocation mode (
Figure 4) shows an overall upward trend, and the change range varies from region to region, showing a discrete distribution. XY shows an obvious increasing trend with an extreme value of more than 4500 hm
2. The rising trend of XY is close to the trend line, and its extreme value is almost zero. HZ is on the rise, and its value fluctuates between 0 and 600 hm
2.
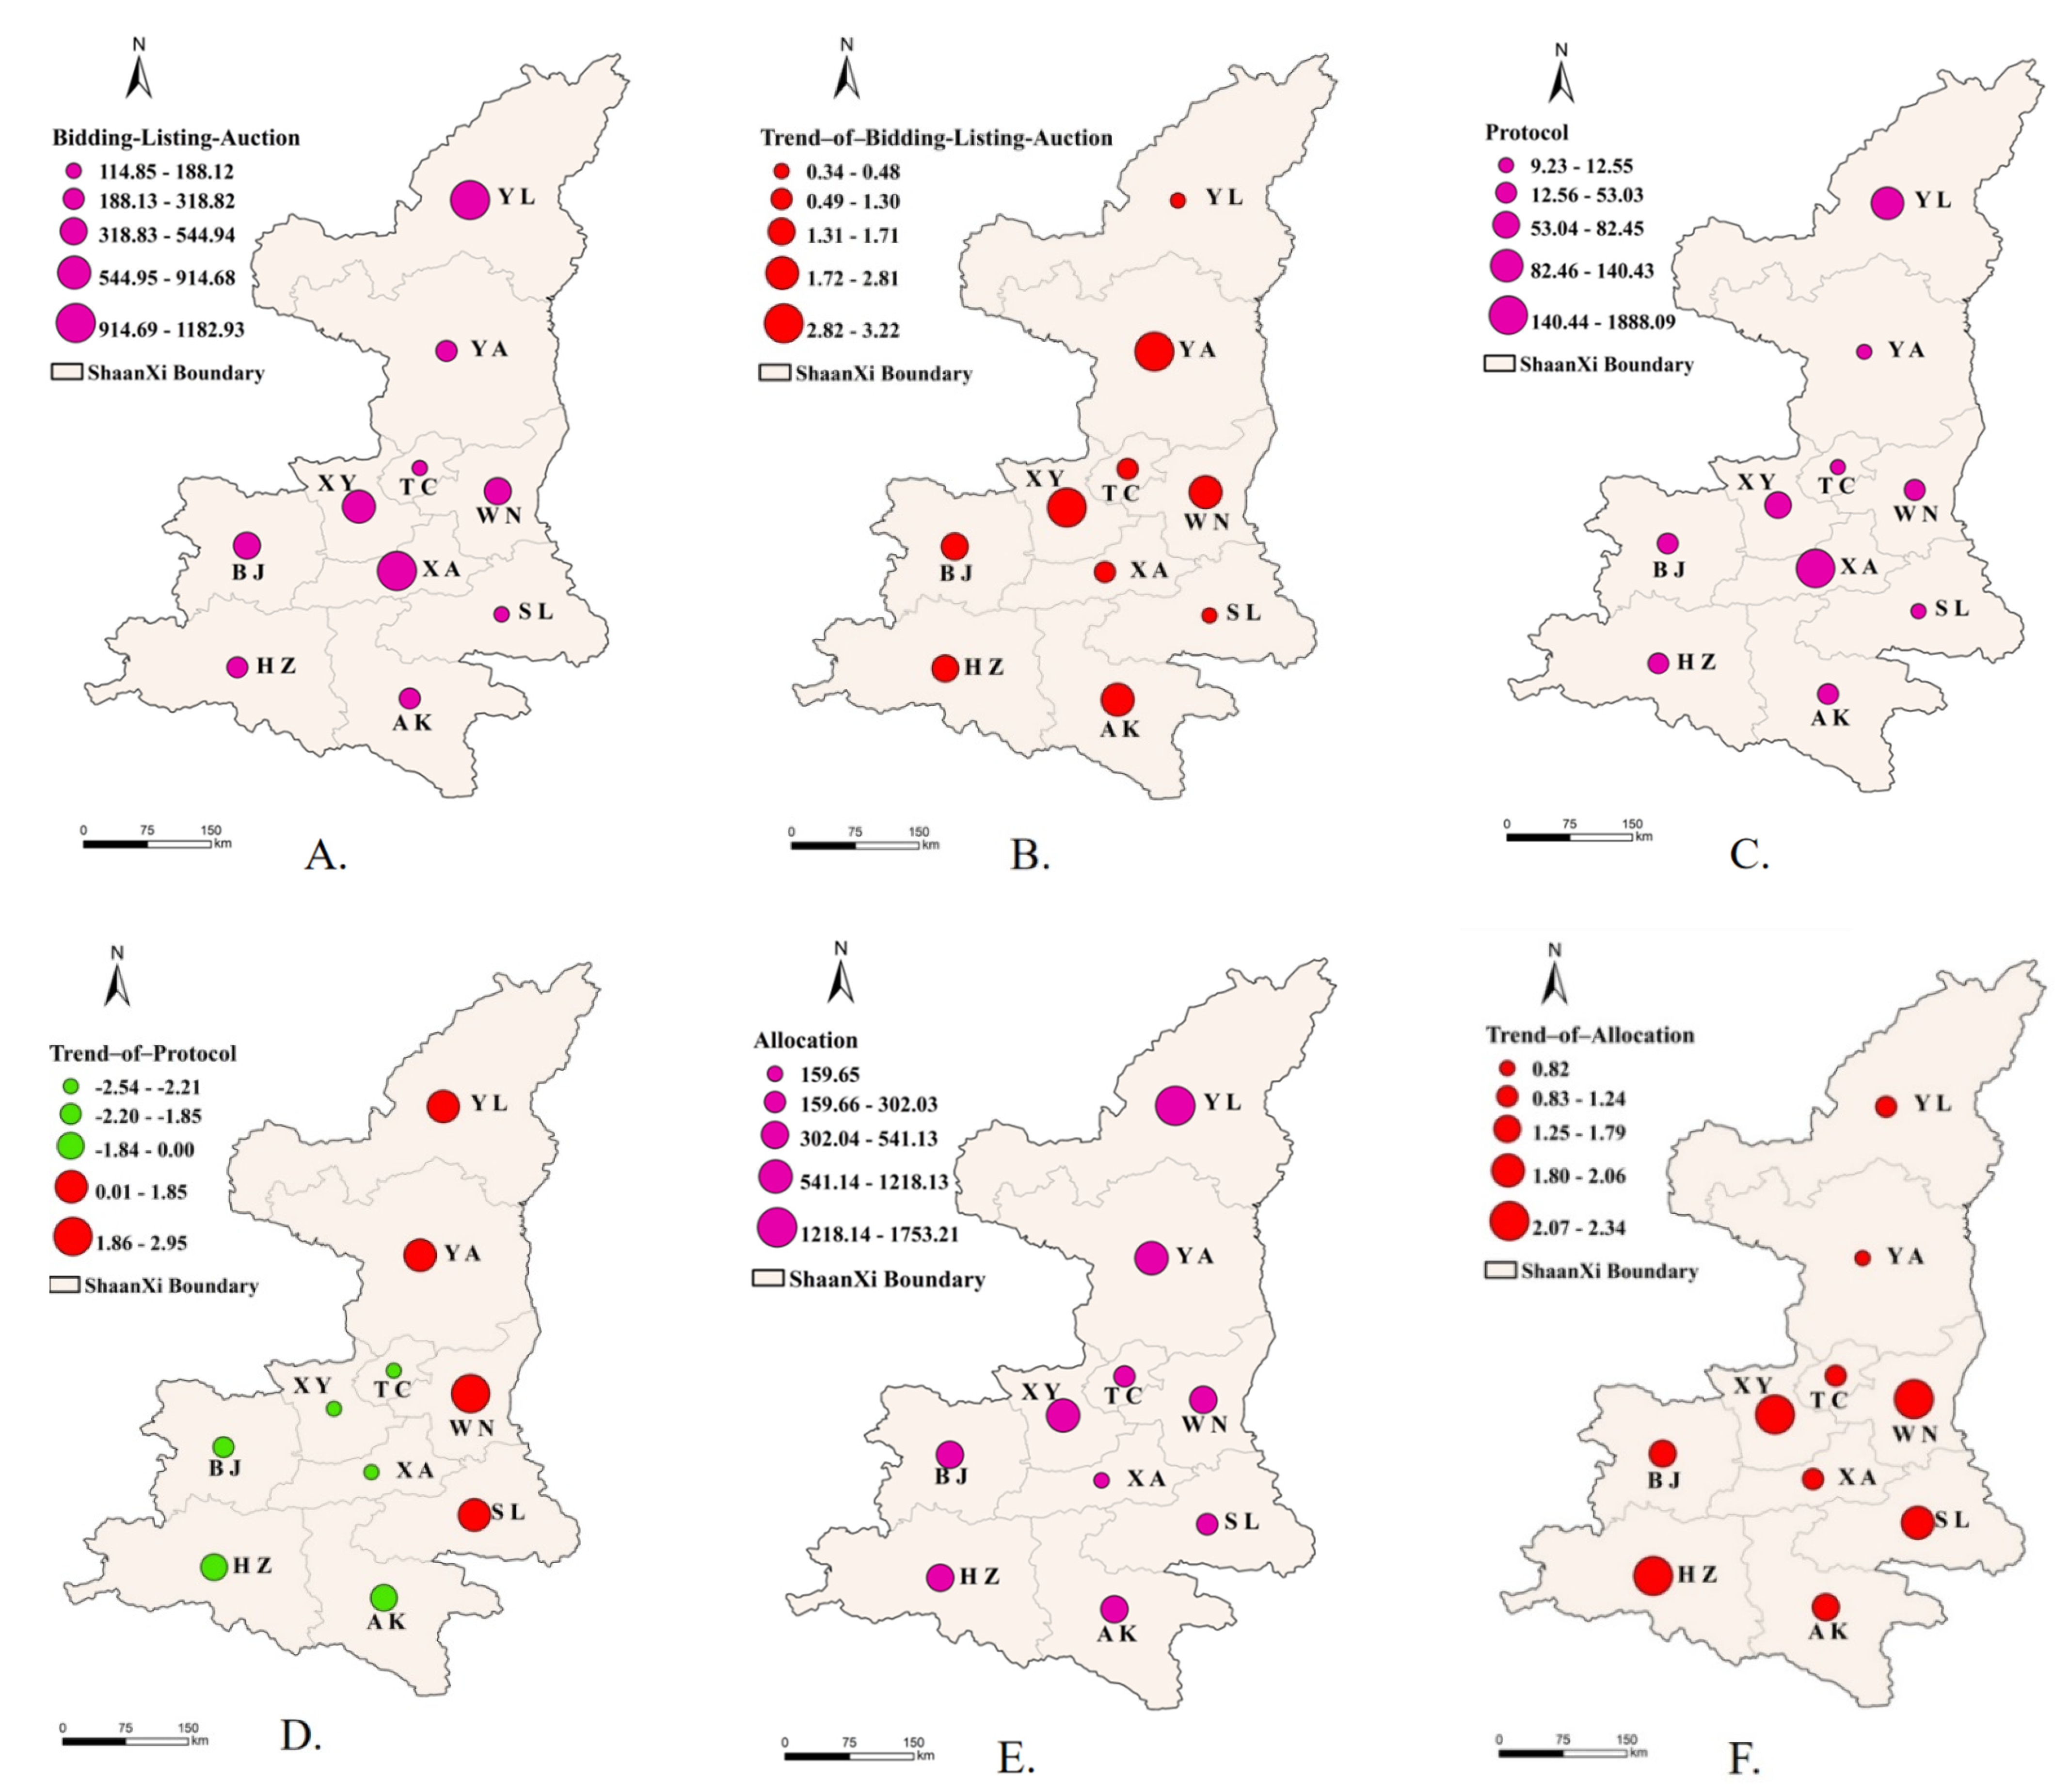
As seen in
Figure 5, most cities have high average area values of B-L-A, but TC and some cities located in the south have a low average area of B-L-A. This may be a result of urbanization, since, compared with the central area, the south of Shaanxi is slower in this regard. All cities show significant increasing trends in B-L-A. The average value of protocol decreases significantly from central areas to both the east and the west, with YL showing high protocol values. Most cities, except for YL, YA, WN, and SL, show decreasing trends in protocol. This may be the result of the rapid economic development in northern Shaanxi Province. Allocation shows high average values for the central and northern areas, and low average values for the southern area of Shaanxi Province. Overall, the allocation trend reflects a significant increase in the province. These trends indicate that the introduction of the B-L-A transfer method was more prevalent in the market mechanism and that it made the biggest impact on land marketization. The degree of marketization would also have been relatively higher, so it is reasonable that the agreement area showed a downward trend.
3.2. Analysis of Time Series Characteristics of Land Marketization
According to the model, the land marketization levels of 10 cities in Shaanxi Province from 2008 to 2019 were calculated (
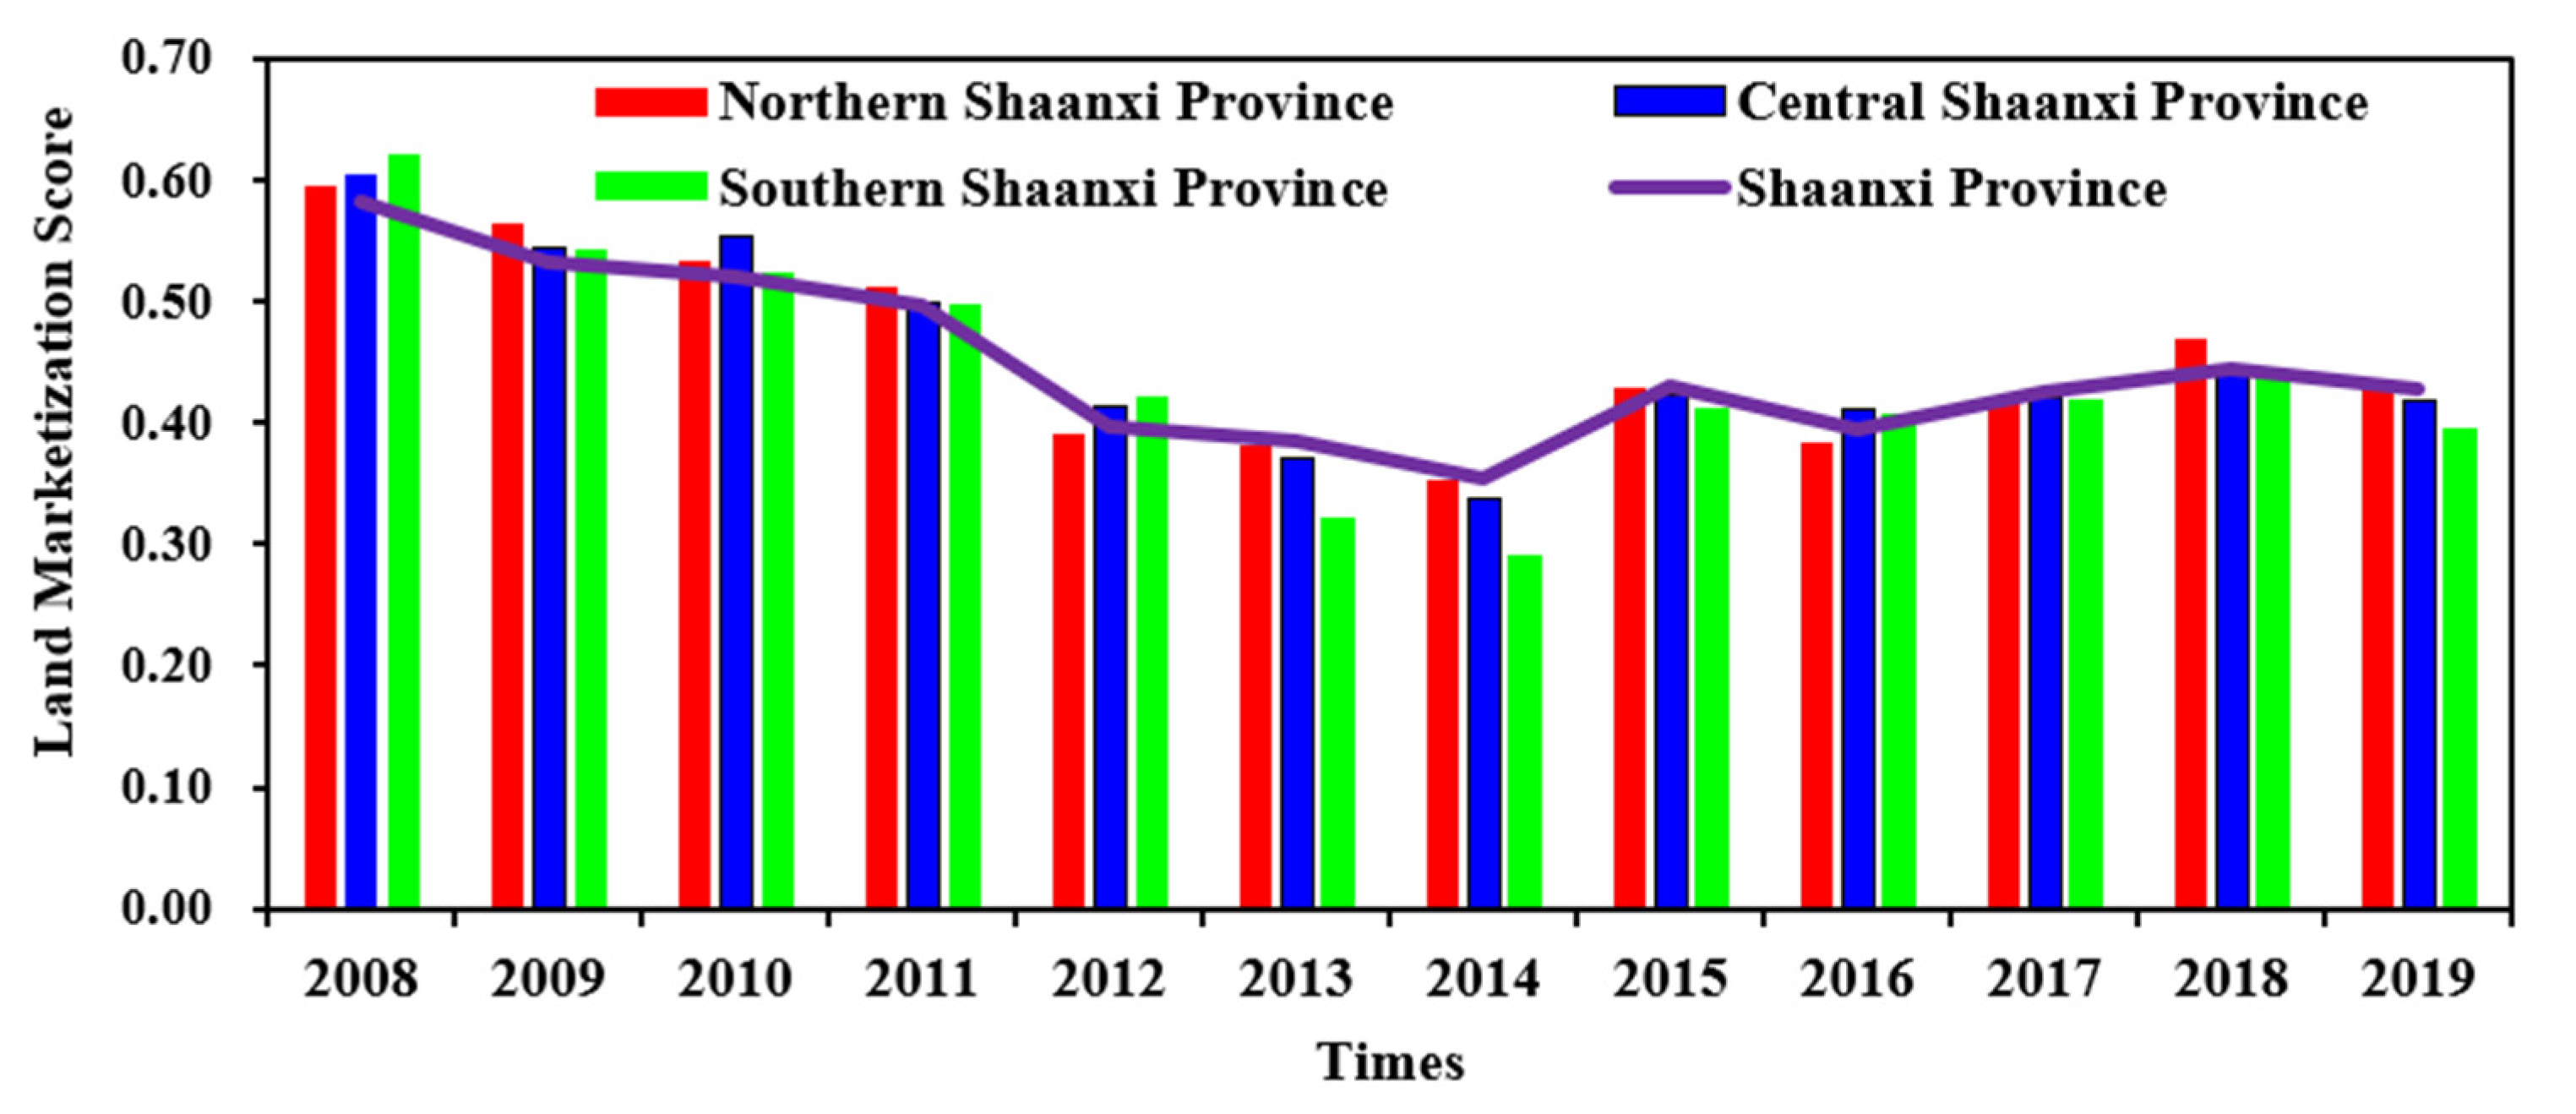
Table 3). The overall land marketization level of Shaanxi Province from 2008 to 2019 shows a declining and then a fluctuating upward trend (
Figure 6). The average extent of land marketization in Shaanxi Province dropped from 51.72% in 2008 to 35.38% in 2014, a drop of nearly 20%. The subsequent fluctuation rose to 42.78% in 2019. The three major regions of the northern, central, and southern areas were basically synchronized with the marketization development trend of Shaanxi Province. The other two regions, distributed in the southern cities, demonstrate more obvious fluctuations from 2011 to 2015. The lowest values of land marketization all occur in 2014 (35.36%, 33.77%, and 29.13%), but these subsequently showed a volatile upward trend. At the city level (
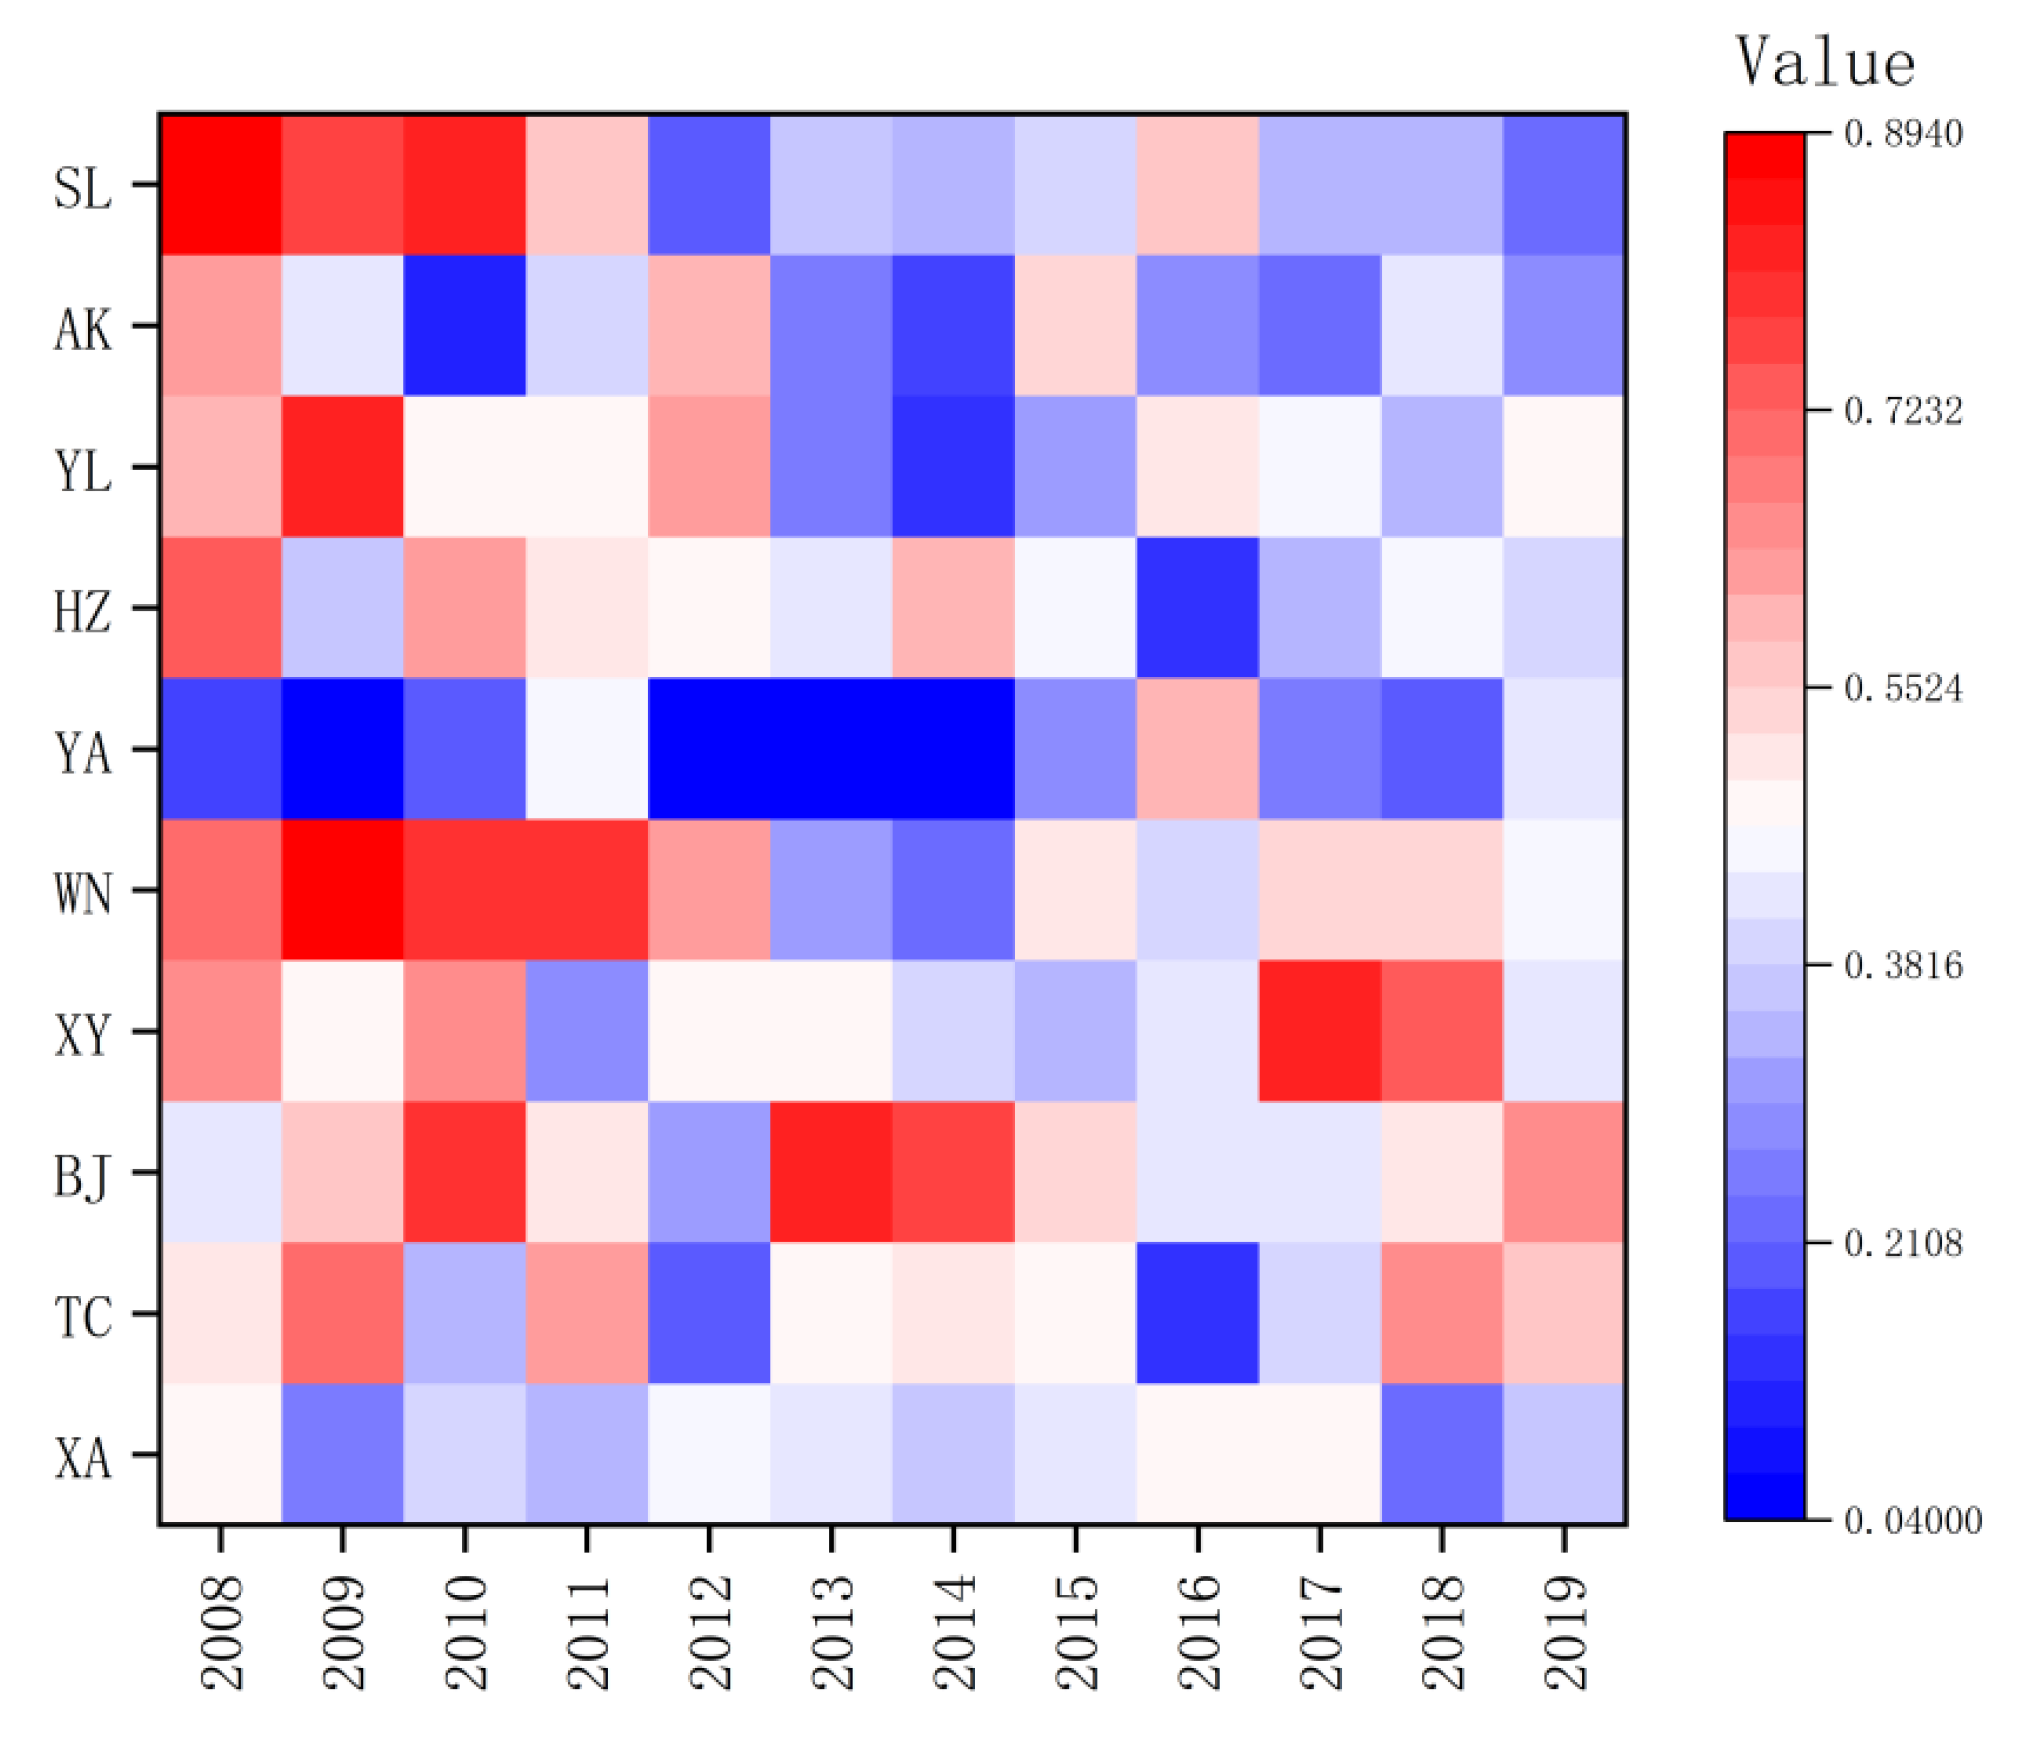
Figure 7 and
Figure 8), changes in land marketization vary according to the spatial and geographic location. SL and WN show a significant decrease in land marketization from 2008 to 2019. The extreme value gradually decreases from 0.89 to 0.22. YA has a low value for a long time, with an average of 0.24. The marketization of the land in XA is stable. This may be due to XA (the provincial capital) continuing to improve its economic development, the three land supply methods being relatively even and reasonable, and the annual changes in land marketization being relatively uniform.
The degree of land marketization was affected by multiple factors. National management decisions, social development trends, and changes in supply methods restricted or promoted the development of land marketization to varying degrees. Affected by the continued economic and financial crisis, the level of land marketization clearly shows a downward trend after 2008. Then, the country expanded its domestic demand and ensured the expansion of economic aggregates. By 2013, the Chinese government issued real estate control policies and continued to improve the B-L-A system in terms of land transactions and housing purchase restrictions. A series of policies for strict control of the real estate market were issued to promote stable development of the land market. In 2014, there was a sudden change in housing prices in China. The state moved away from controlling the demand for houses, restraining housing prices, promoting growth, stabilizing consumption, and relaxing restrictions on house purchases in many places, to reduce the government’s influence on the real estate market. The earlier high degree of intervention was to activate new momentum for the development of the land element market. According to the report on the work of the Chinese government in 2016, they emphasized promoting the destocking of real estate, accelerating urbanization, and stabilizing the development of the land market.
Comparing the east–west and north–south trends of Shaanxi Province between 2008 and 2019, the overall analysis shows that there is a high degree of marketization of the land on the east and west sides of Shaanxi Province. Since 2008, the rapid development of urbanization in BJ and WN prompted a large number of people to migrate to the cities, thus stimulating the demand for housing and, in turn, increasing the area of commercial and residential land. Therefore, the proportion of B-L-A in land transfer increased and the degree of land marketization became high. The degree of marketization of land is slightly higher in the southern and northern areas than in the central area of Shaanxi Province. After 12 years of urban spatiotemporal evolution, the trend of land marketization in Shaanxi Province underwent significant changes in 2019. As part of a new batch of national-level central cities, Xi’an vigorously developed a talent introduction strategy, encouraged the entry of technology companies, and promoted the construction of an international metropolis. The establishment of XA’s New District will play a more significant role as the provincial capital along with its surrounding cities, especially as the degree of marketization there has risen sharply. Compared with 2008, the degree of marketization has shown the greatest increase in the central area, followed by northern Shaanxi. Represented by YL City, Northern Shaanxi has gradually become the second-largest economy in Shaanxi Province, while southern Shaanxi ranks third. In conclusion, the level of marketization in the central area has greatly improved, that in northern Shaanxi has seen stable development, and southern Shaanxi comes in third, suggesting that the degree of land marketization in this area requires improvement.
3.3. Analysis of the Spatial Succession of the Land Marketization Level
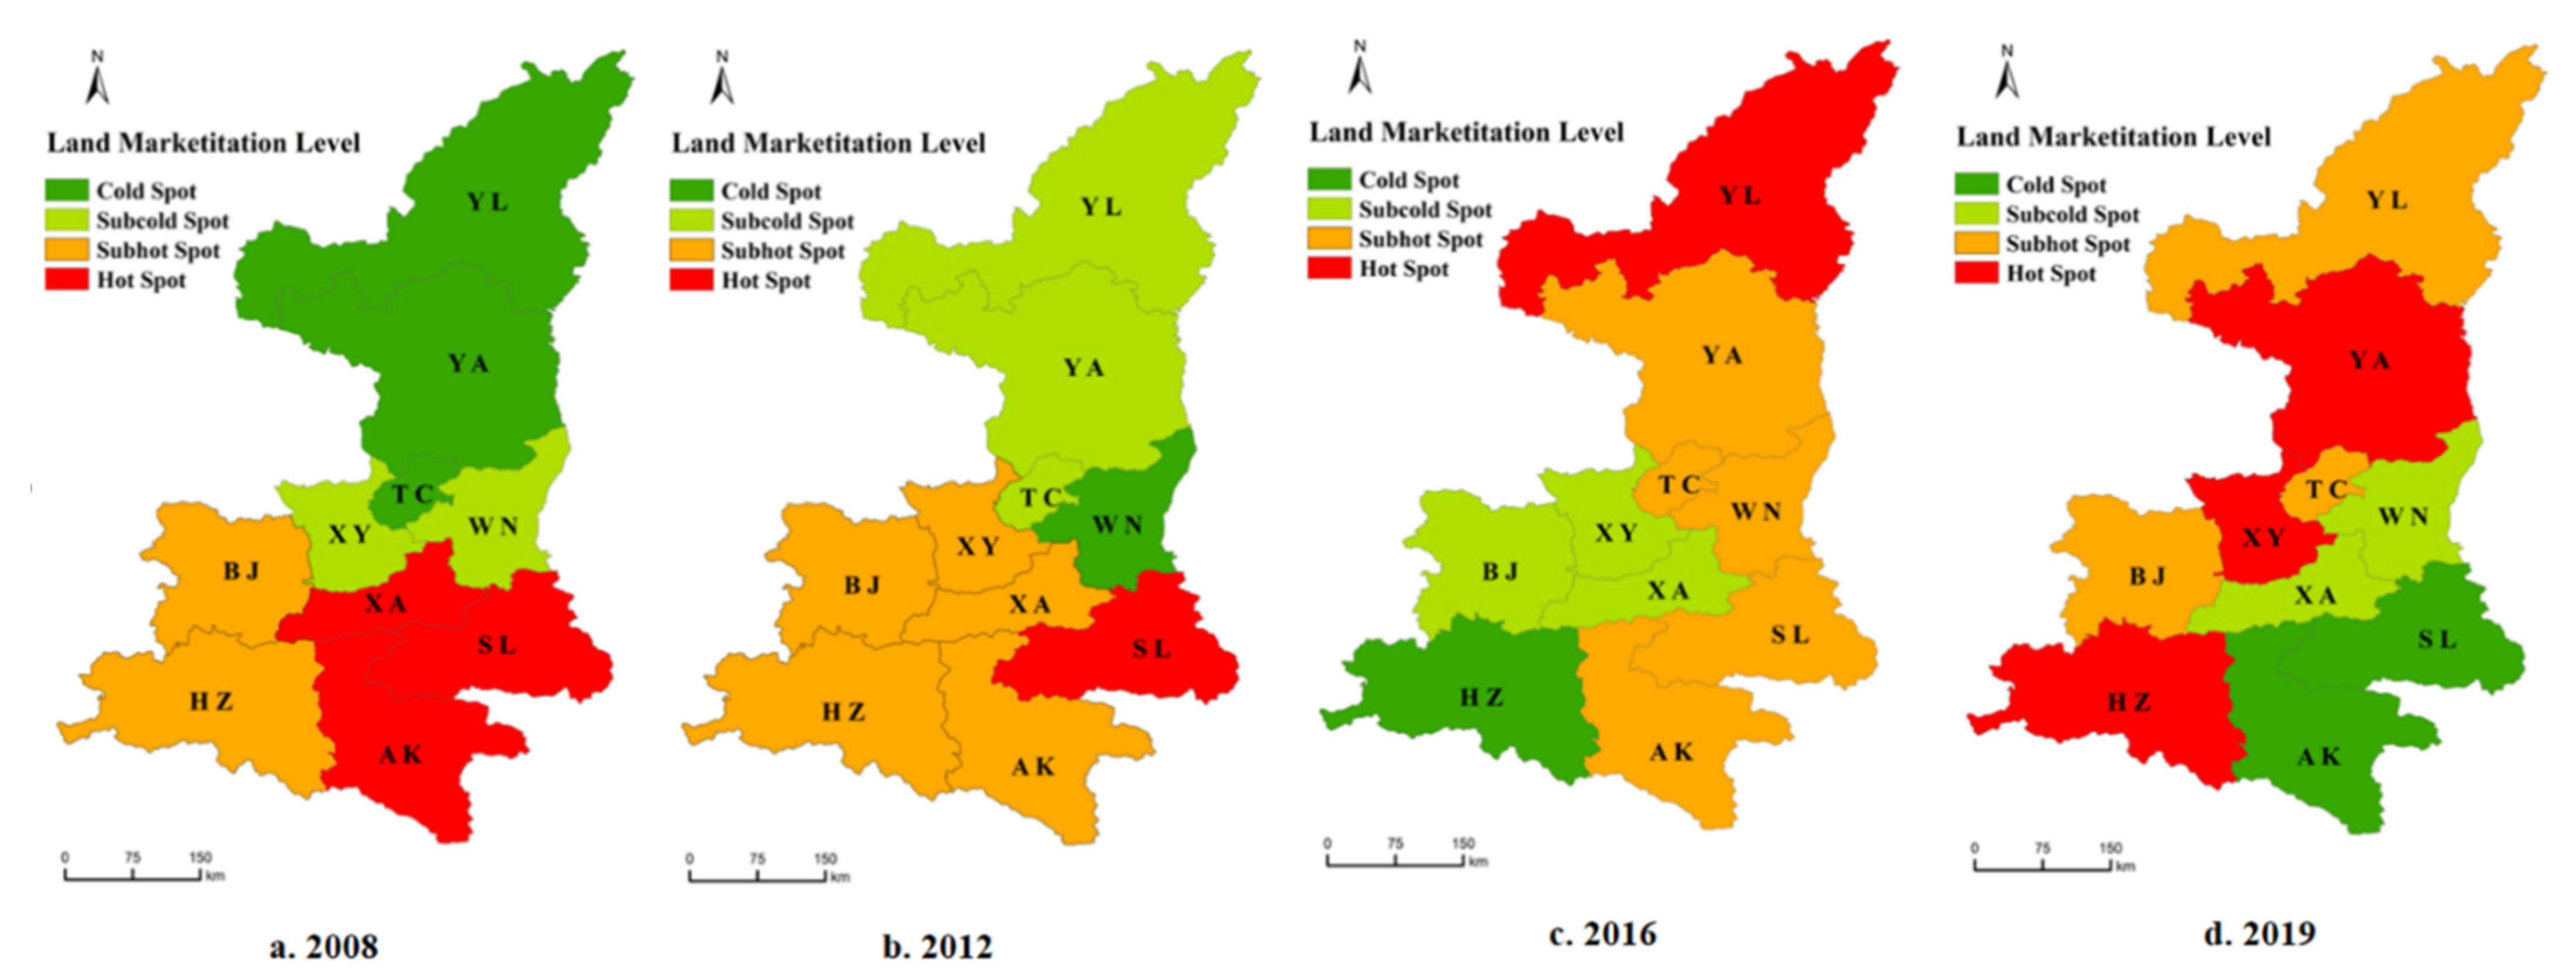
Using the Hot Spot Analysis (Getis–Ord Gi*) tool under a spatial statistical analysis, the periods 2008, 2012, 2016, and 2019 were selected to analyze the evolution of the local regional spatial pattern. The natural discontinuity classification method was used to divide the data into four categories. According to the z-score value from high to low, these four categories were hot spots, sub-hot spots, sub-cold spots, and cold spots (
Figure 9).
Hot spots indicate a pattern whereby land marketization decreased and then increased. In 2008, the hot spots were mainly distributed in AK, SL, and XA. There were no hot spots in southern Shaanxi. In 2012, the number of hot spots significantly decreased, with only one in SL. In 2016, hot spots were only distributed in YL. In 2019, the frequency of hot spots increased significantly and these were distributed in the northern, central, and southern areas of Shaanxi Province.
Sub-hot spots were mainly distributed in BJ and HZ in 2008. In 2012, the number of sub-hot spots rapidly increased, mainly in the central and southern areas of Shaanxi. In 2016, the sub-hot spots shifted from the southwest to the east, with a wide range of distribution, covering most of Shaanxi. In 2019, the sub-hot spots were scattered mainly around hot spots, and the number had obviously decreased compared with 2016, mainly in YL, TC, and BJ.
The number of sub-cold spots remained basically stable. In 2008, they were mainly distributed in XY and WN. In 2012, the center of sub-cold spot clusters gradually shifted to northern Shaanxi, and these sub-cold spots were mainly distributed in northern Shaanxi and TC. In 2016 and 2019, the sub-cold spots were mainly distributed in the central area and were absent in the northern and southern areas.
The cold spot area generally shows a decreasing trend, and the distribution is relatively concentrated. In 2008, it was mainly distributed in northern Shaanxi and TC. In 2012, compared with the sub-hot spot zone and the sub-cold spot zone, the distribution of hot spots and cold spots had shrunk significantly, particularly the distribution of cold spots. In 2016, the cold spots moved to southern Shaanxi, and there was only one in HZ. In 2019, the cold spots were still concentrated but only in the south.
3.4. Analysis of the Driving Forces of Land Marketization
The spatial and temporal evolution of land marketization is the result of a complex of multi-field factors. Many factors, such as the level of economic development, consumption capacity, housing demand, speed of urbanization, and urban foreign investment environment, affect the development of the land market. In addition, the interaction between these elements is not a single linear correlation. Therefore (see
Table 4), based on the GRA model, we selected five driving factors—foreign direct investment (X1) (100 million yuan), non-agricultural output value ratio (X2), per capita disposable income (X3) (yuan), fixed asset investment (X4) (100 million yuan), and urbanization rate (X5)—to determine the degree of correlation between each influencing factor and land marketization. Based on the influence of each evaluation item (driving factor) on the parent sequence of land marketization shown in
Table 5,
Table 6 shows that the urbanization rate (X5), at 0.999, has the highest correlation with land marketization, followed by the non-agricultural output value ratio (X2) at 0.997. The factor with the third-highest correlation degree is the amount of foreign direct investment (X1), followed by fixed asset investment (X4) and per capita disposable income (X3).
(1) Urbanization rate (X5). In the analysis of the driving forces of land marketization, the urbanization rate consistently ranked first from 2008 to 2019. As a multidimensional concept, urbanization is based on a complex structure of many mechanisms, such as population transfers, geographic space changes, and social relationship changes. With the process of urbanization, members of the population transfer to cities, which in turn stimulates housing demand and increases the proportion of B-L-A, structurally improving the process of land marketization. Therefore, urbanization has a direct role in promoting land marketization.
(2) Non-agricultural output value ratio (X2). Healthy economic development requires a reasonable industrial structure and productivity layout. The transformation and upgrading of industrial structures are closely related to the development of the land market. With the adjustment of the industrial structure, the market will put forward new requirements for the allocation of land resources, the relevant elements of land resources will also change, and land prices and utilization will fluctuate, affecting the land market. At the same time, the increase in the non-agricultural output value ratio reflects the fact that the development space of the secondary and tertiary industries increases, and the function of agricultural land is weakened, so as to expand the construction land area and promote the development of land marketization.
(3) Foreign direct investment (X1). In the analysis of the degree of relevance, the foreign direct investment changed slightly and the degree of comprehensive relevance was relatively high. Accompanied by the establishment of a new batch of national central cities and the talent introduction strategy of Shaanxi, the investment environment has become more diversified. These strategies have attracted many foreign companies. According to statistics from 2018, the foreign investment in Shaanxi was mainly focused on real estate and manufacturing. Real estate accounted for 84.3% of Shaanxi’s actual use of foreign capital, leading to a rapid increase in the demand for land and the proportion of market-oriented transfer methods and a higher level of land marketization.
(4) Fixed asset investment (X4). This is a comprehensive indicator reflecting the relationship between the scale, speed, and proportion of fixed asset investment. The correlation between fixed asset investment and land marketization steadily declined from 2008 to 2019, and its influence as a driving force decreased from 0.79 in 2008 to 0.402 in 2019.
(5) Per capita disposable income (X3). This factor reflects the fact that residential income can be used for spending or saving. The increase in per capita income, on the one hand, increases purchasing power, which accelerates the transaction speed of the land market. On the other hand, the increased vitality of economic development promotes the adjustment of the land transaction structure. The impact of per capita disposable income decreased from 0.59 in 2008 to 0.334 in 2019, with an average value of 0.446, indicating that its impact on the level of land marketization declined yearly. This may relate to the fact that, in recent years, regardless of a high or low personal income, purchasing a house has become a need, and thus the impact of per capita disposable income on land marketization has gradually weakened objectively.
4. Discussion
The land market is multidimensional and complex. Efficient operation of the land market can help to achieve efficient and sustainable land use. Exploring its development from different perspectives will lead to different conclusions. In contrast to other land marketization studies, this study links the changes in the area of land supply and the ratio of area obtained by B-L-A as a novel method to quantify the degree of land marketization. Measuring the level of land marketization and exploring its temporal and spatial variation characteristics have revealed that land acquisition through B-L-A is better aligned with the market mechanism. Therefore, foreign direct investment, non-agricultural output value ratio, per capita disposable income, fixed asset investment, and urbanization rate were taken as influencing factors, and the sorting mechanism of GRA was applied to measure the impact of different factors to understand the land marketization system.
Studying land use and land market development can provide better ideas and methods for sustainable land use. This study examined land marketization to explore the question of how land can be used more efficiently to achieve land conservation and utilization, which are consistent with the concept of sustainable development. Land resources are the foundation of human survival and development. With the acceleration of urbanization, the demand for land development has become more robust. However, the current land market system faces many challenges, such as the low efficiency of market allocation of industrial land and the lack of a market-based activation mechanism for stock construction land. These eventually lead to a low degree of land utilization. More efficient and reasonable land use patterns to achieve sustainable land use can be achieved using only the existing land resources. It is important for land development to move toward a more healthy and stable state. This study is based on the concept of sustainable development. By examining the changing trend of land supply and analyzing the impact of urban development, the industrial structure, the economic level, per capita income, and other indicators on land transactions, it explores how to use land resources more efficiently and sustainably.
Analysis of the estimated timing of land marketization reveals that the momentum of economic development and the control exerted by the national policy play a role in promoting land marketization and determining its extent. Additionally, it can be seen that there are obvious phase differences in the degree of land marketization among regions. Analysis of the spatial pattern succession shows that the difference in regional marketization was relatively small. Land marketization in central Shaanxi remained stable because of asset investment, better economic development, and industrial structure optimization. However, we should deepen the reform of the land management system, strengthen land marketization, and take corresponding measures to develop areas in Shaanxi where there is less land marketization. Considering the varying characteristics of the different regions, we must promote coordinated and well-balanced growth in the level of land marketization.
The construction of a land market provides a guarantee for the promotion of sustainable urban and rural development. Social urbanization further improves the service functions of cities and towns by strengthening the effective supply of basic public services and improving the infrastructure system. The optimal layout of urban space is not only a dynamic process but also a process of continuous exploration. It should have different characteristics at different stages of development so that the urban spatial structure is more optimized, the ecological environment’s quality is continuously improved, and environmental safety is effectively guaranteed. Spatial urbanization emphasizes the improvement of the quality of urbanization, with the main tasks of improving production and living conditions, coordinating the equalization of urban and rural public services, providing an effective platform for the coordinated development of humans and land, and providing a good environment for the effective realization of sustainable urban and rural development.
As the regional center of China, Shaanxi is the hub of economic and cultural development in northwest China. As economic and industrial structures in Shaanxi are undergoing a new round of adjustment and upgrade, we must not only strive for economic growth but also promote the continuous optimization of the industrial structure. The land supply structure of Shaanxi consists of three components. First, it provides construction land for transportation, energy, and public infrastructure, including large national projects. This practice intensified in 2009, when local governments implemented an active land supply system to provide a sufficient land guarantee to the central government to support its effort to expand domestic demand and ensure growth. Second, Shaanxi provides land for industrial use and mining storage. With a supply area of 1841.95 ha, this supply accounts for 33.95% of the total supply of construction land. This shows that, in the process of accelerating urbanization in Shaanxi, industrialization is still used as a path to urban economic growth and socio-economic transformation. The last component is the land for real estate development, with a supply area of 1229.13 ha. From the perspective of the sources of land supply, the construction land supplied by Shaanxi in 2009 slightly increased the proportion of the stock land supply in the total land supply. From the perspective of land supply methods, the paid use rate of land showed a downward trend, mainly due to the increase in the proportion of land used for the expansion of domestic projects and new housing. This reflects the policies that Shaanxi is gradually implementing to save intensive land use. From the perspective of land transfer transaction methods, the proportion of B-L-A in the land supply methods has increased significantly. Among the cities, YL was found to be the most prominent in this respect, with a bidding rate of 69.44%. This shows that the land market in Shaanxi has undergone healthy development, and the role of market-oriented allocation of land resources has played a positive role, effectively promoting the economical and intensive use of land. The allocated land has mainly been used for the development of urban public welfare undertakings and key engineering projects. Therefore, the practice of excessive state intervention should be gradually reversed, veering the market towards a development model in which the central government provides the necessary supervisory support while promoting an open and competitive market environment and allowing market forces to operate naturally. In parallel, Shaanxi should make full use of the national urban agglomeration development planning policy, strengthen the central city, and promote XA as a leading development hub among surrounding cities. Further, Shaanxi should optimize the land use structure [
39] and pay special attention to the development trend of the energy land market in the northern area of Shaanxi, which is represented by YL.
Although this study produced many valuable insights, there are some limitations to consider. The differences in the basic conditions and the representativeness of the data on the various cities in Shaanxi may have affected the land marketization indicators to varying degrees, causing possible inaccuracies in the results. In addition, while determining the most impactful driving factors of land marketization, this study focused mostly on economic factors. Therefore, subsequent studies could adopt a more comprehensive view and include other types of influences, such as social and environmental conditions, in the analysis. Finally, the impact of national policies on land marketization trends cannot be underestimated. In future research, the effect of the policy environment [
5,
40,
41] and government control efforts should be explored with regard to the market mechanism. Particular attention should be paid to the newly promulgated laws and policies that allow for agricultural land to enter the market and the impact that this measure has on the supply mode [
42,
43,
44,
45]. It is necessary to improve the system for research on land marketization and promote sustainable urban and rural development [
46,
47,
48,
49].
Previous studies suggest that land marketization promotion efforts must focus more on the southern part of Shaanxi. These efforts would be more fruitful if they utilized urbanization and non-agricultural output as driving factors to promote the sustainable and healthy development of land.
5. Conclusions
Based on the sustainable land development goal, this study calculated the degree of land marketization using a spatial statistical analysis and identified the driving factors affecting the degree of land marketization. The main conclusions are as follows:
(1) In terms of temporal change, the overall level of land marketization in Shaanxi declined from 2008 to 2014 and then rose upward from 2014 to 2019.
(2) Analysis of the spatial patterns shows that the distribution of cold and hot spots in Shaanxi changed over time. In summary, the hot spot areas increased and the cold spot areas gradually decreased.
(3) In the analysis of the driving forces for sustainable land development, urbanization was found to be the strongest factor driving land marketization, followed by non-agricultural output and foreign direct investment. The influence of fixed asset investment and per capita disposable income was found to have weakened.


