1. Introduction
In the 2021 Food Waste Index Report [
1], the United Nations Environment Program estimated that approximately 931 million tonnes of food (17% of total global food production) were wasted in 2019, 61% of which came from households. The United Nations Sustainable Development Goal (SDG) Target 12.3 proposes to “halve per capita global food waste at the retail and consumer levels” by the year 2030 [
2]. A 2014 USDA report estimated that in the United States (US), approximately 60.5 million tonnes of the available food supply at the retail and consumer levels in 2010 went uneaten [
3]. In the United Kingdom (UK), the Waste and Resources Action Programme (WRAP) leads national food waste management efforts in cooperation with the Department for Environment, Food, and Rural Affairs (Defra) and the Food Standards Agency (FSA) [
4]. WRAP estimated that annual food waste by consumers and retailers in the UK was approximately 9.5 million tonnes in 2018.
The reasons why households waste food are complex and driven by multiple factors, such as socioeconomic characteristics, food storage and preparation conditions, and psychological and behavioral factors [
5,
6,
7]. The majority of consumers discard food because they perceive it to be spoiled or they believe that it has lost its taste and freshness [
8]. The posted dates (date codes) and accompanying language that food manufacturers and retailers print on packaged food products (date labels) have a role in shaping these perceptions. The date code and the date labels provide information to consumers that affects their decisions to consume or discard a food item [
9]. However, there is mounting evidence that many consumers are confused about the interpretation about food product date labels, and this has led to an overall increase in household food waste [
10,
11].
Recent innovations in intelligent packaging and smart labels may increase shelf life of products and provide actionable information to consumers on when to consume food products [
12,
13]. Thus, these technologies may complement date labels and help consumers reduce their waste. To investigate the role of food date labels on food waste, we decided to compare how different date labels and smart labels may influence the probability to discard different foods. Specifically, we compared how alternative date labels and technological packing innovations impact US and UK consumers’ stated likelihood to waste food using an online survey.
2. Traditional and Innovative Approaches to Food Date Labelling
In the US, date labels are often referred to as “expiration dates”, but their meaning is not straightforward [
14]. There are currently no US federal regulations regarding food date labeling (other than for infant formula), which has resulted in a proliferation of date label language used in the market. While some states require date labels on specific products, date labels are generally applied on a voluntary basis by food and beverage manufacturers. Examples of date labels used in the US include “Use by”, “Best by”, “Sell by”, “Best if used by”, “Expires on”, “Best before”, and “Fresh until”, among others [
15,
16]. Some of these date labels are more suggestive of food quality whereas others are more suggestive of food safety.
In the UK, the food date labeling environment is less complex and is expected to be less confusing for consumers. Food product date labeling has been regulated at the national level [
17] and requires that all packaged foods are labeled with a date of minimum durability, with some exceptions for fresh produce, baked goods, and alcoholic beverages. There are only two date labels used in the UK: a quality-based “Best Before” date and a safety-based “Use By” date. While food manufacturers have the choice of deciding which date label to apply to their products, “Use By” dates are recommended only for products that pose specific microbiological food safety risks [
4]. In the UK, food products are not permitted to be sold or donated after their printed “Use By” date.
When consumers misuse or misunderstand date label messages regarding food product quality/freshness or food product safety, they may discard products which are past their posted date but are still wholesome and safe to consume. To combat this, groups such as the Food Waste Reduction Alliance (FWRA) and ReFED have advocated for a national strategy that standardizes and simplifies the food product date labeling regime in the US. Similar to the current regime in the UK, these organizations propose using one of only two date labels; one to communicate food safety and the other to communicate food quality [
18,
19]. We have also seen legislative proposals in the US that would mandate that food and beverage manufacturers use either “Use by” or “Best if used by” language. Although there is some support from the food manufacturing and food retailing community in the US for such a legislative initiative, many prefer the status quo and the freedom to choose the date label language used for their products [
16].
In addition to the traditional date labels used on food and beverage products, recent technological advances provide information that may help consumers reduce their food waste. Intelligent packaging technology improves food packaging information through the use of sensors and indicators that provide dynamic information about food quality variables as they move along the supply chain [
13,
20]. These technologies have the potential to reduce information asymmetry between food manufacturers, food retailers, and consumers, and have the potential to affect food waste patterns. In particular, if a food product is past the date code but a supplemental indicator shows that the product remains fresh, it may reduce the food waste of consumers who otherwise would have discarded the product based on the date code and date label alone.
While there are many different types of intelligent packaging technologies, they typically communicate information to consumers using visual indicators, such as color-changing dots, that are easy to understand. While ongoing research is focused on the development and application of new intelligent packaging technologies for commercial use, the majority of consumers are not yet familiar with these technologies and research is needed to investigate potential consumer response.
3. Materials and Methods
We developed a survey and distributed it to participants in the US and the UK to elicit their anticipated likelihood of discarding 15 different food products under different date label conditions. Our experiment exposes participants to treatments that include date labels that exist in both countries; we also include treatments that combine an intelligent on-package indicator with selected date labels.
3.1. Overview of the Survey
In our survey, we elicit consumers’ projected likelihood to discard 15 different food and beverage products under different date label treatments. In all, we collected data from 579 participants in the US and 583 participants in the UK. Separate surveys were used for participants from each country in order to take into account differences in food choice environments and product familiarity between the two countries. Participants were asked to report their likelihood to discard 15 different food products on a 5-point Likert scale (1 = “Extremely Unlikely”, 5 = “Extremely Likely”). In order to reduce bias, participants were also given the option to choose a “Do Not Consume” option if they do not consume the product presented for any reason. The same 15 food products were used in each country, with slight differences in the names and package sizes used to mimic market conditions in each country. We selected 15 food and beverage products that allowed us to observe patterns across five food categories (grains, proteins, fruits and vegetables, sugars/fats, and other). The 15 products were: Bread, Butter, Chicken, Cookies (US)/Biscuits (UK), Eggs, Fruit, Ham, Jam, Juice, Milk, Nuts, Salad, Soda (US)/Fizzy Drink (UK), Soup, Yogurt. We used generic product names (i.e., no brand names) and package sizes to describe the products and did not show product images to mitigate the confounding effects of brand-level preferences amongst the participants.
This survey was designed in Qualtrics and distributed to participants online via Prolific, a UK-based research firm with their own online consumer panel. Respondents in this survey completed the task in an average of 15 min and were paid USD 5.00 (US)/GBP 3.50 (UK) on average. The US survey data were collected in May 2018, and the UK survey data were collected in November 2018.
3.2. Experimental Design
We used a split-plot experimental design, in which all subjects were exposed to a control condition with a date code but no date label, and a treatment with a date code and a date label, or a combination of a date label with a color-coded Freshness Indicator (FI). As
Table 1 suggests, there were 10 date label treatments used in the US survey, in addition to the control condition, while in the UK, only 8 treatments were used. The use of 8 treatments in the UK reflects the fact there already exists a clear regulatory environment concerning the use of date labels. In addition to treatments with the date labels that are commonly used by US food companies, the remaining six date label treatments included three color-coded FIs (Green, Purple and Blue), paired with one of two date labels: “Use By” or “Best if Used By”. Note that each subject was only exposed to one of these date label treatments, but our experimental design enables a comparison within and across participants. All participants answered the likelihood to discard questions for the 15 products in each of the conditions to which they are assigned, for a total of 30 responses per subject. The order of the conditions and the presentation of the products was randomized to reduce order effects. Therefore, some participants answered questions from the treatment condition before the control condition. We have controlled for treatment order by including an “order” dummy variable in our model.
Examples of the labels presented to subjects in the control condition, in the date label treatments without the FI, and in the date label treatments with the FI are shown in
Appendix A. The date labels “Use By” and “Best If Used By” were chosen for the FI treatments in the US because they are the leading candidates for a two-date label system being advocated by policymakers and some industry groups. There were eight date label treatments in the UK version of the study. As
Table 1 shows, in the UK version, we used the two date labels that are currently employed plus the six treatments in which the FI was coupled with the “Best Before” or “Use By” date labels.
The FI was described to participants as signaling the freshness of the product using a color-coded dot system. This color dot is a visual representation of the measured product freshness, with three different colors indicating different levels of freshness: green represents “fresh”, blue represents “less fresh” and purple represents “past fresh”. The FI dots were motivated by a similar system that has been used by a large retailer in the UK for selected food products.
Participants were shown a food product, a date code (always one day prior to the date for which the subject took the survey), and a date label corresponding to their treatment assignment, and asked their likelihood to discard the product. All subjects were told to imagine that they had paid full retail price for the product, the food product is commercially packaged and unopened, they stored the product at home, and that the food product did not taste, smell, or look unusual. This emphasized that the only variables that changed between treatments are the date labels (with or without an FI). The specific question that we asked subjects was “How likely is it that you will discard all of this product due to the label above?” The question was followed with five choices ranging from “Extremely unlikely” to “Extremely likely”.
After participants completed the experimental tasks, they answered an “attention check” question to confirm whether or not they were paying close attention to the task instructions. In the final section of the survey, subjects completed a series of sociodemographic questions and provided additional information about their household food behavior.
3.3. Empirical Model
Following [
21], we estimated the likelihood to discard different food products under different date label treatments using an ordinal logit model. The ordinal logit model is used to model ordinal outcome variables with more than two possible values and is therefore suitable for modeling answers to scale-response questions such as those used to represent the outcome variable of interest, the likelihood to discard. As the outcome variable ranges from “Extremely Unlikely” (1) to “Extremely Likely” (5), positive coefficients can be interpreted as increasing the likelihood to discard or waste the product, and negative coefficients can be interpreted as decreasing the likelihood to waste. There are four possible intercepts in our model to accommodate the 5-point scale outcome variable.
The likelihood to discard (LTD) is modeled as a function of the date label treatment (LABEL) and food product type (PRODUCT). The model also includes the binary indicator variables, Order and Attention, which are used to control for order effects and respondent attentiveness. Order takes the value of 0 to indicate that the participants saw the control condition first, and the value of 1 to indicate that they saw the control condition second (after the date label treatment). Attention takes the value of 0 when participants passed the attention check on the first attempt. Participants who completed the attention check question incorrectly were given a second opportunity to pass. Attention takes the value of 1 when the subjects passed the attention check on the second attempt. Participants who failed the attention check on the second attempt were excluded from our sample.
LABEL is a categorical variable that represents the experimental condition. The control condition is the base level for LABEL and all regression coefficients represent a change relative to the control. In the US survey, LABEL has 10 levels in addition to the control. In the UK survey, LABEL has eight levels in addition to the control.
PRODUCT is a categorical variable that represents the different food product types with which participants were presented. PRODUCT takes on 15 levels, with soda/fizzy drink as the base level in both the US and UK surveys. Soda/fizzy drink was chosen as the base product because it was the product with the lowest frequency of “Extremely Likely” to discard responses and therefore PRODUCT would be expected to have only positive coefficients.
Coefficients in an ordinal logit model represent a change in the log-odds of the outcome variable taking on a higher level. As higher levels of the outcome variable,
LTD, represent an increase in the likelihood to discard, positive regression coefficients are associated with an increase in likelihood to discard relative to the base level of the relevant variable and negative coefficients with a relative decrease in likelihood to discard.
Equation (1) outlines the specification for the likelihood to discard for a given respondent, i, as a function of LABEL, t, and PRODUCT, a. Model 1 includes the effect of only the LABEL variable; Model 2 includes both LABEL and PRODUCT variables. We have also run regressions that include LABEL, PRODUCT, and all interactions between LABEL and PRODUCT variables, but these results follow the general thrust of the results in Model 2 shown here. The vector Zi includes control variables, which in turn includes the Order and Attention variables plus selected sociodemographic variables (age, gender, race, education, income, household size, and presence of children in the home).
3.4. Average Adjusted Probabilities (AAPs) and High Adjusted Probability to Waste (HAPW)
To facilitate interpretation of the estimated coefficients, we calculate average adjusted probabilities (AAPs) with the margins command in Stata 15.1. Average adjusted probabilities represent the estimated probability/likelihood of each response value (1–5) at given levels of the independent variables. Coefficient estimates from Model 2 are used to calculate the AAPs reported here.
We then combine the AAPs for “Somewhat Likely” (4) and “Extremely Likely” (5) to create the High Adjusted Probability to Waste (HAPW). HAPW represents the probability of being likely to waste food. For each date label treatment, we compare the estimated HAPW to the control. These treatment effects represent the estimated increase or decrease in HAPW from the control condition for each date label treatment, averaged across all products. We also calculate the HAPW for each food product type under the control condition (with a date code but without a date label).
4. Results
Summary statistics describing the average likelihood to discard across the 15 products indicate that the share of participants who selected “Extremely unlikely” were quite similar across the treatments in the US and UK samples. On average, approximately 40% selected “Extremely unlikely” to discard the food products in the control condition; this rate went up when subjects were exposed to the FI and a green dot (above 50% were “Extremely unlikely” to discard) and fell below 40% when subjects were presented with the FI and a purple dot in both the US and UK samples. Interestingly, US subjects showed a higher (lower) response to the “Extremely unlikely” choice for the green (purple) dot compared to the UK participants. Subjects in treatments who saw other date labels (without the FI) also increased their response to the choice “Extremely unlikely” to discard, but these effects were smaller than when subjects were exposed to the FI with a green dot (suggesting that the food was “fresh”). Furthermore, in general, we found that the “Best Before” and the “Best By” labels (that are more suggestive of food quality) had a higher frequency of “Extremely unlikely” responses to discard compared to those for the “Use By” date label (that is more suggestive of food safety).
4.1. Descriptive Statistics
Table 2 shows descriptive statistics for selected sociodemographic variables collected in our US and UK surveys. Here, we show the mean and standard deviations for variables that describe subjects’ age, gender, race, education, income, household size, and the presence of children in the household. The first two rows in
Table 2 show the descriptive statistics for the control condition in each country and the subsequent rows present information across the treatments. All participants were assigned to the control condition and then randomly assigned to one of the ten experimental treatments in the US or one of eight treatments in the UK. Therefore, we have over 8000 observations in each of the control conditions and approximately 800 observations for each US treatment and approximately 1000 observations for each UK treatment. An observation is a response to a likelihood to discard question for a specific product in the control or in a treatment; each participant supplied 30 observations. Observations corresponding to responses of “Do not consume” to a particular product were dropped from the analysis.
Table 2 shows that the samples in the US and UK are generally balanced in terms of age, education, household size, and the presence of children in the household. There are larger differences between the US and UK samples in terms of gender (greater share of male participants in the US sample), race (greater share of non-white subjects in the US sample), and income (higher average income in the US sample). There is also some variation in the composition of subjects across treatments (e.g., the “Best if Used By—Blue FI” treatment group has more males than average, and the “Best if Used By—Green FI” has fewer). Because we observe a non-trivial amount of heterogeneity in these sociodemographic variables across countries and treatments, we included these variables in our regression models.
4.2. Regression Results from Mixed Effects Ordinal Logit Model
In our mixed effects ordinal logit model, the likelihood to discard is the outcome variable and it has five levels ranging from “Extremely unlikely” to “Extremely likely”.
Independent variables are categorical variables representing date label treatment, food products, attention check, control/treatment order, and the selected sociodemographic variables. There is a random effect for each individual participant, as each participant answers 30 “likelihood to discard” questions.
Table 3 shows coefficient measures from two model specifications for both the US and UK samples. Model 1 includes only date label treatment effects and does not include food products as explanatory variables. Model 2 includes both date label treatment effects and product-level effects. We also ran regressions that include date label effects, product effects and the full suite of treatment-product interaction terms. However, the findings from Model 2 represent our main set of results because the results from the model with the interaction terms yield very similar estimates and log likelihood and Chi-square measures to Model 2, and this suggests that Model 2 has similar explanatory power but is more parsimonious.
Table 3 shows ordinal logit regression results for both models for both the US and the UK samples, and in the following discussion, we focus on our results from Model 2. In the US, the treatments that include the green FI (“Use by—Green FI” and “Best if Used By—Green FI”) as well as the “Best by” and the “Sell by” treatments are statistically significantly different from the control condition; in each of these cases, the estimated coefficient is negative, indicating that the likelihood to discard decreases in these treatments. The treatments with the purple FI are also significant, but here we see positive estimated coefficients, indicating that a date label accompanied with a purple FI leads to an increase in the likelihood to discard. The effects for the treatments with the blue FI are not statistically different from the control condition. In addition, the treatments “Use by” and “Best if Used by” also are not statistically different from the control condition, suggesting that consumers do not respond to these date labels differently from how they respond to a product without a date label (and only a date code). The last result suggests that consumers interpret the “Use by” and “Best if Used by” date labels, as well as the date code on its own, as signals of food safety and that discard patterns are similar across these three conditions.
For product variables, all coefficients are statistically significant and positive, indicating that there are important product-level differences impacting the likelihood to dis-card. Across the estimated coefficients for food products (relative to soda), chicken had the highest value, indicating that likelihood to discard intentions are highest for chicken. The estimated coefficient for the Order variable was negative and statistically significant at the 5% level in the US, but the Attention variable was not statistically significant.
The final column in
Table 3 shows ordinal logit regression results for the UK sample. Similar to the results from the US sample, the estimated coefficients for the treatments that combined a date label with the green FI were negative and statistically significant, whereas the treatments that combined a date label with a purple FI were positive and statistically significant. However, the magnitude of the estimated coefficients (both the positive and the negative coefficients) were smaller than their counterparts in the US, suggesting that UK subjects were less responsive to the additional information presented with the FI. This may be due to the fact that consumers in the UK are more familiar with intelligent packaging and biosensors (in 2016, Sainsbury’s (the second largest supermarket chain in the UK) launched a “stay fresh” indicator on selected private label packaged ham products that may have been seen by some of the respondents in our survey. More details are available in the report that can be accessed at
http://www.j-sainsbury.co.uk/~/media/Files/S/Sainsburys/documents/wlsm-year-1-report.pdf) (accessed on 14 July 2021) or that UK consumers had more confidence in the date labels themselves and placed less weight on the information communicated through the FI. Interestingly, the estimated coefficient for the date labels coupled with the blue FI were also positive and statistically significant in the UK sample.
Again, similar to the US results for the “Best by” treatment, the subjects in the UK decreased their likelihood to discard when exposed to the “Best Before” date label that is suggestive of food quality. Response to the “Use by” treatment was not statistically different from the control condition. Even though these date labels are regulated in the UK but not regulated in the US, they appear to have very similar responses among subjects in both countries. It is important to note that food products in the UK are required to feature a date label phrase, so the UK consumers may have found it strange to see food products with a date code but no date label. As a result, the respondents may have been cautious with the products presented in the control condition and this may have inflated the likelihood to discard rates observed in the UK control condition. Finally, like we found in the US sample, the estimated coefficients for individual products (relative to the fizzy drink) in the UK were all positive and statistically significant, and chicken again had the highest estimated effect across the 15 products.
4.3. Average Adjusted Probabilities (AAPs)
Average Adjusted Probabilities (AAPs) are calculated from the regression coefficients and shown in
Table 4. The rows in
Table 4 are structured similarly to those in
Table 2, and here the columns report the AAPs for each of the likelihood choices for the control condition and the relevant treatments in each country. The AAPs represent the estimated probability that respondents will choose an outcome variable level. The AAPs are calculated for the control condition and each date label treatment, and represent the probability of selecting each outcome variable in the given condition, averaged across all 15 products.
For example,
Table 4 shows that in the control condition, there is a 41.8% probability that US subjects will be “Extremely unlikely” to discard the average food product and a 12.3% probability that they will be “Extremely likely” to discard. Looking down the column for the “Extremely likely” case, we see that the probabilities range between approximately 7% (for “Best if Used by—Green FI”) to 20% (for the “Use by—Purple FI”) in the US sample.
We used the results in
Table 4 to create a measure that combines the probabilities for greater likelihood to discard. In each row, we sum the probabilities for “Somewhat likely” and “Extremely likely” and refer to it as the High Adjusted Probability of Waste (HAPW). Under the control condition in the US, the HAPW is 26.4% and it increases to as high as 38.7% in the “Use by—purple FI” treatment. Results from the UK sample show a HAPW of 23.4% in the control condition and it increases to as high as 32.4% in the “Best Before—Purple FI” treatment.
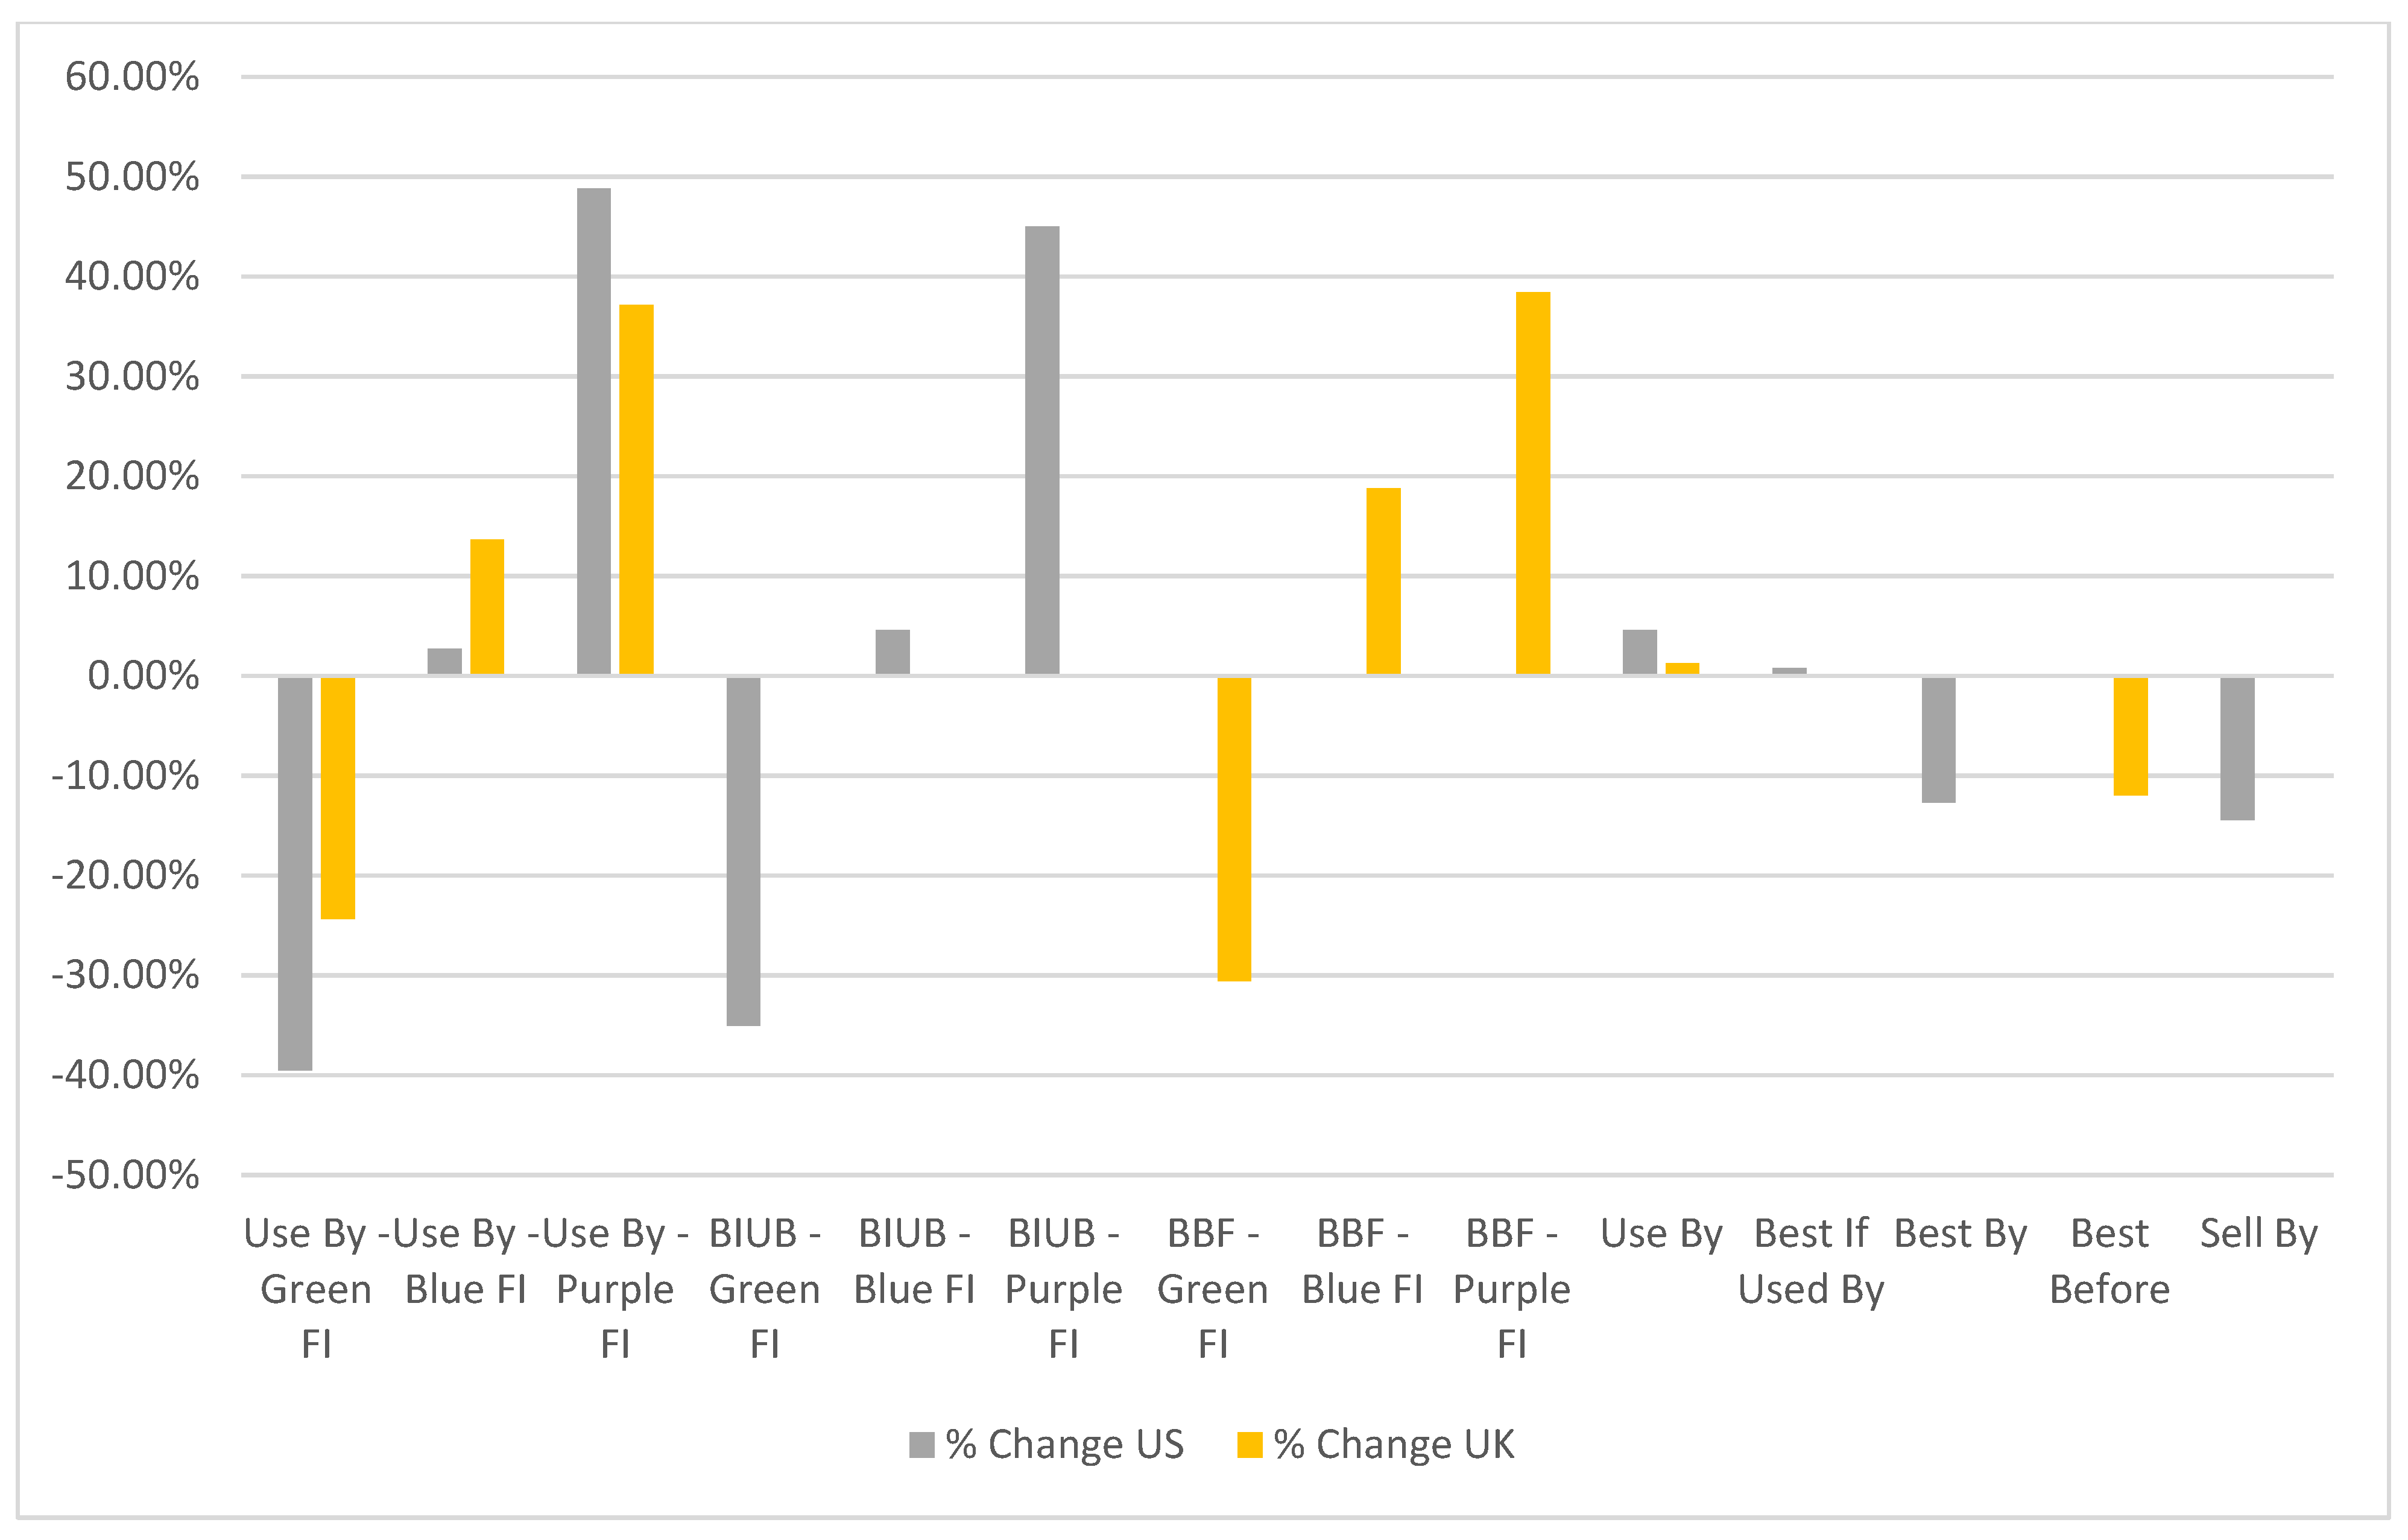
In
Figure 1, we showcase the HAPW results for treatments (relative to the HAPW for the control condition) as a way to compare this measure across treatments and between the two countries.
Figure 1 highlights three important findings. First, we see that the subjects in the US sample are more responsive to both the green and purple FIs relative to those in the UK sample, whereas the UK respondents were relatively more responsive to the blue FI. Second, the effect of the FI appears to be much more important than the date label alone; the percent change associated with “Use By” alone is a tiny fraction of the effect when “Use by” is combined with an FI in both the US and the UK. Third, the magnitude of the effects in the “Use by” treatments in the US and the UK, and in the “Best By” treatment in the US and the “Best Before” treatment in the UK are quite similar.
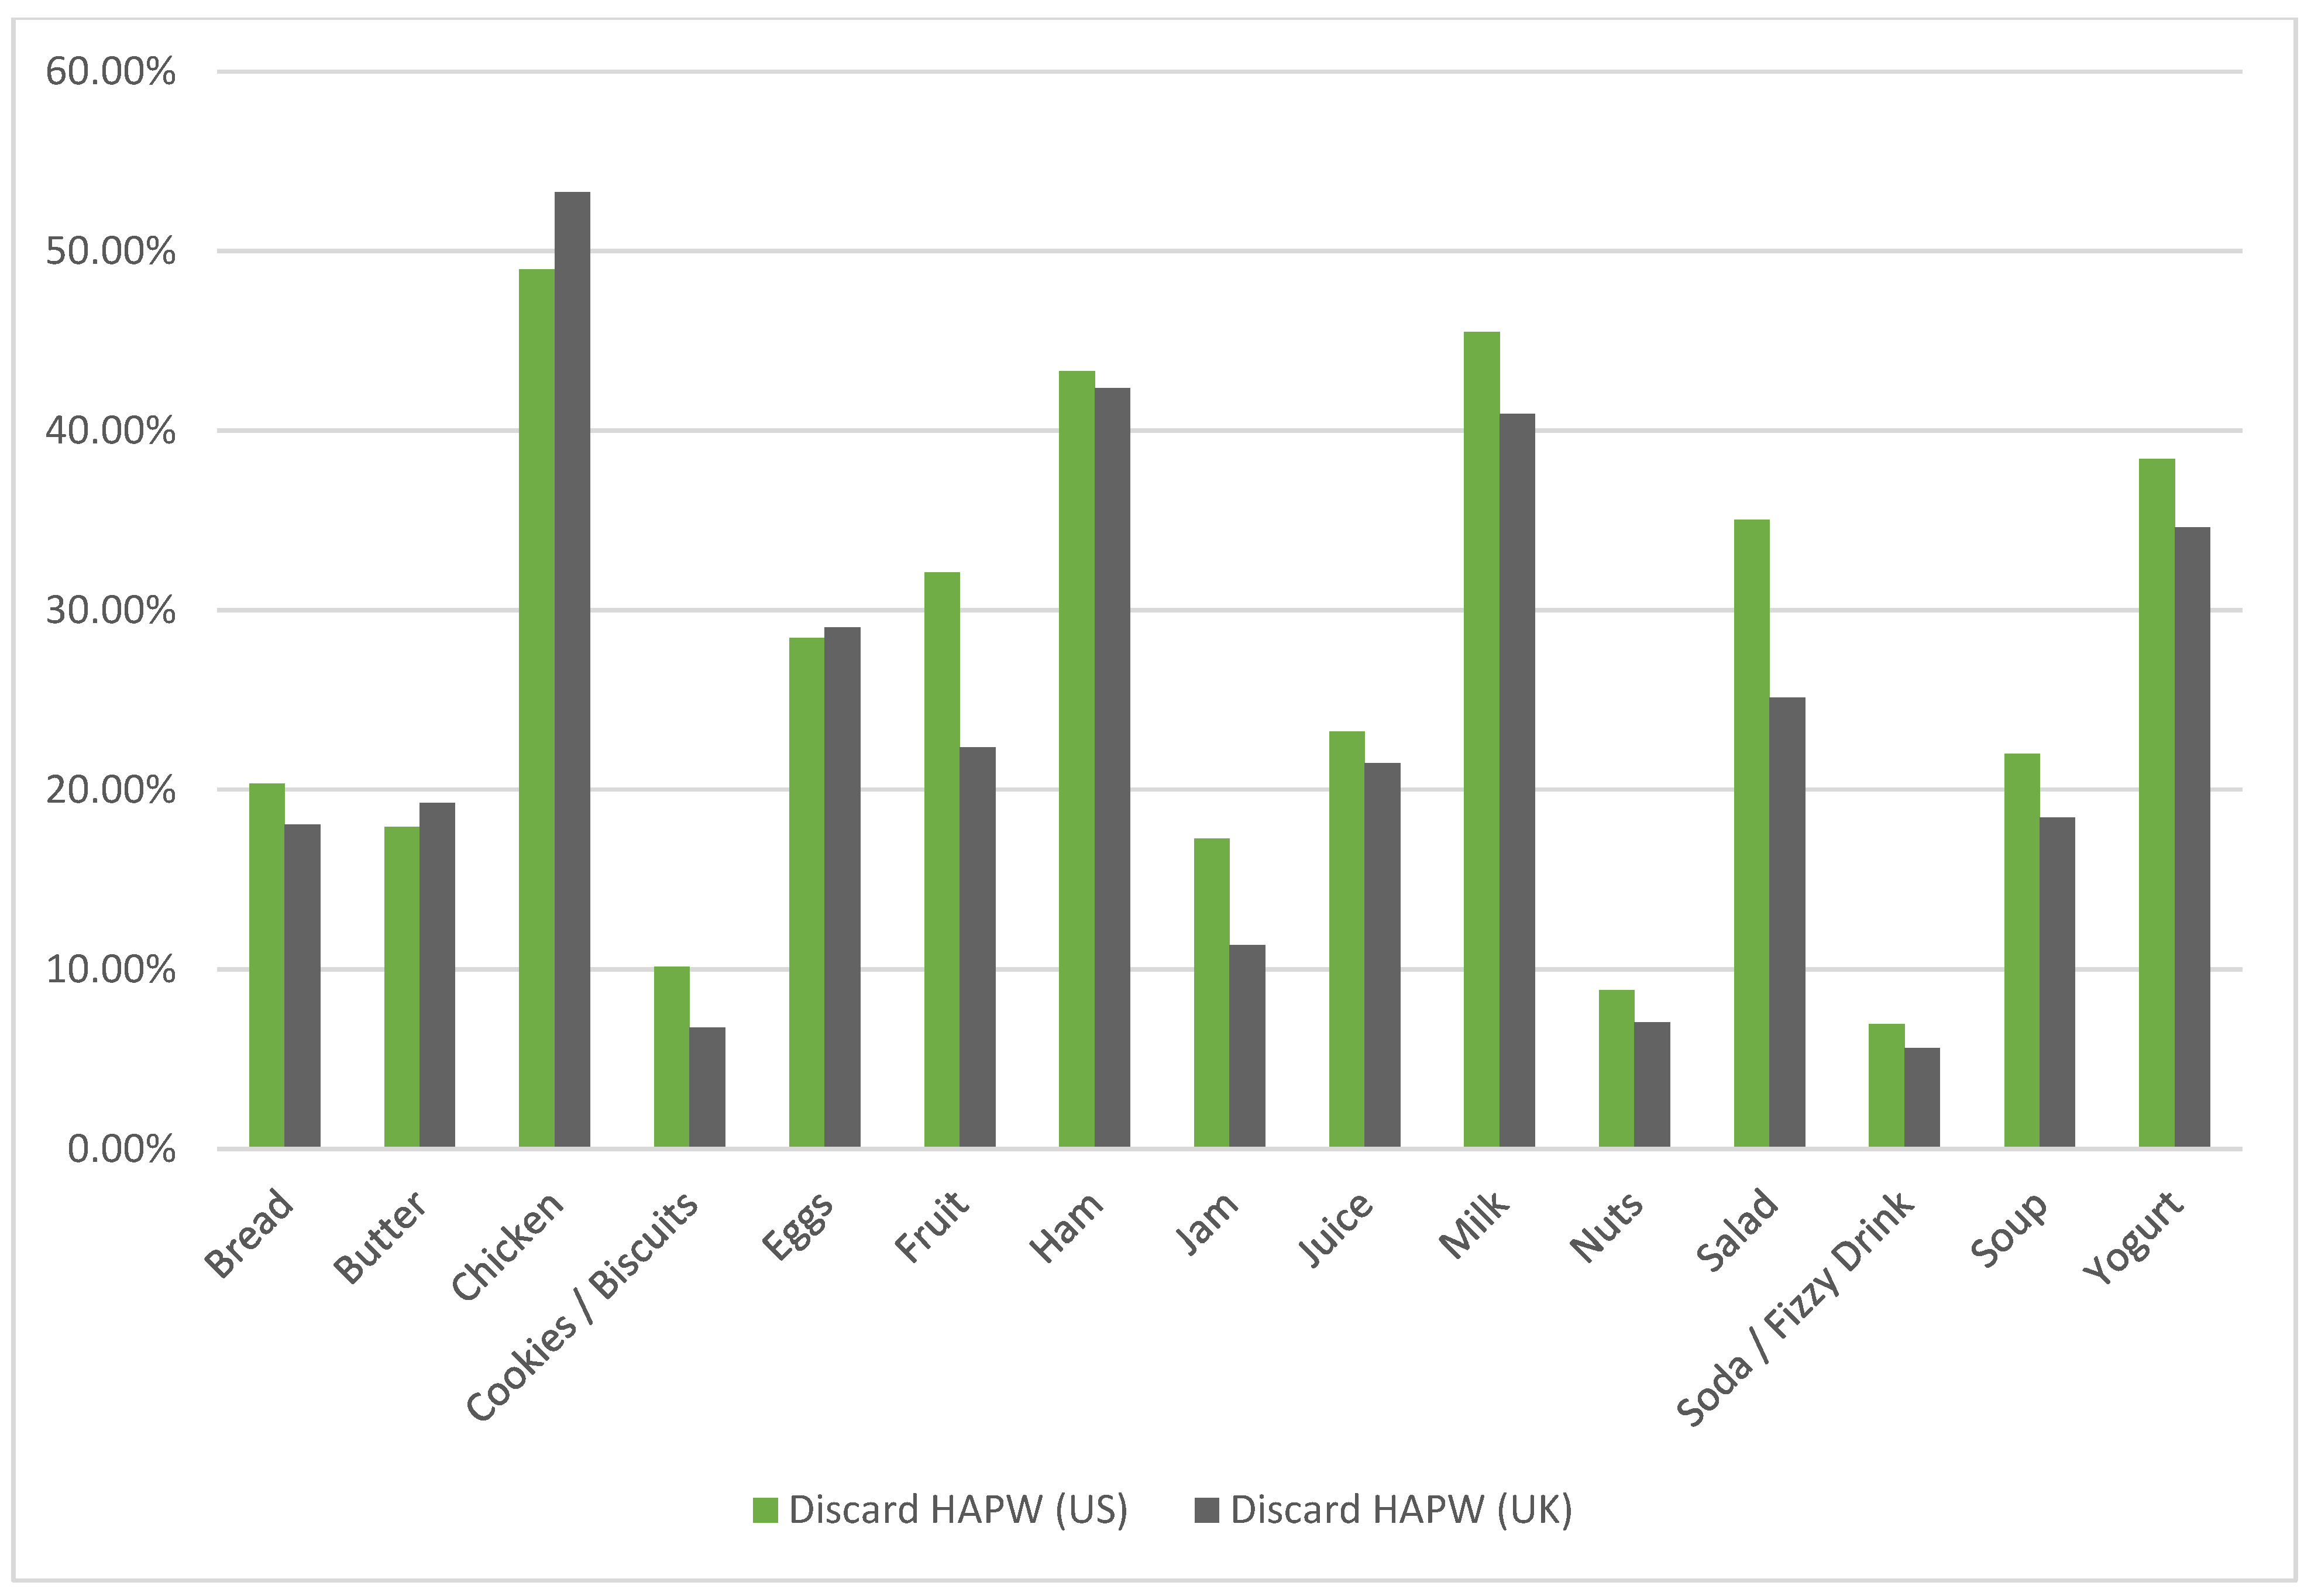
We continue to use the HAPW as a way to study the effects of the date label treatments across products. We recalculate the AAPs for each of the five possible responses for each product in the control condition and for each date label treatment.
Figure 2 shows the HAPW by product for both the US and the UK samples for the control condition. Overall, the results shown in
Figure 2 lead to two important points. First, there are relatively large differences in the HAPW across food products. In the control condition, the HAPW ranges from between approximately 5% for soda (US)/fizzy drink (UK) to near 50% for chicken. In addition, the other protein products have HAPW rates close to 40%. Second, although there is a wide range of HAPW across products, these rates are quite similar between the US and the UK.
5. Summary and Discussion
Overall, we find that consumers’ reported likelihood to discard varies across date labels and across food product types in both the US and the UK. We find that date labels do impact consumers’ likelihood to discard. Date labels that are more suggestive of food quality lead to lower food discard rates and date labels that are more suggestive of food safety lead to higher food discard rates. Furthermore, we find strong evidence that the addition of an FI (to a range of alternative date labels) affects discard rates. Signals indicating that the food is still fresh substantially decrease discard rates whereas signals that suggest food is no longer fresh increase discard rates. Our results provide evidence that the FIs perform as we would expect, as all green FI treatments lowered HAPW relative to the comparison treatments and all purple FI treatments had higher HAPW than their respective comparison treatments. There are also significant differences in likelihood to discard across products. Consumers are much more likely to discard protein products across all date labels and much less likely to discard processed food items.
Despite different food product date label regulatory regimes in the US and UK, we find relatively similar likelihood to discard rates between our two samples. Under the control condition with only a date code (and no date label), the HAPW for an average food product one day past its posted date is 26.4% in the US and 23.4% in the UK. This finding is in line with WRAP’s 2011 finding that households’ decisions about food waste can be attributed, in part, to concern and confusion with date labels.
In the US, we find that consumers respond to “Use By” and “Best if Used By” no differently than they respond to the control condition with only a date code (and no date label). This suggests that consumers do not derive any additional meaning from the text on either of these date labels in regards to food product quality or food product safety and that the date alone communicates most of the meaning for the most common date labels. This may also imply that “Best if Used By” is interpreted similarly to “Use By”, perhaps due to the inclusion of the word “use” in both labels. For the other two date labels commonly seen in the US that we included in our study (“Best By” and “Sell By”), the HAPW was about 14% lower than in the control. This finding suggests that consumers may be aware that “Best By” does not have food safety implications and “Sell By” is primarily used by food manufacturers and retailers to manage inventory rotation [
22].
In the UK, where regulations require date labels and specify that “Best Before” is an indicator of product quality and “Use By” is an indicator of product safety, we find that “Use By” is the only date label with likelihood to discard rates that are not significantly different from the control. This suggests that respondents may behave cautiously in the presence of no date label and be more likely to waste. Our finding that HAPW is 11.54% lower under the “Best Before” label adds more evidence in support of this claim, as respondents are likely aware that this label does not have implications for food safety, similar to those in the US.
In both countries, we find large treatment effects in response to the novel FI treatments, which provide clear information on food product quality (where a green dot is associated with “fresh”, a blue dot with “less fresh”, and a purple dot suggesting that the item is “past fresh”). When respondents in both countries are provided information that a given product is “fresh” despite being past its posted date (with the use of the green FI), they are significantly less likely to discard the item. However, when respondents are told that the product is “past fresh” (through the use of a purple FI), they are significantly more likely to discard the product. In the UK, respondents are also more likely to waste even when the product is “less fresh”, although we do not find this behavior in the US. The large effects under the FI treatments suggest that consumers may value additional information to help them make decisions about which foods to consume, particularly once they have passed the date posted in the date code.
We find evidence in both countries that HAPW is more dependent on specific food products than date labels. HAPW is highest for fresh animal-derived products that may have a higher spoilage or microbiological safety risk and lowest for shelf-stable products that pose little to no food safety risk under usual conditions. Despite these differences, date labels have consistent treatment effects across products. This result is surprising because date labels have meaningful effects on likelihood to discard rates even for products that have a very low HAPW under the control treatment. In future work, we would like to extend our analysis to consider a wider range of both fresh and processed food and beverage products.
Overall, we find that consumers respond differently to different date labels, and that the consumers in our survey were influenced by the color of the FI. Indicators suggesting that foods beyond the date code were still fresh decreased the likelihood to discard while indicators suggesting that foods beyond the date code were not fresh increased the likelihood to discard (relative to the control condition). This finding was evident in both the US and UK samples; however, it was much stronger among subjects in the US sample. While much debate has focused on date label language, we find evidence showing that consumers’ likelihood to discard food is driven mostly by the date code alone and less driven by the accompanying date label (i.e., the text).
This paper provides evidence to support the continued improvement of food product labeling in the US and the UK, and particularly as the US considers the establishment of a national strategy on date labels. Providing consumers with easy access to real-time information about the quality and safety of food products will allow consumers to make improved decisions about food consumption and may also lead to a reduction in food waste. Intelligent packaging indicators, such as the FIs that we examined here, are a new technology with the potential to reduce unnecessary household food waste, and may lead to important benefits for consumers, their communities, and the environment.
Author Contributions
Conceptualization, B.R. and D.M.S.-M.; methodology, C.W., A.N., and B.R.; formal analysis, C.W. and A.N.; writing—original draft preparation, C.W., A.N., B.R., and D.M.S.-M.; writing—review and editing, C.W., A.N., B.R., and D.M.S.-M.; visualization, C.W.; supervision, B.R., and D.M.S.-M.; project administration, B.R.; funding acquisition, B.R. All authors have read and agreed to the published version of the manuscript.
Funding
The project was supported by the Agricultural and Food Research Initiative Competitive Grant no. 2016-67023-24817 from the USDA National Institute of Food and Agriculture (NIFA), and through USDA Hatch project NYC-121864. Any opinions, findings, conclusions, or recommendations expressed in this publication are those of the authors and do not necessarily reflect the views of NIFA or the United States Department of Agriculture (USDA).
Institutional Review Board Statement
The study was conducted according to the guidelines of the Declaration of Helsinki, and approved by the Institutional Review Board of Cornell University (protocol code, 1410005060; date of approval, 11 April 2016).
Data Availability Statement
Survey materials, data, and the code used to analyze the data are available upon request from the authors.
Acknowledgments
The authors gratefully acknowledge the technical assistance provided by Shuay-Tsyr Ho and Maya Wren, and for feedback provided by Aaron Adalja and Norbert Wilson.
Conflicts of Interest
The authors declare no conflict of interest. The funders had no role in the design of the study; in the collection, analyses, or interpretation of data; in the writing of the manuscript, or in the decision to publish the results.
Appendix A
Figure A1.
Example of Information in Control Condition with Date Code Only.
Figure A1.
Example of Information in Control Condition with Date Code Only.
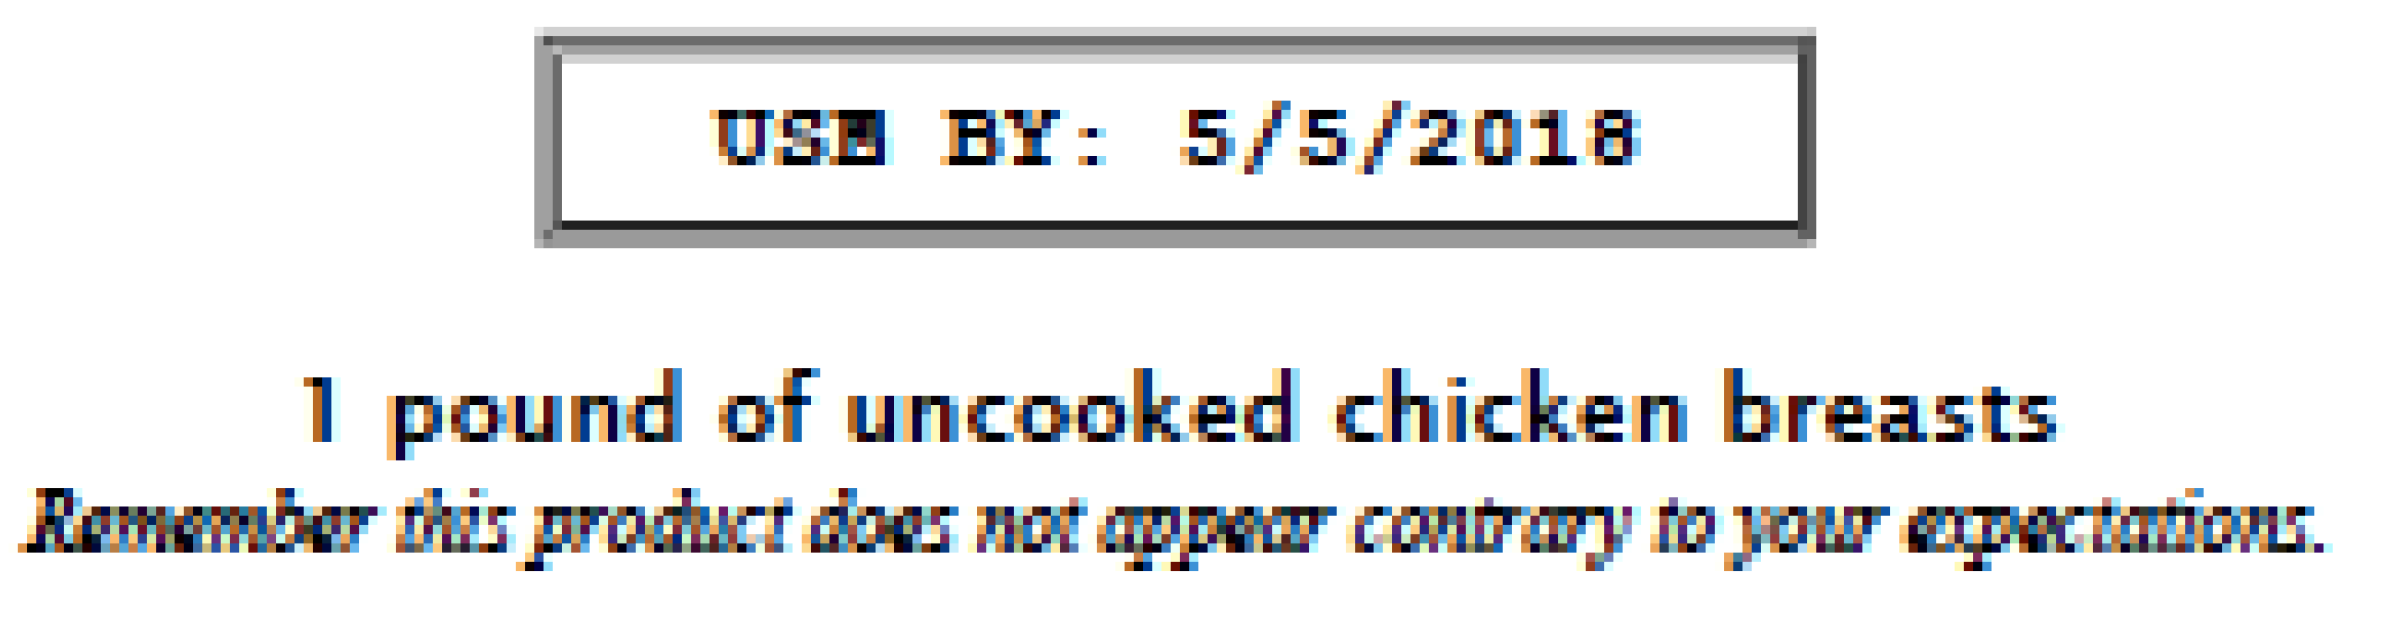
Figure A2.
Example of Information in Treatment with Date Code and Date Label.
Figure A2.
Example of Information in Treatment with Date Code and Date Label.
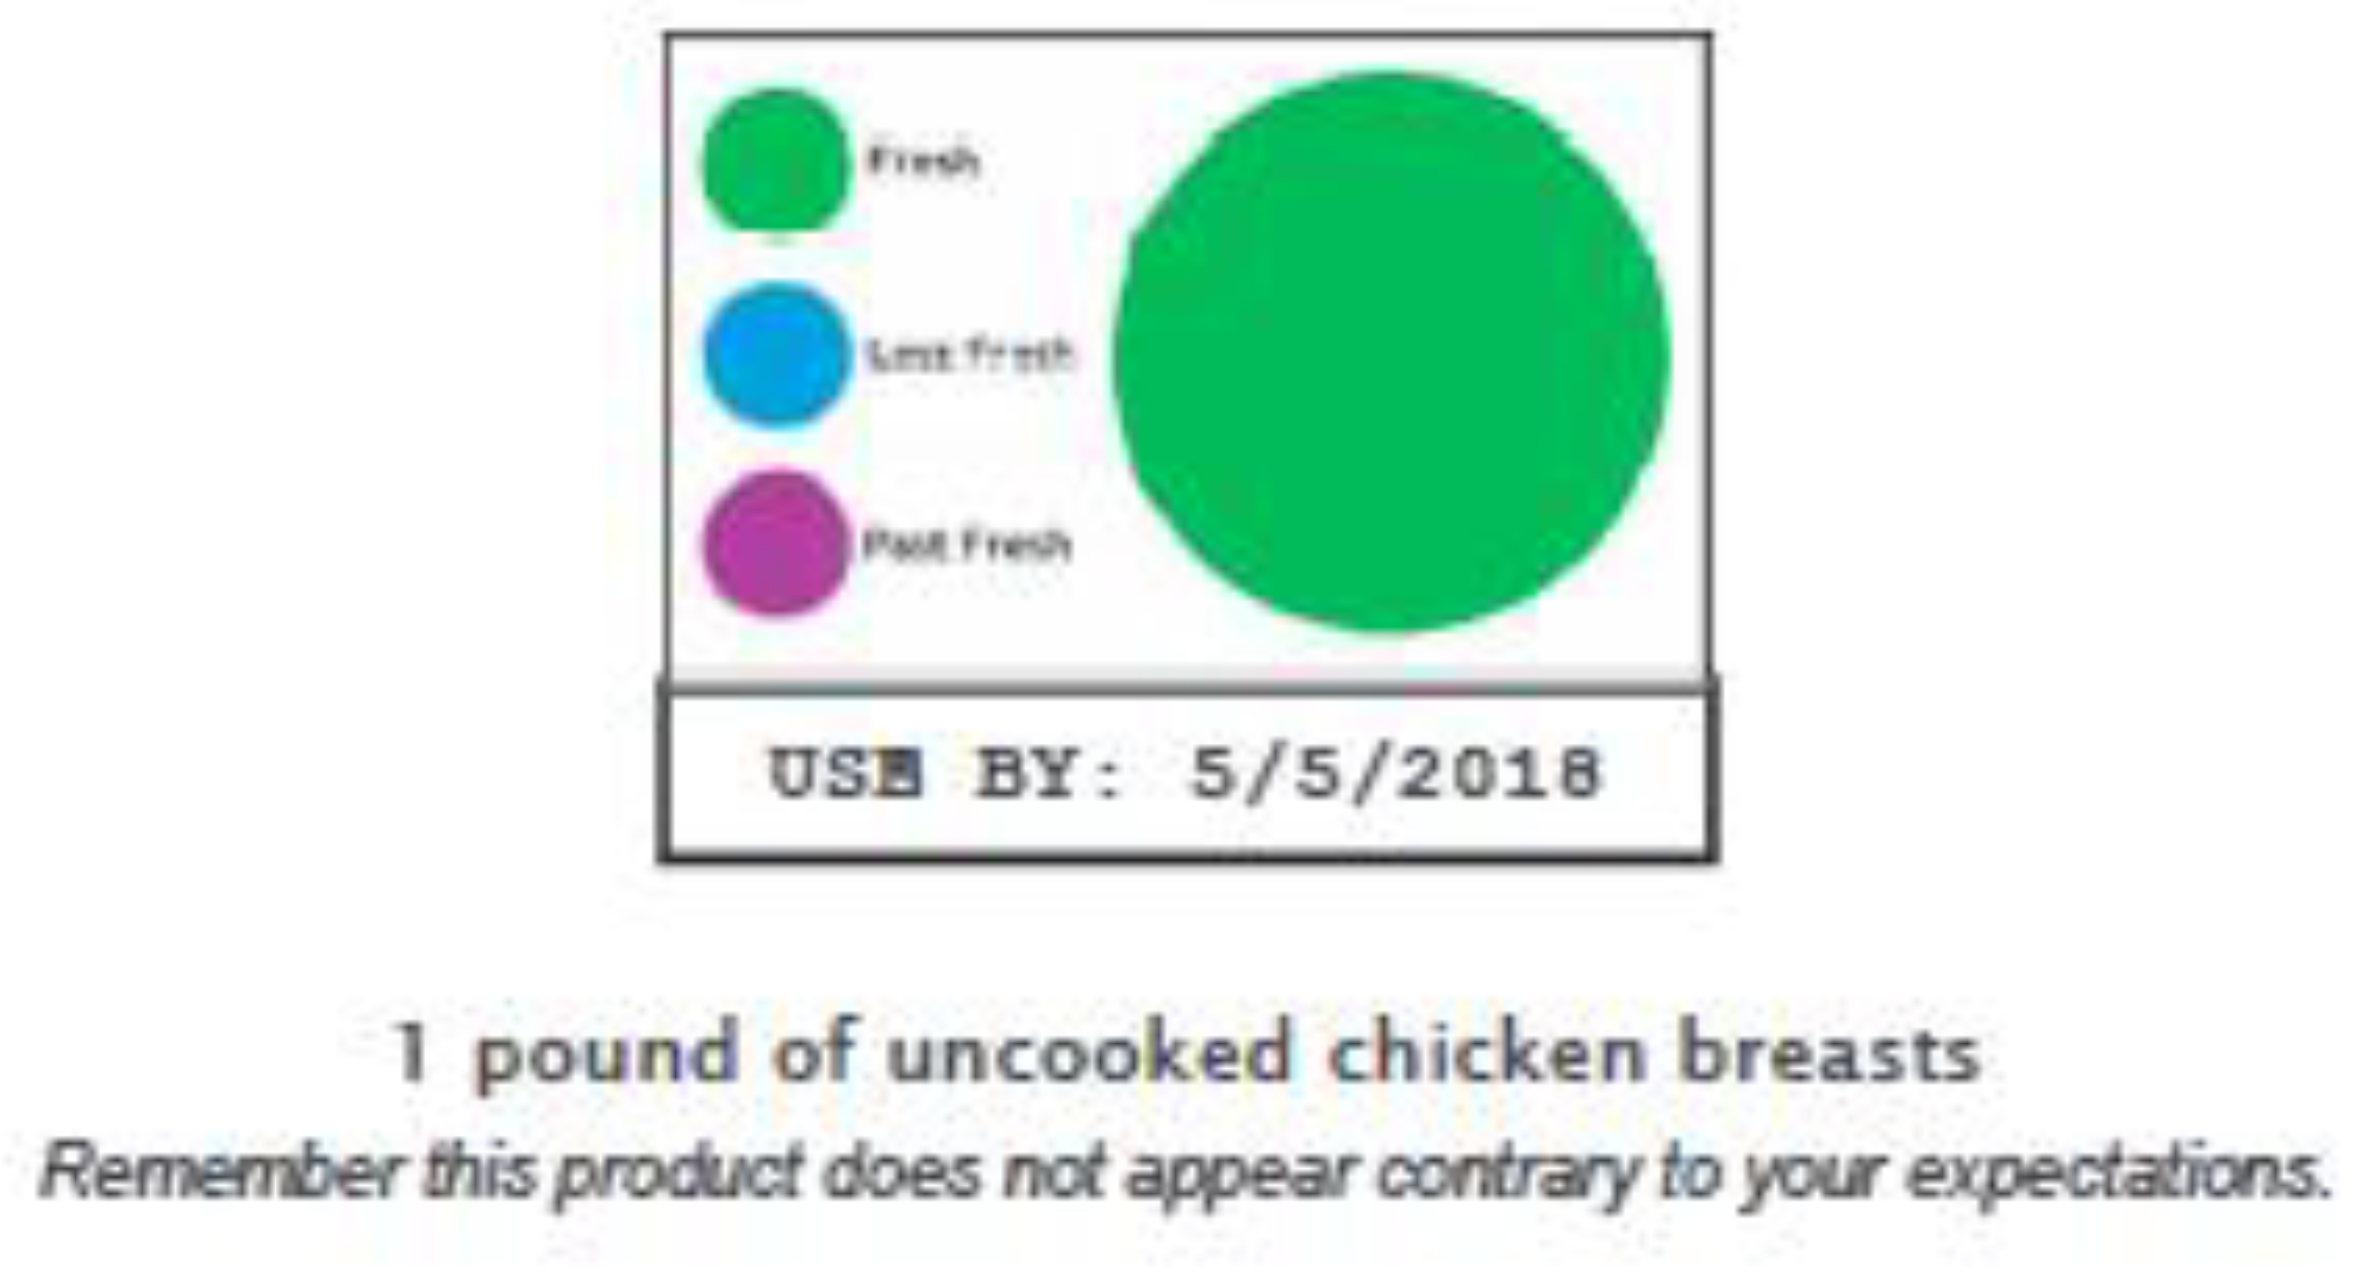
Figure A3.
Example of Information in Treatment with Date Code, Date Label, and Freshness Indicator.
Figure A3.
Example of Information in Treatment with Date Code, Date Label, and Freshness Indicator.
References
- United Nations Environment Programme. Food Waste Index Report 2021. 2021. Available online: https://www.unep.org/resources/report/unep-food-waste-index-report-2021 (accessed on 12 July 2021).
- United Nations. Take Action for the Sustainable Development Goals—United Nations Sustainable Development. 2017. Available online: https://www.un.org/sustainabledevelopment/sustainable-development-goals/ (accessed on 12 July 2021).
- Buzby, J.C.; Wells, H.F.; Hyman, J. The Estimated Amount, Value, and Calories of Postharvest Food Losses at the Retail and Consumer Levels in the United States. EIB-121; U.S. Department of Agriculture, Economic Research Service, 2014. Available online: https://www.ers.usda.gov/webdocs/publications/43833/43680_eib121.pdf (accessed on 12 July 2021).
- Waste & Resources Action Programme. Labeling Guidance: Best Practice on Food Date Labelling and Storage Advice. 2019. Available online: https://wrap.org.uk/sites/default/files/2020-07/WRAP-Food-labelling-guidance.pdf (accessed on 12 July 2021).
- Evans, D. Beyond the Throwaway Society: Ordinary Domestic Practice and a Sociological Approach to Household Food Waste. Sociology 2012, 46, 41–56. [Google Scholar] [CrossRef]
- Quested, T.; Marsh, E.; Stunell, D.; Parry, A. Spaghetti soup: The complex world of food waste behaviours. Resour. Conserv. Recycl. 2013, 79, 43–51. [Google Scholar] [CrossRef]
- Stancu, V.; Haugaard, P.; Lähteenmäki, L. Determinants of consumer food waste behaviour: Two routes to food waste. Appetite 2016, 96, 7–17. [Google Scholar] [CrossRef] [PubMed]
- Neff, R.A.; Spiker, M.; Truant, P.L. Wasted Food: U.S. Consumers’ Reported Awareness, Attitudes, and Behaviors. PLoS ONE 2015, 10, e0127881. [Google Scholar] [CrossRef] [PubMed] [Green Version]
- Newsome, R.; Balestrini, C.G.; Baum, M.D.; Corby, J.; Fisher, W.; Goodburn, K.; Labuza, T.P.; Prince, G.; Thesmar, H.S.; Yiannas, F. Applications and Perceptions of Date Labeling of Food. Compr. Rev. Food Sci. Food Saf. 2014, 13, 745–769. [Google Scholar] [CrossRef] [PubMed] [Green Version]
- Toma, L.; Font, M.C.; Thompson, B. Impact of consumers’ understanding of date labelling on food waste behaviour. Oper. Res. 2020, 20, 543–560. [Google Scholar] [CrossRef] [Green Version]
- Roe, B.E.; Phinney, D.M.; Simons, C.T.; Badiger, A.; Bender, K.E.; Heldman, D.R. Discard intentions are lower for milk presented in containers without date labels. Food Qual. Prefer. 2018, 66, 13–18. [Google Scholar] [CrossRef]
- Yam, K.L.; Takhistov, P.T.; Miltz, J. Intelligent Packaging: Concepts and Applications. J. Food Sci. 2005, 70, R1–R10. [Google Scholar] [CrossRef]
- Janjarasskul, T.; Suppakul, P. Active and intelligent packaging: The indication of quality and safety. Crit. Rev. Food Sci. Nutr. 2018, 58, 808–831. [Google Scholar] [CrossRef]
- Davenport, M.L.; Qi, D.; Roe, B.E. Food-related routines, product characteristics, and household food waste in the United States: A refrigerator-based pilot study. Resour. Conserv. Recycl. 2019, 150, 104440. [Google Scholar] [CrossRef]
- Food Safety and Inspection Service. Food Product Dating. 2019. Available online: https://www.fsis.usda.gov/food-safety/safe-food-handling-and-preparation/food-safety-basics/food-product-dating (accessed on 12 July 2021).
- Reiley, L. “Best if used by.” The FDA Renders its Decision on Food Expiration Date Labels. The Washington Post. 2019. Available online: https://www.washingtonpost.com/business/2019/05/23/best-if-used-by-fda-renders-its-decision-food-expiration-date-labels/ (accessed on 12 July 2021).
- European Parliament and of the Council. Regulation (EU) No 1169/2011 of the on the Provision of Food Information to Consumers, Amending Regulations (EC) No 1924/2006 and (EC) No 1925/2006 of the European Parliament and of the Council, and Repealing Commission Directive 87/250/EEC, Council Directive 90/496/EEC, Commission Directive 1999/10/EC, Directive 2000/13/EC of the European Parliament and of the Council, Commission Directives 2002/67/EC and 2008/5/EC and Commis-sion Regulation (EC) No 608/2004. 2011. Available online: https://eur-lex.europa.eu/LexUriServ/LexUriServ.do?uri=OJ:L:2011:304:0018:0063:en:PDF (accessed on 12 July 2021).
- ReFED. A Roadmap to Reduce U.S. Food Waste by 20 Percent. 2016. Available online: https://refed.com/downloads/ReFED_Report_2016.pdf (accessed on 12 July 2021).
- Consumer Brands Association. Grocery Industry Launches New Initiative to Reduce Consumer Confusion on Product Date Labels. 2017. Available online: https://consumerbrandsassociation.org/posts/grocery-industry-launches-new-initiative-to-reduce-consumer-confusion-on-product-date-labels/ (accessed on 12 July 2021).
- Yam, K. Intelligent packaging to enhance food safety and quality. Emerg. Food Packag. Technol. 2012, 137–152. [Google Scholar] [CrossRef]
- Ellison, B.; Lusk, J.L. Examining Household Food Waste Decisions: A Vignette Approach. Appl. Econ. Perspect. Policy 2018, 40, 613–631. [Google Scholar] [CrossRef]
- Broad Leib, E.; Rice, C.; Neff, R.; Spiker, M.; Schklair, A.; Greenberg, S. Consumer Perceptions of Date Labels: National Survey. 2016. Available online: https://www.comunicarseweb.com/sites/default/files/consumer-perceptions-on-date-labels_may-2016.pdf (accessed on 12 July 2021).
| Publisher’s Note: MDPI stays neutral with regard to jurisdictional claims in published maps and institutional affiliations. |
© 2021 by the authors. Licensee MDPI, Basel, Switzerland. This article is an open access article distributed under the terms and conditions of the Creative Commons Attribution (CC BY) license (https://creativecommons.org/licenses/by/4.0/).


