
The Impact of Impervious Surface Expansion on Soil Organic Carbon: A Case Study of 0–300 cm Soil Layer in Guangzhou City


1
Key Laboratory of Vegetation Restoration and Management of Degraded Ecosystems, South China Botanical Garden, Chinese Academy of Sciences, Guangzhou 510650, China
2
College of Resources and Environment, University of Chinese Academy of Sciences, Beijing 100049, China
3
School of Public Administration, South China Agricultural University, Guangzhou 510642, China
*
Author to whom correspondence should be addressed.
Sustainability 2021, 13(14), 7901; https://0-doi-org.brum.beds.ac.uk/10.3390/su13147901
Submission received: 9 April 2021
/
Revised: 3 July 2021
/
Accepted: 6 July 2021
/
Published: 15 July 2021
(This article belongs to the Special Issue Ecosystem Service and Land-Use Changes in Asia: Implications for Regional Sustainability)
Abstract
:Empirical evidence shows that the expansion of impervious surface threatens soil organic carbon (SOC) sequestration in urbanized areas. However, the understanding of deep soil excavation due to the vertical expansion of impervious surface remains limited. According to the average soil excavation depth, we divided impervious surface into pavement (IS20), low-rise building (IS100) and high-rise building (IS300). Based on remote-sensing images and published SOC density data, we estimated the SOC storage and its response to the impervious surface expansion in the 0–300 cm soil depth in Guangzhou city, China. The results showed that the total SOC storage of the study area was 8.31 Tg, of which the top 100 cm layer contributed 44%. The impervious surface expansion to date (539.87 km2) resulted in 4.16 Tg SOC loss, of which the IS20, IS100 and IS300 contributed 26%, 58% and 16%, respectively. The excavation-induced SOC loss (kg/m2) of IS300 was 1.8 times that of IS100. However, at the residential scale, renovating an IS100 plot into an IS300 plot can substantially reduce SOC loss compared with farmland urbanization. The gains of organic carbon accumulation in more greenspace coverage may be offset by the loss in deep soil excavation for the construction of underground parking lots, suggesting a need to control the exploitation intensity of underground space and promote residential greening.
1. Introduction
The share of urban people in the world has increased from 30% in 1950 to 55% in 2018 and this proportion is projected to reach 68% by 2050 [1]. Urbanized areas in 2030 will nearly triple from those in 2000 [2]. With the rapid expansion of urban areas, many agricultural or natural ecosystem areas have been converted into greenspace or impervious surface, which greatly changes the structure and function of the original ecosystems and has a far-reaching impact on soil organic carbon (SOC) storage [2,3,4,5]. Previous studies have shown that urban vegetation has high carbon sequestration capacity [6,7,8,9,10,11], and the SOC density observed in greenspace is higher than that of grassland or farmland in some cities [8,12,13]. In New York City, the SOC density of the greenspace is comparable to that of suburban and rural forest soil [14]. However, the vegetation and soil removal and soil sealing during the installation of impervious surface have seriously disturbed soil functions [15], which can counterbalance the positive effects from urban greenspace ecosystems [14]. Impervious surface has become the dominant land cover in urbanized areas. Impervious surface covers approximately 31% [13] and 65.91% [16] of the land within urban areas in the United States of America and China, respectively, and more than 50% in many European cities [17]. Therefore, it is necessary to study the influence of impervious surface construction on SOC storage to comprehensively quantify the impact of urbanization on regional carbon budgets [18,19].
The effect of impervious surface expansion on soil carbon storage has been studied from two perspectives. Some studies revealed the differences in SOC storage between sealed soils and surrounding greenspace soil at the sample site scale [14,19,20,21,22,23], and others have used spatially explicit models driven by land cover change and/or other multiple environmental covariates to analyze the total SOC loss and its spatial and/or temporal variability at regional, national and even global scales [24,25,26,27,28]. These models provide a powerful and effective tool for presenting carbon changes in space and time. However, they usually treat urban area or impervious surface as a homogeneous space unit, and interpret land cover types from medium or low resolution remote sensing images, which cannot reflect the differences of soil carbon disturbance among impervious surface types. For urban carbon management, research based on high-resolution images and refined types of impervious surface could be more beneficial to policy making.
Topsoil removal is the main cause of depletion in SOC content under impervious surface [29]. Although the depth of soil removal varies in different types of impervious surface, few studies have explored in detail the difference of soil carbon disturbance between different impervious surfaces. In China, the depth of soil extraction for pavement is approximately 15–30 cm, and that for low-rise buildings without underground parking lots is approximately 80–100 cm. High-rise buildings usually include underground garages. According to the Design Code for Residential Buildings (GB 50096-2011) [30], the net height of underground garage driveways should not be less than 220 cm. Adding spaces for the construction of building foundations and for the installation of facilities, such as pipes, wires and ventilating ducts, the depth of soil extraction for buildings with underground parking requires a deeper depth than 300 cm. Large utility lines, subways, car park facilities and malls have been constructed under the urban surface in many big cities around the world [31,32], especially in China where high-rise buildings with underground parking lots are widely distributed in many medium-sized or big cities. Although the depth of soil excavation in many underground space utilizations is deeper than the top 100 cm soil layer, most published studies on urban SOC storage ignored the carbon below a depth of 100 cm. Soil at deeper depths (e.g., 100–300 cm) still has large carbon storage [33]; therefore, consideration of 0–20 cm or 0–100 cm soil depth cannot reveal the influence of the vertical expansion of impervious surface on SOC pools.
Soil is the largest contributor to the urban ecosystem carbon pool [13,34]. Although the SOC density beneath impervious surface is lower than that in adjacent greenspace areas [14,19,20,28,29], the contribution of soil under impervious surface to urban SOC pool is still large due to the large coverage area. For instance, in the Chicago and Boston metropolitan areas, the impervious surfaces contribute 28.76% and 22.46% to the total soil and plant carbon pools with aerial coverages of 60% and 53.9%, respectively [18]. In the China Urumqi urban area, the impervious surface covers 63% of the urban area and it contributes 57% of the SOC pool. Buildings account for a large proportion of impervious surface in cities; however, previous studies usually sample soils under pavement, such as roads, sidewalks, parking lots, paved backyards and paved squares [14,19,20,22,23,29], because it is hard to sample soil under buildings. The SOC stock in building-covered soil was assumed to be 0 kg/m2 [19,23], or was designated a proxy such as the SOC density of clean fill soil [13,18] or the provincial average SOC density [34], which greatly increased the uncertainty of urban SOC pool estimation and its response to the expansion of urban impervious surface. Thus, it is necessary to try other methods to estimate SOC storage in building-covered areas.
Due to the rapid land use/cover changes in China, ecosystem services intensity experienced a continuously decreasing trend from 1995 to 2015, especially in large megacities [35], and ecosystem service values for provision, regulation, support and culture also decreased during the period of 1988–2008 [36]. Guangzhou is a representative megacity with rapid urbanization and increasing impervious surface in China. Urban area in Guangzhou has increased from 187.40 km2 in 1990 to 1324.17 km2 in 2019 with an annual expansion area of 39 km2 [37]. Urban underground space use has become an essential part of the urban master plan in China. According to the urban subsurface development target of “The master plan of Guangzhou city (2011–2020)”, the city-wide area of developed underground space will reach 90 million square meters, of which 8 million square meters will be used as commercial space. This large-scale soil excavation will cause large disturbances to SOC storage, which should not be ignored in the environmental assessment of underground space exploitation. The objectives of this study were: (1) to estimate the SOC stocks of pavement, low-rise buildings and high-rise buildings based on their average soil extraction depth and the SOC density of pre-urbanization pervious surfaces; (2) to estimate the SOC storage in the 0–300 cm soil layer and then quantify the impacts of urban impervious surface expansion on the SOC stock at the residential and regional scale. To our knowledge, this is the first study in which the urban SOC and its response to the expansion of impervious surface in the 0–300 cm soil layer have been quantified. This research provides implications for policy making on how to reduce disturbances to the deep soil carbon pool during urban underground space development.
2. Materials and Methods
2.1. Study Area
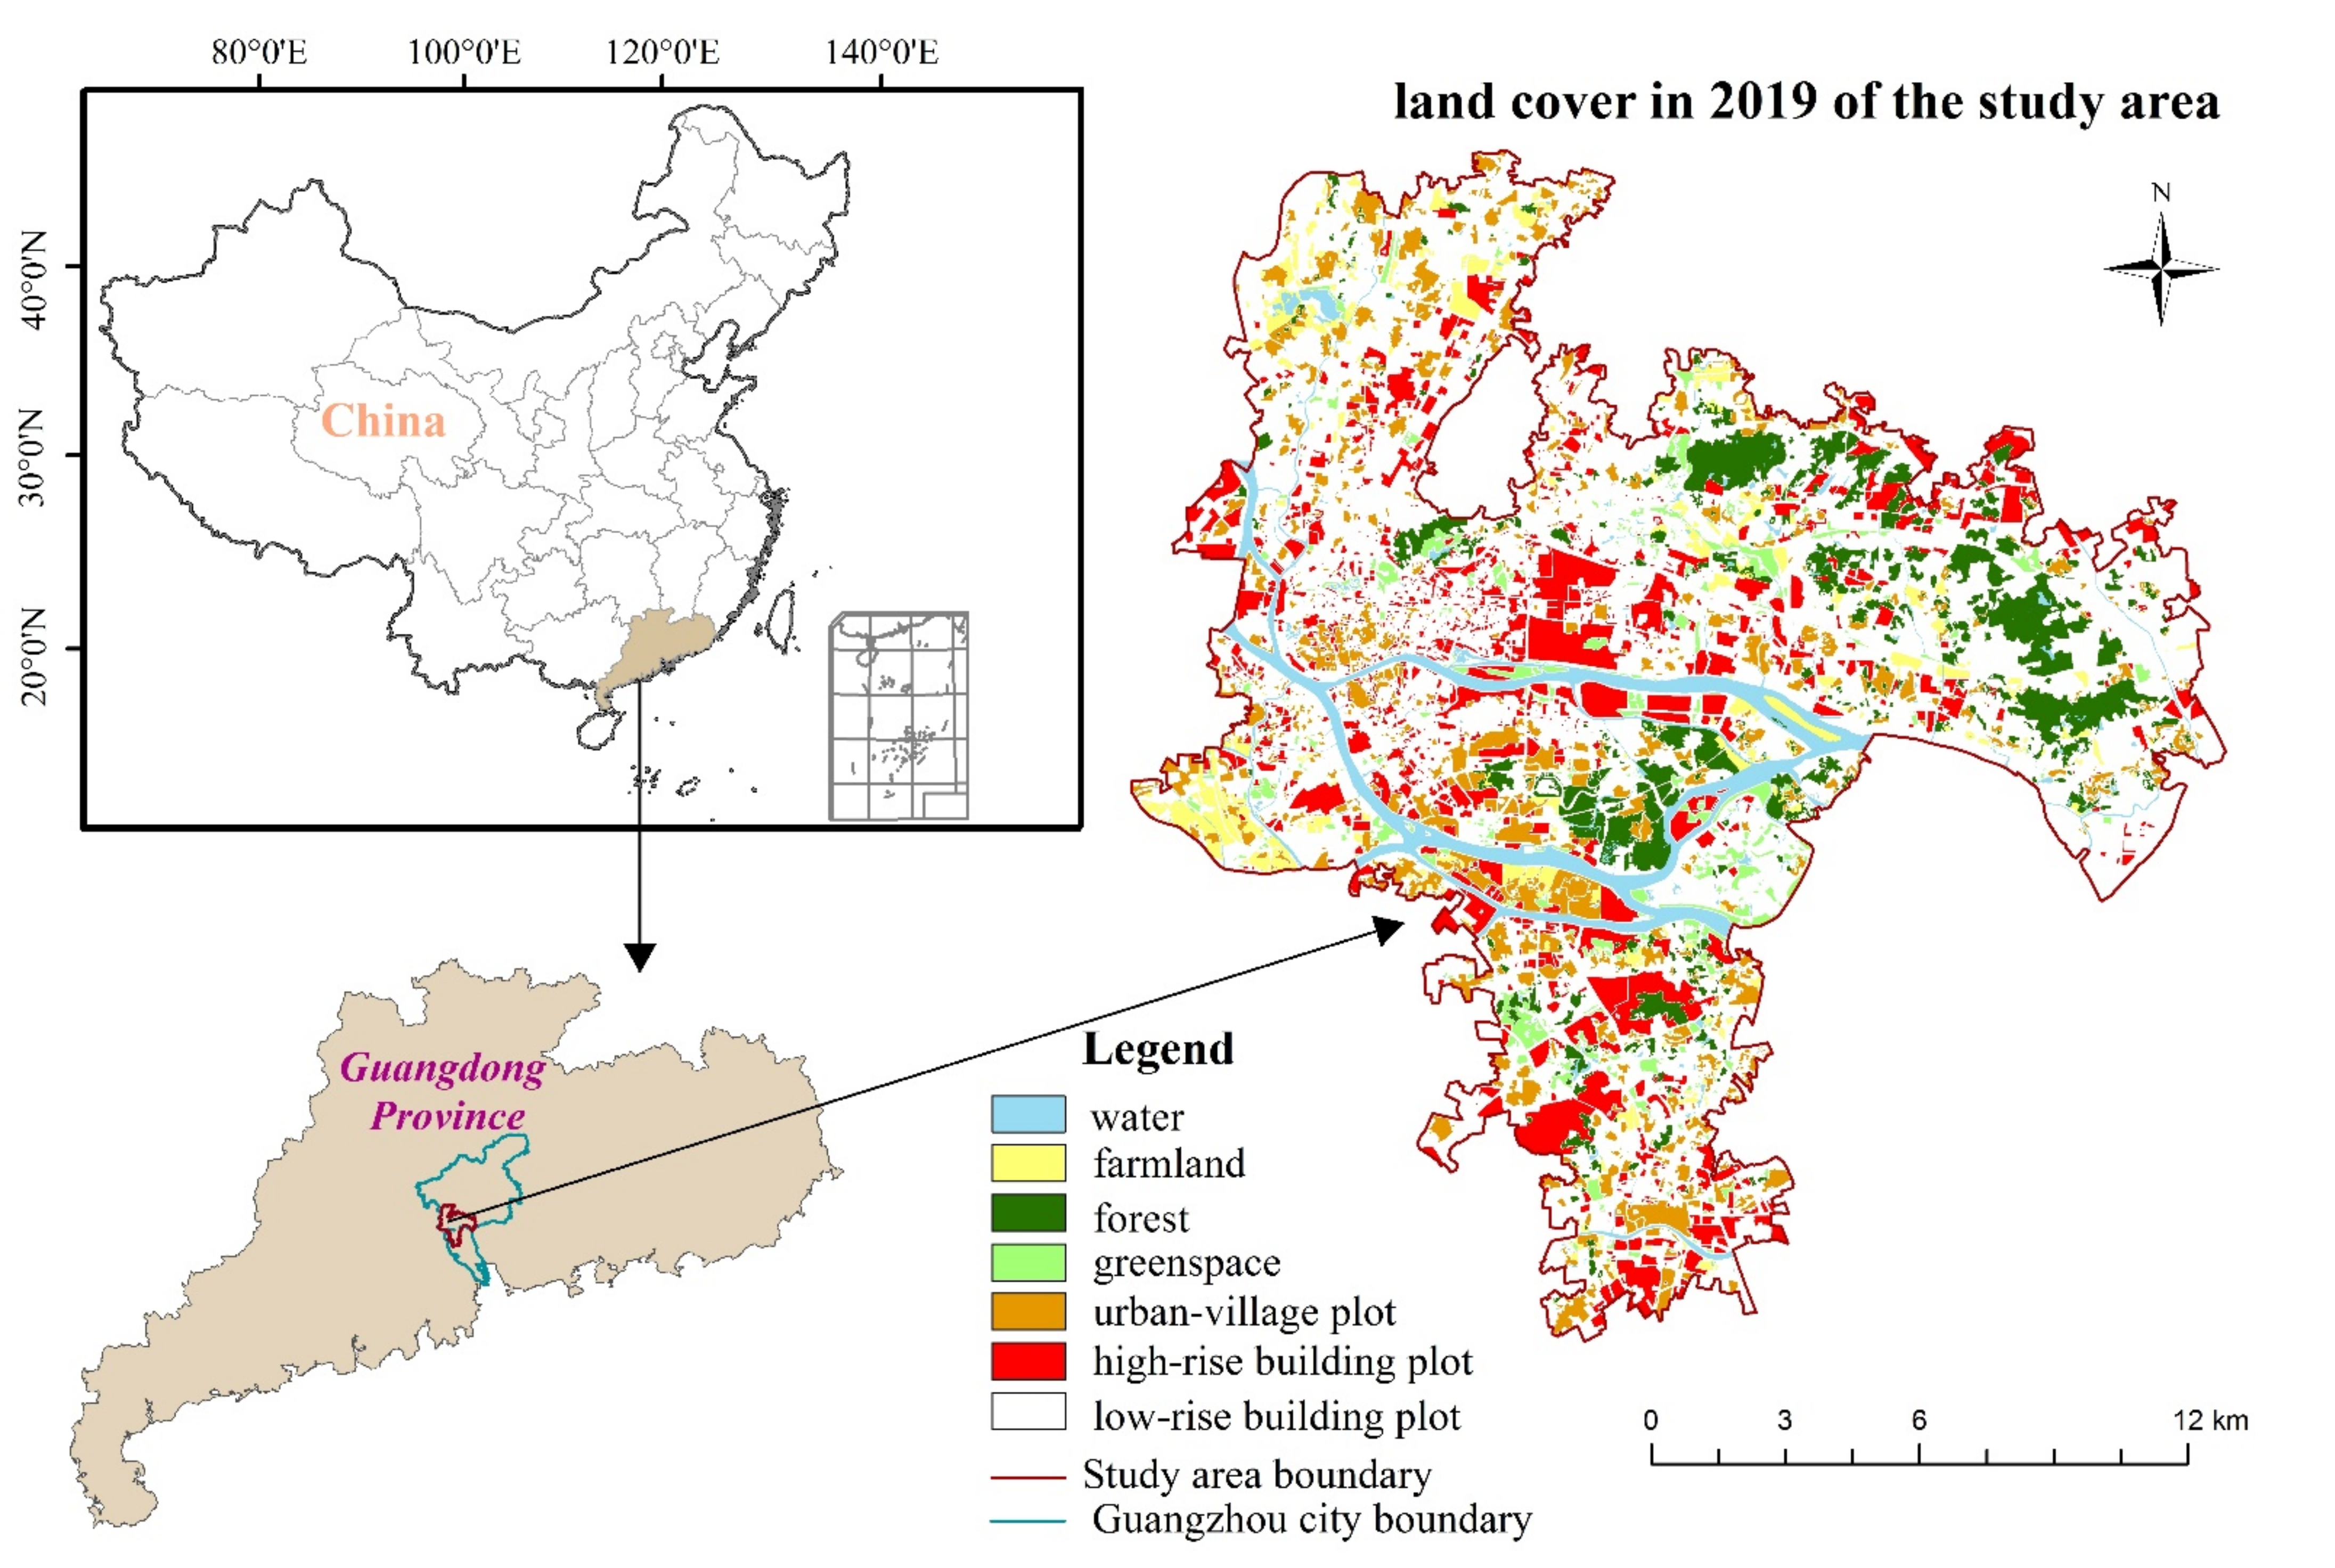
Guangzhou city (112°57′~114°03′ E, 22°26′~23°56′ N) is located in the lower reaches of the Pearl River Delta near the South China Sea. This city is the economic and transportation center of South China, with a built-up area of 1263.34 km2 and a large population of 14.49 million in 2018 [37], making it a key area to study the effects of impervious surface expansion on soil carbon sequestration. Guangzhou city, which is dominated by lateritic red soil and paddy soil, has a subtropical monsoon climate with an average annual temperature of 21.4–22.6 °C and an average annual precipitation of 1600–2300 mm [37]. The northeastern part of this city is dominated by middle and low mountains, the central part contains a hilly basin and the southern part contains a coastal alluvial plain. We delineated the urban core area (735.66 km2) as our study area on Google Earth images (0.27 m resolution) using geographic information system software (ArcGIS version 10.4, ESRI) (Figure 1). This area is separated from the surrounding regions by rivers, woodlands, farmland and rural settlements.
2.2. Mapping Land Use/Cover in 2019
We first classified land use/cover into nine types: urban village plot, high-rise building plot (>28 m), farmland, conservatory, residual forest, tree orchard, water, greenspace with area larger than 1500 m2 and low-rise building (<28 m) plot. Then, using manual digitization techniques, we digitized the first eight land use/cover types from Google Earth images (0.27 m resolution) using the software of ArcGIS (version 10.4, ESRI). The area of the low-rise building plot was the total size of this study area minus the summed area of the other eight land cover types. Second, we grouped the above nine land use/cover types into six categories: greenspace, woodland, farmland, pavement (excavated soil thickness ≤ 20 cm, IS20), low-rise building (excavated soil thickness ≤ 100 cm, IS100) and high-rise building (excavated soil thickness ≥ 300 cm, IS300). According to codes for road and building foundation construction, consultation with engineers and our field investigation, we assigned the evacuation thickness of IS20, IS100 and IS300 as 0–20, 0–100 and 0–300 cm, respectively, and detailed information was presented in the Section 1 of the Supplementary Materials [30,38]. The area of green space was the difference between the total area of this study and the summed area of the other five land cover types. Tree orchard land was grouped with forestland. Conservatory land was classified as farmland. Buildings located in urban village plots and low-rise building plots were grouped as IS100. IS300 included buildings located in high-rise building plots and low-rise building plots or villas equipped with underground parking or other kinds of underground space development. To calculate the area covered by buildings, we multiplied the area of each type of building plot by its building density. The building densities of low-rise building plots, high–rise building plots and urban village plots were randomly sampled based on Google Earth images (0.27 m resolution) using the software of ArcGIS. To calculate the area of pavement, we first calculated the sum area of the impervious surface and bare soil and then subtracted the area of the buildings and conservatory areas (according to Google Earth images, most of the bare soil plots are land parcels under construction, and they were digitized as high-rise building plots; impervious surface interpreted from Landsat images included conservatories that were grouped with farmland). We used the method developed by Fan et al. [39] to estimate the area of imperious surface (Figure S1) and bare soil from Landsat8 OLI images (30 m resolution) at the subpixel scale. The detailed framework for the land use/cover type interpretation was presented in Figure S1 and Table S1. The accuracy assessment of impervious surface map and land use/cover data was presented in the Section 2 of the Supplementary Materials [39, 40, 41, 42].
2.3. Compiled SOC Densities for Pervious Surfaces
By assuming that the 100–200 cm soil layer had a constant SOC density, we calculated the SOC density of the 100–200 cm layer according to the difference in SOC density between the 0–180 cm and 0–100 cm soil layers. The SOC density of woodland was an area-weighted value of the SOC density in residual forest and tree orchard soil. The SOC density of the 0–20 cm, 0–100 cm and 0–180 cm soil layers in farmland, woodland, orchard and greenspace were derived from Zhu [39,40].
For the SOC density of the 200–300 cm layers in woodland and farmland soil, we used the globally averaged SOC density of 200–300 cm soil in tropical evergreen forest and farmland [33] as a proxy, respectively. Urban land in this study area was mainly converted from farmland; therefore, the SOC density for greenspace in the 200–300 cm layer was assigned the value of the corresponding layer in the farmland soil.
2.4. Estimates of SOC Density for Impervious Surfaces
Previous studies have suggested that there is no significant difference between SOC density at the equivalent depth and soil sampled under impervious surface and greenspace [21,23]. The pattern of vertical decline of the SOC density in impervious-covered soil is similar to the trend of rural soils, and the disturbance of pavement installation to the subsoil layers may not be serious; therefore, the vertical distribution of the SOC density before soil sealing is largely maintained [19]. Due to the inaccessibility of soil sampling beneath impervious surface, especially soil under buildings, we estimated the SOC density of sealed soil according to the SOC density of the residual soil layer of the land use/cover before urbanization and the average depth of soil excavation for an impervious surface installation. We hypothesize that: (1) the mineralization rate of residual original soil layers was zero and that all excavated soil was removed from this study area; (2) for regional SOC loss estimation, soil excavation for the construction of buildings and underground facilities was limited to the areas where the buildings would be located. The specific assignment method was as follows.
The average excavation depth was included in the profile of impervious-covered soil; however, its SOC density was assigned as 0 kg/m2. The SOC density of the soil layer beneath impervious surface was equal to the SOC density of the residual soil layer of the land use/cover before urbanization. The average soil excavation depths were 0–20 cm, 0–100 cm and 0–300 cm for IS20, IS100 and IS300, respectively. By subtracting the SOC0–20 density from the SOC0–100 density of the pre-urbanization land use/cover, we obtained the SOC0–100 density of IS20. By assuming that the SOC density between 100 cm and 200 cm soils was a constant value, we evaluated the SOC100–200 density for IS20 or IS100 according to the averaged SOC density of the 0–180 cm layer in the original land use/cover soil before urbanization. We assigned the SOC200–300 density of farmland soil from Jobbágy and Jackson [33] as the SOC200–300 density of IS20 and IS0–100.
Field investigations [19,21,23] and estimation based on the measured SOC density of interval soil layers [14,22] are the main methods by which to obtain the SOC density of deep soil under pavement. SOC density of building-capped soil was assigned as 0 kg/m2 [14,19] or the density of clean-fill soil [13,18]. For comparison with the other methods and their values (Tables S2 and S3 within which references [19,21,23,42,43,44,45,46] were cited). we sampled soil (0–20 cm) beneath impervious surface from 11 new road reconstruction projects and clean-fill soil (a kind of backfill soil excavated from natural sedimentary soil layer, and into which organic waste, stone or white lime should not be mixed) from three road greening projects. We also collected SOC content data from granitic residual soil and oceanic-continental sedimentary clay soil (the widely distributed parent material in Guangzhou), as well as SOC content data from the bottom soil layers of paddy soil and lateritic red soil (the widely distributed soils in Guangzhou). Based on these literature-derived SOC data and the code of soil compaction used for road construction (to evaluate the bulk density of soil under impervious surface), we calculated the SOC density of the deep-soil layer beneath buildings and pavement (Tables S2 and S3). Methods of soil sample and SOC density calculation for the sealed soil and clean-fill soil were present in the Section 3 of the Supplementary Materials [38,46,47,48,49,50,51,52,53,54,55,56,57,58,59,60,61]. The SOC density estimated according to the SOC density of the remaining soil layer in the original pervious soil profile was used to assess the total SOC pool and its loss due to the expansion of impervious surface, while the SOC densities calculated by the other methods were mainly used for comparison.
2.5. Estimate of SOC Storage Loss Caused by Impervious Surface Expansion
Topsoil removal largely contributed to the depletion in SOC content under impervious surface [21,23,29]. We used the SOC storage in the removal soil layer as a representation of the carbon loss caused by impervious surface expansion since it is almost impossible to survey soil beneath buildings. SOC0–300 density changes and the total SOC0–300 pool loss were estimated to reveal the impact of impervious surface expansion at the residential and regional scale, respectively. For farmland urbanization, the loss of SOC0–300 storage at the residential scale was estimated by the area-weighted average SOC0–300 loss in pavement, building and greenspace. For impervious surface and green space, we assumed that the SOC density loss for each impervious surface was the difference between the SOC density of the original pervious surface before urbanization and the estimated SOC density of each surface type. It is very difficult to conduct a spatially explicit study on the conversion between each impervious surface and original pervious surfaces; therefore, we took the average SOC0–300 density of woodland (including tree orchard) and farmland as a proxy for the SOC density of original pervious surfaces (farmland, tree orchard and woodland were the main land use/cover types before urbanization in this region, and the differences in SOC0–180 density between these land covers were small [40]). For urban renewal plots, the loss of SOC storage was the difference of SOC0–300 density before and after urban renewal. The detailed method of this section is present in the Table S5 [62,63,64].
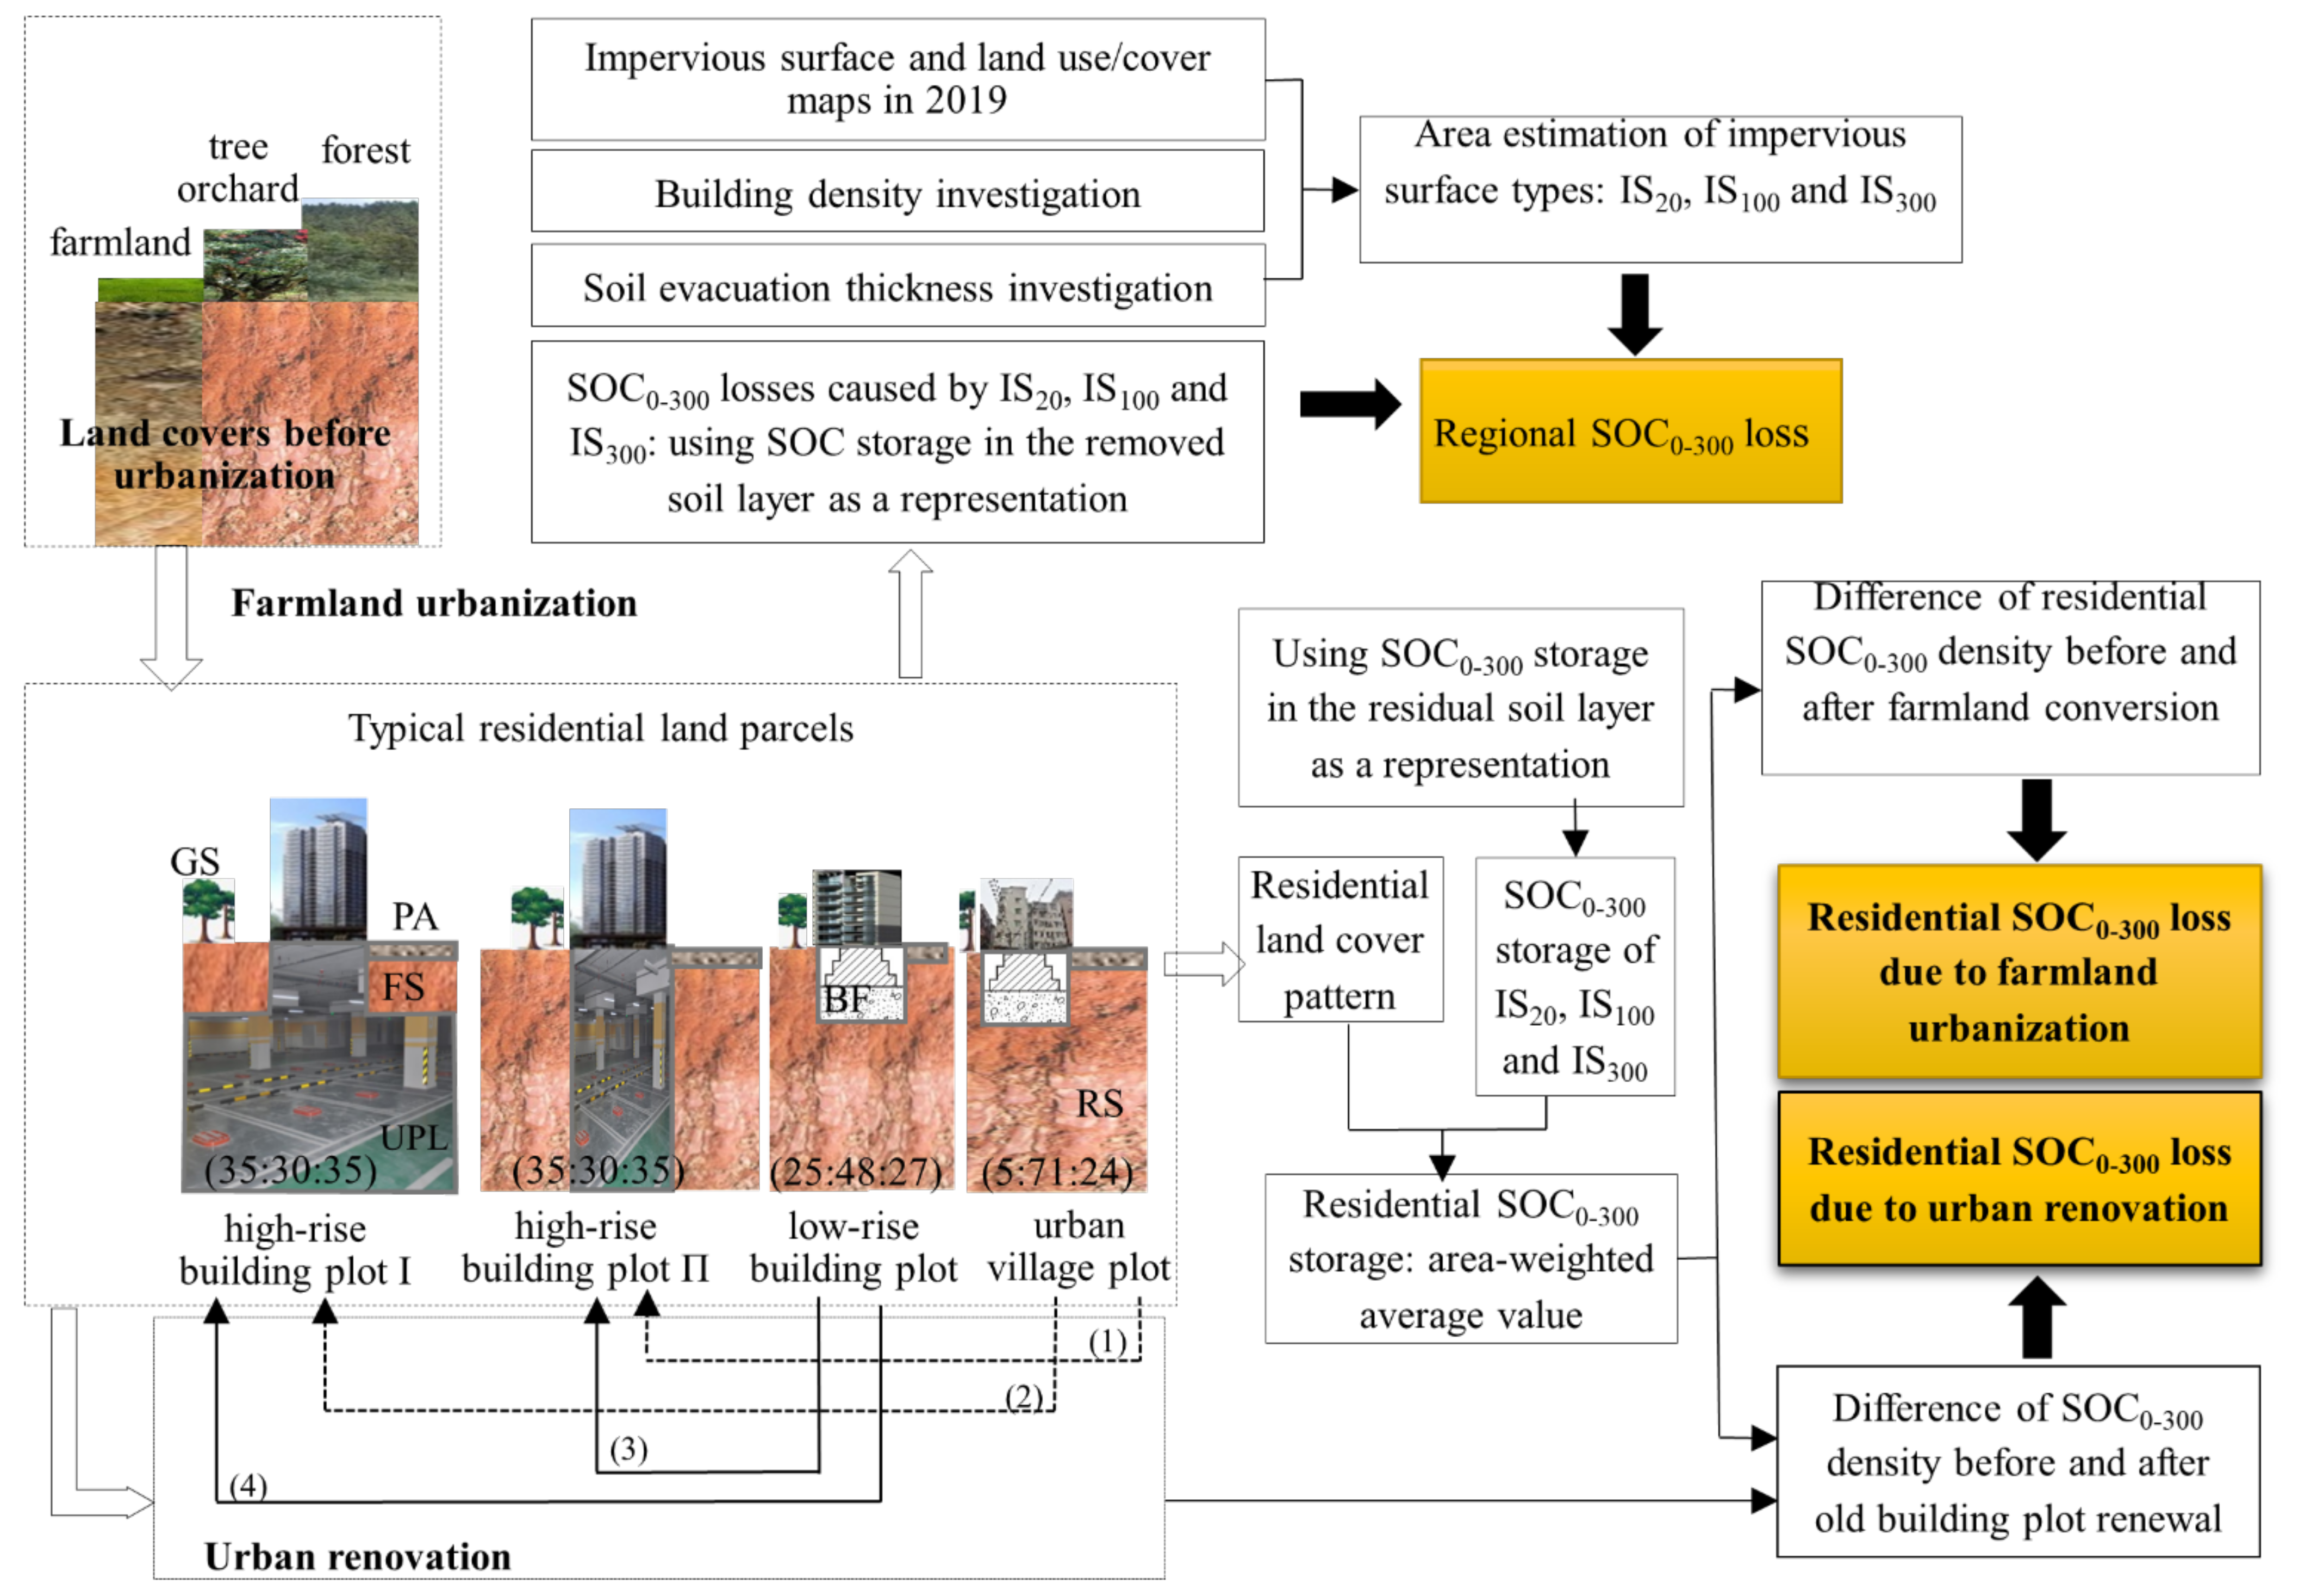
The rapid urbanization of Guangzhou city began around 1990; however, the earliest fine resolution images that we could get were from 2000. Therefore, we did not consider the specific time period of impervious surface expansion, but rather assessed the total SOC loss according to the current distributions and areas of these impervious surface types. To estimate the SOC pool loss caused by the expansion of each impervious surface, we multiplied the area of each impervious surface by its loss of SOC0–300 density. Summing the SOC pool losses caused by each impervious surface, we obtained the total SOC pool loss due to the expansion of impervious surface to date. A summary of the method and characteristics of the study area are shown in Figure 2.
3. Results
3.1. Area Estimation by Land Cover in 2019
IS20 had the largest area (35.54%), followed by IS100 (32.88%), greenspace (9.13%), woodland (8.02%), IS300 (4.96%) and farmland (3.39%) (Figure 1). The areas of urban village plots, low-rise building plots and high-rise building plots were 89.53, 364.97 and 121.41 km2, respectively (Table S1). Large areas of urban roads were subsumed in the low-rise building plots. However, these roads were not considered in the building density sample, which may result in an overestimation of 16% of the low-rise building’s area (Section 2 of the Supplementary Materials). We used the root mean square error (RMSE) to assess the accuracy of the impervious surface map, and the RMSE citywide was 0.20 (Section 2, Figure S1). The total area of IS20, IS100 and IS300 (539.87 km2) was much higher than the impervious surface area interpreted from Landsat 8 OLI images (Figures S1 and S2), because the bare soil areas were regarded as high-rise building plots under construction.
3.2. SOC Stock and Its Profile Distribution by Land Cover
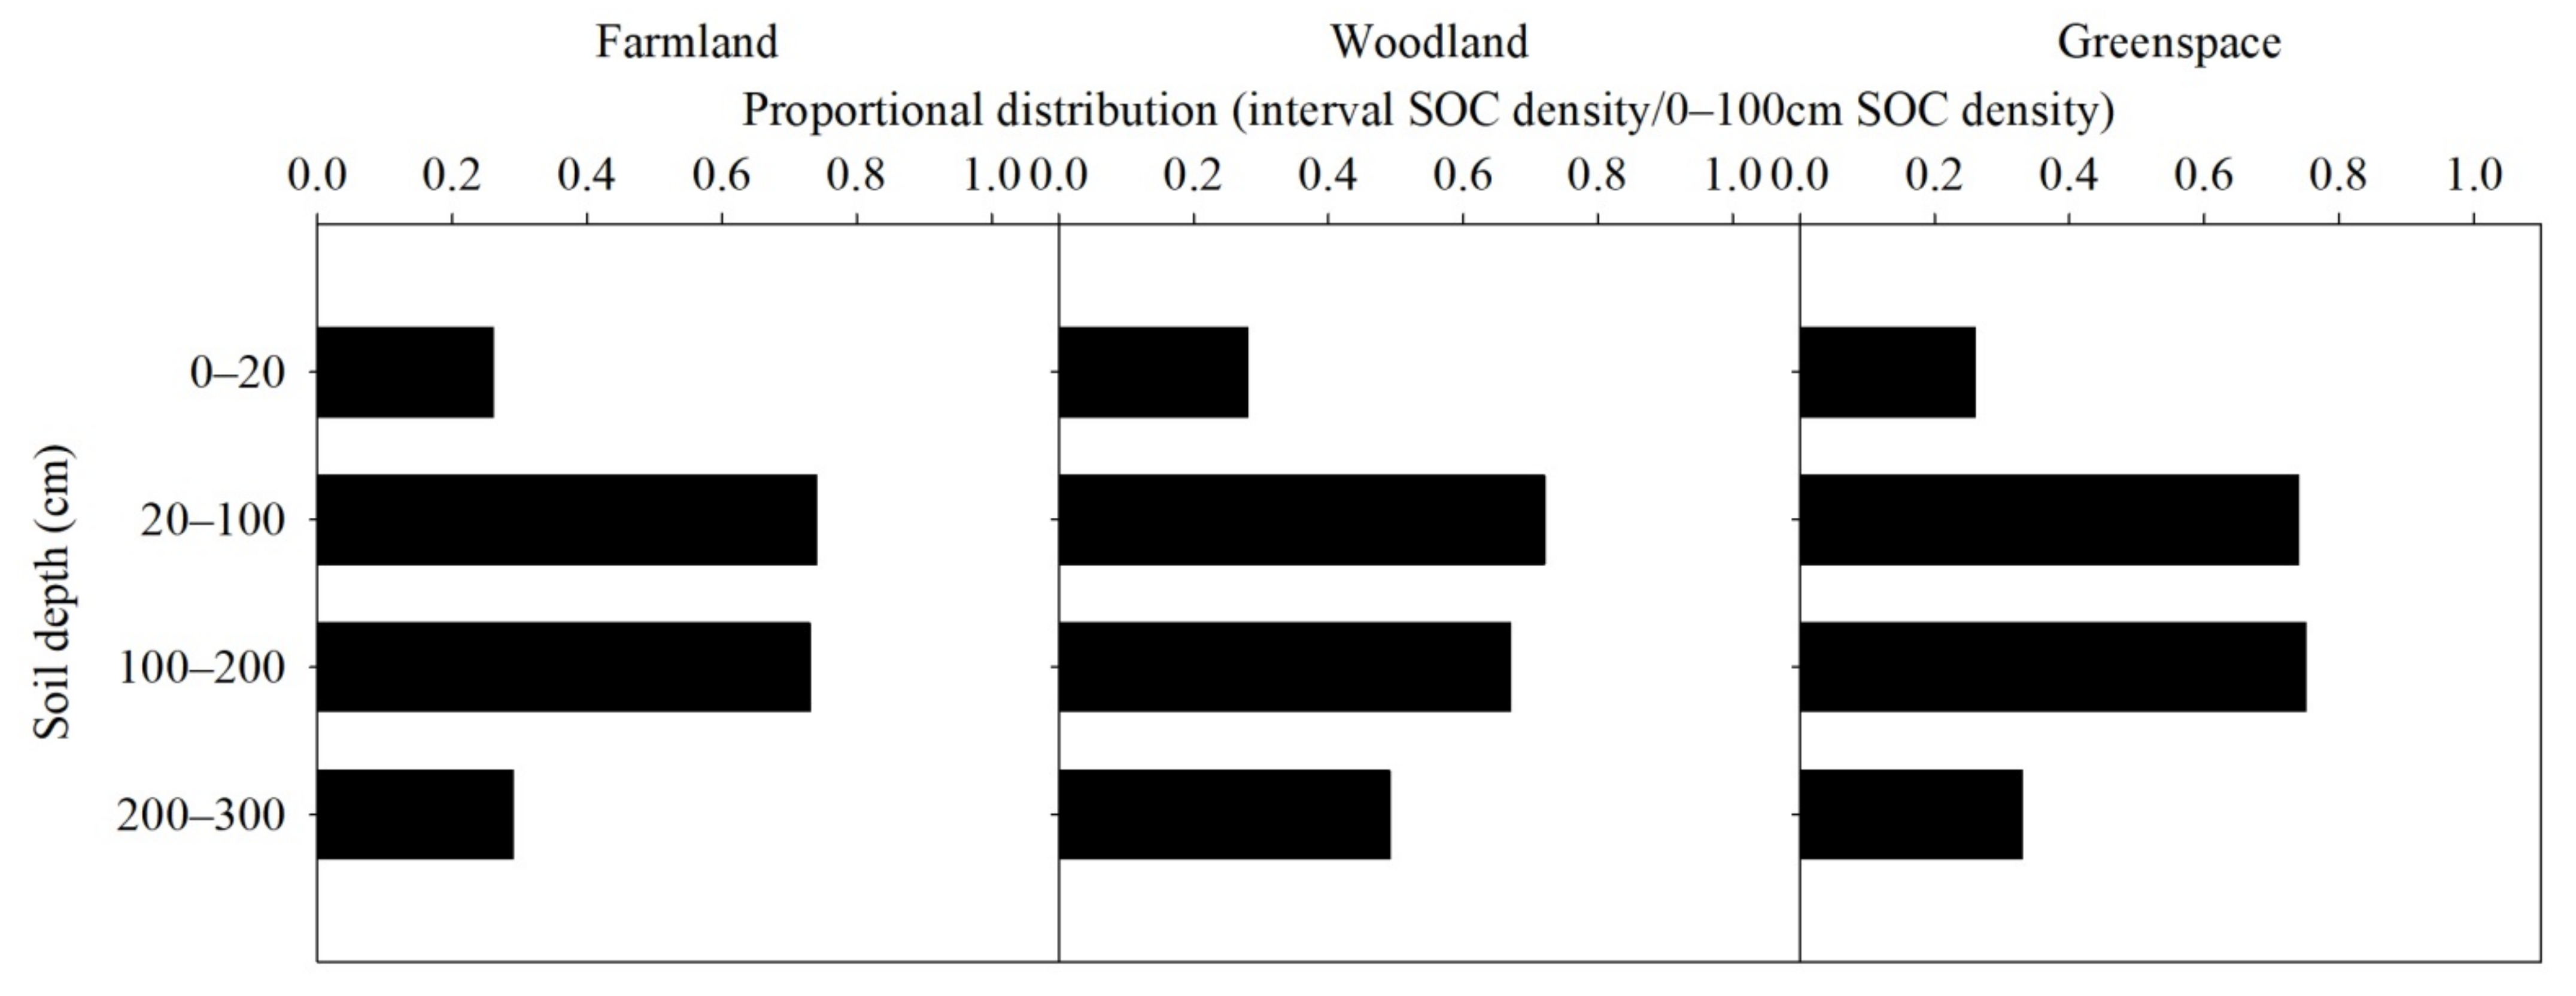
When the thickness of the excavated soil layer was included in the profile of impervious-covered soil, the SOC density at the 0–300 cm layer of farmland, woodland, greenspace, IS20, IS100 and IS300 was 19.04 kg/m2, 17.32 kg/m2, 17.15 kg/m2, 4.04 kg/m2, 8.22 kg/m2 and 0 kg/m2, respectively (Table 1). Relative to the top 100 cm, the percentage of SOC density in the 0–20 cm layer was 26%, 28% and 26% for farmland, woodland and greenspace, respectively; the proportion of SOC density in the 100–200 cm layer was 0.73%, 0.67%, and 0.75%, respectively (Figure 3). The SOC0–100 density and SOC100–200 density for IS20 accounted for 41% and 39% of SOC0–300 density, respectively. The SOC density of IS100 in the 100–200 cm layer was 67% of that in the 0–300 cm layer (Table 1).
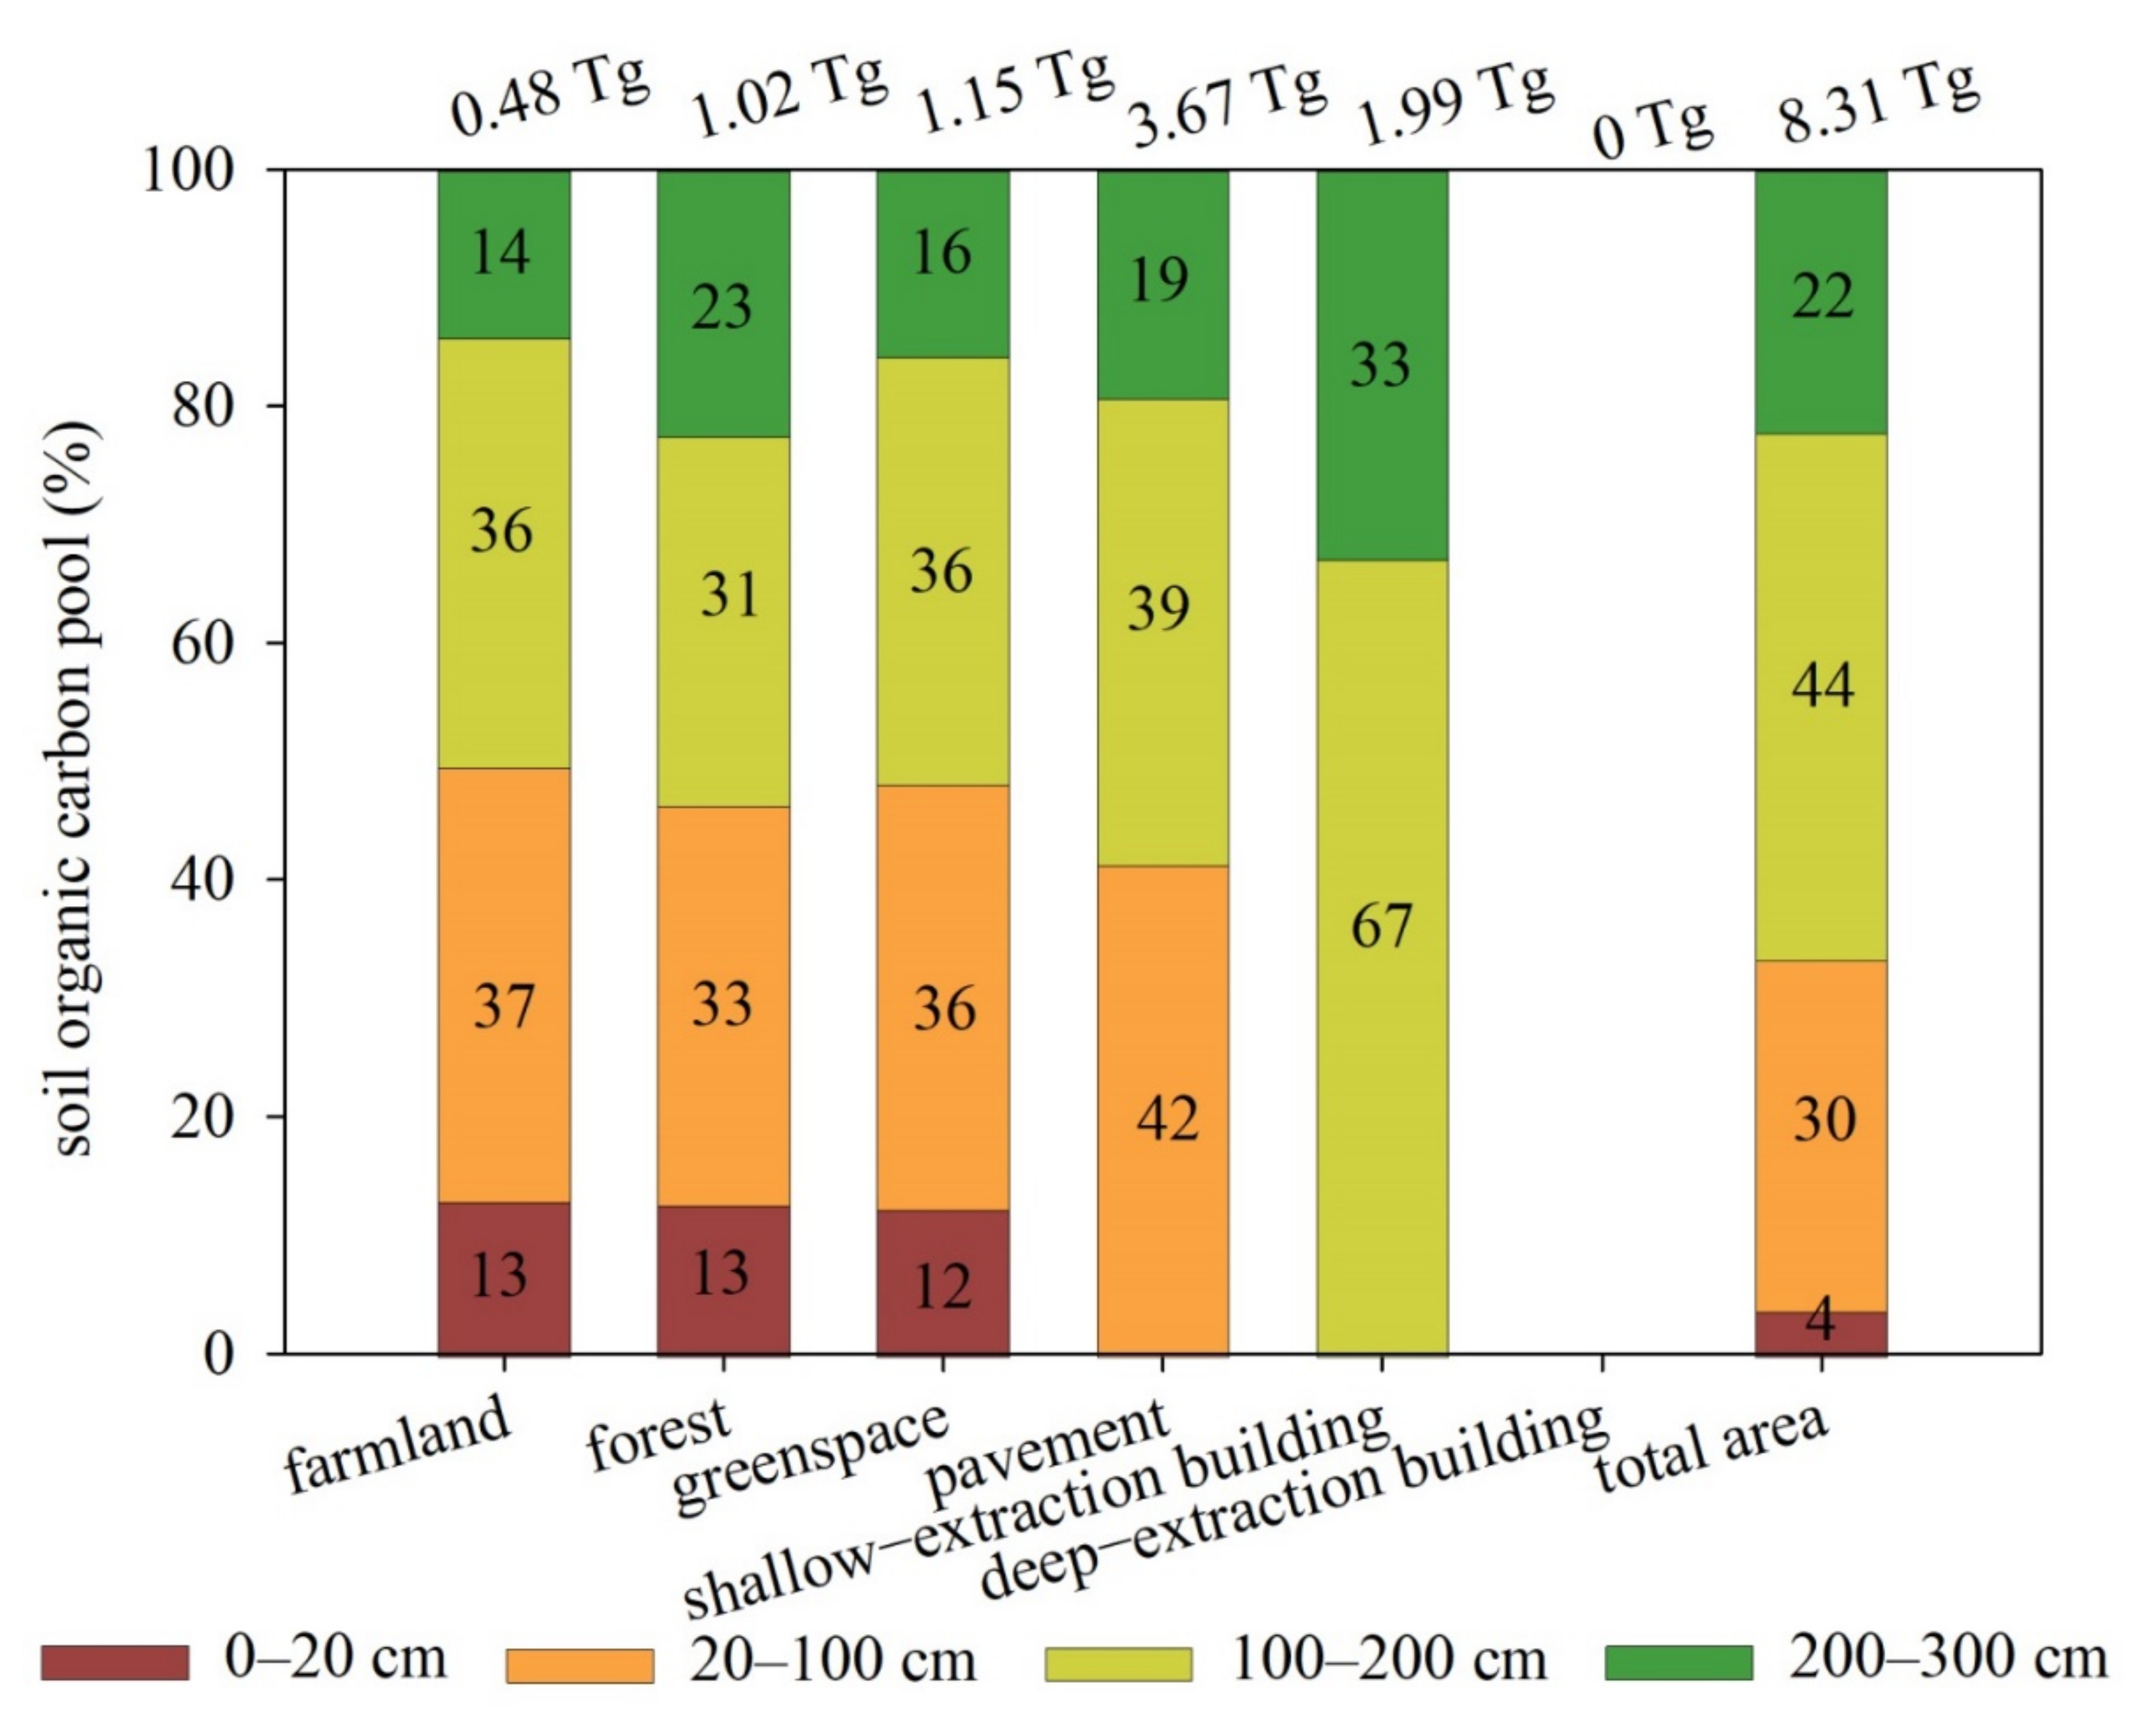
The total SOC pool of 300 cm was 8.31 Tg (the thickness of the excavated soil layer was included in the profile of impervious-covered soil), and the largest pool by land cover was IS20 (3.67 Tg), followed by IS100 (1.99 Tg), greenspace (1.15 Tg), woodland (1.02 Tg), farmland (0.48 Tg) and IS300 (0 Tg) (Figure 4). By soil horizon, the contributions of the 0–20 cm, 20–100 cm, 100–200 cm and 200–300 cm layers to the total SOC pool were 4%, 30%, 44% and 22%, respectively (Figure 4, Table S4). Pervious surface carbon pools contributed 32% of the total SOC pool, of which 48% was stored in the 0–100 cm soil layer; impervious surface carbon pools contributed 69% of the total SOC pool, of which 49% was stored in the 100–200 cm layer (Table S4).
3.3. SOC Loss Caused by Soil Removal for the Installation of Impervious Surface
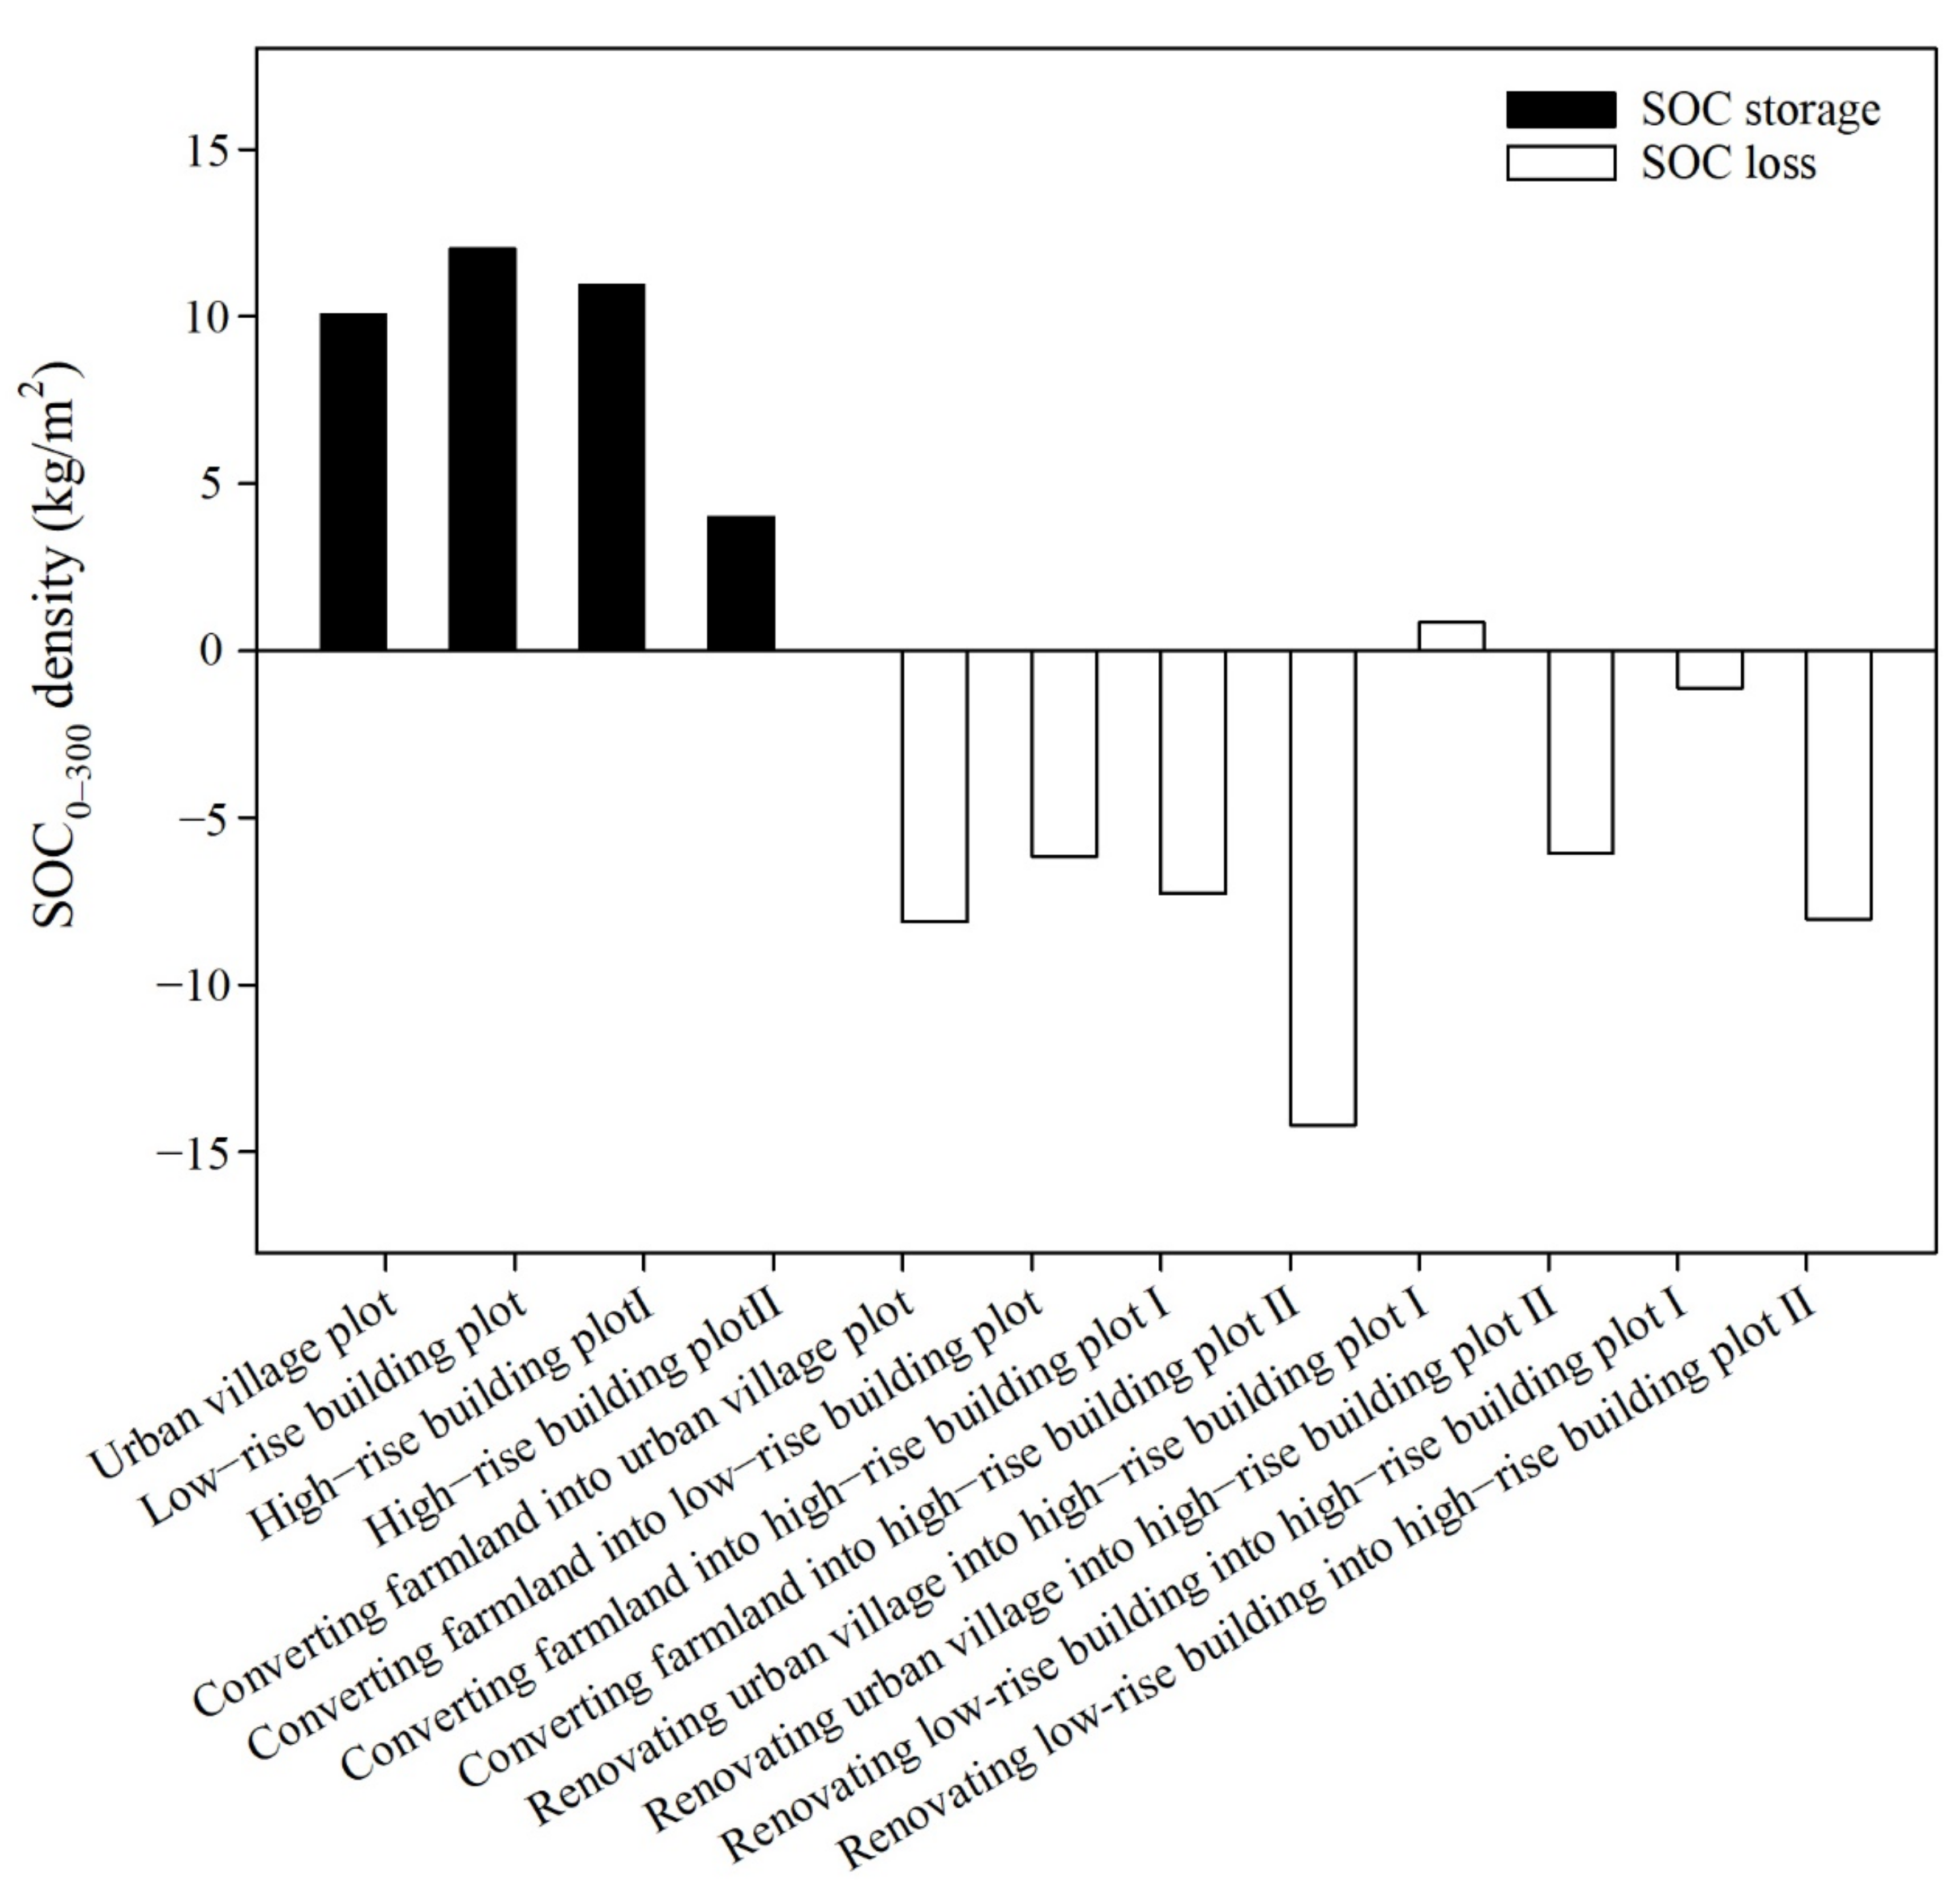
All residential districts converted from farmland had high SOC0–300 loss (6.16–14.18 kg/m2), particularly the high-rise building plots for which underground parking lots covered the whole residential land (14.18 kg/m2) (Figure 5, Table S5). The SOC0–300 losses of renovating urban village into high-rise building plot were lower than that of renovating low-rise building plot. If underground parking lot covers 30% of the residential area, urban village renovation may even slightly increase SOC storage (0.85 kg/m2) (Figure 5, Table S5).
The total SOC loss caused by the expansion of impervious surface (539.87 km2) was 4.16 Tg (0–300 cm), of which the IS100, IS20 and IS300 contributed 58%, 26% and 16%, respectively (Table 2). The SOC density loss by impervious surface type was 18.18 kg/m2, 9.96 kg/m2 and 4.14 kg/m2 for IS300, IS100 and IS20, respectively (Table 2).
4. Discussion
4.1. Comparison Analysis of SOC Density for Pervious Surfaces
Our results showed that the SOC0–20 density and SOC0–100 density in farmland were much lower than the global mean values of the corresponding soil layers [33]. The average proportion of SOC0–20 density to SOC0–100 density in farmland was 26% (Figure 3), which was close to the sampled value of 29% in the Ten-Thousand-Mu Orchard in the Haizhu District of Guangzhou city [65], but slightly lower than the citywide average value of paddy soils (33%) in Guangzhou [66]. All of the above-mentioned ratios in the farmland of Guangzhou were much lower than the global mean value of 40% [33], and farmland management practices may be the main reason for this difference. Compared with the utilization of chemical fertilizer, less organic fertilizer was applied in the farmland of Guangzhou, which was disadvantageous to the SOC accumulation, especially in the topsoil. Sulman et al. [67] reported that tilled soil had low organic carbon concentrations in the top mineral soil. In Guangzhou city, farmers rarely let their land lie fallow, instead tilling their farmland more frequently because of the farming system of the rice-rice-vegetable rotation or the rotation of various vegetables. Farmers plow paddy fields into deep furrows (to a depth of 20–30 cm covered with water) and then heap up soil into rows of broad ridges to grow vegetables on them. Therefore, soils layers deeper than 20 cm are often flooded, which is beneficial to the accumulation of organic carbon in the deep soil. The SOC0–200 density in farmland (Table 1) was slightly higher than the global averaged value of 15.0 kg/m2 [33]. This may contribute to landform and soil parent material in this region. Buried soil layers in the alluvial plain of a river can increase the organic carbon storage of the deep soil layer [68,69]. Our study area is located in the lower reaches of the Pearl River Delta and near the South China Sea. Organic-rich, oceanic-continental sedimentary clay soils are widely distributed in this area. Furthermore, large areas of this clay soil are buried no deeper than 300 cm [70], and its average organic carbon concentration is as high as 2% [46].
The average SOC0–100 density of woodland was only 43% of the global average value [33]; the low stand age and anthropogenic disturbance may be the main reasons for these lower carbon stocks. Guo and Gifford [71] noted that the conversion of natural forests into plantations reduced soil carbon storage. Many forests in the study area are secondary forests or young forests planted in the middle of the 1980s. The average SOC density of the young, middle-aged and mature forests in the Pearl River Delta (where Guangzhou city is located) was only 6.67 kg/m2, 8.41 kg/m2 and 10.26 kg/m2, respectively [72], all of which are much lower than the values reported by Jobbágy and Jackson [33]. The SOC100–200 density in woodland (Table 1) was comparable to the average value in tropical evergreen forest soil [33], which may be due to the deeply buried organic-rich clay soil under the orchard land (tree orchards were grouped with woodland).
We assigned the SOC200–300 density of farmland reported by Jobbágy and Jackson [33] as a proxy to the SOC200–300 density of farmland soil in our study area. Turnover profiles, which were removed from the dataset of Jobbágy and Jackson, were widely distributed in our study area because of the organic-rich sedimentary clay soil that developed in the deep layer of paddy soil [43]; therefore, this proxy maybe an underestimated value.
The proportion of SOC0–20 density to SOC0–100 density in greenspace (Figure 3) was equivalent to the value of 0.25 in a greenspace in the Ten-Thousand-Mu Orchard in the Haizhu District of Guangzhou city [65]. Many topsoil layers in the greenspace originated from clean fill soil, plus the younger age of the vegetation and the carbon storage in the upper 20 cm soil was low. The proportion of SOC100–200 density to SOC0–100 density in the greenspace was as high as 0.75, which was slightly higher than the proportion in the woodland. Most of the greenspaces were converted from farmland. Perhaps because the high carbon pool of 100–200 cm in farmland had not been greatly disturbed during the conversion, the greenspace soil inherited the high carbon density at a depth of 100–200 cm (Table 1 and Figure 3). In addition, areas with thick organic-rich clay soil are usually developed as greenspaces rather than buildings because of their low bearing capacity.
4.2. Comparison Analysis of SOC Density of Impervious-Covered Soil
For soils under pavement, the SOC0–100 density estimated from the residual original pervious surface was similar to the value calculated by the measured SOC density of 0–20 cm soil beneath pavement (Table S2 and Section 3). Our estimated SOC0–100 density in soils sealed by pavement was comparable to that in Urumqi, China [19] and in New York City, USA as reported by Raciti et al. [14]; however, it was much lower than that in Leicester, UK [23] and in New York City, USA as reported by Cambou et al. [21] (Table S2). Clay content and climatic differences may account for the carbon density differences among cities [23]. For clean-fill soil or constructional layers (mainly carbon-free materials) under pavement, SOC0–100 density estimation based on the SOC density of residual pervious surface may lead to a large overestimation. For instance, the SOC density estimated based on the measured organic carbon content in clean-fill soil (100 cm thick) in this study was 3.94 kg/m2 for artificially tampered soil and 3.30 kg/m2 for untampered soil (Table S2 and Section 3), which was similar to the estimation by Pouyat et al. in USA [18]. The sampled SOC density of filled soil under pavement of the Seoul residential area in South Korea was as low as 2.7 kg/m2 [42], and the sampled value for constructional layers (mainly gravel, crushed rock and sand) below the road surface in Lahti, Finland, was as low as 1.20 kg/m2 [22].
For the SOC density of the 0–100 cm soil layer under buildings, Pouyat et al. [18] took the estimated SOC density of clean fill soil as a proxy, which was equivalent to the value calculated in this study (Table S2). If we are using the SOC density of the residual original soil layer before urbanization as a proxy, assuming that the decomposition rate of the residual soil was zero, the estimated values of 5.52 kg/m2 (an estimation based on the SOC density of the residual original soil layer) and 5.43 kg/m2 (an estimation based on the averaged SOC content of the bottom soil in original pervious soil layer) were both higher than the SOC density of the clean fill soil (Table S2 and Section 3). Fill soil mainly comes from excavated deep soil, which has low organic matter content; therefore, the SOC density of clean fill soil may be used as an underestimated proxy for the 0–100 cm soil under IS100, especially for buildings without a clean fill soil layer.
For the SOC200–300 density of pavement and IS100 covered soil, we took the SOC200–300 density (Table 1) in farmland as a proxy, which was close to the estimated SOC density of the granitic residual soil (100 cm thickness) (Table S2). The proxy coincided with the measured SOC density of the 0–100 cm fill soil under impervious surface in a Seoul residential area in South Korea [42] (Table S2). Weathered granitic residual soils excavated during the construction of building foundations is commonly used as a kind of high-quality fill soil. This coincidence may support the rationality of the above-mentioned proxy, since most fill soil came from excavated deep soil layers. However, if the organic-rich, oceanic-continental sedimentary clay soil (Table S2) developed beneath pavement and IS100, this proxy may underestimate the SOC200–300 density of pavement and IS100 covered soil.
Topsoil removal, decomposition and leaching of the residual soil layers beneath impervious surface may attribute to the carbon loss from sealed soil [14]. A controlled field study reported that the removal of 0–10 cm soil contributed 57% to the total carbon loss (0–30 cm) [29]. We assumed that the SOC mineralization of the residual soil was zero, which would underestimate the carbon loss. However, SOC decomposition in impervious-covered areas will be slowed because of anoxic conditions [20,29]. The SOC turnover rate varies with the type, degree and extent of sealing [20,23,29]. Evidence has shown that the SOC density decreases from the edge to center in imperviously covered areas [19]. For small patches of impervious surface surrounded by greenspace, soil could still be colonized by vegetation roots and retain the organic carbon turnover rate to some extent, while organic carbon could be more stable in areas with impervious surface largely distributed [20,23]. Large areas of impervious surface continuously distributed in the study area, and the soil was excavated deeper than the organic-rich topsoil for the construction of building foundations. Therefore, the carbon mineralization in residual soil may contribute less to the carbon loss. Thus, the underestimation of carbon loss due to the above-mentioned assumption may be small.
4.3. Impacts of Impervious Surface Expansion on SOC Storage
Our result showed that there was a large amount of organic carbon in impervious-covered areas. SOC stored in sealed soil in the 0–300 cm layer and 100–300 cm layer in our study area was equivalent to 9% and 6% of the 0–100 cm SOC pool in Guangzhou city [66], respectively. If SOC density in building-covered soil were assigned 0 kg/m2 (Table S6, scenario 3), the total SOC pool in the 0–300 cm soil layer would decrease 34% (Table S6, scenario 1) or 42% (Table S6, scenario 2), and the loss of the SOC pool due to impervious surface expansion would increase by 48% or 82%, respectively (Table S6). Therefore, ignoring the SOC pool under IS100 will greatly underestimate the urban carbon pool and then greatly overestimate the negative impact of impervious surface expansion on urban soil storage.
At the residential scale, carbon loss per unit area varied with the coverage of greenspace and pavement, building density and development intensity of underground space. Foundation-excavation-induced SOC loss of IS300 was 1.8 times that of IS100 (Table 2); however, at the residential scale, if the intensity of underground space development is limited within a reasonable range, the SOC loss of IS300 plots can by roughly equivalent to that of IS100 plots (Figure 5, Table S5). Underground parking lots in many high-rise residential districts had extended to the underground spaces covered by greenspace and pavement. According to the urban construction code of the Planting Soil for Greening (CJ/T 340-2011) [64], the thickness of an effective soil layer for tree planting should not be less than 100 cm. Appropriately raising this thickness criterion may increase SOC stock in greenspace. Compared with farmland urbanization, renovating urban village or low-rise building plots into high-rise building plots has potential to substantially reduce SOC loss (Figure 5, Table S5). Adding the increment of vegetation carbon due to the increased greenspace coverage, urban renewal will be more profitable to urban carbon management. Analysis of the total organic carbon loss per unit area in vegetation and soil at the residential scale can further our understanding.
In areas with deep soil layers and intensive utilization of underground space, studies at conventional depths of 0–20 cm or 0–100 cm cannot fully reveal the negative impact of the vertical expansion of impervious surface on SOC storage. The SOC pool estimated in the 0–100 cm soil layer was 73% (scenario 1) or 54% (scenario 2) lower than that in the 0–300 cm soil layer, and the SOC loss of the 0–100 cm layer was 23% (scenario 1) or 47% (scenario 2) lower than that in the 0–300 cm soil layer (Table S6). We used SOC storage in the excavated soil layer as a representation of carbon loss caused by the expansion of impervious surface. However, these removed SOC cannot simply be considered as a carbon source because they were not necessarily mineralized rapidly [29].
The difficulty of sealed soil sampling, the higher heterogeneity and the lack of standardized methods for urban soil sampling are the main barriers to a robust estimation of the urban soil pool and its response to urbanization [21]. If the thickness of the excavated soil layer is included in the soil profile of the building-covered soil (0 kg/m2 is assigned as the SOC density of the excavated soil layer), and the SOC density of the residual pervious soil layer is taken as a proxy for soil under buildings, the great difficulty of deep soil sampling conducted beneath buildings could be avoided. Indeed, soil surveys are the basic method to accurately assess the urban soil carbon pool; however, the method presented here may be used as a last resort.
4.4. Uncertainties of SOC Pool Evaluation
Buried cultural layers may greatly contribute to the urban deep soil carbon pool [42,73]. We neglected carbon pools stored in the buried A horizon and buried sediment from ponds, which underestimated the regional carbon pool. The possibility of buried A horizons in greenspaces and paved ground is relatively high. If there are buried A horizons under all the greenspaces and pavement in the study area, and by assigning the SOC density of the 0–20 cm layer in farmland (the main land use before urbanization) as a proxy for these horizons, then the total SOC pool of these buried layers is 0.82 Tg. Rapid urbanization in Guangzhou city began in the 1990s. From 1990 to 2018, a total of 7.74 km2 of water area (mainly fish ponds and streams) was converted into construction land, according to the dataset provided by the Data Center for Resources and Environmental Sciences, Chinese Academy of Sciences [74]. The SOC density of this sludge in the 0–100 cm layer can reach 19.64 kg/m2 [65]. If we assume that all these converted water areas contain a buried sludge layer (100 cm depth with a SOC density of 19.64 kg/m2), then the SOC pool of this buried sediment is 0.15 Tg. Taken together, the underestimation of SOC stored in buried soil layers may not be larger than 12% of the total carbon pool.
We ignored the SOC losses in deep soil under pavement and greenspace. If we assume that all of the 100–300 cm soil layers under greenspaces and pavement in high-rise building plots have also been removed during the construction of underground parking lots, then the SOC pool loss of IS300 will increase by 0.75 Tg (the SOC density of greenspace and pavement at the 0–100 cm layer is derived from Table 1), which is 9% and 18% of the total SOC pool and SOC pool loss, respectively. In addition, a small number of low-rise building plots also have small underground parking lots. The construction of subways and underground shopping malls also results in a larger amount of soil excavation. However, carbon loss due to these kinds of underground space developments is difficult to estimate due to the inaccessibility of data on the volume of the soil cuts and fills.
5. Conclusions
We estimated the total SOC pool and its response to impervious surface expansion in the 0–300 cm layer in the core area of Guangzhou city. Our results suggest that there was a large amount of SOC in low-rise building- and pavement-covered soils. Deep soil excavation during the vertical expansion of impervious surface can seriously disturb soil carbon sequestration, and the conventional 0–100 cm soil profile cannot fully reveal the negative effect of this vertical expansion on the regional soil carbon storage. For high-rise residential areas, the gains of organic carbon accumulation in more greenspace coverage may be offset by the loss in deep soil excavation for the construction of underground parking lots. However, compared with farmland urbanization, renovating urban village or low-greenspace-coverage low-rise building plots into high-rise building plots can generate lower SOC0–300 loss. Large areas of deep soil excavation and sealing could greatly disturb the capacity of soil to provide supporting, provisioning, regulatory and cultural services. Possible disposals of these excavated soils include discarding, dumping into designated landfill sites and using as backfill soil to foundation ditch, greenspace, ponds, etc. For regional sustainable development, it is necessary for policy-makers to manage the intensity of underground space development and to promote urban greening. It is also very necessary to investigate the disposal method of excavated soil and its corresponding effects on SOC so as to find the proper solution to meet both the requirements of urban construction and soil protection.
There are some uncertainties in SOC estimations because they are based on data compiled from the literature and a series of assumptions. For the inaccessibility of fine resolution images circa 1990 and the impossibility of deep soil sampling in impervious surface area, we used the statistical summary method to evaluate the possible excavation-induced SOC losses caused by existing impervious surface. Soil profiles formed during the construction of building foundation or underground parking lots can be used to investigate the SOC content in deep soil. Models driven by space-time explicit land cover map (fine resolution) and other natural or human-mediated covariates (such as sediment characteristics, disposal method of excavated soil and its corresponding SOC mineralization characteristics, evacuation thickness, etc.) can provide more useful information for urban construction and soil protection at site at the regional scale.
Supplementary Materials
The following are available online at https://0-www-mdpi-com.brum.beds.ac.uk/article/10.3390/su13147901/s1, Section 1 The basis of assuming evacuation thickness as IS20, IS100 and IS300, Section 2 Accuracy assessment of impervious surface map and land use/cover data, Section 3 Calculation method of SOC density in clean fill soil and sealed soil, Figure S1: Framework for land use/cover type interpretation based on Google Earth and Landsat 8 OLI images, Figure S2: Impervious surface fraction of the urban core area of Guangzhou city in 2018, Table S1: Land use/cover classification and its area, Table S2: Comparison of SOC densities and their calculation methods by impervious surface type, Table S3: Parameters for SOC density calculation for impervious-covered soil, Table S4: Profiles of SOC pool distribution by land cover in the urban core area of Guangzhou city, Table S5: SOC storage and SOC losses due to farmland urbanization & urban renovation at the residential scale (0–300 cm), Table S6: Losses of SOC stock due to the imperious surface expansion under different scenarios.
Author Contributions
Conceptualization, J.D. and J.Y.; methodology, J.D. and M.Y.; software, J.D. and M.Y.; validation, J.Y. and M.Y.; investigation, J.D. and M.Y.; writing—original draft preparation, J.D.; writing—review and editing, J.Y. and M.Y.; funding acquisition, J.Y. and M.Y. All authors have read and agreed to the published version of the manuscript.
Funding
This study was supported by the National Science Fund for Distinguished Young Scholars (41825020), the China Postdoctoral Science Foundation (2020M672863) and Guangdong Basic and Applied Research Foundation (2021A1515012147).
Institutional Review Board Statement
Not applicable.
Informed Consent Statement
Not applicable.
Data Availability Statement
The data that support the findings of this study are available from the corresponding author upon request.
Acknowledgments
We thank H. Li for her help with laboratory soil carbon measurements, Z. Wu for his help in the impervious surface extraction and S. Kong, W. Liang and Z. Liang for their help with soil sample.
Conflicts of Interest
The authors declare no conflict of interest.
References
- United Nations. World Urbanization Prospects: The 2018 Revision; United Nations: New York, NY, USA, 2019. [Google Scholar]
- Seto, K.C.; Guneralp, B.; Hutyra, L.R. Global forecasts of urban expansion to 2030 and direct impacts on biodiversity and carbon pools. Proc. Natl. Acad. Sci. USA 2012, 109, 16083–16088. [Google Scholar] [CrossRef] [Green Version]
- Hutyra, L.R.; Duren, R.; Gurney, K.R.; Grimm, N.; Kort, E.A.; Larson, E.; Shrestha, G. Urbanization and the carbon cycle: Current capabilities and research outlook from the natural sciences perspective. Earth’s Future 2014, 2, 473–495. [Google Scholar] [CrossRef] [Green Version]
- Pickett, S.T.; Cadenasso, M.L.; Grove, J.M.; Groffman, P.M.; Band, L.E.; Boone, C.G.; Burch, W.R.; Grimmond, C.S.B.; Hom, J.; Jenkins, J.C.; et al. Beyond urban legends: An emerging framework of urban ecology, as illustrated by the Baltimore Ecosystem Study. Bioscience 2008, 58, 139–150. [Google Scholar] [CrossRef]
- Churkina, G. The role of urbanization in the global carbon cycle. Front. Ecol. Evol. 2016, 3, 1–9. [Google Scholar] [CrossRef] [Green Version]
- Gregg, J.W.; Jones, C.G.; Dawson, T.E. Urbanization effects on tree growth in the vicinity of New York City. Nature 2003, 424, 183–187. [Google Scholar] [CrossRef] [PubMed]
- Kaye, J.P.; Mcculley, R.L.; Burke, I.C. Carbon fluxes, nitrogen cycling, and soil microbial communities in adjacent urban, native and agricultural ecosystems. Glob. Chang. Biol. 2005, 11, 575–587. [Google Scholar] [CrossRef]
- Golubiewski, N.E. Urbanization increases grassland carbon pools: Effects of landscaping in Colorado’s front range. Ecol. Appl. 2006, 16, 555–571. [Google Scholar] [CrossRef]
- Zhao, S.; Liu, S.; Zhou, D. Prevalent vegetation growth enhancement in urban environment. Proc. Natl. Acad. Sci. USA 2016, 113, 6313–6318. [Google Scholar] [CrossRef] [Green Version]
- Pretzsch, H.; Biber, P.; Uhl, E.; Dahlhausen, J.; Schütze, G.; Perkins, D.; Rötzer, T.; Caldentey, J.; Koike, T.; van Con, T.; et al. Climate change accelerates growth of urban trees in metropolises worldwide. Sci. Rep. 2017, 7, 1–10. [Google Scholar] [CrossRef]
- Jia, W.; Zhao, S.; Liu, S. Vegetation growth enhancement in urban environments of the Conterminous United States. Glob. Chang. Biol. 2018, 24, 4084–4094. [Google Scholar] [CrossRef]
- Pouyat, R.V.; Yesilonis, I.D.; Golubiewski, N.E. A comparison of soil organic carbon stocks between residential turf grass and native soil. Urban Ecosyst. 2009, 12, 45–62. [Google Scholar] [CrossRef]
- Churkina, G.; Brown, D.G.; Keoleian, G. Carbon stored in human settlements: The conterminous United States. Glob. Chang. Biol. 2010, 16, 135–143. [Google Scholar] [CrossRef] [Green Version]
- Raciti, S.M.; Hutyra, L.R.; Finzi, A.C. Depleted soil carbon and nitrogen pools beneath impervious surfaces. Environ. Pollut. 2012, 164, 248–251. [Google Scholar] [CrossRef]
- Scalenghe, R.; Marsan, F.A. The anthropogenic sealing of soils in urban areas. Landsc. Urban Plan. 2009, 90, 1–10. [Google Scholar] [CrossRef]
- Kuang, W.; Liu, J.; Zhang, Z.; Lu, D.; Xiang, B. Spatiotemporal dynamics of impervious surface areas across China during the early 21st century. Chin. Sci. Bull. 2013, 58, 1691–1701. [Google Scholar] [CrossRef] [Green Version]
- Fuller, R.A.; Gaston, K.J. The scaling of green space coverage in European cities. Biol. Lett. 2009, 5, 352–355. [Google Scholar] [CrossRef] [PubMed] [Green Version]
- Pouyat, R.V.; Yesilonis, I.D.; Nowak, D.J. Carbon storage by urban soils in the United States. J. Environ. Qual. 2006, 35, 1566–1575. [Google Scholar] [CrossRef] [Green Version]
- Yan, Y.; Kuang, W.; Zhang, C.; Chen, C. Impacts of impervious surface expansion on soil organic carbon—A spatially explicit study. Sci. Rep. 2015, 5, 1–9. [Google Scholar] [CrossRef] [PubMed] [Green Version]
- Wei, Z.; Wu, S.; Yan, X.; Zhou, S. Density and stability of soil organic carbon beneath impervious surfaces in urban areas. PLoS ONE 2014, 9, 1–7. [Google Scholar] [CrossRef] [Green Version]
- Cambou, A.; Shaw, R.K.; Huot, H.; Vidal-Beaudet, L.; Hunault, G.; Cannavo, P.; Nold, F.; Schwartz, C. Estimation of soil organic carbon stocks of two cities, New York City and Paris. Sci. Total Environ. 2018, 644, 452–464. [Google Scholar] [CrossRef] [Green Version]
- Lu, C.; Kotze, D.J.; Setl, H.M. Soil sealing causes substantial losses in C and N storage in urban soils under cool climate. Sci. Total Environ. 2020, 725, 138369. [Google Scholar] [CrossRef]
- Edmondson, J.L.; Davies, Z.G.; Mchugh, N.; Gaston, K.J.; Leake, J.R. Organic carbon hidden in urban ecosystems. Sci. Rep. 2012, 2, 1–7. [Google Scholar] [CrossRef]
- Tian, H.; Melillo, J.; Lu, C.; Kicklighter, D.; Liu, M.; Ren, W.; Xu, X.; Chen, G.; Zhang, C.; Pan, S.; et al. China’s terrestrial carbon balance: Contributions from multiple global change factors. Glob. Biogeochem. Cycles 2011, 25, 1–16. [Google Scholar] [CrossRef]
- Zhang, C.; Tian, H.; Chen, G.; Chappelka, A.; Xu, X.; Ren, W.; Hui, D.; Liu, M.; Lu, C.; Pan, S.; et al. Impacts of urbanization on carbon balance in terrestrial ecosystems of the Southern United States. Environ. Pollut. 2012, 164, 89–101. [Google Scholar] [CrossRef]
- Jiang, W.; Deng, Y.; Tang, Z.; Lei, X.; Chen, Z. Modelling the potential impacts of urban ecosystem changes on carbon storage under different scenarios by linking the CLUE-S and the InVEST models. Ecol. Model. 2016, 345, 30–40. [Google Scholar] [CrossRef]
- Lyu, R.; Mi, L.; Zhang, J.; Xu, M. Modeling the effects of urban expansion on regional carbon storage by coupling SLEUTH model and InVEST model. Ecol. Res. 2019, 34, 380–393. [Google Scholar] [CrossRef]
- Heuvelink, G.B.; Angelini, M.E.; Poggio, L.; Bai, Z.; Batjes, N.H.; Bosch, R.; Bossio, D.; Estella, S.; Lehmann, J.; Olmedo, G.; et al. Machine learning in space and time for modelling soil organic carbon change. Eur. J. Soil Sci. 2021, 72, 1607–1623. [Google Scholar] [CrossRef]
- Majidzadeh, H.; Graeme, L.B.; Robert, P.; Robin, G. Soil Carbon and Nitrogen Dynamics beneath Impervious Surfaces. Soil Sci. Soc. Am. J. 2018, 82, 1–8. [Google Scholar] [CrossRef]
- Ministry of Housing and Urban-Rural Development of the People’s Republic of China. Design Code for Residential Buildings (GB 50096-2011); China Building Industry Press: Beijing, China, 2011; pp. 18–19.
- Bobylev, N. Mainstreaming sustainable development into a city’s Master plan: A case of Urban Underground Space use. Land Use Policy 2009, 26, 1128–1137. [Google Scholar] [CrossRef]
- Cui, J.; Broere, W.; Lin, D. Underground space utilization for urban renewal. Tunn. Undergr. Space Technol. 2021, 108, 1–10. [Google Scholar] [CrossRef]
- Jobbágy, E.G.; Jackson, R.B. The vertical distribution of soil organic carbon and its relation to climate and vegetation. Ecol. Appl. 2000, 10, 423–436. [Google Scholar] [CrossRef]
- Zhao, S.; Zhu, C.; Zhou, D.; Huang, D.; Jeremy, W.; Ben, B.L. Organic carbon storage in China’s urban areas. PLoS ONE 2013, 8, 1–8. [Google Scholar] [CrossRef] [Green Version]
- Chen, W.; Chi, G.; Li, J. The spatial association of ecosystem services with land use and land cover change at the county level in China, 1995–2015. Sci. Total Environ. 2019, 669, 459–470. [Google Scholar] [CrossRef] [PubMed]
- Song, W.; Deng, X. Land-use/land-cover change and ecosystem service provision in China. Sci. Total Environ. 2017, 576, 705–719. [Google Scholar] [CrossRef] [PubMed]
- Statistics Bureau of Guangzhou City. Guangzhou Statistical Yearbook of 2020 and 2000; China Statistics Press: Beijing, China, 2021; Available online: http://112.94.72.17/portal/queryInfo/statisticsYearbook/index (accessed on 7 February 2021).
- Ministry of Housing and Urban-Rural Development of the People’s Republic of China. Code for Design of Building Foundation GB 50007-2002; China Building Industry Press: Beijing, China, 2002; pp. 17–35.
- Fan, F.; Fan, W.; Weng, Q. Improving urban impervious surface mapping by linear spectral mixture analysis and using spectral indices. Can. J Remote Sens. 2015, 41, 577–586. [Google Scholar] [CrossRef]
- Zhu, X. Temporal and spatial variation of organic carbon and soil carbon storage in the Pearl River Delta Economic Zone. Chin. J. Geol. Miner. Resour. South China 2014, 30, 176–185. [Google Scholar]
- Transport Engineering Center of Ministry of Housing and Urban-Rural Development of the People’s Republic of China; China Academy of Urban Planning and design; Beijing Siwei Tuxin Science and Technology Co., Ltd. Annual Report on Road Network Density in Major Chinese Cities (2020); China Academy of Urban Planning and Design: Beijing, China, 2020.
- Bae, J.; Ryu, Y. High soil organic carbon stocks under impervious surfaces contributed by urban deep cultural layers. Landsc. Urban Plan. 2020, 204, 103953. [Google Scholar] [CrossRef]
- Soil Census Office of Guangdong Province. Soil Species Records of Guangdong Province; Science Press: Beijing, China, 1996; pp. 85–88, 91–94, 117–123, 393–396, 409–410, 413–414. [Google Scholar]
- Soil Census Office of Guangdong Province. Soils of Guangdong Province; Science Press: Beijing, China, 1996; pp. 142–144, 147–152. [Google Scholar]
- Wang, Q. Study on the structure and composition of granite residual soil in the Eastern China. Chin. J. Changchun Univ. Earth Sci. 1991, 21, 70–81. [Google Scholar]
- Ding, L.; Jiang, Y.; Chen, D.; Zhang, X. Analysis of mechanical properties and correlation of soft soil developed in Guangzhou City. Chin. J. Railw. Eng. 2011, 75–78. [Google Scholar] [CrossRef]
- Nelson, D.W.; Sommers, L.E. Total Carbon, Organic Carbon, and Organic Matter. In Methods of Soil Analysis; Sparks, D., Page, A., Helmke, P., Loeppert, R., Soltanpour, P.N., Tabatabai, M.A., Johnston, C.T., Sumner, M.E., Eds.; Wiley: Hoboken, NJ, USA, 1996. [Google Scholar] [CrossRef]
- Ministry of Housing and Urban-Rural Development of the People’s Republic of China. Code for Design of Urban Road Engineering CJJ37-2012; China Building Industry Press: Beijing, China, 2012; pp. 45–46.
- Pan, X.; Huan, Q. Experimental study on cement modified red clay compaction. Chin. J. Sci. Techn. Vis. 2018, 4–85. [Google Scholar] [CrossRef]
- Zhou, J. Modification and modification mechanism of red clay. Master’s Thesis, Chongqing University, Chongqing, China, May 2014. [Google Scholar]
- Li, H.; Yu, G.; Liang, X. Study on variation of maximum dry density with time for modified mild clay. Chin. J. Subgrade Eng. 2007, 95–97. [Google Scholar] [CrossRef]
- Liu, X. Research on the Application of Construction Waste Regeneration in Highway Subgrade. Chin. J. Highw. Eng. 2019, 44, 208–212. [Google Scholar]
- Zhang, Y.; Xu, Q.; Peng, D.; Zhao, K.; Guo, C. An experimental study of the permeability of the catastrophic landslide at the Shenzhen Landfill. Chin. J. Hydrogeol. Eng. Geol. 2017, 44, 149. [Google Scholar]
- Ministry of Housing and Urban-Rural Development of the People’s Republic of China. Technical Code for Ground Treatment of Buildings JGJ79-2012; China Building Industry Press: Beijing, China, 2012; p. 13.
- Liang, S.; Zhou, S.; Zhang, L.; Wang, M. Statistical analysis of physical and mechanical indexes of granite residual soil in eastern Guangzhou. Chin. J. Guangdong Uni. Tech. 2015, 32, 49. [Google Scholar]
- USDA–NRCS. Soil Survey Laboratory Information Manual, Version 2.0; Soil Survey Investigations Report No. 45; U.S. Government Printer: Washington, DC, USA, 2011; pp. 235–253.
- Cao, M. Comparative analysis of granite residual soil developed in Yan Mountains period and sinian system. Chin. J. Sichuan Cem. 2016, 53–55. [Google Scholar] [CrossRef]
- Xiang, Y. Statistical Analysis of physical and mechanical properties of granite residual soil and weathered layer in Luogang station of Guangzhou Metro Line 6. Chin. J. Constr. Sci. Technol. 2012, 92–93. [Google Scholar] [CrossRef]
- Huang, H. Engineering geological characteristics of granite residual soil and application in Panyu District, Guangdong Province. Chin. J. Hydrogeol. Eng. Geol. 2000, 38–39. [Google Scholar] [CrossRef]
- Zeng, F. The engineering geological feature of granite residual soil in Guangdong Shiqiao Region. Chin. J. Soil Eng. Found. 1993, 7, 29–34. [Google Scholar]
- Wu, F. Study of engineering geological characteristics of granitic rocks weathered in Guangzhou. Master’s Thesis, Guangzhou University, Guangzhou, China, 30 May 2013. [Google Scholar]
- Technical Regulations on Urban and Rural Planning of Guangzhou City (Government Decree of the People’s Government of Guangzhou Municipality [2015] No. 133). Available online: http://www.gz.gov.cn/zwgk/fggw/zfgz/content/mpost_4756949.html (accessed on 4 November 2015).
- Ten Years of Urban Renewal in Guangzhou: From Single Goal to Multiple Goals. 2020. Available online: https://www.xkb.com.cn/article_634086 (accessed on 27 November 2020).
- Ministry of Housing and Urban-Rural Development of the People’s Republic of China. Planting Soil for Greening CJ/T 340-2011; Standards Press of China: Beijing, China, 2011; p. 4.
- Zhu, Y.; Luo, Q.; Chen, Y.; Huang, Y.; Guan, D. Carbon density and distribution of main ecosystems in Ten-Thousand-Mu Orchard at Haizhu District, Guangzhou. Chin. J. Ecol. 2016, 35, 164–169. [Google Scholar] [CrossRef]
- Wu, Z.; Huang, Y.; Jiang, C. Soil and vegetation carbon storage and its spatial pattern analysis of Guangzhou City, China. J. Guangzhou Univ. 2014, 13, 73–79. [Google Scholar]
- Sulman, B.N.; Harden, J.; He, Y.; Treat, C.; Nave, L.E. Land use and land cover affect the depth distribution of soil carbon: Insights from a large database of soil profiles. Front. Environ. Sci. 2020, 8, 1–12. [Google Scholar] [CrossRef]
- D’Elia, A.H.; Liles, G.C.; Viers, J.H.; Smart, D.R. Deep carbon storage potential of buried floodplain soils. Sci. Rep. 2017, 7, 1–7. [Google Scholar] [CrossRef] [Green Version]
- Steger, K.; Fiener, P.; Marvin-DiPasquale, M.; Viers, J.H.; Smart, D.R. Human-induced and natural carbon storage in floodplains of the Central Valley of California. Sci. Total Environ. 2019, 651, 851–858. [Google Scholar] [CrossRef]
- Bi, L.; Chen, X.; Lu, B. Distribution features of soft soil and the prediction of seismic subsidence in Guangzhou. Chin. J. China Earthq. Eng. J. 2018, 40, 1026–1033. [Google Scholar]
- Guo, L.B.; Gifford, R.M. Soil carbon stocks and land use change: A meta analysis. Glob. Chang. Biol. 2010, 8, 345–360. [Google Scholar] [CrossRef]
- Zhang, X.; Xu, Z.; Zeng, F.; Hu, X.; Han, Q. Carbon density distribution and storage dynamics of forest ecosystem in Pearl River Delta of low subtropical China. China Environ. Sci. 2011, 31, 69–77. [Google Scholar] [CrossRef]
- Vasenev, V.; Yakov, K. Urban soils as hot spots of anthropogenic carbon accumulation: Review of stocks, mechanisms and driving factors. Land Degrad. Dev. 2018, 29, 1607–1622. [Google Scholar] [CrossRef]
- Xu, X.L.; Liu, J.Y.; Zhang, S.W.; Li, R.D.; Yan, C.Z.; Wu, S.X. China’s Multi-Period Land Use/Cover Remote Sensing Monitoring Dataset (CNLUCC); Data Registration and Publishing System of the Resource and Environmental Science Data Center of the Chinese Academy of Sciences: Beijing, China, 2018. [Google Scholar] [CrossRef]
Figure 1.
Location of Guangzhou city and its land use/cover in the urban core area in 2019.

Figure 2.
The summary of the methodology and land use/cover characteristics of the study area. Numbers in the round brackets represent the coverage proportion of green space, building and pavement in each typical residential land parcel. The GS, PA, FS, UPL, BF and RS represent green space, pavement, fill soils, underground parking lots, building foundations and residual soils, respectively. IS20, IS100 and IS300 represent pavement with a soil evacuation thickness of around 20 cm, buildings with soil evacuation thickness ≤ 100 cm and buildings with evacuation thickness ≥ 300 cm, respectively. (1) and (2) represent renovating urban village plots into high-rise building plots Ι and Π, respectively; (3) and (4) represent renovating low-rise building plots into high-rise building plots Ι and Π, respectively. Areas of high-rise building land parcels, low-rise building land parcels and urban village plots in 2019 were 121.41, 364.97 and 89.53 km2, respectively, and IS20, IS100 and IS300 totally covered 73% of the study area (Table S1).

Figure 3.
Proportional distributions of SOC density by land cover.

Figure 4.
Profile distributions of SOC pools by land cover.

Figure 5.
SOC storage (black columns) and SOC loss of farmland urbanization and urban renovation (white columns) at the residential scale; Ⅰ and Ⅱ represent the coverage fraction of underground parking lots (30% and 100%, respectively). The detailed estimation method is presented in Table S5.
Figure 5.
SOC storage (black columns) and SOC loss of farmland urbanization and urban renovation (white columns) at the residential scale; Ⅰ and Ⅱ represent the coverage fraction of underground parking lots (30% and 100%, respectively). The detailed estimation method is presented in Table S5.


Table 1.
Soil organic carbon density by land cover.
| Land Use/Cover | Area (km2) | SOC Density (kg/m2) | ||||
|---|---|---|---|---|---|---|
| 0–20 cm | 20–100 cm | 100–200 cm | 200–300 cm | 0–300 cm | ||
| Farmland | 24.97 | 2.49 | 6.97 | 6.88 | 2.70 | 19.04 |
| Woodland | 59.02 | 2.22 | 5.82 | 5.38 | 3.90 | 17.32 |
| Greenspace | 67.16 | 2.13 | 6.14 | 6.18 | 2.70 | 17.15 |
| IS20 | 261.46 | 0 | 5.82 | 5.52 | 2.70 | 14.04 |
| IS100 | 241.90 | 0 | 0 | 5.52 | 2.70 | 8.22 |
| IS300 | 36.51 | 0 | 0 | 0.00 | 0.00 | 0.00 |
Table 2.
The SOC loss at a depth of 0–300 cm caused by the expansion of impervious surface.
| Impervious Surface Type | SOC Density Loss kg/m2 | SOC Pool Loss Tg | Fraction of SOC Pool Loss % | Impervious Surface Coverage % |
|---|---|---|---|---|
| IS300 | 18.18 | 0.66 | 16 | 5 |
| IS100 | 9.96 | 2.41 | 58 | 33 |
| IS20 | 4.14 | 1.08 | 26 | 35 |
| Total | 7.67 * | 4.16 | 100 | 73 |
Note: * The area-weighted loss of SOC density due to the construction of the IS20, IS100 and IS300.
Publisher’s Note: MDPI stays neutral with regard to jurisdictional claims in published maps and institutional affiliations. |
© 2021 by the authors. Licensee MDPI, Basel, Switzerland. This article is an open access article distributed under the terms and conditions of the Creative Commons Attribution (CC BY) license (https://creativecommons.org/licenses/by/4.0/).
Share and Cite
MDPI and ACS Style
Du, J.; Yu, M.; Yan, J. The Impact of Impervious Surface Expansion on Soil Organic Carbon: A Case Study of 0–300 cm Soil Layer in Guangzhou City. Sustainability 2021, 13, 7901. https://0-doi-org.brum.beds.ac.uk/10.3390/su13147901
AMA Style
Du J, Yu M, Yan J. The Impact of Impervious Surface Expansion on Soil Organic Carbon: A Case Study of 0–300 cm Soil Layer in Guangzhou City. Sustainability. 2021; 13(14):7901. https://0-doi-org.brum.beds.ac.uk/10.3390/su13147901
Chicago/Turabian StyleDu, Jifeng, Mengxiao Yu, and Junhua Yan. 2021. "The Impact of Impervious Surface Expansion on Soil Organic Carbon: A Case Study of 0–300 cm Soil Layer in Guangzhou City" Sustainability 13, no. 14: 7901. https://0-doi-org.brum.beds.ac.uk/10.3390/su13147901
Note that from the first issue of 2016, this journal uses article numbers instead of page numbers. See further details here.