
Risk, Recessions, and Resilience: Towards Sustainable Local Labor Markets through Employment Portfolio Analysis


1
Department of Economics, Colorado State University, Fort Collins, CO 80523, USA
2
Regional Economic Development Institute (REDI@CSU), Colorado State University, Fort Collins, CO 80523, USA
*
Author to whom correspondence should be addressed.
Sustainability 2021, 13(14), 7926; https://0-doi-org.brum.beds.ac.uk/10.3390/su13147926
Submission received: 31 May 2021
/
Revised: 9 July 2021
/
Accepted: 9 July 2021
/
Published: 15 July 2021
(This article belongs to the Special Issue State of the Art and Future Perspectives in Smart and Sustainable Urban Development)
Abstract
:This paper explores the role of local labor market dynamics on the survival of new businesses. The characteristics of the local labor market are likely to influence the survival of new businesses, the level of entrepreneurship, and the resilience of the regional economy. We apply portfolio theory to evaluate employment-based and income-based measures of risk-and-return trade-offs in local labor markets on new business survival in the United States. Our results show that volatility in local labor markets has a positive impact on new business survival, especially in Metropolitan Statistical Areas. The results are robust across different timeframes, including during economic downturns, thus highlighting the contribution of new businesses in developing the resilience of the local economy, and further promoting sustainable regional economic development.
1. Introduction
Factors that impact the survival of a firm can be broadly categorized into firm-specific, industry-specific, and region-specific. Among region-specific factors, a significant factor is the local labor market environment. The local labor market’s characteristics are likely to significantly impact the level of entrepreneurship and the success achieved by enterprises in that region.
Recent empirical research has identified the employment portfolio of a local market as a critical determinant influencing entrepreneurship in the region [1,2,3,4]. Borrowing from portfolio theory [5] in financial economics, the employment portfolio of the local labor market is now being used to evaluate the prospects of a business enterprise in that location. Portfolio theory helps identify the frontier whereat a combination of financial instruments will yield the optimal return, given their risk profile. Similarly, empirical investigation of the employment portfolio in a region has been shown to create a U-shaped frontier in the local labor market, given the risk–return profile in that market. The return in the labor market, on the horizontal axis, represents the growth in jobs, and the risk, on the vertical axis, represents the volatility in the growth in jobs in that local market.
The trade-off between employment-based risk and return measures in the local labor market is crucial for prospective entrepreneurs to estimate the likelihood of survival of their establishment in the future. Considering the interrelationship between risk and return in a local labor market, we hypothesize that this interrelationship, captured by the employment portfolio, can impact the survival of a new business operating in that region. We are interested in investigating whether the employment portfolio of a region influences the likelihood of survival of a new business in the next period. Is there any heterogeneity in the impact of employment portfolio on new business survival in metro and non-metro regions? How significant is this impact on new business survival in different regions?
Answers to these questions are likely to help design customized policies that promote and support existing and new business establishments in the region. This may also help local governments efficiently allocate financial resources for local economic growth rather than spending on blanket programs.
There is a gap in the existing literature highlighting the impact of local labor market dynamics on new business survival. This paper attempts to fill that gap. Notable investigations in this domain have focused on the role of human capital in the workforce [6], the impact of employment density on labor productivity [7], and the education level of the employer [8]. In turn, we measure the impact of changes in the local labor market environment on new business survival in three steps. First, we begin by identifying the existence of an optimal frontier, represented by risk and return trade-off in the local labor market (at county-level), by using the stochastic frontier estimation technique [1,4]. Second, we investigate the impacts of changes in the employment portfolios in the counties on the new business survival rate in 2010. These business establishments were born in 2005–2006. We find that the local employment-based measures significantly impact the survival of new businesses operating in metro counties. We then use income-based measures to validate our results and find that the latter also have a consistent and significant influence on new businesses, again on those operating in metro counties. Third, we narrow our sample to new businesses operating in Metropolitan Statistical Areas (MSAs) only, using both employment-based and income-based measures, testing the hypothesized relationship with new business survival rates in 2010. We also replicate the third step to investigate the impact on the new business survival rate in 2005. This carries dual benefits: one, it tests for the robustness of our initial findings, and second, it tests for any effects of exogenous shocks on the local labor market environment and their consequent impact on new business survival. The 2001 recession and the Great Recession are two major economic shocks that happened during the study period. By replicating the empirical exercise in different periods, we wish to isolate and study each exogenous event’s impact on local labor market dynamics and subsequently on new business survival.
We find that volatility in the local labor market consistently impacts the likelihood of survival of new businesses in MSAs. We also find that this impact is stronger during recessions. Our results suggest that the continued survival of new businesses despite volatility in local labor markets contributes to local economic growth, and to the resilience of the local economy during economic downturns. We acknowledge the clear limitations of this research given the probability of reverse causality/endogeneity, and suggest trajectories for future work given these likely inter-relationships.
Our endeavor also addresses sustainability; in this case in the form of sustainable economic systems, identified through the viability and opportunities created by the local labor market. We find that over the long-term, the dynamics of local labor markets likely influence the behavior of employees, which further enhances the resilience of new businesses. This resilience displayed by new businesses, especially during recessions, promotes sustainable local economic development.
The following sections exhibit the details of this research endeavor. Section 2 reviews the new firm survival literature, the literature on the application of modern portfolio theory in regional economics, and how the application of this approach helps in identifying the impacts of changes in local labor markets on new business survival. Section 3 highlights the methodology and data used for the research. It presents the theoretical framework and the empirical model used in this attempt. The results of this exercise are discussed in Section 4. The final section concludes this paper, highlighting the impact of local labor market dynamics on new business survival, and discusses potential applications to policies aimed at local economic development.
2. Literature Review, Research Niche, and Theoretical Structure
Empirical research into the role of regional factors in firm survival has broadly focused on the impact of agglomeration, scale economies, and institutional legitimacy [6,9,10,11].
Investigations into the impact of local labor on firm survival have concentrated primarily on the availability and quality of human capital. In this regard, most of the research focuses on the role of entrepreneur-centric human capital in determining firm survival. The level of human capital possessed by the entrepreneur is typically measured in terms of entrepreneurs’ personal characteristics. Ref. [6] cites the role of specific characteristics, namely, the level of education [12], entrepreneur’s experience in similar roles [13,14,15,16], psychological factors such as motivation and ambition [17], preparation, and time spent on the operations [16]. Interestingly, another strand of related literature found no evidence between such personal characteristics and business survival [18,19].
Ref. [6] found a positive relationship between regional human capital and new firm survival in the growth period (1993–1995), and a not so strong relationship during the recession period (1990–1992) when studying the labor market areas (LMAs) in the U.S. They found that “high school dropout rates are negatively associated with firm survival rate for both periods, and college-degree-share is positively related to firm survival in the growth period.” Ref. [7] investigated the variation in labor productivity across states in the U.S. They found that doubling employment density in a county results in a 6% increase in average labor productivity. Ref. [8] found that in Finland, the likelihood of survival of firms established by highly educated employers is greater in the recessionary period than in the growth period. They conclude that the general labor market conditions determine the likelihood of firms surviving in the market.
2.1. Theoretical Structure
Modern portfolio theory, espoused by [5], is used in identifying the unique investment portfolio(s) that yield the highest return for the level of risk tolerance of the investor. The portfolio(s) that meet the risk–return trade-off lie on the border, which is commonly referred as the efficient frontier. Since it was first applied by [20] to find the efficient trade-off between incentives to offer and the desired industrial mix in the region, regional economists have increasingly used portfolio theory to capture the risk–return trade-off with relevant variables of interest. Ref. [3] applied portfolio theory and found that luring businesses by offering economic incentives led to increased volatility in growth rates in metropolitan areas. Ref. [1] found an efficient frontier when mapping economic growth and instability for states in the United States. The paper suggests that economic diversity and instability appear to be negatively correlated.
Ref. [4] pioneered the application of portfolio theory to investigate the impacts of local employment portfolios on the entrepreneurship levels. Focusing on commuting zones and counties, they found that entrepreneurship may be an attractive avenue in areas having high employment risks and low returns. They suggest that self-employment can be an attractive alternative income mechanism to wage and salary jobs in such regional units.
The closure of a business establishment results not only in the loss of jobs or potential losses of tax revenue for the local authorities, but also in a unique externality. Business births and deaths represent business dynamism in the region, which potential entrepreneurs closely watch. Low survival rates of new businesses may have a snowball effect in discouraging potential entrepreneurs from investing in the region. The information spillover from local business birth and death rates is found to have a significant impact on subsequent entrepreneurship and job creation [21].
The number of jobs available, the growth in new jobs, and the risks associated with job growth are some of the factors that define the dynamic character of the local labor market. The interaction of these factors in the light of macroeconomic conditions and the unique economic–cultural milieu of the regional unit create opportunities (expected returns) and threats (risks) for the workforce in the region. The impact of exogenous shocks in the local labor market influences the risk–return trade-off of the worker, which affects their economic behavior.
We attempt to capture these dynamics in the local labor market through the representative labor market portfolio. The portfolio approach helps one to analyze the interplay of numerous idiosyncratic but significant labor market undercurrents, in the context of the prevalent macroeconomic environment, when evaluating the likely impact on the survival of new businesses in the regional unit.
We begin by selecting the county as the regional unit of analysis. The resource base and socio-economic environment unique to the county affect a business’s growth; hence, the regional unit or location is vital in new business survival.
2.2. How Does Survival of New Businesses Determine the Resilience of the Region?
Recent empirical investigations have highlighted the contribution made by entrepreneurs and local businesses to the recovery of the local economy from exogenous shocks [22,23,24]. Entrepreneurship provides local policymakers with an appropriate tool to remove path dependency and the threat of lock-in in the local economy [25]. In the aftermath of the Great Recession, local authorities in many states in the U.S. initiated policy measures to promote entrepreneurship and business ventures in sunrise sectors, with the motivation of stimulating economic growth and reducing dependency on historically dominant sectors.
New businesses provide diversity to the local economy [26]. Given their small size, for all the challenges borne by new businesses, they respond faster to external shocks than their larger counterparts. Not only are they able to adapt to the changes, but they are also able to innovate to respond to the repercussions of the shock [23].
We find that risk in local labor markets helps in the survival of new businesses in metro counties and MSAs. Risk manifested through employment-based and income-based portfolios increases the likelihood of survival of new businesses. This impact has been observed to be stronger during the recent recessions in these regional units.
Economists are increasingly using the lens of resilience to investigate the contribution of new businesses and young establishments when evaluating the responses of regional economies to recent recessions. This ability to absorb, endure and recover from an exogenous shock is commonly referred to as resilience.
Resilience is commonly defined from engineering, ecological, and adaptive perspectives. From an engineering perspective, resilience refers to the displacement of an entity from its equilibrium, caused by an exogenous shock, and the subsequent return to the original equilibrium [27,28]. From an ecological perspective, resilience refers to a subsequent shift towards a new equilibrium, in response to displacement caused by the exogenous shock [27,29]. From an adaptive perspective, resilience follows an evolutionary approach, whereby an entity evolves over time to create new sustainable paths by adapting to changes occurring in its environment [30,31].
In this paper, we employ the definition of resilience from an ecological perspective. We find that the economic downturn highlights the undercurrents operating in the local labor market. The economic agents absorb and endure the economic shock, and eventually the economy recovers to achieve a new steady state after a period of time. This process of absorbing, enduring, and recovering over a period of time to reach a new steady state is significantly determined by the dynamics prevalent in the local labor market besides the existing stock of economic resources, local amenities, and level of aid received.
The ability to survive in the face of adverse economic downturns also concerns the human element, as the competencies and skills of both employees and the entrepreneur are entwined with the business. The success and failure of a business are determined, to a large extent, by the fortitude, perseverance, patience, and ingenuity displayed by the employees during challenging times. The resilience displayed by new businesses is hence related to the resilience displayed by the employees, which further determines the resilience of the community.
2.3. Why Does Risk in Labor Markets Affect Workers?
We identify risk through both employment-based and income-based measures. Employment-based risk (wage and salary employment risk, WSE-Risk) represents the volatility in the growth of employment opportunities in a local county. Firms often freeze hiring or lay off workers in response to economic downturns. WSE-Risk is likely to have a profound impact in a recession. Even after the recession, recovery in local employment lags behind recovery observed in other economic indicators. Consequently, the negative impact, economic and social, is more painful and lasts longer for the unemployed.
On the other hand, income-based risk (wage and salary income risk, WSI-Risk) represents the volatility in growth in income from wages and salaries. Wage income makes up for a significant proportion of the total income of the bottom 20 percentile of households [32]. Volatility in wage income thus has a substantial impact on the living standards of the majority of households. Empirical research highlights the divergence between growth in wages and growth in productivity. From 1973 to 2017, net productivity increased by 77%, while real wages increased by only 12.4% [33,34]. A closer look at the wage growth across different segments of labor force shows that the hourly wage of the middle-wage worker grew only 6% during 1979–2013. Wages were more or less stagnant during the 1980s, 1990s, and 2000s, except for a short period during late 1990s when wages grew due to a tight labor market [32]. The rise in unemployment, observed during recessions, also leads to the suppression of wages.
The overall trend indicates stagnation in wages, which translates into higher income risk for an average worker. The divergence between wage and productivity growth, and near stagnant wage growth, have been identified as major contributors to increases in income inequality in the U.S. With a higher cost of living and divergence in household income, the impact of WSI-Risk is likely to manifest more strongly in urban areas than in rural areas.
A common feature of recession is increased turmoil in the local labor market. This turmoil is apparent through the increased number of mass layoffs, significant and rapid increases in unemployment, a decline in new jobs, increased furloughs, reduced work hours, stagnation, or falls in wage and salary income for the employed.
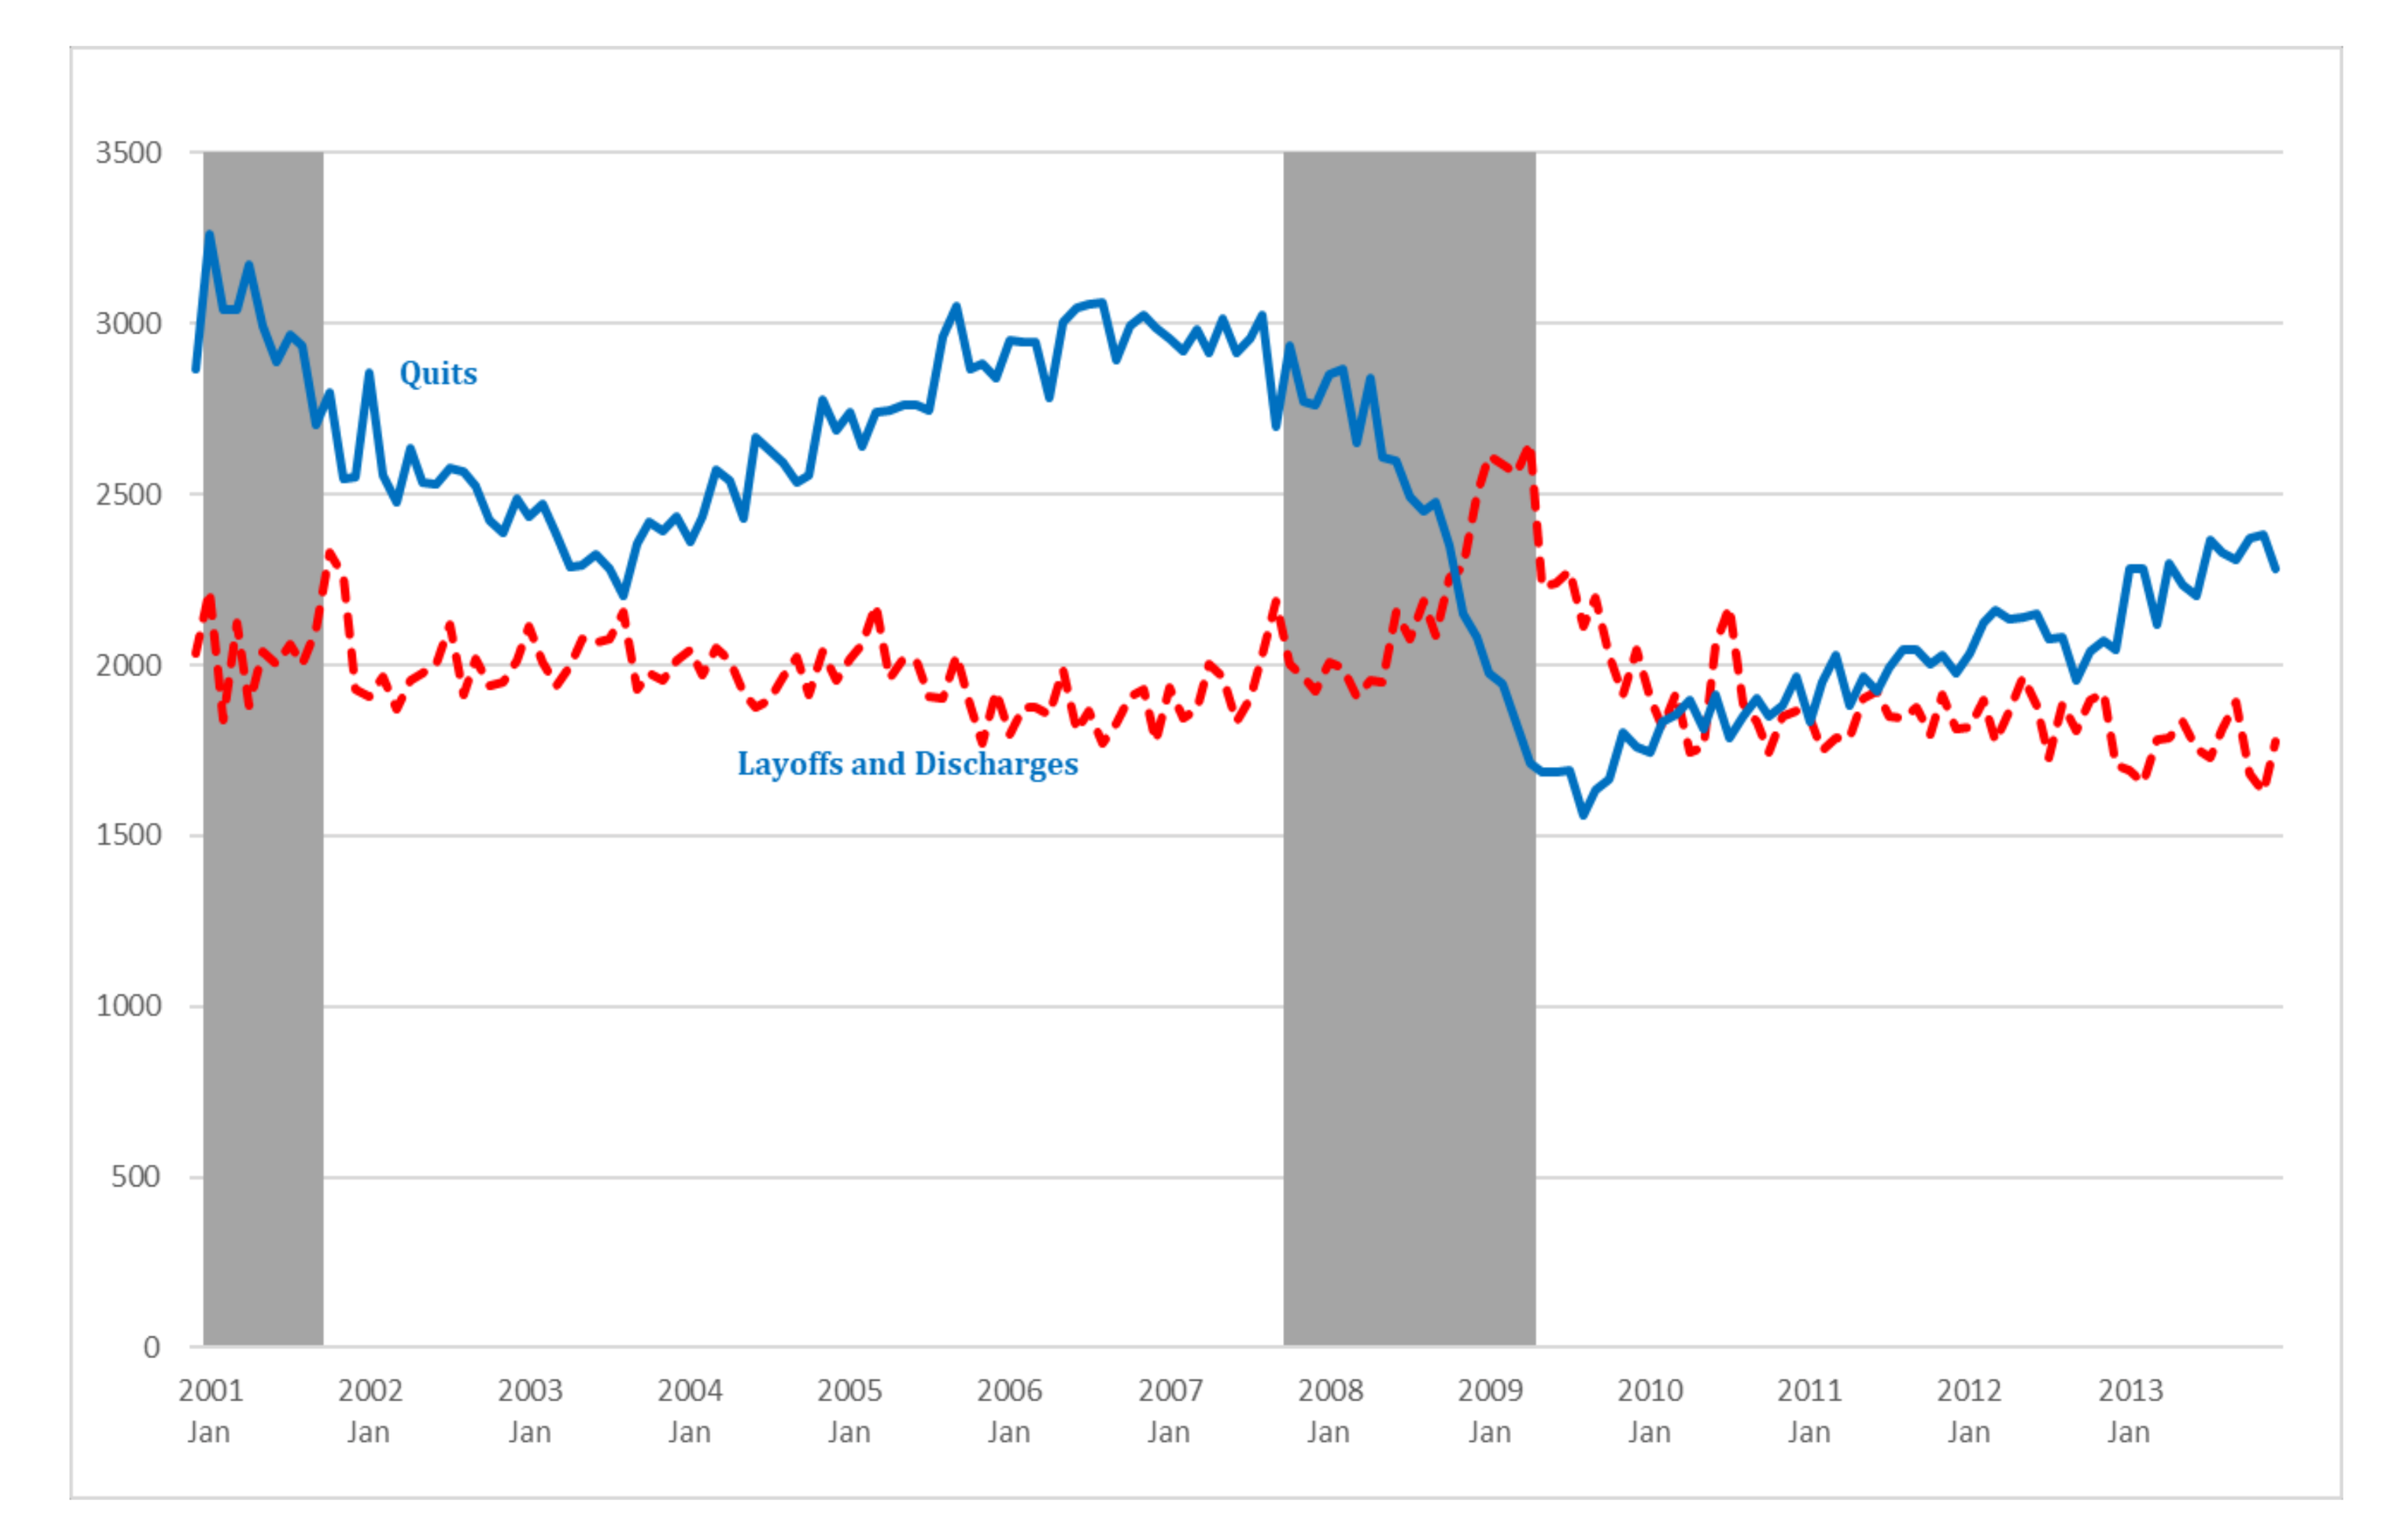
The Bureau of Labor Statistics (BLS) in the March 2013 survey on Jobs Openings and Labor Turnover highlighted that the number of job openings in the private sector fell sharply, from 3.8 million in December 2007 to a low of 1.9 million in July 2009. During the same period, the number of quits (voluntary separation initiated by the employee) also declined from 2.7 million in December 2007 to 1.5 million in September 2009. Since the end of the recession, the numbers of both job openings and quits increased by 81% and 34%, respectively, in March 2013.
The increased volatility in the local labor market, demonstrated through a sharp decline in job openings and new hiring, is likely to discourage rational employees from taking the risk of quitting their current employment. Besides the risk of loss of income from quitting, an experienced employee also faces the risk of loss of skills and becoming less competitive in the job market. Ref. [35] found that such workers face a higher risk of skill loss, and thus accept a lower wage in exchange for job security. This decision results in lower employee turnover and a higher retention rate for existing business establishments. As evident in Figure 1, corresponding to an increase in layoffs and discharges, voluntary quits by employees declined significantly during both recessions.
3. Methodology
This research begins by investigating the impact of the employment portfolio in a county on the survival rates of new business establishments in that county. Growth in employment in the county is measured through the average annual growth in wage and salary employment. Risk in employment in the county represents the standard deviation in wage and salary employment during the same period.
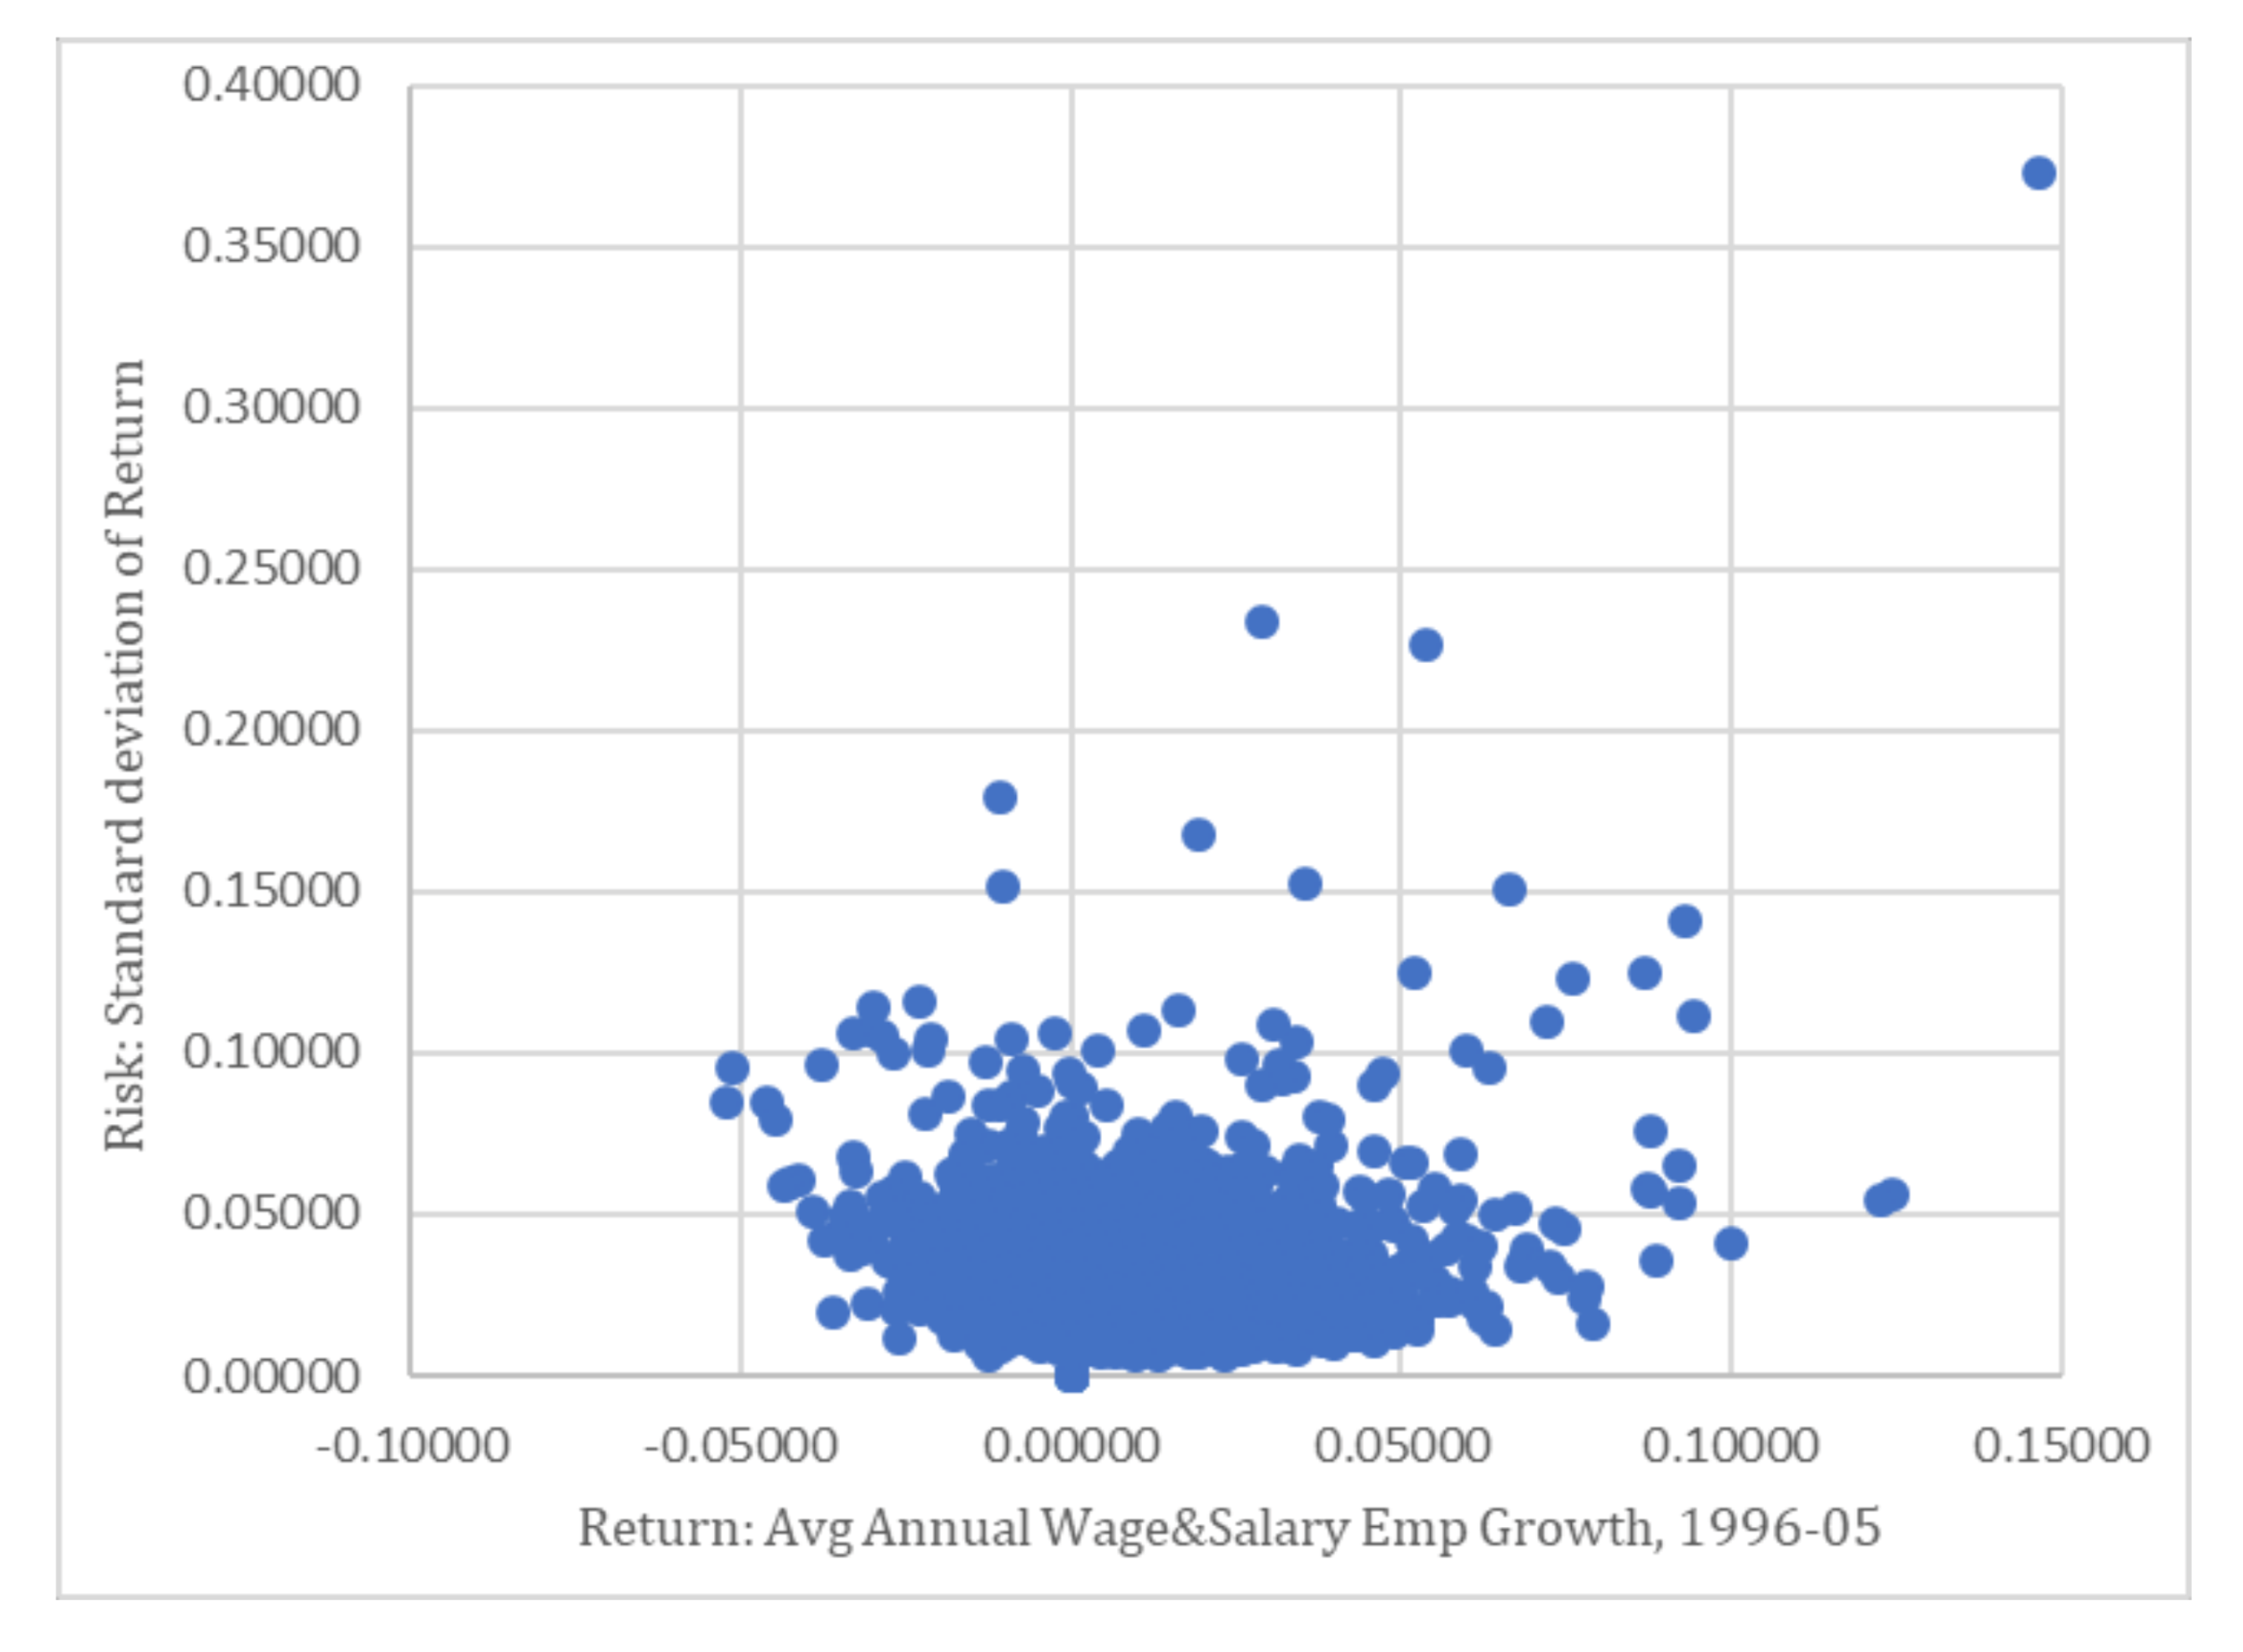
Before it can be established that risk–return trade-off in a county affects business survival rates, it is imperative to establish the existence of a risk–return relationship. Investigation into risk–return trade-off has shown a U-shaped relationship for states, metro areas, and commuting zones [2,3,4]. Plotting the risk and growth variables for all counties for the 1996–2005 timeframe suggests that a U-shaped relationship does exist (Figure 2).
The relationship between risk and return appears to be nonlinear. As returns increase, the risk declines. However, beyond a certain level of growth, the risk starts rising again. This indicates that the growth in returns (or job growth) has a dual effect on the risk, hence quadratic variation in the growth variable, growth-squared, is also included as an additional parameter in the model.
Visual observation suggests that the relationship between risk and returns is nonlinear. To confirm this inference, this relationship is tested econometrically. A widely used technique for this purpose is stochastic frontier estimation [1,4]. This technique may help in identifying the shape of the frontier and the parameters that define this shape. A nonlinear estimator, the maximum likelihood estimator (MLE), is used to estimate the model. The proposed model to be estimated is as follows:
where
= the standard deviation of WSE for region i
= the annual rate of growth of WSE for region i
= parameter 1 to be estimated
= parameter 2 to be estimated
The results displayed in Table 1 confirm that the risk–return trade-off is indeed U-shaped. The risk–return profile can now be used to estimate whether the employment portfolio in a county influences the survival rate of new businesses in that county.
We test the hypothesized relationship using the model developed by [21]. We use the following reduced form equation to identify the labor market dynamics, manifested through the portfolio, in the context of new business survival (Si) in the selected regional unit. Broadly, new business survival depends on the regional labor market portfolio (Li), amenity score (Ai), demand shock (Di), local workforce education measures (EEi), bank deposits (Bi), regional housing market variables (Hi), regional income variables (Ii), market access (Mi), and regional employment variables (Ei).
The above reduced -form model evolves into the following empirical model:
3.1. Data
Data for this research have been collected from the Bureau of Economic Affairs’ (BEA) Regional Economic Information System (1969–2016). This dataset has comprehensive information about local labor markets at the county level for key variables such as wage and salary employment, self-employment (both in farm and non-farm sectors), personal income, and population. Data for variables representing regional characteristics such as education level, homeownership, and median house values are collected from the U.S. Census Bureau, decennial census.
Data for the survival rates of establishments are taken from the National Establishment Time Series database of U.S. establishments. The survival rate of new businesses in the counties is the dependent variable. Metropolitan counties are those with core populations exceeding 50,000 residents, while micropolitan counties have core populations of between 10,000 and 50,000. Town counties are based on core urban areas of less than 10,000 residents. Non-metropolitan counties are defined as micropolitan counties plus town counties. Descriptive statistics are detailed in the Appendix A.
3.1.1. Local Employment Portfolio—The Core Variables of Interest
Average wage and salary employment is selected as the measure of risk–return trade-off in the county because, as a frequently used employment-based measure, it follows trends in incomes as well as in population and tax revenue in the county [4]. This makes wage and salary employment an appropriate variable for investigating risk and return trade-off.
Risk is measured, based on the conventional definition, as the standard deviation of annual wage and salary employment growth (WSE-Risk) during the selected timeframe. The data for annual wage and salary employment growth are obtained from the Regional Economic Information System (REIS) at the Bureau of Economic Analysis (BEA), U.S. Department of Commerce, 1969–2016.
Growth is defined as the average annual wage and salary employment growth (WSE-Growth) in the county during the selected timeframe(s).
Growth squared is defined as the average annual wage and salary employment growth squared (WSE-Growth Squared) in the county during the selected timeframe(s).
The composition and character of the local labor market takes several years to change, and subsequently influence the local businesses in an average county. The timeframes selected in the study were around ten years on average (longer in a few instances), in order to encapsulate these changes and their subsequent manifestations in the survival of local businesses.
3.1.2. Regional Control Variables
The location of the establishment is likely to have an impact on its survival rate. To capture the impact of the local economic environment, commonly used measures of regional characteristics from the literature are used. Besides regional controls, financial capital and human capital controls are also used to evaluate their impact on establishment survival rate.
To partially address the issue of the potential endogeneity of some of these measures with the dependent variable, in the spirit of the econometric technique commonly followed in similar studies, lagged values of some of these variables are used in the econometric analysis. The key regional control variables used in the model and their respective data sources are provided in Appendix A.
No multicollinearity is found in the model. The variance inflation factor (VIF) for each regional control variable is less than 5.
4. Empirical Results
The empirical exercise is conducted by testing the impact of the local labor market portfolio, based on wage and salary employment data, on the new business survival rate in 2010 in countyi. Following the convention in the employment portfolio literature, employment-based measures of risk and return trade-off are used [1,4]. We begin by looking at the role of employment-based portfolios across the spectrum of the chosen regional unit: counties in the U.S., categorized as all, metro, nonmetro, towns, and micro.
WSE portfolios from 1996 to 2005 and from 1997 to 2006 are found to have a significant impact on the survival rate of new businesses in 2010 in metro counties. These are establishments that were born in 2005–2006. All three measures, WSE-Risk, WSE-Growth, and WSE-Growth Squared, were found to be significant, though to varying degrees (Table 2).
We validate these results by using another potential measure of risk and return trade-off in the local labor market, wage and salary income data. A likely criticism of using this measure is the possible influence on the results because of differences in the cost of living in the regional units. Though challenging, the use of this measure is expected to facilitate the validation of the results found earlier using employment-based measures.
Conducting the empirical exercise with the income-based risk and return measures for different timeframes yields interesting results. Similar to the employment-based portfolio, this portfolio comprises wage and salary income growth (WSI-Growth; defined as the average annual wage and salary income growth in the county during the selected timeframe(s)), wage and salary income growth squared (WSI-Growth Squared; defined as the average annual wage and salary income growth squared in the county during the selected timeframe(s)), and wage and salary income risk (WSI-Risk; the standard deviation of annual wage and salary income growth during the selected timeframe). The WSI portfolios from 1996–2005, 1995–2005, 1991–2005, 1991–2004, 1992–2005, 1993–2005, and 1997–2006 were found to be significant for new business survival in 2010. Similar to before, the observed impact was consistently visible in the metro counties, and all three measures, WSI-Risk, WSI-Growth, and WSI-Growth Squared, were found significant.
The results indicate that risk and return trade-off in local labor markets, identified through employment-based and income-based measures, is instrumental in the survival of new businesses. This impact was found to be strong, especially in metro counties, which encouraged us to focus the investigation in Metropolitan Statistical Areas (MSAs; identified using the crosswalk file from NBER). The existence of a non-linear relationship between risk and growth variables was also verified in MSAs. Similar to counties, the existence of a U-shaped relationship was found in MSAs also (See Table A1 in Appendix A, with results of the MLE tests in MSAs).
The validity of these results could potentially be challenged due to the impact of the Great Recession on the local economy. The influence of this macroeconomic shock cannot be ignored, though considerable heterogeneity was observed in its impact on regions across the country.
A widely used practice in econometric analysis is to replicate the empirical exercise in a different period. To validate the results, the exercise was replicated to determine the impact of local labor market dynamics on the new business survival rate in 2005. A similarity that encouraged the selection of new business survival rate in 2005 was found in the fact that the new businesses that operated during this period also had to go through the recession in 2001, just like those that survived in 2010.
To test the robustness of the results, the empirical exercise was replicated in MSAs only, using both employment-based and income-based risk and return portfolios separately to gauge their impact on new business survival rates in 2005 (three regional control variables (Bartik shock, county/MSA income growth 2000–2007, county/MSA employment growth 2000–2007) were dropped when running regressions, as historical data were not available for them for this timeframe) and 2010.
Similar to the results found for counties, income-based risk and return (WSI) measures were consistently found to have a significant impact on new business survival in 2010 in the MSAs as well. WSI-Risk and WSI-Growth from 1991–2001, 1991–2005, 1995–2005, 1996–2005, 1996–2006, 1997–2006, 2001–2010, 2000–2009, 1997–2007, 2000–2008, 2002–2007, and 1998–2007 were found to be significant (Table A3 in the Appendix A). WSI-Growth Squared was found to be significant for all these timeframes, except in 2000–2009 and 2000–2008.
Next, we replicate this exercise in order to specifically investigate the impacts of employment-based and income-based measures on new business survival rates in MSAs in 2005. The regression results reveal that the WSE-Risk related to employment-based measures in 1991–1999, 1991–2000, 1992–2000, 1993–2000, 1991–2001, 1991–2004, 1991–2005, 1993–2005, 1993–2003, and 1993–2004 had a consistent and significant impact on the new business survival rates in 2005 (Table A4 in the Appendix A). WSE-Growth and WSE-Growth Squared were not found to have any impact during these periods. Income-based risk and return measures were also found to have no impact on the new business survival in 2005.
5. Discussion of Key Results
The analysis of the roles of wage and salary employment (WSE) and wage and salary income (WSI) portfolios in new business survival in MSAs revealed some interesting results. WSE-Risk was found to have a significant impact on new business survival in 2005, and the aggregate WSI portfolio on new business survival in 2010. Risk, manifested both in WSE and WSI, was consistently found to affect the likelihood of new business survival when investigated during different timeframes. Reverse causality or endogeneity may well be a factor in these results, and future work would need to incorporate robust identification strategies to untangle these relationships.
5.1. New Business Survival Rate 2010
Wage and salary income risk–return (WSI) portfolios were found to play a significant role in the survival of new businesses in 2010 in MSAs. These are the businesses that were born in 2005–2006.
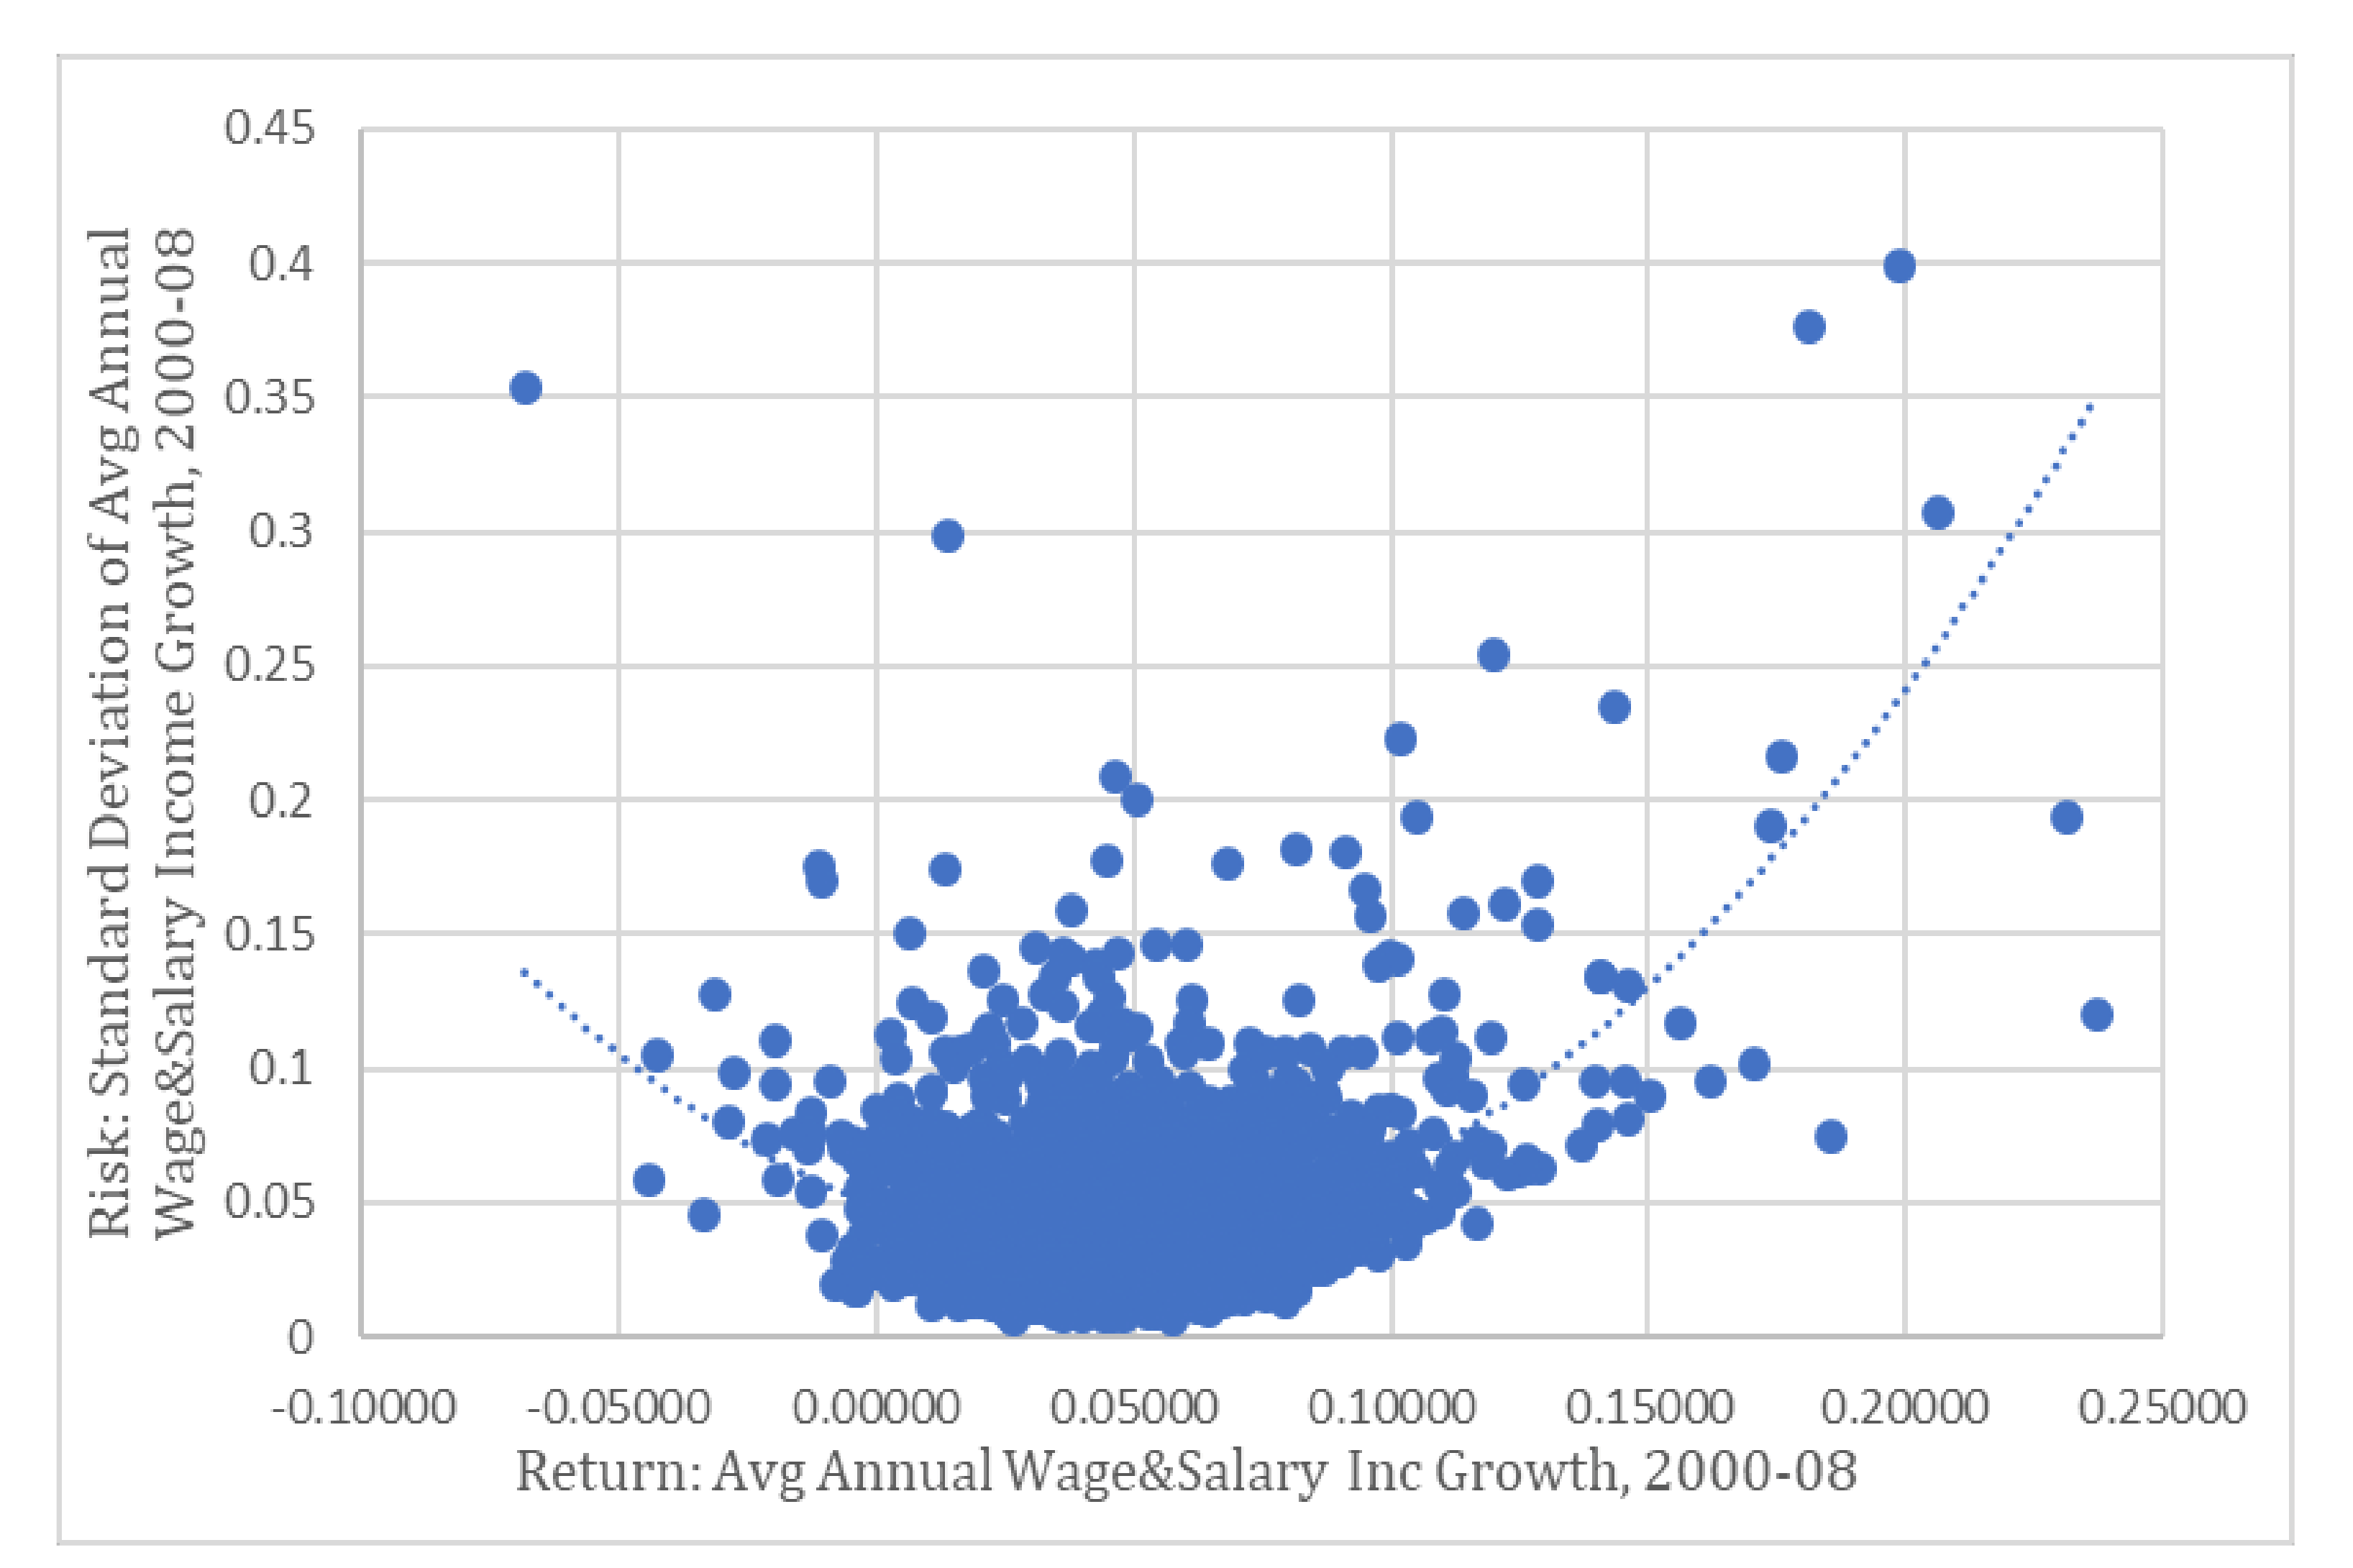
Similar to the wage and salary employment risk and return (WSE) portfolio, the WSI portfolio also showed a U-shaped relationship between WSI Growth and WSI Risk, when plotted for all the counties in different timeframes (See Figure A1 in the Appendix).
The wage and salary income risk and return portfolios of 1996–2005, 1996–2006, 1995–2005, 1991–2005, 1991–2001, 1997–2006, 2001–2010, 2000–2009, 1997–2007, 2000–2008, 2002–2007, and 1998–2007 were selected for this analysis. The impact of the WSI risk–return portfolio on the new business survival rate in 2010 was found to be robust across these timeframes in the MSAs. We offer the following speculative scenarios to help understand these results.
A severe macroeconomic event was found while analyzing new business survival in the years preceding 2010, namely, the Great Recession. This recession was a distinctive event, comparable only to the Great Depression. It was deep, and compared to recent recessions, lasted for a longer period—from December 2007 to June 2009. The severity of this recession can be gauged from the fact that the national unemployment rate rose to almost 10% in late 2009. The average expenditures per household declined from USD 52,203 in 2007 to USD 48,109 in 2010 (The Recession of 2007–2009, Bureau of Labor Statistics, 2012, https://www.bls.gov/spotlight/2012/recession/, accessed on 3 December 2019) [36]. Spending declined in all major categories except healthcare during this period. Labor productivity increased marginally, while output and number of hours worked dropped significantly [36]. The wages and salaries of employees in the private sector grew by only 1.3% in December 2009, compared to an increase of 3.6% in March 2007.
Wage and salary income growth was found to have a positive effect, and is strongly significant in this analysis. This suggests that with increased growth in WSI, the survival of businesses increased. The Great Recession was deep, and lasted for a longer period compared to other recessions in the recent past. New businesses that rewarded existing employees, who stayed with them during this unprecedented event, with small but significant increases in wages and salaries were likely to have encouraged these employees to prolong their stay with them. Sharing the economic rewards with their employees is likely to help them not only survive in challenging times, but also to achieve a quick turnaround.
WSI-Risk was found to have a positive effect, and was significant in new businesses’ survival in MSAs during the studied timeframes.
MSAs with a higher percentage of the population residing in rural areas in 2000 had a higher business survival rate in 2010 during the selected timeframes. Rural areas witnessed relatively sharper declines in jobs and prolonged unemployment in the local labor market. More job opportunities and higher wages are key factors in attracting younger workers to cities and urban areas. Older workers are comparatively less mobile and able to switch occupations when faced with an economic crisis, which creates challenges when it comes to making structural changes in the local economy [37,38]. The migration of a semi-skilled and skilled labor force contributed to the bigger pool of potential employees to choose from for the employers in MSAs.
“Median Household Value 2000” was found to be negative and significant during the selected timeframes. The Great Recession originated in the housing sector, and subsequently spread to other sectors of the economy. It is no surprise that the bursting of the housing bubble resulted in a sharp decline in housing values. This decline in housing prices resulted in negative home-equity for many homeowners. The unprecedented decline in personal wealth and the unfavorable shift in the labor market likely encouraged employees to remain in their current employment, which had a positive impact on the survival of business establishments.
Both “Population with BA+, 2000”, and “Population with High School degree but No BA+, 2000”, were found to have a positive and consistent impact on new business survival in 2010 during the selected timeframes. It is not surprising that MSAs with a higher share of both highly skilled labor force and semi-skilled labor force had higher survival rates. Higher human capital endowment is often associated with higher levels of experience, transferable knowledge, and skills, which helps alleviate the negative impacts of recessions in MSAs [39]. Such employees are highly valued assets, and firms prefer to retain them even when rationing jobs during recessions. Large cities and urban areas have a higher share of labor force with a college education. Ref. [40] shows that places with a higher share of college graduates suffered smaller effects from the crisis.
MSAs with a higher share of skilled labor force attract high-tech jobs. Ref. [41] found that the job-multiplier in commuting zones ranges from 1.7 to 2.9, depending upon the existence of high-tech clusters. This means that for every 100 new jobs created in high-tech sectors, 70 to 190 additional local jobs (including semi-skilled and unskilled) would be created in the regional unit. The survival of new businesses in the high-tech sectors in MSAs saved not only jobs in their units, but also several jobs that they helped create.
5.2. New Business Survival Rate 2005
We found that WSE-Risk had a consistent impact on the survival of new businesses in 2005. These businesses were born in 2000–2001. The analysis was conducted over different timeframes.
WSE-Growth and WSE-Growth Squared were not found to have any impact. However, WSE-Risk was consistently found to be positive and have a significant impact on business survival in MSAs in 2005. The impact of WSE-Risk was found to be robust across all selected timeframes. Again, we offer the following speculative scenarios to help understand these results.
The distinctive event in the lives of new businesses was the 2001 recession. This recession was unique compared to the recessions preceding it as it lasted for eight months, which is less than the average age of eleven months of previous recessions [42], and largely saw a technology, telecommunications, and tourism downturn. Comparatively, it was a milder and shorter recession. The unemployment rate increased by 2.10 percentage points, non-farm employment declined by 1.34 percentage points, while real output dropped by 1.6% from first quarter to the second quarter of 2001 [42]. Despite the decline in output and increase in unemployment, the 2001 recession was also unique because, surprisingly, the U.S. economy observed increased spending on consumer durables, new residential housing, and a significant increase of 2.2% in labor productivity. The latter is broadly attributed to the increased spending on information technology and computer hardware by corporations to combat the threat of Y2K in the late 1990s. The causes of this recession are the dot-com bubble burst, the decline in international trade, and the terrorist attacks of 11 September, all of which resulted in a decline in business spending and eventually the gross output. The 2001 recession severely affected the Technology sector compared to other sectors of the economy.
“Median Household Value, 2000” was found to have a positive and significant impact on new business survival in 2005 during the selected timeframes. An increase in median household value in MSAs is likely to affect business survival through dual channels. Ref. [42] found that expenditure on new housing and consumer durables grew in the years before the 2001 recession and continued to grow throughout the recession. The long-term interest rates peaked ten months before the March 2001 business cycle peak and continued to decline subsequently. Low-interest rate regimes before and during the 2001 recession fueled the growth in the housing market, which resulted in a boom in this sector in subsequent years. Many cities across the country witnessed unprecedented growth in housing prices. Ref. [43] estimated the price elasticities of housing stock at the MSA level, and found that in areas with high elasticity of housing supplies, the number of new houses increased, and areas with low elasticity saw sharp increases in housing prices. With increased home prices, existing homeowners cashed out their dormant home equity. A significant portion of this extra cash was spent on buying consumer durables and big-ticket items. This additional spending is likely to have trickled down as increased revenue for many existing and newly born establishments. The cashed-out home equity also became an additional and untapped source of funds for the owners of new establishments to invest in business and support existing operations, as well as to fuel growth.
“Population with High School degree but No BA+” was found to have a negative and significant impact on business survival in 2005. A distinctive feature of the 2001 recession was the sharp rise of 2.2 percentage points in non-farm labor productivity [42]. The late 1990s witnessed a significant investment in computer equipment and software by corporations to combat the threat of Y2K, and also the adoption of new technology, which likely resulted in increased labor productivity. Growth in labor productivity resulted in real disposable income growth (0.37%). The increased investments in IT and computer hardware by corporations may not have improved the productivity and the resulting disposable income of semi-skilled and unskilled labor force. Regions with less skilled labor force are likely to have missed these benefits, which would have affected the survival of businesses there. This impact is likely to have been stronger, especially during the recession.
5.3. Role of Risk in New Business Survival in MSAs
Risk is the key factor consistently influencing new business survival in MSAs, through both wage and salary employment and wage and salary income portfolios. The positive impact of volatility in the local labor market on new business survival is found to be stronger during recessions. As previously, we offer the following speculative scenarios to help explain these results.
The role of risk in the birth of enterprises is well documented [4]. Our results indicate that the risk displayed in the local labor market significantly increased the likelihood of new business survival. The increased turmoil in the labor market manifests through mass-layoffs, higher unemployment, stagnation in wage and salary income, etc. Empirical investigations highlight the fall in labor productivity, a secular decline in demand for semi-skilled workers, increases in low-wage and insecure jobs, and decreases in union membership as some of the long-term trends observed in the U.S. labor market [44]. Ref. [45] show that the growth rate in productivity picked up in the mid-1990s, slowed in the mid-2000s, and remained flat going into the Great Recession. The response of a rational worker aware of both the impact of exogenous macroeconomic shock and the ongoing dynamic changes in the local labor market would be to continue with their existing employment. This decision results in a lower employee turnover and a higher retention rate for newly established businesses.
A low employee turnover rate is beneficial for establishments. Excessive employee turnover has both monetary and non-monetary costs that can have a significant and far-reaching effect on the economic and operational efficiency of the establishment. In extreme cases, high employee turnover may have detrimental impacts on new business survival. Ref. [46], citing a nationwide survey, found that the average internal cost-per-hire for an engineer was USD 4901, a computer programmer USD 2500, a secretary USD 1000, and a retail sales associate USD 350 in the 1990s. The direct monetary costs can be attributed to the costs of advertising, recruitment, candidate travel, selection, hiring, assignment, orientation, training, signing bonus, and relocation expenses for the new employee(s). These costs would be significantly higher in current dollars. The non-monetary costs include the breakdown of customer relations, the disruption of workflow, declines in morale of the remaining employees, and additional costs incurred till the newly hired employee acquires necessary job skills and can work at the desired level of efficiency [46].
Highly talented and competent employees generally leave for better opportunities or get poached by competitors. The monetary and non-monetary costs from the loss of such employees are likely to have a substantial impact on the survival of new establishments. “County/MSA Employment growth, 2000–2007” was found to have a negative impact on new business survival rate in 2010 during the 2000–2009 and 2000–2008 timeframes. The sign of this variable indicates an inverse relationship with new business survival rate, which reinforces the impact of high employee turnover on the survival of new businesses. Broadly, new businesses operating in MSAs that witnessed high employment growth are also likely to experience high employee turnover, which would result in significant monetary and non-monetary costs. The aggregate consequences of these costs for new businesses, operating on shoe-string budgets, could be attributed to the closure of some of these businesses. The shift in employee preference to current employment vis-a-vis the potential gains derived from a risky switch during a recession helps a new establishment save significant economic resources. Additionally, the prolonged employment of such employees during a recession facilitates a continued focus on innovation, and on maximizing efficiency, which are the comparative advantages of a new business and are the bedrock of their survival.
An interesting result found in the empirical exercise is that risk only consistently manifested on survival rate via wage and salary employment in 2005, and via wage and salary income in 2010. Our analysis of new business survival also highlights the role of the salient structural changes observed in the labor market over the years, the impact of which became strongly visible during both recessions. The labor market witnessed a significant export of jobs to low-wage countries, beginning with manufacturing jobs going to China and Vietnam, and subsequently low-end service sector jobs going to India and the Philippines. The former was facilitated through increased global trade, and the latter accelerated through the technological improvements adopted by corporations in the late 1990s and early 2000s. Ref. [47] found that increased Chinese imports resulted in reductions in both employment and wage levels in the manufacturing sector. They also found that increased transfer payments made through multiple federal and state programs masked the loss in average earnings of the affected households during this period. Ref. [48] showed that globalization affected wages by pushing workers out of the manufacturing sector into low-paying jobs elsewhere. These subtle structural changes over the prolonged period changed the composition and quantity of jobs available in the key sectors, which first became evident during the 2001 recession. The Great Recession resulted in a sharp increase in unemployment across all sectors of the economy, thereby strongly demonstrating the impact of the structural changes that had begun earlier in the 1980s and 1990s. Workers across all sectors experienced a significant and prolonged decline in or loss of wage and salary income, which manifested through income-based measures in our investigation.
As noted above, the 2001 recession significantly impacted the technology and tourism sectors. Regions that specialized in these two sectors were most affected by this recession. States in the Mideast Census Region were least affected by the 2001 recession [49].
The Great Recession originated in the housing sector in urban centers, then transmitted to the financial sector, and eventually engulfed the national economy, before spreading to other countries. The origin of this economic shock and its transmission created an initial perception that its impact would create severe economic challenges in large cities and urban centers. However, investigations into the responses of regional economies to the Great Recession have shown that the impact has been more severe, and the recovery has been slower in smaller towns and rural areas.
Empirical research has shown that urban areas performed better during the 2001 and 2007–2009 recessions [49,50,51]. Not only were MSAs more able to endure these recessions, but they were also able to recover faster than non-MSAs. Surviving businesses contribute valuable tax dollars, and at the same time help reduce the additional expenditure of state and local governments in the form of transfer payments, such as unemployment benefits. These contributions significantly enhance the resilience of the community, especially during economic downturns. New businesses that were able to survive during these recessions sustained the local economy during them and accelerated economic growth in the recovery phase.
6. Conclusions
The findings in this paper highlight that risk in the local labor market improves the survival of new businesses, which provides much needed resilience to the local economy. This dynamic was evident in MSAs when investigating the responses of new businesses during the recent recessions of 2001 and 2007–2009.
The impact of macroeconomic shock on the local labor market, captured through volatility in employment-based and income-based measures, likely influences employees’ decisions when evaluating the risk–return trade-off involved in quitting existing employment. The turmoil in the local labor market encourages employees to continue with their present employment and postpone any career-related decisions (until the economic outlook gets better). This shift in employee behavior, even if temporary, is beneficial for new businesses, as it shields the business from monetary and non-monetary costs associated with high employee turnover. Many new businesses struggle with numerous challenges, which compound exponentially due to the exogenous shock. The savings on such costs and the continued contribution of valued employees in business operations are nothing short of a lifeline for a new business.
This paper contributes to the literature focusing on the role of human capital in regional economic growth. Research on the role of human capital in firm survival is predominantly anchored in the entrepreneur’s personal characteristics. Our endeavor contributes to this literature by uniquely applying portfolio theory in the context of employee-centric risk and return trade-off in the regional unit, also highlighting the contribution of employees to new business survival.
The findings from this paper may help policymakers design economic development policies tailor-made to the needs of the regional unit. The targeted approach may help in the more efficient use of tax dollars compared to the effect from applying a blanket policy. The Paycheck Protection Program (PPP) implemented by the Federal Government in response to the economic downturn caused by the COVID-19 pandemic is a good example of using a targeted approach to support local businesses. Not only does this help businesses survive the downturn and keep their employees on the payroll, but it also ensures business establishments are ready to participate in and contribute to a faster economic recovery. In the absence of this program, many more business establishments would have closed down, and consequently, the post-pandemic recovery would have been more painful and elongated.
We find encouraging results to support our hypothesis, and expect potential opportunities for further research on this topic. Our analysis is limited to the 2001 and 2007–2009 recessions, while countries all across the world are experiencing severe economic shock due to the widespread pandemic. Although the COVID-19 pandemic is a very different type of economic downturn, similar analyses of the COVID recession should provide promising opportunities to investigate its impact on the dynamics of the local labor market, and further, on business survival.
We use counties as a regional unit to capture the dynamics of the local labor market for our analysis. The selection of counties for the analysis can be questioned on the ground that they are not perfect reflections of the prevalent dynamics in the local labor market. For further research, we plan to incorporate granular data from both MSAs and commuting zones into our analyses. As discussed above, reverse causality or endogeneity is likely to be present, so future work needs to incorporate an appropriate identification structure for addressing these confounding relationships.
Author Contributions
B.G.: formal analysis, investigation, resources, methodology, data curation, original draft preparation; S.W.: conceptualization, supervision, writing—review and editing. Both authors have read and agreed to the published version of the manuscript.
Funding
This research received no external funding.
Institutional Review Board Statement
Not applicable in this study.
Informed Consent Statement
Not Applicable.
Data Availability Statement
Data presented in this study are available on request from the corresponding author. Detailed information about the data sources is provided in the Appendix A (Table A2).
Acknowledgments
The authors would like to acknowledge the valuable contribution of faculty members at Department of Economics, CSU, and external stakeholders at various stages of this endeavor.
Conflicts of Interest
The authors declare no conflict of interest.
Appendix A
Figure A1.
County WSI Risk and Return, 2000–2008.


Table A1.
Test of risk–return trade-off in MSAs.
| Metropolitan Statistical Areas | ||
|---|---|---|
| Estimate | Std Error | |
| Constant | 0.018 *** | 0.0005 |
| Growth | −0.122 ** | 0.0599 |
| Growth Squared | 4.992 *** | 1.367 |
| n | 374 | |
| Log-likelihood | 1326.19 | |
*** p < 0.01, ** p < 0.05.
Table A2.
Key regional variables and data source (Regional Economic Information Systems (REIS), Bureau of Economic Analysis (BEA); United States Department of Agriculture (USDA); United States Census Bureau (USCB)).
Table A2.
Key regional variables and data source (Regional Economic Information Systems (REIS), Bureau of Economic Analysis (BEA); United States Department of Agriculture (USDA); United States Census Bureau (USCB)).
| Regional Variable | Source |
|---|---|
| Self Employment Rate | REIS/BEA |
| Amenity Score | McGranahan Index, USDA Economic Research |
| Share of Pop. Living in Rural, 2000 | USCB, Decennial Census 2000 |
| Share of pop. with BA+, 2000 | USCB, Decennial Census 2000 |
| Share of pop. With High School but No BA+, 2000 | USCB, Decennial Census 2001 |
| Bank Deposits per capita 2005 | Federal Deposit Insurance Corp (FDIC) & BEA |
| Median Home Value, 2000 | USCB, Decennial Census 2000 |
| Owner Occupied Houses, 2000 | USCB, Decennial Census 2000 |
| County Income percapita, 2000 | USCB, Decennial Census 2000 |
| County Employment, 2000 | USCB, Decennial Census 2000 |
| County Income per capita growth, 2000–2007 | USCB |
| County Employment growth, 2000–2007 | USCB |
| Distance to nearest Metro | USDA |
| Employment-pop ratio, 2000 | REIS/BEA |
Table A3.
Results from WSI portfolios from different timeframes as regards SR2010 in MSAs only. (Selected timeframes are displayed due to space constraints).
Table A3.
Results from WSI portfolios from different timeframes as regards SR2010 in MSAs only. (Selected timeframes are displayed due to space constraints).
| Survival Rate, 2010 | ||||||
|---|---|---|---|---|---|---|
| 1991–2001 | 1995–2005 | 1996–2005 | 1996–2006 | 1997–2006 | 2000–2009 | |
| WSI-Risk | 0.426 * | 0.438 * | 0.482 ** | 0.494 ** | 0.484 ** | 0.401 * |
| (0.2230) | (0.2240) | (0.2100) | (0.2150) | (0.2020) | (0.2060) | |
| WSI-Growth | 2.080 *** | 1.912 *** | 1.722 *** | 2.056 *** | 2.017 *** | 1.385 ** |
| (0.6290) | (0.6740) | (0.6490) | (0.6740) | (0.6800) | (0.5030) | |
| WSI-Growth Squared | −12.90 ** | −12.44 ** | −11.26 ** | −12.33 ** | −12.15 ** | 1.89 |
| (4.6010) | (5.4620) | (5.2460) | −5.534 | (5.5920) | (5.5990) | |
| Bartik Shock, 2005 | −0.0000796 | −0.000047 | −0.00000365 | −0.000104 | −0.0000941 | −0.000975 |
| (0.0010) | (0.0010) | (0.0010) | (0.0010) | (0.0010) | (0.0009) | |
| Dynamism: Centered | −0.00213 | −0.00191 | −0.00187 | −0.00193 | −0.00188 | −0.00253 * |
| (0.0016) | (0.0016) | (0.0016) | (0.0015) | (0.0015) | (0.0015) | |
| County Income per capita, 2000 | −0.000000924 | −0.0000012 | −0.0000013 | −0.0000012 | −0.0000012 | −0.0000010 |
| (0.0000) | (0.0000) | (0.0000) | (0.0000) | (0.0000) | (0.0000) | |
| County Inc per capita growth rate, 2000–2007 | 0.000389 | 0.000174 | 0.000154 | 0.000057 | 0.00004 | −0.000683 |
| (0.0003) | (0.0003) | (0.0003) | (0.0003) | (0.0003) | (0.0004) | |
| County Employment, 2000 | −0.00000001 | −0.00000001 | −0.00000001 | −0.00000001 | −0.00000001 | −0.00000001 |
| (0.0000) | (0.0000) | (0.0000) | (0.0000) | (0.0000) | (0.0000) | |
| County Employment growth rate, 2000–2007 | −0.000198 | −0.000284 | −0.000259 | −0.000444 | −0.000431 | −0.00111 *** |
| (0.0003) | (0.0003) | (0.0003) | (0.0003) | (0.0003) | (0.0003) | |
| Amenity Score | 0.00089 | 0.00025 | 0.000294 | 0.0000129 | 0.0000737 | −0.0000789 |
| (0.0013) | (0.0013) | (0.0013) | (0.0013) | (0.0013) | (0.0013) | |
| Deposits per capita, 2005 | −0.0000004 | −0.0000004 | −0.0000004 | −0.0000005 | −0.0000005 | −0.0000004 |
| (0.0000) | (0.0000) | (0.0000) | (0.0000) | (0.0000) | (0.0000) | |
| Share of Homes Owner Occupied | 0.0456 | 0.0551 | 0.0554 | 0.0594 | 0.0617 | 0.0835 * |
| (0.0510) | (0.0510) | (0.0510) | (0.0507) | (0.0508) | (0.0500) | |
| Median HH Value, 2000 | −0.000000314 ** | −0.000000285 ** | −0.000000282 ** | −0.000000285 ** | −0.000000284 ** | −0.000000273 ** |
| (0.0000) | (0.0000) | (0.0000) | (0.0000) | (0.0000) | (0.0000) | |
| Share of pop living in Rural, 2000 | 0.0595 *** | 0.0557 ** | 0.0545 ** | 0.0535 ** | 0.0539 ** | 0.0585 *** |
| (0.0172) | (0.0175) | (0.0176) | (0.0175) | (0.0175) | (0.0165) | |
| County Self-Employment Rate, 2000 | −0.00158 | −0.00232 | −0.00237 | −0.00231 | −0.00221 | −0.00188 |
| (0.0039) | (0.0039) | (0.0039) | (0.0039) | (0.0039) | (0.0039) | |
| Population with BA+, 2000 | 0.375 *** | 0.329 *** | 0.325 *** | 0.322 *** | 0.324 *** | 0.344 *** |
| (0.0874) | (0.0860) | (0.0858) | (0.0855) | (0.0857) | (0.0865) | |
| Population with HS degree but NO BA+, 2000 | 0.121 * | 0.125 * | 0.118 * | 0.128 * | 0.126 * | 0.170 ** |
| (0.0548) | (0.0549) | (0.0547) | (0.0545) | (0.0545) | (0.0552) | |
| Employment-Pop Ratio, 2000 | 0.0173 | 0.0267 | 0.0276 | 0.0236 | 0.0241 | 0.0403 |
| (0.0379) | (0.0373) | (0.0372) | (0.0370) | (0.0370) | (0.0361) | |
| Distance to the Nearest MSA | −0.0145 | −0.0132 | −0.0137 | −0.0136 | −0.0137 | −0.01669 ** |
| (0.0083) | (0.0083) | (0.0083) | (0.0082) | (0.0083) | (0.0081) | |
| Constant | 0.452 *** | 0.465 *** | 0.476 *** | 0.460 *** | 0.461 *** | 0.435 *** |
| (0.0619) | (0.0622) | (0.0620) | (0.0618) | (0.0619) | (0.0592) | |
| R-squared | 0.258 | 0.253 | 0.254 | 0.263 | 0.263 | 0.293 |
| Observations | 374 | 374 | 374 | 374 | 374 | 373 |
* p < 0.1, ** p < 0.05, *** p < 0.01. Standard errors are in parenthesis.
Table A4.
Results from WSE portfolios from different timeframes as regards SR2005 in MSAs only. (Selected timeframes are displayed due to space constraints).
Table A4.
Results from WSE portfolios from different timeframes as regards SR2005 in MSAs only. (Selected timeframes are displayed due to space constraints).
| Survival Rate 2005 | |||||
|---|---|---|---|---|---|
| 1991–1999 | 1991–2001 | 1992–2000 | 1993–2000 | 1993–2003 | |
| WSE-Risk | 0.494 ** | 0.500 * | 0.436 * | 0.489 ** | 0.534 * |
| (0.2340) | (0.2160) | (0.2350) | (0.2360) | (0.2370) | |
| WSE-Growth | 0.188 | 0.147 | 0.387 | 0.299 | 0.0172 |
| (0.3100) | (0.3640) | (0.3390) | (0.3320) | −0.365 | |
| WSE-Growth Squared | −4.762 | −5.011 | −6.324 | −4.872 | −2.658 |
| (4.3560) | (5.3860) | (4.4020) | (4.2690) | (5.8880) | |
| Dynamism Centered | 0.0019 | 0.00192 | 0.00177 | 0.00175 | 0.00146 |
| (0.0024) | (0.0023) | (0.0023) | (0.0023) | (0.0023) | |
| County Inc per capita, 2000 | −0.00000116 | −0.00000114 | −0.00000111 | −0.00000111 | −0.0000009 |
| (0.0000) | (0.0000) | (0.0000) | (0.0000) | (0.0000) | |
| County Employment, 2000 | 0.00000001 | 0.00000001 | 0.00000001 | 0.00000001 | 0.00000001 |
| (0.0000) | (0.0000) | (0.0000) | (0.0000) | (0.0000) | |
| Amenity Score | −0.00311 | −0.00298 | −0.00305 | −0.00286 | −0.00301 * |
| (0.0019) | (0.0019) | (0.0019) | (0.0019) | (0.0018) | |
| Deposits per capita, 2000 | 0.000000469 | 0.000000453 | 0.000000426 | 0.000000447 | 0.00000048 |
| (0.0000) | (0.0000) | (0.0000) | (0.0000) | (0.0000) | |
| Share of Homes Owner Occupied | −0.205 ** | −0.209 ** | −0.206 ** | −0.200 ** | −0.201 ** |
| (0.0723) | (0.0722) | (0.0724) | (0.0725) | (0.0717) | |
| Median HH Value, 2000 | 0.000000430 ** | 0.000000431 ** | 0.000000420 ** | 0.000000415 ** | 0.000000424 ** |
| (0.0000) | (0.0000) | (0.0000) | (0.0000) | (0.0000) | |
| Share of pop Residing in Rural, 2000 | 0.0162 | 0.018 | 0.0153 | 0.0169 | 0.0205 |
| (0.0233) | (0.0232) | (0.0233) | (0.0232) | (0.0228) | |
| County Self-Employment Rate, 2000 | −0.0058 | −0.00537 | −0.00568 | −0.00591 | −0.00552 |
| (0.0055) | (0.0055) | (0.0056) | (0.0055) | (0.0055) | |
| Population with BA+, 2000 | −0.152 | −0.15 | −0.151 | −0.145 | −0.153 |
| (0.1180) | (0.1170) | (0.1180) | (0.1180) | (0.1160) | |
| Population with HS degree but NO BA+, 2000 | −0.269 *** | −0.273 *** | −0.278 *** | −0.269 *** | −0.262 *** |
| (0.0761) | (0.0762) | (0.0763) | (0.0761) | (0.0744) | |
| Employment-Pop Ratio, 2000 | −0.0414 | −0.0399 | −0.0398 | −0.0399 | −0.0347 |
| (0.0524) | (0.0523) | (0.0526) | (0.0526) | (0.0513) | |
| Distance to the Nearest MSA | −0.0116 | −0.0116 | −0.0112 | −0.0111 | −0.0119 |
| (0.0118) | (0.0118) | (0.0118) | (0.0118) | (0.0116) | |
| Constant | 0.900 *** | 0.903 *** | 0.905 *** | 0.895 *** | 0.879 *** |
| (0.0820) | (0.0817) | (0.0822) | (0.0824) | (0.0782) | |
| R-squared | 0.102 | 0.105 | 0.101 | 0.103 | 0.103 |
| Observations | 370 | 370 | 370 | 370 | 370 |
* p < 0.1, ** p < 0.05, *** p < 0.01; Standard errors are in parenthesis.
Table A5.
Summary Statistics for All and Metro Counties.
| All | Metro | |||||||
|---|---|---|---|---|---|---|---|---|
| n = 3024 | n = 808 | |||||||
| Mean | Std. Dev. | Min | Max | Mean | Std. Dev. | Min | Max | |
| Survival Rate 2010 | 0.676 | 0.091 | 0.000 | 1.000 | 0.644 | 0.060 | 0.429 | 0.870 |
| WSE-Risk, 1996–2005 | 0.029 | 0.017 | 0.006 | 0.373 | 0.022 | 0.017 | 0.006 | 0.373 |
| WSE-Growth, 1996–2005 | 0.009 | 0.017 | −0.052 | 0.147 | 0.017 | 0.019 | −0.037 | 0.147 |
| WSE-Growth Squared, 1996–2005 | 0.000 | 0.001 | 0.000 | 0.022 | 0.001 | 0.001 | 0.000 | 0.022 |
| Bartik Shock, 2005 | 2.2 | 4.4 | −21.9 | 84.5 | 3.0 | 3.4 | −10.5 | 23.0 |
| Business Dynamism | 1.1 | 3.1 | −30.1 | 72.0 | 0.9 | 2.0 | −3.8 | 26.4 |
| County Income per capita, 2000 | 27,929 | 7075 | 3395 | 87,711 | 33,717 | 7898 | 17,104 | 87,711 |
| County Income per capita growth | 27.4 | 17.0 | −42.5 | 341.2 | 24.0 | 10.6 | −25.7 | 107.4 |
| County Employment, 2000 | 53,286 | 186,743 | 294 | 5,404,010 | 165,187 | 336,265 | 2106 | 5,404,010 |
| County Employment growth | 6.46 | 14.46 | −37.51 | 170.11 | 13.20 | 16.28 | −37.51 | 145.26 |
| Amenity Score | 0.04 | 2.28 | −6.40 | 11.17 | 0.27 | 2.41 | −5.40 | 11.17 |
| Bank Deposits per capita, 2005 | 14,509 | 11,259 | 390 | 241,738 | 15,026 | 16,387 | 2220 | 241,738 |
| Share of Owner Occupied Houses, 2000 | 0.86 | 0.09 | 0.23 | 0.98 | 0.92 | 0.05 | 0.46 | 0.98 |
| Median House Value, 2000 | 83,422 | 44,159 | 20,100 | 750,000 | 114,614 | 49,067 | 47,700 | 514,600 |
| Share of pop residing in rural, 2000 | 0.60 | 0.30 | 0.00 | 1.00 | 0.31 | 0.24 | 0.00 | 1.00 |
| Self-Employment Rate, 2000 | 0.73 | 3.10 | 0.00 | 81.51 | 0.27 | 0.93 | 0.00 | 15.55 |
| Share of pop with BA+, 2000 | 0.11 | 0.05 | 0.03 | 0.44 | 0.14 | 0.06 | 0.03 | 0.44 |
| Share of pop with HS, 2000 | 0.40 | 0.06 | 0.14 | 0.57 | 0.38 | 0.05 | 0.20 | 0.51 |
| Employment-to-pop Ratio, 2000 | 0.52 | 0.15 | 0.13 | 2.79 | 0.54 | 0.16 | 0.21 | 1.79 |
| Distance to nearest metro | 0.81 | 0.65 | 0.00 | 4.34 | 0.26 | 0.23 | 0.00 | 1.74 |
| Nonmetro*Amenityscore | −0.04 | 1.91 | −6.40 | 11.15 | 0.00 | 0.00 | 0.00 | 0.00 |
Table A6.
Summary Statistics for Nonmetro, Towns, and Micro Counties.
| Nonmetro | Towns | Micro | ||||||||||
|---|---|---|---|---|---|---|---|---|---|---|---|---|
| n = 2216 | n = 1581 | n = 635 | ||||||||||
| Mean | Std. Dev. | Min | Max | Mean | Std. Dev. | Min | Max | Mean | Std. Dev. | Min | Max | |
| Survival Rate 2010 | 0.688 | 0.097 | 0.000 | 1.000 | 0.692 | 0.102 | 0.000 | 1.000 | 0.679 | 0.080 | 0.250 | 1.000 |
| WSE-Risk, 1996–2005 | 0.031 | 0.017 | 0.006 | 0.226 | 0.033 | 0.017 | 0.007 | 0.226 | 0.027 | 0.014 | 0.006 | 0.123 |
| WSE-Growth, 1996–2005 | 0.005 | 0.015 | 0.0520 | 0.1228 | 0.005 | 0.016 | 0.0520 | 0.1228 | 0.007 | 0.014 | 0.0427 | 0.0921 |
| WSE-Growth Squared, 1996–2005 | 0.000 | 0.001 | 0.000 | 0.015 | 0.000 | 0.001 | 0.000 | 0.015 | 0.000 | 0.001 | 0.000 | 0.008 |
| Bartik Shock, 2005 | 1.90 | 4.65 | −21.94 | 84.53 | 2.00 | 4.88 | −21.94 | 84.53 | 1.66 | 3.99 | −16.96 | 12.50 |
| Business Dynamism | 1.21 | 3.48 | −30.08 | 72.04 | 1.33 | 3.82 | −19.30 | 72.04 | 0.91 | 2.40 | −30.08 | 18.60 |
| County Income per capita, 2000 | 25,818 | 5376 | 3395 | 83,631 | 24,868 | 5310 | 3395 | 57,187 | 28,184 | 4781 | 12,301 | 3631 |
| County Income per capita growth | 28.65 | 18.6 | −42.54 | 341.19 | 29.56 | 20.26 | −42.54 | 341.19 | 26.39 | 13.40 | −12.70 | 134.04 |
| County Employment, 2000 | 12,485 | 12,802 | 294 | 95,004 | 8634 | 9660 | 294 | 89,957 | 22,073 | 14,525 | 436 | 95,004 |
| County Employment growth | 4.00 | 12.89 | −35.86 | 170.11 | 3.45 | 13.18 | −35.86 | 170.11 | 5.36 | 12.05 | −24.68 | 94.77 |
| Amenity Score | −0.05 | 2.23 | −6.40 | 11.15 | −0.10 | 2.17 | −6.40 | 8.27 | 0.06 | 2.38 | −6.10 | 11.15 |
| Bank Deposits per capita,2005 | 14,320 | 8662 | 390 | 219,273 | 14,451 | 6957 | 390 | 60,109 | 13,994 | 11,890 | 1694 | 219,273 |
| Share of Owner Occupied Houses, 2000 | 0.84 | 0.10 | 0.23 | 0.97 | 0.82 | 0.10 | 0.23 | 0.97 | 0.87 | 0.08 | 0.38 | 0.97 |
| Median House Value, 2000 | 72,063 | 36,067 | 20,100 | 750,000 | 68,784 | 37,091 | 20,100 | 750,000 | 80,228 | 31,976 | 24,900 | 369,100 |
| Share of pop residing in rural, 2000 | 0.71 | 0.25 | 0.06 | 1.00 | 0.78 | 0.23 | 0.06 | 1.00 | 0.53 | 0.22 | 0.07 | 1.00 |
| Self-Employment Rate, 2000 | 0.89 | 3.56 | 0.00 | 81.51 | 1.05 | 3.86 | 0.01 | 81.51 | 0.52 | 2.64 | 0.00 | 49.38 |
| Share of pop with BA+, 2000 | 0.09 | 0.04 | 0.03 | 0.44 | 0.09 | 0.04 | 0.03 | 0.44 | 0.10 | 0.04 | 0.04 | 0.32 |
| Share of pop with HS, 2000 | 0.41 | 0.06 | 0.14 | 0.57 | 0.41 | 0.06 | 0.19 | 0.57 | 0.39 | 0.06 | 0.14 | 0.54 |
| Employment-to-pop Ratio, 2000 | 0.51 | 0.14 | 0.13 | 2.79 | 0.50 | 0.14 | 0.13 | 2.04 | 0.54 | 0.15 | 0.19 | 2.79 |
| Distance to nearest metro | 1.00 | 0.64 | 0.24 | 4.34 | 1.03 | 0.68 | 0.25 | 4.34 | 0.94 | 0.54 | 0.24 | 3.82 |
| Nonmetro*Amenityscore | −0.052 | 2.231 | −6.40 | 11.15 | −0.097 | 2.167 | −6.40 | 8.27 | 0.060 | 2.380 | −6.10 | 11.15 |
References
- Chandra, S. A test of the regional growth-instability frontier using state data. Land Econ. 2002, 78, 442–462. [Google Scholar] [CrossRef]
- Lande, P. Regional industrial structure and economic growth and instability. J. Reg. Sci. 1994, 34, 343–360. [Google Scholar] [CrossRef]
- Spelman, W. Growth, stability, and the urban portfolio. Econ. Dev. Q. 2006, 20, 299–315. [Google Scholar] [CrossRef]
- Low, S.A.; Weiler, S. Employment Risk, Returns, and Entrepreneurship. Econ. Dev. Q. 2012, 26, 238–251. [Google Scholar] [CrossRef]
- Markowitz, H. Portfolio Selection. J. Financ. 1952, 7, 77–91. [Google Scholar]
- Acs, Z.; Armington, C.; Zhang, T. The determinants of new-firm survival across regional economies: The role of human capital stock and knowledge spillover. Pap. Reg. Sci. 2007, 86, 367–391. [Google Scholar] [CrossRef]
- Ciccone, C.; Hall, R.E. Productivity and the density of economic activity. Am. Econ. Rev. 1996, 86, 54–70. [Google Scholar]
- Kangasharju, A.; Pekkala, S. The role of education in self-employment success in Finland. Growth Chang. 2002, 33, 216–237. [Google Scholar] [CrossRef]
- Audretsch, D.B.; Mahmoon, T. New firm survival: New results using a hazard function. Rev. Econ. Stat. 1995, 77, 97–103. [Google Scholar] [CrossRef]
- Audretsch, D.B.; Keilbach, M.C.; Lehman, E.E. Entrepreneurship and Economic Growth; Oxford University Press: Oxford, UK, 2006. [Google Scholar]
- Christie, T.; Sjoquist, D. New Business Survival in Georgia: Exploring the Determinants of Survival Using Regional Level Data. Growth Chang. 2012, 43, 110–142. [Google Scholar] [CrossRef]
- Bates, T. A comparison of franchise and independent small business survival rates. Small Bus. Econ. 1995, 7, 377–388. [Google Scholar] [CrossRef]
- Cooper, A.C.; Woo, C.Y.; Dunkelberg, W.C. Entrepreneurship and the initial size of firms. J. Bus. Ventur. 1989, 4, 317–332. [Google Scholar] [CrossRef]
- Bruderl, J.; Preisendorfer, P.; Ziegler, R. Survival chances of newly founded business organizations. Am. Sociol. Rev. 1992, 57, 227–242. [Google Scholar] [CrossRef]
- Dyke, L.S.; Fisher, E.M.; Reuber, A.R. An inter-industry examination of the impact of owner experience on firm performance. J. Small Bus. Manag. 1992, 30, 72. [Google Scholar]
- Peña, I. Business Incubation Centers and New Firm Growth in the Basque County. Small Bus. Econ. 2004, 22, 223–236. [Google Scholar] [CrossRef]
- Keasy, K.; Watson, R. The state of the art of small business failure prediction: Achievements and prognosis. Int. Small Bus. J. 1991, 9, 11–29. [Google Scholar] [CrossRef]
- Wicker, A.W.; King, J.C. Employment, ownership and survival in microbusiness: A study of new retail and service establishments. Small Bus. Econ. 1989, 1, 137–152. [Google Scholar] [CrossRef]
- Keeble, D.; Walker, S. New firms, small firms and dead firms: Spatial patterns and determinants in the United Kingdom. Reg. Stud. 1994, 28, 411–427. [Google Scholar] [CrossRef]
- Conroy, M. Alternative strategies for regional industrial diversification. J. Reg. Sci. 1974, 14, 31–46. [Google Scholar] [CrossRef]
- Bunten, D.; Weiler, S.; Thompson, E.; Zahran, S. Entrepreneurship, Information, and Growth. J. Reg. Sci. 2015, 55, 560–584. [Google Scholar] [CrossRef] [PubMed] [Green Version]
- Williams, N.; Vorley, T.; Keetikidis, P. Economic Resilience and Entrepreneurship: A case study of the Theessaloniki City Region. Local Econ. 2013, 28, 399–415. [Google Scholar] [CrossRef]
- Williams, N.; Vorley, T. Economic Resilience and Entrepreneurship: Lessons from the Sheffield City Region. Entrep. Reg. Dev. 2014, 26, 257–281. [Google Scholar] [CrossRef]
- Cowling, M.; Weixi, L.; Ledger, A.; Zhang, N. What really happens to small and medium-sized enterprises in a global economic recession? UK evidence on sales and job dynamics. Int. Small Bus. J. 2015, 33, 488–513. [Google Scholar] [CrossRef] [Green Version]
- Martin, R.L. The Roepke lecture in economic geography—Rethinking regional path dependence: Beyond lock-in to evolution. Econ. Geogr. 2010, 86, 1–27. [Google Scholar] [CrossRef]
- Glaeser, E. Reinventing Boston: 1630–2003. J. Econ. Geogr. 2005, 5, 119–153. [Google Scholar] [CrossRef] [Green Version]
- Holling, C. Engineering resilience versus ecological resilience. In Engineering within Ecological Constraints; Schulze, P.C., Ed.; National Academies Press: Washington, DC, USA, 1996; pp. 31–43. [Google Scholar]
- Hill, E.; Clair, T.; Wial, H.; Wolman, H.; Atkins, P.; Blumenthal, P.; Ficenec, S.; Fiedhoff, A. Economic shocks and regional economic resilience. In Urban and Regional Policy and Its Effects: Building Resilient Regions; Paper to Conference; Brookings Institution Press: Washington, DC, USA, 2010; pp. 20–21. [Google Scholar]
- Martin, R. Regional economic resilience, hysteresis and recessionary shocks. J. Econ. Geogr. 2012, 12, 1–32. [Google Scholar] [CrossRef]
- Bristow, G.; Healy, A. Regional resilience: An agency perspective. Reg. Stud. 2013, 48, 923–925. [Google Scholar] [CrossRef]
- Martin, R.; Sunley, P. ON the notion of regional economic resilience: Conceptualization and explanation. J. Econ. Geogr. 2014. [Google Scholar] [CrossRef] [Green Version]
- Mishel, L.; Gould, E.; Bivens, J. Wage Stagnation in Nine Charts; Economic Policy Institute: Washington, DC, USA, 2015. [Google Scholar]
- The Productivity-Pay Gap, August 2018. Economic Policy Institute. Available online: https://www.epi.org/productivity-pay-gap/ (accessed on 14 October 2019).
- Alon, T.; David, B.; Dent, R.; Pugsley, B. Older and Slower: The Startup Deficit’s Lasting Effects on Aggregate Productivity Growth. J. Monet. Econ. 2018, 93, 68–85. [Google Scholar] [CrossRef] [Green Version]
- Fujita, S. Declining Labor Turnover and Turbulence. J. Monet. Econ. 2018, 99, 1–19. [Google Scholar] [CrossRef] [Green Version]
- Bureau of Labor Statistics. The Recession of 2007–2009. Bureau of Labor Statistics. Available online: https://www.bls.gov/spotlight/2012/recession/pdf/recession_bls_spotlight.pdf (accessed on 23 October 2019).
- Longhi, S.; Nijkamp, P.; Poot, H.J. Meta-Analysis of empirical evidence on the labour market: Impacts of immigration. Rég. Dév. 2008, 27, 161–191. [Google Scholar]
- Robertson, A.; Tracy, S. Health and productivity of older workers. Scand. J. Work Environ. Health 1998, 24, 85–97. [Google Scholar] [CrossRef] [PubMed] [Green Version]
- Lee, N. Grim down South? The determinants of unemployment increase in British cities in the 2008–2009 recession. Reg. Stud. 2014, 48, 1761–1778. [Google Scholar] [CrossRef]
- Kitsos, A.; Bishop, P. Economic resilience in Great Britain: The crisis impact and its determining factors for local authority districts. Ann. Reg. Sci. 2018, 60, 329–347. [Google Scholar] [CrossRef] [Green Version]
- Bartik, T.J.; Sotherland, N. Realistic Local Job Multipliers; Policy Brief; W.E. Upjohn Institute for Employment Research: Kalamazoo, MI, USA, 2019. [Google Scholar] [CrossRef] [Green Version]
- Kliesen, K.L. The 2001 Recession: How Was It Different and What Developments May Have Caused It? Federal Reserve Bank of St. Louis Review: St. Louis, MO, USA, 2003; pp. 23–38. [Google Scholar] [CrossRef] [Green Version]
- Saiz, A. The Geographic Determinants of Housing Supply. Q. J. Econ. 2010, 125, 1253–1296. [Google Scholar] [CrossRef] [Green Version]
- Kalleberg, A.L.; Wachter, T.M. The U.S. Labor Market During and After the Great Recession: Continuities and Transformations. RSF Russell Sage Found. J. Soc. Sci. 2017, 3, 1–19. [Google Scholar]
- Fernald, J.; Hall, R.; Stock, J.; Watson, M. The Disappointing Recovery in U.S. Output after 2009; FRBSF Economic Letter, Research from Federal Reserve Bank of San Francisco: San Francisco, CA, USA, 2018. [Google Scholar]
- Abbasi, S.; Hollman, K. Turnover: The Real Bottom Line. Public Pers. Manag. 2000, 29, 333–342. [Google Scholar] [CrossRef]
- Autor, D.H.; Dorn, D.; Hanson, G.H. The China Syndrome: Local Labor Market Effects of Import Competition in the United States. Am. Econ. Rev. 2013, 103, 2121–2168. [Google Scholar] [CrossRef] [Green Version]
- Ebenstein, A.; Harrison, A.; McMillan, M.; Phillips, S. Estimating the Impact of Trade and Offshoring on American Workers Using the Current Population Surveys. Rev. Econ. Stat. 2014, 96, 581–595. [Google Scholar] [CrossRef]
- Connaughton, J.E.; Madsen, R.A. Regional Implications of the 2001 recession. Ann. Reg. Sci. 2009, 43, 491–507. [Google Scholar] [CrossRef]
- Capello, R.; Caragliu, A.; Fratesi, U. Spatial heterogeneity in the costs of the economic crisis in Europe: Are cities sources of regional resilience? J. Econ. Geogr. 2015, 14, 951–972. [Google Scholar] [CrossRef]
- Connaughton, J.E.; Madsen, R.A. U.S. State and Regional Economic Impact of the 2008/2009 Recessio. J. Reg. Anal. Policy. 2012, 42, 177–187. [Google Scholar]
Figure 1.
Quits, and layoffs and discharges, 2000–2014 (Seasonally Adjusted, 2000s). Source: Bureau of Labor Statistics, Jobs Openings and Labor Turnover Survey dataset.
Figure 1.
Quits, and layoffs and discharges, 2000–2014 (Seasonally Adjusted, 2000s). Source: Bureau of Labor Statistics, Jobs Openings and Labor Turnover Survey dataset.

Figure 2.
County WSE Risk and Return, 1996–2005.

Table 1.
Test for U-shaped risk–return trade-off in counties.
| 1996–2005 | 2000–2008 | |||
|---|---|---|---|---|
| Estimate | Std Error | Estimate | Std Error | |
| Constant | 0.028 *** | 0.0003 | 0.025 *** | 0.0003 |
| Growth | −0.355 *** | 0.0226 | −0.219 *** | 0.0205 |
| Growth Squared | 10.5 *** | 0.412 | 11.5 *** | 0.397 |
| n | 3024 | 3024 | ||
| Log-likelihood | 8264.07 | 8283.7 | ||
*** p < 0.01.
Table 2.
Summary results of the WSE portfolio for new business survival rates in 2010.
| Survival Rate 2010 | |||||
|---|---|---|---|---|---|
| All | Metro | Nonmetro | Towns | Micro | |
| WSE-Risk, 1996–2005 | 0.151 | 0.365 ** | 0.0292 | −0.127 | 0.411 |
| (0.1070) | (0.1410) | (0.1380) | (0.1670) | (0.2500) | |
| WSE-Growth, 1996–2005 | 0.279 * | 0.435 * | 0.313 | 0.254 | 0.324 |
| (0.1560) | (0.2370) | (0.1910) | (0.2290) | (0.3440) | |
| WSE-Growth Squared 1996–2005 | −2.466 | −5.491 * | −5.013 | −3.966 | −9.631 |
| (2.4300) | (2.6680) | (3.9680) | (4.7190) | (7.3330) | |
| WSE-Risk, 1997–2006 | 0.103 | 0.375 ** | −0.056 | −0.238 | 0.439 |
| (0.1030) | (0.1200) | (0.1380) | (0.1680) | (0.2420) | |
| WSE-Growth, 1997–2006 | 0.343 * | 0.780 *** | 0.306 | 0.305 | 0.0807 |
| (0.1660) | (0.2200) | (0.2090) | (0.2470) | (0.3910) | |
| WSE-Growth Squared, 1997–2006 | −3.132 | −12.37 *** | −1.621 | −0.551 | −9.305 |
| (2.6610) | (2.8730) | (3.9020) | (4.7150) | (6.8790) | |
* p < 0.1, ** p < 0.05, *** p < 0.01; Standard errors are in parenthesis.
Publisher’s Note: MDPI stays neutral with regard to jurisdictional claims in published maps and institutional affiliations. |
© 2021 by the authors. Licensee MDPI, Basel, Switzerland. This article is an open access article distributed under the terms and conditions of the Creative Commons Attribution (CC BY) license (https://creativecommons.org/licenses/by/4.0/).
Share and Cite
MDPI and ACS Style
Gulati, B.; Weiler, S. Risk, Recessions, and Resilience: Towards Sustainable Local Labor Markets through Employment Portfolio Analysis. Sustainability 2021, 13, 7926. https://0-doi-org.brum.beds.ac.uk/10.3390/su13147926
AMA Style
Gulati B, Weiler S. Risk, Recessions, and Resilience: Towards Sustainable Local Labor Markets through Employment Portfolio Analysis. Sustainability. 2021; 13(14):7926. https://0-doi-org.brum.beds.ac.uk/10.3390/su13147926
Chicago/Turabian StyleGulati, Bharman, and Stephan Weiler. 2021. "Risk, Recessions, and Resilience: Towards Sustainable Local Labor Markets through Employment Portfolio Analysis" Sustainability 13, no. 14: 7926. https://0-doi-org.brum.beds.ac.uk/10.3390/su13147926
Note that from the first issue of 2016, this journal uses article numbers instead of page numbers. See further details here.