Article

Links between Climate Change Knowledge, Perception and Action: Impacts on Personal Carbon Footprint

1
Cátedra de Ética Ambiental, Departamento de Geología, Geografía y Medio Ambiente, Universidad de Alcalá, 28801 Alcalá de Henares, Spain
2
Departamento de Geología, Geografía y Medio Ambiente, Universidad de Alcalá, 28801 Alcalá de Henares, Spain
3
Departamento de Ciencias de la Vida, Universidad de Alcalá, 28801 Alcalá de Henares, Spain
*
Author to whom correspondence should be addressed.
Sustainability 2021, 13(14), 8088; https://0-doi-org.brum.beds.ac.uk/10.3390/su13148088
Submission received: 7 June 2021 / Revised: 11 July 2021 / Accepted: 12 July 2021 / Published: 20 July 2021
(This article belongs to the Section Air, Climate Change and Sustainability)

Abstract

:
The current understanding of determinants of climate action and mitigation behaviour is largely based on measures of climate change including concerns, attitudes and beliefs. However, few studies have shown the actual effects of external and internal drivers on citizens’ lifestyles related to climate change, particularly in terms of their carbon footprint (CF). A questionnaire (N = 845) assessing the impact of potential explanation factors for personal CF was carried out in Spain. The study showed the importance of better understanding the factors affecting citizen’s consumption and climate change mitigation policies. Internal factors were not very explicative. Knowledge was linked to clothing and perceived commitment to food, with both sectors being more directly linked to personal choices than other CF sections. Both accounted for 40% of personal emissions. Frequency of action was not shown to be significantly related to any CF section. External factors, such as income, level of studies, age and type of work, were found to be more important than internal drivers in explaining personal CF, particularly type of work, age and income, which were linked to all CF sectors but household energy. Sex was highly associated to clothing, but also significant for transport. Political orientation was not found to be linked to any section of personal CF.

1. Introduction

In spite of the scientific consensus on climate change (CC) [1] and the extent of international agreement on this topic [2], public debate on the relevance and urgency of the problem is still present on media and social networks [3,4]. As a result, the reductions in national emissions are not ambitious enough to curve the observed trends of the last two decades, while the current CC mitigation policies are far from meeting the ambition of the Paris agreement [5] and the 13rd Sustainable Development Goal (Climate Action). For instance, a recent study indicates that CO2 atmospheric density should be reduced from the current 415 ppm to 350 ppm to recuperate the Earth’s energy balance [6] and avoid further climate destabilization [7]
Reducing GHG emissions implies further efforts being taken not only by governments and private companies, but also by citizens. Different assessments have shown that a high proportion (60–70%) of total emissions are related to individual decisions and personal lifestyles, including household consumption [8,9]. Emphasizing this, several strategies to reduce personal emissions have been suggested in recent decades, including carbon footprinting, carbon offsetting, carbon dieting, Carbon Reduction Action Groups, and Personal Carbon Allowances [10,11,12]. Among these strategies, the calculation of personal carbon footprint (CF) has shown a great potential for extending citizens’ awareness of the impacts of their personal habits in terms of CC mitigation [13,14], and encouraging them to take specific actions to further reduce their footprint. Different CF calculations and databases have been developed in recent years to facilitate a quantitative estimation of personal emissions [13,15,16], and also as a means to evaluate different mitigation policies [17].
However, as occurs in other environmental problems, CC concern and action are not always linked, not even public CC activism and personal change mitigation behaviour [18]. Inconsistent responses and limited actions have been observed in several studies [19]; others have shown relationships between motivations and actions, but these, in many cases, have only a marginal impact on personal emissions [20]. For this reason, a better understanding of the drivers affecting personal CF could greatly benefit CC mitigation policies.
Following the model of Clayton and Myers [21] personal environmental behaviour is explained by a wide set of factors, including external and internal drivers. The external ones refer to physical and socio-economic constraints and benefits, while the internal ones are linked to individual knowledge, values, attitudes and emotions. Previous studies have identified income as the most explicative factor of personal CF, with a higher income associated with higher emissions [21,22,23]. House size has also been found to be related to emissions, with higher per capita emissions for those with lower family sizes [24]. Place of residence (rural or urban location) has an influence in some cases [10,25,26], but not always [27], with influence differing with regard to the various types of emissions (household energy, transport, food, etc.) [23]. Age was found to be closely associated to CF in a sample of the UK population, linked to income and working status, while gender was not found to be relevant [27].
Internal factors associated with personal CF should be linked to the knowledge, values, emotions and perceptions of individuals towards the environment, and particularly towards CC. These drivers have been less explored than the external ones, although different environmental psychologists consider them to be more influential, particularly when affecting curtailed behaviours [21,28,29]. Previous studies have shown that knowledge of CC correlates well with higher concern and positive attitudes towards the climate [30]. Closely related to knowledge of CC is confidence that CC is currently occurring and is mainly caused by anthropogenic actions. Scepticism about CC science is identified as a significant barrier to public engagement [4]. The influence of a perceived social consensus about CC also has relevant impacts on personal opinions and attitudes [3]. On the other hand, a meta-analysis carried out by Van Valkengoed and Steg [30] found a strong correlation between perceived outcome efficacy (the extent to which individuals believe that mitigation actions will be effective) and CC commitment. In the same way, Xiang et al. [31] found a significant relationship between perceived intractability and climate action. This implies that those respondents who considered that CC is either too global to affect them or too great to be affected by their personal efforts tended to be much less involved in climate action than those with higher tractability perceptions. Research has shown that self-transcendent or altruistic values affect personal perceptions of and concern regarding CC; those who report holding altruistic values have higher levels of concern and are more likely to trust science regarding the anthropogenic causes of CC [32,33,34].
Most of the revised literature explaining drivers of CC action aims to understand individuals’ concerns and perceptions, but much less research has been focused on the actual implications of those perceptions on personal behaviour, and particularly on personal CF. On the other hand, previous studies have focused on external factors, with only a few dealing with internal motivations. In this paper, we examine the impacts of internal factors on CC mitigation actions, including knowledge, perception and commitment, using personal CF as an indicator. Since those internal factors are mediated by external drivers, we analyse the cross-correlation between them. The study is based on a sample of the Spanish population, which was interviewed using an internet survey in May 2020. Our initial hypotheses were that people with a better knowledge of CC science, who valued the impact of their personal responsibility on the problem and who had participated in climate actions would have a lower CF than the rest of the sample. We also analysed the role of external factors that mediate these relations, particularly the impact of sex, age, profession, income, place of living and political orientation. Finally, we researched whether explanation variables may change regarding different components of the CF, particularly the two most important factors: Food and Transport.

2. Materials and Methods

2.1. Carbon Footprint Calculator

This survey was carried out within the framework of developing and testing an online Carbon Footprint Observatory “CO2web” (https://www.huellaco2.org/). This CO2 observatory has three main interrelated blocks: the first section presents the scientific basis of CC, the concept of CF and its calculation; the second one compiles data on emissions associated with the main consumption and transport habits of citizens; the third one contains a CF calculator that computes personal emissions (in kg of CO2 equivalent) for the main consumer categories: household energy, transport (car, train, bus, subway), clothing, food and drinks, and others (including tobacco consumption, computers and pets). All CF values are computed in CO2 equivalent units (CO2e) and are based on standard life-cycle assessments, published in scientific sources, mostly peer-reviewed papers (see Burgui-Burgui and Chuvieco [35] for a full description of the CO2 observatory and the associated CF calculator). Emission factors for the Spanish electrical system were taken from the annual average of 2018, provided by the Spanish regulator (https://www.ree.es/, accessed on 12 February 2019).

2.2. Data Collection

An internet survey was conducted by a social studies company, specializing in internet questionnaires. The sample was extracted following a non-random stratified selection, which aimed to represent the whole Spanish population. Sampling strata included sex, age and place of residence, including a quota from their own database of respondents to mimic the whole Spanish population distribution of those strata. The target population was 1000 people, which was recommended by the company experts, based on their previous surveys. Annex I includes a full technical description of the survey.
The questionnaire comprised two blocks. The first one included three groups of questions:
  • Those related to external factors (age, sex, studies, working sector, income level, size of the town of residence, and political orientation);
  • Those related to motivations and perceived connection to nature;
  • Those linked to internal factors: CC knowledge, perception and actions.
The second block of questions referred to the personal consumption of the interviewed persons, including the different categories of the CF calculator. Personal GHG emissions were grouped in five categories: 1. Household energy (including heating and cooling), 2. Transport (including car, train, bus and subway displacements), 3. Food (+drinks), 4. Clothing (+shoes), and 5. Others (including tobacco, electronic devices and pets: cats and dogs). The CF calculator was based on emission ratios computed from peer-reviewed papers and national agencies. The CF estimations were based on quantitative estimations of respondents’ consumption in the five previously indicated categories. To improve the accuracy of the estimations, the interviewed citizens were previously informed that they would need to have detailed data related to their transport journeys or household energy consumption (monthly bills) on hand. For instance, to estimate their car emissions, the questionnaire asked about the size of their car, the total number of km driven during the previous year, fuel type (gasoline, gasoil, natural gas, electric), and average consumption (l/100 km or kW/100 km). The questionnaire asked the respondents to base the estimations on what they did in 2019, to avoid the potential bias introduced by the COVID-19 confinements’ impact on their ordinary habits.

2.3. Selection of Variables

Since we aimed to explain the drivers of CF, the target variable was the estimation of total CF and their five components (household energy, transport, food, clothing and others). The explanatory variables included external and internal factors (Table 1). The former comprised sex, age, level of studies, work activity, income level, town size and political orientation, while the latter involved the knowledge, perception and action of respondents regarding CC. These three aspects were related to the main hypothesis of our analysis, while the former aspects were mediators of those internal factors. More specifically, the following internal variables related to CC were considered:
  • Knowledge. This item aimed to classify respondents based on their understanding of the scientific basis of CC. To do this, two questions were included in the survey. In the first one, respondents were asked to select the main cause of CC from five choices: deterioration of the ozone layer, variations of solar radiation, aerosols, greenhouse gases (GHG) and “Don’t know”. In the second, the respondents were asked to rank the importance of natural factors to CC between 1 (very low) and 5 (very high). From these answers, a synthetic variable was created, named Knowledge. It was binary coded, assigning a code of 1 to those answers that correctly indicated the main cause of CC, while simultaneously considering the importance of natural factors as very low or low, and a code of 2 otherwise;
  • Perception. This included several questions related to the respondents’ self-perception oftheir CC actions, using a Likert scale of five intervals. The questions aimed to estimate their perception of their self-commitment (from very high to very low) and the relationship between their CF and the social norm (from much higher to much lower than national average). Other questions included perception of the responsibility of different agents to mitigate CC, including companies, governments, other countries and each one of us, and the main obstacles they perceived in reducing their CF, including economic, legal, social, and personal aspects. These four questions were summarized into two variables:
    a. 
    Perceived commitment, aimed to link self-reported responsibility and personal CF values. This variable was coded in three categories: 1. highly committed and below average emissions (that is, self-perceived as having a low CF); 2. highly committed and above average (self-perceived as having a medium-high CF); 3. otherwise (no particular commitment to CC);
    b. 
    Perceived intractability, this variable tried to relate CF with the self-perceived efficacy of personal actions to mitigate CC [30], assuming those who were confident in the relevance of personal actions would have a lower CF. This variable was coded as 1 when the respondent indicated that the importance of our personal actions in CC mitigation was high or very high, and 2 (otherwise);
  • Frequency of Action. The respondents were asked to rate, in a Likert scale from 1 (never) to 7 (very frequently), the frequency with which they participated in CC mitigation actions, including actions to reduce transport or consumption, changes in food habits, or being involved in CC-related rallies. This question was also adapted from Xiang et al. [31].

2.4. Analysis

2.4.1. Carbon Footprint and Its Components

Relationships between total CF and its components were explored using correlation and dispersion plots. Of the five components of CF, we focused mainly on transport and food values, as they were the most important factors in our data, and have been identified as the most clearly linked to daily habits and personal decisions [23,36]. In addition, the result of the clustering algorithm was used as the response variable, as it indicated a classification of personal CF values, which was related to different patterns of personal consumption.

2.4.2. Effect of External and Internal Factors

Descriptive statistics were computed to obtain mean and dispersion values of the different response variables (i.e., total CF and its components) and explanatory variables. The main hypothesis required the computation of different confidence tests to verify whether differences in CF values were significant or not. As most of the explanation variables were measured in a nominal or ordinal scale, we selected the Kruskal–Wallis (KW) non-parametric test for most of the comparison tests. The KW metric is defined as:
H = 12 N N + 1 i = 1 m R i 2 n i 3   N + 1
where m is the number of groups, ni the number of cases for group i, Ri the ranking of CF values for group i, and N the total sample size. We selected a confidence level of 0.99 to identify significant differences (p < 0.01).

2.4.3. Relevance of Explanatory Variables

We used two complementary approaches to determine the relative importance of the explanatory variables for CF. The first one aimed to explain the full range of CF variation, using the actual values of CF (total) and its main components (food and transport) as a target variable. The second one was based on the classification of CF groups obtained by the k-means algorithm, which provided a summary of different types of personal CF values and, to some extent, particular lifestyles.
Having two different sets of response variables implies the application of two different set of methods, one directed at continuous variables (CF values) and the other one at categorical variables (CF groups). In both cases, the final goal was to identify the main variables that explained the variation in CF values (first case) or the assignment to CF categories (second case). Since the explanatory variables were measured in categorical and ordinal scales, and most did not comply with normality assumptions, we opted to use the Random Forest (RF) algorithm in both models, which is a non-parametric model widely used in multiple fields [37,38,39]. RF is a recursive partitioning method that creates a collection of decision trees from a random selection of cases. Each tree is built from the training data, choosing a set of input variables by maximizing the interclass divergence of the selected cases. A collection of individual trees forms a “forest” that is trained from a percentage of the input data. The algorithm assigns an unknown case to the most repeated class in the trees’ outputs. The accuracy of the algorithm is computed from cases not used to build the RF model (named “out of bag” (OOB)). In this way, the estimation of error is more accurate.
RF provides descriptive measures that reflect the impact of each variable in terms of both the main effects and interactions [40] and unbalanced size classes in factors [41]. The optimal number of attributes was randomly selected and the optimal node size at each split was adjusted following the specialized literature [42], before being determined for each response variable. For the original CF values, we used the RF regression mode. For the clusters of CF categories, we used the RF classification mode. In both cases, the indicator of variable importance was the mean decrease in accuracy that represents how much the OOB error decreases when each variable is removed [43].
O O B _ M S E = 1 n i = 1 n ( y i y i ¯ O O B ) 2
where y i ¯ O O B is the average prediction for the ith observation from all trees for which the observation was OOB.

3. Results

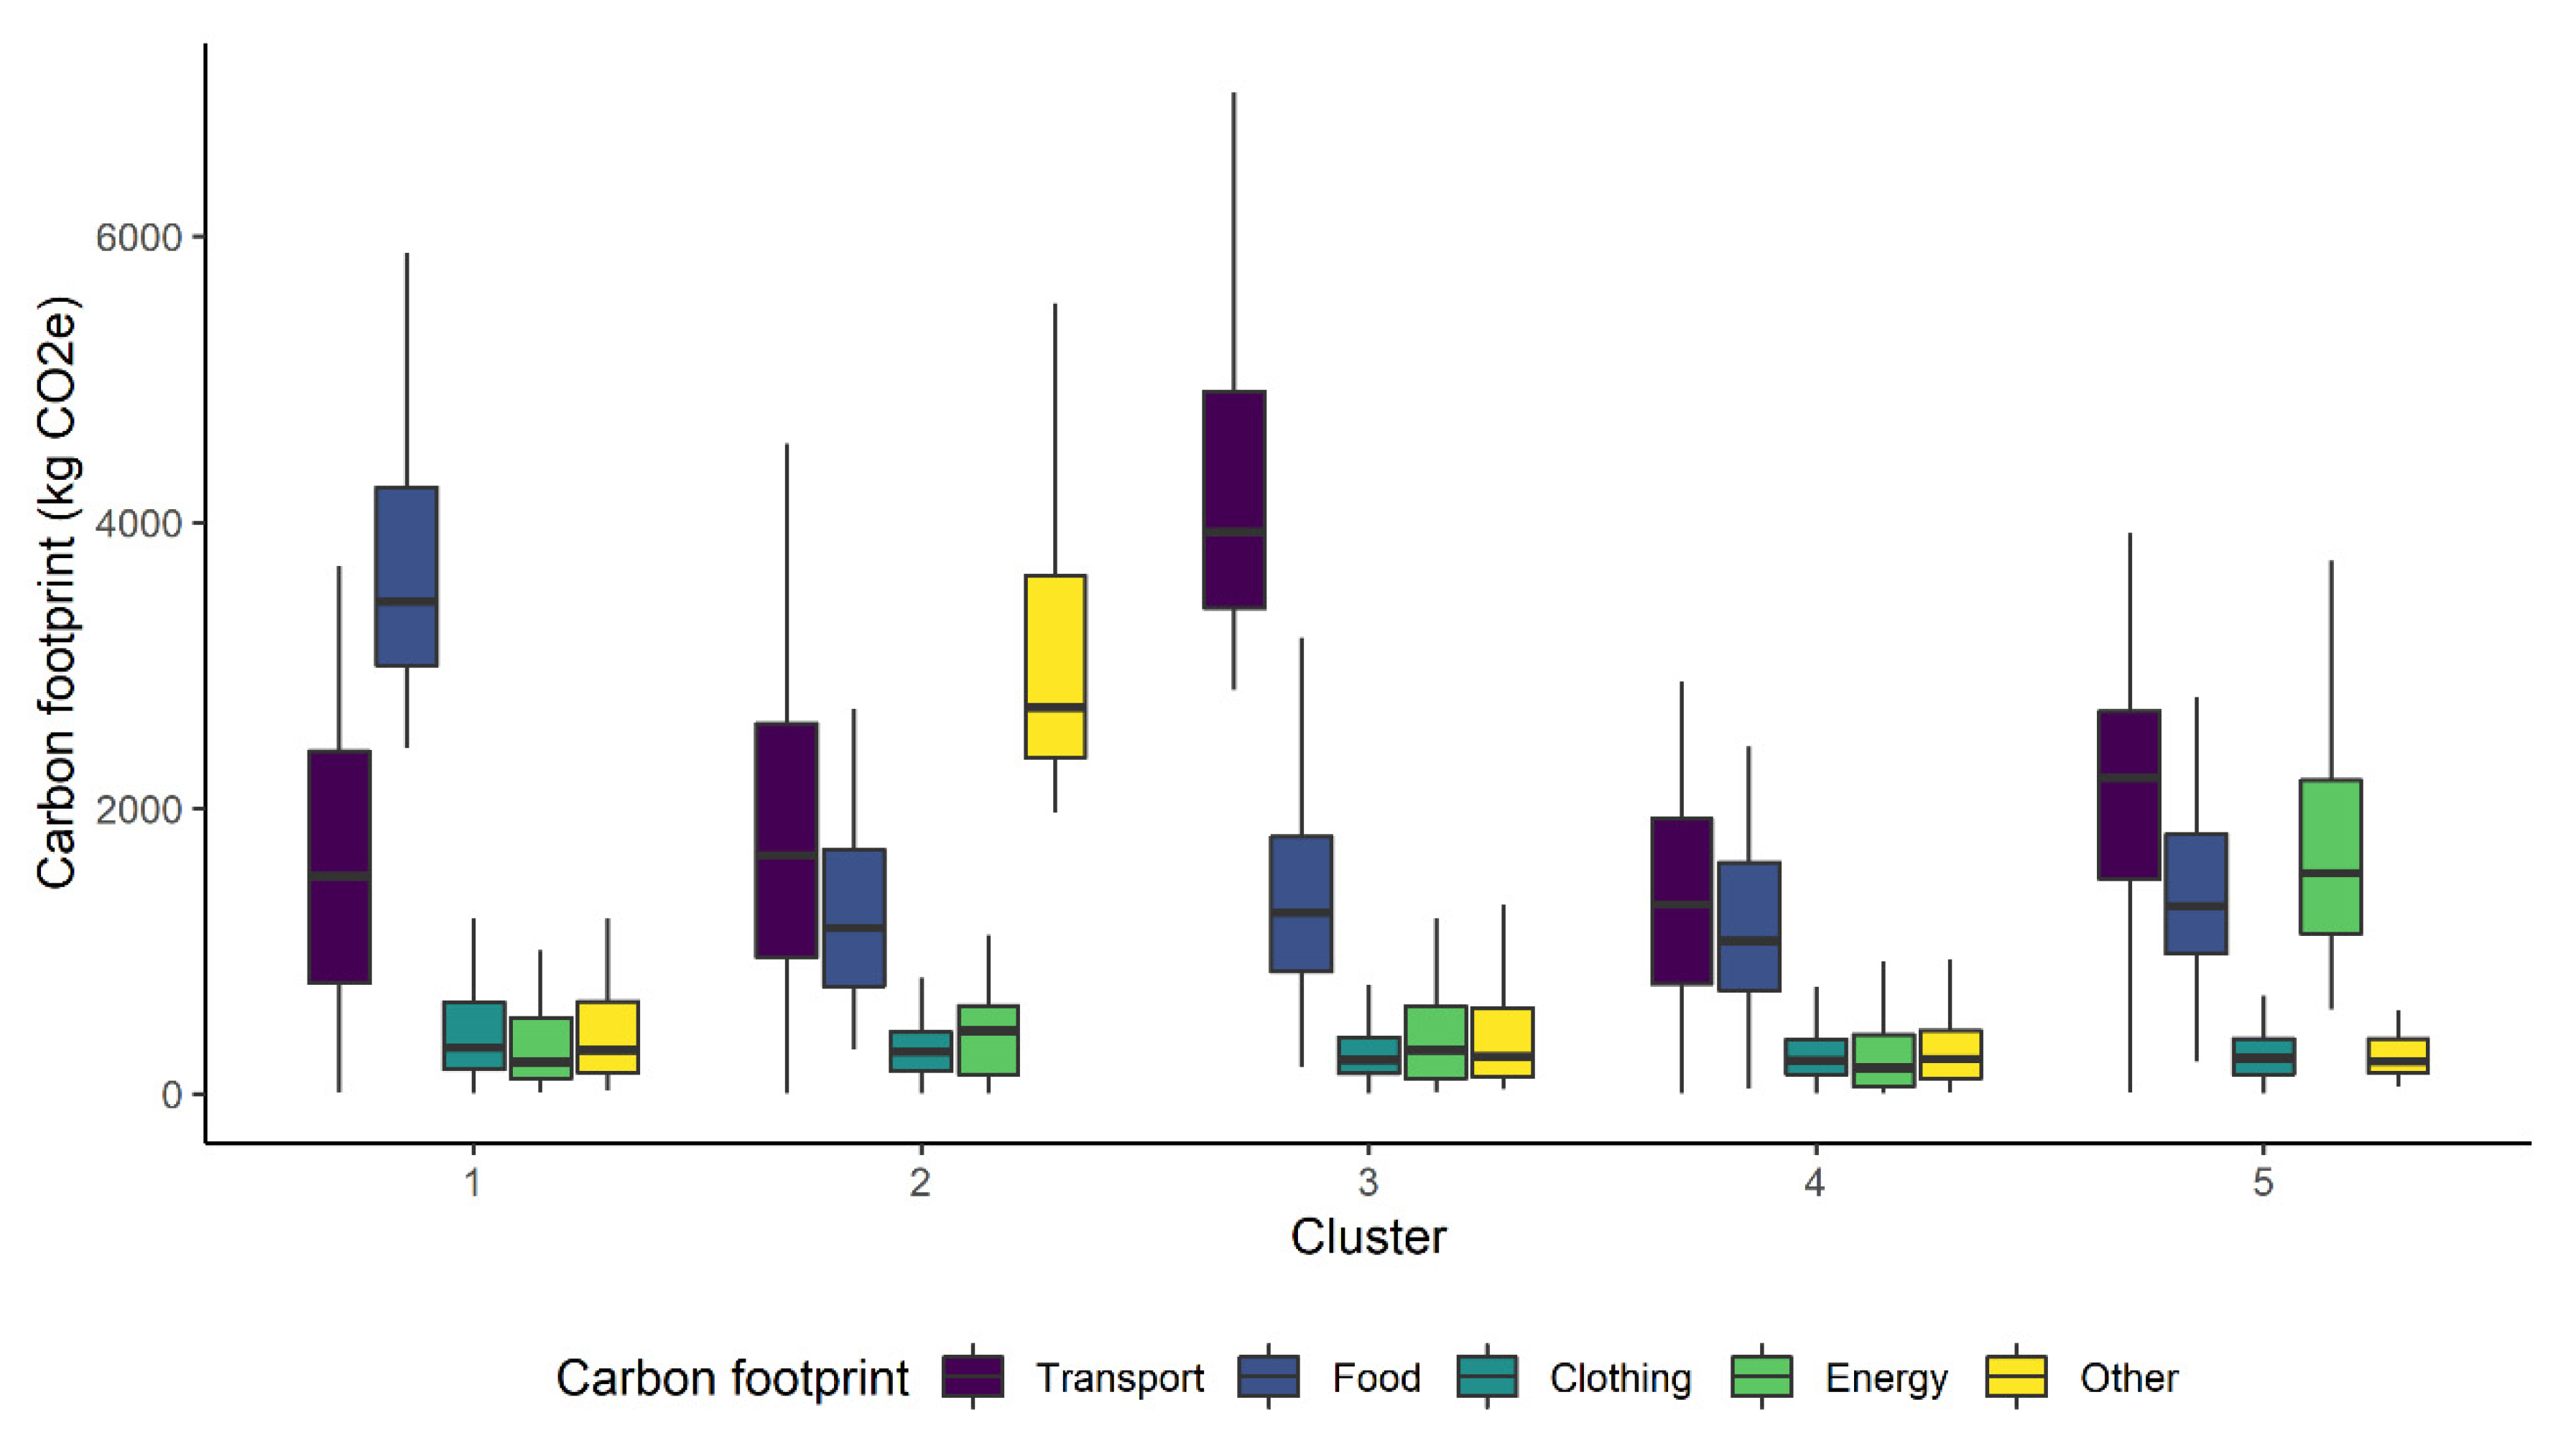
3.1. Average CF Values and Clusters

The mean personal CF of our sample was 5010 kg of CO2e/year. This value was found to be lower than the per capita emission rate of Spain (6861.21 kgCO2e/year in 2019: (https://www.ine.es/jaxi/Datos.htm?path=/t26/p084/base_2010/serie/&file=01004.px, last accessed on 2 March 2021)). It should be noted that our estimation only included consumption emissions (emissions linked to construction or export goods, for instance, were not considered) and population older than 16 years. The main contributor to the meanpersonal emissions value was the transport section, which implied 45% of total emissions (2164 kg). The second one was food, with 33% (1509 kg), which was far greater than household energy consumption (9.25%), clothing (7.35%) or others (11%), with the latter mainly related to emissions from electronic tools and pets (see Table A1 within the Appendix B). The highest correlations between total CF and its components were found for transport (Spearman rs = 0.726) and food (rs = 0.448), with both being highly significant (Table 2). Lower values were observed for household energy, clothing and others, although they were still significant (rs < 0.35). Relationships between the CF components were observed in the case of household energy and transport, and food and clothing, which were significant in both cases, but with low values (rs < 0.158).
Table 3 shows the average CF values for the different groups obtained by automatic clustering (see also Figure A1). They can be described by their main CF component:
  • Group 1 indicated high food emissions, medium to high transport emissions and low emissions from the three remaining CF sectors;
  • Group 2 had particularly high CF values of others and medium to high values for transport and food. This was the less frequent group (6% of cases);
  • Group 3 was characterized by high transport emissions, medium food emissions and low emissions from the remaining sectors;
  • Group 4 indicated mean emission levels for all categories. This was the most populated cluster, with 425 respondents (50.3%);
  • Group 5 included high values for household energy and mean of CF transport and food, while low values for the two remaining sectors.

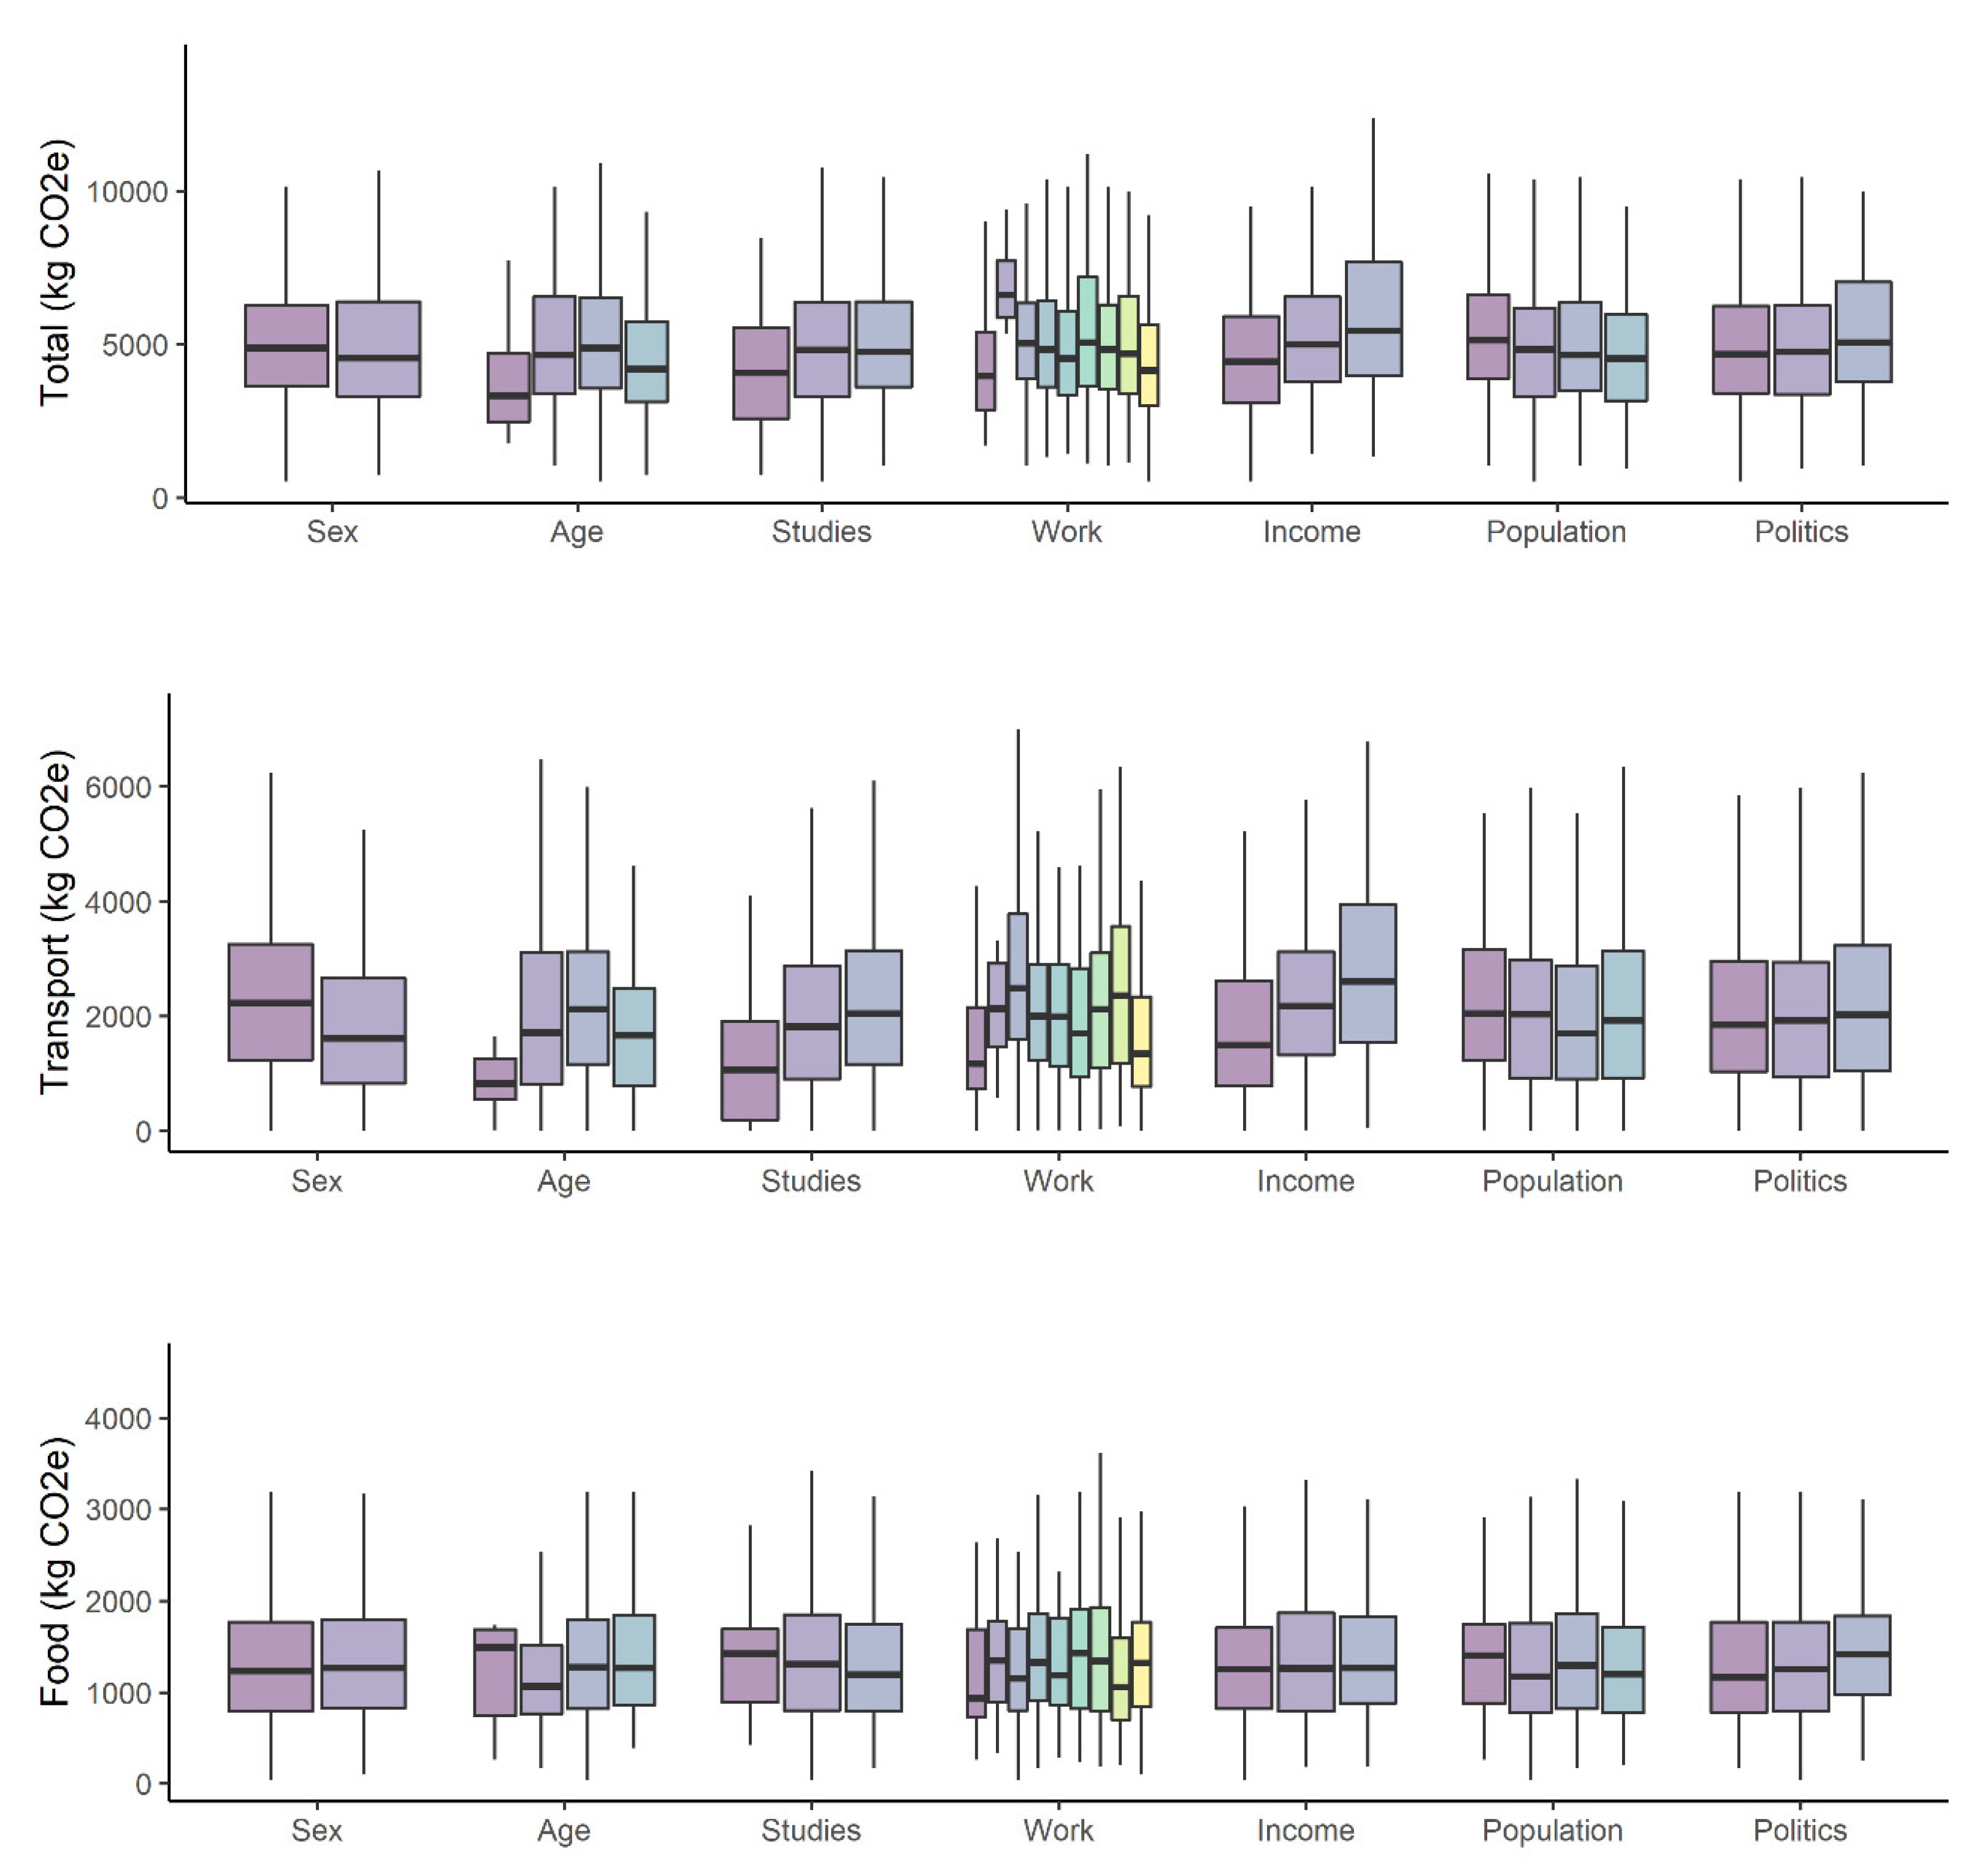
3.2. External Explanation Factors

The influence of external factors on CF values was measured by the Kruskall–Wallis rank differences. KW test values determined which external factors were more closely related to the distribution of CF values (Table 4 and Table A2).
Sex groups had significantly different emissions in terms of household energy, transport, clothing and others. However, a remarkably similar distribution in terms food emissions between sexes was found, with only minor differences in total emissions. The males in our sample consumed more in terms of household energy and transport (Figure 1 and Appendix B Table A1), but they had significantly lower emissions regarding clothing and others than females.
Age implied significant differences in total CF, transport, clothing and others. Transport CF was found to be higher for the intermediate groups, and lower for teenagers (16–17 years) and people above 65 years. However, clothing had higher values for the two younger groups (<30 years), with significantly lower values for those >65 years. Food emissions had fewer significant differences among age groups.
Income was observed to only be directly related to transport CF, with higher values related to higher income, while, for the other components, the relations were not clear, with intermediate values for higher incomes. Study level had a significant association with transport and household energy, with higher values for persons with university degrees. However, this group had a lower CF for food and others. Working activity implied different levels of personal emissions in terms of both the total CF and its components, with the exception of household energy (Table 4). It was observed that students and domestic workers had significantly lower transport and food emissions, while for industrial workers and entrepreneurs, CF values were significantly higher (Figure 1 and Table A1). Total CF was higher for agricultural workers and catering services and lower for students and home workers (Figure 1).
Regarding the size of the town where respondents live, the only significant differences were found in terms of household energy and others, with higher emissions for smaller towns. Transport and food was more equilibrated among town groups.
Finally, political orientation was found to be significantly associated with CF in neither total values nor any of the CF components, although a tendency towards higher values was observed for the more right-wing orientation regarding total CF, food and transport.

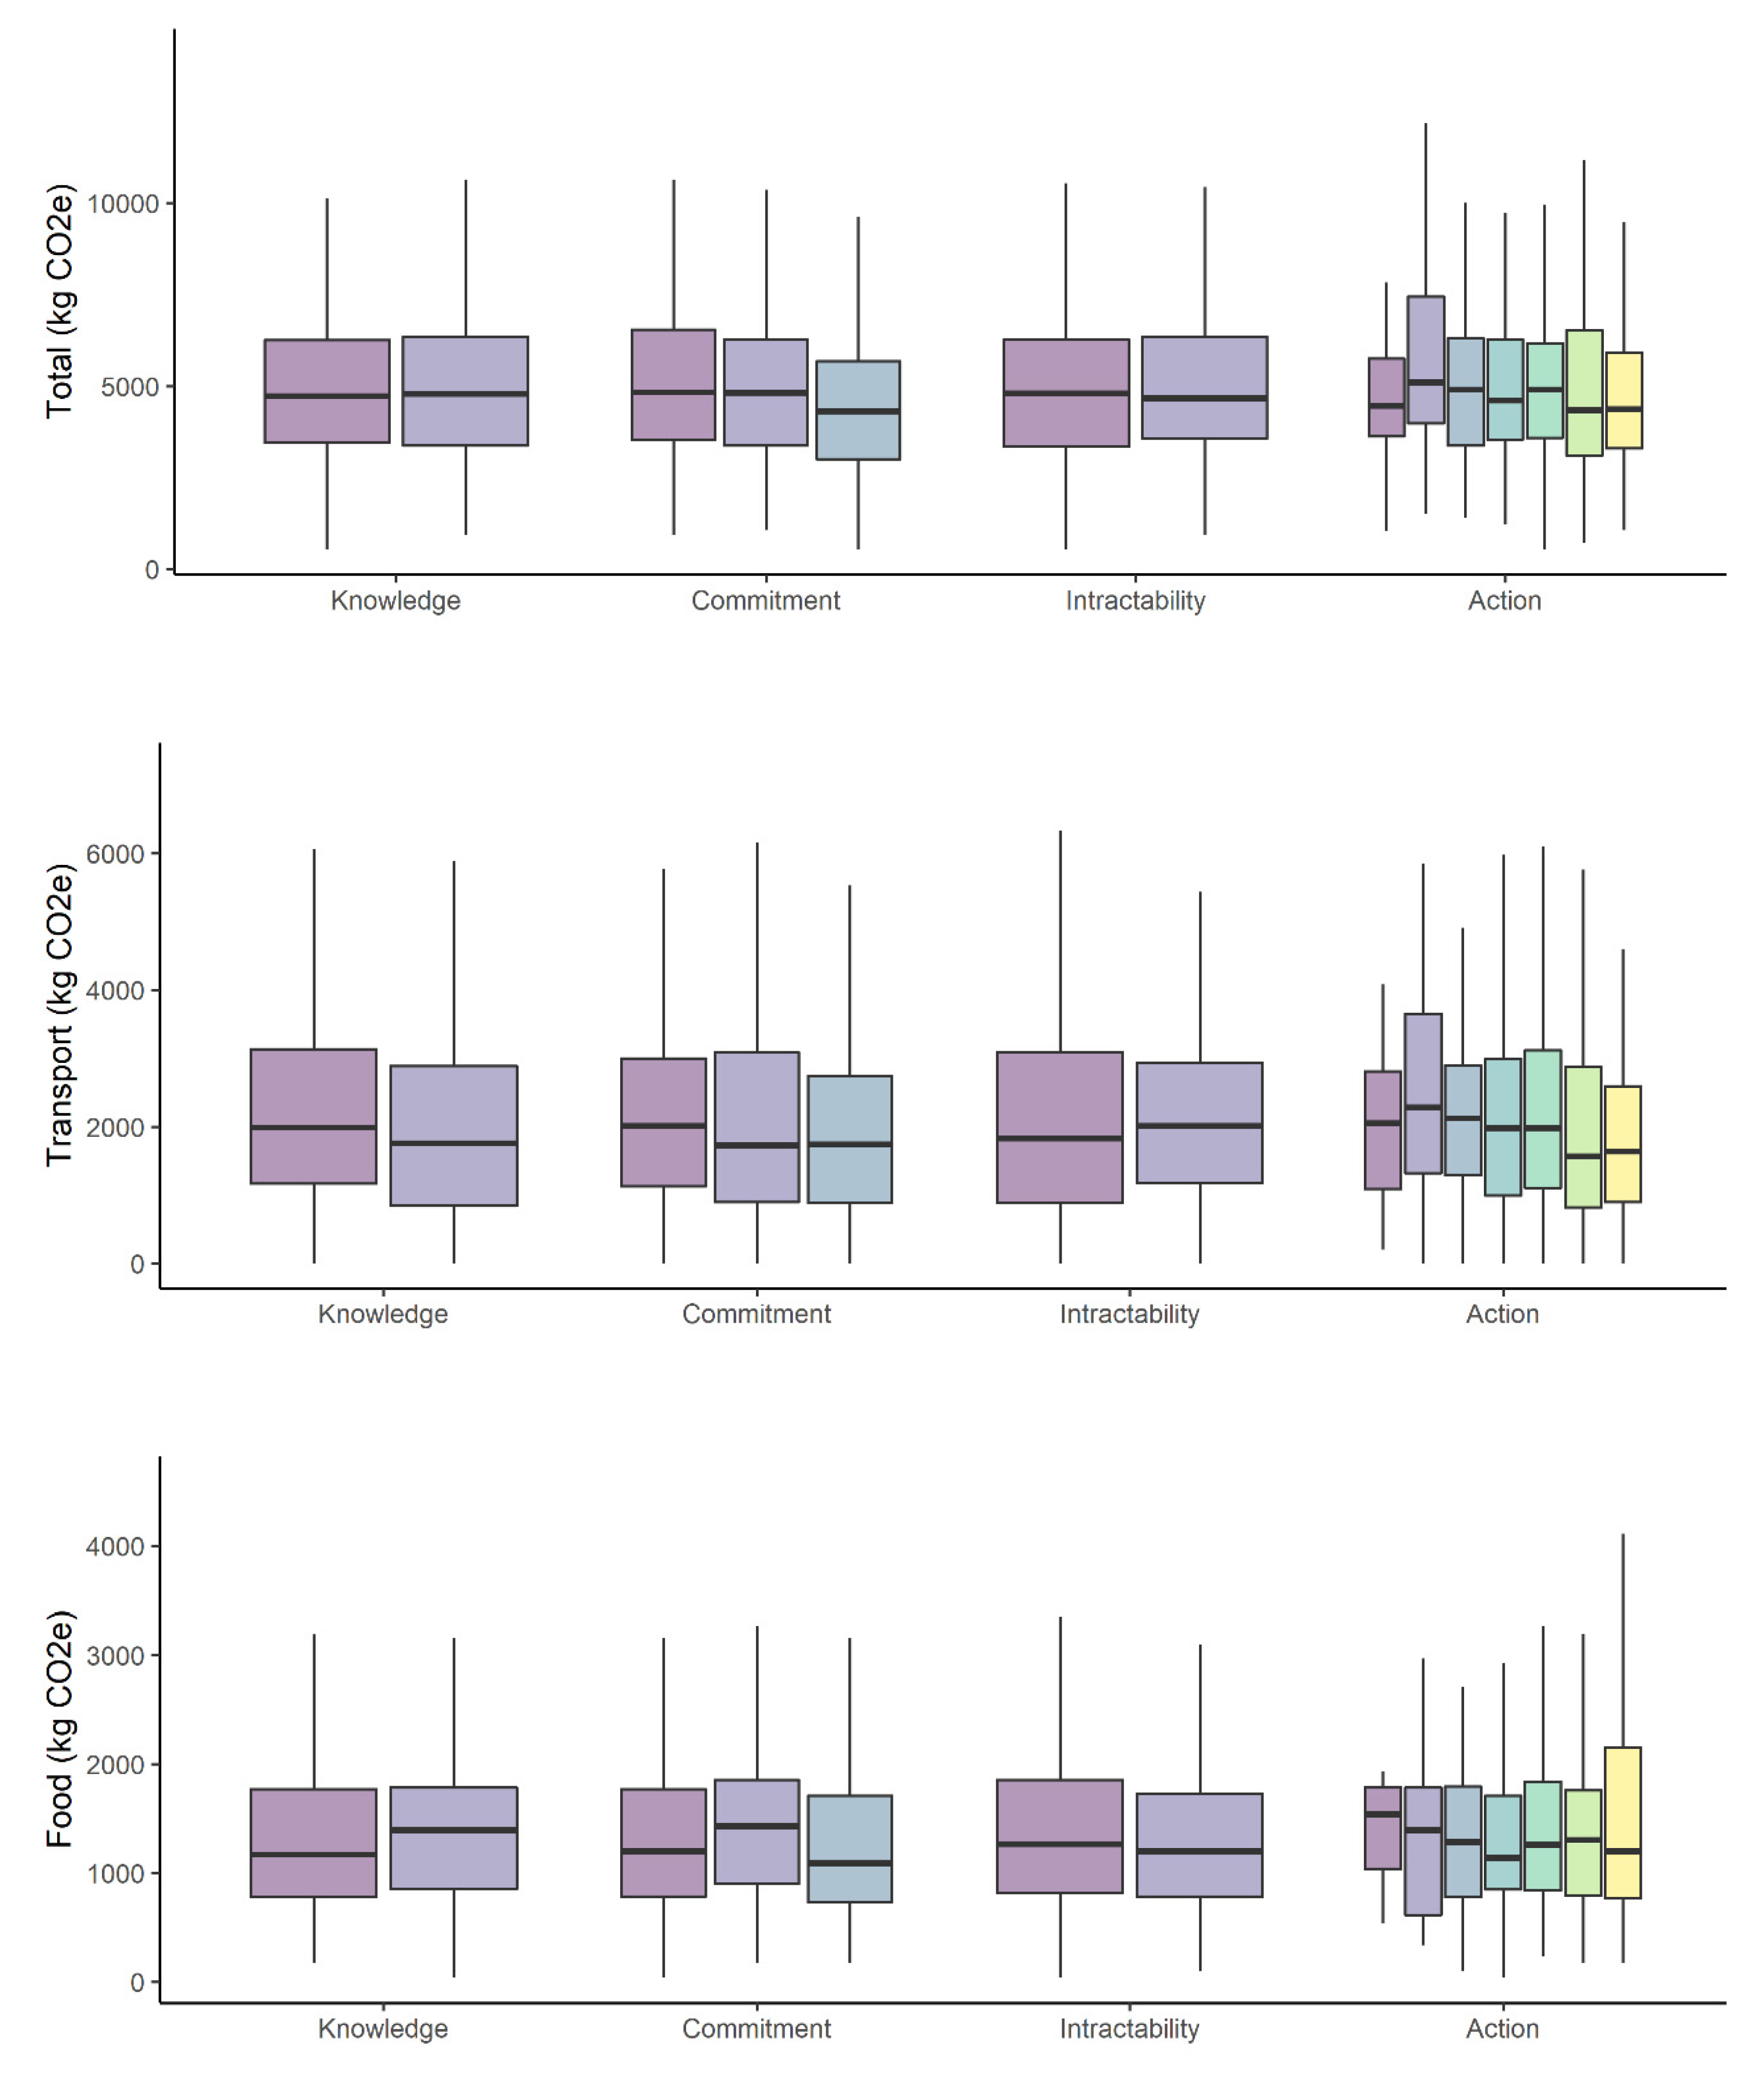
3.3. Internal Explanation Factors

Regarding the internal factors, the KW test provided insights into the driving factors of personal CF. Knowledge about the causes of CC only implied significant differences in clothing CF, but not in total CF values, neither in their main components (Table 4). Although not highly significant, it was observed that respondents with higher knowledge about CC had less emissions in food and clothing than the others, but higher in transport and household energy (Figure 2).
The different levels of perceived personal commitment were found to be significantly related to food CF, while in other CF sections, they showed lower differences (Table 4). The CF values of those self-perceived to be highly committed and with below-average emissions, in fact, had the lowest total CF values, as well as lowest emissions in terms of transport, food and clothing, and the second lowest in terms of household energy (Figure 2 and Table A2). Those self-perceived as having low commitment in fact had the highest emissions for total, transport, household energy, clothing and others, while those self-perceived as with high commitment but with higher than average emissions only had the highest values for food.
Perceived intractability, as indicated by the self-perceived relevance of personal responsibility for CC mitigation, only showed significant differences in energy CF (Table 4). Here, our initial assumptions were confirmed, as emissions from household energy use were lower for those that emphasized the importance of personal actions in CC mitigation. However, in other CF sections, the values were very similar, or even slightly higher, for those who were less concerned about personal responsibility, particularly for food and others.
Finally, the frequency of climate action did not imply significant differences in CF in any of the CF sectors (Table 4 and Figure 2). Considering the trends in this variable, higher emissions were not related to a lower frequency of CC actions, as was expected. In fact, similar emissions regarding transport and food were found for people in both extremes of the action scale: those never participating in any action and those with a high frequency of participation. The lowest values in both CF sections were observed for categories with a medium frequency of CC action (from 3 to 4 in the original Likert scale), indicating a low impact of CC activism on personal lifestyle.

3.4. Factors Driving CF Clusters

Clusters generated from automatic classification of CF values were cross-tabulated with the different external and internal factors to detect significance associations. However, only external factors were found to be significantly (p < 0.01) associated with CF clusters, particularly sex, working activity, income and population (Table A3).
Regarding those external factors, cross-analysis showed that male and higher-income respondents had higher proportions than expected in group 3 (high CF transport, medium CF food and low of the remaining), those with university degrees and people living in small towns (<10 K) had a higher proportion than expected in group 2 (high CF of others, medium to high transport and food), and domestic workers and residents of medium-size towns (50–500 K) were more represented than expected in group 1 (high food CF). However, in most cases, the distribution of the cases among groups was very diverse, with no clear associations with specific categories of explanatory variables.

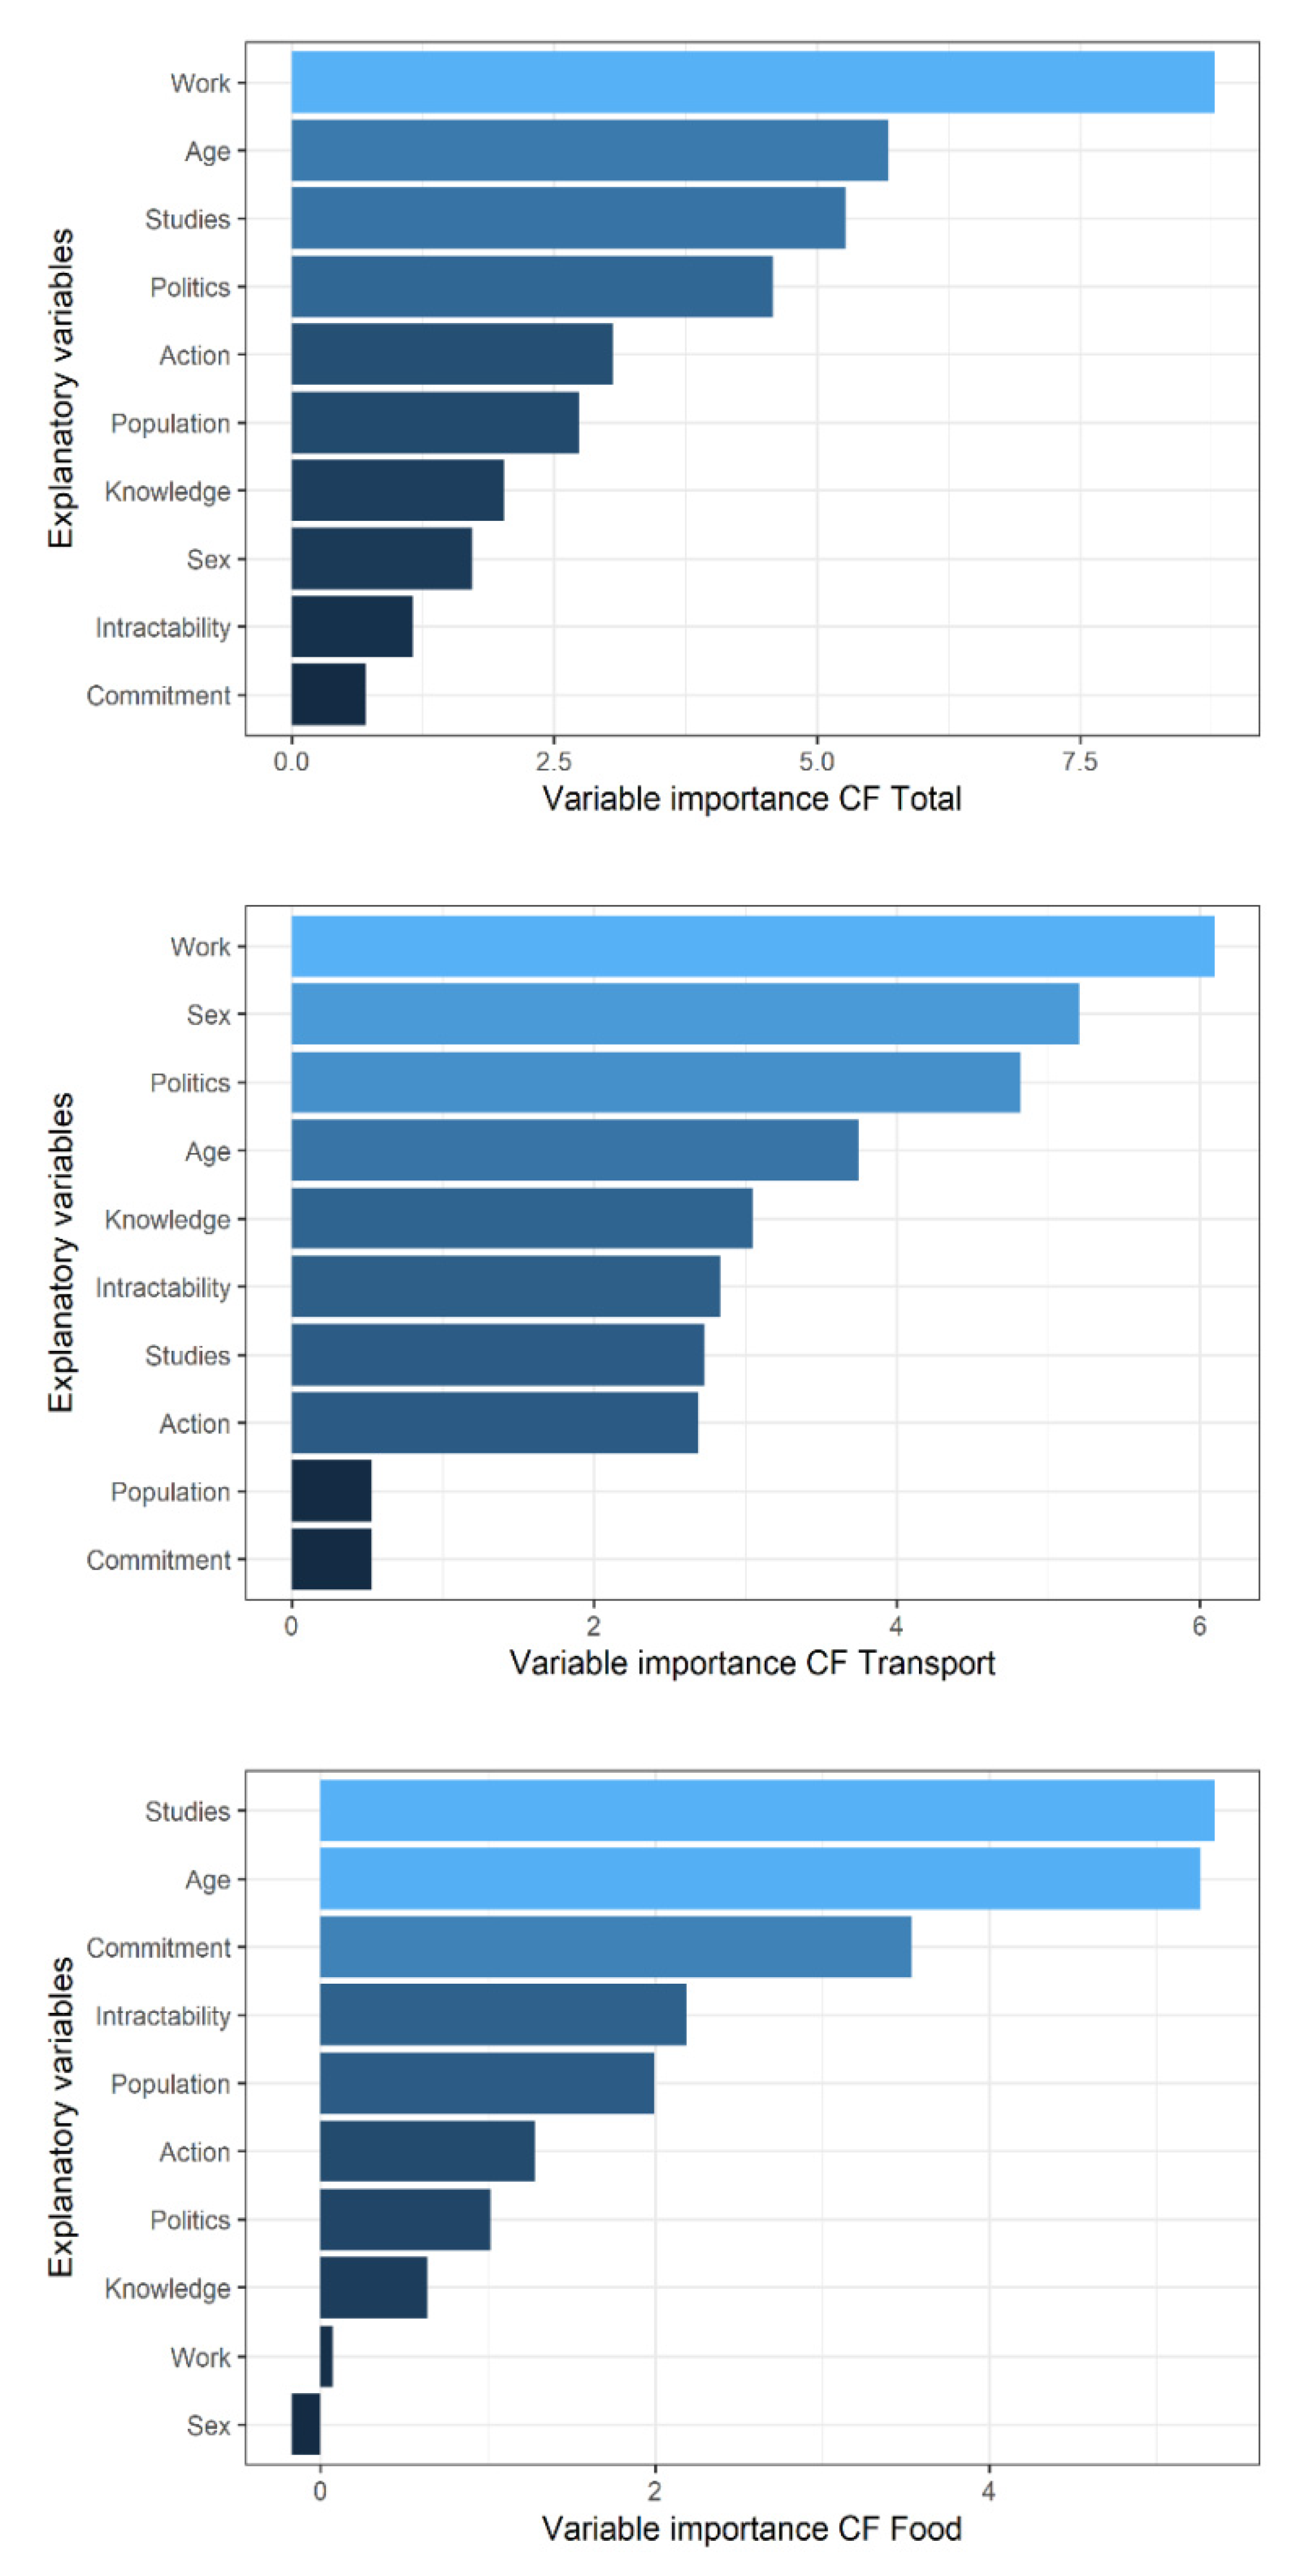
3.5. Global Random Forest Models

We included all external and internal factors in the RF models, with the exception of income, which had a large number of unfilled answers (172). Since this variable was correlated with level of studies (rs = 0.34, p < 0.001), we used the latter variable as an explanatory factor to maintain the total number of cases. We intended to use RF models to identify the most explanatory variables of personal CF values. However, neither the regression nor the categorical RF models provided satisfactory results, with low explanation metrics for both the CF values and the CF clusters, respectively.
We developed RF regression models for the total CF values and the different CF sectors. In all cases, we found only a marginal explanation for the observed CF: 0.87% for total CF, 3.74% for transport CF and 0.18% for food CF. These values implied that neither external nor internal factors provided a good estimation of personal CF. Among the external factors, the accuracy metric for the total CF provided higher values for working activity, age, studies and political orientation, while, of the internal factors, the frequency of action showed the highest explanation power (Figure 3). The main variables explaining transport CF were working activity, sex, politics and age, while for the model of food CF, studies, age and perceived commitment showed the most explanatory power.
The RF classification mode also provided a poor explanation of the CF clusters. The OOB classification error was 0.58 using ten variables and 0.5 using only the two most explicative variables (Action and Work). Besides these two variables, the first model included population, age, perceived intractability, commitment, sex, studies, knowledge and politics. The less explicative variables in the model (the last eight) were rejected in the second model. However, these rejections should be taken with care, considering the low explanation capacity of the model.

4. Discussion

This study has analysed factors affecting personal carbon emissions through a quantitative measurement of personal CF for the main consumption sectors (household energy, transport, food, clothing, others). Although the previous literature has identified potential drivers of consumption impacting CF, only a few have used numerical estimations of personal CF based on detailed emission factors. As explained earlier, different studies have shown the discrepancies between concern and commitment, and even between commitment and personal behaviour [19,44]. Our approach makes it possible to verify whether external and internal factors, such as CC knowledge, perception and action, are really linked to low-carbon lifestyles.
We found that the personal CF of Spanish consumers accounted for an important share of the country’s per capita emissions. With data from 2019, our estimations indicate that 73% of the total GHG emissions were derived from personal consumption. This value was similar to what was estimated by other authors based on census data (72% in the UK, found by [10], and >60% in a sample of 43 countries, found by [9]), although in our case we should consider that only the population older than 16 years participated in the questionnaire.
Regarding the distribution of sectors, personal CF was mainly related to transport and food, which form 78% of total personal emissions. Household energy, clothing and others accounted only for 10% each, approximately. Automatic classification of CF “profiles” included a very large group (covering 50% of cases) with lower-than-average values for all CF sectors, followed by a cluster 3 (with 24% of cases), with high transport CF and average results for the other CF sectors, and two smaller groups (80 cases each) with a high food (group 1) and energy CF (group 5). Finally, a marginal group (with 51 cases) was composed of those respondents with a high CF from others (tobacco, computers, and pets).
In the search for global models that would provide an insight into the most explanatory variables, we have not found any that properly explained overall CF trends, including both quantitative CF values and classified CF groups. Random forest models performed poorly in both cases; therefore, the approaches used to derive global explanatory models should be further studied.
Explanation variables had generally low correlations between them. The exceptions were income and level of education; this was also observed by other authors analysing CF [10,23]
In terms of single relations between CF values and explanatory factors, the Kruskal–Wallis test highlighted the higher importance of external over internal factors, as was also observed in other studies [20]. Total CF was mainly related to age, income and work, with higher emissions for intermediate ages (30–65 years), greater incomes (>3000 €), and agricultural and catering employments, while lower emissions were observed for younger (16–17 years) and older ages (>65 years), lower income (<1500 €), and students and domestic workers. This is in line with previous studies, particularly those relating income and CF [10,22]. Age and work have been less frequently tested, as most CF studies were based on census data, rather than on personal questionnaires [10].
The explanation factors of different CF sectors were quite diverse. Food CF was significantly related to working activity, with higher emissions for agriculture, home, catering and administration workers, and low for students and entrepreneurs. Commitment was also significantly associated with the food CF, following expected trends, with lower values for those self-perceived to be highly committed. However, those that were self-declared to be highly committed but with perceived higher emissions in fact had higher values than those declared to have low commitment. Perception, in this case, parallels the actual values.
Transport CF was related exclusively to external factors, including income, work, age, sex and education, in that order. Following expected trends, lower transport CF values were found for lower incomes and for the two extremes of the age cohorts: young and old respondents. Lower values were also observed for catering and domestic workers, females and students. The size of the residence town only implied significant differences in household energy and others, but not in transport, as was expected, as location is related to accessibility to work and food. Political orientation was not related to any of the CF sectors.
It was observed that the CF sectors more linked to personal decisions, such as food and clothing, were the most closely related to internal factors, although only a few were significant. For instance, CC knowledge only significantly impacted the CF of clothing, which is related to a consumerism mentality, with higher values for those ignoring the basis of CC. Knowledge also impacted food CF, although not significantly, with lower emissions for those who were more informed about CC.
Self-perceived commitment was also associated with food and clothing CF, with significantly lower values for those who were more committed. Other authors have found controversial results regarding the relationship between internal factors and climate behaviour [45], with some showing positive trends and some negative ones.
The self-perception of personal responsibility and impact of personal decisions to solve the problem (perceived intractability) was only found significantly related to household energy, but with low significance, and not with other sectors more related with personal decisions. This finding contradicts previous studies [31], that found significant differences between perceived intractability and climate action, although in that case, the study did not test actual CF indicators.
The frequency of CC actions was not significantly associated with any CF sector. This was particularly surprising, since it was the only variable that indicated actual behaviour, not just concern. However, apparently, the impact of this activity on personal lifestyles is not evident, with very similar values in the CF regarding food or clothing for those with a low and high frequency of activism. A recent study on climate protesters during the 2019 youth rallies showed that climate action does not necessarily affect personal behaviours [18].
The inconsistent relationship between CF values and internal factors confirms other studies that observed uneven relationships between concerns and personal habits, observed in several environmental topics [46], and particularly in terms of CC mitigation [47]. Certainly, concern relies on self-reporting of a value that is widely accepted by society, while actual facts require changes that are much more complex to undertake; therefore, they are not necessarily highly related to objective indicators [48]. This also affects knowledge of CC (and other environmental issues), which is not necessarily related to personal commitment and environmentally friendly lifestyles [49]. In our results, some of the CF sectors may have, in fact, depend little on personal choices, as they are mediated by family or working activities, as is the case for the CF of household energy and transport. However, personal choices are more evident for food and clothing, which form a significant part of the total CF (>40%).

5. Limitations

When interpreting our results, it should be noted that CF values were computed from a CF personal calculator, with all the strengths and limitations that this approach includes. On the positive side, the emission coefficients were estimated from updated scientific references and adapted to Spanish conditions [35]. On the negative side, quantitative estimations of CF require accurate inputs (energy bills, food amounts, transport distances), which are difficult to calculate and rely on the respondent to providing accurate data. Although all respondents were warned about this before starting the interview, we had to remove questionnaires later, as they included very unlikely CF values, using visual and automatic classification methods. The final values included in our analysis seem reasonable, but it was not possible to test their actual accuracy, as the analysis was based on the “bona fide” answers of the respondent. On the other hand, the sample was selected using a statistically designed sample, and included an unbiased representation of the Spanish population above 17 years. Consequently, we are confident the conclusions drawn from our work, which mostly align with previous research, but further studies based on actual CF measurements are necessary to verify some of the results.
Another limitation refers to the date on which the survey was conducted (May 2020). At that time, Spain was confined because of the COVID-19 pandemic; therefore, the consumption habits of the population were very different from ordinary. For this reason, we asked the respondents to base their estimations on data from 2019. In spite of this, some respondents may have been affected by the situation at the time of filling in the questionnaires. It is difficult to assess the impact of this, as no previous studies have dealt with personal CF values of the Spanish population.

6. Conclusions

In spite of these limitations, this study has shown the importance of better understanding the factors affecting citizen’s consumption links to CC mitigation policies. Moving from declared concern or commitment to actual consumption habits requires quantitative assessment of CF values; this is complex and includes uncertainties, but still reveals interesting outcomes that go beyond declared concern and are obviously more important than this in quantifying CC mitigation efforts.
Reducing overall emissions should imply decreasing and reshaping consumption. Our initial hypothesis assumed that people with better knowledge about CC science, those who value the impact of their personal responsibility on the problem and those who have participated in CC-related activities would have a lower CF. From our results, none of these internal factors were found to be significantly related to total CF, but knowledge and concern about CC were found to be linked to food and clothing emissions, which account for 40% of average CF. External factors were more relevant than internal ones to explain differences in terms of transport, household energy and total CF, with income, level of studies, age and working activity as the most important drivers.

Author Contributions

Conceptualization, E.C. and M.B.-B.; methodology, P.R.-B. and A.O.; software, P.R.-B., A.O. and G.O.; validation, P.R.-B., A.O. and G.O.; formal analysis, P.R.-B. and A.O.; investigation, E.C., M.B.-B., A.O., G.O., P.R.-B.; data curation, M.B.-B. and P.R.-B.; writing—original draft preparation, E.C.; writing—review and editing, E.C., M.B.-B., A.O., G.O., P.R.-B.; project administration, E.C. All authors have read and agreed to the published version of the manuscript.

Funding

This paper is based on research performed by the Environmental Ethics Chair, which is funded by the “Tatiana Pérez de Guzmán el Bueno Foundation”.

Institutional Review Board Statement

At the time of this study, our centre did not request approval by an ethics committee. However, the survey company followed all data protection protocols and those related to the integrity of human research.

Informed Consent Statement

Informed consent was not requested because the survey company followed an irreversible anonymization process, which means that the respondent cannot be identified.

Data Availability Statement

Not applicable.

Acknowledgments

The authors want to offer thanks for the financial support of the “Fundación Tatiana Pérez de Guzmán el Bueno” to the Environmental Ethics Chair at the University of Alcalá. We thank to Julián Tijerin, Rubén Ramo and Mariano García for discussion with the random forest methods. PRB is supported by the Community of Madrid Region under the framework of the multi-year Agreement with the University of Alcalá (Stimulus to Excellence for Permanent University Professors, EPU-INV/2020/010).

Conflicts of Interest

The authors declare no conflict of interest.

Appendix A. Survey Description

The opinion poll used to obtain the data for this paper was performed by a social-studies company (Netquest) specializing in internet surveys, which follows the ISO 20252 for panellist selection. The sample was extracted from their population database, who were willing to respond to questionnaires. Three strata were defined to select a representative sample of the Spanish population: sex (50%), age (16–17 years: 4.44%; 18–30 18.16%; 30–65: 64.36% and >65: 13.03%), and geographical regions (also in proportion to their population size). The survey company invited 1584 respondents, finally obtaining 1016 answers. Each invited panellist was sent up to three reminders to complete the questionnaire. In case they did not respond or finish the questionnaire, the invitation was transferred to another person, considering the expected quotas for sex, age and geographical regions that mimic the overall Spanish population characteristics. In all cases, the representative size of each strata was met by the final sample. Each respondent was encouraged to fill out the questionnaire using a bonus point system given by the survey company. The reward was proportional to the time dedicated to completing the survey. The target sample size was 1000 people.
The questionnaire included some internal checks to avoid wrong answers. For instance, questions related to the CF included a range of minimum and maximum expected values (kg of food/person or litters of gasoline/100 km). The company also included some verification measures to ensure that respondents understood the questions and were properly answering them. However, some answers were still found to be unreliable, either because they had quite unrealistic accumulated values (food or transport) or because they were very unusual. For this reason, we applied additional post-survey filters, first by removing those records with obvious errors, and then by applying an automatic cluster analysis, as explained in the main text. The final size of the sample was 845 persons, which were still distributed according to the initial quotas defined in the initial survey.

Appendix B. Additional Tables

Table A1. Average CF values for the different groups of external factors.
VariableCategories#CasesHous.
Energy
Transp.FoodClothingOtherTotal
All 845478216415093175435010
SexMale436518239114892154955108
Female409434192115314265934906
Age (years)16–1721318101212664298623887
18–30142439220413474406765105
30–65558470228815463115315146
>65124584175215721833874479
StudiesPrimary34314130716392255284013
Secondary375462204715483236265006
University436504233114653194725091
Income (€)<1500305457176015413185654642
1500–3000245532244314953325205322
>3000123474288915603065535782
Town size (inhab.)<10,000128596228114913306935392
10,000–50,000230443218713693056474952
50,000–500,000330490209316373265095056
>500,000157404218314593053364688
Political ideologyLeft312490215714453035844979
Centre429472214315223155124963
Right104463227016493685455295
Working activityStudent65370166411623958984489
Agriculture93792466186857113256609
Industry98527263713432243925124
Administration191438226516013345275166
Education64552209715723474575025
Catering66577198616094447665382
Health, Military178420225515613035275066
Entrepreneurs57691254912452073915084
Domestic workers117454166716222914544488
Table A2. Average CF values for the different groups of internal factors.
#CasesHous.
Energy
TranspFoodClothingOtherTotal
KnowledgeYes438501228114202795174998
No407452203816053585705023
Perceived commitment>committed and
<emissions
152480198813612674844580
>committed and >emissions234446215716433125355094
<committed459493222514903365665110
Perceived
intractability
High523433213815323195634986
Low322550220514713145095049
Frequency
of Action
114411200915593133124603
229539234915813477465563
387583224314283145195087
4222485217614333165274937
5274478223715773134865091
6150471199915283116194928
769318204315063436454856
Table A3. Contingency coefficient and Chi-square significance values for cross comparison of CF clusters and the different explanation factors.
Chi-Squarep
Sex0.1560.00
Age0.1560.05
Studies0.1550.007
Working activity0.2680.00
Income0.2250.00
Population0.1920.001
Politics0.0690.853
Knowledge0.1010.071
Perceived commitment0.0880.575
Perceived intractability0.0690.407
Frequency of Action0.180.251
Figure A1. Boxplots of carbon footprint values for the different clusters.
Sustainability 13 08088 g0a1

References

  1. Cook, J.; Oreskes, N.; Doran, P.T.; Anderegg, W.R.L.; Verheggen, B.; Maibach, E.W.; Carlton, J.S.; Lewandowsky, S.; Skuce, A.G.; Green, S.A.; et al. Consensus on consensus: A synthesis of consensus estimates on human-caused global warming. Environ. Res. Lett. 2016, 11, 048002. [Google Scholar] [CrossRef]
  2. Eskander, S.M.S.U.; Fankhauser, S. Reduction in greenhouse gas emissions from national climate legislation. Nat. Clim. Chang. 2020, 10, 750–756. [Google Scholar] [CrossRef]
  3. Lewandowsky, S.; Cook, J.; Fay, N.; Gignac, G.E. Science by social media: Attitudes towards climate change are mediated by perceived social consensus. Mem. Cogn. 2019, 47, 1445–1456. [Google Scholar] [CrossRef]
  4. Corner, A.; Whitmarsh, L.; Xenias, D. Uncertainty, scepticism and attitudes towards climate change: Biased assimilation and attitude polarisation. Clim. Chang. 2012, 114, 463–478. [Google Scholar] [CrossRef]
  5. Victor, D.G.; Akimoto, K.; Kaya, Y.; Yamaguchi, M.; Cullenward, D.; Hepburn, C. Prove Paris was more than paper promises. Nat. News 2017, 548, 25. [Google Scholar] [CrossRef]
  6. Von Schuckmann, K.; Cheng, L.; Palmer, M.D.; Hansen, J.; Tassone, C.; Aich, V.; Adusumilli, S.; Beltrami, H.; Boyer, T.; Cuesta-Valero, F.J.; et al. Heat stored in the Earth system: Where does the energy go? Earth Syst. Sci. Data 2020, 12, 2013–2041. [Google Scholar] [CrossRef]
  7. Rogelj, J.; Shindell, D.; Jiang, K.; Fifita, S.; Forster, P.; Ginzburg, V.; Handa, C.; Kheshgi, H.; Kobayashi, S.; Kriegler, E.; et al. Mitigation Pathways Compatible with 1.5 °C in the Context of Sustainable Development. In Global Warming of 1.5 °C. An IPCC Special Report on the Impacts of Global Warming of 1.5 °C Above Pre-Industrial Levels and Related Global Greenhouse Gas Emission Pathways, in the Context of Strengthening the Global Response to the Threat of Climate Change, Sustainable Development, and Efforts to Eradicate Poverty; Masson-Delmotte, V., Zhai, P., Pörtner, H.-O., Roberts, D., Skea, J., Shukla, P.R., Pirani, A., Moufouma-Okia, W., Péan, C., et al., Eds.; Intergovernmental Panel on Climate Change: Geneva, Switzerland, 2018. [Google Scholar]
  8. Hertwich, E.G.; Peters, G.P. Carbon footprint of nations: A global, trade-linked analysis. Environ. Sci. Technol. 2009, 43, 6414–6420. [Google Scholar] [CrossRef] [Green Version]
  9. Ivanova, D.; Stadler, K.; Steen-Olsen, K.; Wood, R.; Vita, G.; Tukker, A.; Hertwich, E.G. Environmental Impact Assessment of Household Consumption. J. Ind. Ecol. 2016, 20, 526–536. [Google Scholar] [CrossRef]
  10. Baiocchi, G.; Minx, J.; Hubacek, K. The Impact of Social Factors and Consumer Behavior on Carbon Dioxide Emissions in the United Kingdom. J. Ind. Ecol. 2010, 14, 50–72. [Google Scholar] [CrossRef]
  11. Wilson, J.; Tyedmers, P.; Spinney, J.E.L. An Exploration of the Relationship between Socioeconomic and Well-Being Variables and Household Greenhouse Gas Emissions. J. Ind. Ecol. 2013, 17, 880–891. [Google Scholar] [CrossRef]
  12. Paterson, M.; Stripple, J. My Space: Governing individuals’ carbon emissions. Environ. Plan. D Soc. Space 2010, 28, 341–362. [Google Scholar] [CrossRef]
  13. Mulrow, J.; Machaj, K.; Deanes, J.; Derrible, S. The state of carbon footprint calculators: An evaluation of calculator design and user interaction features. Sustain. Prod. Consum. 2019, 18, 33–40. [Google Scholar] [CrossRef]
  14. Büchs, M.; Bahaj, A.S.; Blunden, L.; Bourikas, L.; Falkingham, J.; James, P.; Kamanda, M.; Wu, Y. Promoting low carbon behaviours through personalised information? Long-term evaluation of a carbon calculator interview. Energy Policy 2018, 120, 284–293. [Google Scholar] [CrossRef]
  15. Petersson, T.; Secondi, L.; Magnani, A.; Antonelli, M.; Dembska, K.; Valentini, R.; Varotto, A.; Castaldi, S. A multilevel carbon and water footprint dataset of food commodities. Sci. Data 2021, 8, 127. [Google Scholar] [CrossRef] [PubMed]
  16. Salo, M.; Mattinen, M.K. Carbon footprint calculators for citizens: Recommendations and implications in the Nordic Context; Nordic Council of Ministers: Copenhagen, Denmark, 2017; p. 46. [Google Scholar]
  17. Moberg, K.R.; Aall, C.; Dorner, F.; Reimerson, E.; Ceron, J.-P.; Sköld, B.; Sovacool, B.K.; Piana, V. Mobility, food and housing: Responsibility, individual consumption and demand-side policies in European deep decarbonisation pathways. Energy Effic. 2019, 12, 497–519. [Google Scholar] [CrossRef] [Green Version]
  18. Martiskainen, M.; Axon, S.; Sovacool, B.K.; Sareen, S.; Del Rio, D.F.; Axon, K. Contextualizing climate justice activism: Knowledge, emotions, motivations, and actions among climate strikers in six cities. Glob. Environ. Chang. 2020, 65, 102180. [Google Scholar] [CrossRef]
  19. Ivanova, D.; Vita, G.; Wood, R.; Lausselet, C.; Dumitru, A.; Krause, K.; Macsinga, I.; Hertwich, E.G. Carbon mitigation in domains of high consumer lock-in. Glob. Environ. Chang. 2018, 52, 117–130. [Google Scholar] [CrossRef] [Green Version]
  20. Moser, S.; Kleinhückelkotten, S. Good Intents, but Low Impacts: Diverging Importance of Motivational and Socioeconomic Determinants Explaining Pro-Environmental Behavior, Energy Use, and Carbon Footprint. Environ. Behav. 2018, 50, 626–656. [Google Scholar] [CrossRef] [Green Version]
  21. Clayton, S.; Myers, G. Conservation Psychology: Understanding and Promoting Human Care for Nature; John Wiley & Sons: Chichester, UK, 2015. [Google Scholar]
  22. Boucher, J.L. Culture, carbon, and climate change: A class analysis of climate change belief, lifestyle lock-in, and personal carbon footprint. Soc. Ecol. J. Environ. Thought Sociol. Res. 2016, 25, 53–80. [Google Scholar] [CrossRef] [Green Version]
  23. Büchs, M.; Schnepf, S.V. Who emits most? Associations between socio-economic factors and UK households’ home energy, transport, indirect and total CO2 emissions. Ecol. Econ. 2013, 90, 114–123. [Google Scholar] [CrossRef] [Green Version]
  24. Ivanova, D.; Büchs, M. Household Sharing for Carbon and Energy Reductions: The Case of EU Countries. Energies 2020, 13, 1909. [Google Scholar] [CrossRef] [Green Version]
  25. Adnan, M.N.; Safeer, R.; Rashid, A. Consumption based approach of carbon footprint analysis in urban slum and non-slum areas of Rawalpindi. Habitat Int. 2018, 73, 16–24. [Google Scholar] [CrossRef]
  26. Bhoyar, S.P.; Dusad, S.; Shrivastava, R.; Mishra, S.; Gupta, N.; Rao, A.B. Understanding the impact of lifestyle on individual carbon footprint. In Procedia—Social and Behavioral Sciences; Elsevier Ltd.: Amsterdam, The Netherlands, 2014; Volume 133, pp. 47–60. [Google Scholar]
  27. Brand, C.; Preston, J.M. ‘60-20 emission’—The unequal distribution of greenhouse gas emissions from personal, non-business travel in the UK. Transp. Policy 2010, 17, 9–19. [Google Scholar] [CrossRef]
  28. Gifford, R.; Nilsson, A. Personal and social factors that influence pro-environmental concern and behaviour: A review. Int. J. Psychol. 2014, 49, 141–157. [Google Scholar] [CrossRef]
  29. Mallett, R.K.; Melchiori, K.J.; Strickroth, T. Self-confrontation via a carbon footprint calculator increases guilt and support for a proenvironmental group. Ecopsychology 2013, 5, 9–16. [Google Scholar] [CrossRef]
  30. Van Valkengoed, A.M.; Steg, L. Meta-analyses of factors motivating climate change adaptation behaviour. Nat. Clim. Chang. 2019, 9, 158–163. [Google Scholar] [CrossRef]
  31. Xiang, P.; Zhang, H.; Geng, L.; Zhou, K.; Wu, Y. Individualist-Collectivist Differences in Climate Change Inaction: The Role of Perceived Intractability. Front. Psychol. 2019, 10, 187. [Google Scholar] [CrossRef] [Green Version]
  32. Corner, A.; Roberts, O.; Chiari, S.; Völler, S.; Mayrhuber, E.S.; Mandl, S.; Monson, K. How do young people engage with climate change? The role of knowledge, values, message framing, and trusted communicators. Wiley Interdiscip. Rev. Clim. Chang. 2015, 6, 523–534. [Google Scholar] [CrossRef]
  33. Poortinga, W.; Whitmarsh, L.; Steg, L.; Böhm, G.; Fisher, S. Climate change perceptions and their individual-level determinants: A cross-European analysis. Glob. Environ. Chang. 2019, 55, 25–35. [Google Scholar] [CrossRef]
  34. De Groot, J.I.M.; Steg, L. Value Orientations and Environmental Beliefs in Five Countries:Validity of an Instrument to Measure Egoistic, Altruistic and Biospheric Value Orientations. J. Cross-Cult. Psychol. 2007, 38, 318–332. [Google Scholar] [CrossRef]
  35. Burgui-Burgui, M.; Chuvieco, E. Beyond Carbon Footprint Calculators. New Approaches for Linking Consumer Behaviour and Climate Action. Sustainability 2020, 12, 6529. [Google Scholar] [CrossRef]
  36. Druckman, A.; Jackson, T. Understanding Households as Drivers of Carbon Emissions. In Taking Stock of Industrial Ecology; Clift, R., Druckman, A., Eds.; Springer International Publishing: Cham, UK, 2016; pp. 181–203. [Google Scholar] [CrossRef] [Green Version]
  37. Breiman, L. Random forests. Mach. Learn. 2001, 45, 5–32. [Google Scholar] [CrossRef] [Green Version]
  38. Kuhn, M.; Johnson, K. Applied Predictive Modeling; Springer: Berlin/Heidelberg, Germany, 2013. [Google Scholar]
  39. Belgiu, M.; Drăguţ, L. Random forest in remote sensing: A review of applications and future directions. Isprs. J. Photogramm. 2016, 114, 24–31. [Google Scholar] [CrossRef]
  40. Strobl, C.; Malley, J.; Tutz, G. An introduction to recursive partitioning: Rationale, application, and characteristics of classification and regression trees, bagging, and random forests. Psychol. Methods 2009, 14, 323. [Google Scholar] [CrossRef] [Green Version]
  41. Strobl, C.; Boulesteix, A.-L.; Kneib, T.; Augustin, T.; Zeileis, A. Conditional variable importance for random forests. BMC Bioinform. 2008, 9, 1–11. [Google Scholar] [CrossRef] [Green Version]
  42. Probst, P.; Wright, M.N.; Boulesteix, A.L. Hyperparameters and tuning strategies for random forest. Wiley Interdiscip. Rev. Data Min. Knowl. Discov. 2019, 9, e1301. [Google Scholar] [CrossRef] [Green Version]
  43. Strobl, C.; Boulesteix, A.-L.; Zeileis, A.; Hothorn, T. Bias in random forest variable importance measures: Illustrations, sources and a solution. BMC Bioinform. 2007, 8, 1–21. [Google Scholar] [CrossRef] [PubMed] [Green Version]
  44. Gifford, R.D.; Chen, A.K.S. Why aren’t we taking action? Psychological barriers to climate-positive food choices. Clim. Chang. 2017, 140, 165–178. [Google Scholar] [CrossRef]
  45. Steg, L.; Perlaviciute, G.; van der Werff, E. Understanding the human dimensions of a sustainable energy transition. Front. Psychol. 2015, 6, 805. [Google Scholar] [CrossRef] [Green Version]
  46. Kormos, C.; Gifford, R. The validity of self-report measures of proenvironmental behavior: A meta-analytic review. J. Environ. Psychol. 2014, 40, 359–371. [Google Scholar] [CrossRef]
  47. Steg, L. Limiting climate change requires research on climate action. Nat. Clim. Chang. 2018, 8, 759–761. [Google Scholar] [CrossRef]
  48. Environmental Psychology: An Introduction, 2nd ed; Steg, L.; de Groot, J.I. (Eds.) John Wiley & Sons Ltd.: Hooboken, NJ, USA, 2019. [Google Scholar]
  49. Chuvieco, E.; Burgui, M.; Da Silva, E.V.; Hussein, K.; Alkaabi, K. Factors Affecting Environmental Sustainability Habits of University Students: Intercomparison Analysis in Three Countries (Spain, Brazil and UAE). J. Clean. Prod. 2018, 198, 1372–1380. [Google Scholar] [CrossRef]
Figure 1. Boxplots of total, transport and food carbon footprint values (kg CO2e), depending on external drivers. Box categories are included in the same order as in Table 1.
Sustainability 13 08088 g001
Figure 2. Boxplots of total carbon footprint and its components (kg CO2e) depending on climate change knowledge, perception and action.
Sustainability 13 08088 g002
Figure 3. Variable importance for total, transport and food CF from regression RF models.
Sustainability 13 08088 g003
Table 1. External and internal variables included in the questionnaire to explain personal CF.
NameType#CategoriesDescription
External variables
SexBinary2Male, female
Ages groupsOrdinal416–17, 18–30, 31–65, >65 years
StudiesOrdinal3No studies or primary, secondary school, university studies
WorkNominal9Student, agriculture, industry, office work, education, catering, other services, management, home
Monthly IncomeOrdinal3<1500 €, 1500 a 3000 € and >3000 €
PopulationOrdinal4Number of residents in the town of respondents: <10.000, 10.000–50.000, 50.000–500.000, or >500.000 persons
PoliticsOrdinal3From the original 9 Likert scale, we formed 3 classes: left (<4), Centre (4–6) and right mind (>6)
Internal variables
KnowledgeBinary21 = Identify GHG as main cause and consider natural factors as having low o very low importance in CC; 2 = otherwise
Perceived commitmentNominal31 = highly committed and below average emissions; 2 = highly committed and above average; 3 = otherwise
Perceived intractabilityBinary21 = importance of personal actions high or very high; 2 = otherwise
Frequency of ActionOrdinal7Likert scale from 1 (never) to 7 (very frequently)
Table 2. Spearman correlation values between the different components of the carbon footprint.
EnergyTransportFoodClothingOthersTotal
Energy1
Transport0.158 *1
Food−0.0710.0191
Clothing−0.0540.0260.156 **1
Others−0.0070.0550.0390.158 *1
Total0.325 **0.726 **0.448 **0.204 **0.321 **1
p-values lower than 0.001 are marked as ** and lower than 0.01 as *.
Table 3. Average CF values for the different clusters (kg CO2e).
12345Average Values
Energy385.05525.61447.37261.261773.89477.58
Transport1612.281882.694265.491337.962054.992163.66
Food3663.791339.451405.251151.21410.151509.17
Clothing445.11372.32306.11291.75301.69316.94
Others471.242989.26443.53342.2374.61542.57
Number of cases885120142580845
Table 4. Kruskall–Wallis values of CF differences for the explanatory variables (external and internal factors).
FoodTransportHousehold EnergyClothingOthersTotal
Sex0.0526.56 *11.12 *168.35 *6.91 *2.97
Age8.3029.43 *9.4174.31 *25.70 *15.96 *
Studies4.1014.03 *3.245.6712.77 *8.53
Income2.7253.65 *2.282.442.1631.73 *
Work20.47 *42.70 *12.6351.69 *36.83 *21.57 *
Population4.943.6314.73 *4.4116.98 *8.26
Politics3.570.731.181.625.932.72
Knowledge6.165.563.979.43 *1.860.10
Perceived Commitment10.82 *3.680.976.183.266.74
Perceived Intractability0.701.567.60 *0.233.880.11
Frequency of Action3.027.588.062.275.924.62
Values marked with * indicate p < 0.01.
Publisher’s Note: MDPI stays neutral with regard to jurisdictional claims in published maps and institutional affiliations.

