Article

Flexible Fuzzy Goal Programming Approach in Optimal Mix of Power Generation for Socio-Economic Sustainability: A Case Study

1
Department of Basic Science, College of Science and Theoretical Studies, Saudi Electronic University, Riyadh 11673, Saudi Arabia
2
Centre for Distance and Online Education, Jamia Millia Islamia, New Delhi 110025, India
3
Department of Statistics & Operations Research, Modibbo Adama University, P.M.B. 2076, Yola, Nigeria
4
Department of Commerce, Aligarh Muslim University, Aligarh 202002, India
5
Department of Statistics & Operations Research, Aligarh Muslim University, Aligarh 202002, India
*
Author to whom correspondence should be addressed.
Current address: Department of Statistics & Operations Research, Aligarh Muslim University, Aligarh 202002, India.
Sustainability 2021, 13(15), 8256; https://0-doi-org.brum.beds.ac.uk/10.3390/su13158256
Submission received: 15 June 2021 / Revised: 17 July 2021 / Accepted: 18 July 2021 / Published: 23 July 2021

Abstract

:
The demand for cost-efficient and clean power energy cannot be overemphasised, especially in a developing nation like India. COVID-19 has adversely affected many nations, power sector inclusive, and resiliency is imperative via flexible and sustainable power generation sources. Renewable energy sources are the primary focus of electricity production in the world. This study examined and assessed the optimal cost system of electricity generation for the socio-economic sustainability of India. A sustainable and flexible electricity generation model is developed using the concept of flexible fuzzy goal programming. This study is carried out with the aim of achieving the government’s intended nationally determined contribution goals of reducing emission levels, increasing the capacity of renewable sources and the must-run status of hydro and nuclear, and technical and financial parameters. The result shows an optimal cost solution and flexibility in how increased electricity demand would be achieved and sustained via shifting to renewable sources such as solar, wind and hydro.

1. Introduction

Environmental sustainability focuses on minimizing the negative environmental impacts of generating electricity based on conventional resources. It can be achieved by increasing production based on renewable energy sources (RES). Therefore, it is composed of several criteria by which power sources have a direct impact on human life, ecological balance, and the environment [1]
The ever-increasing CO2 emissions and the rapid degradation of the environment globally affects environmental sustainability adversely. As a result, policy-makers and researchers are developing interest in, and shifting to, greener manufacturing and the production of electricity via renewable energy sources. Developing countries like India suffer the most from environmental issues due to rapid population growth and lack of adequate resources to harness the potential of RES. Recently, a study was conducted to identify, analyze and rank the predominant barriers restricting India from implementing green manufacturing practices in its small and medium-sized enterprises [2]. The study identified 25 barriers and used different multi-criteria decision-making (MCDM) frameworks to analyze and rank the barriers. The study advocated eco-friendly design in the manufacturing system.
As well as the environmental issue, the COVID-19 pandemic poses challenges globally, especially when developing nations are at a higher risk of damage. The pandemic disrupted regular businesses, supply chain networks, production systems, educational systems and, above all, good governance. Recently, the effects of COVID-19 on the e-commerce of European countries in terms of cyber-security have been analyzed using MCDM tools [3]. The countries’ sensitivity to cyber-security and e-commerce performance during the pandemic has been identified and ranked. The study suggests digital transformation to policymakers as a framework for a sustainable environment. Similarly, strategies for managing the adverse effects of the COVID-19 pandemic on the educational sector have been evaluated flexibly using MCDM techniques [4].
Several kinds of research have been ongoing regarding the disruption of the supply chain of food and services during the COVID-19 pandemic. Recently, the challenges and opportunities of the food system and circular economy concerning the COVID-19 pandemic have been studied to pave the way for, and aid, policy designers in enacting environmental sustainability policies [5,6,7]. In all cases, electricity consumption is unavoidable hence the need to devise an optimal mix for the sustainable production of power energy for environmental sustainability development.
In modern times, electricity is among the most important inventions of science for humanity. From home appliances such as fans and toasters, to modern communications and transportation, to the heavy machines used for production in industries, we cannot do without electricity-based technology. India had a population of 1.353 billion people in 2018 alone. It is positioned as the second most populated country globally and the seventh largest economy with a GDP of 2.726 trillion USD in 2018 [8]. However, the electricity consumption per capita was 1122 Kwh in 2017 [9], which is much lower than that of many countries. Electricity shortages are one of South Asia’s most significant barriers to achieving development. The power distortion in South Asia causes a four to seven percent lower GDP a year [10]. As of March 2017, Asia’s total installed electricity generation capacity, both from utilities and non-utilities, was 377,122 MW and the gross electricity generation was 1,432,358 GWh.
The gross import and export of electricity during 2016–2017 was 5617 GWh and 6710 GWh, respectively. In 2016–2017, electricity available for supply was 1168,317 GWh in, and the estimated electricity consumption was 1,066,268 GWh [9]. The enhancement of India’s power sector would be essential to the growth of its economy. Many studies have shown the association between the electricity consumption and the GDP of a country [11,12,13]. The importance of electricity is understandable as electricity consumption serves as an indicator for the socio-economic development of countries [14,15]. With the growth of an economy, electricity demand also grows [See Figure 1]. Because of the scarce fuel resources available to satisfy the demand, additional optimal capacity must be planned [16].
Recently, a two-stage optimization problem was modeled to address hydropower systems and wind parks [17]. The study used mixed-integer linear programming to maximize the system production profits and minimize the imbalances caused by profit reduction penalties. Similarly, wind power production plants have some uncertainties in their production due to the stochastic nature of the operating system during transmission. As such, an optimization model was developed to address the congestions by re-dispatching various cascaded hydropower plants [18]. The study formulated mixed-integer programming to maximize the profit from selling the energy and using a hybrid of quadratic and chance-constrained programming to minimize possible congestions due to re-dispatching the cascaded hydropower plants. More recently, a cooling system with thermodynamic and thermo-economic assessments has been investigated, and energy cost was discovered to be dominant for a single-phase cooling system with a future minimum carbon cost for both systems [19]. Similarly, dynamic mode decomposition has been used to predict the thermal performance of a battery surface [20].
The costs and environmental effects of fossil and nuclear fuels are enormous. Therefore, the need for an optimal mix from various technologies for generating power at a minimum cost cannot be overemphasized. This study tried to assess the cost-optimal additional capacity required by the end of 2021–2022 from conventional and non-conventional energy sources. The study uses flexible fuzzy goal programming to analyze various power generation scenarios for India’s sustainable development. This study addresses the UN sustainable development goal 7 (SDG7) related to ensuring affordable, reliable, sustainable and modern energy for all. The goal is interconnected and has synergy with several SDGs such as no poverty (SDG 1), good health and well-being (SDG 3), quality education (SDG 4), clean water and sanitation (SDG 6), decent work and economic growth (SDG 8), sustainable cities and communities (SDG 11), and climate action (SDG 13), among others [21,22,23]. According to [22], “decisions about SDG7 affect humanity’s ability to: realize aspirations of greater welfare and well-being, build physical and social infrastructures for sustainable development, and achieve sustainable management of the natural environment.” Therefore, achieving SDG 7 will help to realize socio-economic and environmental sustainability. Some benefits of the techniques employed in this study are discussed briefly in the next section.

1.1. Benefit of Flexible Fuzzy Goal Programming

Flexible Fuzzy goal programming is one of the distance-based methods. It is an extension of conventional goal programming. One of the significant advantages of such approaches is their computational efficiency. While dealing with multiobjective optimization problems, flexible fuzzy goal programming allows us to stay within an efficient linear programming computational environment. In this method, each objective’s aspiration level is taken as unity, regarding their highest degree of achievement goal. The technique helps to solve multiobjective optimization problems with imprecise parameters in a decision-making environment.
Additionally, the approach uses tolerance values, making it more flexible for decision-makers to realize the range of the solutions they can operate within. In this approach, instead of measuring the achievement of fuzzy objective values directly, achieving membership values of objectives to the highest degree (unity) by minimizing under-deviations is taken into account in a solution search process. All these are incorporated in this research.

1.2. Paper Organization

The paper is organized as follows: Section 1 introduces the study background and presents some benefits of the technique used in the study. In Section 2, the relevant literature in the subject area is reviewed, and the research gap established. Section 3 discusses the general multiobjective optimization model followed by the flexible goal programming technique, which the study uses for modeling and solving the problem. The stepwise procedure of the solution method is presented as well. Models related to the levelized cost of energy and its components, such as capital costs, operational costs, and fuel costs, are presented and discussed. Section 4 briefly discusses the sustainable development goals (SDGs) and identifies the SDG 7-goal related to energies and emissions that are crucial to environmental sustainability in the Indian context, based on which the study is carried out. In this section, the Indian Intended Nationally Determined Contribution (INDC), the current scenario of the Indian power sector, the installed capacity of power generation, the Indian electricity generation and consumption, its import and export, and the renewable energy scenarios are all discussed. This section further discusses the state-wise scenario of the power sector and the projections of electricity demand. Section 5 presents the modeling of electrical energy production. The necessary parameters and the system constraints, such as capacity additional targets, renewable energy sources, reserve margin, emissions limits, current energy mixed, and so forth, are discussed. Section 6 presents the results, analysis and discussions, and the article is concluded in Section 7 with research implications and recommendations for decision-makers to implement the findings.

2. Literature Review

Over the years, researchers have been engaged in optimization, studying and investigating, proposing new methodologies and strategies for finding alternative solutions to the existing and newly emerging problems of human endeavors, for the betterment of the universe. Studies related to the sustainability and development agendas, with respect to India, have been intensive and ongoing. For instance, Rathi [24] and Ghose [25] studied how to promote clean production in the industrial set up of India; Mukherjee [26] considered barriers to the use of energy and the control of pollution with the aim of preserving the environment by the use of cleaner production technologies. The study discovered inconsistency in technology parameters and that they were not reliable for optimizing the eco-friendly casting production problem. Pal et al. [27] studied the process of a device for effectively controlling pollution, developed by the SDC–TERI partnership in India, and discussed measures to replicate and improve the technology for energy efficiency. Narayanaswamy and Scott [28] discussed the lessons derived from cleaner production in textile industries, related to urban and rural environmental interdependency in India.
Unnikrishnan and Hedge [29] analyzed industrial training imparted with the goal of cleaner production. Affordability for cleaner water production was studied by Annala et al. [30], where they used “Reverse Osmosis (RO)” technology to investigate the low cost of water filters in Indian households. The study found that there is active participation in the frugal innovation process by the citizens. Nomani et al. [31] analyzed Indian vision 2030 using the concept of FFGP. Khatun and Ahamad [32] discussed the energy situation in Bangaladesh and analyzed the gap between energy production and usage over 38 years, linking it to the economic growth of the country. McCollum et al. [33] extensively reviewed the linkage between energy and its counterparts related to SDGs.
Similarly, Hassan and Garg [34] studied a system approach for water resource development. Robust optimization techniques have recently been used in sustainability studies [35,36]. Multi-criteria goal programming was used by Gupta et al. [1,37] to analyze the SDGs of India. Recently, a critical review of the application of optimization techniques to the United Nation’s SDGs has been conducted [38]. Globally, researchers and decision-makers tend to investigate and proffer solutions to the problem of environmental sustainability [39]. For instance, Yang et al. [40] investigated factors influencing urban sustainability in Beijing and Shanghai in China, and found that service industries have the most substantial consumption of energy and water and CO2 emissions.
Other similar environmental and electricity regulations have been studied and documented in [39,40,41,42,43,44,45,46,47]. Recently, green energy has been used for providing sustainable economic growth [48,49]. A compact summary of the related work concerning energy studies and environmental sustainability is shown in Table 1. The next section discusses the methodology of this research.

3. Methodology

In this section, the techniques used for modeling the optimization problem and calculating the levelized cost of energy are discussed and presented. First, a general multiobjective optimization problem is discussed, followed by the specific techniques employed in the study.

3.1. Multiobjective Optimization Model

A problem is said to exist if there is a discrepancy between what is and what should be in a real-life situation. Optimization, in simple terms, is finding the best possible desired result(s) out of many available solutions. In an optimization problem, the objective could be single or multiple. A multi-objective problem has more than one objective or goal that is desired to be achieved. It can be a linear or nonlinear function(s) with some constraints or limitations, which can also be linear or nonlinear. For instance, the problem can be about minimizing a certain quantity (say cost) or maximizing a particular value (say profit), or a combination of both. An optimal solution is possible in a single objective optimization depending on the nature of the problem; however, if there is more than one objective, it is a multi-objective optimization problem (MOOP). Naturally, in MOOP, it is impossible to obtain an optimal solution for all the objectives since they could be conflicting. Therefore, a Pareto or a compromise solution is possible. There are different types of models and solutions obtainable in MOOP. The MOOP can be linear or nonlinear depending on the problem’s nature and constraints. However, the general MOOP model is presented below:
Let a multiobjective programming problem (MOPP) with j objectives functions be given as:
O p t i m i z e Z 1 ( X ) , Z 2 ( X ) , Z j ( X ) s u b j e c t t o ; g i ( x ) ( , = , ) b i , i = 1 , 2 , , m ; x 0 ,
where Z j is the set of objectives, g i ( x ) ( , = , ) b i are m sets of constraints for which b i is the ith resource. Many techniques and approaches exist for solving the MOPP model Equation (1), one of which is flexible goal programming.

3.2. Flexible Fuzzy Goal Programming with Tolerance Functions

Fuzzy set theory is a concept to which flexible fuzzy goal programming (FFGP) applies. Fuzzy sets describe the imprecise goals of a decision-maker. These goals are flexible and can be associated with an objective function or constraints. They can reflect a weighting with a value from zero to one or a range of “goal achievement” possibilities. An FFGP allows decision-makers who cannot define goals in a precise manner to express them in a weighting structure, which is not limited. The decision is generally made under four different environments with various conditions. The decision-making takes place in an environment where the DM either has ultimately no knowledge about the environment (ignorance), has complete knowledge (certainty), has little or no knowledge (uncertainty), but can be assigned probabilities and environments in which the DM is competing with the state of nature. Some decisions are simple, while others are very complicated. It is simple when there is precision of the boundaries in the environment, while it is very complicated when the environment is full of uncertainties and vagueness. Fuzzy set theory with imprecise boundaries, developed by Zadeh [51], can handle such vagueness and uncertainty. Zimmermann [52] proposed a fuzzy programming concept for solving multi-objective DM problems, in which both the objectives and the constraints of the problem are considered to be a fuzzy set, a characteristic function (membership) in that set assigns some grades (real values) of membership between one and zero to each of the objectives or goals of the DM. A generalized model for this type of problem (FFGP) can be stated as:
Find
X = ( x 1 , x 2 , . . . , x n ) T ,
such that
Z k ( X ) ( , , ) g k , k = 1 , 2 , 3 , . . . , K . A X b i , i = 1 , 2 , . . . , m X 0 ,
where g k is the various anticipated future goals, b i is the vector of available resources at hand, and A is the technological coefficient. The symbol ⪰ is the fuzzy-max type, meaning that Z k ( X ) should be approximately more than or exactly the same as the level of aspiration g k ; this implies that it can be satisfied by the DM even if it is less than g k at a certain level. The symbol ⪯ stands for fuzzy-min, meaning that Z k ( X ) should be less than or exactly the same as the level of aspiration g k approximately, up to an allowable limit (tolerance), while the symbol ≃ stands for fuzzy-equal and implies that Z k ( X ) should be within the level of aspiration g k , which means that it can be satisfied by the DM even if it is less than or greater than g k to a certain level of tolerance. The k-th fuzzy objective is denoted by Z k , and the n-dimensional vector for decision variables is represented by X.
For multi-objective fuzzy goal programming, let g k be the aspiration level set by DM for the k-th objective value Z k ( X ) . Thus, using the method developed by Zimmermann [52], for a maximization problem fo the fuzzy-goal type Z k ( X ) g k , the membership function for fuzzy-max goals is given as: “
λ k ( Z k ( X ) ) = 1 , i f Z k ( X ) g k Z k ( X ) L k g k L k , i f L k Z k ( X ) g k 0 , i f Z k ( X ) L k .
While the constraint of a fuzzy model is a subset of vector X with a membership characteristic function λ a i j ( x j ) : x⟶[0,1], given by
λ Σ a i j x j , b i = 1 , i f j = 1 n a i j x j = b i , i = 1 , 2 , . . . , m j = 1 n a i j x j b i + T b i T b i , i f b i T b i < j = 1 n a i j x j b i , i = 1 , 2 , . . . , m b i + T b i j = 1 n a i j x j T b i , i f b i < j = 1 n a i j x j b i + T b i , i = 1 , 2 , . . . , m 0 , O t h e r w i s e .
The Flexible Fuzzy Goal Programming Model can be written as:
Find x X
such that it will Maximize λ
subject to :
λ Z k ( x ) L k g k L k , i f Z k ( x ) g k λ U k Z k ( x ) U k g k , i f Z k ( x ) g k λ ( b i + T b i ) i = 1 m a i j ( x j ) T b i , i f i = 1 m a i j ( x j ) b i λ ( i = 1 m a i j ( x j ) ( b i + T b i ) T b i , i f i = 1 m a i j ( x j ) b i x j 0 , j = 1 , 2 , . . . , n λ 0 ,
where T is the tolerance interval.”

3.3. Stepwise Solution Procedure for MOPP

We define four linear functions in our study as a multi-objective optimization problem and the following step-wise algorithms are employed for solving the model.
Step 1:
Formulate the problem at hand as a multi-objective mathematical model.
Step 2:
Obtain the individual optimal solution of the model using any available package, considering one objective at a time.
Step 3:
Formulate a pair-wise comparison matrix using the solutions in Step 2, given as:
Z 1 * ( x 1 ) Z 2 ( x 1 ) Z j ( x 1 ) Z 1 ( x 2 ) Z 2 * ( x 2 ) Z j ( x 2 ) Z 1 ( x j ) Z 2 ( x j ) Z j * ( x j ) .
Step 4:
Identify the lowest and highest value of each column in Step 3 obtained from Step 2 above and set them as a lower and upper goal, respectively.
Step 5:
Construct the membership functions using the FFGP models in Equation (5).
Step 6:
Construct a function that will maximize the overall linear additive model of the auxiliary variables defined from the membership function in Step 5 above.
Step 7:
Solve for the function in Step 6 using a suitable optimization package and obtain the goal achievement value.

3.4. Levelized Cost of Energy

The “Levelized Cost” of electricity generation can be defined as “the ratio of the net present value of total capital cost and the total operating cost of a particular plant to the net present value of the net electricity generated by that plant over its operating life” [53,54]. It has not been a reasonable way to quantify the cost economics by simply comparing the electricity generating cost of various RES, such as wind or solar, with that of “conventional sources” such as coal, nuclear or natural gas. Present Net Value (NPV) is one of the critical parameters used to judge the financial viability of the technology; it is the current investment value considering the cost of capital, fuel, as well as other operating and maintenance costs. The LCOE model is given in Equation (6).
L C O E = I t + ( O M ) t + F t ( 1 + r ) t E t ( 1 + r ) t ,
where LCOE = levelized cost of energy, I t = initial investment, ( O M ) t = operating and maintenance charge, F t = fuel cost, r = discount rate, E t = system energy yield, and t = year.
The NPV is calculated by determining the annual cash flows from the investment and discounting them to the present time with a specific discount rate. Thus, to compare the costs of generating technologies, the total costs and the load factor for each technology are first considered, and the net present value analysis is then performed. That is the only logical way to evaluate power generation technologies.

3.4.1. Component of levelized Costs

The levelized cost of energy helps with the economic assessment and comparison of different power generation technologies with unequal plant life, capital costs, capacity factor, and fuel costs. Different methods of power generation incur different costs, which include the initial capital cost, operation and maintenance cost and fuel cost (see Table 2).

3.4.2. Capital Costs

Capital costs are the overnight construction costs, including mechanical equipment supply and installation, civil and structural costs, project indirect costs, electrical and instrumentation and control and owners costs [53]. They also include waste disposal and decommissioning costs in the case of nuclear power plants [54]. These costs are lower for gas, wind and solar PV and higher for coal, solar thermal and nuclear.

3.4.3. Operation and Maintenance Cost

Power plants’ operating costs include labor and maintenance costs. Unlike the capital costs, the operation and maintenance costs of the plant can vary with the electricity produced. It is low for solar PV, solar thermal and wind, and high for biomass plants.

3.4.4. Fuel Costs

These costs are high for coal, gas and biomass plants, low for nuclear power plants, and zero for many renewable energy sources. Fuel costs can vary arbitrarily over the life of the plants, due to political and other factors such as inflation; therefore, for the present study fuel cost was inflated at 5.72% on a year on year basis.
To calculate the overall cost of the production of electricity from different technologies, various streams of costs are discounted by a discounting factor to net present value. Similarly, yearly energy units produced by different methods are discounted back to net present value. In this study, a discount factor of 10 percent has been used to calculate the net present value of streams of cash outflows and energy units produced. Capital costs, operating and maintenance and fuel costs are applied in Lakh per megawatt installed capacity while electrical energy produced is applied in million U.

4. Sustainable Development Goals

Member states of the United Nations (UN) adopted the seventeen Sustainable Development Goals (SDGs) in 2015. The SDGs serve as a global action against poverty, hunger, AIDS and discrimination, and to ensure that all people enjoy peace and prosperity by 2030 for balanced and sustainable social, economic and environmental development [55]. The SDG 7 agenda is determined to ensure the affordability, reliability, and sustainability of energy for the benefit of all. Secure energy access is linked with various social and economic development goals such as alleviating poverty, education, health, improving industrialisation, providing infrastructure for communication, and mitigating climate changes. In India, NITI Aayog is saddled with the responsibility of ensuring the SDG implementation, while the “Ministry of Statistics and Programme Implementation (MoSPI) is evolving the related national indicators” (Economic survey, 2017).

4.1. Intended Nationally Determined Contribution (INDC)

India endorsed the Copenhagen Accord in 2010 and intended to reduce CO2 intensity by at least 20 to 25 percent of that of 2005 levels by 2020. In October 2015, with the view of eradicating poverty and adopting low carbon clean technologies, India also submitted its “Intended Nationally Determined Contribution” (INDC) to UNFCCC (Government of India 2016). The actual contents of the reports include:
  • reduce the emissions intensity of its GDP by 33 to 35 percent by 2030 from 2005 levels.
  • achieve about 40 percent cumulative electric power installed capacity from non-fossil fuel-based energy resources by 2030, with the help of the transfer of technology and low-cost international finance including from the Green Climate Fund (GCF).
  • create an additional carbon sink of 2.5 to 3 billion tonnes of CO2 equivalent through additional forest and tree cover by 2030.
Therefore, GOI needed to enrich the existing policies and intended to introduce more efficient and cleaner technologies, promote renewable energy, reduce carbon emissions from different sources, promote energy efficiency in the economy, develop resilient climate infrastructure, Implement programmes of afforestation, enhance climate resilience and reduce vulnerability to climate change.

4.2. Current Scenario of the Indian Power Sector

In India, electricity generation, transmission, distribution and trading are currently governed by the Electricity Act of 2003. The act promotes the development of the power industry by promoting and encouraging competition, protecting consumers’ interests, ensuring electricity supply, electricity bill rationalisation, transparent subsidies policies, and promoting efficient electricity policies. The Central Electricity Authority (CEA) advises the government on policy matters regarding the country’s electricity system. It has a constitution under section 3(1) of the “Electricity Supply Act 1948”, which was superseded by section 70(1) of the “Electricity Act 2003”. The central electricity regulatory commission is a statutory body with “quasi-judicial status,” functioning under section 76 of the Electricity Act 2003 for rationalisation of the electricity tariff. Many state electricity regulatory commissions are also working for the development of power sector in the respective states. The Appellate Tribunal for Electricity APTEL was established in 2005 to appeal against the orders of the arbitrating officer or central and state electricity regulatory commissions under the Electricity Act 2003. In collaboration with the states, CEA (the ‘Central Electricity Regulatory Commission’) and other stakeholders, the Government of India (GOI) issued a revised tariff policy in 2016. The electricity is generated from conventional sources of energy such as coal and lignite, hydro, nuclear and natural gas power generation as well as from non-conventional RES such as solar, wind, biomass, small hydro, tidal, geothermal, waste to energy and hydrogen/ fuel cells, among others. The CEA, the Ministry of Power and the GOI consider the principles of sustainable development in the power sector and the development of generation capacity to meet the demand pattern, varying demand, efficient use of resources, availability of fuel and integration of Non-Dispatchable Renewable Energy Sources (NDRES) like wind and solar, during the planning process for electricity generation capacity addition [56].

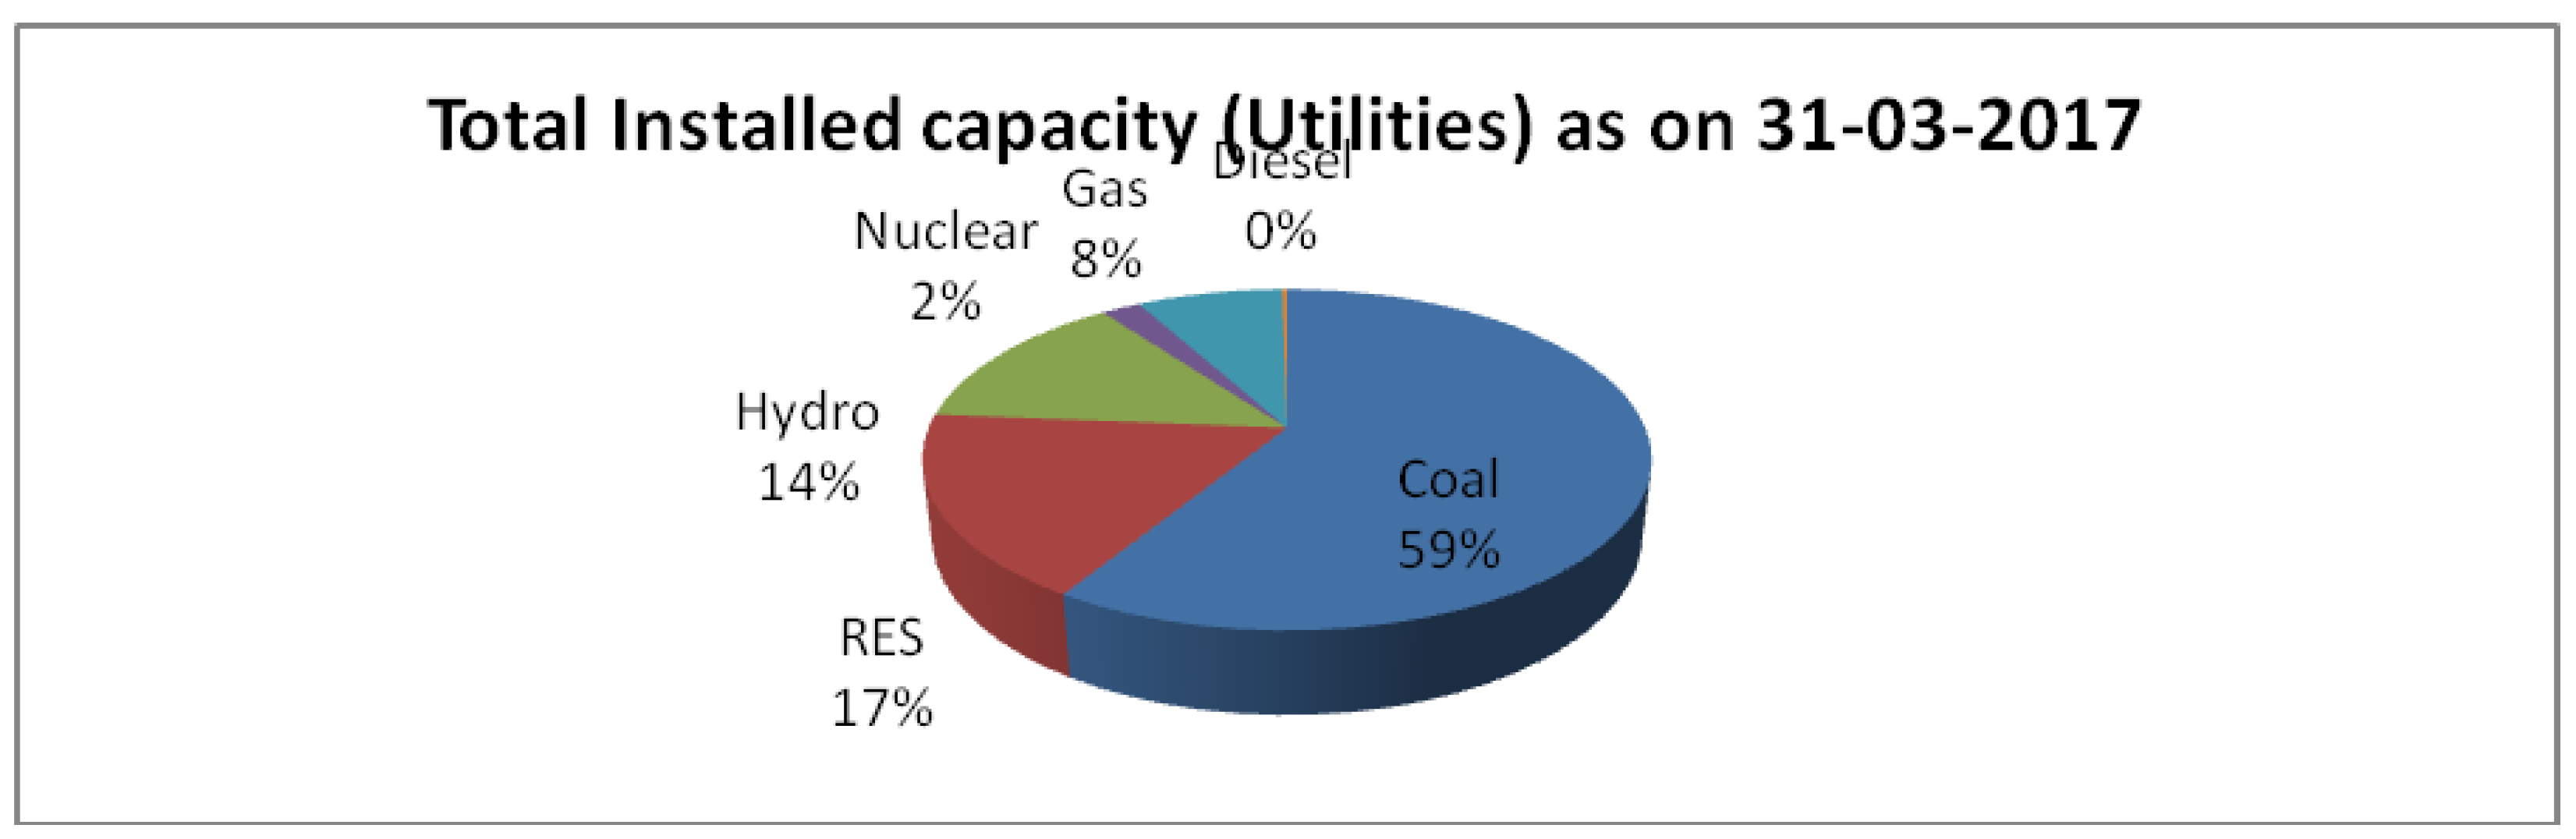
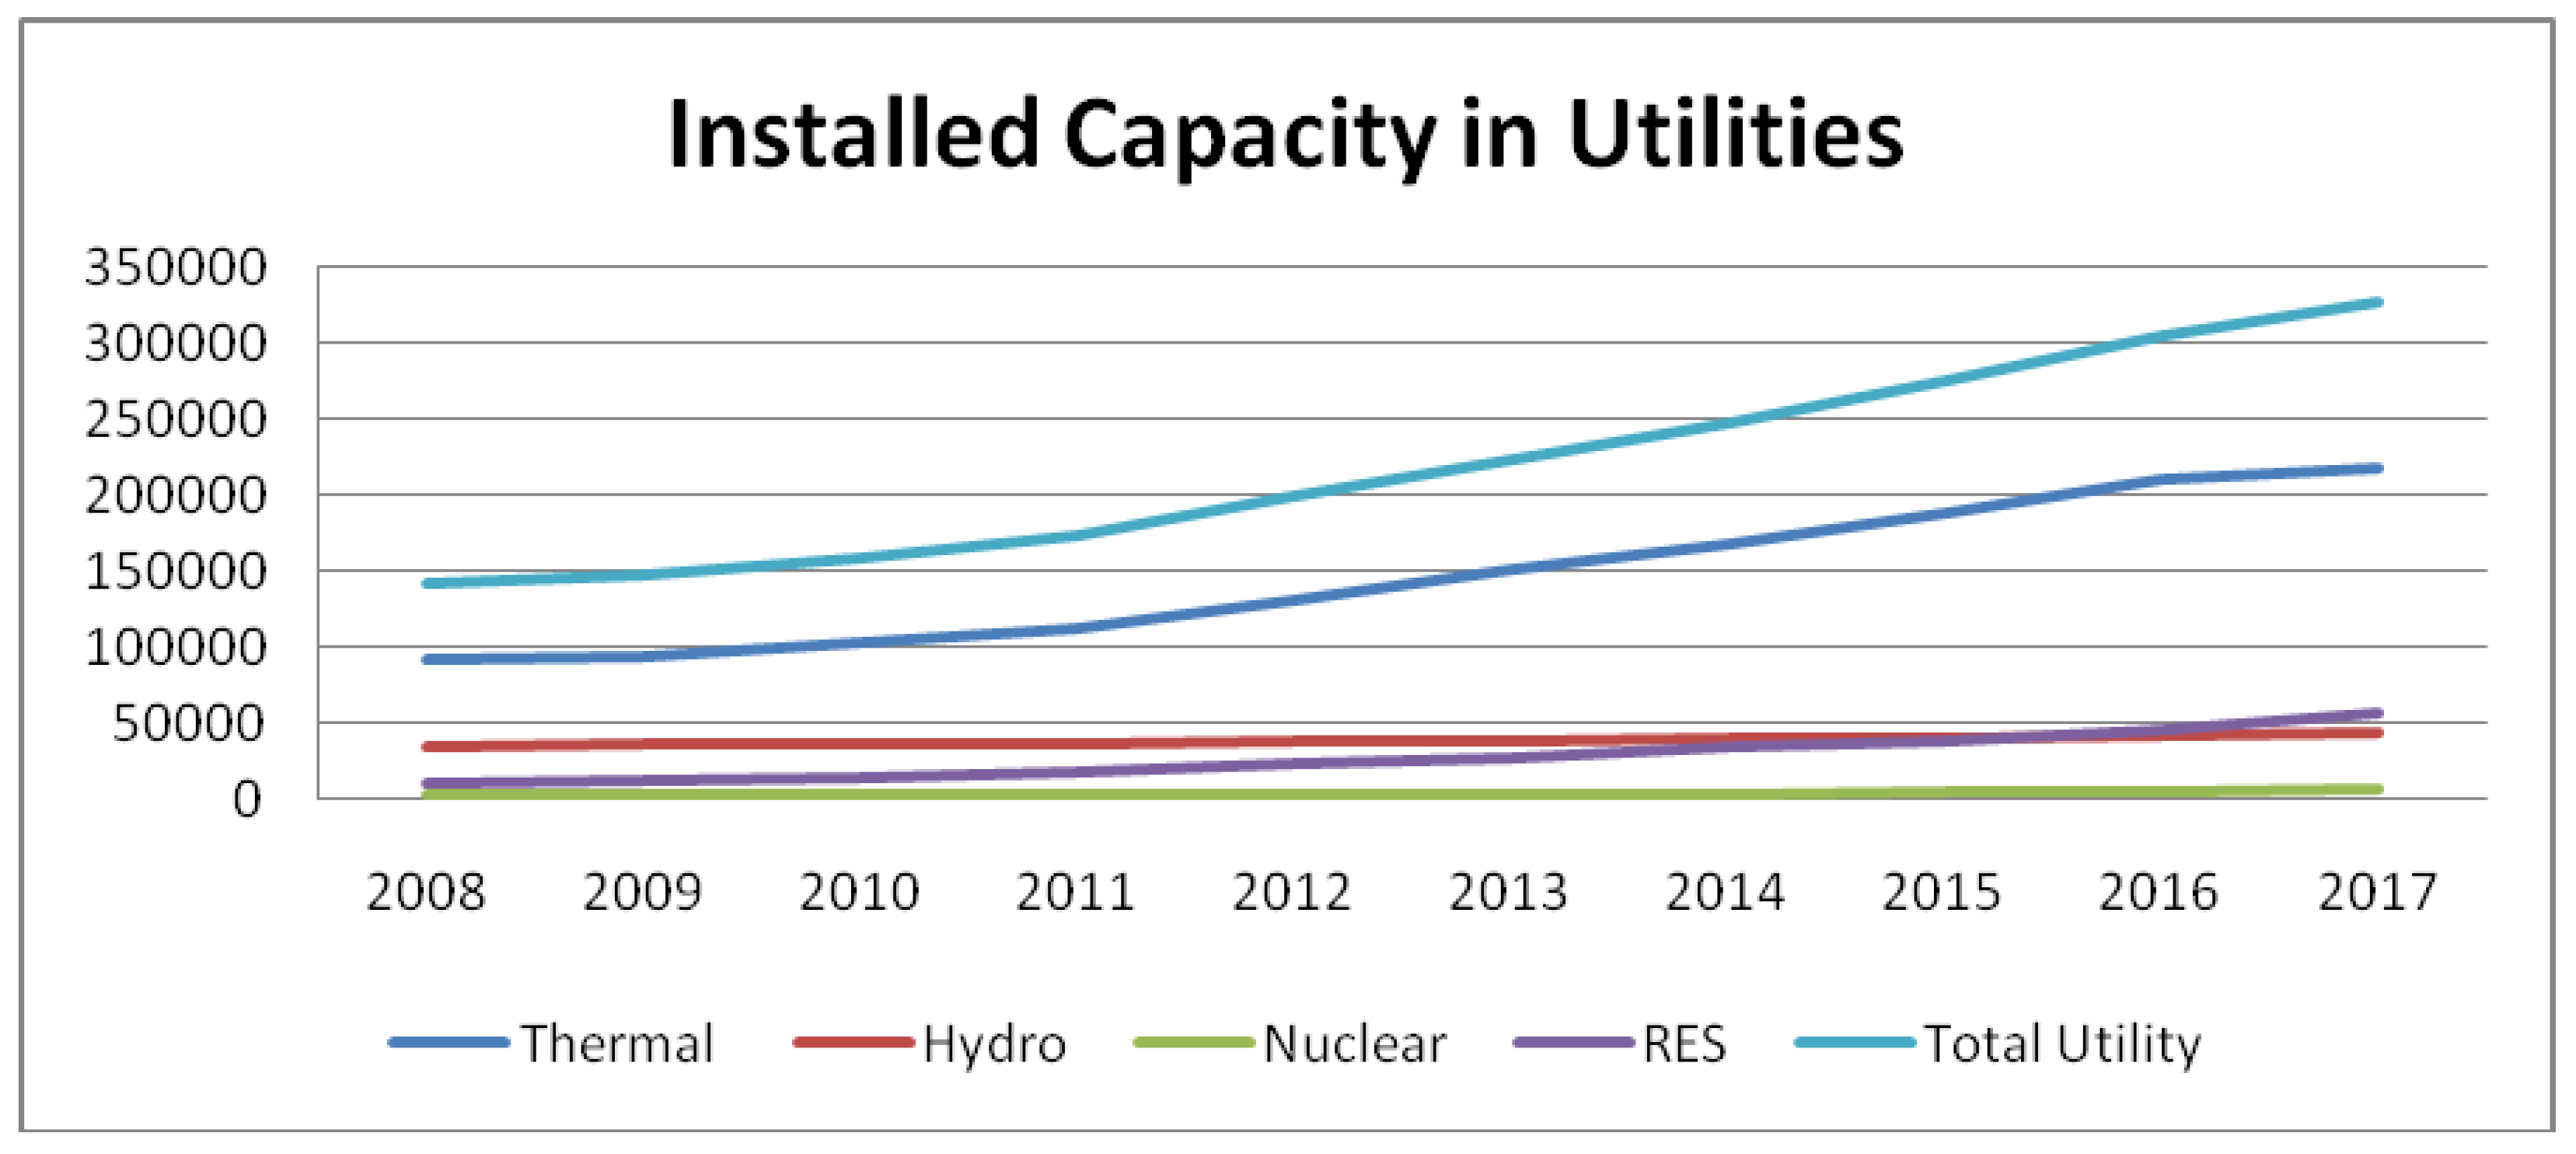
4.2.1. Installed Capacity of Power Generation

Figure 2 depicts the electricity installed capacity in the country as of March 31, 2017. India, the third-largest electricity producer and consumer in the world [57], has installed a generation capacity of 377,122 MW, including 326,833 MW in utilities and 50,289 MW in non-utilities. In 326,833 MW of the total installed capacity from utilities, thermal accounted for 218,330 MW (66.80%), followed by RES with 57,244 MW (17.51%), nuclear 6780 MW (2.07%) and hydro 44,478 MW (13.60%), as of March 2017. The generation capacity of power from utilities in India increased from 143,061 MW in 2008 to 326,833 MW in 2017 (8.61% CAGR), as shown in Figure 3.

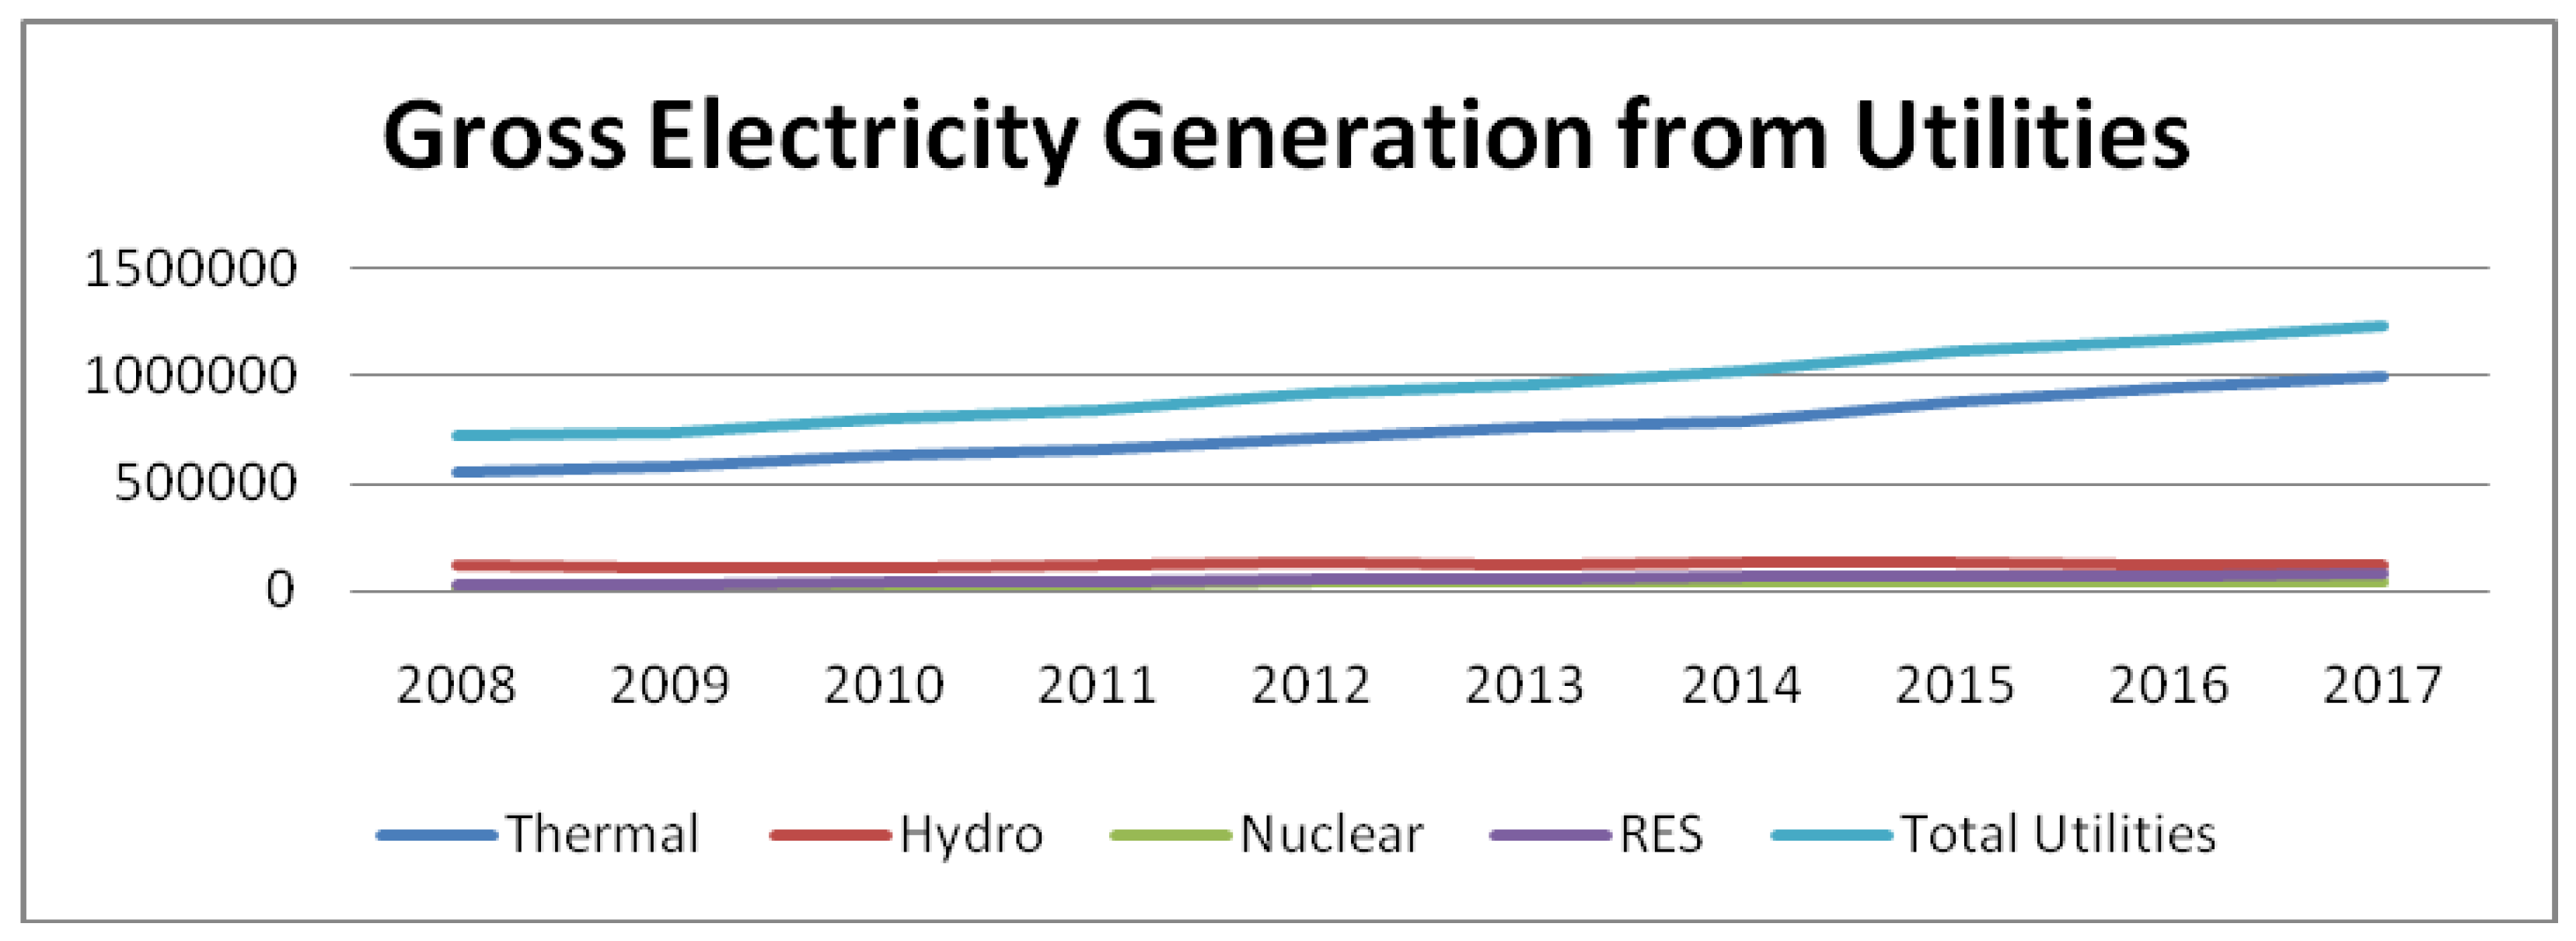
4.2.2. Generation of Electricity

The gross generation of electricity from utilities was 1,235,358 GWh during 2016–2017, in which 993,516 GWh was generated from thermal, 122,378 GWh from hydro and 37,916 GWh from nuclear, respectively (Figure 4). The non-utilities total output was 197,000 GWh. It rose from 722,625 GWh during 2007–2008 to 1,235,358 GWh during 2016–2017.

4.2.3. Import and Export of Electricity

India is gradually becoming an electricity exporting country. The gross importation of electricity decreased from 5897 GWh in 2008–2009 to 5617 GWh in 2016–2017. Similarly, the exportation of electricity has increased from 58 GWh in 2008–2009 to 6710 GWh in 2016–2017 [9] as depicted in Figure 5. India exports electricity to Bangladesh, Nepal and Myanmar, while Bhutan is the only power supplier to India. This trade of electricity takes place under bilateral Memorandum of Understandings and power Trade Agreements. The Ministry of Power issued import/export (Cross Border) guidelines for electricity in 2018 [58]. After adding the net import and purchase of electricity from non-utilities, the electricity available for supply in 2016–2017 was 1,168,317 GWh, while the loss of electricity due to transmission was 21.30%, a much higher loss rate than other countries.

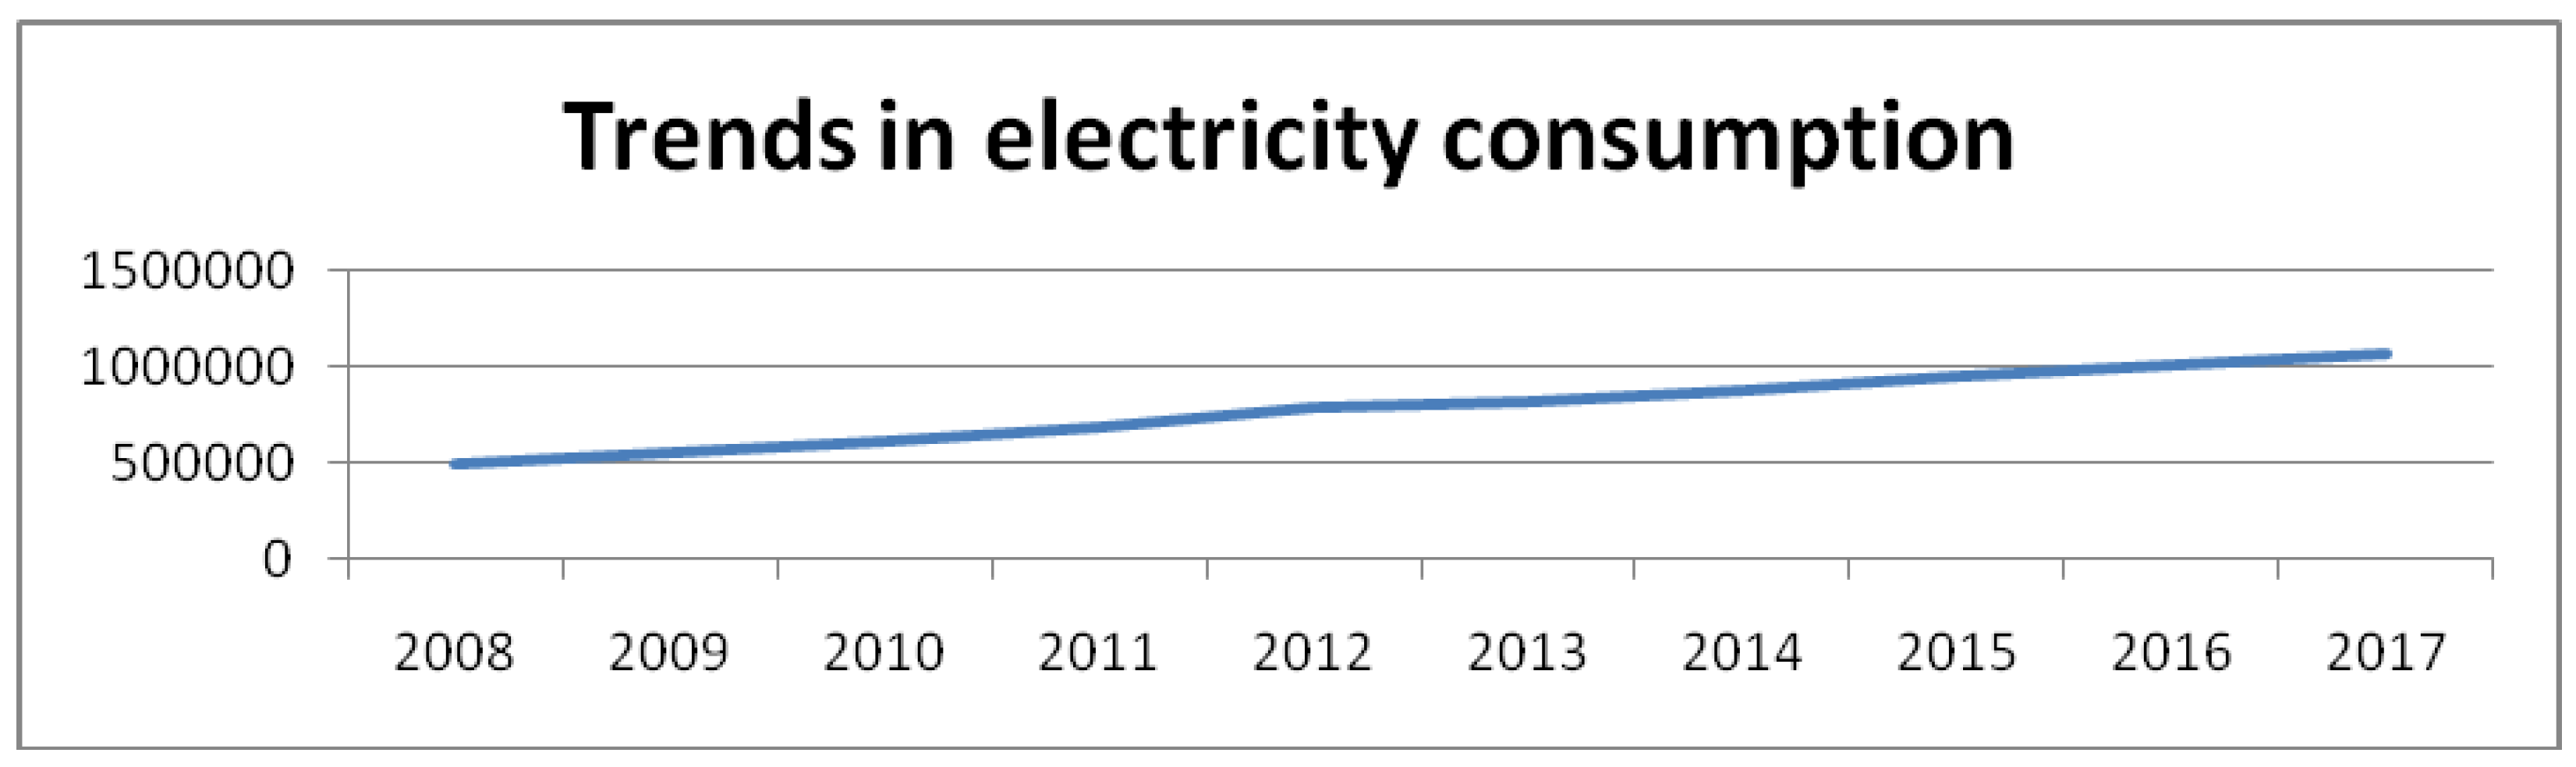
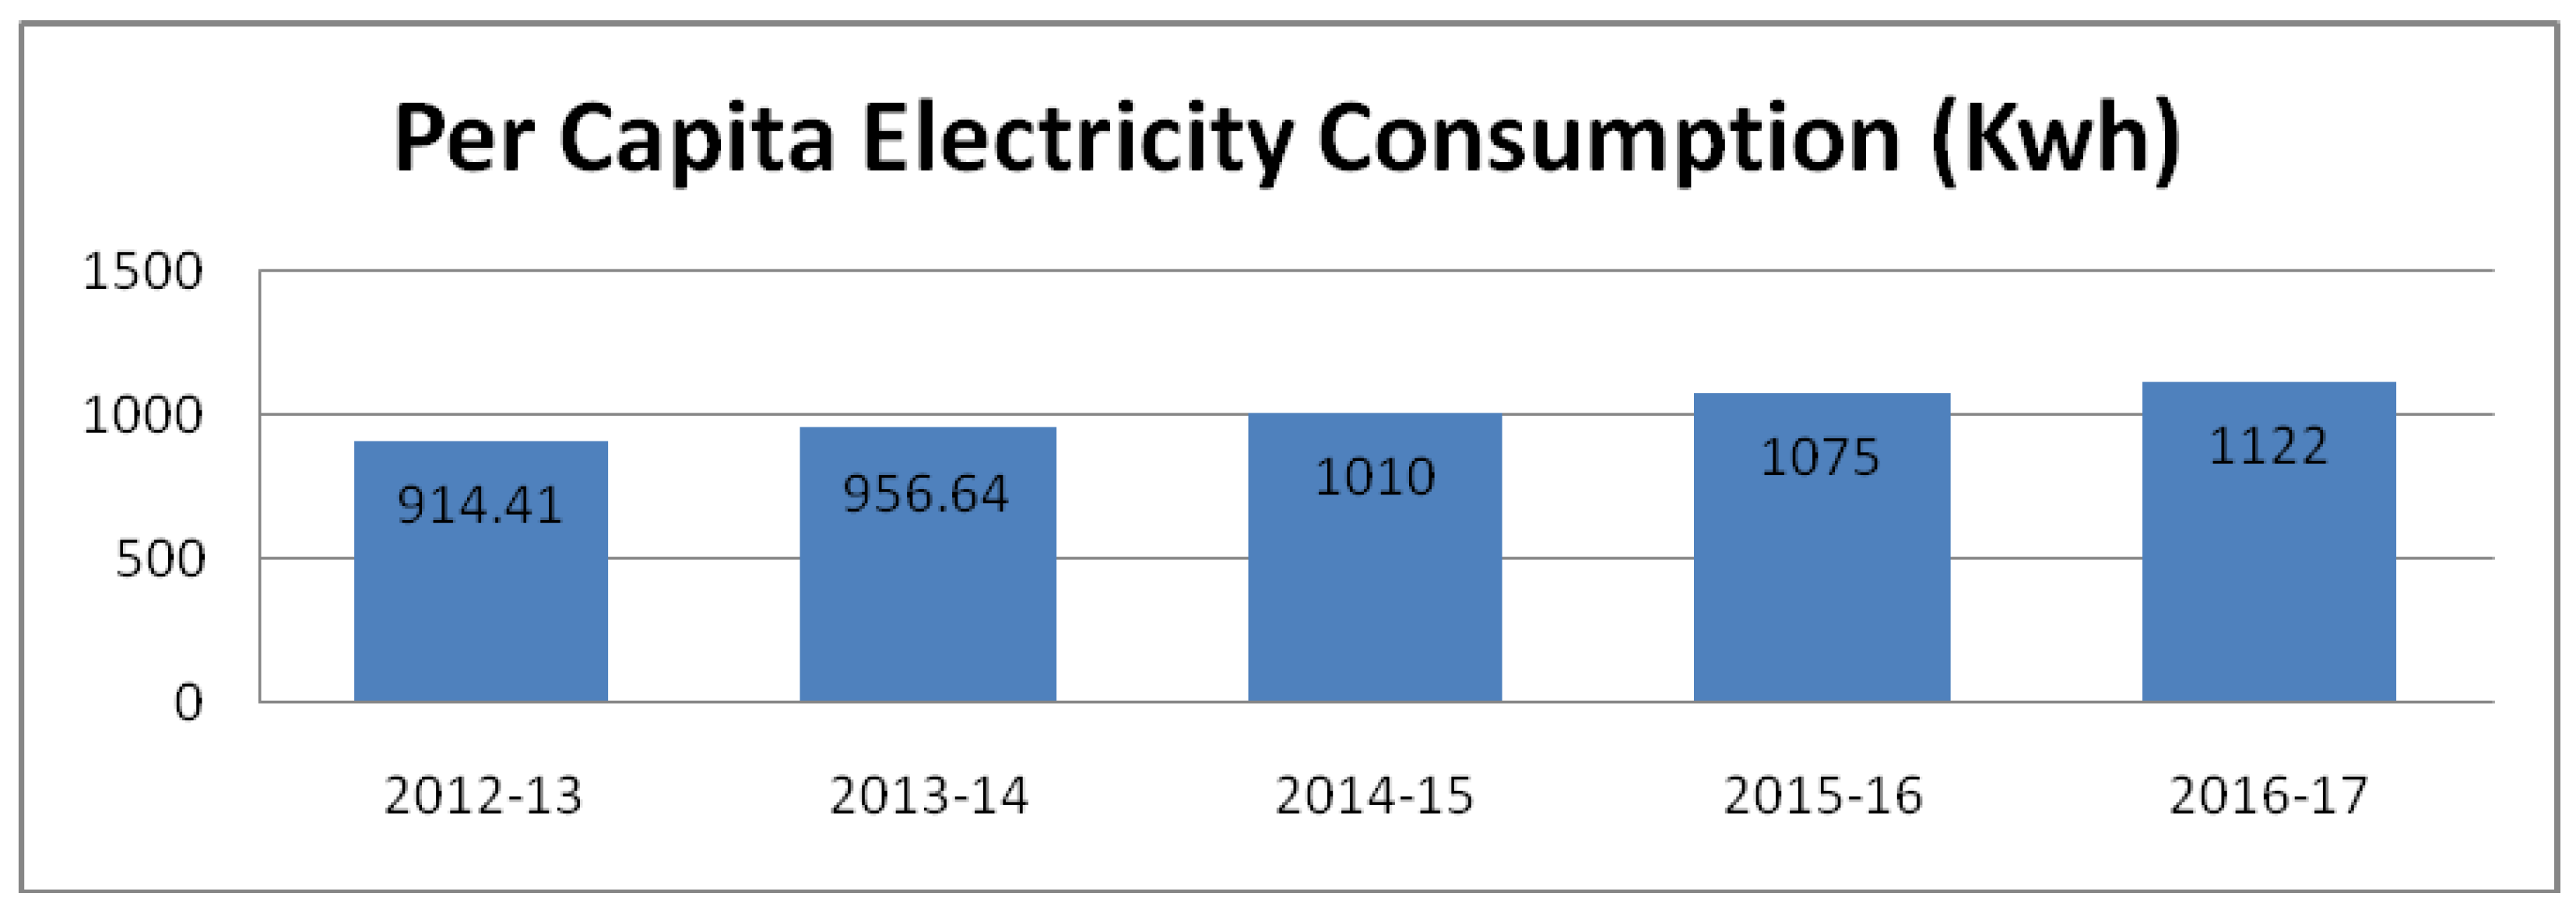
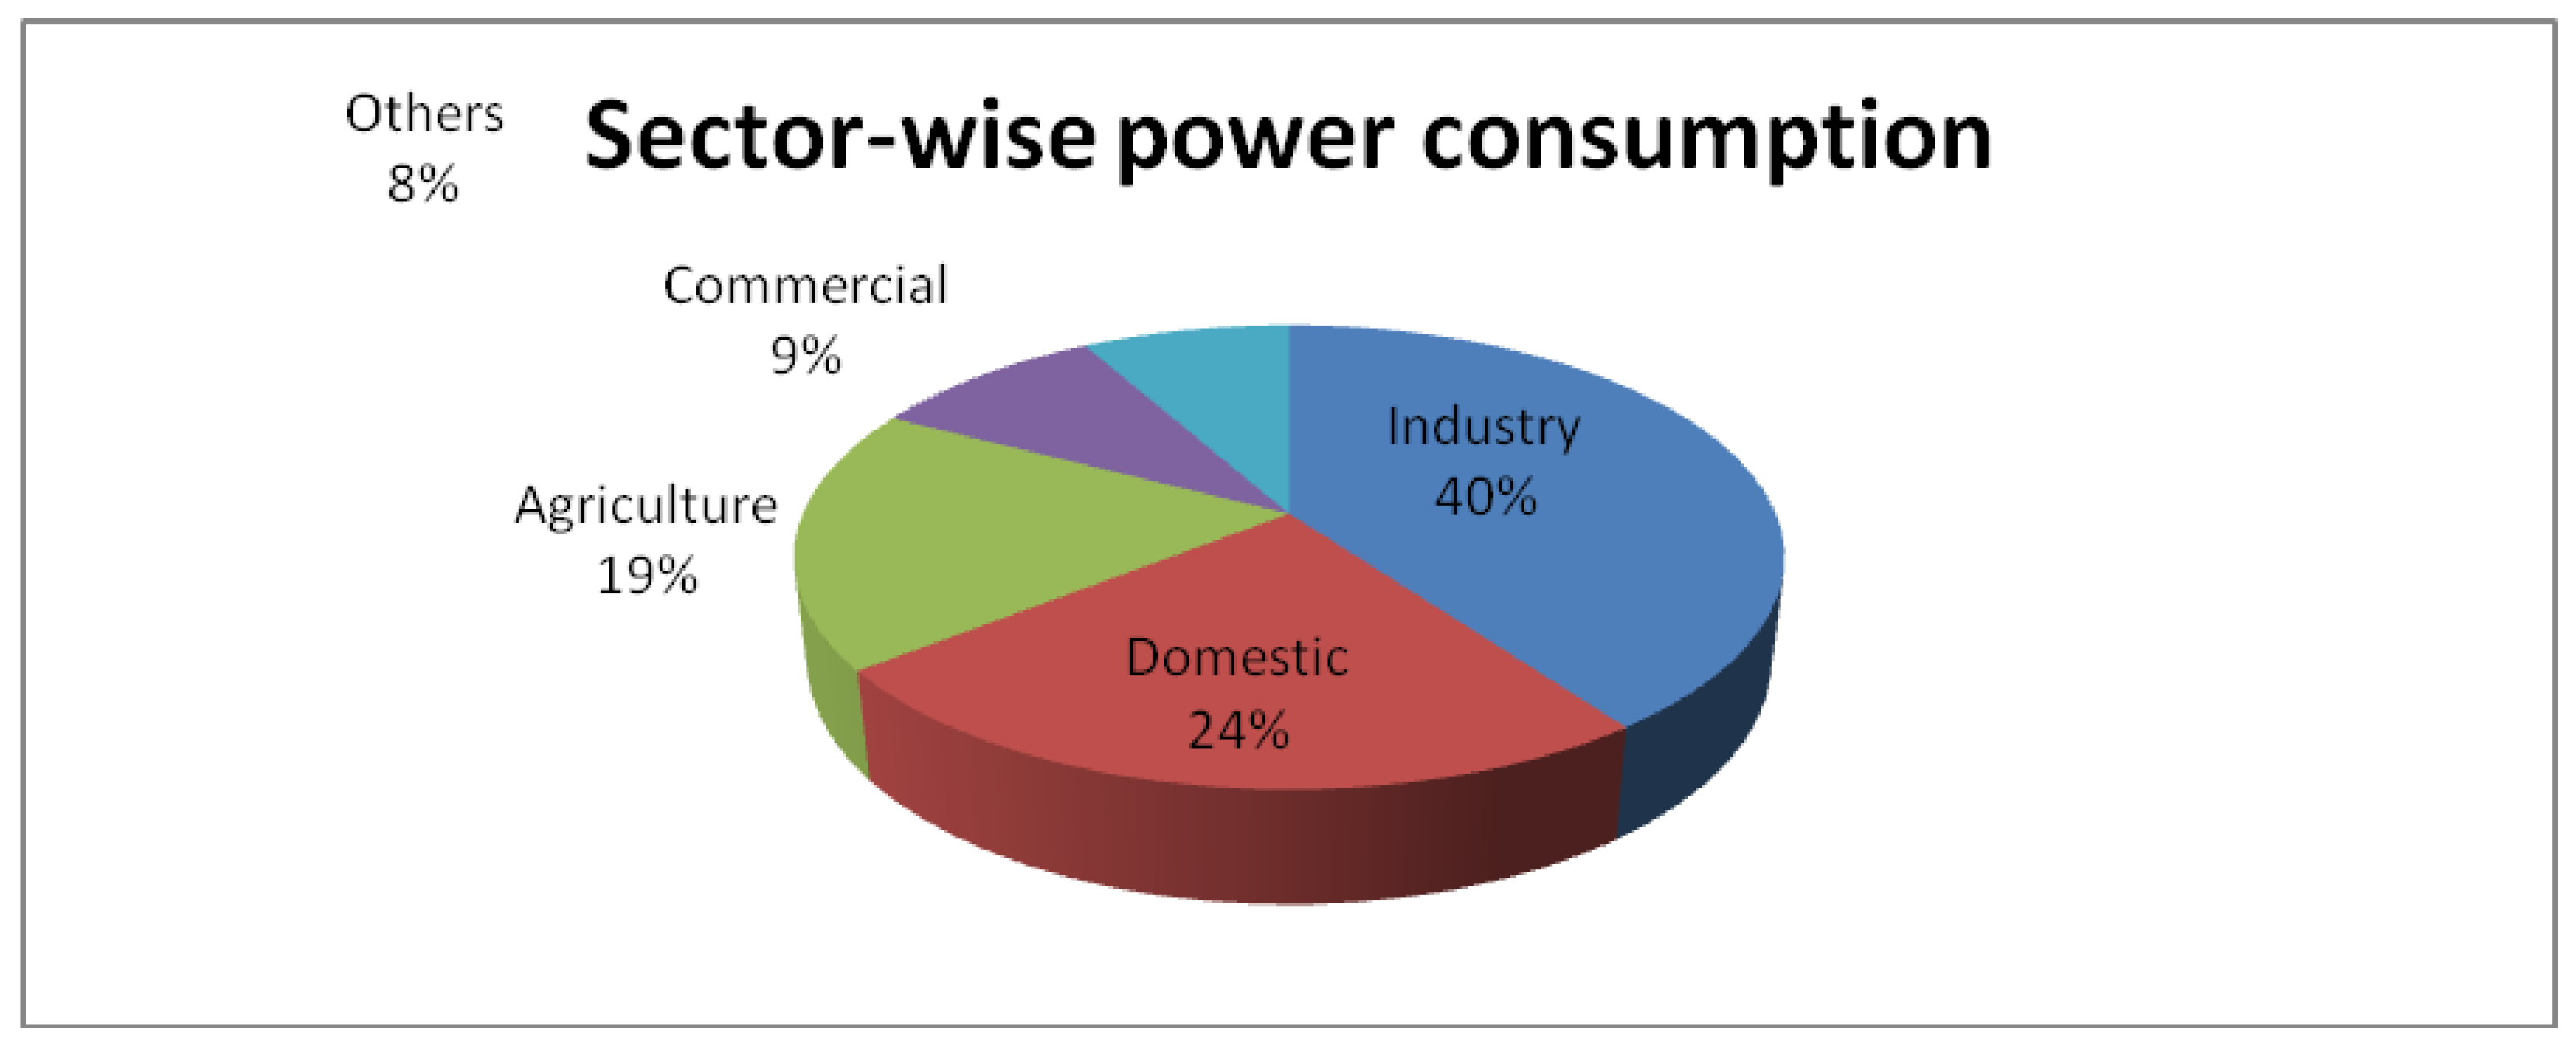
4.2.4. Consumption of Electricity

According to the report of [58,59], India has become the third-largest producer as well as consumer of electricity in the world. In 2016–2017, the estimated electricity consumption was 1,066,268 GWh. However, the average consumption of electricity per capita in India was only 1122 Kwh in 2017 [9], which is much lower than that of the world’s average per capita electricity consumption (see Figure 6). Despite having a lower tariff, the per capita electricity consumption of India is much lower compared to many other countries. Of India’s electricity consumption, industry consumed 40.01 percent of the total, followed by the domestic sector which consumed 24.32 percent, agriculture with a consumption of 18.33 percent and the commercial sectors with 9.22 percent, respectively as shown in Figure 7.

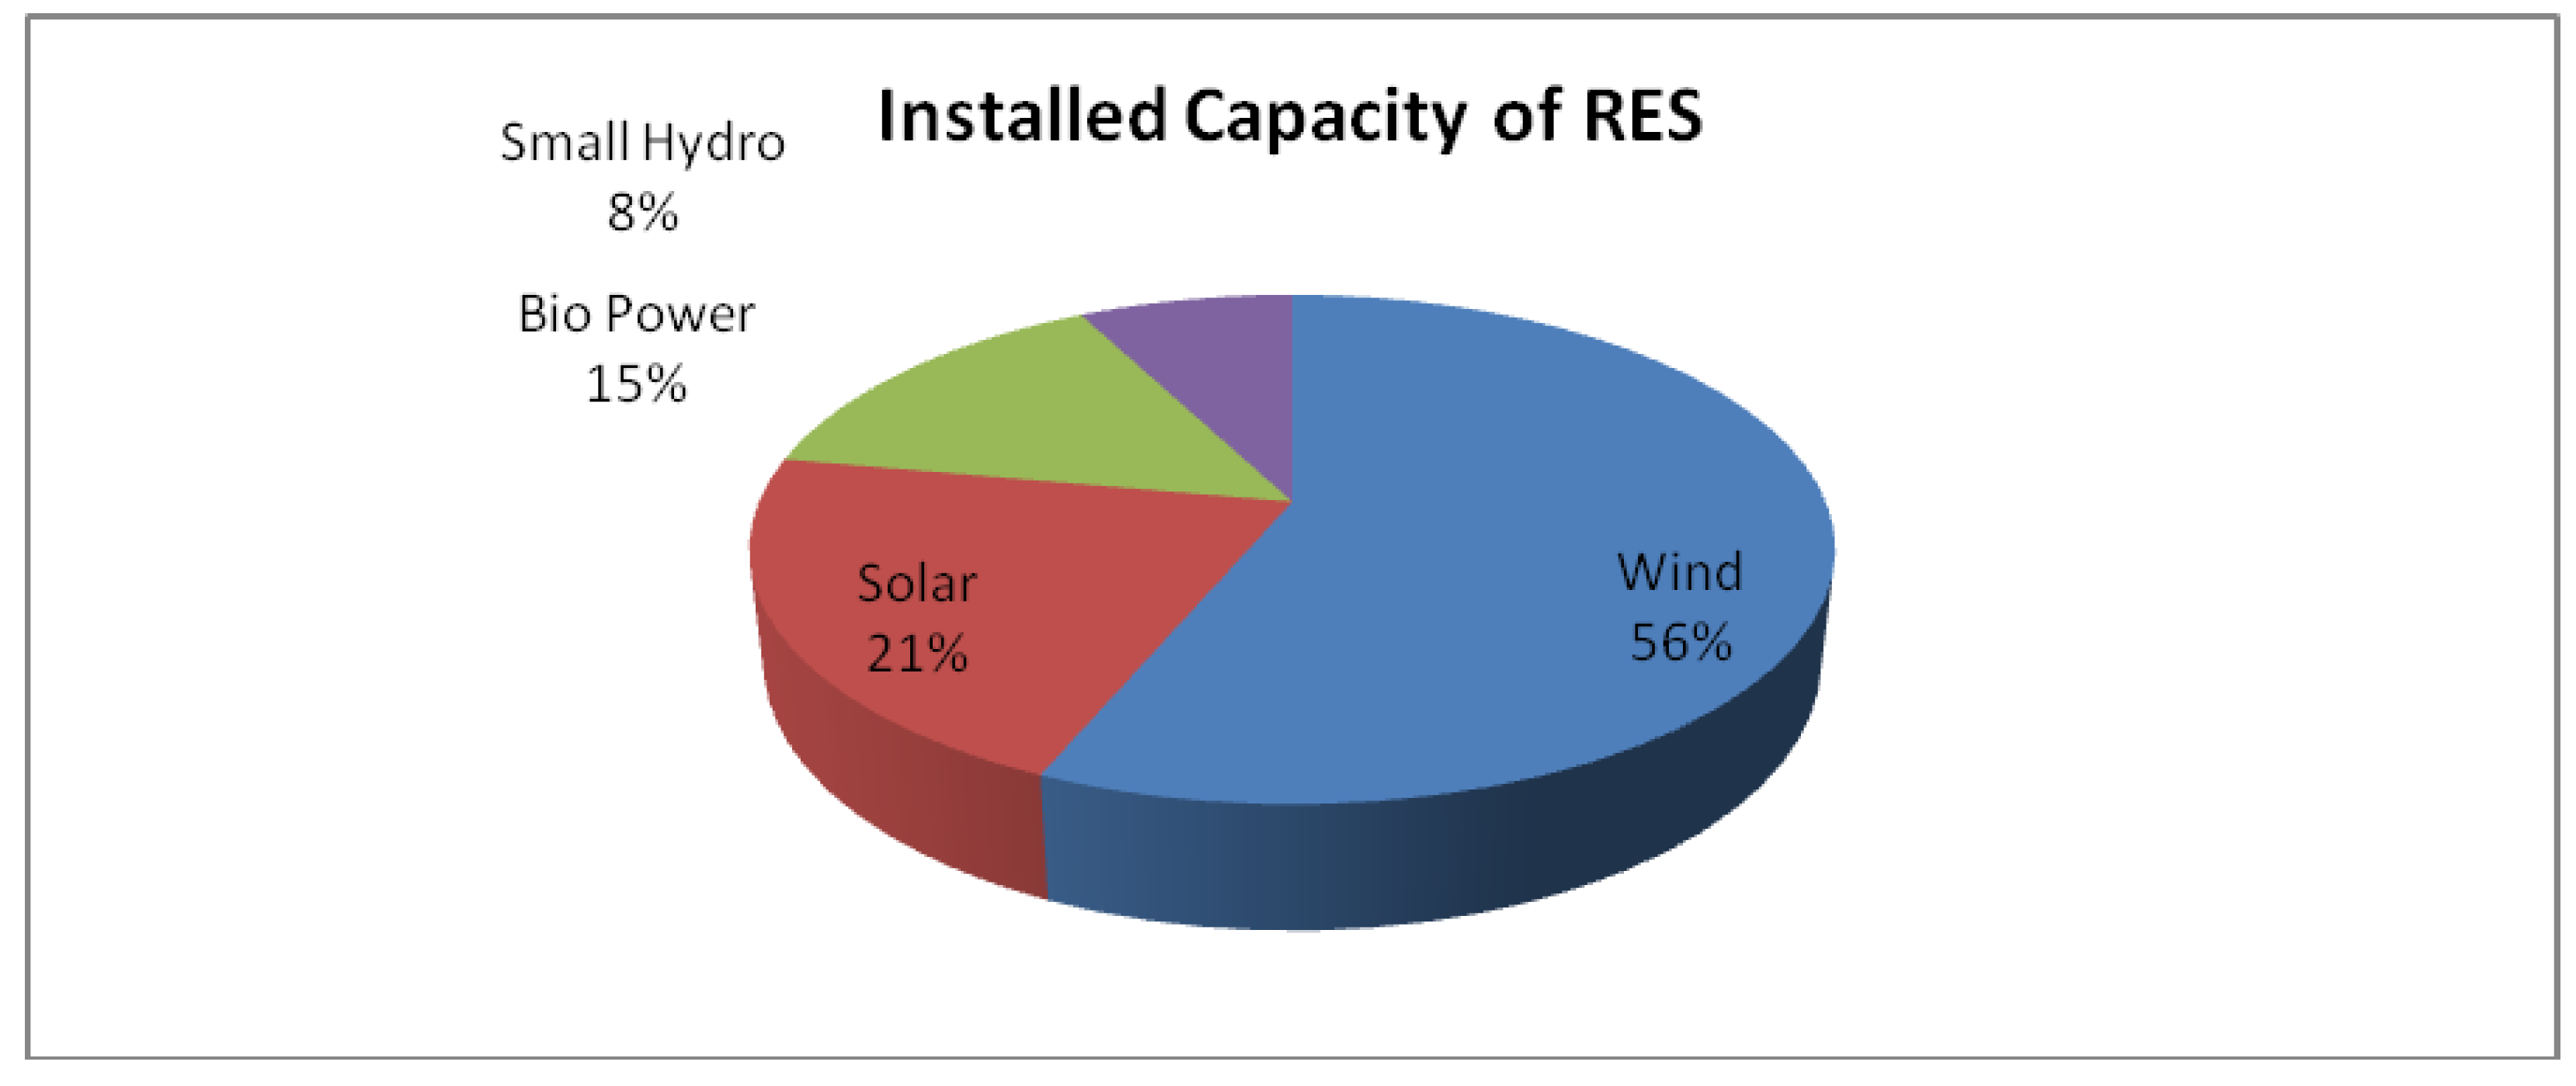
4.2.5. Renewable Energy in India

India is among the countries with the most significant production of energy from renewable sources. Including hydro, as of March 2017, renewable energy accounts for 31.12 percent of the total installed capacity from the utility in the country, while renewable energy sources other than hydro accounted for 57,244 MW, which is 17.51 percent of the total installed capacity. Wind power capacity was 32,280 MW, solar accounted for 12,288.83 MW, biopower accounted for 8295.78, and the small hydro plant has a capacity of 4379.86 MW (see Figure 8). A total of 175 GW has been targeted by the Government of India for installed capacity from RES by March 2022. The additional capacity anticipated from RES during 2022–2027 has been considered to be 100,000 MW, of which 50,000 MW will be from solar, 40,000 MW from wind, 7000 MW from biomass and 3000 MW from small hydro, respectively, to reach a target of 175 GW RES by 2021–2022 and 275 MW by 2027. There is a huge potential for power generation in India from RES. The total potential for generating renewable power in India in 2017 was projected to be 1,001,132 MW. These include 649,342 MW from solar, 302,251 MW from wind, 21,134 MW from small-hydro, 18,601 MW from biomass, 7260 MW from “bagasse-based” cogeneration in sugar mills and 2554 MW from waste to energy. The detailed estimated potential for renewable energy in India is presented in Section 4.3.

4.3. State-Wise Scenario of the Power Sector

The installed state-wise and region-wise capacity of power generation as of 31st March 2017 and the per capita power consumption during 2016–2017 have been reported. Furthermore, the state-wise and region-wise projected energy requirement and peak demand for 2021–2022 and 2026–2027, and the estimated potential of renewable power, were also investigated. Dadra and Nagar Haveli have the highest electricity consumption per capita with 15,783 Kwh, while Bihar has the lowest consumption in the country, with 272 Kwh for 2016–2017. In India, the per capita power consumption was 1122 Kwh in 2017, far lower than many developed countries. Maharashtra has the highest projected energy requirement and peak demand for 2021–2022 and 2026–2027, followed by Uttar Pradesh, Tamil Nadu and Gujarat. Rajasthan has the highest share of the estimated potential of renewable power generation, at about 16.21 percent (i.e.,162,326 MW), followed by Gujarat with 12.17 percent (i.e., 121,791 MW) and Jammu and Kashmir with 11.27 percent (i.e., 112,800 MW), mainly from solar power potential.
The North region accounted for 26 percent of the total installed generating capacity of electricity. In the North Region, per capita consumption for Uttar Pradesh is well below the national average at 585 Kwh. Other states are above the national average, with Punjab having the highest per capita power consumption of 2028 Kwh, followed by Haryana (1975 Kwh), Delhi (1574 Kwh), Uttarakhand (1454 Kwh), Himachal Pradesh (1340 Kwh), Jammu and Kashmir (1282 Kwh), Rajashthan (1166 Kwh) and Chandigarh (1128 Kwh). The average per capita power consumption for the North region was 1003 Kwh in 2016–2017. The North region has the second-highest projected energy requirement and peak demand for 2021–2022 and 2026–2027. This region has a very high potential of 373,398.48 MW power generation from renewable sources.
The Western region accounted for the highest share of 34 percent of the total installed generating capacity of electricity. The average per capita power consumption for the West region is above the national average, with a per capita consumption of 1533 Kwh. The per capita power consumption of Madhya Pradesh is below the national average, at 989 Kwh. In the West region, Dadra and Nagar Haveli has the highest consumption of 15,783 Kwh, followed by Daman and Diu (7965 Kwh), Goa (2466 Kwh), Gujarat (2279 Kwh), Chhattisgarh (2016 Kwh), Maharashtra (1307 Kwh) and Madhya Pradesh (989 Kwh). The Western region has the highest projected energy requirement and peak demand for 2021–2022 and 2026–2027. This region has a high potential of 248,616.79 MW power generation from renewable sources.
The South region accounted for 27 percent of the total installed generating capacity of electricity. In the South Region, per capita consumption for Kerala and Lakshadweep is well below the national average at 763 Kwh and 633 Kwh, respectively. Other states are above the national average, with Tamil Nadu having the highest per capita power consumption of 1847 Kwh, followed by Puducherry (1784 Kwh), Telangana (1551 Kwh), Karnataka (1367 Kwh) and Andhra Pradesh (1319 Kwh). The average per capita power consumption for the South region was 1432 Kwh, above the national average in 2016–2017. The South region has the third-highest projected energy requirement and peak demand for 2021–2022 and 2026–2027. This region has a potential of 225,985.37 MW power generation from renewable sources.
The Eastern region accounted for 12 percent of the total installed generating capacity of electricity. The average per capita power consumption for the Eastern region is well below the national average at 694 Kwh, with Bihar having the lowest per capita consumption of 272 Kwh. Odisha is the only state in the Eastern region with per capita power consumption above the national average at 1622 Kwh. It has the highest per capita consumption in the region, followed by Jharkhand (915 Kwh), Sikkim (806 Kwh), West Bengal (665 Kwh), Andaman and Nicobar Islands (370 Kwh) and Bihar (272 Kwh). The Eastern region has the fourth-highest projected energy requirement and peak demand for 2021–2022 and 2026–2027. This region has a potential of 73,198.25 MW power generation from renewable sources.
The Northeast region accounted for only one percent of the total installed generating capacity of electricity. Per capita consumption for the Northeast region is well below the national average at 392 Kwh. Meghalaya has the highest per capita power consumption of 832 Kwh, followed by Arunachal Pradesh (648 Kwh), Mizoram (523 Kwh), Tripura (470 Kwh), Nagaland (345 Kwh), Assam (339 Kwh), and Manipur (326 Kwh). The Northeast region has the fifth-highest projected energy requirement and peak demand for 2021–2022 and 2026–2027. This region has a potential of 60,873.45 MW power generation from RES.

4.4. Electricity Demand Projections for India

Various agencies and investigators have made projections for energy demands in India; these reports have a substantial spread in energy demand forecasts. According to the World Bank, with expected GDP growth at an average of 7 percent every year, demand for electricity in India would be almost tripled between 2018 and 2040 [11]. In another report, nine electricity demand projections were generated for three scenarios of GDP growth and three levels of energy efficiency. Aggregate demand could grow from 949 TWh in 2015 to 2338 TWh in 2030 [60]. The Energy Resources Institute (TERI) presented the future electricity mix in its report in 2017, based on two scenarios: a ‘High Renewables Scenario (HRES)’ and a ‘Low Renewables Scenario (LRES)’. In the HRES, the renewable energy capacity increases by 125 GW in 2021–2022, 225 GW in 2025–2026 and 803 GW in 2029–2030 from 50 GW, respectively. The LRES is based on a lower trajectory of renewables; here, capacity addition was taken to be 75 GW during the first five years and 100 GW in the five years after that [61]. The aggregate projected electricity energy requirement in MU and peak demand in megawatt are presented in Table 3.
The national electricity plan surveyed the periods of 2021–2022 and 2026–2027 to identify the optimal capacity mix based on the demand of electricity, considering various initiatives by GOI, such as RES capacity targets by 2022 with committed capacity. The present study suggests an optimization model intending to minimize the cost of generation considering various other constraints.

5. Electrical Energy Production Modeling

In this section, we discuss the constraints and parameters of modeling the electrical energy system.

5.1. Constraints for Electric Energy Production

The optimum mix of electricity generation can be viewed as an optimisation problem, where the objective is to minimise the operating cost of the existing plants and levelized cost of capital and operating new generating stations satisfying a different set of constraints or limitations in the system, which include: “
  • Renewable capacity addition targets fixed by Government;
  • Must Run Status for Renewable Energy Sources;
  • Loss of Load Probability;
  • Energy Not Served;
  • Provision of Reserve Margin;
  • International commitments by the country;
  • Emission limits if any; and
  • Current Energy mix.
”The various decision variables of the problem are as follows:
X 1 = Installed Capacity of Hydro
X 2 = Installed Capacity of Coal
X 3 = Installed Capacity of gas
X 4 = Installed Capacity of nuclear
X 5 = Installed Capacity of solar thermal
X 6 = Installed Capacity of solar PV
X 7 = Installed Capacity of Wind
X 8 = Installed Capacity of Biomass
X 9 = Installed Capacity of Small Hydro.

5.1.1. Renewable Capacity Addition Targets Fixed by Government

The GOI recently set a target to achieve 175 GW capacity installed from RES by March 2022 (see Table 4). Additional capacity anticipated from RES during 2022–2027 has been considered to be 100,000 MW, of which 50,000 MW would be from solar, 40,000 MW from wind, 7000 MW from biomass and 3000 MW from small hydro, respectively, to reach a target of 175 GW RES by 2021–2022 and 275 MW by 2027 (see Table 4).

5.1.2. Must Run Status for Renewable Energy Sources

Must Run Renewable Energy Sources, such as solar, wind, nuclear and hydro projects, followed by gas being given priority, are considered the “must run projects” based on their potential. During 2017–2022, the additional capacity of hydro is estimated to be about 6823 MW, and that of nuclear about 3300 MW, while hydro is projected to total 12,000 MW, and the additional capacity of nuclear is projected to total 6800 MW in the years 2022–2027 (see Table 5). Renewable capacity is also considered a “must-run” capacity. The expected import of hydro during 2021–2022 is 4356 MW, and during 2026–2027 it is 21,600 MW. Projected capacity after addition of hydro in 2017–2022 is 51,301.42 MW; for nuclear it is 10,080 MW and for gas it is 25,735.38 MW. For 2022–2027, the projected capacity of hydro is 63,301.42 MW, for nuclear is 16,880 MW, and for gas it is 25,735.38 MW.

5.1.3. Loss on Load Probability and Energy Not Served

This is the probability of an electricity system failing to serve the peak load. It can be described as the proportion of days or hours in a year when the available capacity generated is insufficient to meet the peak demand. Energy Not Served can be expressed as a fraction of the total energy required, which is expected not to be supplied to the consumers by the electricity system. It is the unmet energy demand in the number of hours in a year. LOLP and ENS are used as reliability criteria for electricity systems. LOLP of 0.2 percent and ENS of 0.05 percent are adopted for electricity planning in India.

5.1.4. Provision for Reserve Margin

Future electricity demand is challenging to forecast with accuracy, therefore, as a simple strategy, a capacity with more supply than may be required is maintained as it would take years to build new power generation capacity. “Reserve margin = (Capacity − Demand)/Demand, where capacity is the expected maximum available supply and demand expected peak demand”. A 5% spinning reserve for conventional plants is required as per the National Electricity Plan in India.

5.1.5. International Commitments by India

The Indian Government is committed to achieving “energy autonomy and to provide clean, affordable, reliable and sustainable power for all”. The GOI has made the international commitment (INDC) to have at least 40 percent electric power capacity installed from non-fossil fuel-based sources cumulatively by the year 2030 and to reduce the intensity of its GDP emissions by 33 percent to 35 percent by the year 2030 from the levels in 2005. The non-fossil fuel energy sources include hydro, nuclear and RES. The Government of India recently set a target of achieving 175 GW installed electricity capacity from renewable energy sources (RES) by March 2022. More emphasis is given to developing a non-fossil fuel-based generation of power, that is, hydropower, to the greatest extent possible, shifting towards more efficient supercritical technologies for coal-based power plants.

5.1.6. Emission Limits

The Indian government has made an international commitment (INDC) to reduce its GDP emission intensity by 33 to 35 percent by 2030 from the levels in 2005. Therefore, the installed capacity of thermal sources (coal, gas, diesel and ignite) of electricity should be those with smaller emissions than the prescribed emission limit for the government’s INDC goal for emissions intensity. The estimate of the total emission of CO2 from the “grid-connected” power stations during 2005 was 462 million tonnes. The emission of CO2 resulting from the power sector was estimated to reach 1026 million tonnes at the end of 2021–2022 and 1173 million tonnes at the end of the year 2026–2027, respectively. Emission intensity is likely to reduce by 40.51 percent and 53.65 percent, respectively, at the end of 2021–2022 and 2026–2027 from the 2005 level [62]. In the year 2005, the emission intensity in India was 0.015548 kg CO2/GDP. The GDP in 2005 was Rs 2971464 crore at factor cost [1,31,37]. For the present study, 2005 has been taken as the base year, and GDP at factor cost for 2021–2022 and 2026–2027 has been projected, assuming an annual GDP growth rate of 7 percent. Available GDP of 2013–2014 at the base price of 2005 was Rs 5,741,791 crore [63]. Projected GDP for 2021–2022 is Rs 9,865,466 crore, and for 2026–2027 it is Rs 13,836,826 crore (see Table 6). Emission intensity in 2005 was 0.015548 kg CO2/Rs GDP [64]. The Government of India has made an international commitment (INDC) to reduce the emissions intensity of its GDP by 33 to 35 percent by the year 2030 from the 2005 level. For the present study, we have assumed achievement of this target by 2026–2027. Therefore, in 2026–2027 the emission intensity should reduce to 0.010062 kg CO2/Rs GDP. Therefore, total allowed emissions should be 0.010062 98 , 654 , 660 , 000 , 000 = 992 , 663 , 188 , 920 kg for the year 2021–2022 and 0.010062 138 , 368 , 260 , 000 , 000 = 1 , 392 , 261 , 432 , 120 kg for the year 2026–2027.
Table 7 shows CO2 emission factors for different power generation systems [50,64]. A coal-based electricity generation system has a substantial CO2 emission factor. As the installed capacity of power generation is primarily coal-based, coal is a significant source of emitting carbon dioxide in India. Therefore, if RES usage increased and thermal efficiency improved, the CO2 emissions in India would be reduced significantly.

5.1.7. Current Energy Mix in India

The installed capacity of electricity in India as of 31 March 2017 was 326,833 MW. Of the 326,833 MW of total installed capacity, coal accounted for 192,163 MW, nuclear 6780 MW, hydro 44,478 MW, diesel accounted for 838 MW, and gas accounted for 25,329 MW. India is among the largest producers of energy from renewable sources. RES accounted for 57,244 MW with wind power capacity accounting for 32,280 MW, solar accounting for 12,288.83 MW, biopower accounting for 8295.78, and the small hydro plant has a capacity of 4379.86 MW (see Table 8). Installed capacity of coal up until 31 March 2017 was 192,163 MW, 22,716 MW to be retired until 2022 (see Table 5) while 47,855 MW are under-construction and to be completed during 2017–2022 [62]. Therefore, the likely capacity of coal would be 217,302 MW in 2021–2022.
The various cost components of electricity production are the capital cost, operation and maintenance cost, and fuel cost. The cost of electricity production also depends upon specific fuel consumption, capacity factor, auxiliary consumption and plant life (see Table 2). In the current study, the technology-specific and overall cost of electricity was computed with the help of a levelized energy formula Equation (6).

5.2. Mathematical Model Formulation

In this section, we formulate three models with the objectives of minimizing the levelized cost of electricity, minimizing the total present value of the cost of energy, and maximizing the present value of total energy produced. In order to optimise the system cost, we introduce installed capacities as variables with the respective costs of the generation technologies and specified constraints. LCOE is calculated by dividing all expected “technology lifetime costs by the total energy production” throughout its lifetime. The present value of the cost of energy is computed as the ratio of the present value of the cost of the installed capacity to the present value of energy produced over the lifetime of the plants, while the last objective is calculated as the present value of total energy produced over the lifetime of different plants. The complete mathematical formulation is presented in Equatinos (7)–(20).
min Z 1 = 37.674 X 1 + 52.838 X 2 + 81.569 X 3 + 61.399 X 4 + 73.698 X 5 + 39.479 X 6 + 29.172 X 7 + 89.380 X 8 + 35.082 X 9 ;
min Z 2 = ( 1228.431 X 1 + 2629.385 X 2 + 2029.527 X 3 + 3576.471 X 4 + 1471.684 X 5 + 649.9936 X 6 + 736.7164 X 7 + 4622.645 X 8 + 1422.595 X 9 ) / ( 32.60631 X 1 + 49.76247 X 2 + 24.88098 X 3 + 58.25021 X 4 + 19.96949 X 5 + 16.46369 X 6 + 25.25431 X 7 + 51.71852 X 8 + 40.55516 X 9 )
max Z 3 = 32.60631 X 1 + 49.76247 X 2 + 24.88098 X 3 + 58.25021 X 4 + 19.96949 X 5 + 16.46369 X 6 + 25.25431 X 7 + 51.71852 X 8 + 40.55516 X 9
subject to:
3.031184 X 1 + 4.98385 X 2 + 2.4919 X 3 + 5.41512 X 4 + 2.0 X 5 + 1.648885 X 6 + 2.52929 X 7 + 5.52258 X 8 + 3.905259 X 9 1 , 566 , 023
33.75 X 1 + 5154.4 X 2 + 788.94 X 3 + 142.13 X 4 + 88.94 ( X 5 + X 6 ) + 74.99 X 7 + 613.62 X 8 + 43.39 X 9 992 , 663 , 189
X 1 + X 4 + X 5 + X 6 + X 7 + X 8 + X 9 0.40 ( X 1 + X 2 + X 3 + X 4 + X 5 + X 6 + X 7 + X 8 + X 9 )
12 , 289 X 5 + X 6 100 , 000
44 , 478.42 X 1 51 , 301.42 ,
169 , 447 X 2 217 , 302 ,
26 , 167.01 X 3 26 , 573.01 ,
6780 X 4 10 , 080 ,
32 , 280 X 7 60 , 000 ,
8295 X 8 10 , 000 ,
4380 X 9 5000 .
Equation (7) is related to optimizing the levelized costs of energy by individual technologies. Equation (8) is related to optimizing the levelized costs of energy by all technologies. Equation (9) is related to optimizing the present value of energy by all technologies. These Equations (7)–(9) are derived from Table 2.
The constraints of the above optimization model are explained as follows:
Constraint Equation (10) is related to the unit production of electricity in a year derived from Table 2 and Table 3. Constraint Equation (11) is related to CO2 emissions limit during a year. The coefficient of the constraint is derived from Section 5.1.6, Table 2 and Table 7. Constraint Equation (12) is related to non-fossil fuel derived from Section 5.1.5. Constraint Equation (13) is related to solar installed capacity derived from Table 4. Constraint Equation (14) is related to hydro installed capacity derived from Table 5 and Table 8. Constraint Equation (15) is related to coal installed capacity derived from Section 5.1.6. Constraint Equation (16) is related to gas installed capacity derived from Table 5 and Table 8, respectively. Constraint Equation (17) is related to nuclear-installed capacity derived from Table 5 and Table 8, respectively. Constraint Equation (18) is related to projected wind installed capacity derived from Table 4. Constraint Equation (19) is related to projected bio-power plant capacity derived from Table 4. Finally, constraint Equation (20) is related to projected small hydro capacity derived from Table 4.

6. Results Analysis and Discussions

This study was carried out using the flexible fuzzy goal programming (FFGP) approach to find out the optimum cost solution for electricity “system expansion” for the study period from 2016–2017 to 2021–2022. The model proposed determines the optimal cost expansion that will guarantee the optimal mix of the capacity generation for all the years until 2021–2022, considering all the input parameters (financial/technical) for the study period. The optimal mix of installed capacity by the end of the year 2021–2022 is given in Table 9.
The FFGP model has selected the target installed capacity of hydro, nuclear, solar, wind, biomass and small hydro due to the reduction in cost and CO2 emissions. The model does not select any new coal power plants apart from the existing projects. It can be observed that RES installed capacity, including solar and wind, will become 160,000 GW by the end of 2021–2022, which is more than 35 percent of the total installed capacity of 447,027.83 GW. In contrast, energy from non-fossil sources will be 236,381.4 GW by the end of 2021–2022, which is more than 52 percent of the total installed capacity of 447,027.83 GW. Capacity expansion for coal-based plants is not significant as compared to the solar and wind capacity addition.
The optimal gross electricity generation during the year 2021–2022 is 1,597,715 MU, comprised of 983,611 MU from thermal, 177,507 MU from solar, 151,757 MU from wind, 155,504 MU from hydro, 54,584 MU from nuclear and 55,226 MU from biomass and 19,526 MU from small hydro, as shown in Table 10. It can be noticed from the results above that the installed capacity of non-fossil fuel-based plants, including solar, wind, biomass, hydro and nuclear-based, is likely to be about 50 percent of the total installed capacity. It contributes around 35 percent of the gross electricity generation in the year 2021–2022. The levelized cost of electricity at this optimal solution would be Rs 51.53 lakh per MU or Rs. 5.15 per Kwh.
Furthermore, we introduce different tolerance values to the FFGP model to obtain the optimum cost solution for electricity system expansion for the study period of 2016–2017 to 2021–2022. We considered both technical and financial input parameters and a tolerance of one percent to ten percent for increasing the projected demand and installed capacity of solar, hydro, wind and small hydro. The optimal mix of installed capacity with tolerance level is given in Table 11.
As evident from Table 11, the projected demand and installed capacity of renewable sources of electricity increased by one percent to ten percent tolerance throughout the solution cases. The optimal solutions give increased installed renewable sources of electricity that is hydro, solar and small hydro. In contrast, it does not increase non-renewable sources such as gas, nuclear and biomass. The optimal solution also indicated a slight increase in the installed capacity of coal; however, it does not exceed the existing and under-construction plants, implying that no new plant is required.
Table 12 shows that the levelized cost for an optimal electricity system at a different level of tolerance, ranging from one percent to ten percent, decreases as the demand increases. This implies that increased electricity demand can be met with renewable energy sources by increasing hydro, solar PV and small hydro, which have lower levelized costs than non-renewables such as gas, nuclear and biomass, which have a higher levelized cost.

Managerial and Practical Implications

Results of the study indicate that flexible fuzzy goal programming can be implemented to meet energy demand in the future, at the same time achieving various national goals and international commitments. The results and methodology of the study can be used by researchers and governments to further the research in the field of the cost-production optimization of energy. There are various sources of energy generation; however, some are costly and have a highly negative impact on environmental sustainability. Therefore, from the managerial perspective, such sources are not the most desired. Currently, most of the energy produced by the GOI is based on hydro and coal, and their installed capacity can meet the Indian demands up to 2022. However, from 2022 onwards, there will be a high demand for electricity power due to the increasing population. As such, this study suggests shifting to renewable energy sources. The study further suggests the rates of shifting from non-renewable to renewable sources at every step. The tolerance values shown in Table 11 provide the optimal mix for electricity generation from the various technologies. This concept will help the government and policymakers to gain insight into what amount is required from every technology to optimally generate electricity for the sustainable development of India. The study balanced the three tiers of the SDGs—social, economic and environmental issues.

7. Conclusions and Recommendations

India is determined to ensure the affordability of clean energy for the benefit of all and intends to reduce CO2 intensity by adopting low-carbon technologies, as evident from the INDC submitted to the UNCC and their various targets for RES. It is observable from Table 11 and Table 12 that, with an increase of projected demand from one percent to ten per cent, the capacity expansion for “coal-based” plants is not significant as compared to renewable energy capacity addition; also the levelized cost decreases as the electricity demand increases. Although India has made sound progress towards a mix of cleaner energy as recognized by the international community [65], the following recommendations are vital for accelerating India’s progress towards attaining cost-efficient and clean electricity generation while simultaneously achieving its international commitments and financial and technical constraints.
  • The optimal allocation of installed capacity among different technologies in Table 9 can be adopted to meet the projected demand for electricity;
  • For any further increase in demand, the allocation of different electricity plants can be made based on the optimal solution in Table 11;
  • Increasing electricity demand should be made by shifting allocations towards renewable energy sources, especially solar, wind and hydro;
  • A less-costly decommissioning method can be adopted for plants, especially for the nuclear plant;
  • Government should install solar panels on the roof-tops of government offices and encourage individuals to use a solar panel for electricity generation for their personal use;
  • Government should reduce the dependency on costly imported coal and explore and use domestic coal reserves for running existing coal plants.
This research studied energy policy choices and addressed issues related to electricity generation (SDG 7), and will enhance the achievement of several SDGs for environmental sustainability in many ways.
  • Shifting from fossil fuels to renewable energy sources may lower carbon dioxide emissions, which furthers climate change mitigation goals (SDG13);
  • Ensuring efficient energy access to poorer citizens and deploying large scale renewable sources will positively impact the SDG1 goal of alleviating poverty and all its ramifications;
  • Energy efficiency will help achieve the sustainability of cities (SDG11), and with smart cities, road traffic accident risks will reduce drastically, improving peoples’ health (SDG3);
  • The provision of access to efficient and affordable energy will create employment opportunities for men and women who will be engaging in hairdressing and digital services (SDG5). It will also improve the quality of education via access to laboratories, internet facilities and modern technologies, helping the necessary flourishing of interdisciplinary research (SDG 10).

Author Contributions

Conceptualization, M.F.K., A.P., and I.A.; methodology, I.A., and U.M.M.; software, I.A., and U.M.M.; validation, M.F.K., A.P., U.M.M., J.C., and I.A.; formal analysis, A.P., U.M.M. and J.C.; investigation, A.P.; resources, M.F.K., A.P., and J.C.; writing–original draft preparation, M.F.K., A.P., U.M.M., and J.C.; writing–review and editing, I.A.; visualization, A.P., and U.M.M.; supervision, I.A.; funding acquisition, M.F.K. All authors have read and agreed to the published version of the manuscript.

Funding

The first author is thankful to Saudi Electronic University, Riyadh, Saudi Arabia, for providing a financial assistance to carry out this research.

Acknowledgments

This work was supported by the Deanship of Scientific Research, College of Science and Theoretical Studies, Saudi Electronic University, Riyadh, Saudi Arabia. All authors are thankful to the Special Issue editor D’Adamo Idiano and the anonymous reviewers.

Conflicts of Interest

The authors have no known conflict of interest regarding the authorship and publication of this paper.

Abbreviations

The following abbreviations are used in this manuscript:
COVID-19Coronavirus Disease 2019
C O 2 Carbondioxide.
SDGSustainable Development Goals
UNUnited Nations.
UNCCUnited Nations Conference Centre
INDCIntended Nationally Determined Contribution.
RESRenewable Energy Sources.
GOIGovernment of India.
FFGPFlexible Fuzzy Goal Programming.
KwhKilo Watt hour
MWHMega Watt Hour
MUMillion Unit
GWGiga Watt
MWMega Watt
LCOElevelized Cost of Energy.
GDPGross Domestic Product.
KgKilo gram
LOLPLoss On Load Probability
ENSEnergy Not Served.
TERIThe Energy Resources Institute.
HRESHigh Renewables Scenario.
LRESLow Renewables Scenario.
NDRESNon-Dispatchable Renewable Energy Sources.
CEACentral Electricity Authorithy.
APTELAppellate Tribunal for electricity.
GCFGreen Climate Fund.
MoSPIMinistry of Statistics & Programme Implementation.
MOOPMultiObjective Optimization Problem.
DMDecision Maker(ing)
MCDMMulti-Criteria Decision Making
Z k kth objective function.
g k kth fuzzy aspirational goal.
b i ith resource restriction.
a i j coefficient of the jth decision variable in the ith constraint.
Tflexible tolerance interval.
λ k kth goal’s membership value.
L k kth aspirational goal’s lower value.
U k kth aspirational goal’s upper value.
K 1 : an objective function related to optimizing the levelized costs of energy
by individual technology.
K 2 : an objective function related to optimizing the levelized costs of
energy by all technologies.
K 3 : an objective function related to optimizing the present value of
energy by all technologies.
X 1 Installed Capacity of Hydro.
X 2 Installed Capacity of Coal.
X 3 Installed Capacity of gas.
X 4 Installed Capacity of nuclear.
X 5 Installed Capacity of solar thermal.
X 6 Installed Capacity of solar PV.
X 7 Installed Capacity of Wind.
X 8 Installed Capacity of Biomass.
X 9 Installed Capacity of Small Hydro.
I t Initial investment at time t.
( O M ) t Operating and maintenance charge at time t.
F t fuel cost at time t.
rdiscount rate.
E t system energy yield at time t.
ttime in years.

References

  1. Ali, I.; Modibbo, U.M.; Chauhan, J.; Meraj, M. An integrated multi-objective optimization modeling for sustainable development goals of India. Environ. Dev. Sustain. 2021, 2, 3811–3831. [Google Scholar] [CrossRef]
  2. Karuppiah, K.; Sankaranarayanan, B.; Ali, S.M.; Chowdhury, P.; Paul, S.K. An integrated approach to modeling the barriers in implementing green manufacturing practices in SMEs. J. Cleaner Prod. 2020, 265, 121737. [Google Scholar] [CrossRef]
  3. D’Adamo, I.; González-Sánchez, R.; Medina-Salgado, M.S.; Settembre-Blundo, D. E-Commerce Calls for Cyber-Security and Sustainability: How European Citizens Look for a Trusted Online Environment. Sustainability 2021, 13, 6752. [Google Scholar] [CrossRef]
  4. Ahmed, S.; Taqi, H.M.M.; Farabi, Y.I.; Sarker, M.; Ali, S.M.; Sankaranarayanan, B. Evaluation of Flexible Strategies to Manage the COVID-19 Pandemic in the Education Sector. Global J. Flexible Syst. Manag. 2021. [Google Scholar] [CrossRef]
  5. Giudice, F.; Caferra, R.; Morone, P. COVID-19, the food system and the circular economy: Challenges and opportunities. Sustainability 2020, 12, 7939. [Google Scholar] [CrossRef]
  6. Ali, I.; Fügenschuh, A.; Gupta, S.; Modibbo, U.M. The LR-Type Fuzzy Multi-Objective Vendor Selection Problem in Supply Chain Management. Mathematics 2020, 8, 1621. [Google Scholar] [CrossRef]
  7. Mahmud, P.; Paul, S.K.; Azeem, A.; Chowdhury, P. Evaluating Supply Chain Collaboration Barriers in Small-and Medium-Sized Enterprises. Sustainability 2021, 13, 7449. [Google Scholar] [CrossRef]
  8. The World Bank. 2019. Available online: https://data.worldbank.org/country/india (accessed on 3 September 2019).
  9. Energy Statistics 2019 (Twenty-Fifth Issue) Central Statistics Office, Ministry of Statistics and Programme Implementation, Government of India New Delhi. Available online: http://mospi.nic.in/sites/default/files/publication-reports/EnergyStatistics2019-finall.pdf (accessed on 3 September 2019).
  10. Zhang, F. How much do power sector distortions cost to South Asia. In Proceedings of the 2nd IAEE Eurasian Conference, Energy in Eurasia: Economic Perspectives on Challenges, Risks and Opportunities, International Association for Energy Economics, Zagreb, Croatia, 12–14 October 2017. [Google Scholar]
  11. Devarajan, S.; Nabi, I. Economic growth in South Asia: promising, unequalising, sustainable? Econ. Pol. Wkl. 2006, 41, 3573–3580. [Google Scholar]
  12. Holmes, F. Unmasking the Asian Giant|Financial Sense. 5 July 2012. Available online: https://www.financialsense.com/contributors/frank-holmes/unmasking-the-asian-giant (accessed on 2 September 2019).
  13. Andrews, R. Electricity and the Wealth of Nations|Energy Matters. 22 November 2015. Available online: http://euanmearns.com/electricity-and-the-wealth-of-nations/ (accessed on 2 September 2019).
  14. Burke, P.J.; Stern, D.I.; Bruns, S.B. The impact of electricity on economic development: a macroeconomic perspective. Int. Rev. Environ. Resour. Econ. 2018, 12, 85–127. [Google Scholar] [CrossRef]
  15. Zhang, T.; Shi, X.; Zhang, D.; Xiao, J. Socio-economic development and electricity access in developing economies: A long-run model averaging approach. Energy Policy 2019, 132, 223–231. [Google Scholar] [CrossRef]
  16. Central Electricity Authority. Committee on Optimal Energy Mix in Power Generation on Medium and Long Term Basis; Ministry of Power, Government of India: New Delhi, India, 2018.
  17. Knežević, G.; Topić, D.; Jurić, M.; Nikolovski, S. Joint market bid of a hydroelectric system and wind parks. Comput. Electr. Eng. 2019, 74, 138–148. [Google Scholar] [CrossRef]
  18. Fekete, K.; Nikolovski, S.; Klaić, Z.; Androjić, A. Optimal re-dispatching of cascaded hydropower plants using quadratic programming and chance-constrained programming. Energies 2019, 12, 1604. [Google Scholar] [CrossRef] [Green Version]
  19. Kanbur, B.B.; Wu, C.; Fan, S.; Duan, F. System-level experimental investigations of the direct immersion cooling data center units with thermodynamic and thermoeconomic assessments. Energy 2021, 217, 119373. [Google Scholar] [CrossRef]
  20. Kanbur, B.B.; Kumtepeli, V.; Duan, F. Thermal performance prediction of the battery surface via dynamic mode decomposition. Energy 2020, 201, 117642. [Google Scholar] [CrossRef]
  21. Kroll, C.; Warchold, A.; Pradhan, P. Sustainable Development Goals (SDGs): Are we successful in turning trade-offs into synergies? Palgrave Commun. 2019, 5, 140. [Google Scholar] [CrossRef] [Green Version]
  22. Nerini, F.F.; Tomei, J.; To, L.S.; Bisaga, I.; Parikh, P.; Black, M.; Borrion, A.; Spataru, C.; Broto, V.C.; Anandarajah, G.; et al. Mapping synergies and trade-offs between energy and the Sustainable Development Goals. Nat. Energy 2018, 3, 10–15. [Google Scholar] [CrossRef] [Green Version]
  23. Bisaga, I.; Parikh, P.; Tomei, J.; To, L.S. Mapping synergies and trade-offs between energy and the sustainable development goals: A case study of off-grid solar energy in Rwanda. Energy Policy 2021, 149, 112028. [Google Scholar] [CrossRef]
  24. Rathi, A.K.A. Promotion of cleaner production for industrial pollution abatement in Gujarat (India). J. Clean. Prod. 2003, 11, 583–590. [Google Scholar] [CrossRef]
  25. Ghose, M.K. Promoting cleaner production in the Indian small-scale mining industry. J. Clean. Prod. 2003, 11, 167–174. [Google Scholar] [CrossRef]
  26. Mukherjee, D.P. Barriers towards cleaner production for optimizing energy use and pollution control for foundry sector in Howrah, India. Clean Technol. Environ. Policy 2011, 13, 111–123. [Google Scholar] [CrossRef]
  27. Pal, P.; Sethi, G.; Nath, A.; Swami, S. Towards cleaner technologies in small and micro enterprises: a process-based case study of foundry industry in India. J. Clean. Prod. 2008, 16, 1264–1274. [Google Scholar] [CrossRef]
  28. Narayanaswamy, V.; Scott, J.A. Lessons from cleaner production experiences in Indian hosiery clusters. J. Clean. Prod. 2001, 9, 325–340. [Google Scholar] [CrossRef]
  29. Unnikrishnan, S.; Hegde, D.S. Environmental training and cleaner production in Indian industry—A micro-level study. Resour. Conserv. Recycl. 2007, 50, 427–441. [Google Scholar] [CrossRef]
  30. Annala, L.; Sarin, A.; Green, J.L. Co-production of frugal innovation: Case of low cost reverse osmosis water filters in India. J. Clean. Prod. 2018, 171, S110–S118. [Google Scholar] [CrossRef]
  31. Nomani, M.A.; Ali, I.; Fügenschuh, A.; Ahmed, A. A fuzzy goal programming approach to analyse sustainable development goals of India. Appl. Econ. Lett. 2017, 24, 443–447. [Google Scholar] [CrossRef]
  32. Khatun, F.; Ahamad, M. Foreign direct investment in the energy and power sector in Bangladesh: Implications for economic growth. Renew. Sustain. Energy Rev. 2015, 52, 1369–1377. [Google Scholar] [CrossRef]
  33. McCollum, D.L.; Echeverri, L.G.; Busch, S.; Pachauri, S.; Parkinson, S.; Rogelj, J.; Riahi, K. Connecting the sustainable development goals by their energy inter-linkages. Environ. Res. Lett. 2018, 13, 033006. [Google Scholar] [CrossRef]
  34. Hassan, Q.; Garg, N.K. Systems approach for water resources development. Global J. Flexible Syst. Manag. 2007, 8, 29–43. [Google Scholar] [CrossRef]
  35. Kaur, H.; Singh, S.P.; Glardon, R. An integer linear program for integrated supplier selection: A sustainable flexible framework. Global J. Flex. Syst. Manag. 2016, 17, 113–134. [Google Scholar] [CrossRef]
  36. Khorasani, S.T. A robust optimization model for supply chain in agile and flexible mode based on variables of uncertainty. Global J. Flex. Syst. Manag. 2018, 19, 239–253. [Google Scholar] [CrossRef]
  37. Gupta, S.; Fügenschuh, A.; Ali, I. A multi-criteria goal programming model to analyze the sustainable goals of India. Sustainability 2018, 10, 778. [Google Scholar] [CrossRef] [Green Version]
  38. Modibbo, U.M.; Raghav, Y.S.; Hassan, M.; Mijinyawa, M. A Critical Review on the Applications of Optimization Techniques in the UN Sustainable Development Goals. In Proceedings of the 2021 2nd International Conference on Intelligent Engineering and Management (ICIEM), London, UK, 28–31 April 2021; pp. 572–576. [Google Scholar] [CrossRef]
  39. Modibbo, U.M.; Ali, I.; Ahmed, A. Multi-objective optimization modeling for analysing sustainable development goals of Nigeria: Agenda 2030. Environ. Dev. Sustain. 2021, 23, 9529–9563. [Google Scholar] [CrossRef]
  40. Yang, X.; Wang, Y.; Sun, M.; Wang, R.; Zheng, P. Exploring the environmental pressures in urban sectors: An energy-water-carbon nexus perspective. Appl. Energy 2018, 228, 2298–2307. [Google Scholar] [CrossRef]
  41. Ahmadini, A.A.H.; Modibbo, U.M.; Shaikh, A.A.; Ali, I. Multi-objective optimization modeling of sustainable green supply chain in inventory and production management. Alex. Eng. J. 2021, 60, 5129–5146. [Google Scholar] [CrossRef]
  42. AlArjani, A.; Modibbo, U.M.; Ali, I.; Sarkar, B. A new framework for the sustainable development goals of Saudi Arabia. J. King Saud Univ.-Sci. 2021, 33, 101477. [Google Scholar] [CrossRef]
  43. Wang, Y.; Liu, J.; Hansson, L.; Zhang, K.; Wang, R. Implementing stricter environmental regulation to enhance eco-efficiency and sustainability: A case study of Shandong Province’s pulp and paper industry, China. J. Clean. Prod. 2011, 19, 303–310. [Google Scholar] [CrossRef]
  44. Christainsen, G.B.; Haveman, R.H. The contribution of environmental regulations to the slowdown in productivity growth. J. Environ. Econ. Manag. 1981, 8, 381–390. [Google Scholar] [CrossRef]
  45. Yabar, H.; Uwasu, M.; Hara, K. Tracking environmental innovations and policy regulations in Japan: case studies on dioxin emissions and electric home appliances recycling. J. Clean. Prod. 2013, 44, 152–158. [Google Scholar] [CrossRef] [Green Version]
  46. Curtis, E.M.; Lee, J.M. When do environmental regulations backfire? Onsite industrial electricity generation, energy efficiency and policy instruments. J. Environ. Econ. Manag. 2019, 96, 174–194. [Google Scholar] [CrossRef]
  47. English, J.; Niet, T.; Lyseng, B.; Keller, V.; Palmer-Wilson, K.; Robertson, B.; Rowe, A. Flexibility requirements and electricity system planning: Assessing inter-regional coordination with large penetrations of variable renewable supplies. Renew. Energy 2020, 145, 2770–2782. [Google Scholar] [CrossRef]
  48. D’Adamo, I.; Gastaldi, M.; Morone, P. The post COVID-19 green recovery in practice: Assessing the profitability of a policy proposal on residential photovoltaic plants. Energy Policy 2020, 147, 111910. [Google Scholar] [CrossRef] [PubMed]
  49. D’Adamo, I.; Rosa, P. How Do You See Infrastructure? Green Energy to Provide Economic Growth after COVID-19. Sustainability 2020, 12, 4738. [Google Scholar] [CrossRef]
  50. Hondo, H. Life cycle GHG emission analysis of power generation systems: Japanese case. Energy 2005, 30, 2042–2056. [Google Scholar] [CrossRef]
  51. Zadeh, L.A. Fuzzy sets. Inf. Control. 1965, 8, 338–353. [Google Scholar] [CrossRef] [Green Version]
  52. Zimmermann, H.J. Fuzzy programming and linear programming with several objective functions. Fuzzy Sets Syst. 1978, 1, 45–55. [Google Scholar] [CrossRef]
  53. U.S. Energy Information Administration. Capital Cost Estimates for Utility Scale Electricity Generating Plants. 2016. Available online: https://www.eia.gov/analysis/studies/powerplants/capitalcost/pdf/capcost/assumption.pdf (accessed on 4 September 2019).
  54. Heptonstall, P. A review of Electricity Unit Cost Estimates. Available online: http://www.ukerc.ac.uk/publications/a-review-of-electricity-unit-cost-estimates.html (accessed on 7 September 2019).
  55. United Nation Development Programme (n.d) Sustainable Development Goals. Available online: https://www.undp.org/content/undp/en/home/sustainable-development-goals.html (accessed on 7 September 2019).
  56. Government of India, “Nationally Determined Contirbution,” Working towards Climate Justice. 2016, pp. 1–38. Available online: https://www4.unfccc.int/sites/ndcstaging/PublishedDocuments/India%20First/INDIA%20INDC%20TO%20UNFCCC.pdf (accessed on 3 September 2019).
  57. Dudley, B. BP Statistical Review of World Energy. 2019. Available online: https://www.bp.com/content/dam/bp/business-sites/en/global/corporate/pdfs/energy-economics/statistical-review/bp-stats-review-2019-full-report.pdf (accessed on 5 September 2019).
  58. Ministry of Power, Government of India. Guidelines on Cross Border Trade of Electricity-2018. 2018; p. 1. Available online: https://powermin.nic.in/en/content/guidelines-importexport-cross-border-electricity-2018 (accessed on 6 September 2019).
  59. Tripathi, B. Now, India is the third largest electricity producer ahead of Russia, Japan. Business Standard News. 26 March 2018. Available online: https://www.business-standard.com/article/economy-policy/now-india-is-the-third-largest-electricityproducerahead-of-russia-japan-118032600086-1.html (accessed on 4 September 2019).
  60. Ali, S. The Future of Indian Electricity Demand: How much, by Whom, and under What Condition? 2018. Available online: https://www.brookings.edu/research/the-future-of-indian-electricity-demand-how-much-by-whom-and-under-what-conditions/ (accessed on 6 September 2019).
  61. Pathak, S.; Saxena, P.; Ray, A.K.; Großmann, H.; Kleinert, R. Irradiation based clean and energy efficient thermochemical conversion of biowaste into paper. J. Clean. Prod. 2019, 233, 893–902. [Google Scholar] [CrossRef]
  62. Central Electricity Authority. National Electricity Plan. 2018. Available online: www.cea.nic.in/reports/committee/nep/nep/jan/2018 (accessed on 3 September 2019).
  63. Central Statistical Organization, MOSPI, Government of India. New Series of National Accounts Statistics. 2010. Available online: :mospi.nic.in/default/files/publication/reports/brochure/2004-05 (accessed on 6 September 2019).
  64. Bhawan, S.; Puram, R.K. CO2 Baseline Database for the Indian Power Sector; Central Electricity Authority, Ministry of Power, Government on India: New Delhi, India, 2011.
  65. Srikanth, R. India’s sustainable development goals–Glide path for India’s power sector. Energy Policy 2018, 123, 325–336. [Google Scholar] [CrossRef]
Figure 1. Trends in electricity consumption. source: Energy Statistics 2018, CSO [9].
Sustainability 13 08256 g001
Figure 2. Total installed capacity of electricity from utilities. source: Energy Statistics 2018, CSO [9].
Sustainability 13 08256 g002
Figure 3. Installed capacity in utilities, from 2008 to 2017. source: Energy Statistics 2018, CSO [9].
Sustainability 13 08256 g003
Figure 4. Gross electricity generation from utilities from 2008 to 2017. source: Energy Statistics 2018, CSO [9].
Sustainability 13 08256 g004
Figure 5. Import and export of electricity from 2008 to 2017. Data source: Energy Statistics 2018, CSO [9].
Sustainability 13 08256 g005
Figure 6. Per capita electricity consumption. Data source: National Electricity Plan, CEA [16].
Sustainability 13 08256 g006
Figure 7. Sector-wise power consumption. Data source: Energy Statistics 2018, CSO [9].
Sustainability 13 08256 g007
Figure 8. Installed capacity of Renewable Energy Sources (utilities). Data source: National Electricity Plan, CEA [16].
Sustainability 13 08256 g008
Table 1. A summary of closely related literature and the present work.
AuthorsOptimization TypeDescriptionSolving Method
Ali et al. [1]Multiobjectivemodeling India’s SDGsClassical Goal Programming
Karuppiah et al. [2]-Ranked barriers to implementing greener manufacturing in IndiaFuzzy MCDM (DEMATEL, ANP, TOPSIS)
DAdamo et al. [3].-Ranking e-commerce in European countries amidst pandemicMCDA and a Likert scale survey
Ahmed et al. [4]-Evaluating strategies for managing COVID-19 in education SectorPareto analysis and rough-DEMATEL
Giudice et al. [5].-Cause-effect analysis of COVID-19 on food securitytheme popularity metric.
Mahmud et al. [7]-Evaluating Supply Chain Collaboration Barriers in Small-and Medium-Sized Enterprises.MCDM (Grey DEMATEL and Fuzzy Best-Worst methods )
Zhang et al. [15]-Study of the relationship between electricity access and social-economic factorsBayesian Model Averaging
Knežević et al.  [17]Biobjectivemodeling hydroelectric system and wind parksMixed integer linear programming
Fekete et al.  [18]BiobjectiveAddressing congestion problem in the transmission network of hydropower plantsMixed integer linear programming, Quadratic and Chance-constrained programming
Mukherjee [26]-Evaluation of operational performances of cupola and pollution Control system for optimizing energy useDescriptive statistics and Factor analysis
Nomani et al. [31]MultiobjectiveAnalysis of the sustainable development goals of IndiaFuzzy goal programming
Khatun and Ahamad [32]-Examination of the causal relationship between FDI in the energy and power sector, and economic growth in BangladeshEmpirical study
McCollum et al. [33]-Study of the interconnectivity of the UN SDGsDescriptive statistics
Gupta et al. [37]MultiobjectiveAnalysis of India’s economic sectors for sustainable development goalsFuzzy goal programming
Modibbo et al.  [38]Multiobjectivemodeling and analysis of Nigeria’s SDGsAHP, Fuzzy goal programming
AlArjani et al. [42]MultiobjectiveA framework for SDGs in Saudi ArabiaFuzzy goal programming
Yang et al. [40]-Investigating energy–water–carbon nexus of urban sectors in Shanghai and Beijing.Environmental input–output model.
Wang et al. [43]-Evaluation of the relationship between environmental regulation and eco-efficiencyDe-linking and re-linking tool
Yabar et al. [45]-Study on the impact of environmental policy on technological innovationPatent data analysis
Curtis and Lee [46]-Study of Onsite industrial electricity generation, energy efficiency and policy instrumentsSurvey
English et al. [47]-Examining balancing requirements in a decarbonizing electricity system.Capacity expansion and dispatch model
D’Adamo et al. [48]-An economic assessment of a 3 kW plant in the context of several policy scenarios during a pandemicDescriptive statistics
Hondo [50]-A life cycle analysis of greenhouse gas emissions from power generation systemsFramework and descriptive statistics
Present workMultiobjectiveOptimal mix of various technology for electricity generationFlexible fuzzy goal programming
Table 2. Parameters used for the study.
TechnologyHydroCoalGasNuclearSolar ThermalSolar PVWindBiomassSmall Hydro
Capital Cost (Lakh/MW)667.38700.2752316001200530575605.6846.5
Operation & maint. (Lakh/MW)27.4420.4328.613216.87.42104029.86
Fuel Price (Rs)035.7142280003.20
Specific Fuel consumption (Kg/Kwh)00.6270.460.000250001.250
Fuel cost (Lakh/MW)098.8669.0262.03000245.30
Capacity factor356030672319297045
Auxiliary consumption1.25.255.257.8110.5101
Plant life402525402525252035
Table 3. Estimated demand as per 19th EPS.
YearElectrical EnergyPeak Electricity
Requirement (MU)Demand (MW)
2021–20221,566,023225,751
2026–20272,047,434298,774
Table 4. Renewable energy target in India.
RESTarget RESRES InstalledExpected RES
CategoryIC as onCapacity as onCapacity Addition
31 March 202231 March 2017from 2017–2022
Solar100,00012,28987,711
Wind60,00032,28027,720
Biomass10,00082951705
Small Hydro50004380620
Total175,00057,244117,756
National Electricity Plan, CEA [16].
Table 5. Committed capacity addition.
YearHydroNuclearGasCommitted RES& Retirement of
(MW)(MW)(MW)Capacity (MW)Coal (MW)
2017–202268233300406175,00022,716
2022–202712,00068000275,00025,572
Source: National Electricity Plan, CEA [16].
Table 6. Gross Domestic Product.
Serial NumberFinancial YearGDP at Constant 2004–2005
Prices (Rupees Crore)
12004–20052,971,464
22005–20063,253,073
32006–20073,564,364
42007–20083,896,636
52008–020094,158,676
62009–20104,516,071
72010–20114,918,533
82011–20125,247,530
92012–20135,482,111
102013–20145,741,791
112021–20229,865,466
Table 7. Various technologies emission factors.
S/NTechnologyCO2 Emission Factor (tCO2/Mwh)
1Coal0.98
2Diesel0.59
3Gas0.45
4Lignite1.38
5Hydro0.011
6Nuclear0.0242
7Wind0.0295
8Solar0.0534
Source: Latest CERC orders, CERC Tariff Regulations for FY 2014-19 & 2019-24 [50,64].
Table 8. Installed Capacity utilities (MW) as of 31 March 2017.
S/NTechnologyInstalled Capacity (MW)
1Coal192,163
2Diesel838
3Gas25,329
4Hydro44,478
5Nuclear6780
6Solar12,288
7Wind32,280
8Bio Power8295
9Small Hydro4379
Table 9. Optimal installed capacity.
S/NTechnologyCapacityPercentage
(MW)Mix (%)
1Hydro51,301.4211.48
2Coal184,073.4041.17
3Gas26,573.015.94
4Nuclear10,0802.25
5Solar Thermal35,938.058.04
6Solar PV64,061.9514.33
7Wind60,00013.42
8Biomass10,0002.24
9Small Hydro50001.12
Total447,027.83100
Table 10. Optimal generation of electricity by different technologies.
S/NTechnologyGenerationPercentage
(MWH)Mix (%)
1Hydro15,5509.73
2Coal917,39457.42
3Gas66,2174.14
4Nuclear54,5843.42
5Solar Thermal71,8764.50
6Solar PV105,6316.61
7Wind151,7579.50
8Biomass55,2263.46
9Small Hydro195,261.22
Total1,597,715100
Table 11. The optimal mix of installed capacity at different tolerance levels.
TechnologiesTol = 1%Tol = 2%Tol = 3%Tol = 4%Tol = 5%Tol = 6%Tol = 7%Tol = 8%Tol = 9%Tol = 10%
Hydro51,686.4951,932.1252,102.4452,227.4852,325.3452,467.2452,651.1352,833.0953,013.3753,192.17
Coal178,135.4180,485.2183,004.70184,277.40184,138.40183,982.30183,967.60183,953.10183,938.60183,924.20
Gas26,167.2526,167.0126,167.0126,167.0126,573.0126,167.0126,167.0126,167.0126,167.0126,167.01
Nuclear10,08010,08010,08010,08010,08010,08010,08010,08010,08010,080
Solar Thermal80,283.1466,046.3351,809.3040,907.7531,162.4025,697.8424,173.9522,683.9121,223.4719,789.04
Solar PV20,966.2536,724.2652,629.3065,287.1176,841.7084,029.6687,195.1290,330.4693,439.4996,525.39
Wind60,450.3759,438.0657,188.3456,389.4056,762.9954,135.7053,103.5352,061.2151,010.0249,951.03
Biomass8295829582958295829510,00010,00010,00010,00010,000
Small Hydro50375061.475078.075090.255099.795113.625131.545149.285166.855184.27
Table 12. levelized Cost at Different Tolerance and Emissin values.
ToleranceElectricity DemandLevelized Cost (lakh/MU)
0.01158168353.02
0.02159734352.46
0.03161300451.95
0.04162866451.52
0.05164432451.16
0.06165998451.17
0.07167564551.12
0.08169130551.07
0.09170696551.03
0.10172262550.98
Publisher’s Note: MDPI stays neutral with regard to jurisdictional claims in published maps and institutional affiliations.

