Article

Influence of Slope Gradient and Aspect on Soil Organic Carbon Content in the Region of Niš, Serbia

1
Laboratory for Soil and Agroecology, Institute of Filed and Vegetable Crops, National Institute of the Republic of Serbia, Maksima Gorkog 30, 21000 Novi Sad, Serbia
2
Center for Viticulture and Oenology, Bulevar Kralja Aleksandra 84, 11111 Belgrade, Serbia
3
Agromediterranean Faculty, Univerzitetski Kampus, Džemal Bijedic University of Mostar, 88104 Mostar, Bosnia and Herzegovina
*
Author to whom correspondence should be addressed.
Sustainability 2021, 13(15), 8332; https://0-doi-org.brum.beds.ac.uk/10.3390/su13158332
Submission received: 25 June 2021 / Revised: 18 July 2021 / Accepted: 20 July 2021 / Published: 26 July 2021

Abstract

:
Topography-induced microclimate differences determine the local spatial variation of soil characteristics as topographic factors may play the most essential role in changing the climatic pattern. The aim of this study was to investigate the spatial distribution of soil organic carbon (SOC) with respect to the slope gradient and aspect, and to quantify their influence on SOC within different land use/cover classes. The study area is the Region of Niš in Serbia, which is characterized by complex topography with large variability in the spatial distribution of SOC. Soil samples at 0–30 cm and 30–60 cm were collected from different slope gradients and aspects in each of the three land use/cover classes. The results showed that the slope aspect significantly influenced the spatial distribution of SOC in the forest and vineyard soils, where N- and NW-facing soils had the highest level of organic carbon in the topsoil. There were no similar patterns in the uncultivated land. No significant differences were found in the subsoil. Organic carbon content was higher in the topsoil, regardless of the slope of the terrain. The mean SOC content in forest land decreased with increasing slope, but the difference was not statistically significant. In vineyards and uncultivated land, the SOC content was not predominantly determined by the slope gradient. No significant variations across slope gradients were found for all observed soil properties, except for available phosphorus and potassium. A positive correlation was observed between SOC and total nitrogen, clay, silt, and available phosphorus and potassium, while a negative correlation with coarse sand was detected. The slope aspect in relation to different land use/cover classes could provide an important reference for land management strategies in light of sustainable development.

1. Introduction

Soil organic matter (SOM) is key for healthy and high-quality soil and is a major terrestrial pool for carbon. The importance of increased SOM or soil organic carbon (SOC) is due to their role in improving the physical and chemical properties of soil, conserving water, and increasing available nutrients. There is concern that if SOC content in soils decreases too much, the productive capacity of agriculture will then be compromised due to deterioration in soil physical properties and by impairment of soil nutrient cycling mechanisms [1,2]. Spatial distribution of SOC is the result of a combination of various factors related to both the natural environment and human activities, with heterogeneity observed at different spatial scales [3].
Topography plays an important role in defining soil properties with respect to temperature and moisture regimes [4]. At a smaller scale, apart from cloudiness and other atmospheric heterogeneities, topography determines the distribution of incoming solar radiation. The variability in slope orientation can lead to strong local gradients in solar radiation. The most important effect of slope gradient on soil profile development is its influence on soil moisture. The amount of runoff increases as the slope gradient increases; therefore, the amount of water infiltrating the soil profile in any given area decreases as the slope gradient increases [4,5].
Topographic factors can both directly and indirectly affect SOC stocks by altering soil depth, photosynthesis, nutrient cycle, soil processes, decomposition of biomass, and management intensity [5]. Slope gradient and aspect can modify the soil temperature, soil moisture, and vegetation communities at a smaller scale, and create microclimates that differ significantly from the zonal climatic conditions [1,6,7]. Soils in warm climates usually contain less SOM than soils in cooler climates due to higher mineralization rates [8]. Additionally, SOC content increases with rainfall [9]. Therefore, the slope aspect and gradient can affect SOC distribution, either retarding or accelerating SOC decomposition by affecting microorganism activity through their influence on soil temperature and water content [10]. In the Northern Hemisphere, north-facing slopes receive less direct sunlight than south-facing slopes. South-facing slopes are generally warmer, drier, and more sparsely vegetated, and thus accumulate less SOC than other aspects. Lozano-García et al. [11] found that the SOC content on the north-facing slopes in reforested areas was about 1.69 times higher than on the south-facing slopes in Mediterranean natural areas. Ajami et al. [12] showed that the north-facing slopes had a higher SOC density in the 0–100 cm layer in comparison with the east- and west-facing slopes in northern Iran. Jia et al. [13] found that the aspect and slope gradient had a significant influence on SOC stocks, especially in the 0–20 cm soil layer, but slope position had no significant influence on SOC stocks in a Pinus kesiya var. langbianensis plantation. Zheng et al. [7] stated that the aspect and slope position had a significant effect on SOC stocks, but slope gradient had no direct effect on grassland SOC stocks in northern China. Fan [14] found that aspect, slope position, and slope gradient had no significant effect on SOC stocks in Moso bamboo forest.
Maintaining soil organic carbon at a satisfactory level is a prerequisite for protecting the soil from degradation and maintaining sustainable production. This is possible only with knowledge of all the factors that can affect the variability of organic carbon in the soil. Although the influence of the aspect and the slope on SOC is widely recognized, there are no studies that quantify these influences on SOC within different land use/cover classes in Serbia. This study represents a continuation of the investigation of soil properties in Serbia [15].
The aims of this study were: (1) to investigate the spatial distribution of SOC with respect to the slope gradient and aspect, (2) to quantify the influence of aspect and slope on SOC within different land use/cover classes, (3) to define the distribution patterns of SOC along depth gradients, and (4) to analyze correlations of SOC and slope with other soil properties.

2. Materials and Methods
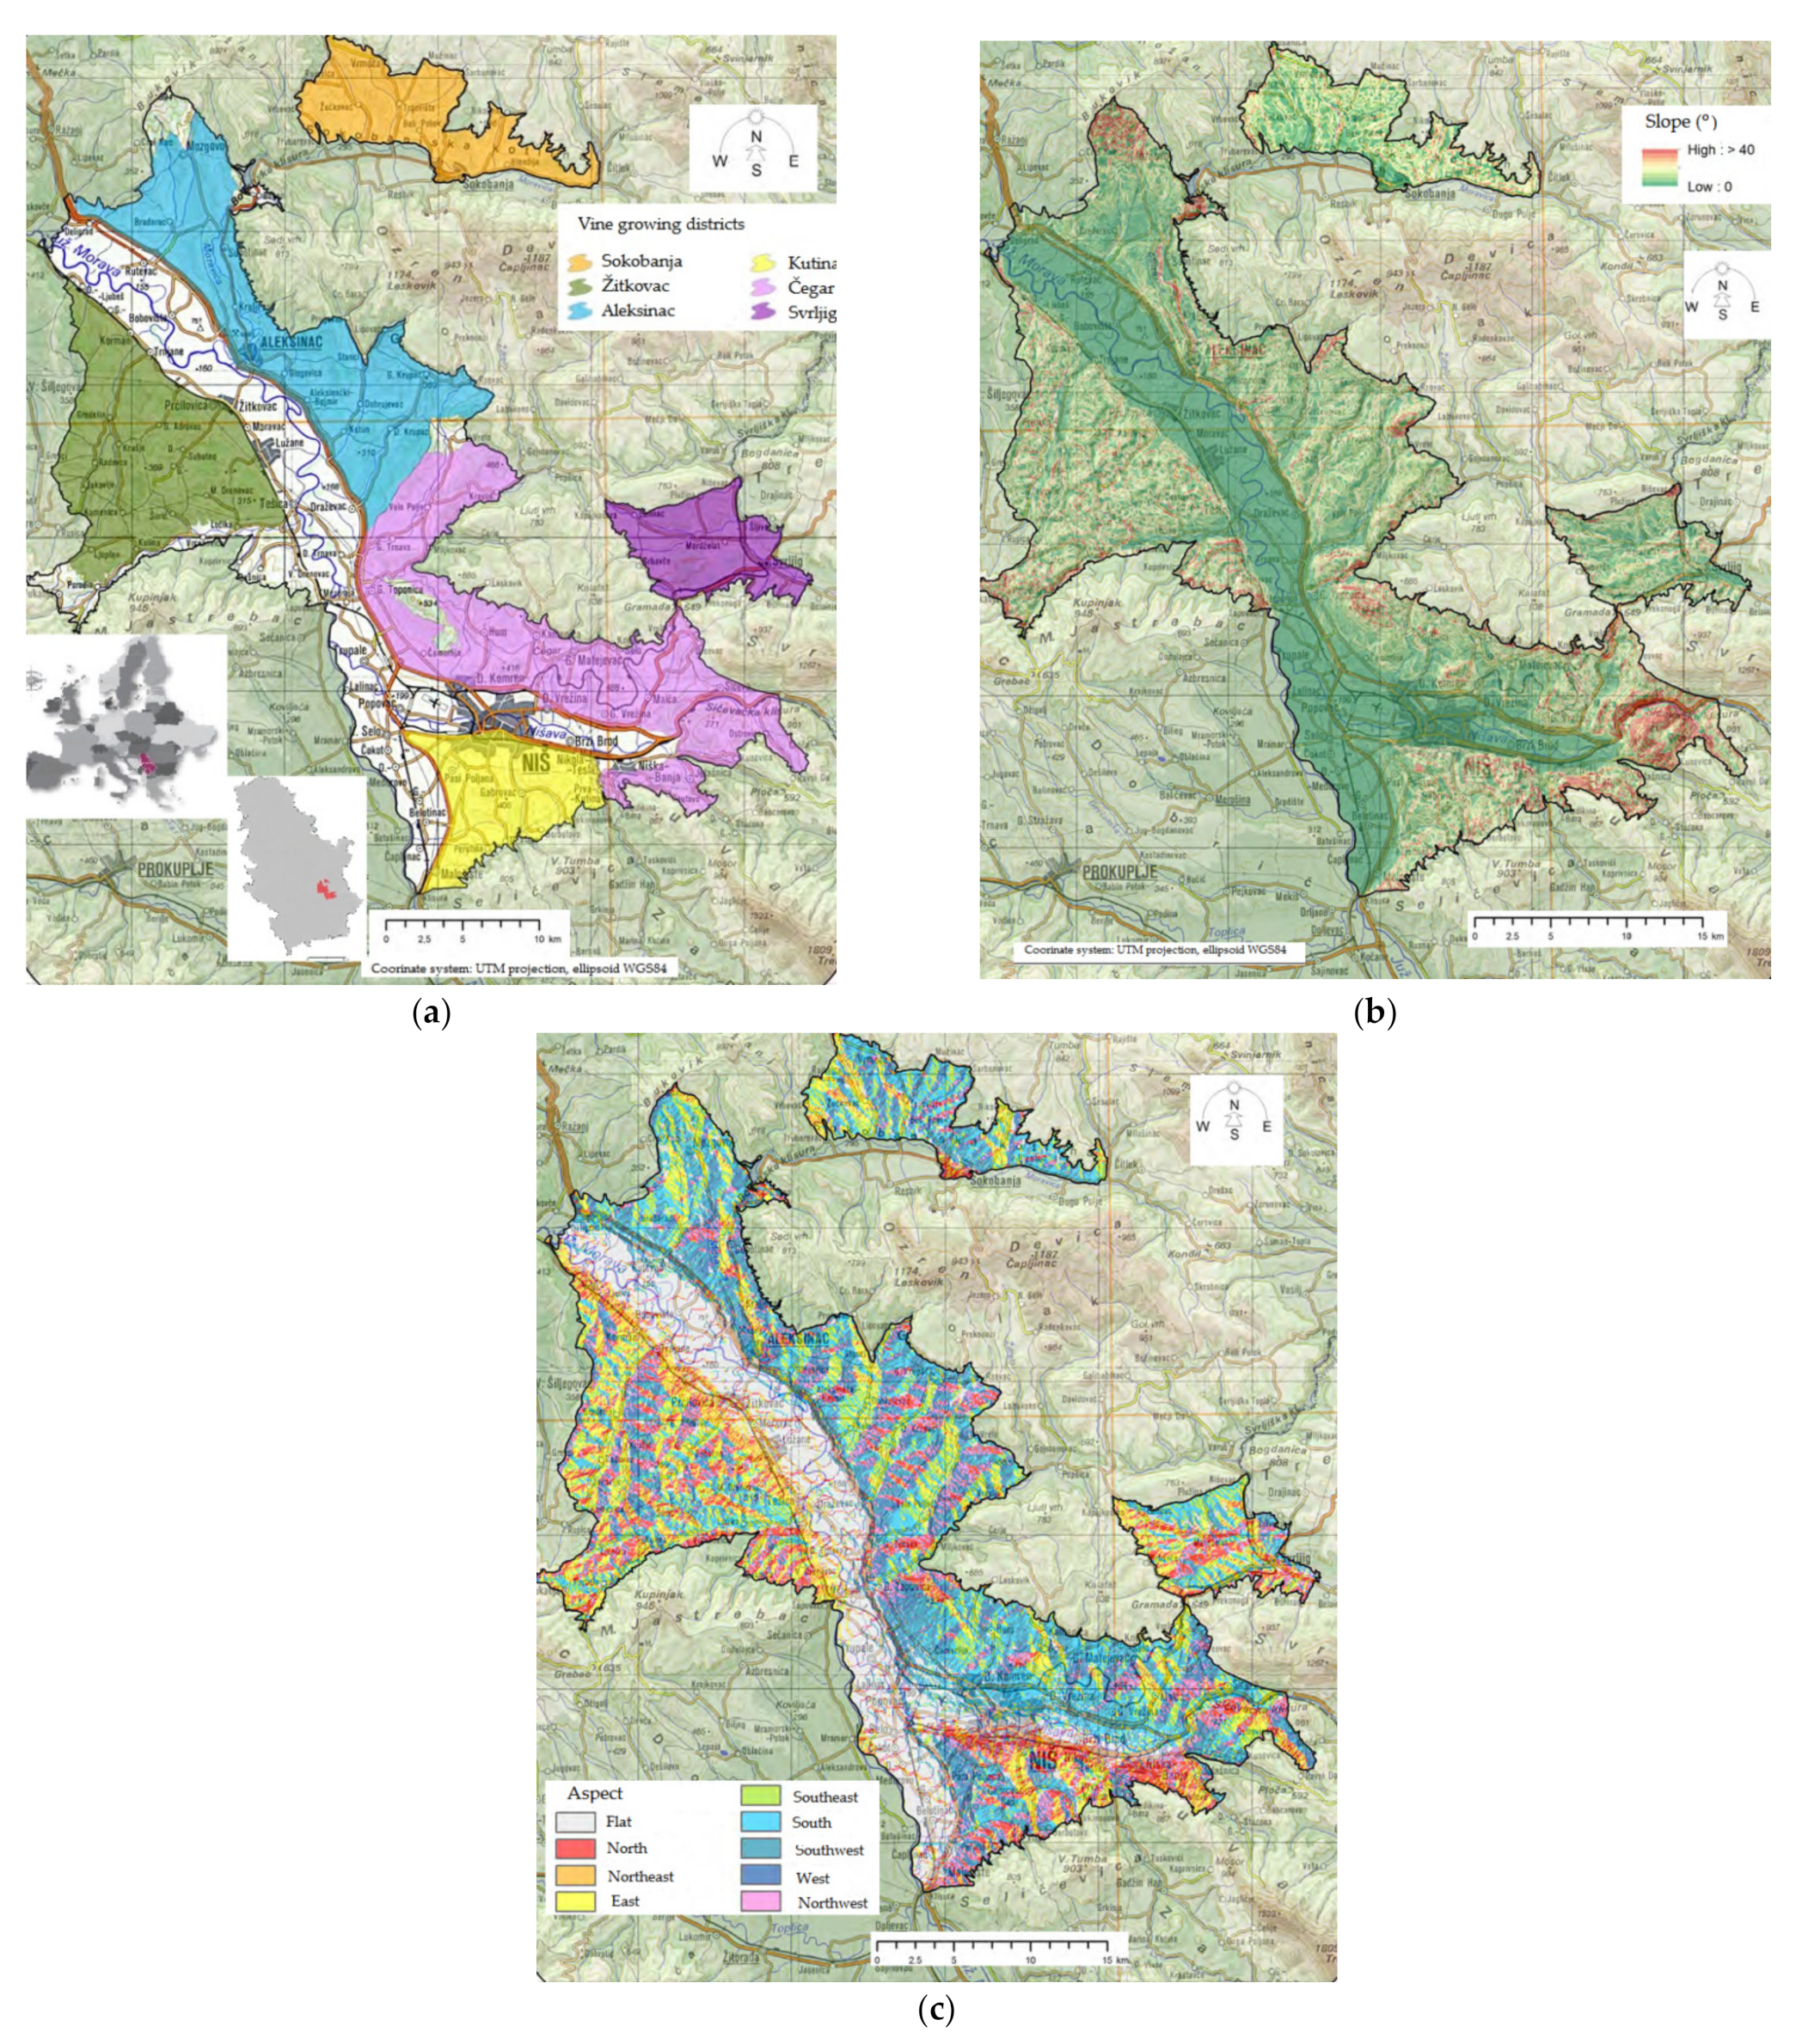
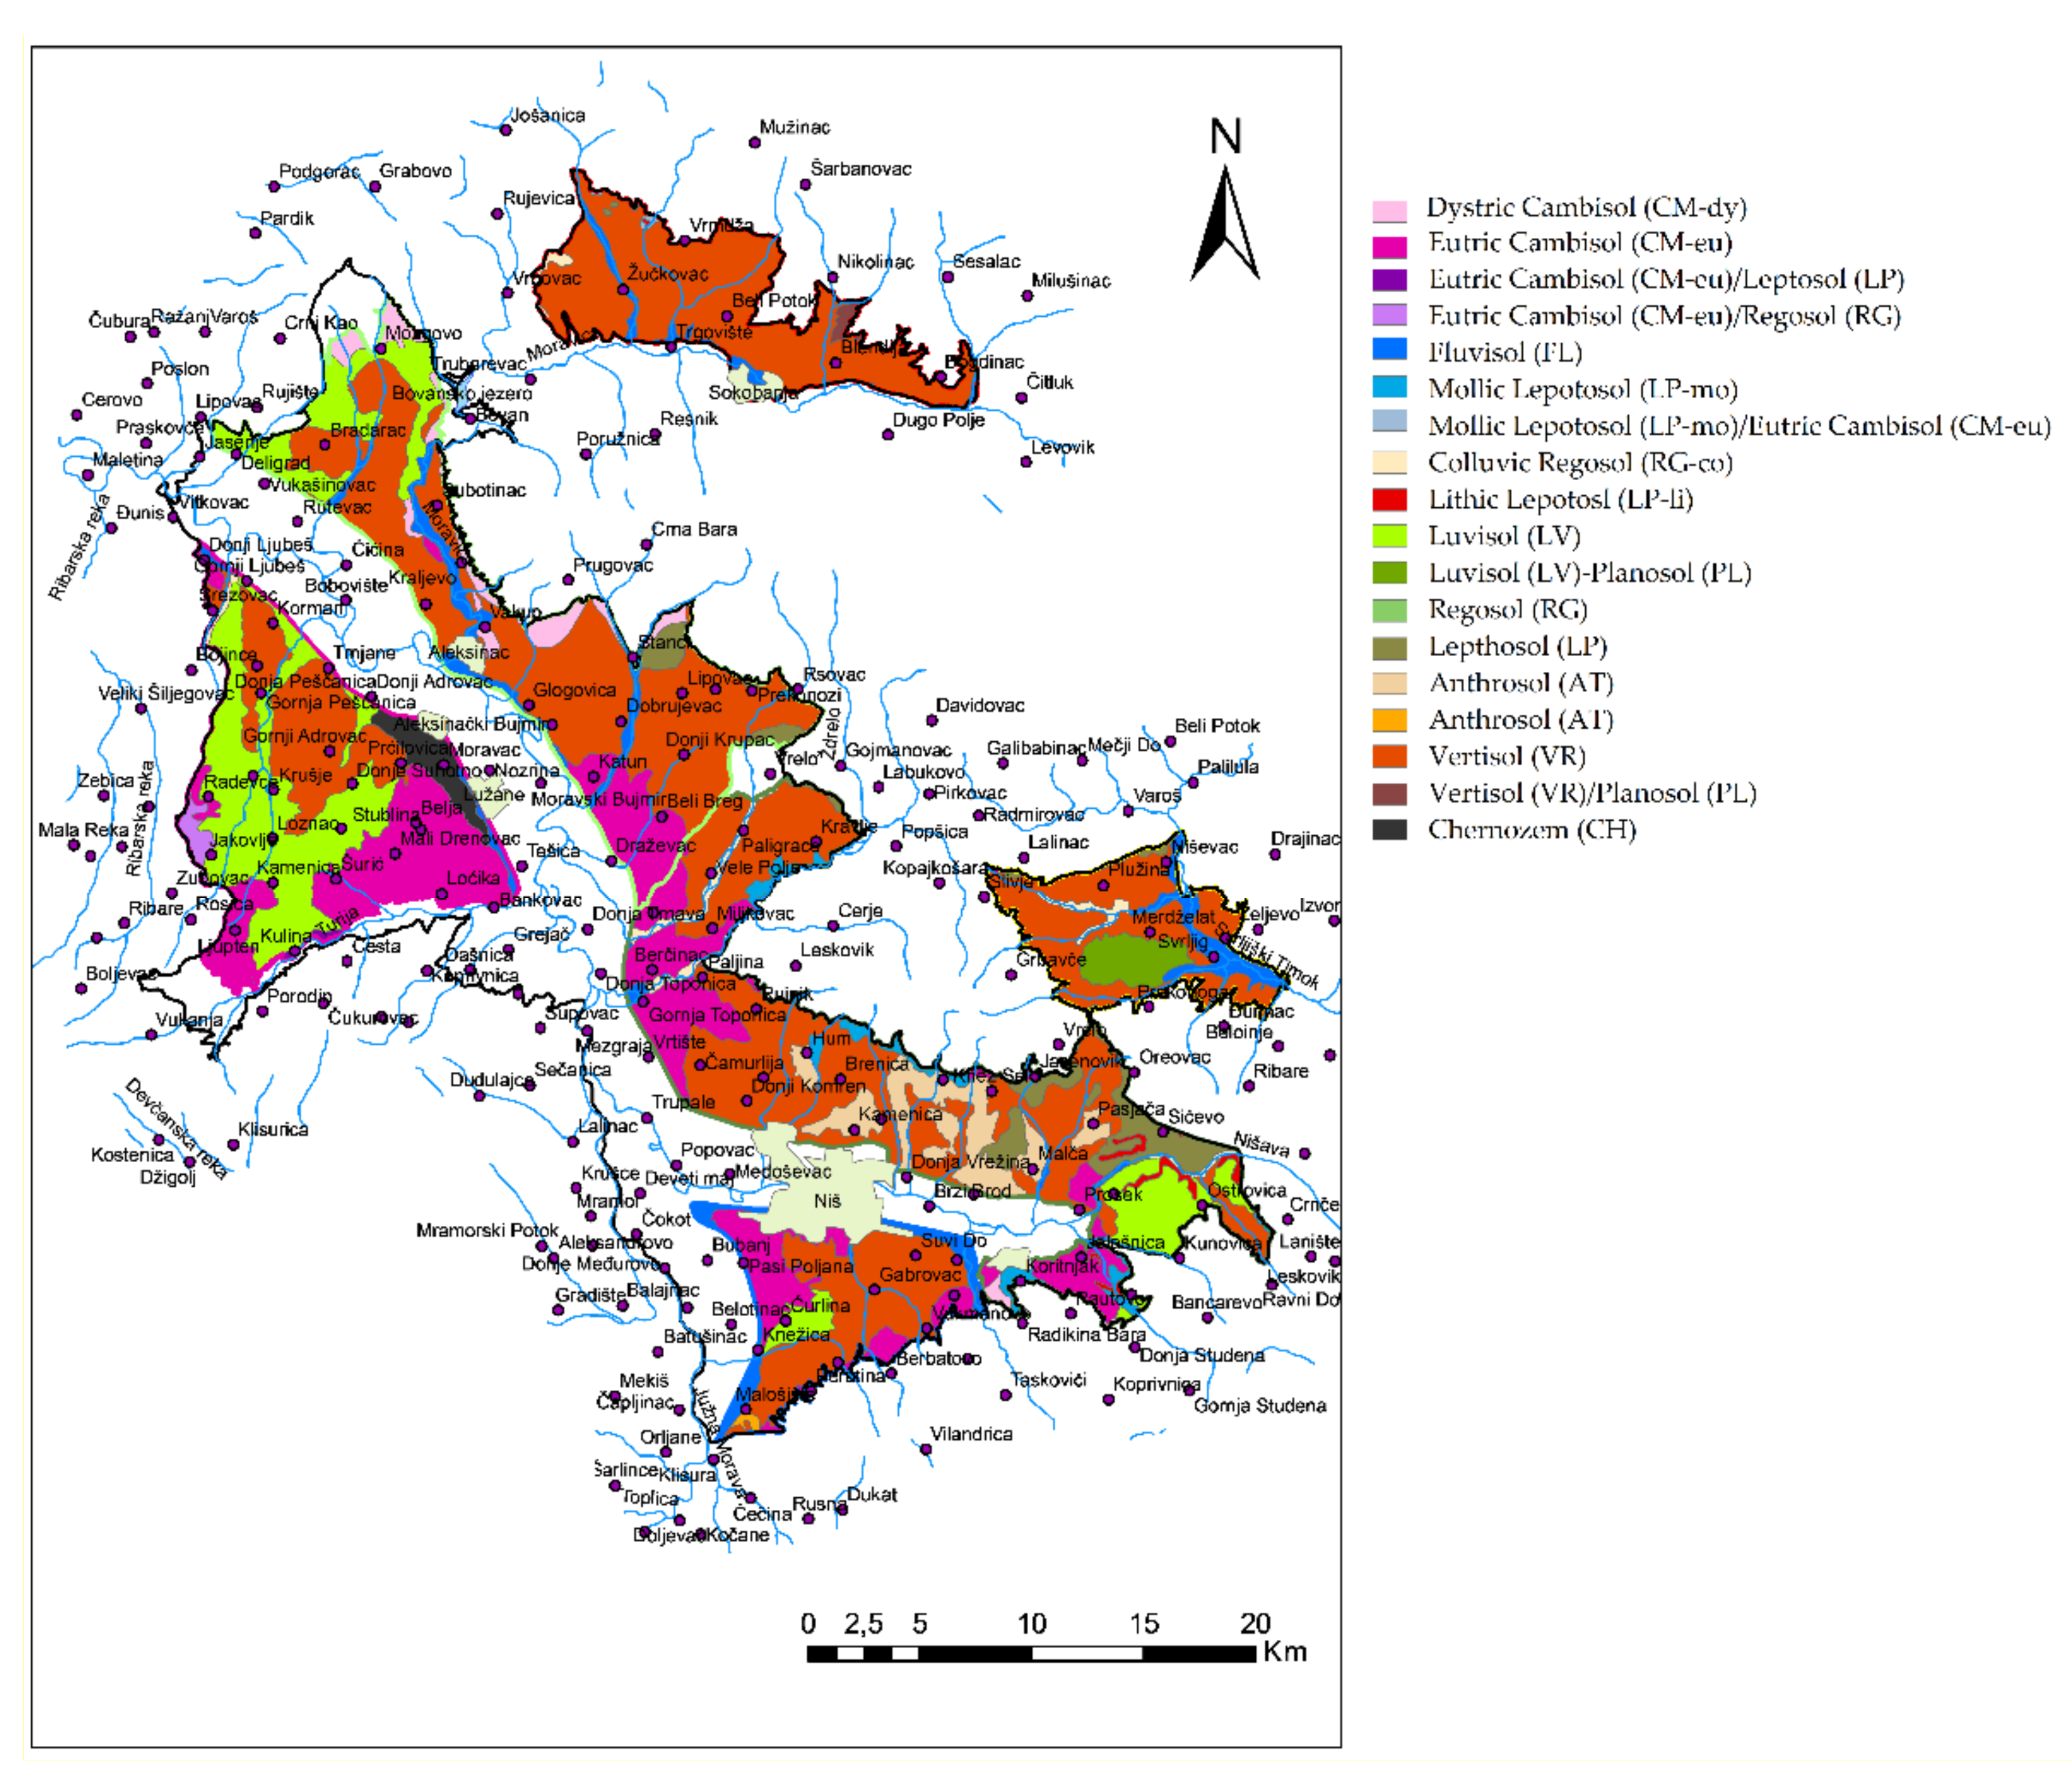
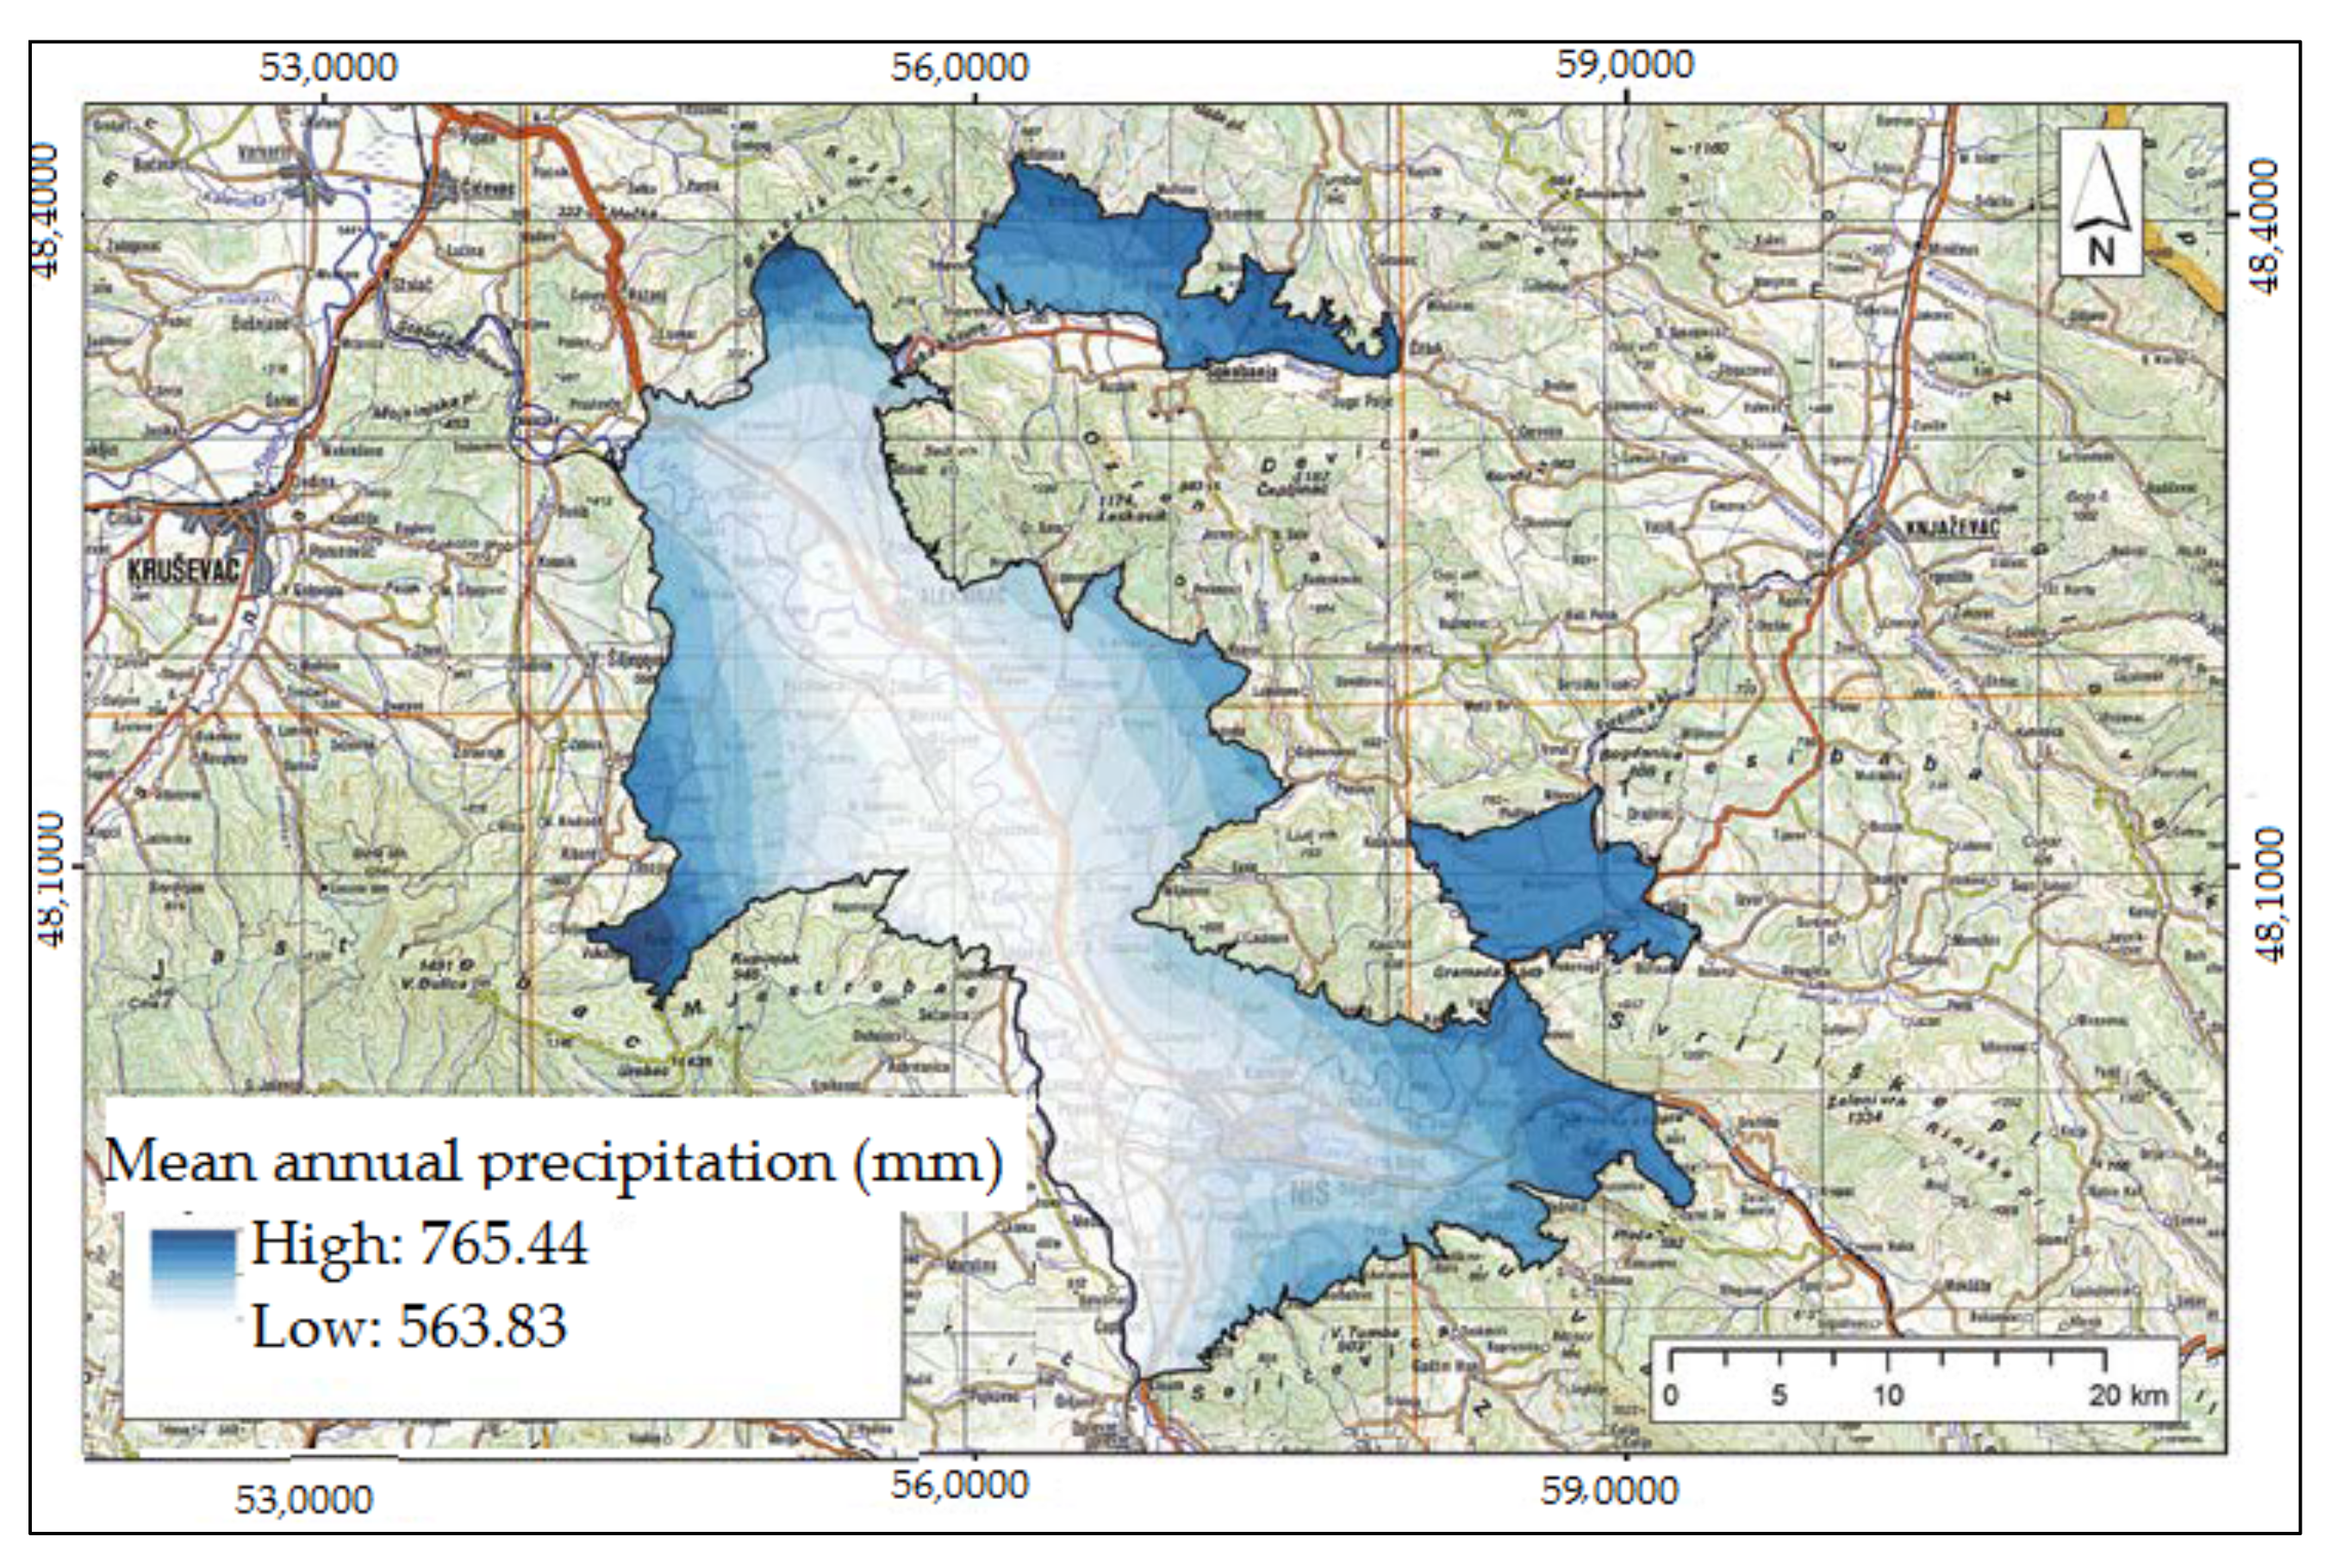
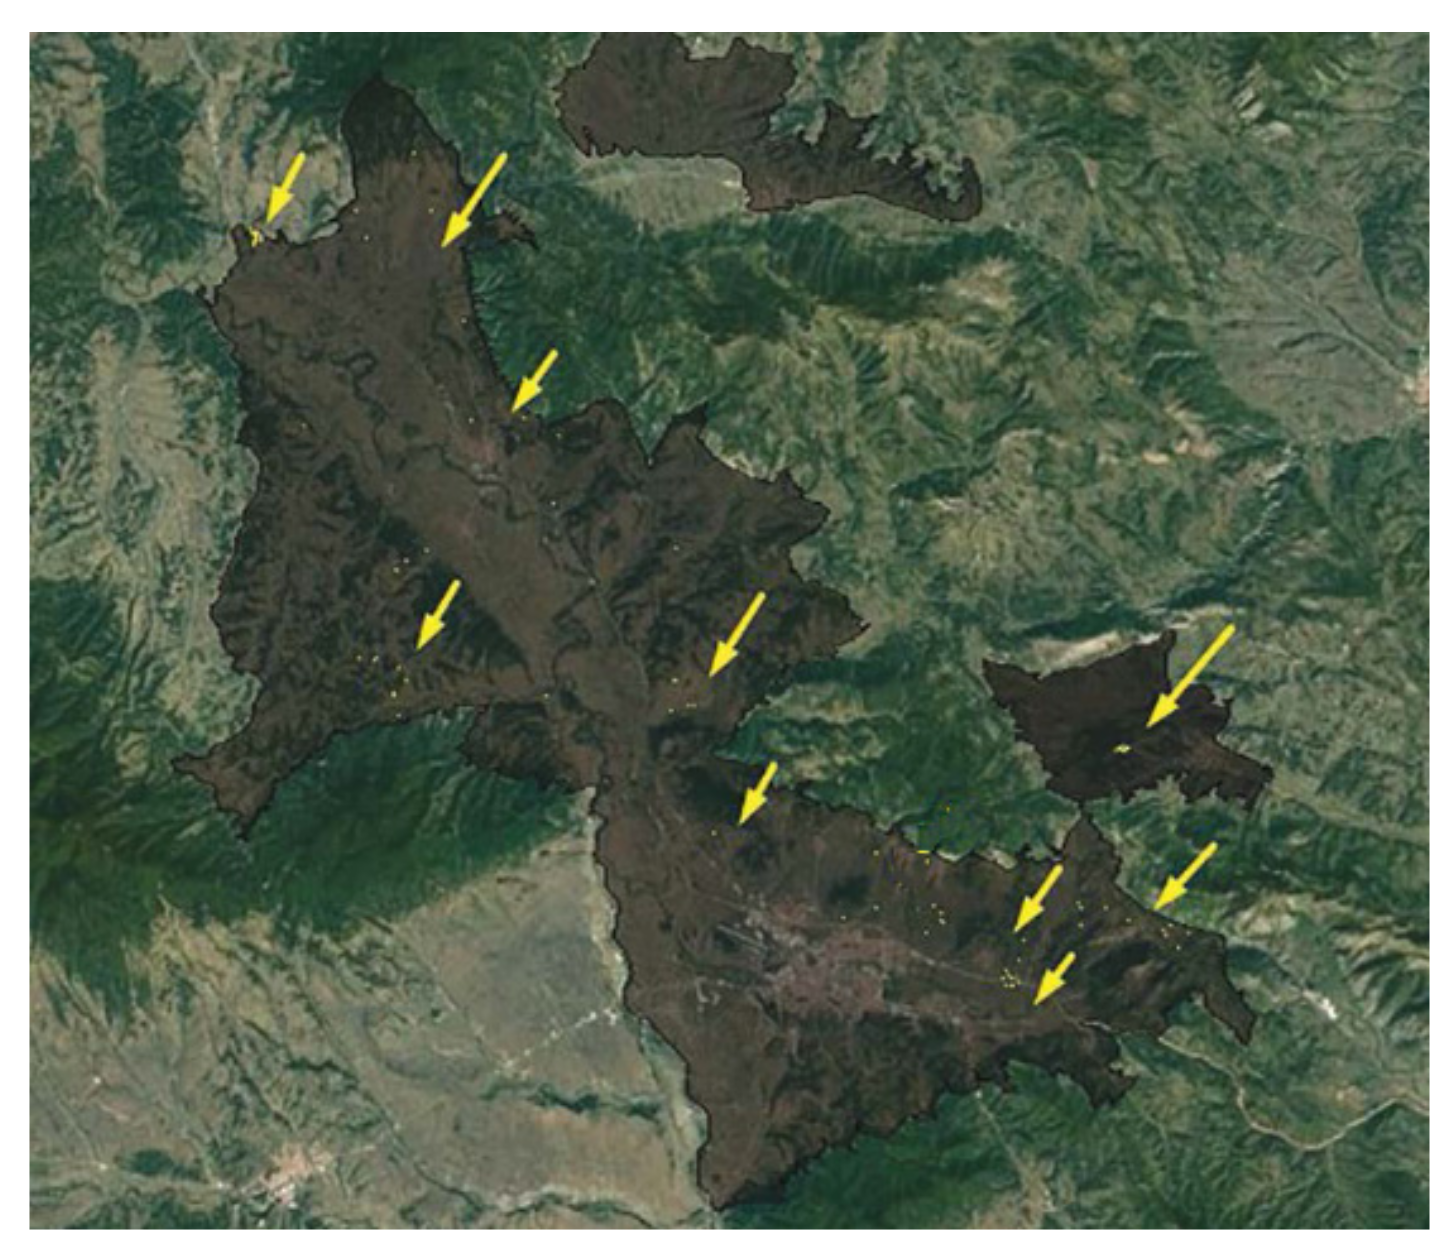
2.1. Study Area

The study area is the Region of Niš (Figure 1), located between 43°41′ N and 43°13′ N and with a total surface area of 1040.84 km2.
The Region of Niš encompasses wide areas around the lower Nišava, Južna Morava, and Moravica river basins. Moving away from the valleys of the rivers Južna Morava and Nišava in the central part of the region towards the more peripheral parts, the plains and hilly areas are replaced by mountain ranges that surround the region. In the northeast, the region is surrounded by Ozren and, in the southeast, by Svrljig and Suva mountains which belong to the Carpathian mountain range. Selicevica in the south and Jastrebac in the west both belong to the Rhodope mountain range. The river South Morava is situated along the western border of the southernmost part of the region, which is characterized by flat terrain. The relief characteristics of the region have three general altitudes: (1) plains around the rivers in the southeast-northwest direction (lower level); (2) areas with hills and ridges on both sides of the valleys, except in the southwestern part of the region (higher level); (3) parts of the previously mentioned mountains in the northeast and a small part in the west near Jastrebac mountain (the highest mountain level).
Most of the observed area (48.11%) is at altitudes of between 200 and 300 m, while 28.11% is at an altitude of 300 to 400 m and 13.02% is at an altitude of 400 to 500 m. Other altitudes constitute a significantly lower share of the area. There are six vine-growing districts in this region: Sokobanja, Aleksinac, Žitkovac, Čegar, Kutina, and Svrljig (Figure 1a) [17].
About 43.39% of the observed area is located on terrains with a slope greater than 0 to 5° (Figure 1b). The share of area in the Niš region on slopes greater than 5 to 10° is 26.42%, while 16.04% of the area is located on very steep terrains (with a slope greater than 10 to 15°) [17].
Figure 1c shows that the slopes in the Niš region are mostly oriented to the south (S) (31.5%), southwest (SW) (19.16%), southeast (SE) (14.04%), west (W) (11.95%), and east (E) (7.40%) [17].
The Niš region contains fourteen different types of soil represented in larger or smaller areas, with the most common soil types being vertisol, eutric cambisol, and luvisol (Figure 2).

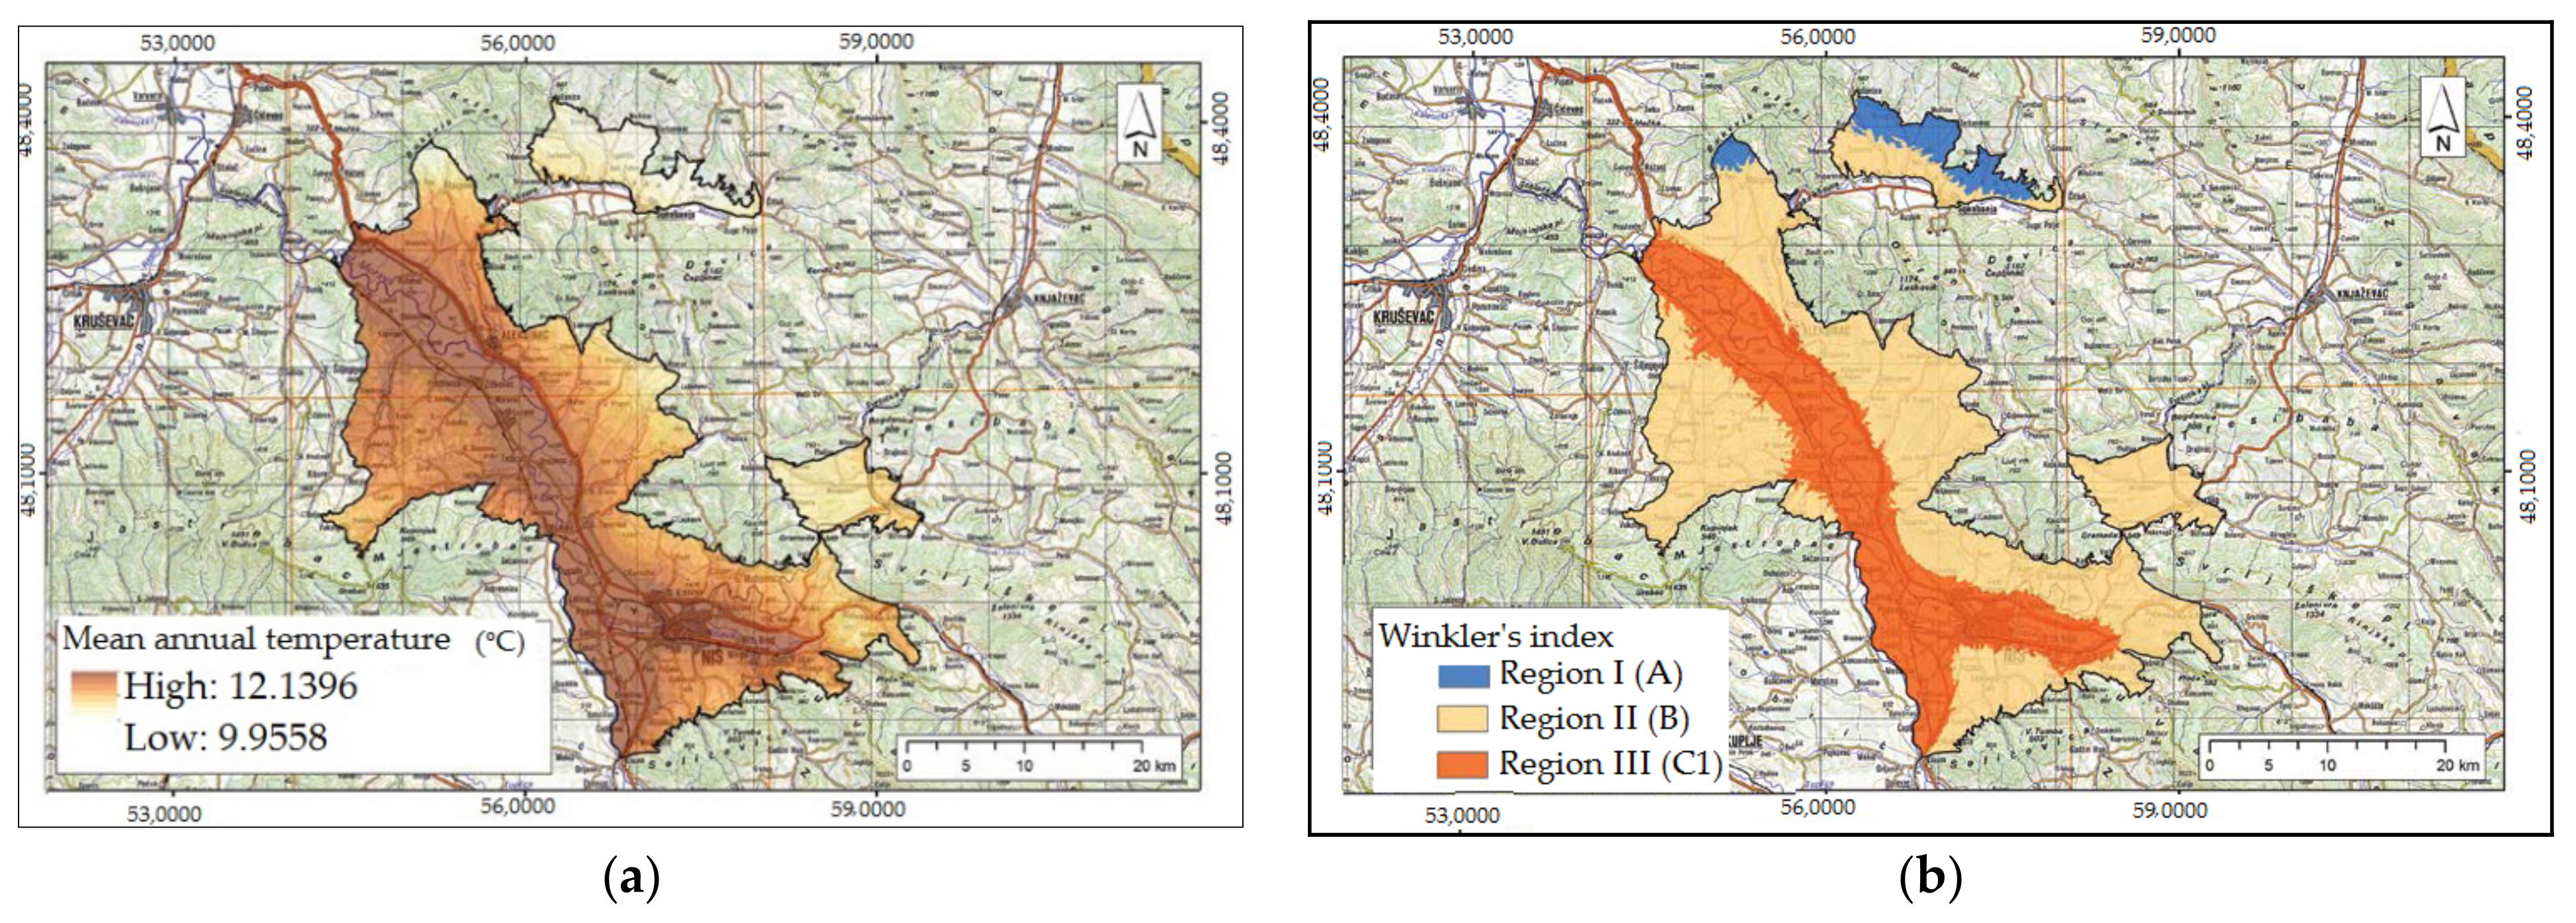
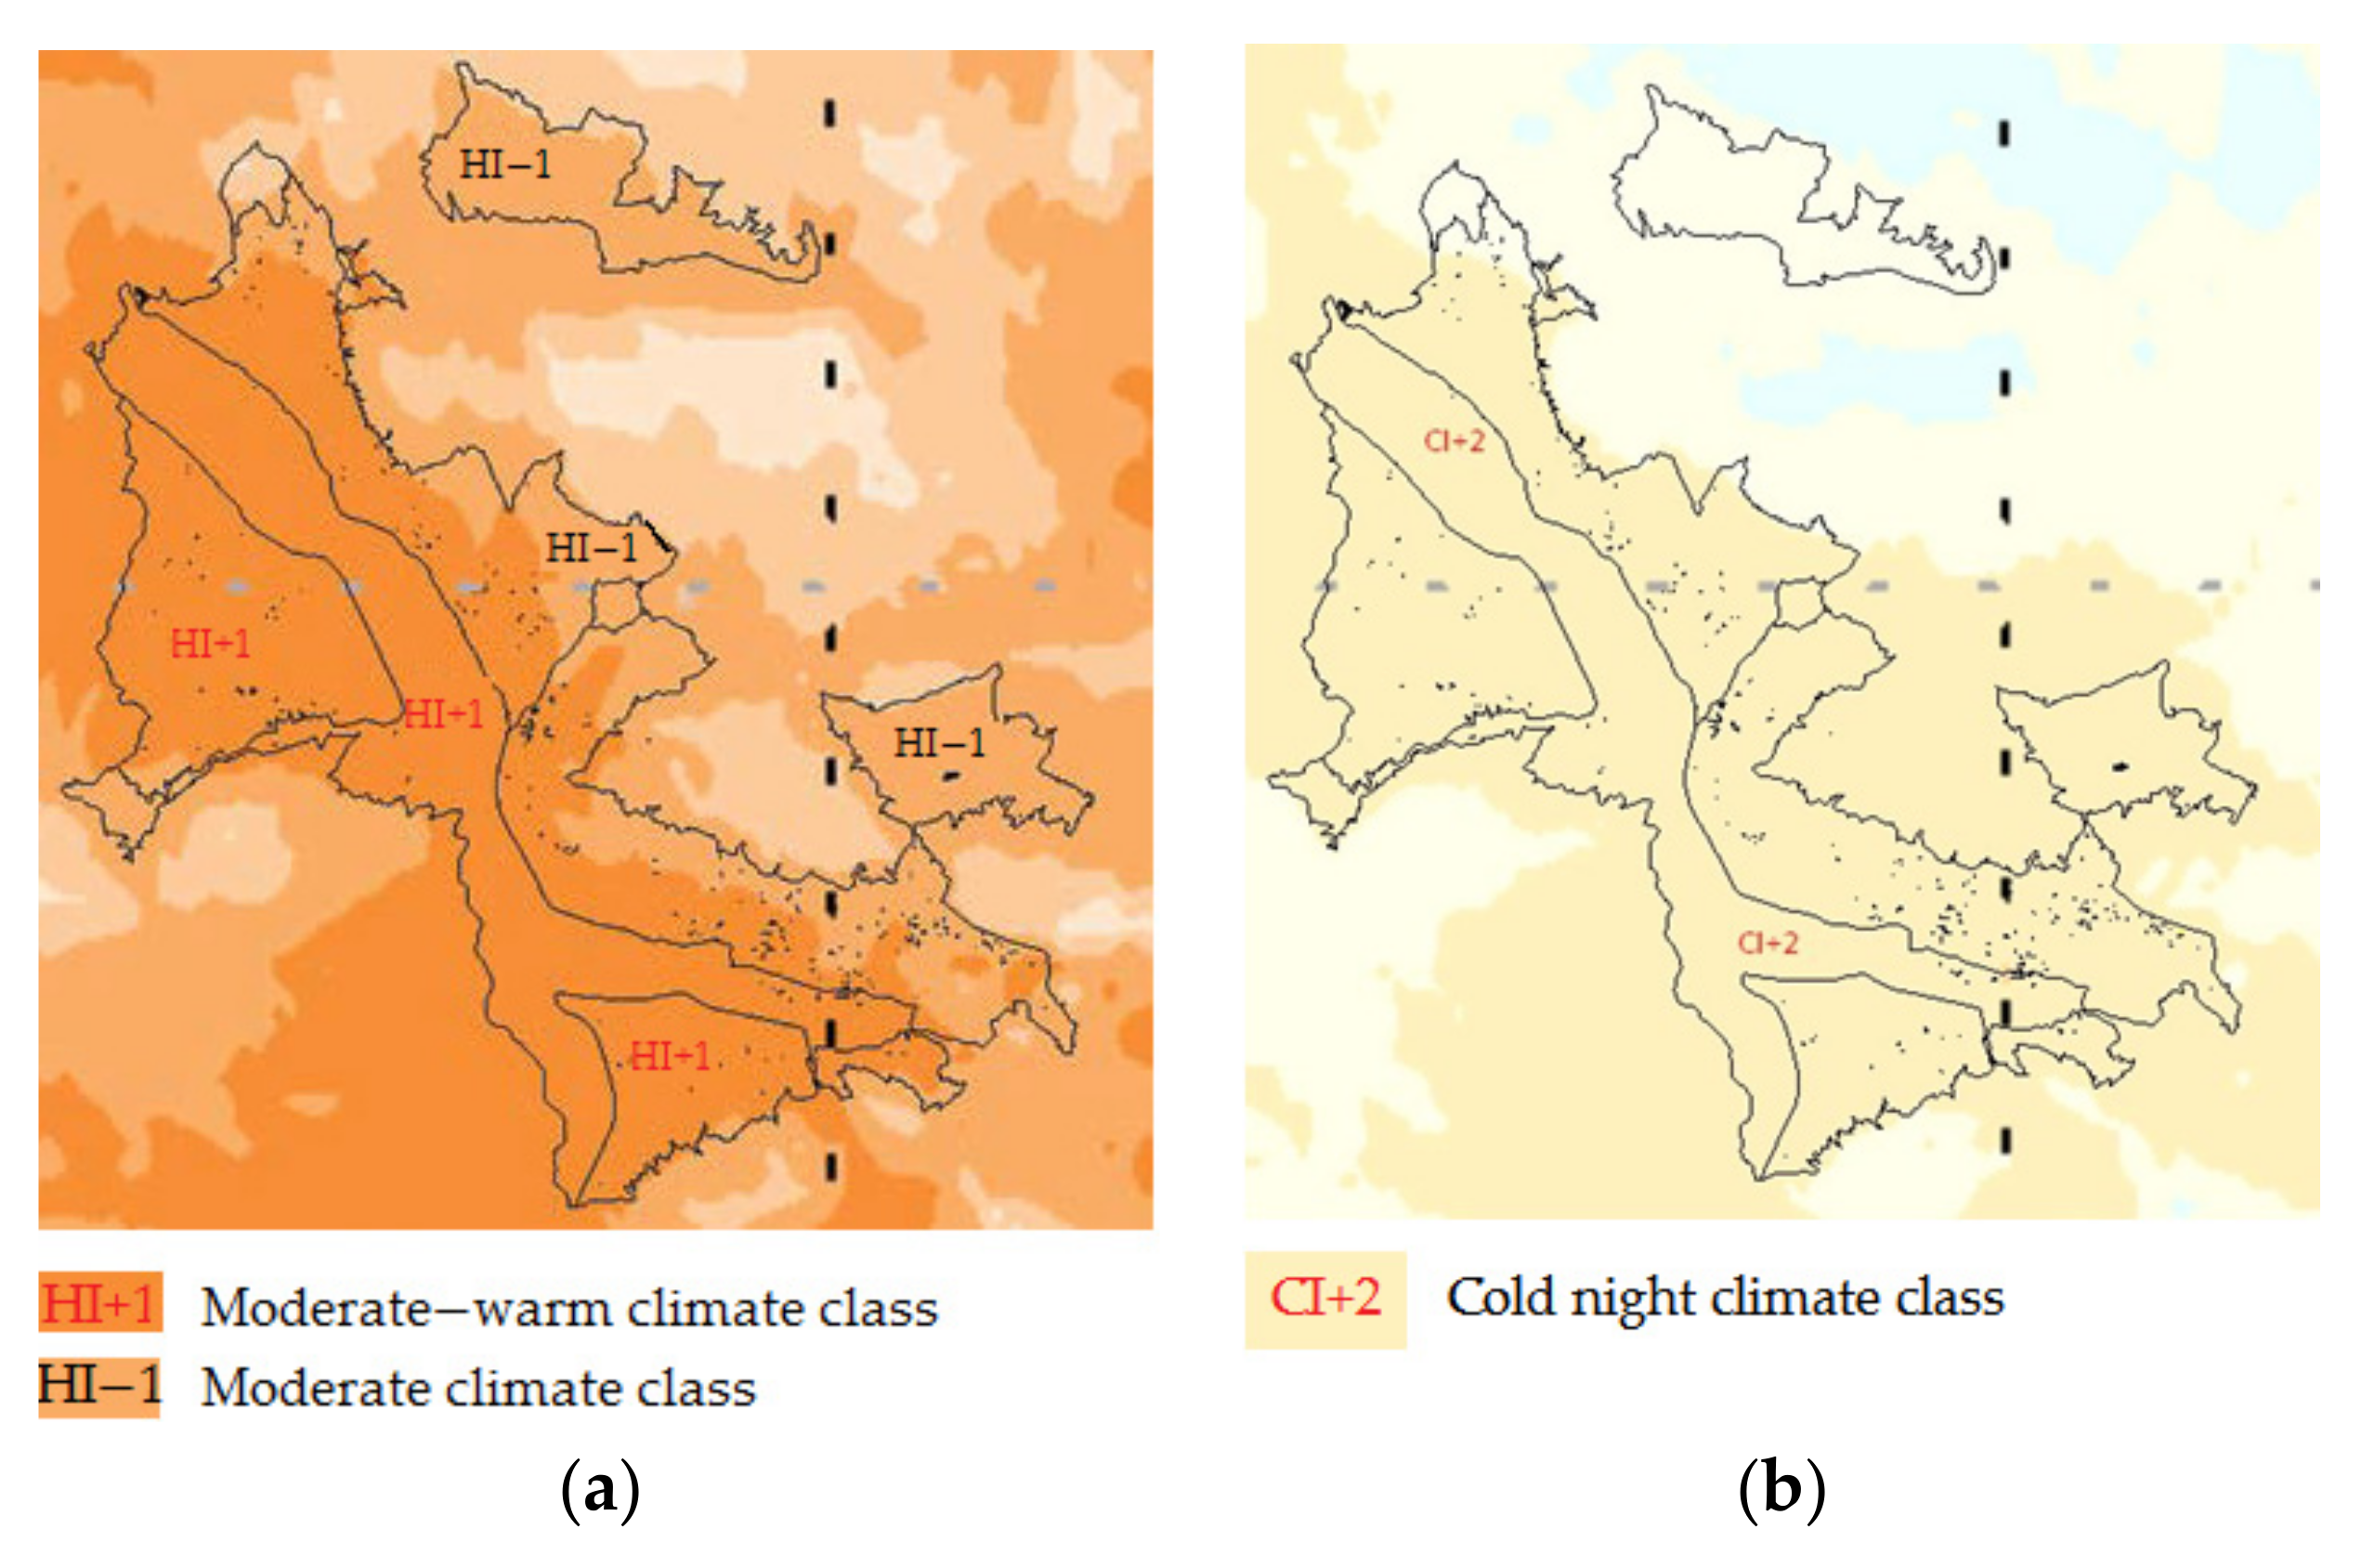
2.2. Climate Characteristics

Climate characteristics were obtained by analysis of data for the 50-year period of 1961–2010 from the meteorological station in Niš located at 43°33′33″ N, 21°90′00″ E and at 204 m a.s.l.

2.2.1. Temperature Characteristics

Temperature characteristics are shown in Figure 3 and Figure 4. The average annual air temperature, for the last 50 years, is 12.1 °C. The average air temperature is highest in the valleys of the rivers Južna Morava and Nišava to the entrance of the Sićevačka gorge, while the locality east of Niš also has a favorable air temperature. The mean maximum annual air temperature in the Niš region is 17.7 °C, while the mean minimum annual air temperature is 6.5 °C.
On average, the coldest month in the Niš region, according to average monthly temperatures, is January (0.7 °C), while the warmest is August (22.2 °C). The mean maximum air temperature is the lowest in January, and the highest in August. The average minimum air temperature in the Niš region is the lowest in January, and the highest in July. According to the Winkler index, the region of Niša is in Region III (1713.8). The sum of biological effective temperatures (BEDD) (April–October period) for the Niš region is 1390.4.
According to Huglin’s index (2259.7), the lower parts of the region are in the HI+1 group of regions in the interval >2100, ≤2400 with climate type moderate-warm (temperate warm) [18]. The index of night freshness (CI) for the Niš region (at the meteorological station) is 11.3 °C. The value of the drought index for the Niš region (at the meteorological station) is 138.0 mm, which classifies this region as a DI-1 sub-humid (medium humid) region, with typical absence of drought [19]. The number of days in the vegetation period (April–October) with a minimum daily temperature of ≤0 °C (NT0) for the Niš region is 3.6. The number of days in the dormant period with minimum daily temperatures of ≤−15 °C (NT-15) for the Niš region is 1.2, which puts it in the group of regions with a moderate number of days with extremely low temperatures. The number of days in the vegetation period (April–October) with maximum daily temperatures of ≥35 °C (NT35) is 7.7, which puts it into the group of regions with a slightly higher number of days characterized by extremely high temperatures.

2.2.2. Precipitation Characteristics

The average annual precipitation in the Niš region is 593.5 mm, ranging between 565.83 mm and 765.44 mm (Figure 5), with the lowest precipitation in the valley of South Morava and the highest in the hilly areas of Sokobanja and Svrljig in the eastern part of the region, or at the slopes of Jastrebac mountain in its western part. The mean precipitation during vegetation (April–October) in the Niš region is 362.7 mm, which is lower in relation to the precipitation in other regions. The average recorded monthly precipitation in the Niš region for the period of 1961–2010 was lowest during February (39.1 mm) and highest during June (64.5 mm).

2.3. Classifications of Topographic Factors
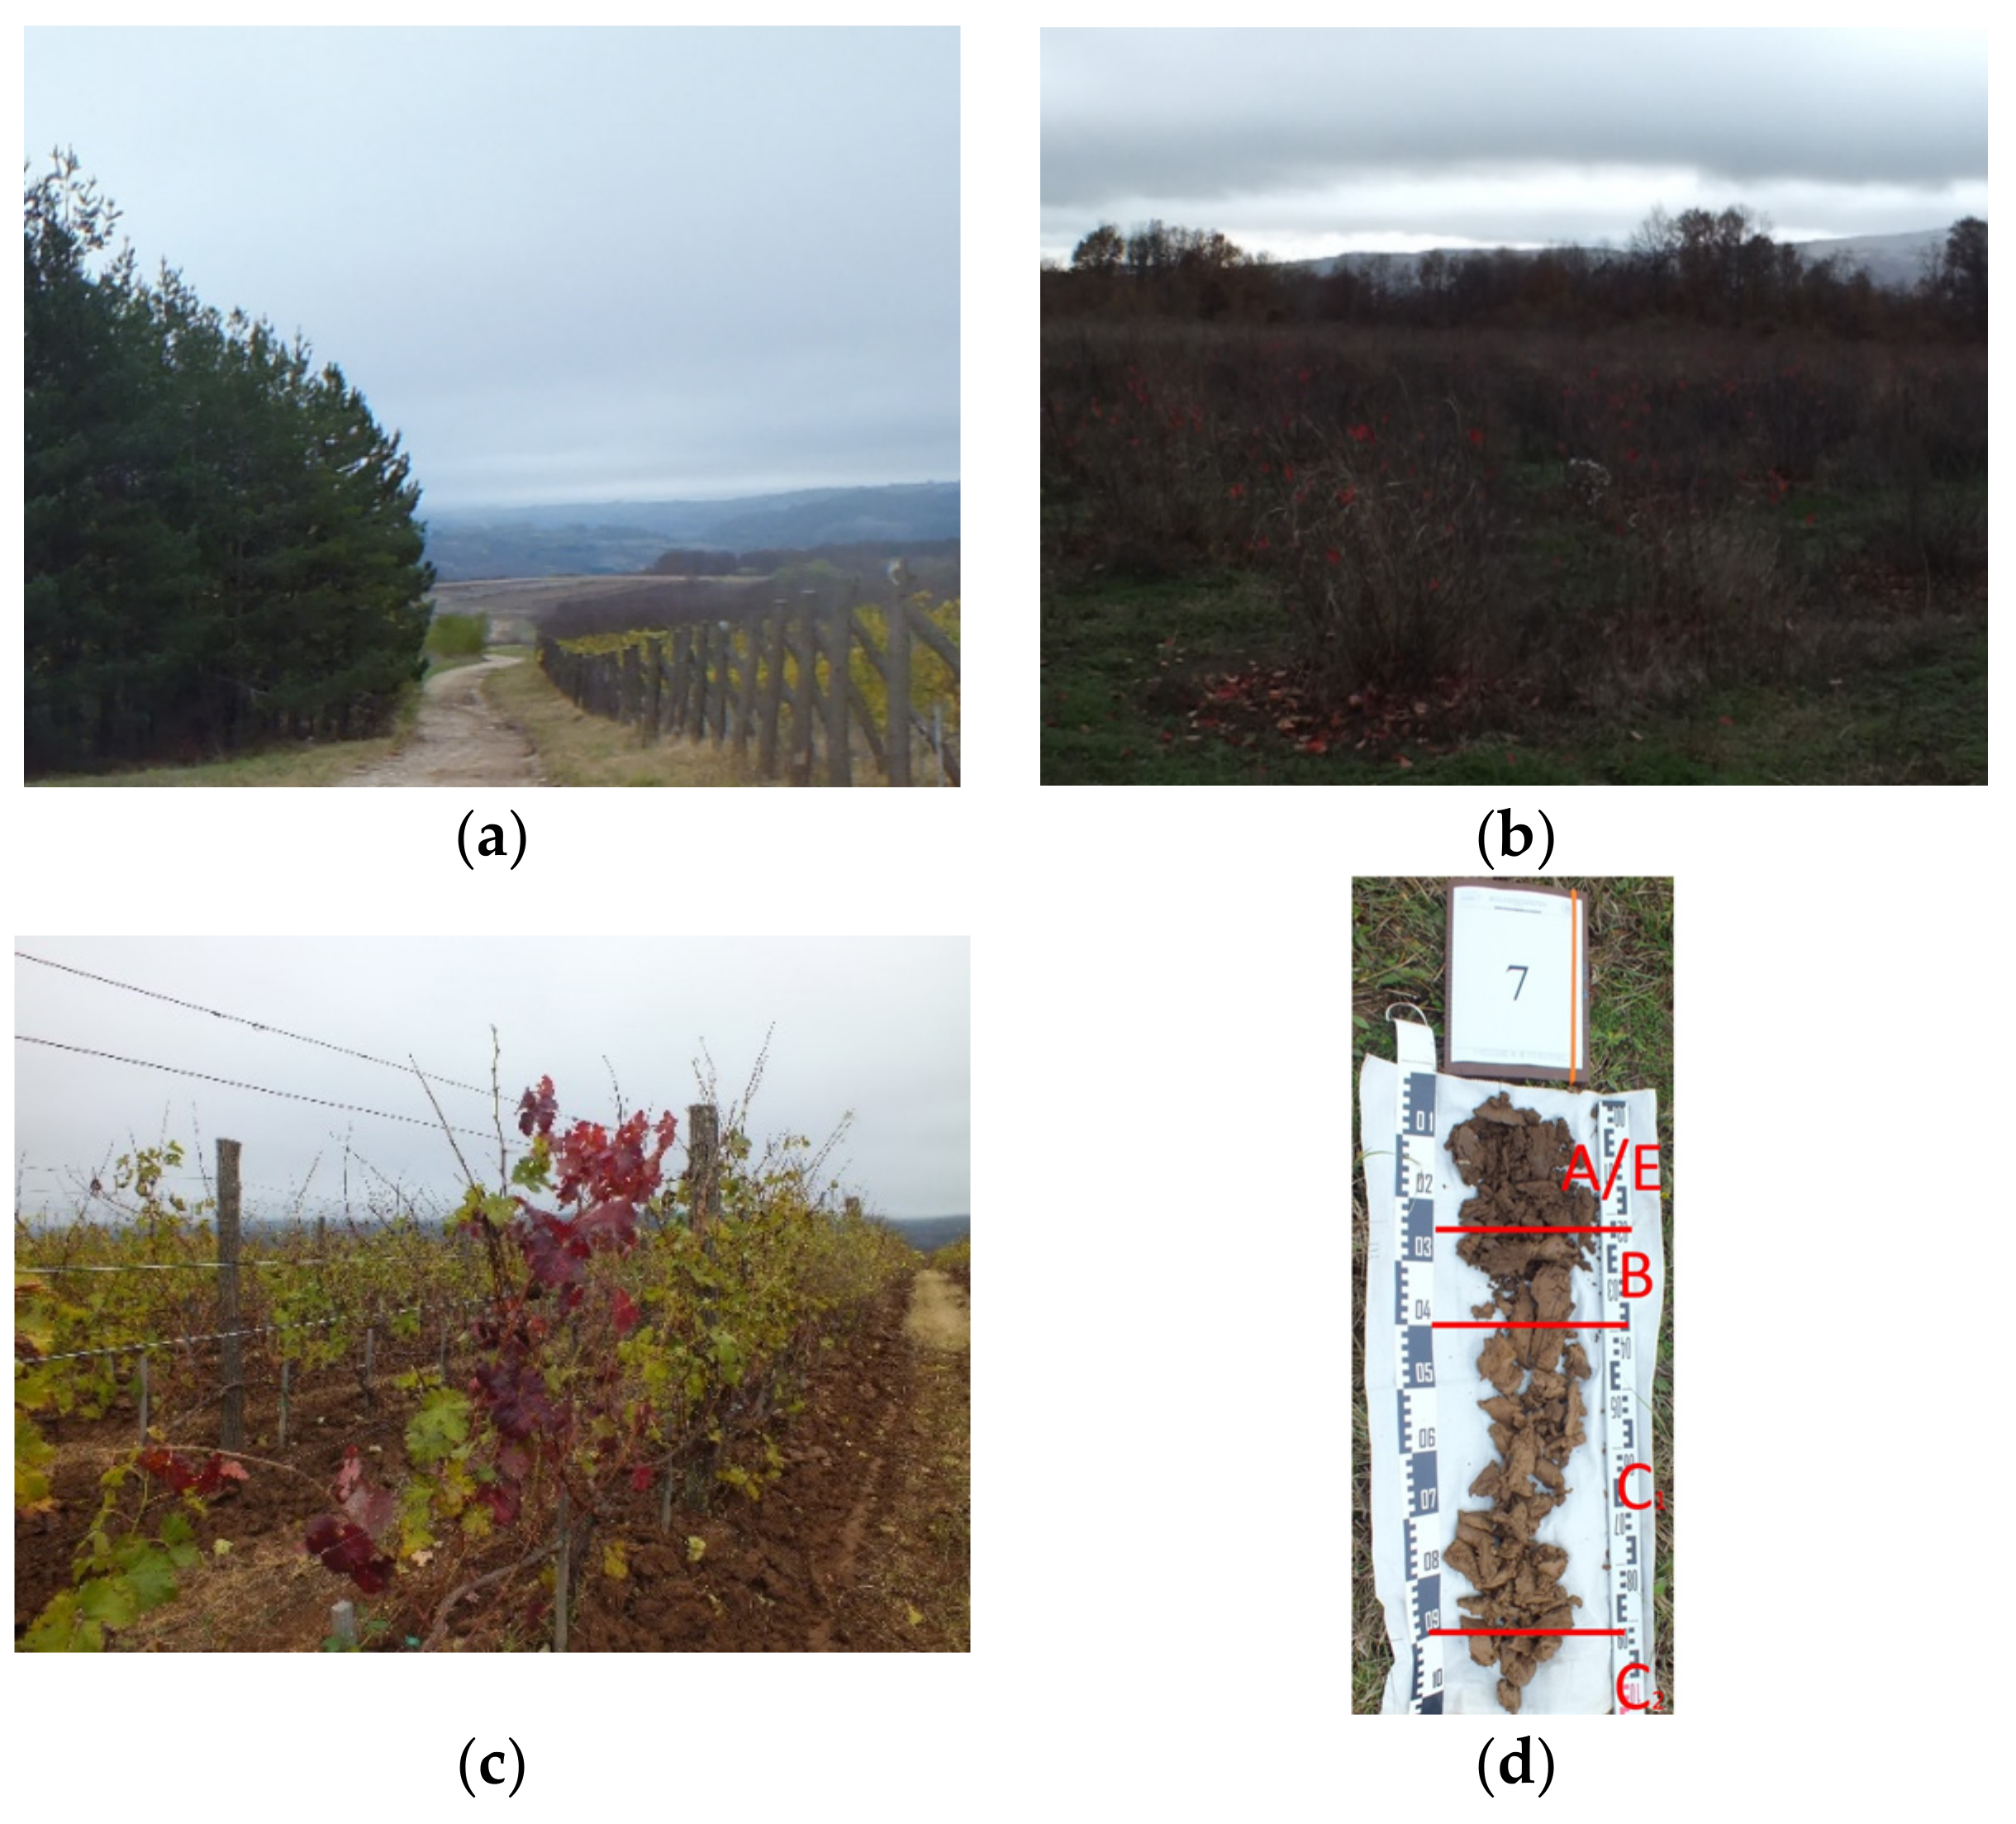
The aspect was classified into eight slope aspects: E (east), NE (northeast), N (north), W (west), NW (northwest), SE (southeast), S (south), and SW (southwest).
The slope gradient was divided into very slightly inclined (VSI): 1–2°, slightly inclined (SI): 2–5°, and medium inclined (MI): 5–10° classes [20].

2.4. Soil Sampling

The total analyzed area included 20 vineyard plots, 10 forest locations, and 10 plots of uncultivated land at 10 locations representative of the region of Niš (Table 1 and Figure 6). The uncultivated land category contains agricultural areas that have no physical indication of present agricultural use. One of the locations is shown in Figure 7. The sampling plots exhibited a uniform microrelief and slope to the terrain, as well as having the same cultivation practices. The size of the plots (subplots) varied from 1400 to 34,500 m2. Field work took place during 2016. The soil was sampled from two depths, 0–30 cm and 30–60 cm. Composite soil samples amounted to approximately 20 individual samples. The total number of these composite soil samples was 80.
Soil profiles were analyzed up to a maximum depth of 200 cm or to the parent material. Samples for soil profile description and classification were taken in disturbed state using an Eijkelkamp Edelman auger. The total number of these soil samples was 45.
Georeferencing of soil and parcel samples in this study was performed using GPS receivers (Trimble GPS GeoXH 3000, Trimble GPS Juno SC, Terrasync Professional software; Trimble, Inc., Sunnyvale, CA, USA). Data processing was carried out using the ESRI ArcEditor 10 GIS (geographic information system).

2.5. Laboratory Analysis

All laboratory analyses were performed at the Laboratory for Soil and Agroecology of the Institute of Field and Vegetable Crops, accredited according to the standard ISO/IEC 17025:2017 [21].
The soil samples collected were naturally air-dried, milled, and passed through a 2.0 mm sieve, according to ISO 11464:2006 [22]. Soil pH values were determined by the potentiometric method according to ISO 10390:2005 [23] in a 1:5 suspension of soil in H2O using a Mettler Toledo SevenCompact pH meter with glass electrode (Mettler Toledo, LLC, Columbus, OH, USA). The carbonate content (as CaCO3) was determined according to the ISO 10693:1995 [24] volumetric method. SOC was determined by elementary analysis using CHNSO VarioEL III Elementar (Elementar Analysensysteme GmbH, Langenselbold, Germany) after dry combustion and carbonate removal, in accordance with ISO 10694:1995 [25]. Available phosphorus (P2O5) and available potassium (K2O) were determined by ammonium lactate extraction [26] followed by spectrophotometry and flame photometry detection, respectively. Total N was determined according to the AOAC 972.43: 2000 method by elemental analysis on the CHNSO VarioEL III Elementar. The particle size distribution was determined in the <2 mm fraction using the pipette method [27]. The size fractions were defined as clay (<2 μm), silt (2–20 μm), fine sand (20–200 μm), and coarse sand (200–2000 μm).

2.6. Statistical Analyses

Study data were processed using descriptive statistics. The effects of slope gradient and aspect on SOC were estimated by analysis of variance (ANOVA). The significance of the differences was determined using Duncan’s range test (multistage test) (p < 0.05). Correlation analysis between slope gradient, SOC content, and other soil properties was calculated using the Pearson correlation at a significance level of p < 0.05. All statistical analyses were performed using STATISTICA 12.6 (StatSoft, Inc. Corporation, Tulsa, OK, USA).

3. Results and Discussion

3.1. Characteristics of the Soil

The results of the analysis of the physical and chemical soil properties for topsoil and subsoil are given in Table 2.
According to the classification for agricultural soils [28], the pH value in topsoil and subsoil was extremely acid to alkaline. Soil pH value is determined by the pH reaction of the parent substrate in which the soil was formed. The topsoil layer (0–30 cm) had an acidic pH value for the most part (62% of the region’s surface area).
Samples of topsoil and subsoil belonged to the noncalcareous to highly calcareous soil categories [15]. The CaCO3 content largely depended on the parent substrate. With regard to total N content, the soil samples had a low to adequate level. A high clay content was found in both soil layers and varied between 10.32% and 61.88%. Most of the samples were concentrated in the classes of light clay and heavy clay. This texture is unfavorable for most cultivated plant species. Loamy soils with high organic matter, low water-holding capacity, and well-drained characteristics are more suitable for plant production [29]. The available phosphorus content in soil samples varied from very low to the optimal level. The available potassium content in soil samples ranged from low to very high.

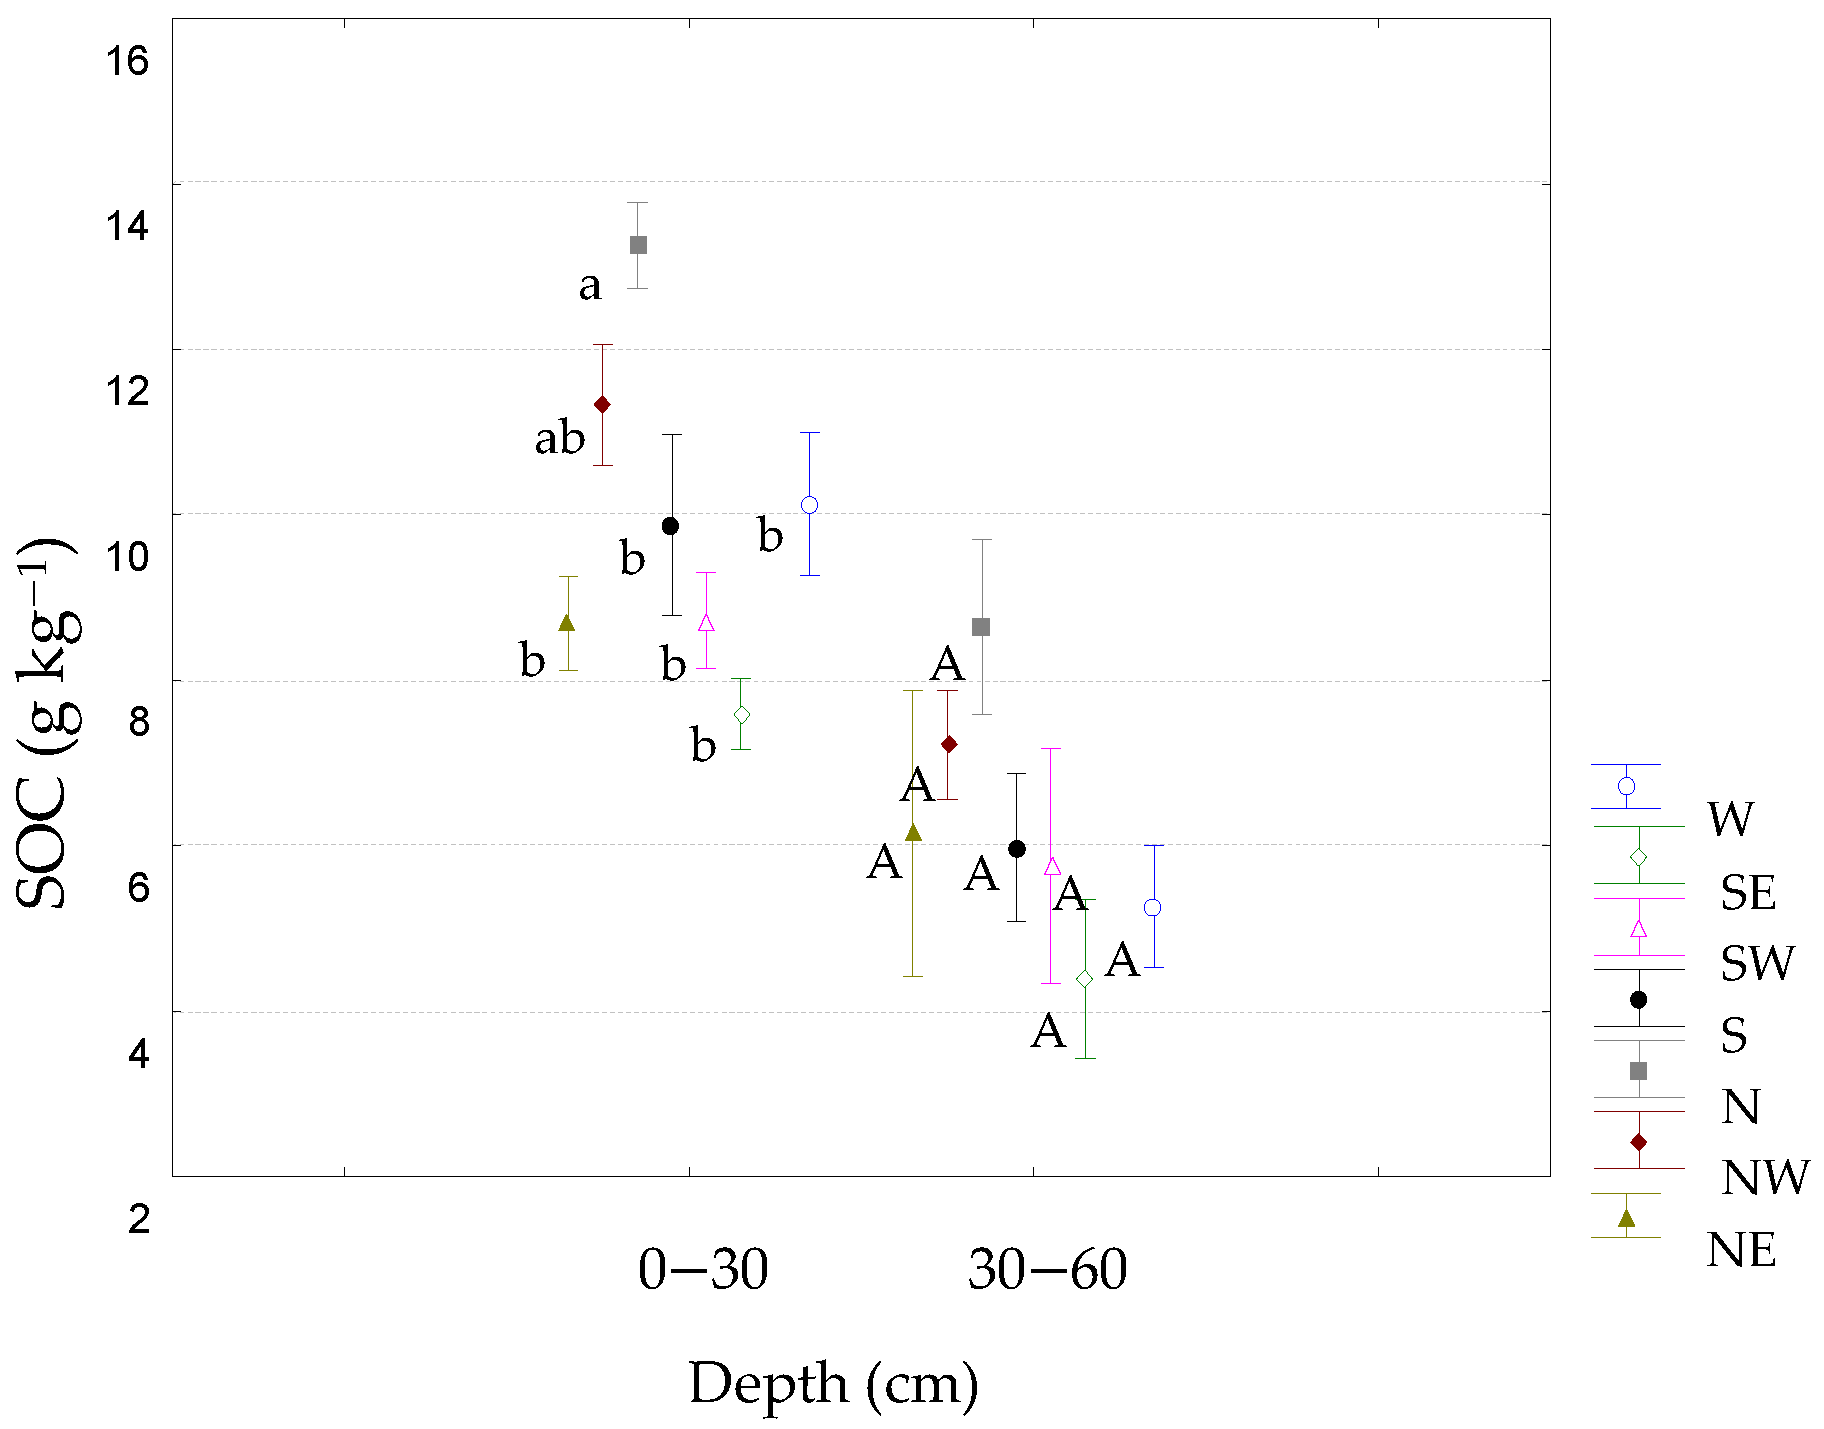
3.2. Effect of Slope Aspect on SOC Content

The results of the study indicate a significant variation of SOC content depending on the slope aspect (Figure 8). The soil organic carbon ranged between from 2.55 g kg−1 to 15.49 g kg−1, with mean value 8.47 g kg−1. The highest content of SOC, 10.94 g kg−1, was in N-facing soils, which was significantly higher than all other values, except for NW (9.27 g kg−1). The lowest value was detected in SE (5.99 g kg−1), which was significantly lower than N and NW. There were no significant differences among other slope aspects.
Organic carbon in the topsoil was highest in N soils (13.25 g kg−1), as compared with all other aspects, except for NW (Figure 9). No significant differences were found in the subsoil.
The variation of organic carbon content in soils differed significantly depending on the land use/cover. The highest values were found in forest land (9.17 g kg−1) and the lowest in UL (7.66 g kg−1). Previous studies in Serbian soils demonstrated that land use is an important factor in SOC variability. In the study of Antonović and Mrvić [30], the average SOC content in forests was 15.20 g kg−1. The lowest SOC content was in vineyards (12.91 g kg−1).
The SOC content in the observed area was lower compared with the mean value for soils in Serbia. Differences in SOC content can be partially explained by soil-forming factors. SOC storage is strongly associated with soil type at multiple scales. Soil type is not an independent control factor but integrates climate, parent material, and topography-related properties, which affect the potential of soils to store C, particularly through moisture regime and texture. The surface SOC concentration correlates negatively with annual mean temperature and correlates positively with annual mean precipitation [15]. The mean annual air temperature in the region of Niš from the last 50 years (12.1 °C) was higher than that of the whole country (10.1 °C). The mean annual precipitation was lower in this region (593.5 mm) compared with the value for the whole country (734 mm). On the other hand, forest clearing and unprofessional forest thinning, as well as frequent wildfires, stimulate soil degradation in the forests of this region [30].
In forest land, the highest SOC value was recorded in NW-facing soils (11.86 g kg−1), and was significantly higher compared with SOC values from S (6.93 g kg−1), SE (5.57 g kg−1), and NE-facing aspects (5.05 g kg−1). Additionally, significant differences in SOC content were recorded between N (10.81 g kg−1) and W (9.91 g kg−1), and SE (5.57 g kg−1) and NE (5.05 g kg−1). The lowest SOC value was in NE-facing soils (5.05 g kg−1). Similar results were obtained by Zhu et al. [31], suggesting that the forest-steppe zone was characterized by the strongest effect of aspect on SOC in comparison with the shrub-steppe and shrub-meadow zones, and confirmed the importance of elevation and aspect in shaping the spatial patterns. The SOC density, at a depth of 0–60 cm, was higher on the north-facing slopes than that on the south-facing slopes.
In vineyards, the highest SOC value was measured in N-facing soils (11.23 g kg−1), and the lowest in S (6.87 g kg−1) and SE-facing soils (6.97 g kg−1), with a significant difference existing between them.
In UL, no similar regularity in the distribution of organic carbon in relation to the topographic aspect was observed. The highest SOC value was from S aspects (8.80 g kg−1), and the lowest was from SE aspects (4.45 g kg−1).
Based on these results, it could be concluded that slope aspect greatly influenced the spatial distribution of SOC in the forest and vineyard soils. In forests and vineyards, N and NW aspects had the highest levels of organic carbon in soil. No similar pattern was found in uncultivated soils, most likely due to anthropogenic influences. Uncultivated soils are mostly abandoned areas with various previous uses, cover, and management practices which have led to disturbances in the spatial distribution of organic carbon.
This distribution pattern was consistent with several recent studies, which demonstrated that SOC was higher on north-facing slopes. In the study of Qui et al. [32], the SOC, vegetation cover, and biomass significantly increased from south-facing to semi-shady slope aspects, and values from the semi-shady slope aspect were around two times greater than those from the south-facing slope aspect. Lozano-García et al. [11] found the lowest SOC value in the S aspect and the highest in the N aspect. Lenka et al. [33] found higher SOC values in the N aspect compared with the E aspect. In the study of Tamene et al. [34], the highest significant (p < 0.05) mean value of SOC was observed in the Ww (3.04%), followed by Nw (2.52%), but SOC was not significantly different between Sw and Ew. Sharma et al. [35] and Sigua and Coleman [36] found higher SOC values in the NE aspect than in the SW aspect. This difference between the aspects is due to the fact that the insolation received is lower in the N aspect; therefore, this slope aspect has microclimatic features including soil moisture and temperature regimes that favor biomass production and soil organic C accumulation within the overall environment [36,37]. Holland and Steyn [38] indicated that typical north-facing slopes received 1.3 to 1.9 times more insolation than south-facing slopes. The south-facing slopes are usually hot and dry with less vegetation, are prone to erosion, and hence are depleted of SOC [39].

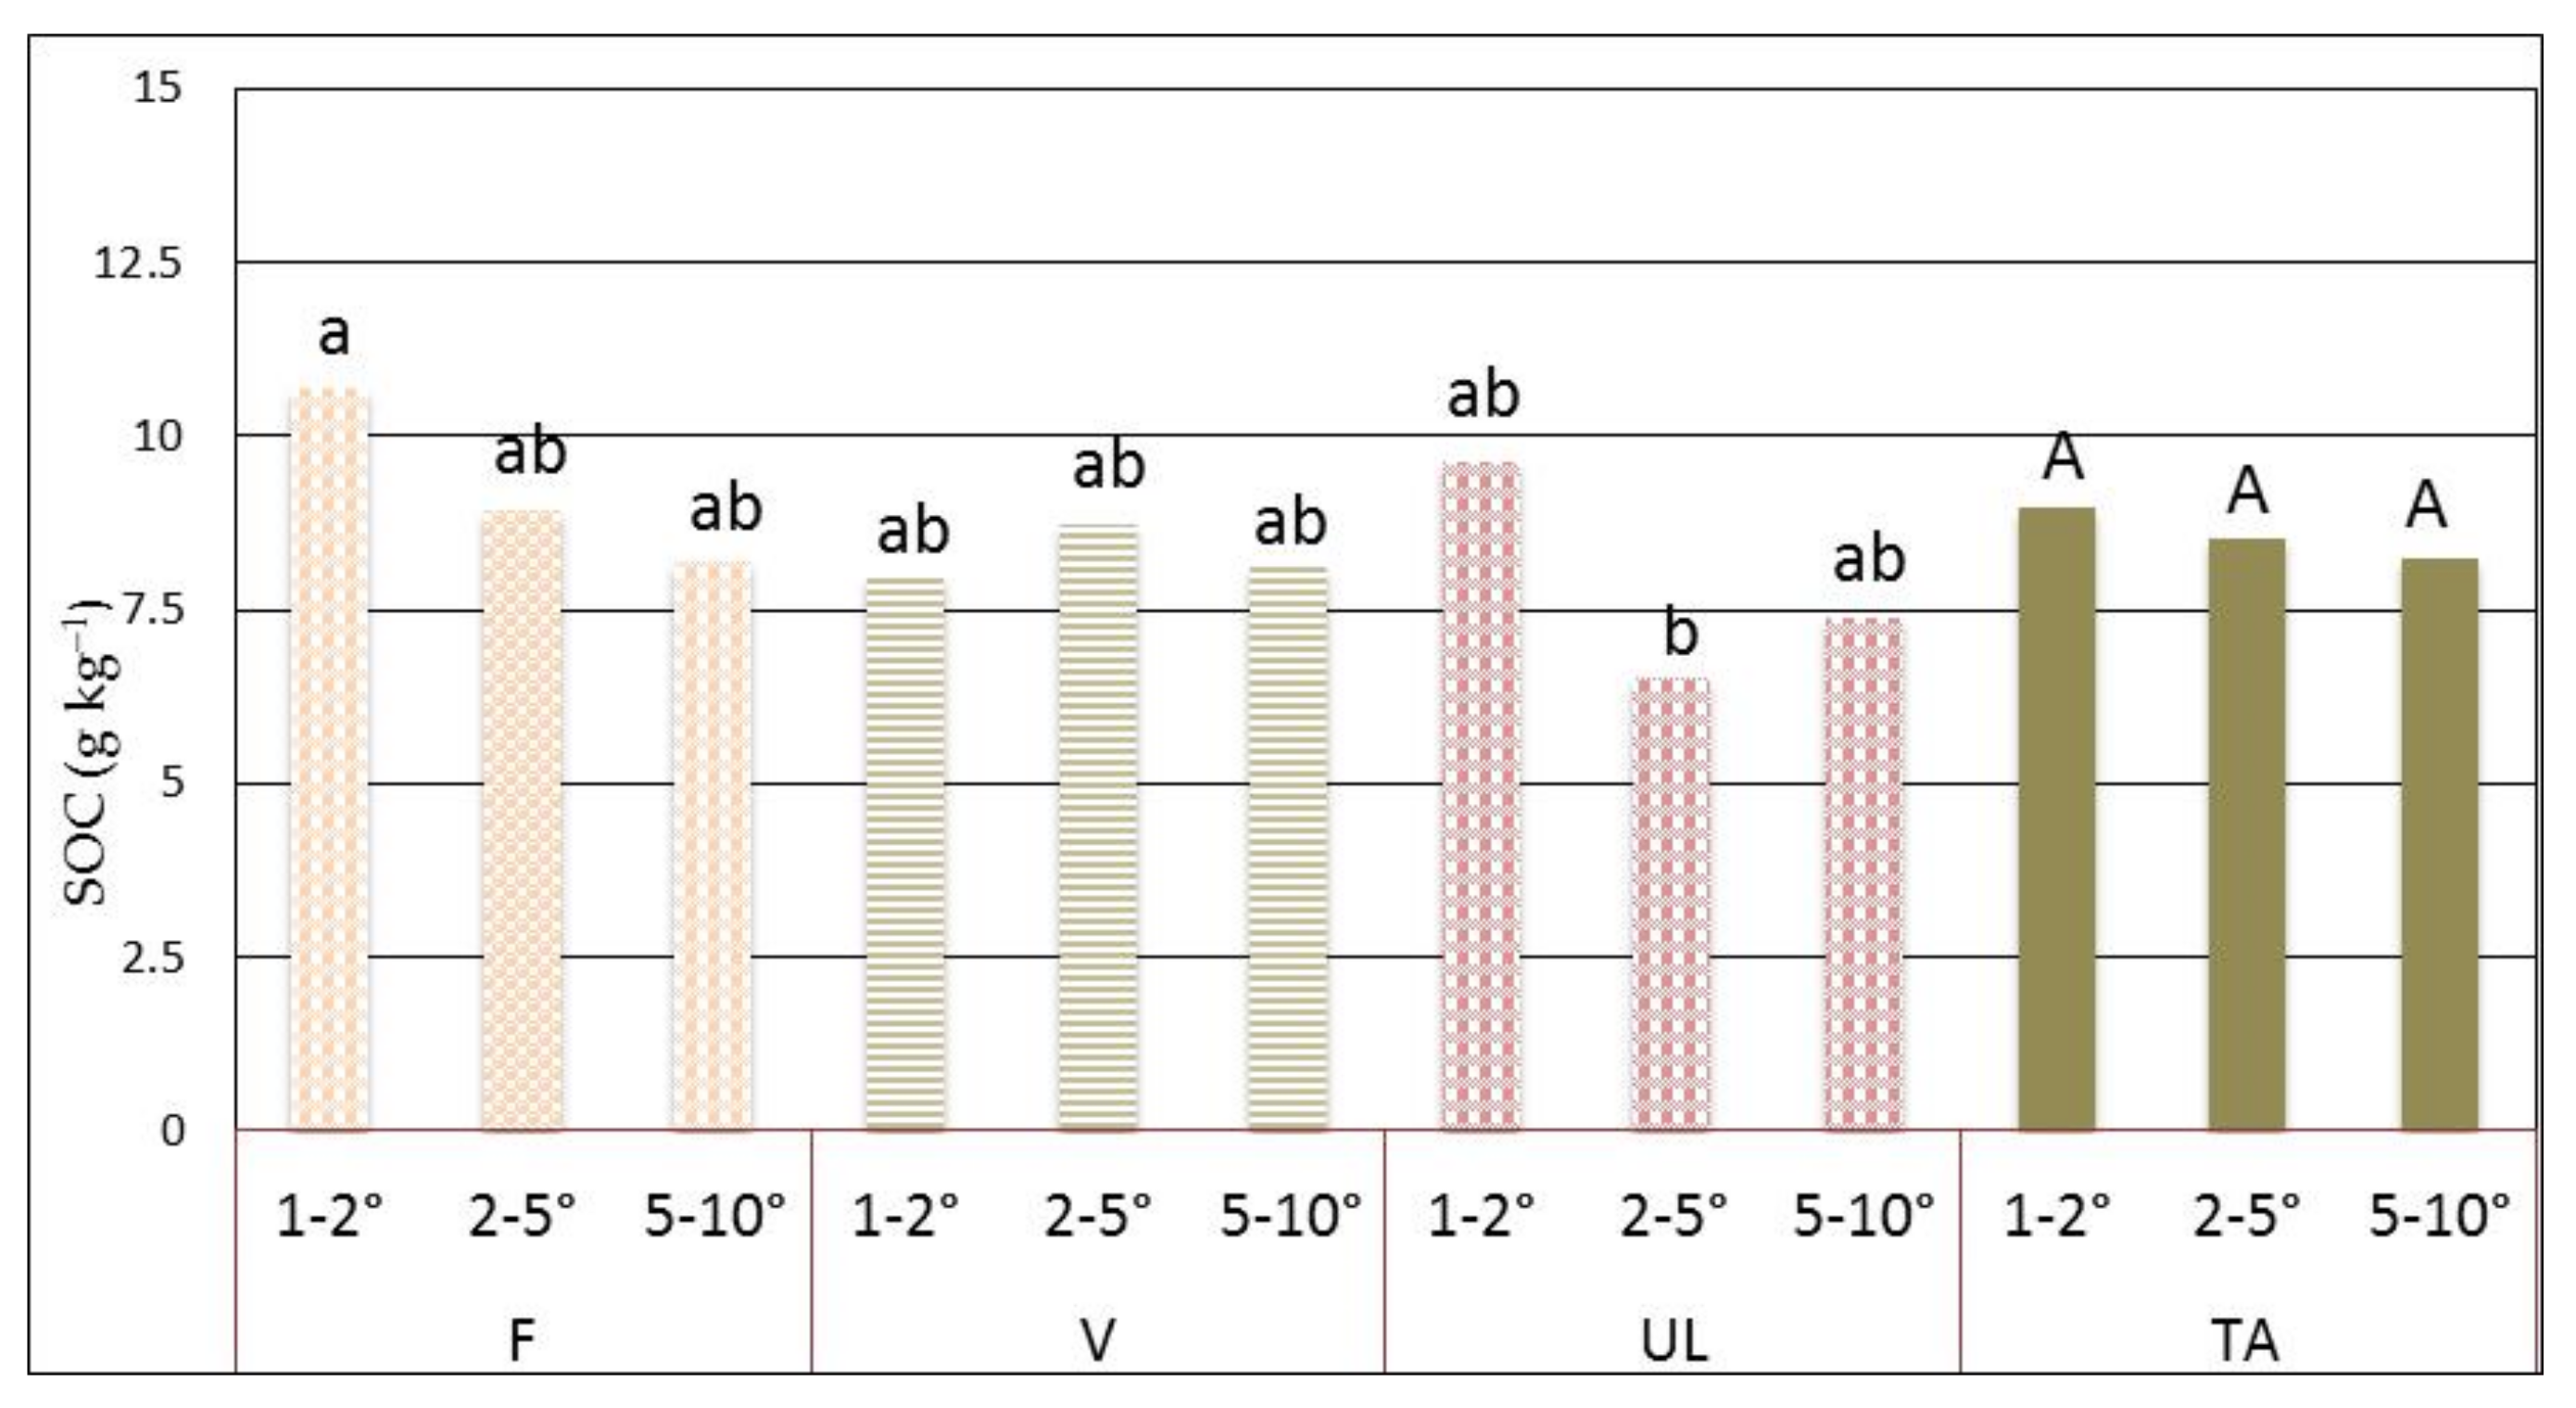
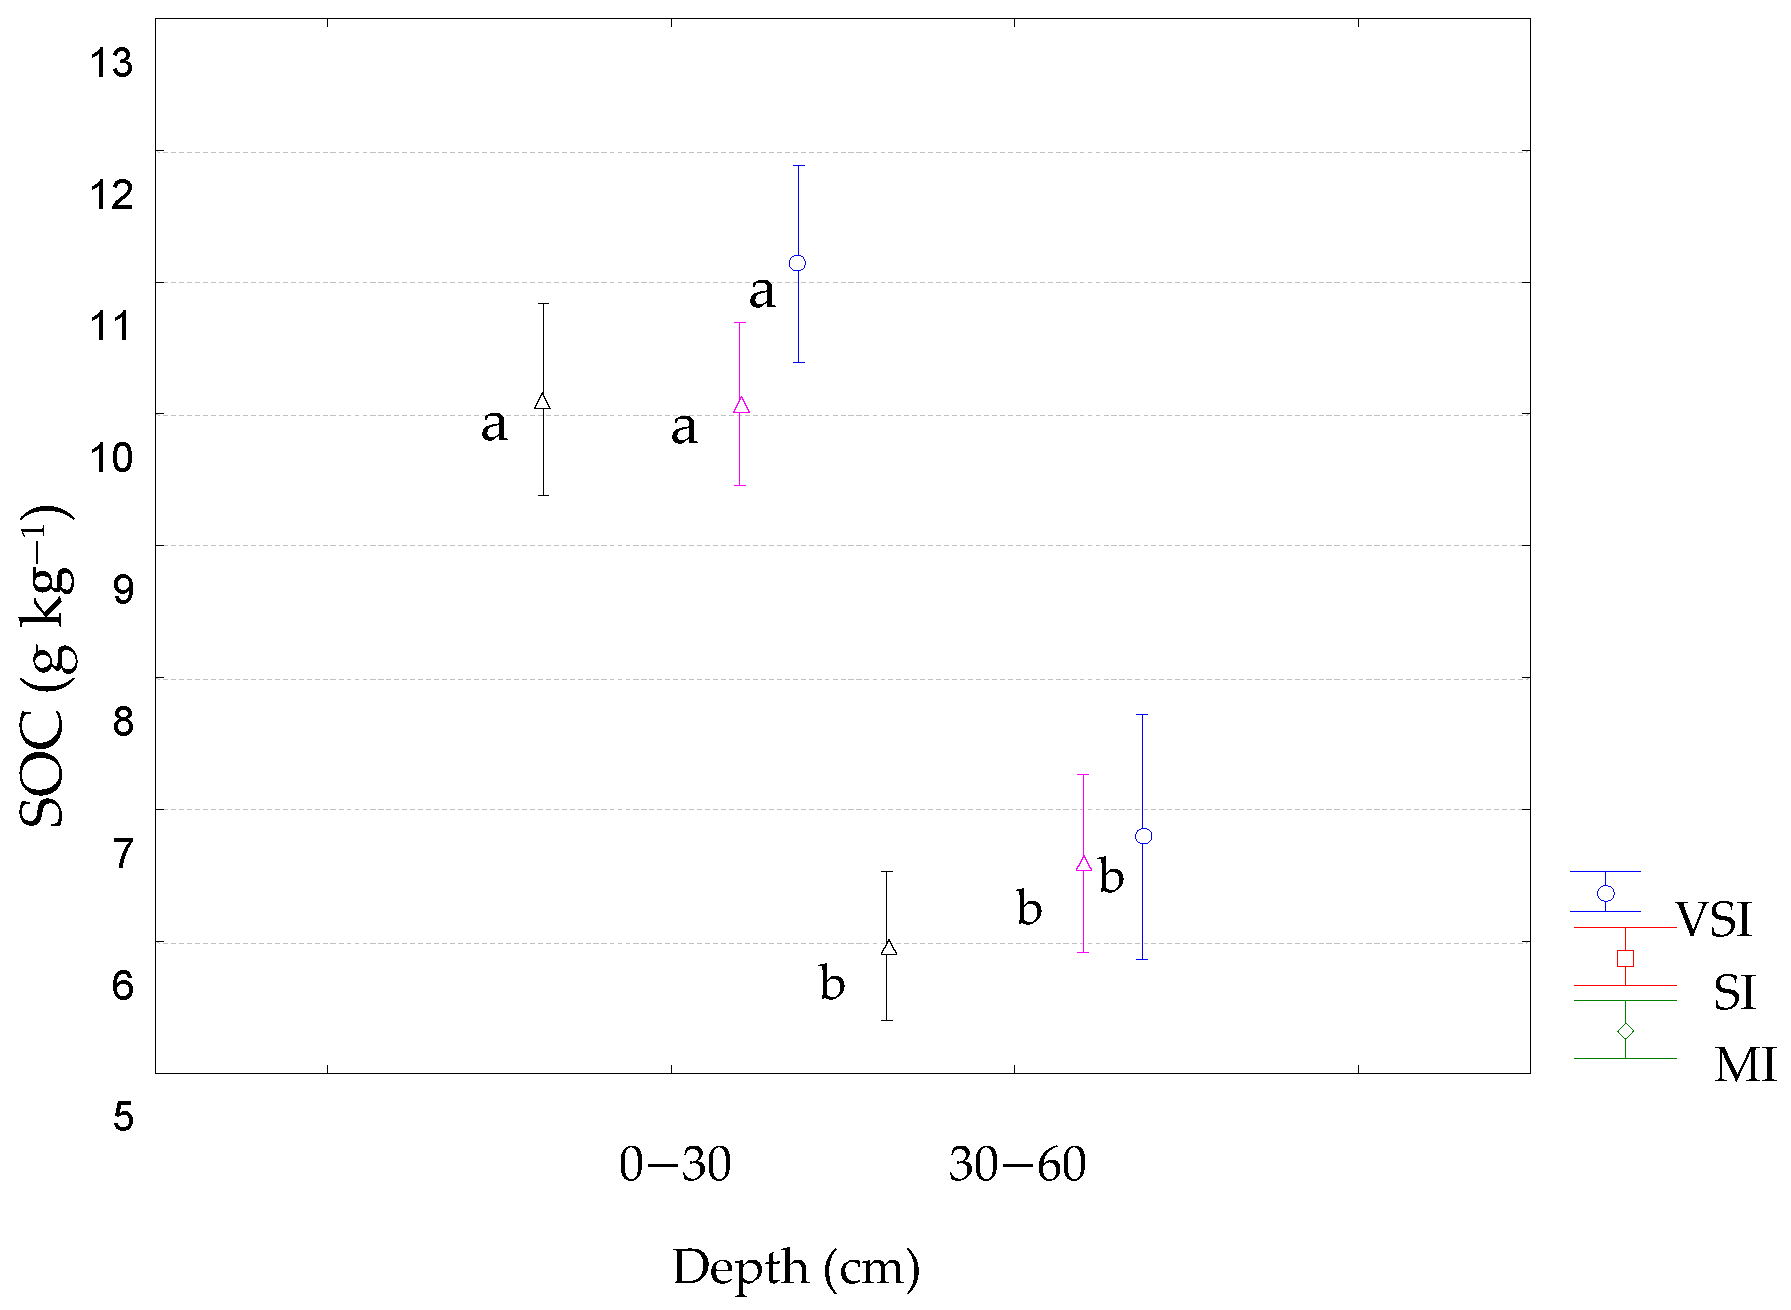
3.3. Effect of Slope Gradient on SOC Content

Soil organic carbon content for different slope gradients and land use/cover classes is shown in Table 3. The results of the study showed that SOC in VSI ranged from 3.80 g kg−1 to 15.00 g kg−1, with mean value 8.96 g kg−1. In SI class, the highest SOC content was 14.11 g kg−1 and the lowest was 2.60 g kg−1, while the mean value was 8.51 g kg−1. In MI class, SOC ranged from 2.55 g kg−1 to 15.49 g kg−1, with mean value 8.24 g kg−1.
The average SOC content in forest land decreased with increasing slope, but the difference showed no statistical significance (Figure 10). The highest SOC was in VSI (10.71 g kg−1) and the lowest was in MI (8.22 g kg−1). In vineyards and UL, the SOC content demonstrated an irregularity in its spatial distribution. In vineyards, the highest SOC value was in SI class (8.73 g kg−1) and the lowest in VSI (8.00 g kg−1). In UL, the highest content of organic carbon was determined in VSI (9.62 g kg−1) and the lowest in SI (6.53 g kg−1). The results showed no statistical significance.
A statistically significant difference between topsoil and subsoil SOC was observed in all slope classes (Figure 11). The average SOC content in topsoil was 10.35 g kg−1, and in subsoil 6.41 g kg−1. In the topsoil of the VSI, the SOC content (11.14 g kg−1) was significantly higher than the value for subsoil (6.79 g kg−1). Additionally, in the SI class, the SOC content in topsoil (10.07 g kg−1) was higher compared with the values for subsoil (6.60 g kg−1), as well as in MI, where mean SOC content in topsoil was 10.11 g kg−1, and in subsoil 5.97 g kg−1.
Numerous studies have confirmed carbon leaching through erosion related to topography [39,40,41,42]. With increasing slope, infiltration decreases because increasing slope area and the velocity of water flow lead to increasing runoff. In the region of Niš, part of the examined area is endangered by erosion processes, but a high threat of erosion is present in only 2.73% of the territory, and severe threat in only 0.73% [17]. The mean intensity of erosion in the region of Niš is 5.42 t ha−1 y−1, which classifies this area, according to the OECD classification, in the group of tolerable soil loss [17]. It can be concluded that erosion did not significantly contribute to leaching of organic carbon in the observed slope range (1–10°).
Based on the results of the study, it could not be concluded that the SOC content is predominantly determined by the slope gradient, but that its values are significantly influenced by other factors such as land use/cover, slope aspect, management practices, soil type, depth, elevation, etc. Similar results were obtained by Dortzbach et al. [43]. Their study investigated SOC content in vineyard and forest areas of wine producing regions in the state of Santa Catarina, Brazil. The results of the study indicated that irregular spatial distribution of SOC in the vineyard soils, in addition to altitude and climatic factors, was significantly influenced by management practices and soil disturbance. Zhu et al. [31] obtained similar results. Their study found the relative size of the slope gradient influence was trivial in comparison with the aspect within each of the three observed zones.
Since this study covers classes of slopes from very slightly to medium inclined, it would be useful for future investigations to include steeper terrains.

3.4. Correlation between Selected Soil Properties

The dependence of SOC content on slope gradient and other physicochemical properties of soil was analyzed by correlation analysis and is shown in Table 4.
As one of the most important physicochemical properties of soil, soil pH directly affects plant growth and microbial activities; most plants are suitable for growth in an environment where pH is neutral [44]. Although an increase in the calcium carbonate concentration and soil pH affects soil microbial activity and reduces SOC concentration by the enhancement of the rate of mineralization, in our study, soil pH was not significantly correlated with SOC. This result is different from the significant negative correlation reported by some authors [15,45,46], but is consistent with other studies [44]. Qin et al. [32] obtained results similar to ours, r = −0.17. In the study of Hossain [47], the correlation coefficient between OM content and pH in forest soil was also nonsignificant and ranged from −0.013 to 0.215. The disturbance of pH (CaCO3)/SOC relation in our study may be a partial consequence of recent calcification in one part of the area. The correlation of slope gradient with soil pH and carbonate content was nonsignificant. In the study of Qin et al. [32], correlation coefficients between soil pH and slope were −0.19 and −0.10.
The TN was significantly positively correlated with SOC because most soil N is part of the soil organic matter [48]. The correlation of slope gradient with TN was nonsignificant.
Significant correlation of SOC with silt content was found. The fine fraction of soil positively affects SOC storage [49]. Smaller particle size has better fertilizer retention capacity and higher nutrient content [41]. The strong correlation between silt content and soil organic C reflects the greater water holding capacity and plant available water of silt-dominated soils, which, in turn, affect plant productivity and influence C sequestration in soil [50]. In similar climatic conditions, the SOM content in fine-textured soils is two to four times higher than in coarse-textured (sandy) soils [51]. On the other hand, SOC values were significantly positively correlated with clay content only in vineyards, although numerous studies showed otherwise [52,53,54]. However, some researchers have reported that silt plus clay has a better relationship with SOC [55,56,57]. In the study of Augustin and Cihacek, [50], silt was found to have the best correlation with SOC (r = 0.624), similar to our results. Coarse sand content was negatively correlated with SOC, but the difference was significant only in vineyards. This agrees with the results of Li et al. [58] and Jakšić et al. [15]. They concluded that increasing desertification would reduce the accumulation of SOC. Sandy soils usually contain less SOM than soils with a finer texture, such as loam or clay. Lower moisture content and higher aeration in sandy soils results in faster SOM oxidation compared with heavier soils.
Available phosphorus and potassium were significantly positively correlated with SOC. The SOC affects plant nutrient availability. In the study of Hossain [47], the correlation coefficient between OM content and available phosphorus in forest soil ranged from −0.753 to 0.212. The correlation coefficient for organic OM and K ranged from 0.071 to 0.558. Tamene et al. [34] found significant positive correlation between SOC and available phosphorus (r = 0.58) and positive, but nonsignificant, correlation between SOC and available potassium (r = 0.22). Available potassium and phosphorus were significantly negatively correlated with slope gradient. The high concentration of these nutrients in the gentler slopes is related to its removal from steeper slopes and deposition in gentler slope gradients [45]. In the study of Wubie and Assen [59], the available phosphorous content was higher (4.98 mg kg−1) in gentler slopes and lower (3.76 mg kg−1) in steeper slope gradients.

4. Conclusions

Slope aspect proved to be an important factor influencing the spatial distribution of SOC in the forest land and vineyard soils, where N- and NW-facing soils had the highest levels of OC in topsoil. There was no similar pattern in uncultivated soils, most likely due to anthropogenic influences. No significant differences were found in the subsoil. Higher OC content was found in the topsoil, regardless of the slope of the terrain. The average SOC content in forest land decreased with increasing slope, but the difference showed no statistical significance. In vineyards and uncultivated land the SOC content showed an irregular spatial distribution in relation to slope gradient. No significant variations across slope gradient were found for all observed soil properties, except for AP and AK. A significant positive correlation was observed between SOC and TN, CL, ST, AP, and AK, while a negative correlation was observed with CS.
Since this study covered slope classes from very slightly to medium inclined, it would be useful for future investigations to include steeper terrains.
Our results demonstrated that slope aspect in relation to different land use/cover classes could provide an important reference for land management strategies in light of sustainable development.

Author Contributions

Conceptualization, S.J. and J.N.; methodology, S.J., J.N. and D.J.; formal analysis, S.J., M.Ž. and S.M.; investigation, S.J., J.N., D.J., M.Ž., S.M., V.K. and J.V.; data curation, S.J., M.Ž., J.V., V.K., D.J. and S.M.; writing—original draft preparation S.J.; review and editing, J.N.; writing—review and editing S.J. All authors have read and agreed to the published version of the manuscript.

Funding

This research is part of the project “Soil fertility control and content of hazardous and harmful substances in the soil under the vineyards of the Niš region”, funded by the Ministry of Agriculture and Environmental Protection, Directorate for Agricultural Land. Part of this research was supported by the Ministry of Education, Science and Technological Development of the Republic of Serbia, grant number: 451-03-68/2021-14/200032.

Institutional Review Board Statement

Not applicable.

Informed Consent Statement

Not applicable.

Data Availability Statement

Not applicable.

Conflicts of Interest

The authors declare no conflict of interest. The funders had no role in the design of the study; in the collection, analyses, or interpretation of data; in the writing of the manuscript, or in the decision to publish the results.

References

  1. Bauer, A.; Black, A.L. Quantification of the Effect of Soil Organic Matter Content on Soil Productivity. Soil Sci. Soc. Am. J. 1994, 58, 185–193. [Google Scholar] [CrossRef]
  2. Loveland, P. Is There a Critical Level of Organic Matter in the Agricultural Soils of Temperate Regions: A Review. Soil Tillage Res. 2003, 70, 1–18. [Google Scholar] [CrossRef]
  3. Wang, D.; Liu, Y.; Wu, G.L.; Ding, L.M.; Yang, Z.; Hao, H.M. Effect of rest-grazing management on soil water and carbon storage in an arid grass-land. J. Hydrol. 2015, 527, 754–760. [Google Scholar]
  4. Griffiths, R.P.; Madritch, M.D.; Swanson, A.K. The effects of topography on forest soil characteristics in the Oregon Cascade Mountains (USA): Implications for the effects of climate change on soil properties. For. Ecol. Manag. 2009, 257, 1–7. [Google Scholar] [CrossRef]
  5. Jobbágy, E.G.; Jackson, R.B. The vertical distribution of soil organic carbon and its relation to climate and vegetation. Ecol. Appl. 2000, 10, 423–436. [Google Scholar] [CrossRef]
  6. Zhang, J.; Wang, X.; Wang, J. Impact of land use change on profile distributions of soil organic carbon fractions in the Yanqi Basin. Catena 2014, 115, 79–84. [Google Scholar] [CrossRef]
  7. Zheng, X.Y.; Liu, M.Z.; Zhao, X.; Li, A.; Chen, S.; Chen, S.; Han, X.; Huang, J. Topography and grazing effects on storage of soil organic carbon and nitrogen in the northern China grasslands. Ecol. Indic. 2018, 93, 45–53. [Google Scholar] [CrossRef]
  8. Ping, C.L.; Jastrow, J.D.; Jorgenson, M.T.; Michaelson, G.J.; Shur, Y.L. Permafrost soils and carbon cycling. Soil 2015, 1, 147–171. [Google Scholar] [CrossRef] [Green Version]
  9. Meier, I.C.; Leuschner, C. Variation of soil and biomass carbon pools in beech forests across a precipitation gradient. Glob. Change Biol. 2010, 16, 1035–1045. [Google Scholar] [CrossRef]
  10. Scowcroft, P.G.; Douglas, R.; Turner, P.; Vitousek, M. Decomposition of Metrosideros polymorpha leaf litter along elevational gradients in Hawaii. Glob. Change Biol. 2000, 6, 73–85. [Google Scholar] [CrossRef]
  11. Lozano-García, B.; Parras-Alcántara, L.; Brevik, E.C. Impact of topographic aspect and vegetation (native and reforested areas) on soil organic carbon and nitrogen budgets in Mediterranean natural areas. Sci. Tot. Environ. 2016, 544, 963–970. [Google Scholar] [CrossRef]
  12. Ajami, M.; Heidari, A.; Khormali, F. Environmental factors controlling soil organic carbon storage in loess soils of a subhumid region, northern Iran. Geoderma 2016, 281, 1–10. [Google Scholar] [CrossRef]
  13. Jia, S.; Li, F.; Su, J. Influence of terrain factors on soil organic carbon stock in Pinus kesiya var. langbianensis plantation. For. Res. 2016, 29, 424–429. [Google Scholar]
  14. Fan, Y.Q. An Analysis on the Differences of Carbon Storage of Phyllostachys Edulis Ecosystem under the Terrain Conditions and Management Intensity (in Chinese). In The Effect of Terrain Conditions on Carbon Storage of Phyllostachys Edulis; Zhejiang A&F University: Zhejiang, China, 2012; pp. 28–34. [Google Scholar]
  15. Jakšić, S.; Ninkov, J.; Milić, S.; Vasin, J.; Banjac, D.; Jakšić, D.; Živanov, M. The State of Soil Organic Carbon in Vineyards as Affected by Soil Types and Fertilization Strategies (Tri Morave Region, Serbia). Agronomy 2021, 11, 9. [Google Scholar] [CrossRef]
  16. Ivanišević, D.; Jakšić, D.; Korać, N. Vineyard Atlas; Republican Bureau of Statistics: Belgrade, Serbia, 2015.
  17. Jakšić, D.; Petrović, V. Some Important Properties of the Terroir of the Vineyard Region of Niš. In Soil Properties of the Vineyard Region of Niš; Ninkov, J., Ed.; Institute of Field and Vegetable Crops: Novi Sad, Serbia, 2017; pp. 43–92. [Google Scholar]
  18. Nakalamić, A.; Marković, N. Opšte Vinogradarstvo; Poljoprivredni Fakultet Beograd; Zadužbina Svetog Manastira Hilandara: Belgrade, Serbia, 1993. [Google Scholar]
  19. Tonietto, J.; Carbonneau, A. A multicriteria climatic classification system for grape-growing regions worldwide. Agric. For. Meteorol. 2004, 124, 81–97. [Google Scholar] [CrossRef] [Green Version]
  20. Food and Agriculture Organization. Forest Survey Manual (Forstliche Standortsaufnahme), 7th ed.; FAO: Rome, Italy, 2016. [Google Scholar]
  21. ISO/IEC 17025:2017. General Requirements for the Competence of Testing and Calibration Laboratories; Institute for Standardization of Serbia: Belgrade, Serbia, 2017. [Google Scholar]
  22. ISO 11464:2006. Soil Quality—Pretreatment of Samples for Physico-Chemical Analysis; Institute for Standardization of Serbia: Belgrade, Serbia, 2006. [Google Scholar]
  23. ISO 10390:2005. Soil Quality—Determination of pH; Institute for Standardization of Serbia: Belgrade, Serbia, 2005. [Google Scholar]
  24. ISO 10693:1995. Soil Quality—Determination of Carbonate Content—Volumetric Method; Institute for Standardization of Serbia: Belgrade, Serbia, 1995. [Google Scholar]
  25. ISO 10694:1995. Soil Quality—Determination of Organic and Total Carbon After Dry Combustion (Elementary Analysis); Institute for Standardization of Serbia: Belgrade, Serbia, 1995. [Google Scholar]
  26. Egner, H.; Riehm, H. Die Untersuchung von Böden; Thun, R., Herrmann, R., Knickmann, E., Eds.; Neumann Verlag: Radebeul-Berlin, Germany, 1995; pp. 110–125. [Google Scholar]
  27. Van Reeuwijk, L.P. Procedures for Soil Analysis, 6th ed.; ISRIC FAO Technical Paper Volume 9; International Soil Reference and Information Centre Wageningen: Wageningen, The Netherlands, 2002. [Google Scholar]
  28. Belić, M.; Nešić, L.J.; Ćirić, V. Practicum in Pedology; Faculty of Agriculture: Novi Sad, Serbia, 2014; p. 90. [Google Scholar]
  29. Gücüyen, A. Manisa ili ve Çevresinde Bağcılıkta Mekanizasyon Durumu, Sorunları ve iyi Tarım Uygulamalarına Yönelik Çözüm Önerileri; Ege Üniversitesi Fen Bilimleri Enstitüsü: Bornova, Turkey, 2007; p. 146. (In Turkish) [Google Scholar]
  30. Antonović, M.; Mrvić, V. Zemljišta sliva Nišave; Institute of Soil Science: Belgrade, Serbia, 2008; p. 214. [Google Scholar]
  31. Zhu, M.; Feng, Q.; Qin, Y.; Mengxu, C.; Cao, J.; Zhang, M.; Liu, W. The role of topography in shaping the spatial patterns of soil organic carbon. Catena 2019, 176, 296–305. [Google Scholar] [CrossRef]
  32. Qin, Y.; Feng, Q.; Holden, N.M.; Cao, J.J. Variation in soil organic carbon by slope aspect in the middle of the Qilian mountains in the upper Heihe river basin, China. Catena 2016, 147, 308–314. [Google Scholar] [CrossRef]
  33. Lenka, S.; Patnaik, U.S. Soil carbon sequestration as affected by slope aspect under restoration treatments of a degraded alfisol in the Indian sub-tropics. Geoderma 2013, 204–205, 102–110. [Google Scholar] [CrossRef]
  34. Tamene, G.M.; Adiss, H.K.; Alemu, M.Y. Effect of Slope Aspect and Land Use Types on Selected Soil Physicochemical Properties in North Western Ethiopian Highlands. Appl. Environ. Soil Sci. 2020, 2020, 8463259. [Google Scholar] [CrossRef]
  35. Sharma, C.M.; Gairola, S.; Baduni, N.P.; Ghildiyal, S.K.; Suyal, S. Variation in carbon stocks in different slope aspects in seven forest types of temperate region of Garhwal Himalaya, India. J. Biol. Sci. 2011, 36, 701–708. [Google Scholar] [CrossRef] [PubMed]
  36. Sigua, G.C.; Coleman, S.W. Spatial distribution of soil organic carbon in pastures with cow-calf operations: Effect of slope aspect and slope position. J. Soils Sediments 2010, 10, 240–247. [Google Scholar] [CrossRef]
  37. Yohannes, H.; Soromessa, T.; Argaw, M. Carbon Stock Analysis along Slope and Slope Aspect Gradient in Gedo Forest: Implications for Climate Change Mitigation. J. Earth Sci. Clim. Chang. 2015, 6, 305. [Google Scholar] [CrossRef] [Green Version]
  38. Holland, P.G.; Steyn, D.G. Vegetational responses to latitudinal variations in slope angle and aspect. J. Biogeogr. 1975, 2, 179–183. [Google Scholar] [CrossRef]
  39. Begum, F.; Bajracharya, R.M.; Sharma, S.; Sitaula, B.K. Influence of slope aspect on soil physico-chemical and biological Properties in the mid hills of central Nepal. Int. J. Sustain. Dev. World Ecol. 2010, 17, 438–443. [Google Scholar] [CrossRef]
  40. Abebe, G.; Tsunekawa, A.; Haregeweyn, N.; Takeshi, T.; Wondie, M.; Adgo, E.; Masunaga, T.; Tsubo, M.; Ebabu, K.; Berihun, M.L.; et al. Effects of Land Use and Topographic Position on Soil Organic Carbon and Total Nitrogen Stocks in Different Agro-Ecosystems of the Upper Blue Nile Basin. Sustainability 2020, 12, 2425. [Google Scholar] [CrossRef] [Green Version]
  41. Schöning, I.; Totsche, K.U.; Kögel-Knabner, I. Small Scale Spatial Variability of Organic Carbon Stocks in Litter and Solum of a Forested Luvisol. Geoderma 2006, 136, 631–642. [Google Scholar] [CrossRef]
  42. Rhanor, T. Topographic Position and Land Cover Effects on Soil Organic Carbon Distribution of Loess-Veneered Hillslopes in the Central United States; Southern Illinois University Carbondale: Carbondale, IL, USA, 2013. [Google Scholar]
  43. Dortzbach, D.; Assunção, S.A.; Pereira, M.G.; Carvalho da Silva, E. Fractions of soil organic matter in the vineyards of altitude regions in Santa Catarina. Ciênc. Agrár. Londrina 2017, 38, 1799–1812. [Google Scholar] [CrossRef] [Green Version]
  44. Liu, T.; Yang, L.; Hu, Z.; Xue, J.; Lu, Y.; Chen, X.; Liu, M.; Griffiths, B.S.; Whalen, J.K. Biochar exerts negative effects on soil fauna across multiple trophic levels in a cultivated acidic soil. Biol. Fertil. Soils 2020, 56, 597–606. [Google Scholar] [CrossRef]
  45. Islam, K.K.; Anusontpornperm, S.; Kheoruenromne, I.; Thanachit, S. Relationship between Carbon Sequestration and Physico-Chemical Properties of Soils in Salt-Affected Areas, Northeast Thailand. Kasetsart J. Nat. Sci. 2014, 48, 560–576. [Google Scholar]
  46. Ayaz, M.; Akhtar, M.; Rukh, S.; Imran, M.; Hassan, A.; Abbasi, K.; Qayyum, A. Soil Organic Carbon Stock Variation with Climate and Land Use in Shale Derived Soils. J. Serbian Chem. Soc. 2018, 83, 785–793. [Google Scholar]
  47. Abidela Hussein, M.; Muche, H.; Schmitter, P.; Nakawuka, P.; Tilahun, S.A.; Langan, S.; Barron, J.; Steenhuis, T.S. Deep Tillage Improves Degraded Soils in the (Sub) Humid Ethiopian Highlands. Land 2019, 8, 159. [Google Scholar] [CrossRef] [Green Version]
  48. Yimer, F.; Ledin, S.; Abdelkadir, A. Soil organic carbon and total nitrogen stocks as affected by topographic aspect and vegetation in the Bale Mountains, Ethiopia. Geoderma 2006, 135, 335–344. [Google Scholar] [CrossRef]
  49. Wiesmeier, M.; Urbanski, L.; Hobley, E.; Lang, B.; von Lützow, M.; Marin-Spiotta, E.; van Wesemael, B. Soil Organic Carbon Storage as a Key Function of Soils—A Review of Drivers and Indicators at Various Scales. Geoderma 2019, 333, 149–162. [Google Scholar] [CrossRef]
  50. Augustin, C.; Cihacek, L. Relationships Between Soil Carbon and Soil Texture in the Northern Great Plains. Soil Sci. 2016, 181, 1. [Google Scholar] [CrossRef]
  51. Prasad, R.; Power, J.F. Soil Fertility Management for Sustainable Agriculture; CRC Press: Boca Raton, FL, USA, 1997; p. 243. [Google Scholar]
  52. Vos, C.; Don, A.; Hobley, E.U.; Prietz, R.; Heidkamp, A.; Freibauer, A. Factors Controlling the Variation in Organic Carbon Stocks in Agricultural Soils of Germany. Eur. J. Soil Sci. 2019, 70, 550–564. [Google Scholar] [CrossRef]
  53. Meersmans, J.; De Ridder, F.; Canters, F.; De Baets, S.; Van Molle, M. A Multiple Regression Approach to Assess the Spatial Distribution of Soil Organic Carbon (SOC) at the Regional Scale (Flanders, Belgium). Geoderma 2008, 143, 1–13. [Google Scholar] [CrossRef]
  54. Meersmans, J.; Martin, M.P.; Lacarce, E.; De Baets, S.; Jolivet, C.; Boulonne, L.; Lehmann, S.; Philippe, N.; Saby, A.; Bispo, A.; et al. A High Resolution Map of French Soil Organic Carbon. Agron. Sustain. Dev. 2012, 32, 841–851. [Google Scholar] [CrossRef]
  55. Hassink, J.; Whitmore, A.P. A Model of the Physical Protection of Organic Matter in Soils. Soil Sci. Soc. Am. J. 1997, 61, 131–139. [Google Scholar] [CrossRef]
  56. Plante, A.F.; Conant, R.T.; Stewart, C. Impact of Soil Texture on the Distribution of Soil Organic Matter in Physical and Chemical Fractions. Soil Sci. Soc. Am. J. 2006, 70, 287–296. [Google Scholar] [CrossRef]
  57. Gulde, S.C.; Chung, H.; Amelung, W.; Chan, C.U. Soil Carbon Saturation Controls Labile and Stable Carbon Pool Dynamics. Soil Sci. Soc. Am. J. 2008, 72, 605–612. [Google Scholar] [CrossRef]
  58. Li, Y.; Wang, X.; Niu, Y.; Lian, J.; Luo, Y.; Chen, Y.; Gong, X.; Yang, H.; Yu, P. Spatial Distribution of Soil Organic Carbon in the Ecologically Fragile Horqin Grassland of Northeastern China. Geoderma 2018, 325, 102–109. [Google Scholar] [CrossRef]
  59. Wubie, M.A.; Assen, M. Effects of land cover changes and slope gradient on soil quality in the Gumara watershed, Lake Tana basin of North–West Ethiopia. Model. Earth Syst. Environ. 2020, 6, 85–97. [Google Scholar] [CrossRef] [Green Version]
Figure 1. The Rregion of Niš, Serbia: (a) vine-growing districts; (b) slope gradient (°); (c) aspect ([16], modified by the authors).
Sustainability 13 08332 g001
Figure 2. A pedological map of the region of Niš and borders of vine-growing districts, according to the World Reference Base (WRB) soil classification, based on a digitalized primary pedological map of the Republic of Serbia, 1:50,000.
Sustainability 13 08332 g002
Figure 3. Air temperature characteristics of the region of Niš: (a) mean annual temperature for the period 1961–2010; (b) Winkler index of the region of Niš ([17], modified by the authors).
Sustainability 13 08332 g003
Figure 4. Distribution of air temperature in the region of Niš for the period 1961–2010: (a) distribution in moderate-warm (HI+1) and moderate (HI−1) climate classes of the Heliothermic index; (b) distribution in the cold night climate class (CI+2) of the night freshness index (CI) ([17], modified by authors).
Sustainability 13 08332 g004
Figure 5. Mean annual precipitation (mm) in the Niš region for the period of 1961–2010 ([17], modified by the authors).
Sustainability 13 08332 g005
Figure 6. Observed localities in the region of Niš.
Sustainability 13 08332 g006
Figure 7. Sampling location Svrljig- Abruptic Luvisol (Clayic), LV-ap-ce: (a) forest land; (b) uncultivated land; (c) vineyard; (d) disturbed state of samples from soil profile.
Sustainability 13 08332 g007
Figure 8. Soil organic carbon content (g kg1) for different slope aspects and land use/cover (N = 80). Significant differences among soil groups are labeled with different letters (Duncan’s range test, p < 0.05).
Sustainability 13 08332 g008
Figure 9. Soil organic carbon content (g kg1) for different slope aspects across soil depths. Different lowercase letters indicate significant differences in SOC among slope aspects in topsoil; different capital letters indicate significant differences in SOC among slope aspects in subsoil (Duncan’s range test, p < 0.05).
Sustainability 13 08332 g009
Figure 10. Soil organic carbon content (g kg1) for different slope gradients and land use/cover classes (N = 80); F, forest land, V, vineyards, UL, uncultivated land; TA, total area. Different lowercase letters indicate significant differences in SOC among slope gradients within the different land use/cover classes; different capital letters indicate significant differences in SOC among slope aspects in the total area (Duncan’s range test, p < 0.05).
Sustainability 13 08332 g010
Figure 11. Soil organic carbon content (g kg1) for different slope gradients across soil depths. Significant differences among soil groups are labeled with different letters (Duncan’s range test, p < 0.05).
Sustainability 13 08332 g011
Table 1. Localities, GPS coordinates, and soil types of the investigated areas in the region of Niš.
LocalityGPS (E)GPS (N)Soil Type (FAO–WRB)
Jasenje21.57595143.629562Haplic Vertisol (Ochric), VR-ha-oh
Šurić21.64482243.453924Haplic Vertisol (Ochric), VR-ha-oh
Beli Breg21.81491543.478903Haplic Vertisol (Ochric), VR-ha-oh
Beli Potok21.85913543.674641Haplic Vertisol (Ochric), VR-ha-oh
Vele Polje21.82774343.450464Haplic Vertisol (Ochric), VR-ha-oh
Svrljig22.06971543.414675Abruptic Luvisol (Clayic), LV-ap-ce
Jasenovik22.03086243.355521Haplic Vertisol (Ochric), VR-ha-oh
Malča22.01056843.316971Haplic Vertisol, VR-ha-oh
Sićevo22.08198743.346480Skeletic, Dolomitic, Eutric Leptosol
(Clayic, Ochric), LP-sk.do.eu-ce.oh
Gornji Barbeš21.95072343188976Vertic, Eutric Cambisol (Ochric),
CM-vr.eu-oh
Table 2. Analyzed soil properties in 0–30 cm and 30–60 cm layers for different land uses/cover classes.
Soil PropertiesVineyardForestUncultivated Land
0–30 cm
pH (in H2O)6.64 ± 0.96; (4.99–8.23) 16.76 ± 1.16; (4.31–8.29)6.39 ± 0.95; (5.19–7.96)
CaCO3 (%)2.73 ± 6.42; (0.00–23.06)2.48 ± 10.48; (0.00–11.32)1.92 ±5.98; (0.00–18.87)
N (%)0.12 ± 0.02; (0.09–0.17)0.15 ± 0.06; (0.08–0.30)0.14 ±0.07; (0.08–0.30)
Clay (%)37.94 ± 9.12; (21.44–61.88)34.12 ± 9.92; (23.80–56.32)33.16 ± 11.43; (25.64–44.84)
Silt (%)22.07 ± 4.40; (15.36–31.08)22.82 ± 4.93; (18.40–32.72)22.24 ± 7.26; (17.76–32.36)
Fine sand (%)27.67 ± 5.58; (11.04–37.09)30.45 ± 7.35; (17.27–38.87)32.03 ± 10.11; (26.00–43.00)
Coarse sand (%)12.37 ± 9.89; (2.34–38.88)12.60 ± 8.32; (4.57–20.21)12.58 ± 5.05; (5.32–19.37)
AP (P2O5) (ppm)47.00 ± 3.63; (12.00–130.00)55.00 ± 4.15; (11.00–229.00)53.80 ± 7.90; (5.00–232.00)
AK (K2O) (ppm)300 ± 10.67; (209.00–635.00)290.00 ± 10.40; (136.00–545.00)313.50 ± 2.54; (205.00–570.00)
30–60 cm
pH (in H2O)6.47 ± 0.99;(5.42–8.34)7.07 ± 1.36; (5.11–8.43)6.96 ± 1.17; (5.55–8.49)
CaCO3 (%)4.30 ± 9.83; (0.00–36.60)6.43 ± 10.92; (0.00–41.09)3.45 ± 16.89; (0.00–46.96)
N (%)0.10 ± 0.02; (0.04–0.15)0.11 ± 0.08; (0.04–0.32)0.07 ± 0.04; (0.05–0.14)
Clay (%)40.34 ± 7.79; (21.56–51.82)39.09 ± 6.32; (28.80–46.84)37.92 ± 9.93; (21.76–55.88)
Silt (%)20.84 ± 4.80; (14.24–30.48)22.36 ± 5.80; (15.80–33.84)18.41 ± 6.15; (13.76–34.96)
Fine sand (%)26.54 ± 5.26; (14.66–37.78)27.05 ± 5.31; (16.44–33.89)29.69 ± 9.24; (18.15–40.71)
Coarse sand (%)12.28 ± 9.80; (3.36–33.11)11.50 ± 4.70; (4.99–17.71)13.98 ± 4.09; (5.08–17.92)
AP (P2O5) (ppm)27.00 ± 2.34; (0.50–90.00)20.00 ± 4.15; (6.00–69.00)28.70 ± 3.59; (60.00–119.00)
AK (K2O) (ppm)243.00 ± 6.97; (145.00–460.00)214.00 ± 10.13; (141.00–291.00)211.50 ± 6.81; (86.00–345.00)
1 Mean value ± standard deviation; minimum and maximum value in brackets; AP, available phosphorus; AK, available potassium.
Table 3. Soil organic carbon content (g kg1) in observed soil types for different slope gradients and land use/cover classes in 0–30 cm and 30–60 cm soil layers (N = 60).
Slope Gradient (°)Soil Depth (cm)VineyardForestUncultivated Land
1–20–308.29–12.47 112.41–13.479.30–15.00
10.02 ± 2.22 212.94 ± 2.7012.15 ± 3.70
30–603.89–9.166.36–10.613.80–10.40
5.99 ± 2.328.49 ± 2.177.10 ± 3.80
2–50–308.12–12.247.66–14.116.30–10.40
9.55 ± 2.4411.55 ± 2.348.67 ± 3.60
30–605.34–11.663.48–9.632.60–6.70
7.91 ± 2.276.32 ± 2.334.40 ± 2.60
5–100–306.49–14.077.55–15.4910.40–10.70
9.70 ± 2.5211.52 ± 2–9010.50 ± 3.40
30–603.74–8.992.55–7.313.80–4.70
6.58 ± 2.424.93 ± 1.704.25 ± 2.00
1 Minimum and maximum value; 2 Mean value ± standard deviation.
Table 4. Matrix of Pearson’s correlation coefficients (r) among selected soil properties.
SOCpHCCTNCLSTFSCSAPAK
Vineyards
SOC0.120.190.89 *0.33 *0.38 *−0.13−0.39 *0.45 *0.70 *
SL0.030.160.390.11−0.210.18−0.060.160.43 *−0.05
Forest land
SOC0.120.340.95 *−0.050.74 *0.10−0.240.42 *0.19
SL0.35−0.170.200.28−0.310.600.060.03−0.69 *−0.72 *
Uncultivated land
SOC0.140.110.97 *0.160.39 *−0.28−0.170.48 *0.68 *
SL0.410.150.350.30−0.280.43−0.070.26−0.54 *−0.59 *
SL—slope gradient (°), pH—pH in H₂O, CC—calcium carbonate (CaCO3), TN—total nitrogen, CL—clay, ST—silt, FS—fine sand, CS—coarse sand, AP—avalilable phosphorus (P2O5), AK—avalilable potassium (K2O); * p < 0.05.
Publisher’s Note: MDPI stays neutral with regard to jurisdictional claims in published maps and institutional affiliations.

