Article

Facilitating Multifunctional Green Infrastructure Planning in Washington, DC through a Tableau Interface

1
Department of Plant Sciences and Entomology, University of Rhode Island, Kingston, RI 02881, USA
2
College of Agriculture, Urban Sustainability and Environmental Sciences, University of the District of Columbia, Washington, DC 20008, USA
3
The Trust for Public Land, Washington, DC 20003, USA
*
Author to whom correspondence should be addressed.
Sustainability 2021, 13(15), 8390; https://0-doi-org.brum.beds.ac.uk/10.3390/su13158390
Submission received: 7 May 2021 / Revised: 5 June 2021 / Accepted: 10 June 2021 / Published: 27 July 2021

Abstract

:
Multifunctional urban green infrastructure (UGI) can regulate stormwater, mitigate heat islands, conserve biodiversity and biocultural diversity, and produce food, among other functions. Equitable governance of UGI requires new tools for sharing pertinent information. Our goal was to develop a public-access geographic information system (GIS) that can be used for comprehensive UGI planning in Washington, DC (the District) and to create an e-tool for UGI in the form of Tableau dashboards. The dashboards allow stakeholders to identify (1) existing UGI and (2) potential areas for new UGI including urban agriculture (UA). They also allow users to manipulate the data and identify priority locations for equitable UGI development by applying population vulnerability indices and other filters. We demonstrate use of the dashboards through scenarios focusing on UA in the District, which currently has 150 ha of existing UGI in the form of documented projects and an additional 2734 ha potentially suitable for UGI development. A total of 2575 ha is potentially suitable for UA, with 56% of that area in Wards 5, 7, and 8, which are largely food deserts and whose residents are primarily Black and experience the greatest inequities. Our work can serve as a model for similar digital tools in other locales using Tableau and other platforms.

1. Introduction

Green infrastructure (GI) offers the opportunity for cities to reduce their ecological footprint through self-provisioning of ecosystem services traditionally provided by rural and peri-urban landscapes. A boundary object operating across diverse disciplines [1], GI does not have a single definition either conceptually or in practice. The United States Environmental Protection Agency (US EPA), for example, defines GI as “a cost-effective, resilient approach to managing wet weather impacts that provides many community benefits” [2], while the American Society of Landscape Architects (ASLA) considers green infrastructure “a conceptual framework for understanding the valuable services nature provides the human environment” [3]. From a systems perspective, GI has also been narrowly defined as “a network of green spaces planned and managed as an integrated system to provide synergistic benefits through multifunctionality” (Landscape Institute, 2009 in Lovell and Taylor [4] (p. 1452)). Similarly, the European Union defines green infrastructure as “a strategically planned network of natural and semi-natural areas with other environmental features designed and managed to deliver a wide range of ecosystem services” [5] (p. 3). Lovell and Taylor’s [4] definition, which we adopt here, recognizes that planned and unplanned green space on public and private land contributes to the social and ecological functioning of urban systems. This definition expands the realm of what is considered to be GI, and (1) recognizes the need for greater engagement of private citizens in the planning, implementation, and management of such infrastructure, (2) acknowledges the role of privately-owned land—particularly residential land, the major land use in most cities—in providing ecosystem services, and (3) includes the role of private citizens—often homeowners—in managing landscapes for ecosystem services.
Much of the quantitative modeling work on urban GI (UGI) planning has historically centered on, and continues to focus on, stormwater management [4]. Trees, forests, and parks have also been a focus of the measurement of ecosystem services from UGI [6]. UGI, however, subsumes a wide range of landscape features providing diverse services, including informal green spaces and even wastelands [6]. In the urban environment, UGI is necessarily multifunctional. To be a valued part of the urban landscape, it must contribute to ecological quality while also performing production, social, and/or cultural functions. We therefore include urban agriculture (UA), which can provide multiple supporting, regulating, provisioning, and social/cultural services [7], as a form of UGI and a potential focus of a holistic, multifunctional approach to UGI planning. Such an approach seeks to integrate UGI with existing social-ecological systems across sites and scales and to balance cultural and ecological and, in the case of UA, production functions [4,7,8].
Planning and management at the city level and finer scales requires a spatially explicit approach [9]. As a first step, the locations of existing UGI sites must be mapped [10]. Doing so requires integrating diverse data sources including secondary data produced by government agencies and non-governmental organizations, such as UGI data layers documenting the existing tree canopy and community or school gardens, and remotely sensed data from high resolution satellite or aerial images or LiDAR data. Data on existing UGI may also be collected through participatory methods, with stakeholders ranging from homeowners to nongovernmental organizations (NGOs) providing information on the location, extent, and characteristics of projects through digital applications [11]. Potential spaces for the development of new UGI in all its potential forms must also be identified as part of the planning process to support expansion of UGI.
Combining data for existing and potential UGI in a single geographic information system (GIS) allows planners and other stakeholders to strategically (1) expand the fabric of existing UGI, (2) locate new UGI where it is needed most for ecological or social reasons, and (3) connect existing UGI and new UGI sites in synergistic ways. With some forms of UGI, such as wildlife habitats for area-sensitive species, bigger is better, with one large patch being superior to several smaller patches of equivalent aggregate area [12]. With other forms of UGI, such as stormwater retention and infiltration, systems of distributed, smaller-scale UGI may be superior to larger-scale, more centralized facilities [13]. Small patches of habitat also may provide corridors or connectivity for species across the urbanized matrix in the form of stepping stones, depending on the organisms of concern [14]. Weaving small UGI sites such as community gardens, urban farms, community food forests, and pocket parks into residential neighborhoods has the additional advantages of increasing opportunities for psychologically restorative encounters with everyday nature and providing provisioning, ecological, and cultural services where people live [15]. Small-scale UGI may be particularly important in the smart-green-compact city [16].
Providing public access to a GIS documenting existing and potential UGI through a digital application or e-tool can further promote UGI development while empowering diverse groups [11]. Such access supports top-down, bottom-up, and collaborative forms of UGI planning and management, leading to mosaic forms of UGI governance [17] and improved UGI functionality [18]. Active citizens or a UA service provider, for example, might use a UGI e-tool to identify undeveloped public land for the creation of a community garden or an urban farm in a food-insecure neighborhood. An urban farmer might use it to identify unused space on residential lots for a yard-sharing business, while private property owners could use it to coordinate the creation of urban commons spanning their properties, providing opportunities for recreation and food and habitat provisioning. Local governments can support such bottom-up initiatives by providing technical knowledge, funding, and materials [17,19].
UGI e-tools further support participatory planning at the city level [11], at a time when participatory approaches to planning and governance remain infrequent [20]. Stakeholder engagement combined with transparency in the planning process—promoted by interactive e-tool visualizations—can help ensure that the UGI meets community needs and aesthetic standards and addresses environmental inequities [4]. Community engagement in the planning, maintenance, and monitoring of UGI may also yield greater ecological benefits than top-down approaches [21]. E-tools can raise the visibility of existing and potential UGI sites, increase public awareness of their contributions to the quality of urban life, and, through place attachment, engender support for their creation, management, and protection [22].
With these potential applications and benefits in mind, the goals of this project were (1) to develop a public-access GIS for comprehensive UGI planning in Washington, DC (which we refer to as “the District” in the remainder of this article) and (2) to create an e-tool to facilitate both top-down and bottom-up UGI planning. To attain these goals, we chose to combine two complementary software applications—Esri ArcGIS Pro 2.7 [23] for the GIS and Tableau 2021.2 [24] for the e-tool—to take advantage of the strengths of each. While Tableau offers some geoprocessing capabilities, Esri products are considered the industry standard for GIS and are widely used across industries as a database management system and for geospatial analyses. Esri does offer public-access visualization capabilities in the form of ArcGIS Online. However, Tableau, designed primarily for analysis and visualization of data, offers greater functionality and ease-of-use for novice users without modification than ArcGIS Online does, including drag-and-drop functionality for creating data visualizations such as graphs and maps. In addition, while Tableau dashboards, as part of a Tableau workbook, are standalone applications with no ongoing costs and can also be published to Tableau Public, a free platform for sharing visualizations, ArcGIS Online has limitations for free public accounts. Publishing visualizations for the size of the GIS created for this project would require an organizational account and ongoing costs for data storage.
Project products will allow stakeholders to identify (1) existing UGI and (2) potential UGI areas, including areas for multifunctional UA. The GIS and dashboards merge three sources of data: information on existing green infrastructure collected from a variety of sources including Open Data DC, a GIS repository managed by the District government [25]; data on land suitable for new green infrastructure development identified through existing GIS layers or analysis of remote sensing data; and the demographic layer from the US EPA’s Environmental Justice (EJ) Screening and Mapping Tool [26], which includes variables such as percent low income and percent people of color at the block group level from the American Community Survey conducted by the US Census Bureau. We chose to include these demographic indicators because of their correlation with inequities in access to UGI [27]. By joining UGI data with sociodemographic data, the dashboards support visualization of the distribution of the former relative to the latter. Such visualization can reveal inequitable patterns of UGI type by community characteristics including income and race/ethnicity and help to catalyze the expansion of UGI to redress those inequities.
After describing the methods used to develop the GIS and dashboards, we briefly discuss results and then demonstrate the use of the dashboards in two hypothetical planning scenarios, focusing on the development of multifunctional UA on private and public lands.

2. Materials and Methods

2.1. Study Site, Population, and UGI Initiatives

The US federal capital, the District, has a current population of slightly more than 705,000 residents, a 17% increase from 2010 [28]. The population is 38% non-Hispanic white, 46% Black, 11% Hispanic, and 4% Asian [28]. Gentrification and emigration have resulted in a decline in the city’s Black population from a peak of 71.1% in 1970 [29]. With a total area of 177.0 km2 and a land area of 158.1 km2, the District has a population density of 4464 residents km−2, making it one of the US’s more densely populated cities. Residents under 5 years old constitute 6% of the population, those less than 18, 18%, and those 65 and older, 12% [28]. Residents are comparatively highly educated; 91% have a high school diploma or higher, and 58% have at least a bachelor’s degree, compared to 32% for the US as a whole [28]. Household income was USD 86,420 in 2019 compared to a US average of USD 62,843 [28]. However, the cost of living is high, 15% higher than the national average based on regional price parities [30], and at 13.5%, the District’s poverty rate is 3% higher than the US average [28]. The average income for Black households is a fraction of that of white households: USD 46,061 for the former versus USD 141,863 for the latter [31]. Of the city’s eight wards, four are majority Black. The populations of Wards 7 and 8 are more than 90% Black; these wards also have the city’s highest poverty rates, 25.2% and 30.8%, respectively [31].
Since 1973, a mayor and city council have governed the District, but the US Congress has exclusive jurisdiction over the city, per the US Constitution, and has the right to abrogate any laws passed by the District government. The US federal government is the city’s largest landholder, controlling 33% of land within the District; 37% of land is privately owned, and the District owns 30%. Over 24% of the city is federal or District parkland. At 710 hectares, Rock Creek Park, managed by the US National Park Service (NPS), is the District’s largest park and was the third national park authorized by the US government.
The District is within the watershed of the Chesapeake Bay, a federally listed impaired water [32], and is traversed by the Potomac and Anacostia Rivers, Rock Creek, Oxon Run, and their tributaries. The Potomac and Anacostia Rivers and Rock Creek are also listed as impaired waterways [33]. Like many older US cities, the District has a combined sanitary-storm sewer system and, along with its water utility DC Water, is under consent decree of the US EPA to reduce overflows from the system, which contribute to Chesapeake Bay pollution [34]. In response, the city has a vigorous UGI outreach and education program managed by its Department of Energy and Environment (DOEE). DOEE manages a wide range of UGI programs, including the RiverSmart Programs providing technical and financial support for the installation of stormwater retrofit facilities such as rain gardens and detention basins, canopy trees on private property, tree planting rebates for property owners, and the Habitat Restoration Program, which focuses on the restoration of river, stream, and wetland habitats [35]. With the planned installation of UGI projects in the Rock Creek watershed, the District has succeeded in eliminating one of three planned holding tunnels to reduce combined sewer overflows [34].
The District has a humid subtropical climate (Köppen climate classification Cfa) with hot, humid summers and cold winters. The average high temperature is 6.3 °C in January, the coldest month, and 31.3 °C in July, the warmest month [36]. Monthly precipitation is greatest in spring and lowest in winter, with an annual average of 101 cm for the period 1981–2020 [37]. Impervious surfaces, which were estimated to cover almost 35% of the District’s total area in 2010 [38], exacerbate summer heat and stormwater runoff. The city has sought to mitigate the urban heat island effect and to reduce runoff while improving air quality through, in part, a tree planting campaign. In 2011, the mayor set a goal of increasing canopy coverage in the District by 5%, from 35% to 40%, by increasing the annual tree planting rate on all lands within the city—federal, District, and private—over a 20-year period [39]. A wide range of public and private tree planting initiatives support the city’s efforts to attain this goal.

2.2. Creating the Existing and Potential UGI GIS Layers with ArcGIS Pro 2.7

2.2.1. Existing UGI Projects

We initially identified existing UGI sites in geospatial data layers maintained by Open Data DC [25] and then summarized total UGI project area and number by UGI category at the parcel (ownership lot) level using the Urban Tree Canopy at Parcel Level in 2015 layer [40]. We first combined the following five geospatial data layers to create a point layer documenting existing projects.
  • Best Management Practices (BMP) point data for green (as opposed to gray) infrastructure, including the following BMP groups: BayScaping (a form of UGI replacing lawn with plants native to the Chesapeake Bay region), bioretention, contributing drainage area (CDA) to a shared BMP, green roof, impervious surface disconnection, infiltration, land cover change, open channel (dry or wet swale or grass channel), permeable pavement, ponds, rainwater harvesting, stream restoration, tree planting and preservation, and wetlands [41]. These projects are intended to mitigate stormwater and were installed as part of the District’s Stormwater Retention Credit (SRC) trading program [42], RiverSmart Homes program [43], RiverSmart Rooftops program [44], or RiverSmart Rewards stormwater fee discount program [45].
  • Green Sites and Amenities point layer, filtered for only green roofs and only those points not included in the BMP layer, which were removed from the layer using the Erase tool [46].
  • Urban Agriculture Areas Polygons layer documenting 29 urban farms [47]. Per the layer’s Open Data DC description, these sites “are distinguished from community gardens in that they are generally not intended for the public to use the space for their own growing activities and…many have a commercial focus.” Note this layer includes outdoor and indoor UA sites.
  • Community Gardens Polygons layer comprising 68 active community gardens managed by the District, the National Park Service, the federal government, and other organizations [48].
  • School Gardens point layer documenting 126 school campuses with active school gardens during the 2016–2017 school year [49]. Note these gardens are not necessarily food-producing sites.
For the BMP and Green Sites and Amenities point layers, UGI area was derived from the area attribute associated with points. In the case of the BMP layer, this was the post-project BMP area attribute, except for BayScaping projects, for which post-project contributing drainage area was used. Area is missing from the layer for some BMP types, and for three types, we estimated area. For shade tree and tree planting projects, we conservatively estimated area per project based on the typical canopy spread of a newly planted shade tree, 1.16 m2. For rain garden projects, we used the project area minimum per District guidelines, 4.65 m2 (50 ft2). For the UA and community garden layers, UGI area was derived from polygon area. Because some sites span multiple parcels, the community garden and urban agriculture polygon layers were intersected with the parcel polygon layer, and the resulting polygons were converted to points with area attributes using the Feature to Point tool after the Multipart to Singlepart tool was run to separate multipart polygons. Because the school garden point layer lacks an area attribute and no school garden polygon layer is available for the District, the area of each garden was assumed to be 65.5 m2 based on ground truthing of 10 sites by staff from the University of the District of Columbia.
The five UGI point layers were combined using the Append tool. The resulting layer was joined with the parcel polygon layer using the Spatial Join tool in ArcGIS Pro to create an existing projects-by-parcel layer for analysis. For UGI projects outside parcel boundaries, such as street corridors, a ward-level parcel boundary was created in the parcel layer and assigned a unique parcel ID. Note that the original tree canopy-parcel layer includes overlapping parcels, such as parcels which have apparently been consolidated to form a single parcel and single parcels which have been subdivided for development. Because we were unable to determine for each set of overlapping parcels which parcel(s) represent current conditions, we kept all parcels in the dataset.
We used the Summary Statistics tool to create a table summarizing UGI project area and number by category by parcel. To create a point shape file for visualization of these data in Tableau, we first converted the parcel polygon layer to a point layer using the Feature to Point tool, with an output point location within the parcel polygon, and added the latitude and longitude of each point to the attribute table using the Calculate Geometry tool. This table was joined to the summary table using the Add Join tool. The resulting table was converted to a point layer using the XY Table to Feature tool. To separate overlapping points for parcels with multiple categories of existing UGI projects, we used the Disperse Markers tool.
Total existing UGI area and number of projects were added to the parcel polygon layer using the Summarize Within tool, and this layer was joined with the ward layer [50], zoning layer [51], low food access areas layer [52], and EPA EJSCREEN block group demographic layer [26] using the Spatial Join tool to create a final parcel-level polygon layer for analysis and for visualization in Tableau.

2.2.2. Tree Canopy Characteristics

The urban tree canopy is a key feature of the District’s UGI. Several variables from the Urban Tree Canopy at Parcel Level in 2015 dataset [40] were retained in the parcel layer, including 2015 tree canopy as total area and percent of parcel area.

2.2.3. Potential UGI Area

To create the potential UGI layer, we followed these procedures:
  • Using the Raster Calculator tool and the 2020 normalized digital surface model (nDSM) with 1-m resolution from Open Data DC [53], we output a raster with input values less than 1.5 m recoded to 1 and all other input values recoded to 0. The nDSM is the result of subtracting the ground surface from the first-return surface, giving the height of buildings, trees, and other objects above the surface.
  • Ran the Focal Statistics tool on the output raster using a 3 × 3 cell majority statistic to remove insignificant areas, such as single pixels.
  • With the Extract by Attributes tool, extracted cells with a value of 1 to select areas with structures and vegetation less than 1.5 m in height, which excluded areas of taller vegetation potentially already providing significant ecosystem services from consideration for new UGI development.
  • Converted the resulting raster to a polygon layer using the Raster to Polygon tool, with simplification of polygon edges.
  • Erased from the resulting polygon layer areas of land use incompatible with new UGI development—impervious surfaces and building footprints from the Open Data DC impervious surface layer [54], cemeteries [55], recreational fields [56], railroad lines [57] buffered to a distance of 10 m with internal areas removed with the Eliminate Polygon Part tool, golf courses [58], historic landmark sites [59], urban agriculture areas [47], community gardens [48], waterbodies [60], and wetlands [61]—using the Erase tool.
  • Intersected the polygon layer with the parcel layer using the Intersect tool.
  • Clipped the polygon layer to the Washington, DC boundary using the Clip Layer tool.
  • Separated multipart polygons to create singlepart polygons using the Multipart to Singlepart tool, and deleted duplicate polygons using the Delete Identical tool.
  • Selected polygons with an area greater than or equal to 9.29 m2 (100 ft2) with the Make Feature Layer tool; these polygons represent the final potential UGI data layer for the city.
  • Summarized potential UGI area by parcel—including ward-level parcels created for areas (mostly within street corridors and suitable for stormwater structures and other BMPs) falling outside parcel boundaries (see Section 2.2.1)—using the Summarize Within geoprocessing tool.

2.3. Creating the Potential UA GIS Layers with ArcGIS Pro 2.7

2.3.1. Potential Rooftop UA

The GIS-based site suitability model for rooftop UA was adapted from the spatial analysis framework developed for an assessment of rooftop urban agriculture potential in Boston [62]. Potential rooftop UA areas were identified according to three criteria based on safety, access, and production efficiency:
  • Building height less than 30.5 m but greater than or equal to 2 m. The latter qualification was added to eliminate small, lightweight structures, buildings which had apparently been demolished but which were still present in the building footprints layer, and buildings for which height data were unavailable due to the redaction of LiDAR data at the direction of the U.S. Secret Service.
  • Rooftop slope less than 5 degrees.
  • Net roof area, after deducting existing green roof area, of at least 23.2 m2 (250 ft2).
    To create the rooftop UA layer, we:
    • Derived slope from the 2020 digital surface model (DSM) with 1-m resolution from Open Data DC [63] using the Slope geoprocessing tool, which produced a raster dataset representing slopes.
    • Ran the Zonal Statistics as Table tool on the slope raster with footprints from the latest building footprints layer [64] as the zones and the statistic set to majority. Because the majority statistic requires the raster be composed of integer values rather than decimal values, the Int tool was first used to truncate the slope value to an integer. The majority statistic was used because the parapet walls of some buildings inflated the mean statistic, making it unrepresentative of the actual slope of the roof.
    • Calculated the height of each building by running the Zonal Statistics as Table geoprocessing tool on the 2020 nDSM [53], with footprints from the building footprints layer [64] as the zones and the statistic set to mean.
    • Calculated the area of each roof by running the Calculate Geometry tool on the building footprints layer.
    • Joined the tables resulting from steps 1 and 2 using the Join Field tool, and added the resulting table to the building footprints layer using the Add Join tool.
    • Summarized existing green roof area by building footprint using the Summarize Within tool and the existing UGI projects point layer. (Green roof points falling outside building footprints were moved to the nearest building with a green roof—per aerial/satellite imagery—when appropriate.)
    • Subtracted existing green roof area from building footprint area to estimate net roof area with the Calculate Field tool.
    • Converted the footprint polygons to points using the Feature to Point tool and erased points falling within areas of land use incompatible with new UA development—cemeteries [55], recreational fields [56], railroad lines [57] buffered to a distance of 10 m with internal areas removed with the Eliminate Polygon Part tool, golf courses [58], and historic landmark sites [59]—using the Erase tool.
    • Used the Make Feature Layer tool to select the footprints of buildings meeting the slope (<5 degrees), building height (<30.5 and > 2 m), and net roof area (>23.2 m2) criteria. Structures in the footprints layer which were not buildings per the description attribute—bleachers, memorials, and parking garages—were excluded from the final selection
    • Summarized potential rooftop UA area by parcel using the Summarize Within tool.

2.3.2. Potential Ground-Level UA

The suitability model for ground-level UA was adapted from a study on the UA production capacity of Seattle [65]. Ground-level areas suitable for UA were identified based on four criteria:
  • Slope < 15%, to minimize stormwater runoff [62].
  • Sufficient sunlight to grow vegetable crops, which we estimated to be 2.5 kW m−2 d−1 following Richardson and Moskal [65].
  • Contiguous area of at least 9.29 m2 (100 ft2) within the same parcel, for relatively efficient production and sufficient yield to have an impact on household food budgets.
  • Existing vegetation and structures less than 1.5 m in height.
To create the potential ground-level UA layer, we:
  • Calculated slope from the 2020 hydro enforced digital terrain model (DTM) with 1-m resolution from Open Data DC [66] using the Slope geoprocessing tool, and extracted raster cells with slope less than 15% using the Extract by Attributes tool.
  • Extracted raster cells with elevation less than 1.5 m from the 2020 nDSM with 1-m resolution [53] using the Extract by Attributes tool
  • Calculated single-day solar insolation (solar potential) using the Area Solar Radiation tool for July 22 and the tool’s default settings. This date was chosen because it represents the midpoint of the frost-free growing season for the District. Input to the Area Solar Radiation tool was the 2020 DSM [63], with modification. Trees were not removed from the DSM prior to calculation of solar potential because removing trees would represent the highly unlikely scenario in which the District, a city currently trying to expand its tree canopy to mitigate increasing heat due to climate change, would remove all trees. However, existing vegetation and structures less than 1.5 m in height were removed. To do this, a mask was created by extracting raster cells with elevation greater than or equal to 1.5 m from the nDSM using the Extract by Attributes tool. This mask was used to extract corresponding cells from the DSM using the Extract by Mask Tool. The resulting raster was mosaicked with the DTM using the Mosaic to New Raster tool, replacing no data cells with the ground elevation from the DTM. The solar radiation tool was run on the new, mosaicked raster. The output raster represents average solar potential in kilowatts per square meter (or kilowatts per pixel, since the pixel size is 1 m2) per day.
  • Extracted raster cells with solar potential greater than or equal to 2.5 kW m−2 d−1 with the Extract by Attributes tool.
  • Added the rasters from steps 1 (slope < 15%), 2 (nDSM < 1.5 m), and 4 (solar potential ≥ 2.5 kW m−2 d−1) using the Raster Calculator tool. This effectively combined the three eligibility criteria with a Boolean AND operator, yielding a raster comprising only cells meeting all three criteria.
  • Used the Reclassify tool to reclassify cells meeting all three criteria to 1 and no data cells to 0.
  • Ran the Focal Statistics tool on the resulting raster using a 3 × 3 cell majority statistic to remove insignificant areas, such as single pixels, and extracted cells with a value equal to 1 using the Extract by Attributes tool.
  • Converted the raster layer to a polygon layer with the Raster to Polygon conversion tool, with simplification of polygon edges.
  • Erased from the resulting polygons areas of land use incompatible with new UA development—impervious surfaces and building footprints from the Open Data DC impervious surface layer [54], cemeteries [55], recreational fields [56], railroad lines [57] buffered to a distance of 10 m with internal areas removed with the Eliminate Polygon Part tool, golf courses [58], historic landmark sites [59], urban agriculture areas [47], community gardens [48], waterbodies [60], wetlands [61], and areas outside parcels (largely in street corridors)—using the Erase tool.
  • Intersected the layer with the parcel layer with the Intersect tool.
  • Clipped the polygon layer to the Washington, DC boundary using the Clip Layer tool.
  • Separated multipart polygons into singlepart polygons using the Multipart to Singlepart tool, and deleted duplicate polygons using the Delete Identical tool.
  • Selected polygons with an area greater than or equal to 9.29 m2 (100 ft2) with the Make Feature Layer tool; these polygons represent the final potential ground-level UA data layer for the city.
  • Summarized potential ground-level UA area by parcel using the Summarize Within tool.

2.4. Creating the Tableau Interface

Business Intelligence (BI) generally refers to software technologies and services which can be used to transform data into insights for business operations. Tableau was one of the first companies to make the field of BI and visual data analytics accessible to a broad audience [67]. The software makes statistical analysis and visualization traditionally performed with packages like R and SAS available in a more user-friendly drag and drop environment where no programming experience is required. The visual data analytics allow for interaction with underlying data at a more granular level making it useful for data-informed research and decision making, including, in the case of this study, UGI planning.
Tableau works with a variety of different data types, including temporal, spatial, categorical, and continuous data. Datasets or layers can be visualized individually, but more often the data analyzed comprises a collection of tables which are joined or blended together, creating a flat file containing all the information.
In a Tableau workbook, a dashboard is a collection of data views allowing simultaneous monitoring and comparison of different types and sets of data. Dashboards support data analysis by end-users unfamiliar with Tableau’s technical specifications. Dashboards can be shared with the public in two ways: by sharing a packaged workbook, which contains local data sources and can be downloaded and opened with Tableau Reader, a free application, or by publishing the workbook to Tableau Public, which can be accessed via desktop, laptop, or handheld device.
For this project, we created six Tableau dashboards using Tableau Desktop (version 2021.2) by joining the parcel polygon layer with summary variables with the point layer summarizing existing UGI project area and number by UGI category by parcel. The join relationship between the parcel layer and the existing UGI point layer is considered a full order join where all records from the parcel layer and the existing UGI layer are included in the final table. Following the join, worksheets and dashboard tables were created for data visualization. Summary calculations within Tableau relied on Level of Detail and CASE statements to remove duplicates created by joins.

3. Results and Planning Scenarios

In this section, we discuss the results of analyses of existing and potential UGI in the District, provide an overview of the Tableau dashboards created for the project, and demonstrate the use of a dashboard for UA planning on public and private land in the city.

3.1. Summary Statistics for Existing and Potential UGI

Across the District, UGI projects totaling 150 ha had been implemented as of April 2021. They fall into 15 different categories including: BayScaping (District-sponsored replacement of lawn with plants native to the Chesapeake Bay region), bioretention, CDA to a shared BMP, green roof, impervious surface disconnection, infiltration, land cover change, open channel, permeable pavement, ponds, rainwater harvesting, stream restoration, tree planting and preservation, UA, and wetlands. Tree planting and preservation (N = 6603), rainwater harvesting (N = 6435), and bioretention (N = 3587) are the most common types of UGI. The distribution of rainwater harvesting and tree projects is concentrated in Wards 4 and 5 (Table 1), while bioretention facilities are somewhat more evenly distributed. Green roofs, permeable pavement, and urban agriculture account for the largest area of existing UGI projects across the city, 126 ha in total.
Table 2 summarizes existing GI projects, tree canopy area, total area of existing GI (area of existing projects plus tree canopy area), and potential rooftop and ground-level UA area by ward. Of the District’s total area of 17,711 ha, 2734 ha are categorized as potential areas for development of UGI of any kind based on model criteria, although these areas include both pervious and impervious ground area. The UA suitability models developed for this study indicate 1372 ha of District land meet the criteria for ground-level UA. In addition to parcels, rooftops hold significant potential for UA development or other types of green roofs. Of the 162,588 buildings in Washington DC, 60,265 buildings have rooftops suitable for agriculture, representing 1203 ha of potential production area. Wards 5, 7, and 8 have the largest total areas suitable for UA (Table 2).

3.2. Using the Dashboards

Dashboards created for this project include:
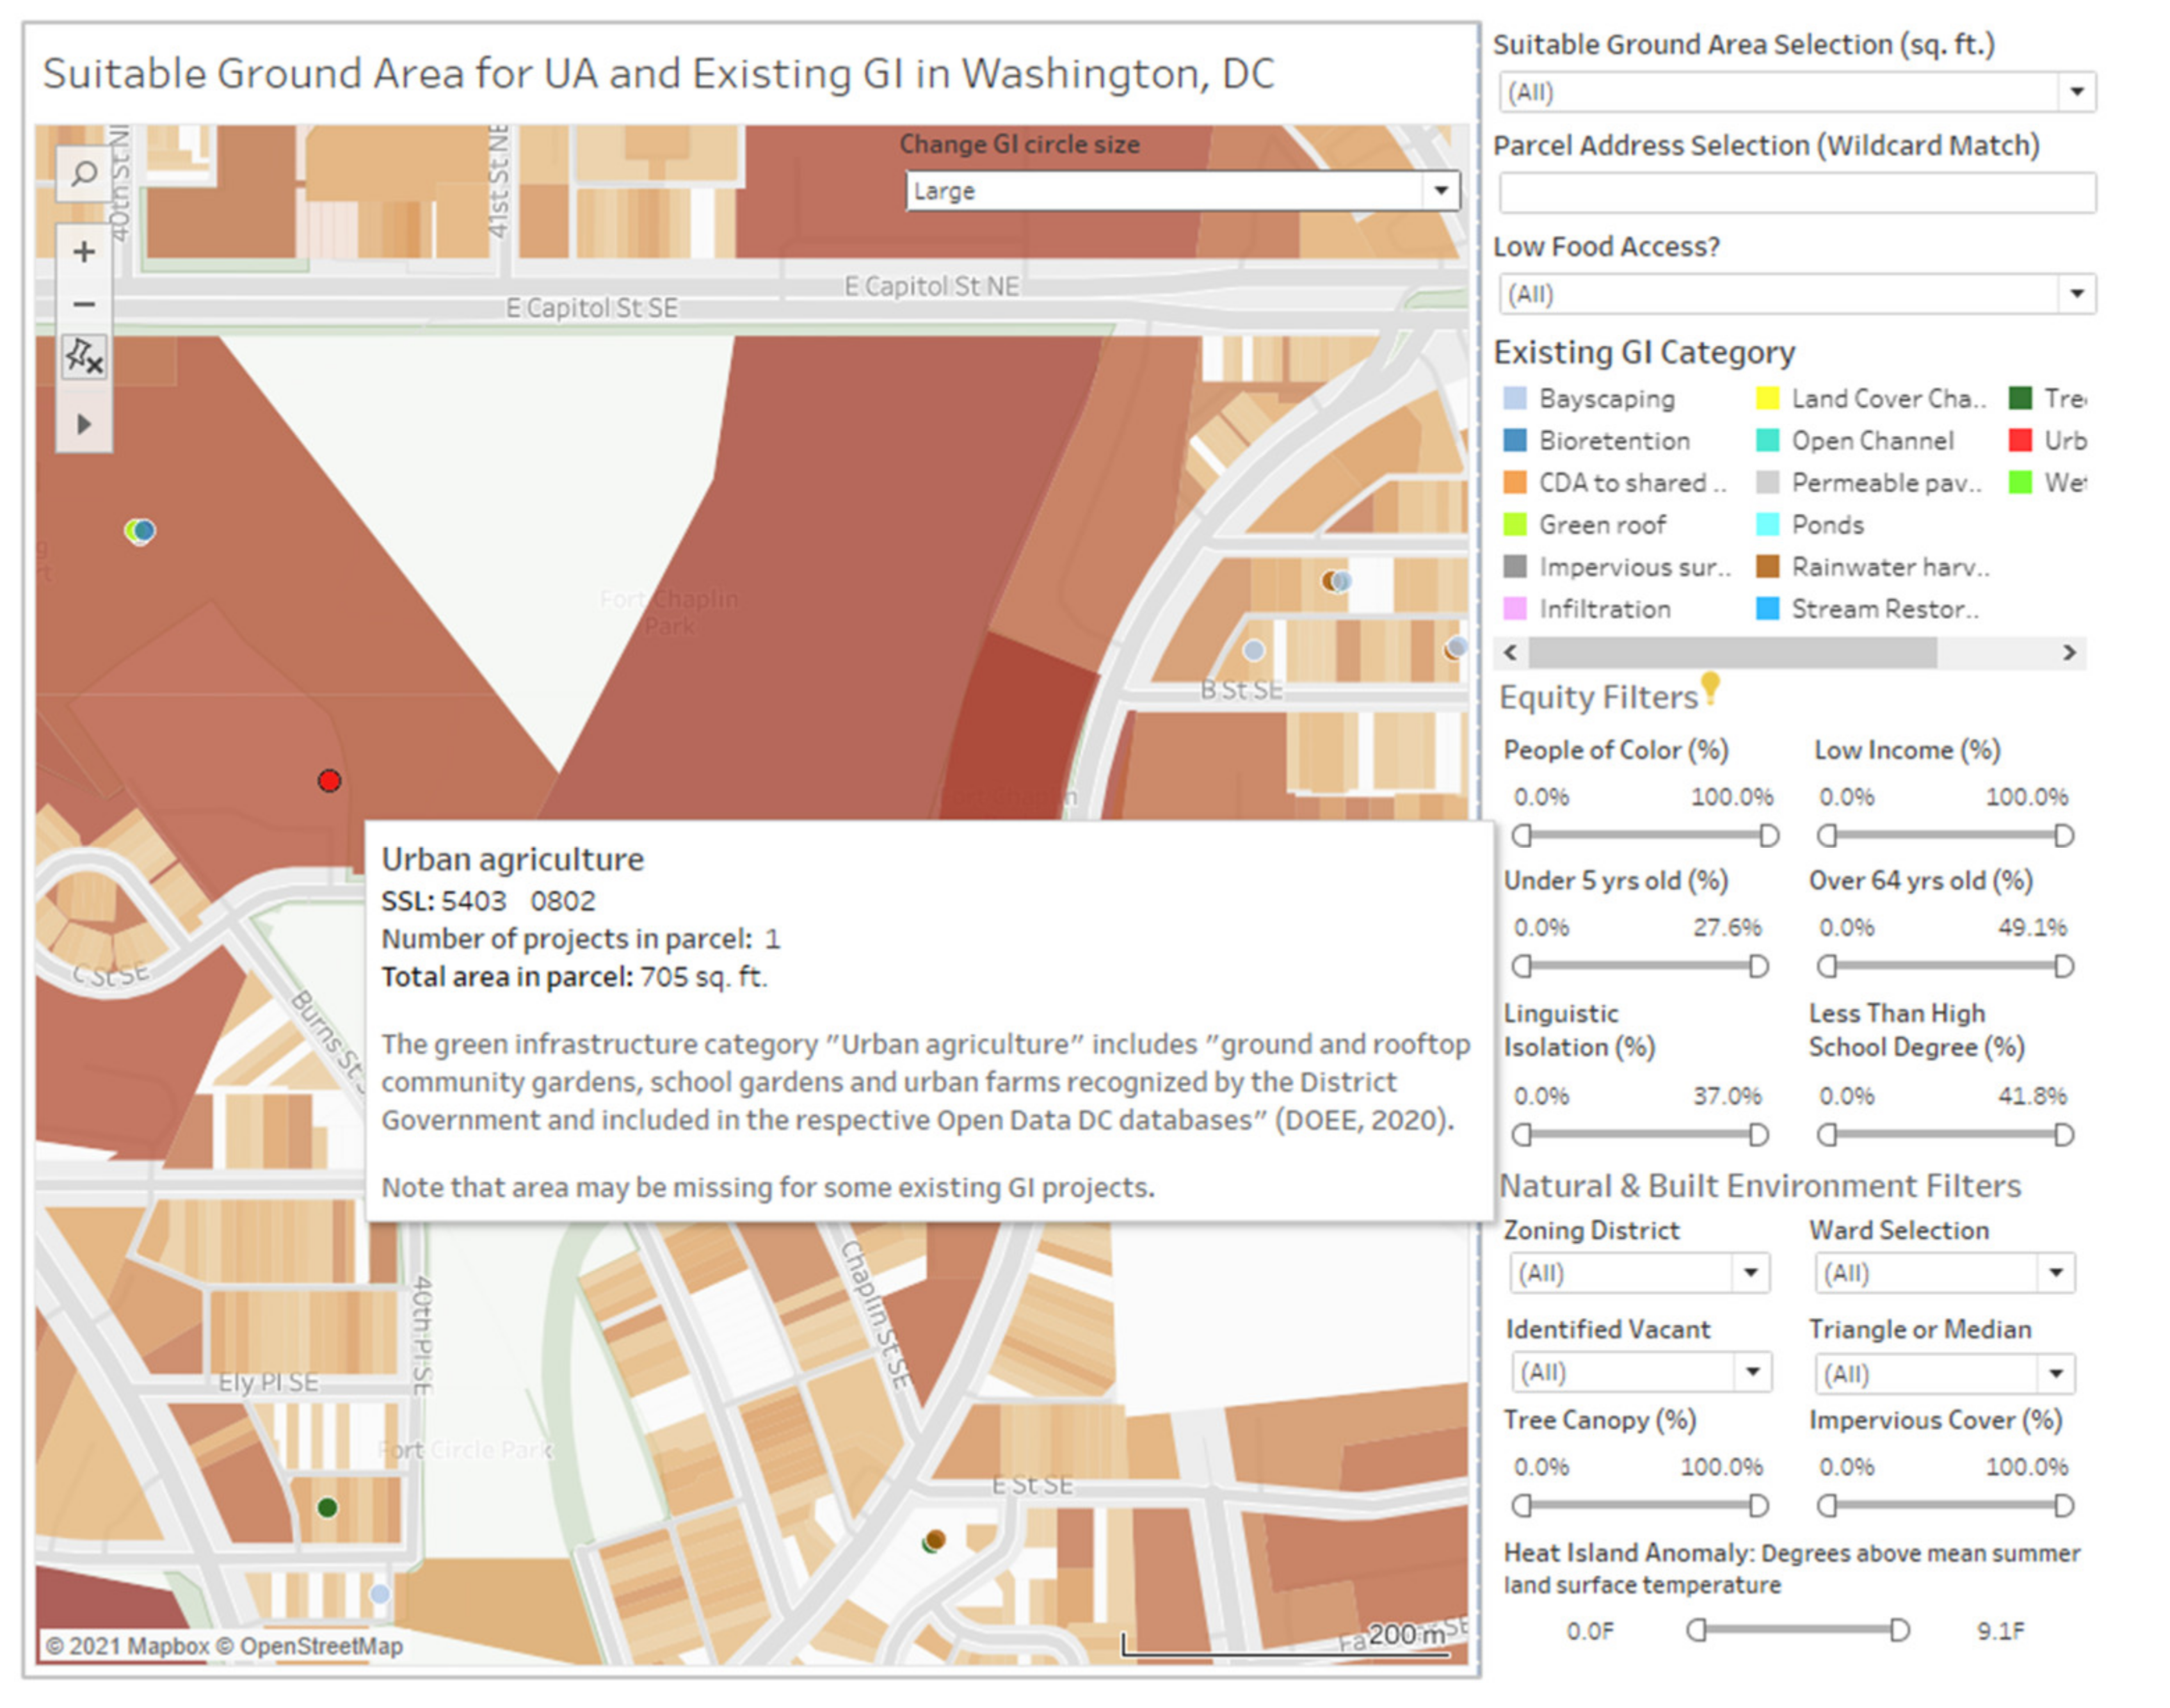
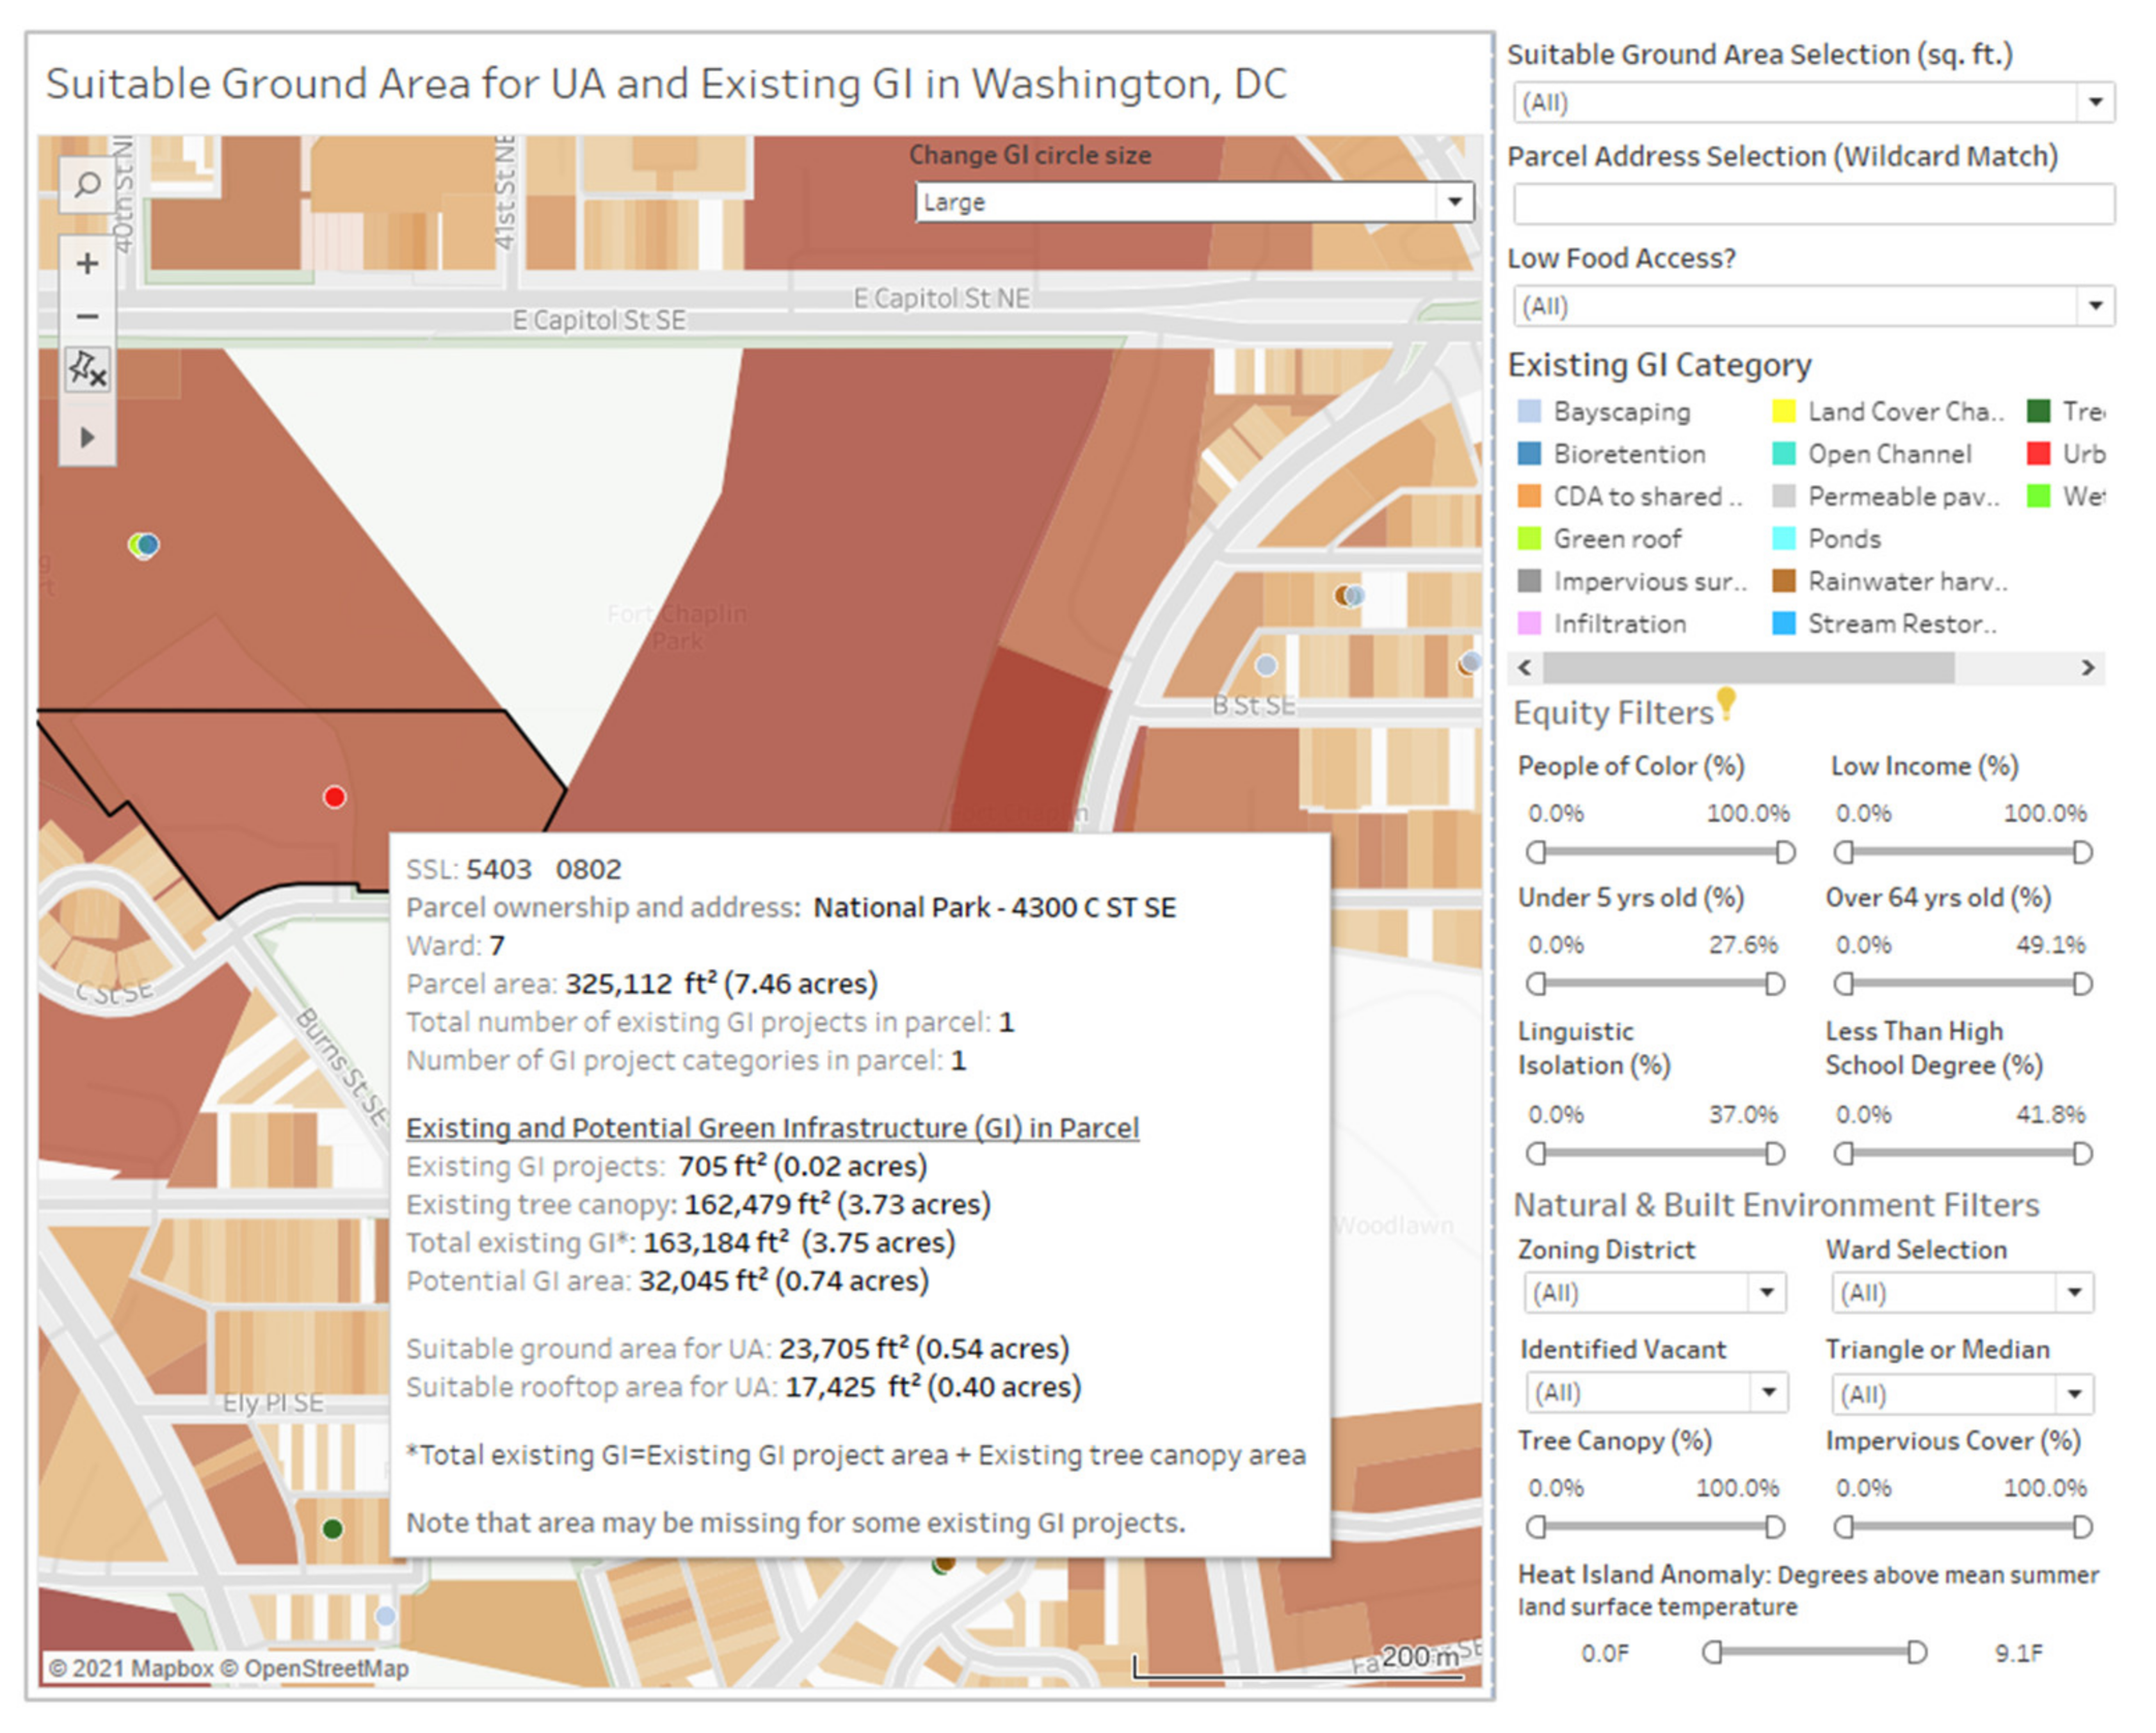
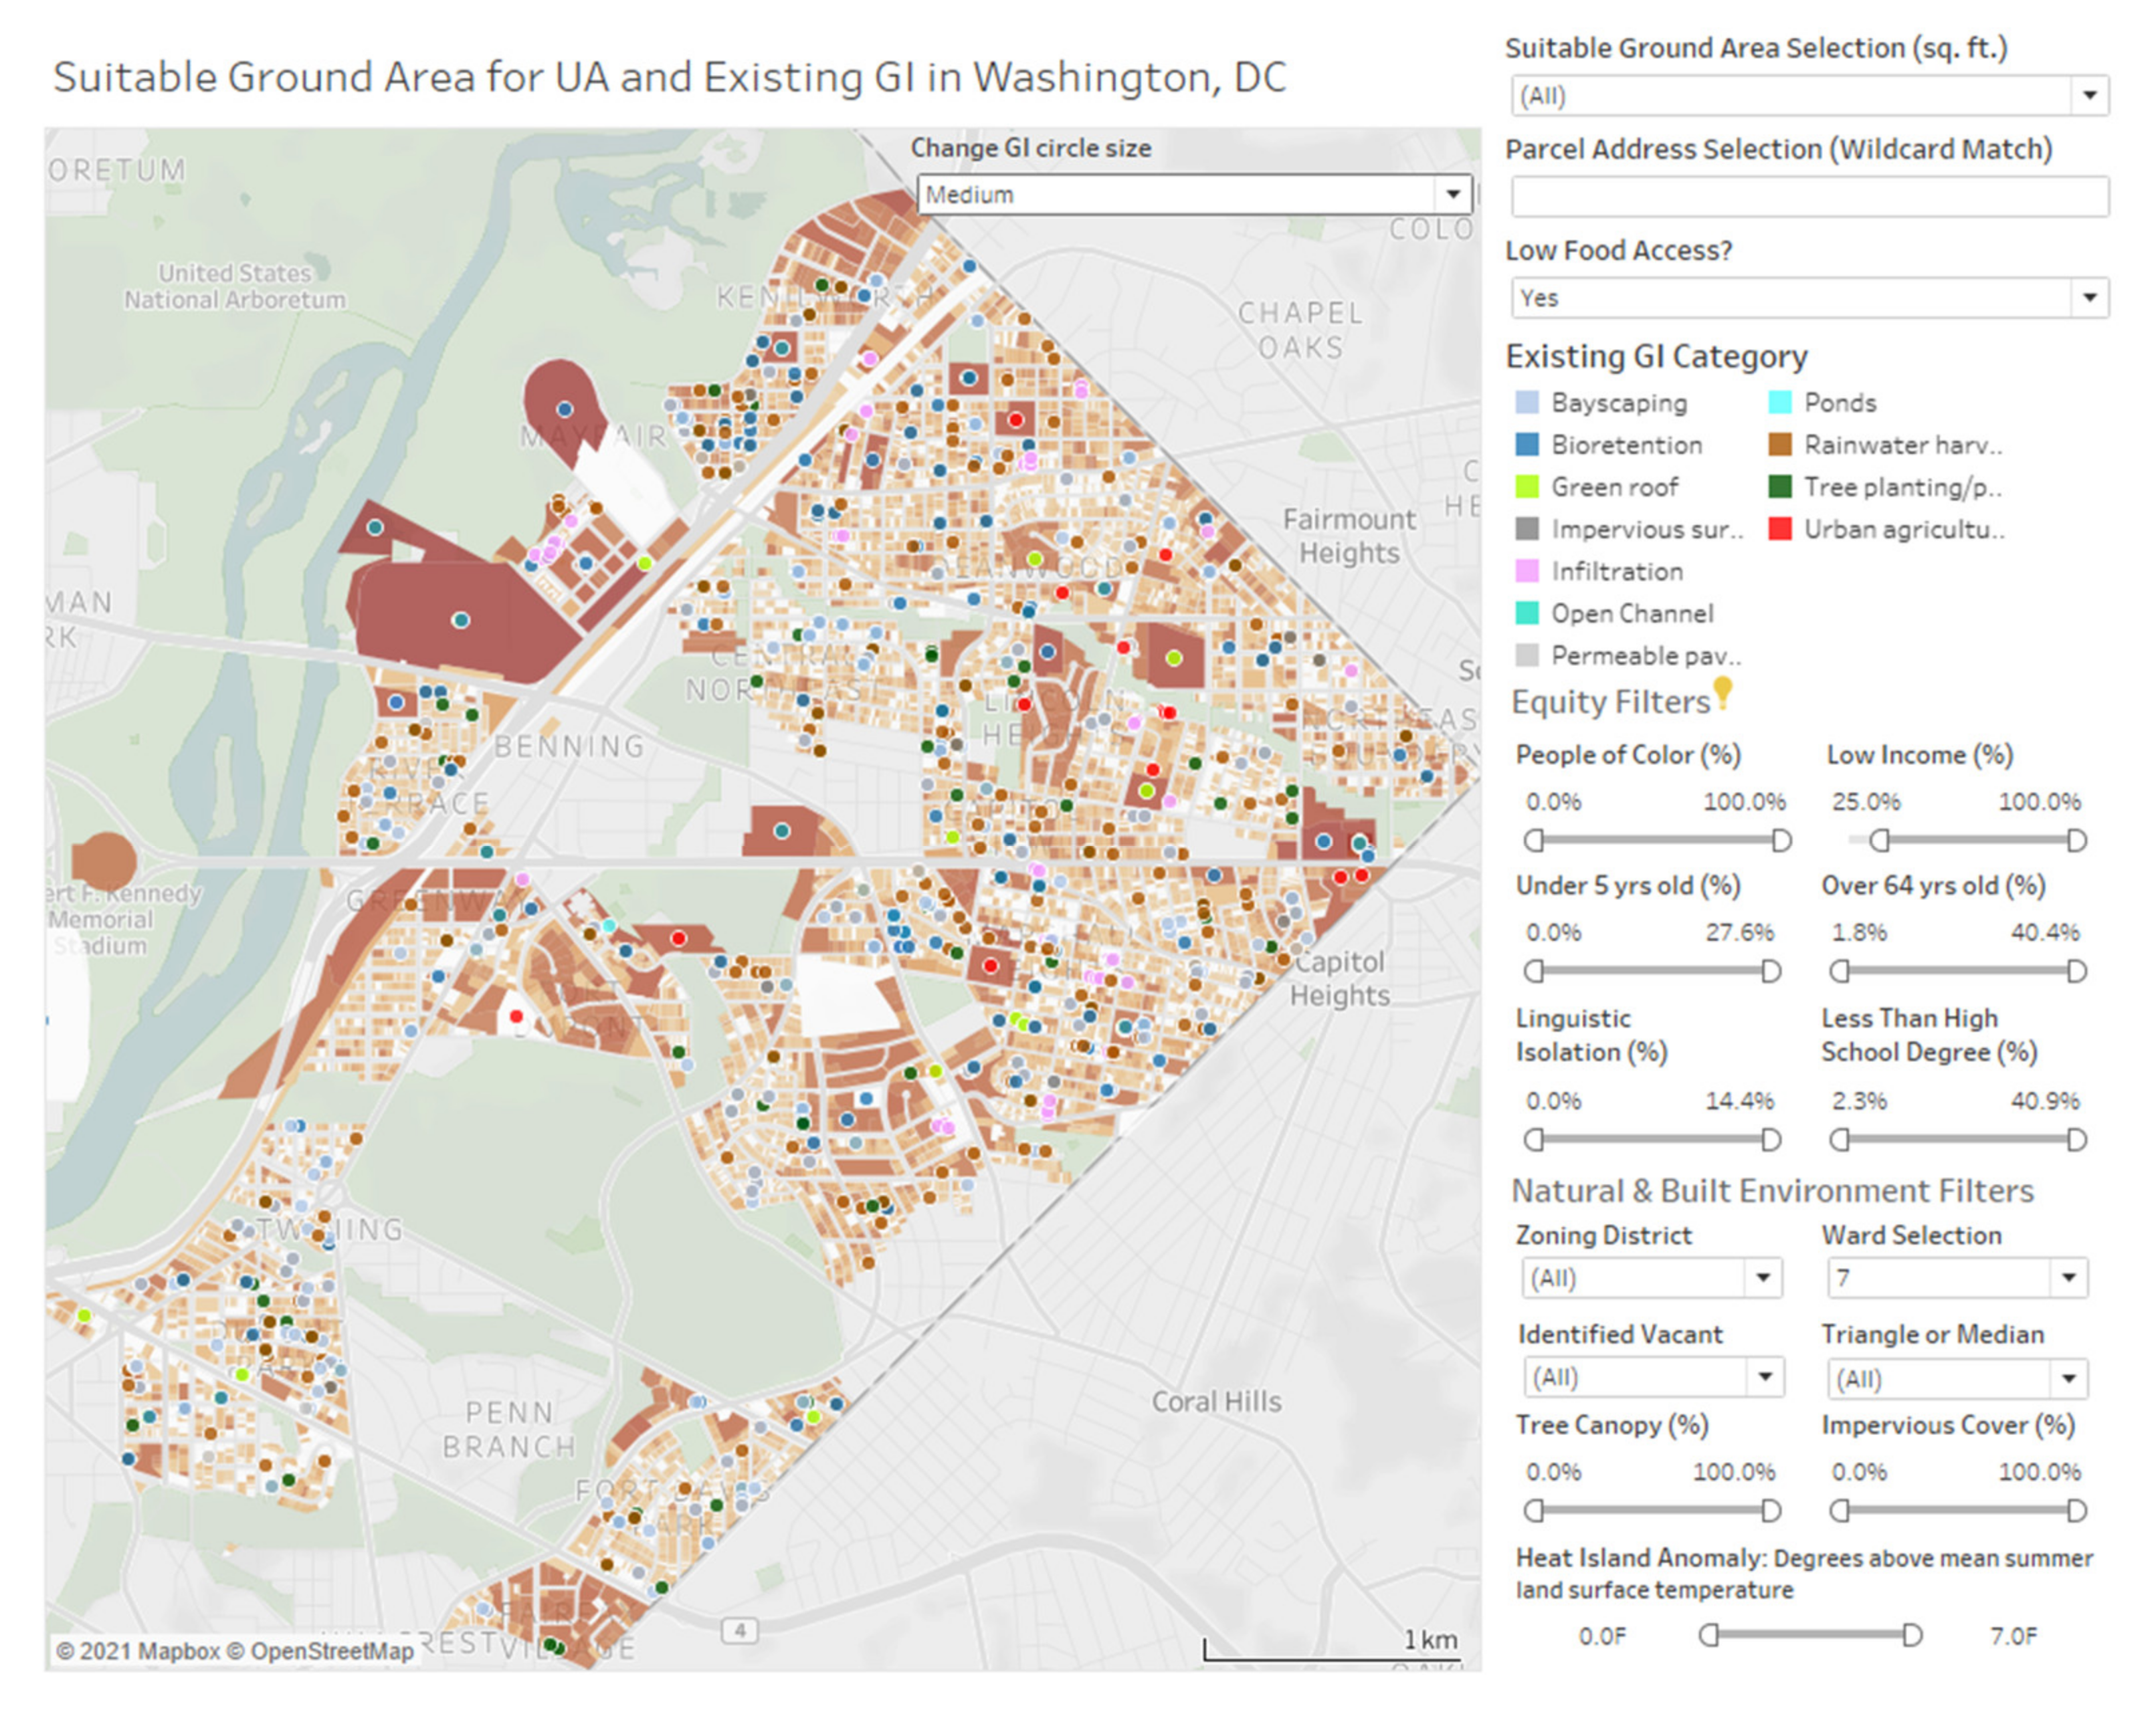
  • Suitable Ground Area for UA and Existing GI in Washington, DC. This dashboard includes a map showing (1) parcels shaded to indicate the amount of suitable ground area for UA, from tan (small area) to dark brown (large area) and (2) color-coded circles representing the categories of existing GI projects in the parcel (Figure 1). Parcels with no ground area suitable for UA are rendered in white. The dashboard also includes: (1) filters for suitable ground area size category, parcel street address, and low food access (more than a 10 min walk from the nearest full-service grocery store) and (2) equity filters based on the EPA EJSCREEN demographic data and natural and built environment filters such as ward and zoning. Hovering the cursor over a parcel opens a tooltip displaying the parcel’s SSL (Square, Suffix, Lot), a unique parcel identifier used by the District; ownership type; street address; ward; parcel area; area of existing GI projects; existing tree canopy area; total GI area (existing GI projects plus tree canopy area); potential ground area suitable for UA; and potential area suitable for rooftop UA (Figure 2) (Note that all dashboard areas are in US units because the target user group includes members of the US public). Hovering over a color-coded GI circle opens a tool tip displaying the existing GI category, the SSL of the parcel with which it is associated, the total area and number of projects in the category in the parcel, the number of GI categories, and the category definition. Users can search on a full or partial street address to find a specific parcel, and the map will display parcels with addresses matching the search string, with other parcels grayed out. Filters can be manipulated to identify parcels meeting user-defined criteria such as suitable ground area size. Parcels not meeting the criteria will be grayed out.
  • Suitable Rooftop Area for UA and Existing GI in Washington, DC. This dashboard is identical to the previous dashboard except parcel shading in blue represents suitable rooftop area for UA.
  • Potential GI Area and Existing GI in Washington, DC. This dashboard is identical to the previous two dashboards except parcel shading in green represents potential GI area, and the low food access filter has not been included.
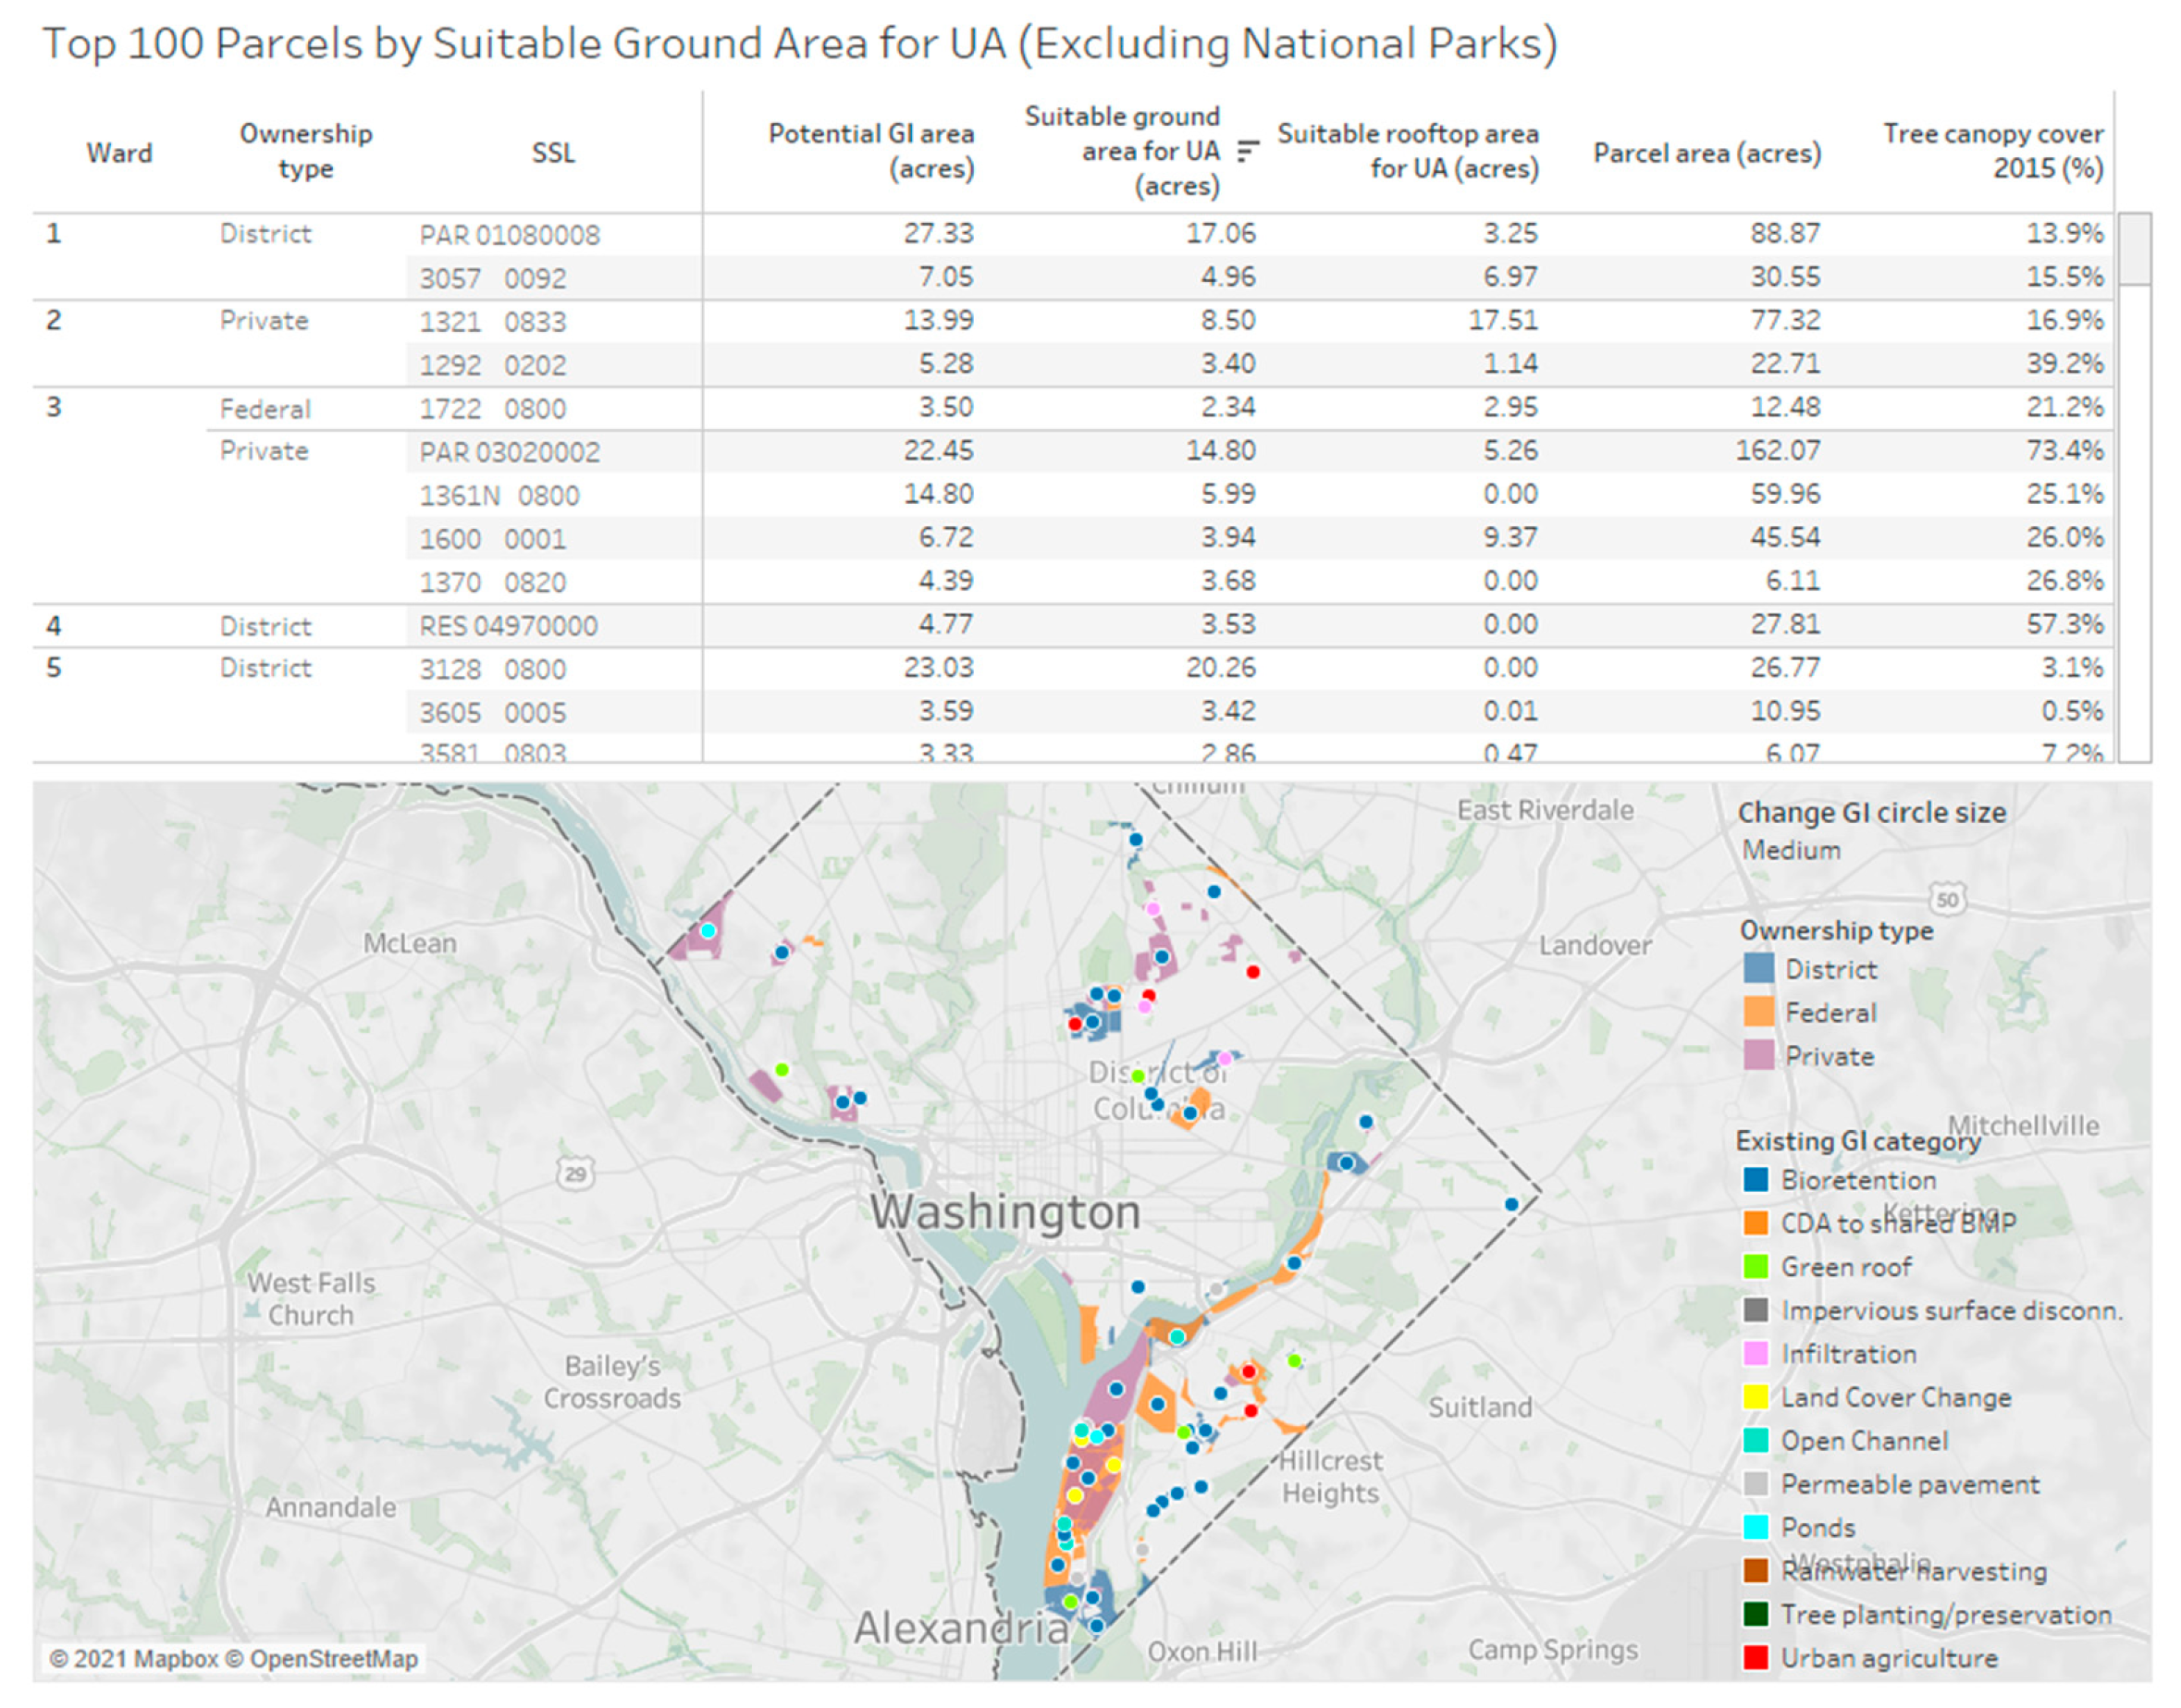
  • Top 100 Parcels by Suitable Ground Area for UA (Excluding National Parks). This dashboard lists by ward, ownership type, and SSL the 100 parcels (excluding national parks) with the largest ground area suitable for UA. Clicking on an SSL number in the table will zoom to the selected parcel in the accompanying map. All other parcels will be greyed out.
  • Top 100 Parcels by Suitable Rooftop Area for UA (Excluding National Parks). This dashboard is identical to the previous dashboard except that it lists the 100 parcels (excluding national parks) with the largest rooftop area suitable for UA.
  • Top 100 Parcels by Potential GI Area (Excluding National Parks). This dashboard is identical to the previous two dashboards except that it lists the 100 parcels (excluding national parks) with the largest potential GI area.
The Tableau dashboards are provided as Supplementary Materials, as a packaged Tableau workbook.

3.3. Planning for UA Using the Tableau Dashboards

In this section, we demonstrate the use of the dashboards for UA planning on public and private land. While our examples are specific to the District and to UA, they demonstrate the functionality of the dashboards and their integration with other data sources and offer a model for communicating dashboard features and use to stakeholder groups.

3.3.1. City-Scale Planning

Healthy diets reduce chronic disease, improve children’s learning and behavior in school, and enhance quality of life [69]. According to the Sustainable DC 2.0 Plan, one in ten District residents and one in five households with children lack consistent access to healthy affordable foods [70]. The plan has two goals directly related to the expansion of agriculture aimed at improving access to and strengthening the local food system. The first is to expand food production by 20 acres (8.1 ha) by 2032. The second is to develop orchards or other agriculture on 5 acres (2 ha) of District-owned public space dispersed across all eight of the city’s wards. The two Top 100 dashboards for UA can be used to identify parcels with the greatest potential for meeting these goals through ground-level or rooftop production. For example, the top parcel in Ward 1 in the Top 100 Parcels by Suitable Ground Area for UA is owned by the District and has 18.4 acres (7.4 ha) of land suitable for ground-level UA (Figure 3). Initial virtual reconnaissance of this parcel using Google Earth followed by ground truthing could be used to determine its suitability either for annual cropping in the form of community gardens or urban farms or for orchards.
By manipulating the low food access, equity, and natural and built environment filters, the Suitable Ground Area for UA dashboard can be used to target UA development more strategically to address inequities in availability and access to food (Figure 4). Checking “Yes” in the low food access dropdown menu identifies areas in the city which are more than a 10-min walk from the nearest full-service grocery store. Ward 7 encompasses some of the poorest neighborhoods in the District; selecting this ward from the dropdown menu further narrows the focus of the map. While the existing UGI layer indicates some UA in this ward, residents could benefit from increased local food production. Moving the left grip on the low-income slider from 0% to 25% displays only those parcels in census block groups where the household poverty rate is above 25%. Because food insecurity is correlated with low income [71], households in these block groups in Ward 7 are at higher risk for food insecurity and could most benefit from UA.

3.3.2. Planning for UA on Private Property at the Neighborhood Level

Several neighborhoods in DC—Anacostia (Ward 8), Barry Farm (Ward 8), Mayfair (Ward 7), and Ivy City (Ward 5)—are considered to be food deserts [72]. Private and public forms of UA can increase food availability in such food deserts through self-provisioning in home and community gardens and through the distribution of food from urban farms. To search for suitable areas for the development of UA on private property, we began with the Suitable Ground Area for UA dashboard, which shows current UGI at the parcel level as circles color-coded by UGI category and parcels shaded to indicate potential ground-level UA area, from light tan (small potential area) to dark (large potential area) brown. Parcels with no suitable area are rendered in white.
We zoomed into the adjoining Hillsdale and Barry Farm neighborhoods in Ward 8 for our analysis. Using the Existing Land Use Index Map for the District [73], we identified an area containing low, medium, and high density residential, multi-use, institutional, and vacant parcels under private ownership (Figure 5A,B). Area 2 in our focal neighborhoods, bounded by Stanton Rd SE, Douglas Rd SE, and Bryan Pl SE, is a medium (orange color) and high density (dark brown) residential area (Figure 5A), indicating potentially high demand for fresh produce from UA, which could be sold at commercial outlets in the nearby mixed-use district (in pink in Figure 5A) in addition to on-site use, sales, and distribution. Vacant parcels (white in Figure 5A) in this neighborhood may be amenable to and available for UA, and several other properties have a range of UA potential as depicted by the brown color gradient in Figure 5B, potentially supporting UA at different scales and in different contexts. Hovering over the three parcels in area 2 in the dashboard reveals a combined area of approximately 0.2 ha suitable for ground-level agriculture and 0.2 ha suitable for rooftop production. Using the parcel SSLs, we obtained more information from the DC official zoning map [74] such as owner address, ward council member, and chairperson of the Advisory Neighborhood Commission (ANC), which can be helpful for obtaining permission to use the land for UA and for mobilizing community support. (Each ward is divided into multiple ANCs, which advise the District government on issues of neighborhood concern.) All three parcels have the same owner.
The vacant land use category includes improved but vacant and abandoned parcels, potentially with buildings, in addition to unimproved parcels. Consequently, parcels depicted as vacant in Figure 5A may not have land with ground-level UA potential per Figure 5B. Instead, the parcels in Figure 5B appear to have high potential for rooftop agriculture, indicating the presence of vacant and abandoned buildings which could be used for indoor agriculture, a topic not discussed in this paper. The same method used to identify parcels with ground-level UA potential can also be used to identify those with rooftop UA potential. Area 3 in Figure 5A,B also encompasses medium- and high-density residential parcels, which not only offer a potential customer base for UA production but also have a high potential for ground-level and rooftop agriculture as seen in Figure 5B and confirmed via parcel details in the Tableau dashboard. A nearby parcel (1 in Figure 5A,B) has existing UA (indicated by the red circle), which could serve as a nucleation point for additional UA projects in the neighborhood, which overall has very high potential for new rooftop and ground-level UA.
Row houses, or attached single-family dwellings, are a typical form of housing in the District, and associated yard space and rooftops offer opportunities for provisioning at the household, block, or neighborhood scale. Area 4 in Figure 5A,B encompasses several such dwellings. Individually, these parcels have less area suitable for UA, but collectively, they still offer substantial potential for the development of mostly ground-level agriculture through one of several models, including cultivation by the household or yard sharing, in which urban farmers rent or use yard space from private property owners.

3.3.3. Planning for UA on Publicly Owned Land

In this scenario, we demonstrate the use of the Tableau dashboards to identify publicly owned land for larger-scale UA development such as urban farms, which have been encouraged by the District as part of its efforts to develop a resilient food system through food production on vacant lands under District ownership. Community engagement is critical at this level of planning, including building and maintaining support. ANCs, Neighborhood Civic Associations, and residents/local businesses near a proposed UA site are all potential stakeholders and sources of valuable input and support, and partnerships can be cultivated through a community benefit plan and implementation strategy addressing District objectives. Public programming can also help build support and should include educational programming addressing, for example, healthy living and childhood and community development.
In the following section, we demonstrate how to use the Tableau dashboards to identify several potential sites for larger-scale UA on public land in the Kingman Park neighborhood, for which the District has solicited proposals and applications for urban farms. Kingman Park is bounded by the Anacostia, Trinidad, Stanton, and Lincoln Park neighborhoods in northeast DC. Using the Suitable Ground Area for UA dashboard, we found several parcels in the neighborhood with existing UA, mostly on District-owned land, and a number of parcels across the neighborhood with UA potential, including a District-owned parcel at 1613 Kramer Street NE (see arrow to the left of the oval in Figure 6A,B) which is available for UA per a District request for proposals for urban farms. However, the Kramer Street parcel is contaminated with arsenic according to the District, necessitating raised beds or some other contaminant mitigation strategy.
Between 17th and 19th Streets on E Street, four District-owned properties, circumscribed by an oval in Figure 6A,B, have approximately 0.26 ha of area suitable for ground-level UA. The Monument Academy Public Charter School, located at 500 19th Street NE, has 0.05 ha of ground-level area and about 0.29 ha of rooftop area with UA potential, making it highly desirable to develop a school garden with a family food share program. The three adjoining District-owned parcels on 17th Street SE are shown as parks and open space on the District’s Property Quest website [75]. Together, these three parcels have about 0.21 ha of area apparently suitable for ground-level UA and 0.02 ha of rooftop suitable for UA. However, cross-checking with a Google Earth image of the site from January 2021 indicates these parcels are the location of a recreation center, a neighborhood library, and a turf field (excluded from suitable UA area), making a site visit necessary to assess the true potential of the parcels for UA.
Other sites with UA potential include Eliot-Hine Middle School, athletic fields to the south of the school, Eastern Senior High School, and AppleTree Early Learning Public Charter School (PCS), numbered 1–4, respectively, in Figure 6A,B. All of these parcels are District owned. Sites 1–3 have almost 1.2 ha of area suitable for ground-level agriculture and 1.7 ha of potential rooftop UA area. Located one block north of AppleTree Early Learning PCS (site 4 in the figures), the Kingman Park-Rosedale Community Garden is thriving with over 40 plots rented by members, including a plot set aside for AppleTree students [76]. The school site itself has over 0.05 ha of ground-level and about 0.29 ha of rooftop area suitable for UA. Operating a school or community garden on the site itself would offer several benefits, including enhanced food security and educational enrichment.

3.3.4. Study Limitations

Because the GIS and suitability models are based on existing, publicly available datasets, analyses are limited by the quality of the input layers. No public, fine-scale tree canopy layer is available for the District; the precision of canopy estimates in the tree-canopy-by-parcel layer is 0.01 acre (0.004 ha). The impervious surface layer does not document sealed surfaces such as driveways, sidewalks, and parking areas on residential lots, possibly leading to overestimates of potential UGI area and suitable ground area for UA. At the same time, such impervious surfaces could be replaced with permeable paving, a form of UGI, or could serve as the basis for cap-and-fill or raised-bed UA, a common UA production practice [77,78], or even hydroponic systems.
The study may underestimate existing UGI area, because it was calculated based on tree canopy area and the area of existing UGI projects documented in Open Data DC GIS layers. The BMP layer from Open Data DC includes only projects developed under District UGI programs (Stormwater Retention Credit (SRC) trading program [42], RiverSmart Homes program [43], RiverSmart Rooftops program [44], and RiverSmart Rewards stormwater fee discount program [45]). Moreover, area was missing from the layer for some UGI types. In addition, public data layers document only urban farms and community gardens. Research suggests that home gardens, an often overlooked form of UA, make a substantial contribution to urban food systems [79]. While the rooftop suitability model deducted existing green roof area from building footprint area to calculate net roof area with UA potential, a data layer documenting solar panel area for the District was not available through Open Data DC. Consequently, the model may overestimate potential rooftop UA area.
Participatory mapping of UGI in the District, including UA, could improve area estimates while also engaging the public more directly in planning. A public-use mapping application could be linked to the Tableau databases as a first step in creating a public participation GIS (PPGIS) for the District, including even socio-perceptual data on existing UGI. PPGIS has diverse potential benefits, including refinement of expert estimates, identification of overlooked sites, and increased public engagement [80].
The development of e-tools for UGI planning is in its infancy. Future research could assess the use of the Tableau dashboards developed for this project by the public and planners and their effectiveness in real-life UGI planning.

4. Conclusions

In this study we developed a GIS integrating data on existing and potential UGI in Washington, DC and adapted existing business intelligence software, Tableau, to create a public-use e-tool to facilitate bottom-up UGI development and collaboration between the public and planners. As do many cities worldwide, the District needs to expand UGI to meet sustainability goals for stormwater management, tree canopy expansion, and local food production. Project results indicate the District has ample private and public land to meet these goals—2734 ha for new UGI development, 1372 ha with potential for ground-level UA, and 1203 ha of potential rooftop UA area, with the largest total areas suitable for UA in the poorest—and most food-insecure—neighborhoods in the city. The District needs to ensure that the implementation of new UGI not only does not exacerbate any existing inequities—to be identified in future GIS analyses of patterns in the distribution of existing UGI and potential UGI area—but in fact seeks to redress those inequities through participatory planning processes. E-tools can potentially facilitate these processes by engaging diverse users—each with unique multifunctional UGI planning needs and interests—through interactive visualizations [11]. Results from this research, we hope, can inform and inspire the development of similar e-tools for UGI planning in other cities.

Supplementary Materials

The following are available online at https://0-www-mdpi-com.brum.beds.ac.uk/article/10.3390/su13158390/s1, Tableau workbook for Washington, DC UGI dashboards.

Author Contributions

Conceptualization, J.R.T., M.H. and M.L.R.; methodology, J.R.T. and L.M.; formal analysis, J.R.T. and L.M.; writing—original draft preparation, J.R.T.; writing—review and editing, M.H., L.M., B.S. and M.L.R.; visualization, J.R.T.; project administration, B.S. and M.L.R.; funding acquisition, M.L.R. All authors have read and agreed to the published version of the manuscript.

Funding

This project was funded through the University of the District of Columbia Agricultural Experiment Station funds from USDA-NIFA.

Institutional Review Board Statement

Not applicable.

Informed Consent Statement

Not applicable.

Data Availability Statement

The data presented in this study are available on request from the corresponding author.

Acknowledgments

We thank Diego Lahaye at UDC for measuring school gardens in the District and Pete Aniello and Taj Schottland at TPL for their contributions of ideas and methods.

Conflicts of Interest

The authors declare no conflict of interest. The funders had no role in the design of the study; in the collection, analyses, or interpretation of data; in the writing of the manuscript, or in the decision to publish the results.

References

  1. Garmendia, E.; Apostolopoulou, E.; Adams, W.M.; Bormpoudakis, D. Biodiversity and green infrastructure in Europe: Boundary object or ecological trap? Land Use Policy 2016, 56, 315–319. [Google Scholar] [CrossRef] [Green Version]
  2. U.S. EPA. What Is Green Infrastructure? Available online: https://www.epa.gov/green-infrastructure/what-green-infrastructure (accessed on 28 April 2021).
  3. ASLA. Green Infrastructure: Overview. Available online: https://www.asla.org/ContentDetail.aspx?id=43532 (accessed on 28 April 2021).
  4. Lovell, S.T.; Taylor, J.R. Supplying urban ecosystem services through multifunctional green infrastructure in the United States. Landsc. Ecol. 2013, 28, 1447–1463. [Google Scholar] [CrossRef]
  5. European Commission. Green Infrastructure (GI)—Enhancing Europe’s Natural Capital; European Commission: Brussels, Belgium, 2013. [Google Scholar]
  6. Pulighe, G.; Fava, F.; Lupia, F. Insights and opportunities from mapping ecosystem services of urban green spaces and potentials in planning. Ecosyst. Serv. 2016, 22, 1–10. [Google Scholar] [CrossRef]
  7. Lovell, S.T. Multifunctional urban agriculture for sustainable land use planning in the United States. Sustainability 2010, 2, 2499–2522. [Google Scholar] [CrossRef] [Green Version]
  8. Mell, I.C. Can green infrastructure promote urban sustainability? Eng. Sustain. 2009, 162, 23–34. [Google Scholar]
  9. Meerow, S.; Newell, J.P. Spatial planning for multifunctional green infrastructure: Growing resilience in Detroit. Landsc. Urban Plan. 2017, 159, 62–75. [Google Scholar] [CrossRef]
  10. Hansen, R.; Olafsson, A.S.; van der Jagt, A.P.; Rall, E.; Pauleit, S. Planning multifunctional green infrastructure for compact cities: What is the state of practice? Ecol. Indic. 2019, 96, 99–110. [Google Scholar] [CrossRef]
  11. Steen Møller, M.; Stahl Olafsson, A. The use of e-tools to engage citizens in urban green infrastructure governance: Where do we stand and where are we going? Sustainability 2018, 10, 3513. [Google Scholar] [CrossRef] [Green Version]
  12. Beninde, J.; Veith, M.; Hochkirch, A. Biodiversity in cities needs space: A meta-analysis of factors determining intra-urban biodiversity variation. Ecol. Lett. 2015, 18, 581–592. [Google Scholar] [CrossRef]
  13. Sørup, H.J.D.; Lerer, S.M. Principles for distributing infiltration-based stormwater control measures in series. Water 2021, 13, 1029. [Google Scholar] [CrossRef]
  14. Lynch, A.J. Creating effective urban greenways and stepping-stones: Four critical gaps in habitat connectivity planning research. J. Plan. Lit. 2019, 34, 131–155. [Google Scholar] [CrossRef]
  15. Maller, C.J.; Henderson-Wilson, C.; Townsend, M. Rediscovering nature in everyday settings: Or how to create healthy environments and healthy people. EcoHealth 2009, 6, 553–556. [Google Scholar] [CrossRef]
  16. Artmann, M.; Kohler, M.; Meinel, G.; Gan, J.; Ioja, I.-C. How smart growth and green infrastructure can mutually support each other—A conceptual framework for compact and green cities. Ecol. Indic. 2019, 96, 10–22. [Google Scholar] [CrossRef]
  17. Buijs, A.; Hansen, R.; Van der Jagt, S.; Ambrose-Oji, B.; Elands, B.; Rall, E.L.; Mattijssen, T.; Pauleit, S.; Runhaar, H.; Olafsson, A.S. Mosaic governance for urban green infrastructure: Upscaling active citizenship from a local government perspective. Urban For. Urban Green. 2019, 40, 53–62. [Google Scholar] [CrossRef]
  18. Vaňo, S.; Olafsson, A.S.; Mederly, P. Advancing urban green infrastructure through participatory integrated planning: A case from Slovakia. Urban For. Urban Green. 2021, 58, 126957. [Google Scholar] [CrossRef]
  19. Fox-Kämper, R.; Wesener, A.; Münderlein, D.; Sondermann, M.; McWilliam, W.; Kirk, N. Urban community gardens: An evaluation of governance approaches and related enablers and barriers at different development stages. Landsc. Urban Plan. 2018, 170, 59–68. [Google Scholar] [CrossRef]
  20. Wilker, J.; Rusche, K.; Rymsa-Fitschen, C. Improving participation in green infrastructure planning. Plan. Pract. Res. 2016, 31, 229–249. [Google Scholar] [CrossRef]
  21. Krasny, M.E.; Russ, A.; Tidball, K.G.; Elmqvist, T. Civic ecology practices: Participatory approaches to generating and measuring ecosystem services in cities. Ecosyst. Serv. 2014, 7, 177–186. [Google Scholar] [CrossRef] [Green Version]
  22. Møller, M.S.; Olafsson, A.S.; Vierikko, K.; Sehested, K.; Elands, B.; Buijs, A.; van den Bosch, C.K. Participation through place-based e-tools: A valuable resource for urban green infrastructure governance? Urban For. Urban Green. 2019, 40, 245–253. [Google Scholar] [CrossRef]
  23. Esri Inc. ArcGIS Pro (2.7). Available online: https://pro.arcgis.com/en/pro-app/latest/get-started/get-started.htm (accessed on 12 February 2021).
  24. Tableau Software LLC. Meet the World’s Leading Analytics Platform. Available online: https://www.tableau.com/ (accessed on 29 April 2021).
  25. District of Columbia. Open Data DC. Available online: https://opendata.dc.gov/ (accessed on 29 April 2021).
  26. U.S. EPA. EJSCREEN: Environmental Justice Screening and Mapping Tool. Available online: https://www.epa.gov/ejscreen (accessed on 29 April 2021).
  27. Liu, D.; Kwan, M.-P.; Kan, Z. Analysis of urban green space accessibility and distribution inequity in the City of Chicago. Urban For. Urban Green. 2021, 59, 127029. [Google Scholar] [CrossRef]
  28. U.S. Census Bureau. QuickFacts: District of Columbia. Available online: https://www.census.gov/quickfacts/DC (accessed on 29 April 2021).
  29. Gibson, C.; Jung, K. Historical Census Statistics on Population Totals by Race, 1790 to 1990, and by Hispanic Origin, 1970 to 1990, for the United States, Regions, Divisions, and States; US Census Bureau: Washington, DC, USA, 2002. [Google Scholar]
  30. BEA. Real Personal Income by State and Metropolitan Area. 2019. Available online: https://www.bea.gov/news/2020/real-personal-income-state-and-metropolitan-area-2019 (accessed on 29 April 2021).
  31. DC Health Matters. 2021 Demographics. Available online: https://www.dchealthmatters.org/demographicdata?id=131495 (accessed on 29 April 2021).
  32. U.S. EPA. Chesapeake Bay Total Maximum Daily Load (TMDL). Available online: https://www.epa.gov/chesapeake-bay-tmdl (accessed on 29 April 2021).
  33. District of Columbia. Total Maximum Daily Load (TMDL) Documents. Available online: https://doee.dc.gov/service/total-maximum-daily-load-tmdl-documents (accessed on 29 April 2021).
  34. U.S. EPA. DC Utilizes Green Infrastructure to Manage Stormwater. Available online: https://www.epa.gov/arc-x/dc-utilizes-green-infrastructure-manage-stormwater (accessed on 29 April 2021).
  35. DOEE. Stormwater Management. Available online: https://doee.dc.gov/service/stormwater-management (accessed on 29 April 2021).
  36. NOAA. DCA Normals, Means, and Extremes. Available online: https://www.weather.gov/lwx/dcanme (accessed on 29 April 2021).
  37. NOAA. Washington, DC Precipitation; NOAA: Washington, DC, USA, 2021. [Google Scholar]
  38. Sexton, J.O.; Song, X.-P.; Huang, C.; Channan, S.; Baker, M.E.; Townshend, J.R. Urban growth of the Washington, DC–Baltimore, MD metropolitan region from 1984 to 2010 by annual, Landsat-based estimates of impervious cover. Remote Sens. Environ. 2013, 129, 42–53. [Google Scholar] [CrossRef]
  39. DOEE. District of Columbia Urban Tree Canopy Plan; DOEE: Washington, DC, USA, 2013. [Google Scholar]
  40. Open Data DC. Urban Tree Canopy at the Parcel Level in 2015; Open Data DC: Washington, DC, USA, 2020. [Google Scholar]
  41. Open Data DC. Best Management Practices; Open Data DC: Washington, DC, USA, 2021. [Google Scholar]
  42. District of Columbia. Stormwater Retention Credit Trading Program. Available online: https://doee.dc.gov/src (accessed on 10 April 2021).
  43. DOEE. RiverSmart Homes Program. Available online: https://doee.dc.gov/service/riversmart-homes (accessed on 10 April 2021).
  44. DOEE. Get RiverSmart! Available online: https://doee.dc.gov/greenroofs (accessed on 9 April 2021).
  45. DOEE. RiverSmart Rewards and Clean Rivers IAC Incentive Programs. Available online: https://doee.dc.gov/riversmartrewards (accessed on 9 April 2021).
  46. Open Data DC. Green Sites and Amenities; Open Data DC: Washington, DC, USA, 2019; Volume 2020. [Google Scholar]
  47. Open Data DC. Urban Agriculture Areas Polygons; Open Data DC: Washington, DC, USA, 2019. [Google Scholar]
  48. Open Data DC. Community Gardens Polygons; Open Data DC: Washington, DC, USA, 2018. [Google Scholar]
  49. Open Data DC. School Gardens; Open Data DC: Washington, DC, USA, 2018. [Google Scholar]
  50. Open Data DC. Ward from 2012; Open Data DC: Washington, DC, USA, 2021. [Google Scholar]
  51. Open Data DC. Zoning Regulations of 2016; Open Data DC: Washington, DC, USA, 2019. [Google Scholar]
  52. Open Data DC. Low Food Access Areas; Open Data DC: Washington, DC, USA, 2019. [Google Scholar]
  53. Open Data DC. 2020 LiDAR—Normalized Digital Surface Model (nDSM)—Mosaic; Open Data DC: Washington, DC, USA, 2021. [Google Scholar]
  54. Open Data DC. Impervious Surface 2019; Open Data DC: Washington, DC, USA, 2020. [Google Scholar]
  55. Open Data DC. Cemeteries; Open Data DC: Washington, DC, USA, 2015. [Google Scholar]
  56. Open Data DC. Recreational Fields; Open Data DC: Washington, DC, USA, 2020. [Google Scholar]
  57. Open Data DC. Railroads; Open Data DC: Washington, DC, USA, 2020. [Google Scholar]
  58. Open Data DC. Golf Courses; Open Data DC: Washington, DC, USA, 2019. [Google Scholar]
  59. Open Data DC. Historic Landmark Sites; Open Data DC: Washington, DC, USA, 2020. [Google Scholar]
  60. Open Data DC. Waterbodies; Open Data DC: Washington, DC, USA, 2020. [Google Scholar]
  61. Open Data DC. Wetland Inventory; Open Data DC: Washington, DC, USA, 2021. [Google Scholar]
  62. Saha, M.; Eckelman, M.J. Growing fresh fruits and vegetables in an urban landscape: A geospatial assessment of ground level and rooftop urban agriculture potential in Boston, USA. Landsc. Urban Plan. 2017, 165, 130–141. [Google Scholar] [CrossRef]
  63. Open Data DC. 2020 LiDAR—Digital Surface Model (DSM)—Mosaic; Open Data DC: Washington, DC, USA, 2021. [Google Scholar]
  64. Open Data DC. Building Footprints; Open Data DC: Washington, DC, USA, 2020. [Google Scholar]
  65. Richardson, J.J.; Moskal, L.M. Urban food crop production capacity and competition with the urban forest. Urban For. Urban Green. 2016, 15, 58–64. [Google Scholar] [CrossRef] [Green Version]
  66. Open Data DC. 2020 LiDAR—Hydro Enforced Digital Terrain Model (DTM)—Mosaic; Open Data DC: Washington, DC, USA, 2021. [Google Scholar]
  67. Tableau Software LLC. Tableau Mission. Available online: https://www.tableau.com/about/mission (accessed on 29 April 2021).
  68. Open Data DC. Urban Tree Canopy by Single Member District in 2015; Open Data DC: Washington, DC, USA, 2020. [Google Scholar]
  69. Willett, W.; Rockström, J.; Loken, B.; Springmann, M.; Lang, T.; Vermeulen, S.; Garnett, T.; Tilman, D.; DeClerck, F.; Wood, A. Food in the Anthropocene: The EAT–Lancet Commission on healthy diets from sustainable food systems. Lancet 2019, 393, 447–492. [Google Scholar] [CrossRef]
  70. District of Columbia. Sustainable DC 2.0 Plan. Available online: https://sustainable.dc.gov/sdc2 (accessed on 12 January 2021).
  71. Gundersen, C.; Ziliak, J.P. Food insecurity research in the United States: Where we have been and where we need to go. Appl. Econ. Perspect. Policy 2018, 40, 119–135. [Google Scholar] [CrossRef] [Green Version]
  72. Smith, R. Food Access in D.C Is Deeply Connected to Poverty and Transportation. Available online: https://www.dcpolicycenter.org/publications/food-access-dc-deeply-connected-poverty-transportation/ (accessed on 10 January 2021).
  73. District of Columbia. Existing Land Use Maps. Available online: https://planning.dc.gov/page/existing-land-use-maps (accessed on 21 January 2021).
  74. District of Columbia. Zoning Maps of the District of Columbia. Available online: https://dcoz.dc.gov/page/zoning-maps-district-columbia (accessed on 21 January 2021).
  75. District of Columbia. PropertyQuest. Available online: https://propertyquest.dc.gov/# (accessed on 16 January 2021).
  76. Kingman Park-Rosedale Community Garden. Available online: https://kprgarden.org/ (accessed on 14 January 2021).
  77. Miernicki, E.A.; Lovell, S.T.; Wortman, S.E. Raised beds for vegetable production in Urban agriculture. Urban Agric. Reg. Food Syst. 2018, 3, 1–10. [Google Scholar] [CrossRef] [Green Version]
  78. Ugarte, C.M.; Taylor, J.R. Chemical and biological indicators of soil health in Chicago urban gardens and farms. Urban Agric. Reg. Food Syst. 2020, 5, e20004. [Google Scholar]
  79. Taylor, J.R.; Lovell, S.T. Mapping public and private spaces of urban agriculture in Chicago through the analysis of high-resolution aerial images in Google Earth. Landsc. Urban Plan. 2012, 108, 57–70. [Google Scholar] [CrossRef]
  80. Rall, E.; Hansen, R.; Pauleit, S. The added value of public participation GIS (PPGIS) for urban green infrastructure planning. Urban For. Urban Green. 2019, 40, 264–274. [Google Scholar] [CrossRef]
Figure 1. Tableau dashboard map for area in Washington, DC showing existing green infrastructure (GI) and suitable ground area for urban agriculture. Existing GI is color coded by category, which is identified by the tooltip when the cursor is hovered over the UGI point.
Sustainability 13 08390 g001
Figure 2. Hovering over a parcel on the dashboard map reveals detailed information about the property in the tooltip, including existing GI area, tree canopy area, potential GI area, and suitable ground and rooftop area for UA.
Sustainability 13 08390 g002
Figure 3. Top 100 parcels with ground area suitable for agriculture—excluding national parks—in Washington, DC by ward and property ownership type.
Sustainability 13 08390 g003
Figure 4. Low food access areas in low-income census block groups in Ward 7 in Washington, DC, with suitable ground area for urban agriculture.
Sustainability 13 08390 g004
Figure 5. (A) Washington, DC Existing Land Use Index Map for selected low-income neighborhood in the Barry Farm neighborhood in Ward 8. 1 = District-owned educational institution. 2, 3, and 4 = Properties with high, medium, and low-medium density residences. (B) Map from the Tableau dashboard for suitable ground area for urban agriculture showing the same area in Washington, DC as in Figure 5. Note the gradient in color depicting ground agriculture potential with deeper shade correlating with higher potential. 1 = Existing UA (red circle) associated with District-owned educational institution in the Barry Farm neighborhood.
Sustainability 13 08390 g005
Figure 6. (A) Washington, DC Existing Land Use Index Map 11 for selected area in the Kingman Park neighborhood in Ward 6. Oval, arrow, and numbers within figure: oval = three District-owned Rosedale properties and an educational center (lower right). Red arrow to left of oval points to a District-owned parcel at 1613 Kramer Street NE available for community or commercial UA. Parcel 1 = Eliot-Hine Middle School; 2 = district-owned parcels with athletic fields; 3 = Eastern Senior High School; and 4 = district-owned Appletree Early Learning PCS. Image of map 11 in the Existing Land Use Index Map available on the DC Office of Planning website (District of Columbia, n.d.-b). (B) Map from the Tableau dashboard for suitable ground area for urban agriculture showing the same area in Washington, DC as in Figure 6A. The red circle next to 3 shows existing ground-level UA.
Sustainability 13 08390 g006
Table 1. Counts of 15 categories of existing urban green infrastructure projects in Washington, DC by ward.
Existing GI CategoryCount by Ward
12345678Total
Tree planting/preservation2781281070186416096515944096603
Rainwater harvesting26495847203016104777793336435
Bioretention1332163396086516914105393587
Green roof260585121125220785114672277
BayScaping11892035324171353441541912
Permeable pavement1061101852742443991841301632
Infiltration5413302845361128211906
Impervious surface disconnection62010722959284220511
Urban agriculture2211213040423126223
Open channel36231725273126158
Ponds00504121325
Land cover change0801321722
Stream restoration0042009116
CDA to a shared BMP0020230411
Wetlands001021004
Total1244120132305796493933032669194024,322
Table 2. Area of existing and potential urban green infrastructure in Washington, DC by ward and UGI type.
UGI CategoryArea in Hectares by Ward
12345678Total
Existing GI project area9191817223017 18150
Tree canopy area *149471163311488503028917216165
Total existing GI area158490165111658723329087396315
Potential GI area721053233635361905226232734
Suitable area for ground UA3249113146286882773811372
Suitable area for rooftop UA1221511181262321921111511203
* Calculated from the Urban Tree Canopy by Single Member District in 2015 feature layer from Open Data DC [68]. With some exceptions, single member districts are contained wholly within a single ward.
Publisher’s Note: MDPI stays neutral with regard to jurisdictional claims in published maps and institutional affiliations.

