Article

Scale Characteristics and Optimization of Park Green Space in Megacities Based on the Fractal Measurement Model: A Case Study of Beijing, Shanghai, Guangzhou, and Shenzhen

1
Key Laboratory of New Technology for Construction of Cities in Mountain Area of Education Ministry, Faculty of Architecture and Urban Planning, Chongqing University, Chongqing 400045, China
2
Guangzhou Urban Planning & Design Survey Research Institute, Guangzhou 510060, China
*
Author to whom correspondence should be addressed.
Sustainability 2021, 13(15), 8554; https://0-doi-org.brum.beds.ac.uk/10.3390/su13158554
Submission received: 22 May 2021 / Revised: 27 July 2021 / Accepted: 28 July 2021 / Published: 31 July 2021

Abstract

:
This paper applies fractal theory to research of green space in megacity parks due to the lack of a sufficient qualitative description of the scale structure of park green space, a quantifiable evaluation system, and operable planning methods in traditional studies. Taking Beijing, Shanghai, Guangzhou, and Shenzhen as examples, GIS spatial analysis technology and the Zipf model are used to calculate the fractal dimension (q), the goodness of fit (R2), and the degree of difference (C) to deeply interpret the connotation of indicators and conduct a comparative analysis between cities to reveal fractal characteristics and laws. The research results show that (1) the fractal dimension is related to the complexity of the park green space system; (2) the fractal dimension characterizes the hierarchical iteration of the park green space to a certain extent and reflects the internal order of the scale distribution; (3) the scale distribution of green space in megacity parks deviates from the ideal pyramid configuration; and (4) there are various factors affecting the scale structure of park green space, such as natural base conditions, urban spatial structure, and the continuation of historical genes working together. On this basis, a series of targeted optimization strategies are proposed.

1. Introduction

Improving the urban environment and quality of life have become important issues of public concern. Park green space, as a material carrier for public activities such as recreation, leisure, and sports [1,2], maintains urban health and safety, beautifies the environment, and improves residents’ quality of life; it is important ecological infrastructure for the construction of urban settlements [3] and a precious resource for people to experience nature up close [4]. In addition, park green space is closely related to personal and social health. It not only relieves people’s mental stress, eliminates fatigue, and lowers adult blood pressure and body mass index [5,6] but also plays a positive role in promoting human-to-human interaction and enhancing social welfare benefits [7,8]. Therefore, determining how to scientifically configure the green areas of urban parks to maximize the benefits has become a hot research field pursued by related disciplines such as urban and rural planning and landscape architecture.
Existing research mainly focuses on three aspects: benefit evaluation, structure and layout, and theory and the practice of urban park green space planning. In terms of benefit evaluation, the differences in national conditions would affect the quantitative criteria for green space evaluation. Compared with Western developed countries with earlier studies of urban green space and higher index requirements, China has basically guided urban green space construction through the three quantitative indicators of “public green space area per capita”, “green space rate”, and “green space coverage rate” and has gradually expanded to “green space rate per capita”, “park green area”, “park green area per capita”, and other evaluation indicators that can reflect the urban green space environment level. In addition to the evaluation and discussion of ecological benefits, research on the economic benefits [9,10], social benefits [11], and comprehensive benefits [12] of park green spaces is increasing. It is believed that parks have become an important place that affect the value of surrounding land, improve the quality of human settlements, and affect the happiness of citizens [13]. The role of the park extends from carrying green vegetation and providing viewing space to all aspects that affect the urban spatial pattern and quality of life. To measure the fairness of urban park green space in terms of the spatial matching between service supply and user group needs, the fairness index is introduced into the discussion framework, characterizing the rationality of the green space layout [14,15]. In addition, related studies have focused on establishing a comprehensive evaluation system of green space resources from a holistic perspective to promote the highly integrated trinity of ecology–society–economy [16]. In terms of structure and layout, existing studies mainly analyze the distribution of green spaces at different scales based on the landscape ecology background [17,18]. At the macro level, a series of indicators, such as landscape connectivity, corridor density, landscape fragmentation, diversity index, and heterogeneity, are introduced to explain the characteristics of green space layouts and provide a reference for the comprehensive evaluation of regional green space patterns. At the microlevel, the quality of urban green space structure is determined based on the composition of green plants and the configuration of the vegetation structure. In addition, many scholars have studied the evolution and optimization of green space patterns and adjusted urban green space through model building and quantitative index analysis [19] and the role they play in solving urban problems, such as alleviating urban heat island effects [20]. In terms of the theory and practice of planning, Western countries, represented by Hyde Park, New York’s Central Park, and other planning schemes, set off a city park movement to improve the environment. Then it experienced the period of reshaping the city, the period of great development after the war, the period of ecological planning, and the period of diversified modernization. Green space planning further developed from the characteristics of random layout to the systematic construction of paying attention to ecology and recreation, and finally tended to the practical exploration stage of structural networking and functional rationalization. In comparison, China has experienced four stages of urban park green space planning practice by drawing on Western theory and domestic experience. The process is slower, but the overall development is headed toward fairness and specialization.
Based on a review of the related literature, the research on park green space has extended from simple landscape architecture and urban–rural planning to cross fields such as geography and ecology, and the results are gradually enriched. However, the evaluation of park green space from the perspective of different disciplines has different preferences and different focuses, which leads to the difficulty of horizontal comparative research. In addition, the related exploration of park green space structure is carried out from the perspective of landscape ecology, most of which aims to identify and diagnose the landscape pattern within a single area. Furthermore, the comparative research between areas is insufficient, and there is a lack of structural evaluation and optimization measures based on quantitative indicators, which makes it difficult to effectively reveal potential features and patterns. Scientific studies show that when the green space coverage rate is less than 40%, the overall benefits of green space depend on the internal structure and spatial layout [21]; the contradiction between land usage and the ecological environment in megacities is particularly prominent. Green space elements are passively distributed in an economically oriented manner, making it increasingly difficult to meet the demands of high-quality residential environment construction.
In summary, on the one hand, traditional research has an insufficient qualitative description of the scale and hierarchy of parks and green spaces and lacks a set of quantifiable evaluation systems and operational planning methods. Hence, there is still room for research on the mathematical order and laws of the park system. On the other hand, it is particularly necessary to further explore the parks and green spaces of megacities. Creating a good urban environment through the allocation of green space and corresponding structural adjustments within a limited urban area has become an important issue for maintaining the balance of the urban ecosystem and maximizing resource benefits. This paper introduces the fractal theory research method, taking Beijing, Shanghai, Guangzhou, and Shenzhen as the research objects; uses GIS spatial analysis technology and the Zipf model to measure the fractal dimension value of the urban park green space scale; and deeply interprets the reflection of quantitative calculation indicators. As the basis for judging the pros and cons of the scale structure of urban parks and green spaces, it is expected to provide a reference value for promoting the sustainable optimization of park green space structure.

2. Materials and Methods

Why introduce the fractal theory? Its birth can be traced back to the famous paper “How Long is the Coast of Britain? Statistical Self-Similarity and Fractal Dimension”, published by Science in 1967. Its author, BB Mandelbrot, published the groundbreaking book Fractals: Morphological Opportunities and Dimension in 1975, marking the birth of fractal geometry as different from European geometry [22]. It has now developed into one of the three pillar theories of nonlinear science in contemporary complex systems. Only after nearly half a century has it become widely used in the fields of economics, sociology, chemistry, and management science [23,24,25,26], providing a new perspective for solving complex problems in many disciplines. The paper “Cities as Fractals: Simulating Growth and Form” in 1991 marks the expanded application of this theory in the field of urban research. Related foreign research focuses on the structure, form, transportation, and mechanism of a single city, while domestic research focuses on the urban system and overall form structure at the regional level, the spatial elements at the urban level, such as road density, square form, street landscape, green space, and urban skyline, as well as the layout and aesthetics at the architectural level.
The fractal research method, as an optimized structure of nature, is suitable for nonlinear and irregular complex shapes and phenomena and is helping cast off the past shackles of having to solve nonlinear problems with linear geometry. With the help of self-similarity and fractal dimensions (parameters to measure irregularity), the effectiveness of the space occupied by complex shapes can be characterized [27]. Through fractal theory, the scientific configuration of urban elements and the maximization of potential spatial benefits can be realized under limited resources; therefore, introducing fractal theory to study the space complexity of park green space will help continuously optimize the structure of green space and push its development toward maximum efficiency so that the park system can be continuously optimized in a limited space.

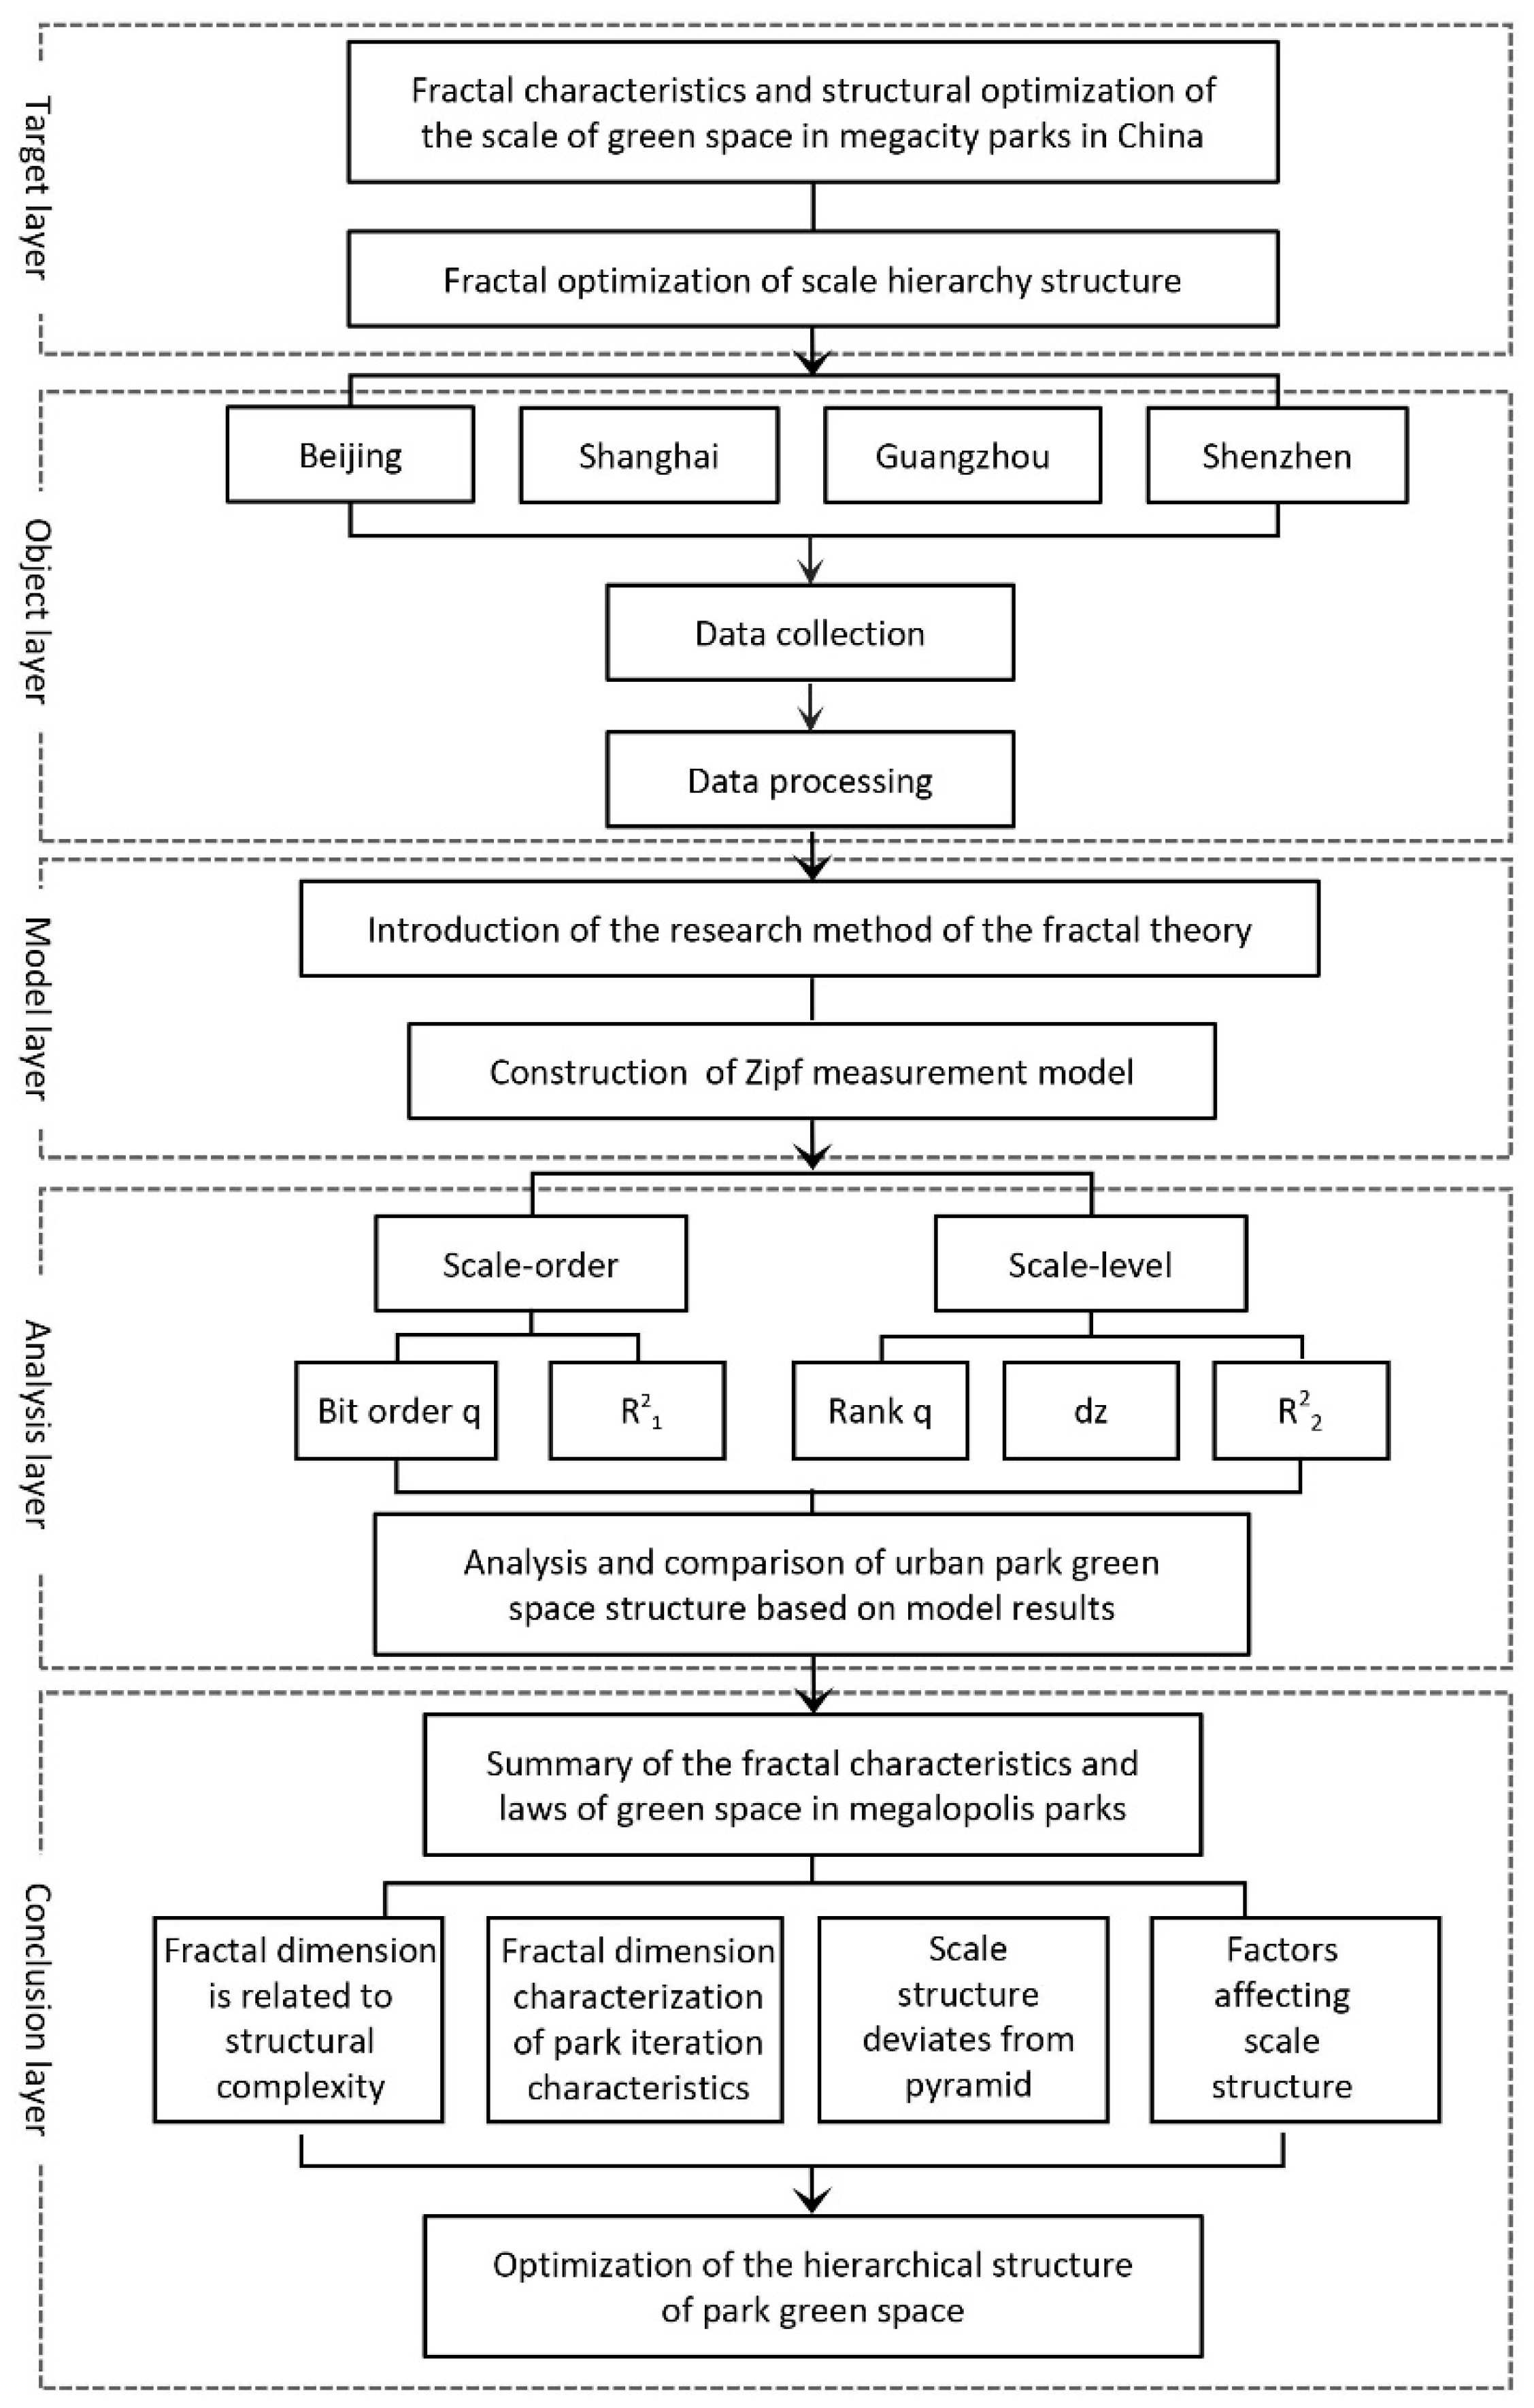
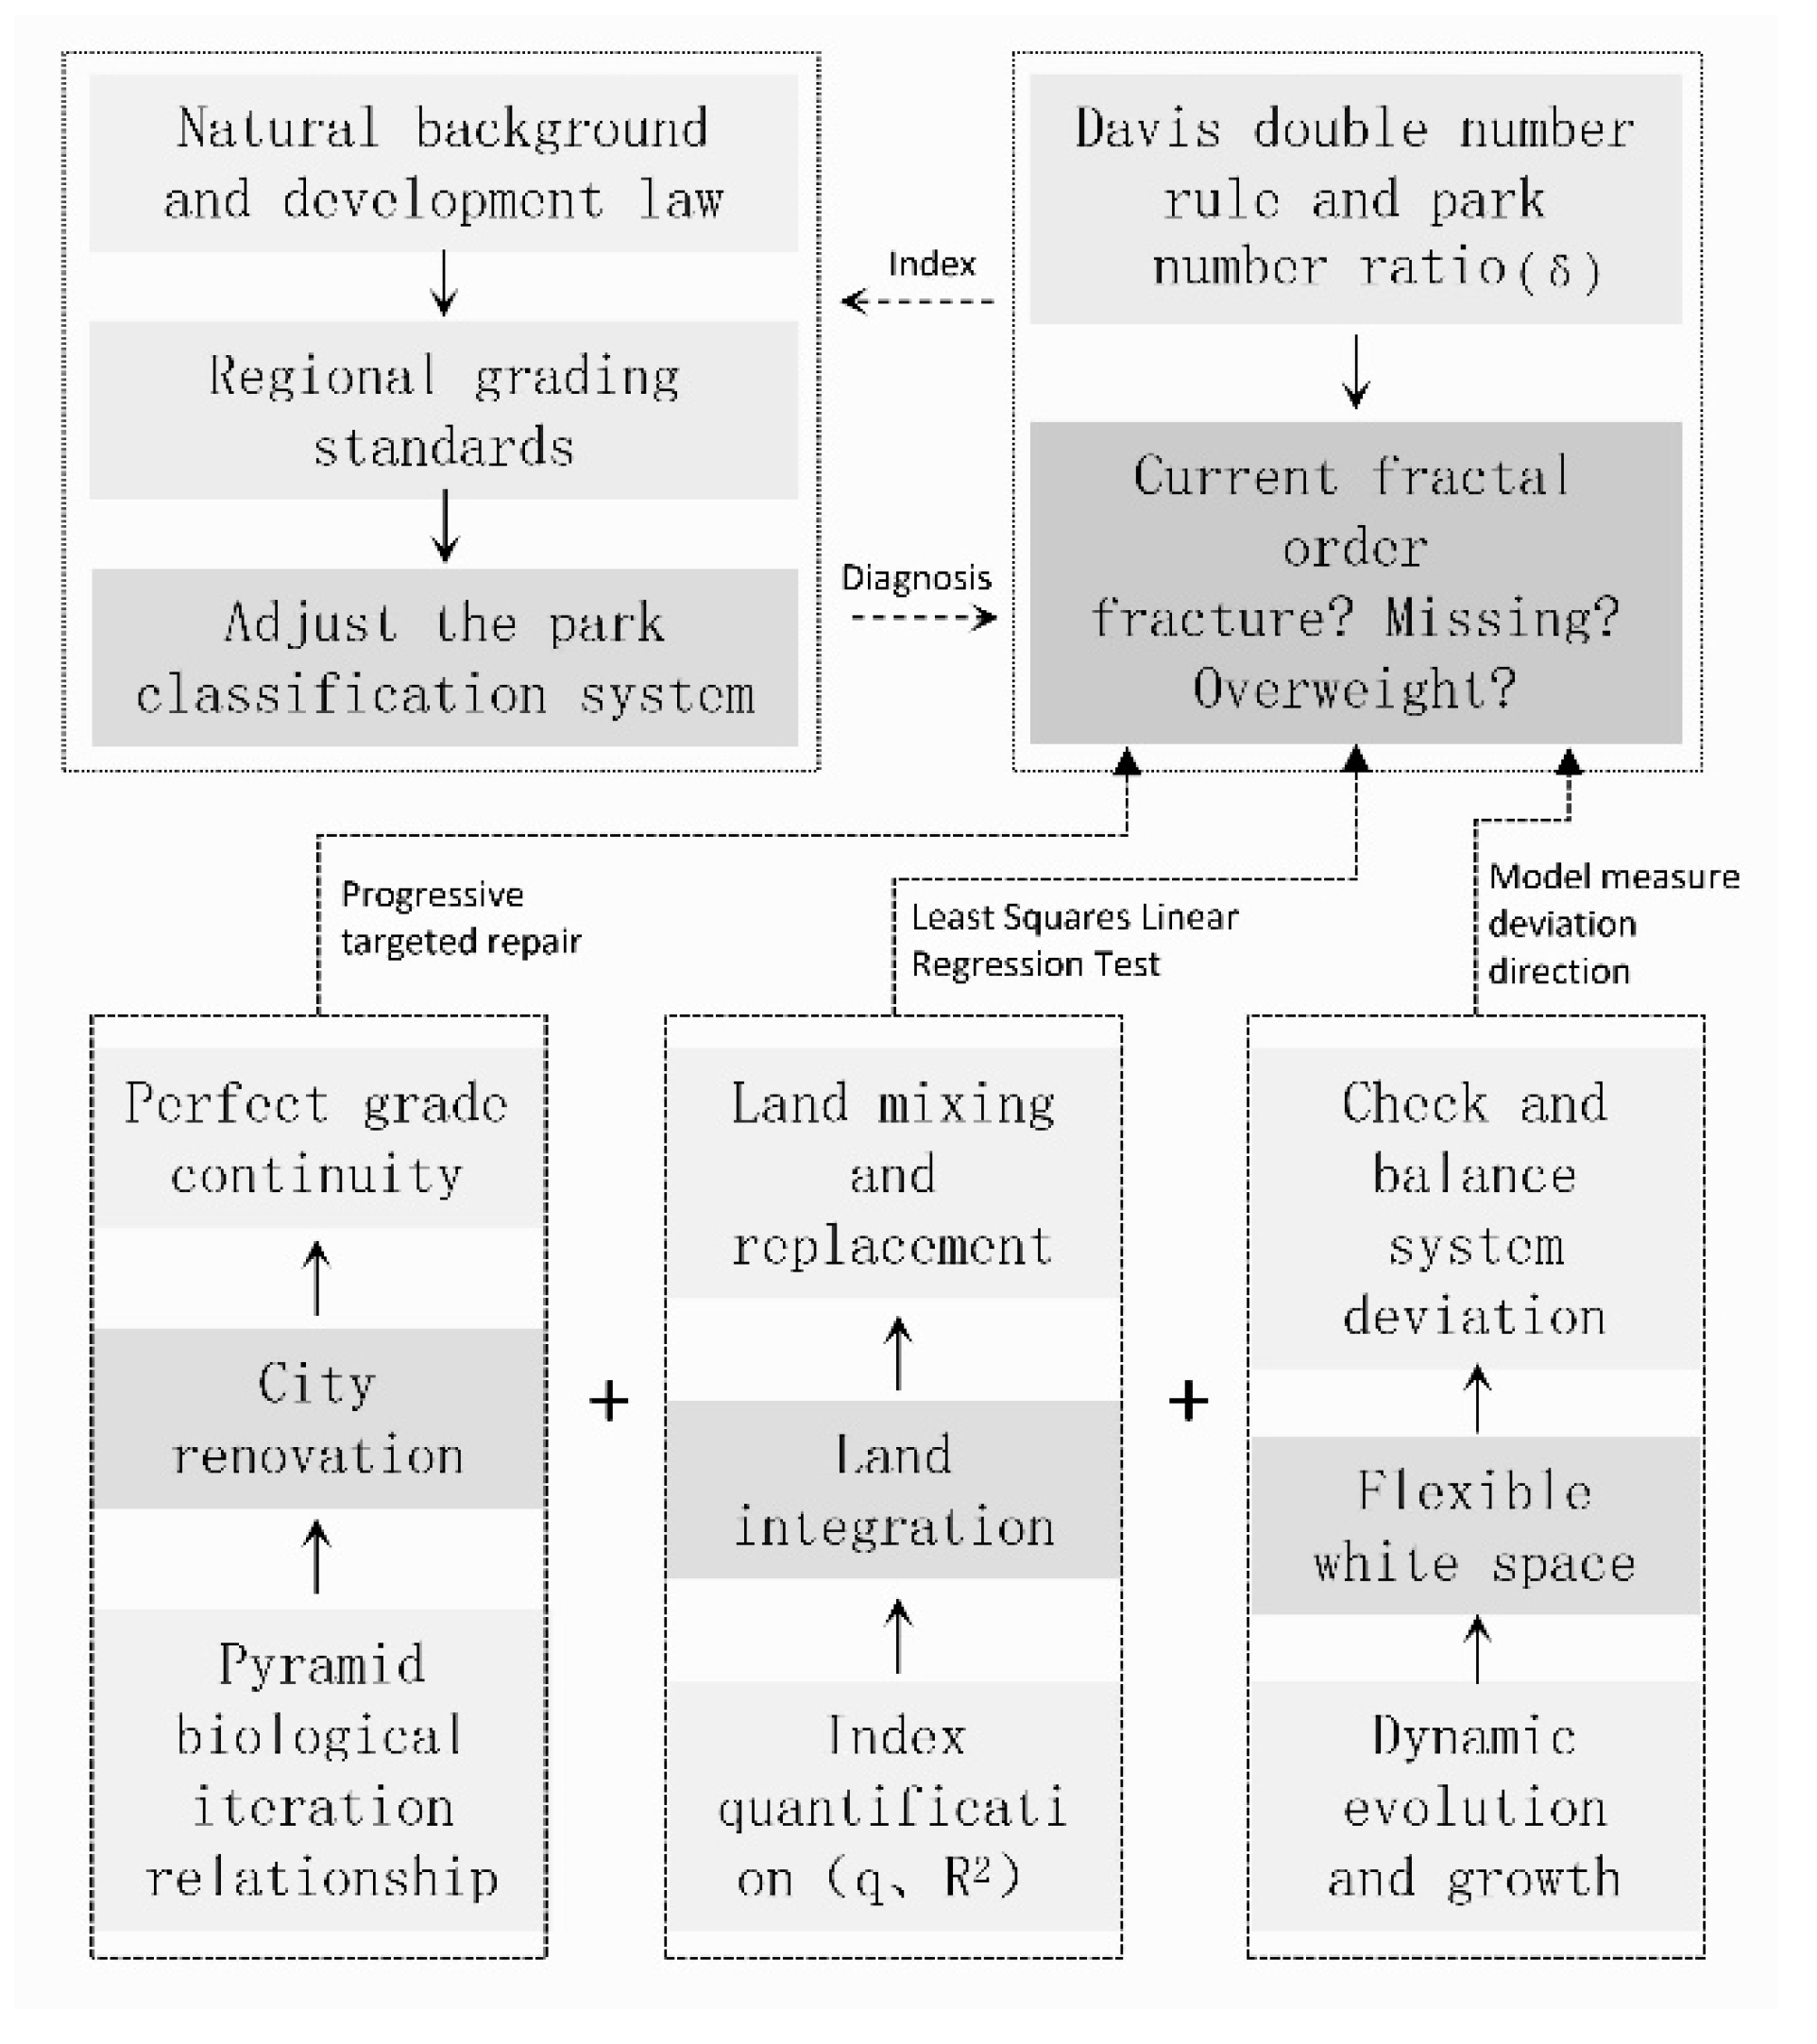
2.1. Analytical Framework

The overall research idea of this paper is divided into four steps (Figure 1): (1) Select the research object based on the principles of typicality and comparability, obtain the current status data of the corresponding city, and preprocess; (2) Introduce the research method and the fractal theory, construct the Zipf measurement model, and explain the mathematical relationship and representative meaning; (3) Based on the existing data and models, calculate the fractal dimensions of the green areas of four megacities’ parks, describe and analyze the calculation results of a single city, and carry out a comparative study among the cities, with the scale order and the scale level as the key indicators quantifying the rationality of green space structure; (4) Summarize the characteristics and optimization.

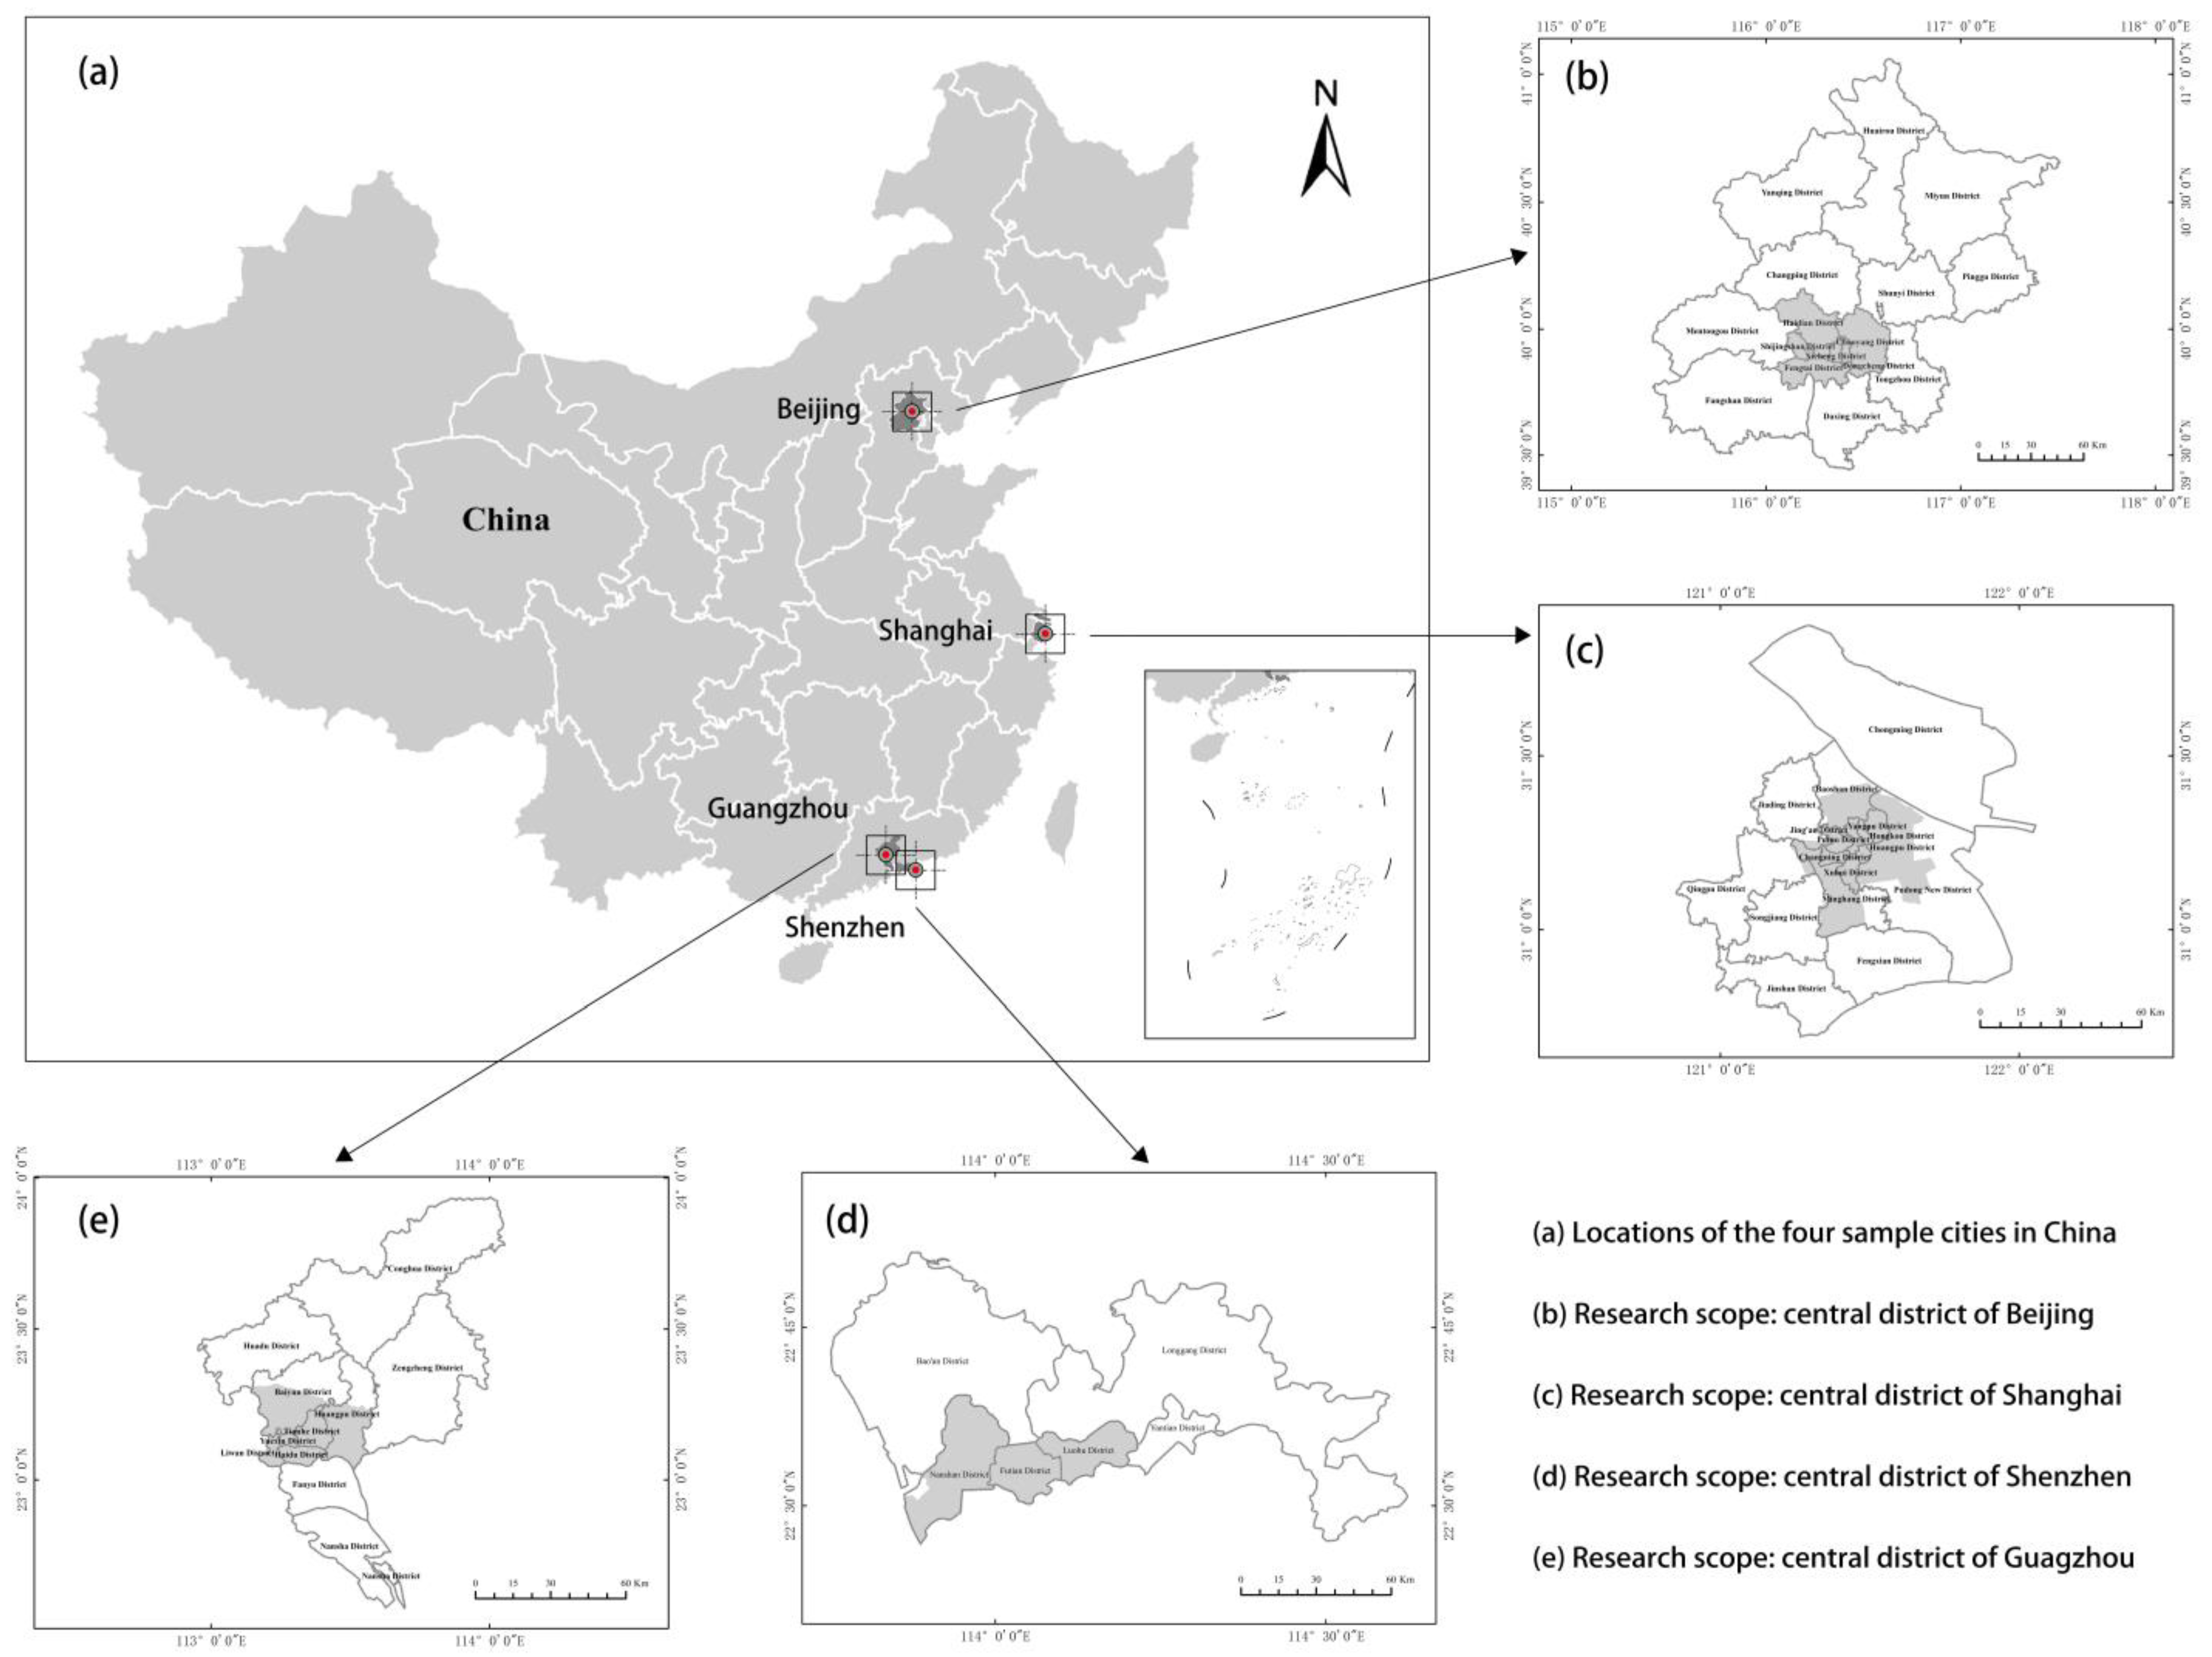
2.2. Research Object

The research object of this paper was selected based on two principles: first, that megacities exist with a relatively high level of urbanization development and a prominent contradiction between the supply of construction land and ecological environmental protection, and second, that megacities’ location distribution, geographical environment, spatial structure, and park sizes are comparable and typical. On this basis, this paper selected the green areas of central urban parks in Beijing, Shanghai, Guangzhou, and Shenzhen as data samples to extract the basic profile (Table 1). These four cities are typical representatives of megacities. They are located in North China, East China, and South China (Figure 2) and have a relatively high level of urbanization and rapid development. The geographical environment involves a variety of complex landforms, such as plains, hills, mountains, and coastal areas. The contradiction between humans and land and the demands of ecological maintenance have become the key links that restrict the quality of urban human settlements.

2.3. Data Acquisition and Processing

The data used in the present study include the current status data (2018) from remote sensing image maps within the research area (source: Geospatial Data Cloud Platform), green space vector data of electronic maps (source: Baidu map), and city master plan texts and drawings, with the texts and drawings mainly used to calibrate the scope of the central urban area and identify the nature and location of the green space.
According to the classification and provisions of urban parks in the “Park Design Specification” (GB 51192-2016), the scale of comprehensive parks should not be less than 10 hm2 (the town-level scale is smaller, preferably not less than 5 hm2); the scale of specialized parks is often larger. For example, comprehensive zoos and botanical gardens should be no less than 20 hm2 and 40 hm2, respectively (corresponding special parks should be no less than 5 hm2 and 2 hm2); a minimum scale for community parks and amusement parks has not been defined. Calculation of the total area and quantity of park green space was based on park green space of more than 0.5 hectares to meet the criteria for the quantitative study of the scale of park green space. The scale of parks and green spaces in the sample cities was graded according to the double-number rule, although the largest scale grades often differ. However, in combination with the classification of comprehensive parks, specialized parks, community parks, and amusement parks in the park design specifications, the last two levels in the classification scheme are found to be small scale, the upper three levels medium scale, and the higher 4th and 5th levels large scale. On this basis, the lower limit values of different city scales were extracted, and the average value was taken to obtain the graded scale area interval of this study (Table 2), supplemented by research.
First, the acquired data were preprocessed, which was divided into four steps: projecting and transforming the coordinate system, merging broken patches, identifying and correcting park green space, and delimiting the central city. Second, the green patch area was calculated through ArcGIS, and the data above 0.5 hectares were filtered and sorted in descending order. Third, the processed data were input into the measurement model; power trend line fitting was performed with the double logarithmic formula; and the fractal dimension, degree of fit, and scale-free area corresponding to the order and level were calculated. Finally, we calibrated the calculation results and took the average value.

2.4. Research Methods

Common fractal dimensions include the box dimension [28], the boundary dimension [29], and the radius dimension [30,31]; the phenomena and laws described by different indicators have different emphases. Based on the comprehensive consideration of the scale-order distribution and scale-level relationships of park green space, the model with the law of Zipf was constructed as follows.

2.4.1. Scale-Order Model

The formula to describe the mathematical relationship between the size and the order of the park green space is as follows, which provides support for the next level distribution study.
P ( r ) = P 1 r q
In the formula, r is the order of the parks arranged from highest to lowest, P(r) is the scale of the urban park with rank r, P1 is the scale of the largest urban park, and q is the dimension of the order. We took the logarithm of both sides of the above formula and transformed it into:
ln P ( r ) = ln P 1 q ln r
Thus, a double logarithmic coordinate chart was drawn. The linear regression analysis was performed using least squares, and the scale-free area and fitting coefficient R12 (parameters for evaluating the fitting effect) corresponding to the order q were quantified.

2.4.2. Scale-Level Model

The following formula describes the scale distribution of park green space, takes the maximum park green space scale as the reference, and grades according to the Davis double law. It has been verified that the Davis double number law is a special case of δ = 2, that is, dz = 1. It is a special case of Zipf’s three-parameter law. It reveals the fractal dimension of dz and gives its mathematical relationship with neighbor multiples (δ): d z =   ln 2 / ln δ . The upper limit of each level is twice that of the lower limit of the scale, with the exception of the last level, that is, the lame-duck class is 0.5 hectares (according to the “Park Design Code” (CJJ 48–92) for the minimum scale of park green space). The formula is as follows:
P m = C m q
In the formula, m is the scale grade number, P m   is the corresponding park scale grade, C is a constant, and q is the grade dimension. In the same way, the value of two sides of the above formula logarithmized, the scale-free area, and the fitting coefficient R22 corresponding to the level q can be quantified and denoted as follows:
ln P m = ln C q ln m
Considering the data irregularities caused by random disturbances, another calculation method of the park green space-grade dimension is introduced to eliminate the subjective error:
d z = ln λ ln δ
In the formula, dz is the rank dimension of the park green space, λ is the average value of the scale classification ratio, and δ is the average value of the number of parks.
Formula (2), Formula (4), and Formula (5) can be integrated. When q = 1, the park green space scale distributes characters by continuous iteration, and the hierarchical system is the most reasonable. When q > 1, the park green space scale structure is scattered, the monopoly of large-scale parks is stronger, and the number of middle-rank park green spaces is lower. When q < 1, there are more middle-rank park green spaces, and the scale distribution is balanced and concentrated.

2.4.3. Difference Degree Model

To reflect the complexity of the park green space system structure, the degree of difference formula is introduced:
C = 1 I I m a x
In the formula, I ( r ) = i = 1 r P i ( r ) ln P i ( r ) I m a x = ln r , I is the scale distribution of the information entropy of the system, Imax is the maximum entropy, r is the permutation from larger to smaller park green space, and Pi(r) is the ratio of each park to the total size.

3. Results

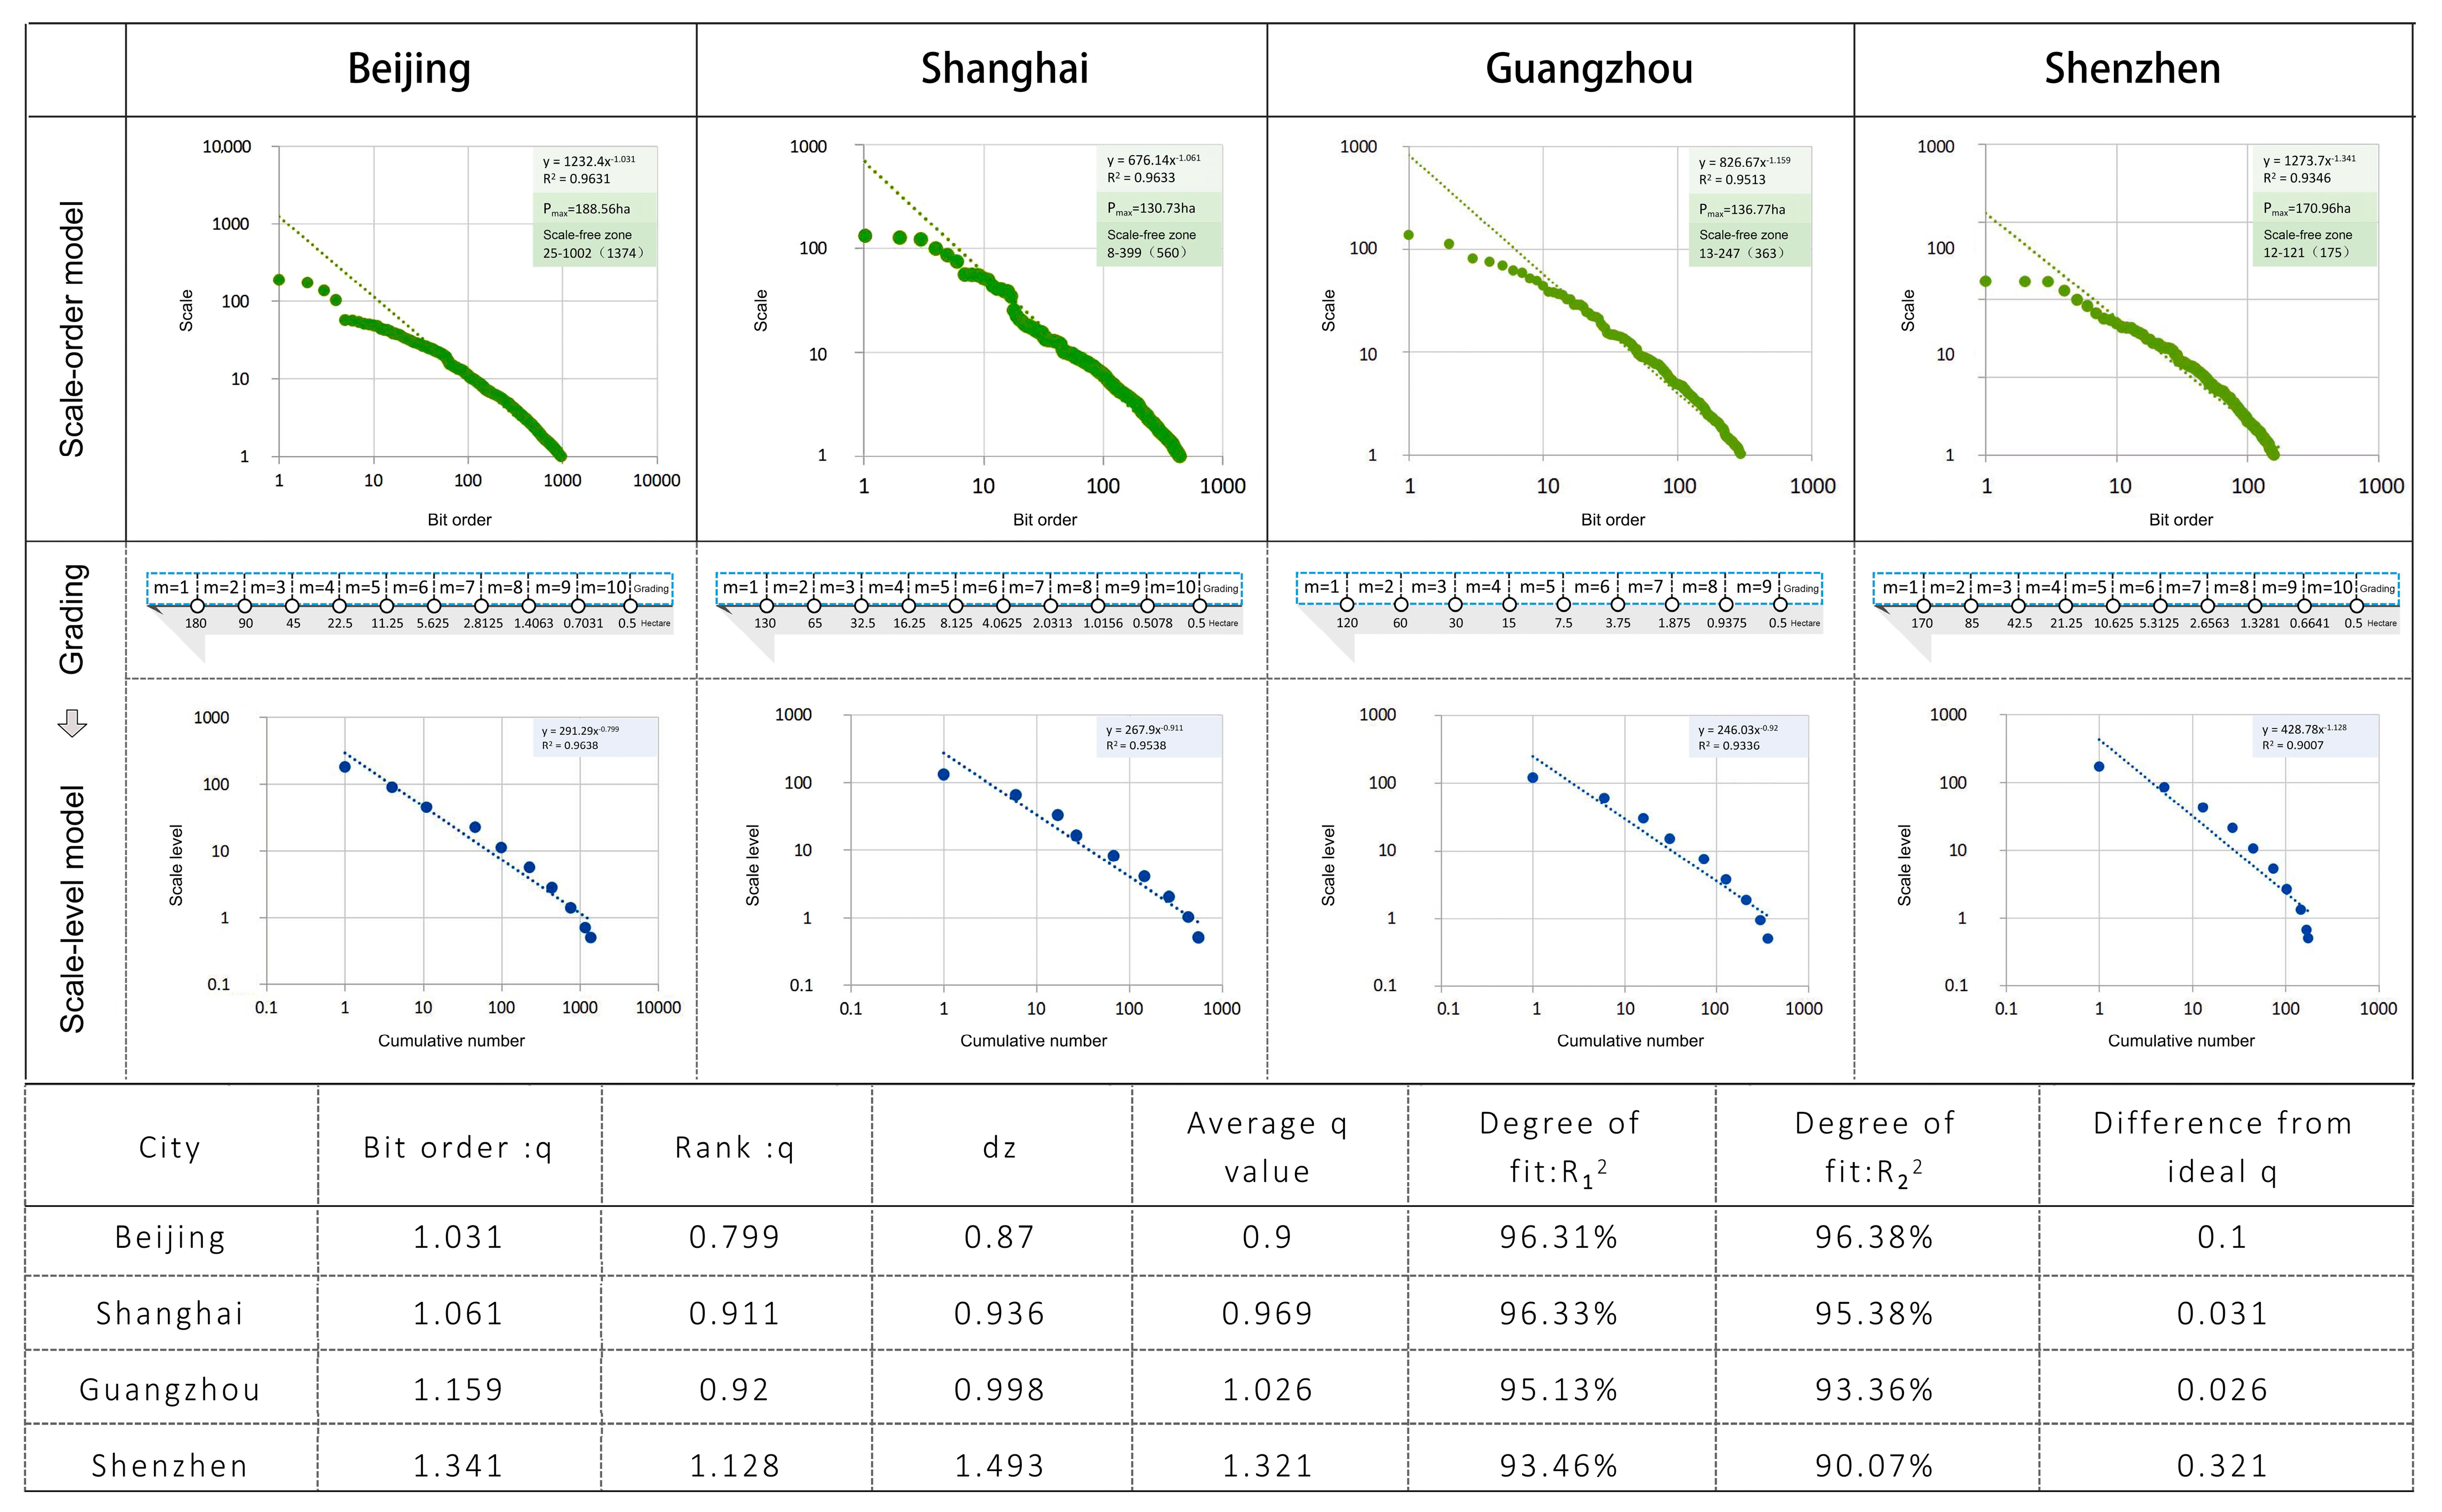
3.1. Calculation of Fractal Dimension

Figure 3 shows the model calculation results of urban park green space, which is highly consistent with complex fractal features. Among them, the average fractal dimension q-value of Beijing is 0.9, indicating that there are a large number of park green spaces in the middle rank showing a relatively balanced structure, which is divided into 10 levels from top to bottom based on the largest park green space scale, with an overall degree of fit of over 96.3%. When m = 1, the scale level distribution enters the scale-free zone, and when m = 9 or 10, the fitting effect is poorer, and small-scale green spaces of 0.5–1.4 hectares are insufficient. The average fractal dimension q-value of Shanghai is 0.969, which is close to the ideal value, and the degree of fit coefficients are all above 95%. Due to the large number of park green spaces that are 65–130 hectares and 8.125–16.25 hectares, the scale-free zone is achieved only when m = 2, and the park green space structure presents a large- and medium-scale phenomenon. The scale distribution of park green space in Guangzhou is closest to the ideal state, and the average q-value is only 0.026, which is different from 1. From the scale distribution, the structure of park green space is superior to that of the other three cities. The Zipf model of Shenzhen shows that the degree of fit determination coefficient is between 90% and 93%, and the fitting effect is general. When m = 1 and m = 9 or 10, the deviation from the fit trend line is most obvious, and the average q-value exceeds the ideal value by more than 0.3. Large-scale parks have a stronger monopoly, while the number of small-scale parks is seriously insufficient, and their structure is dispersed.

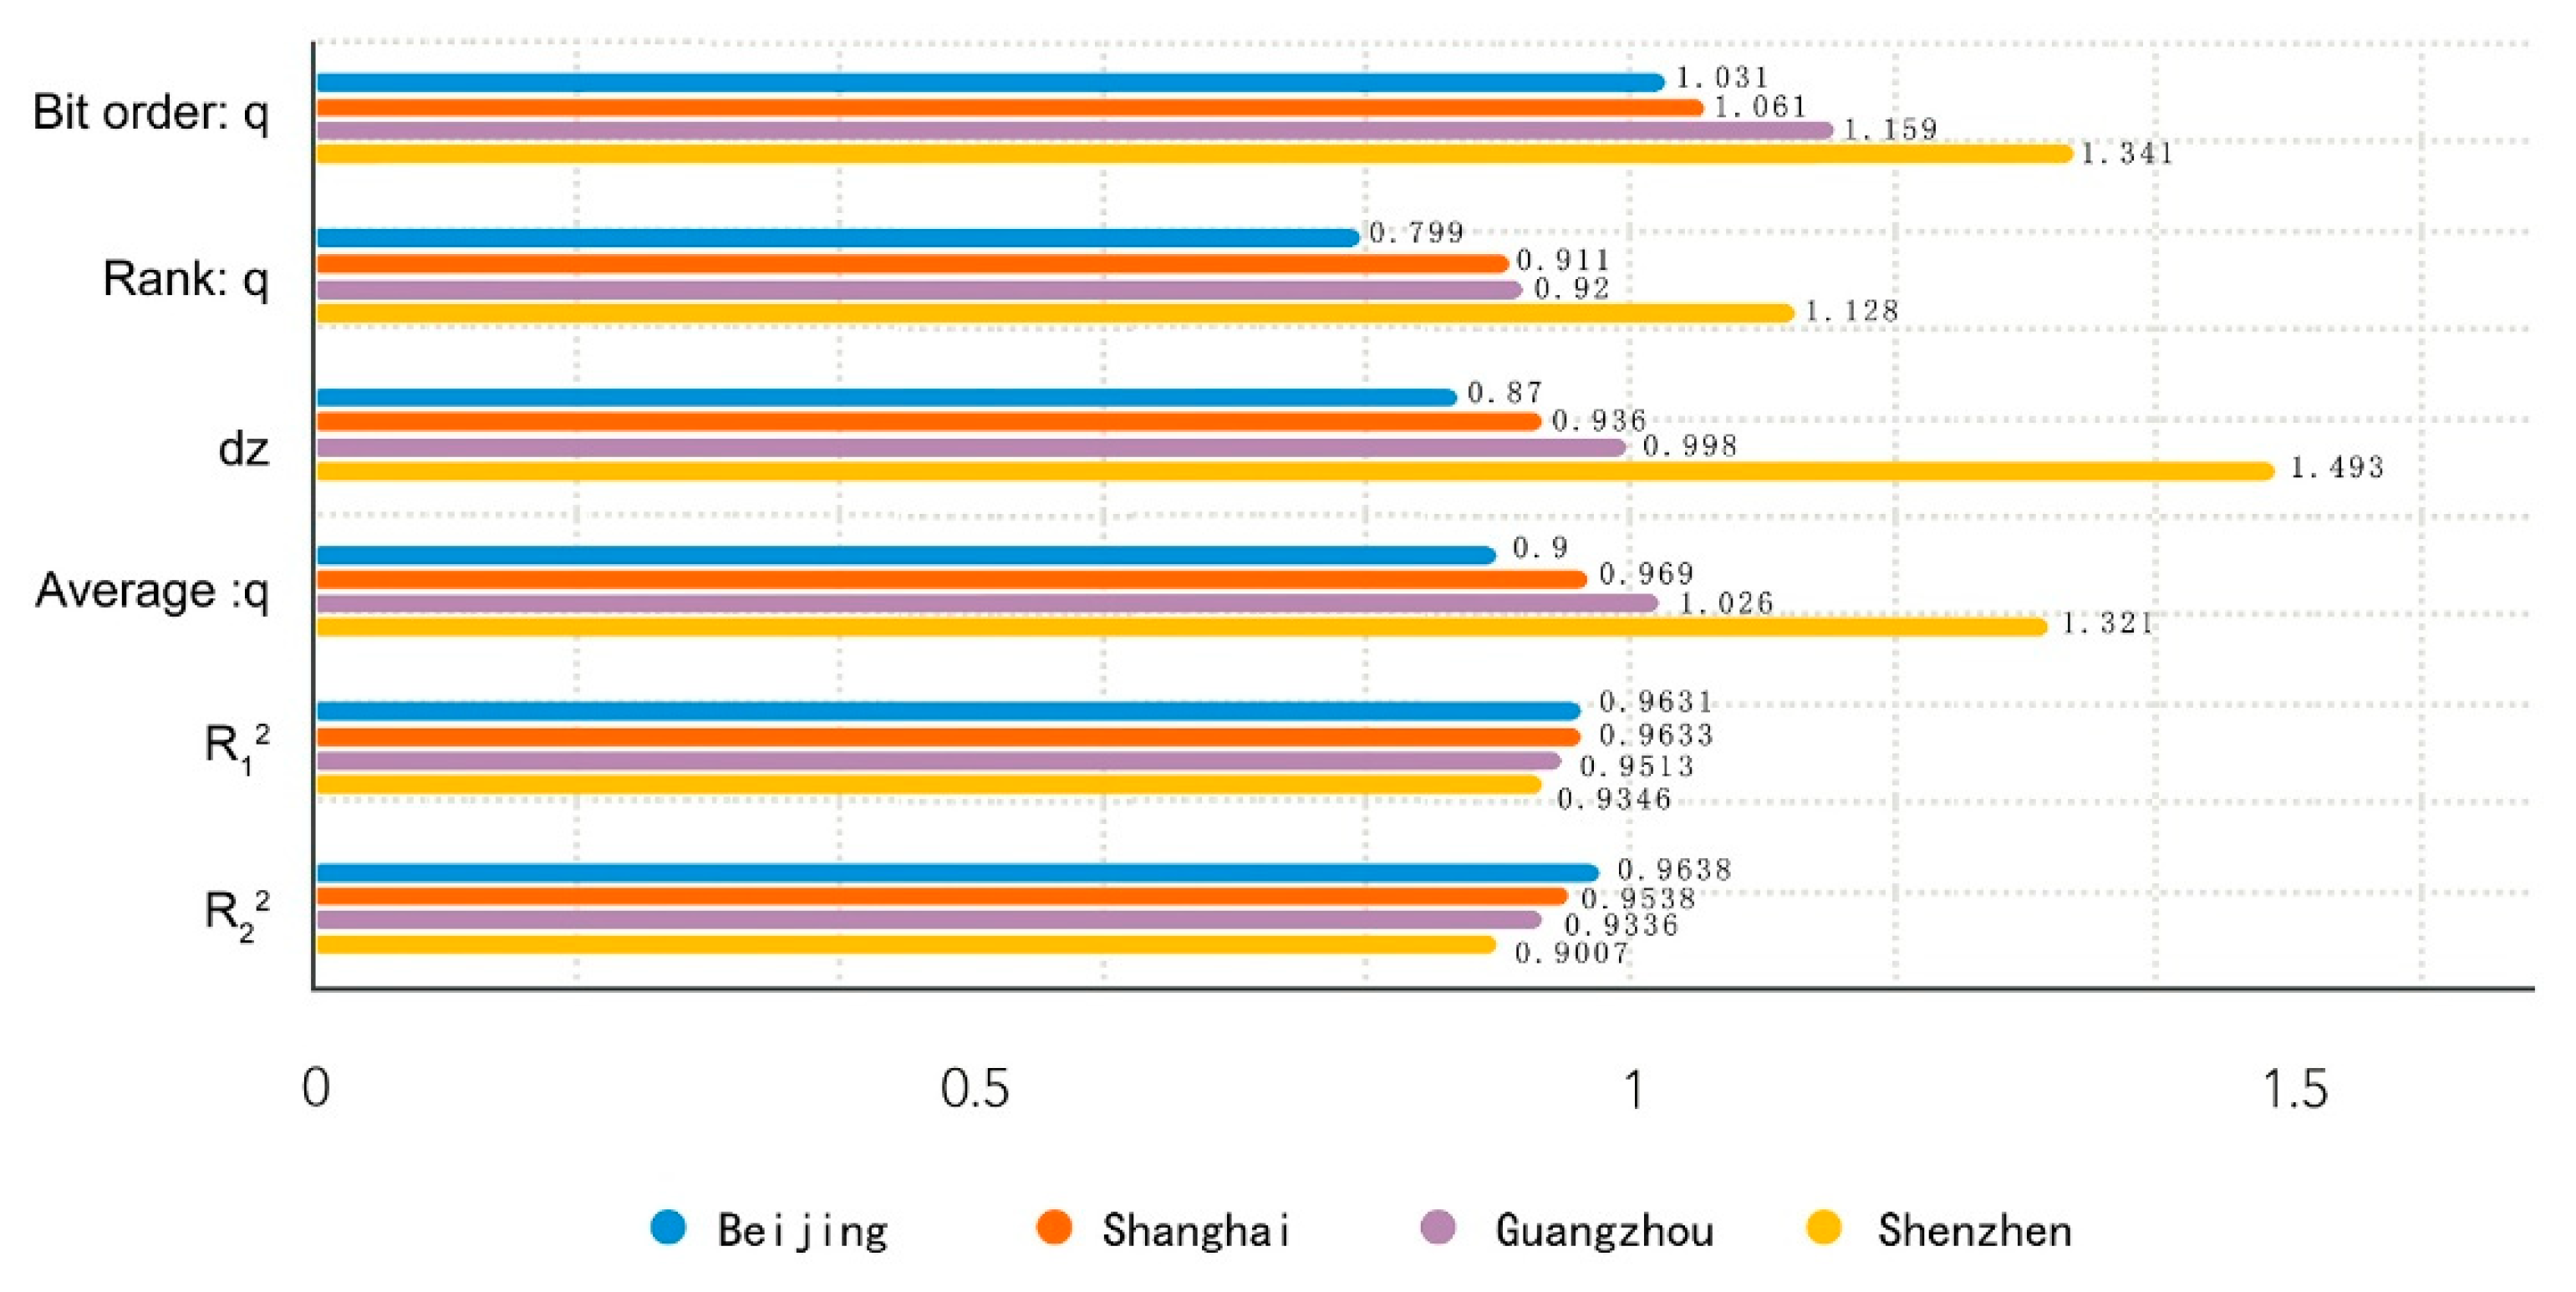
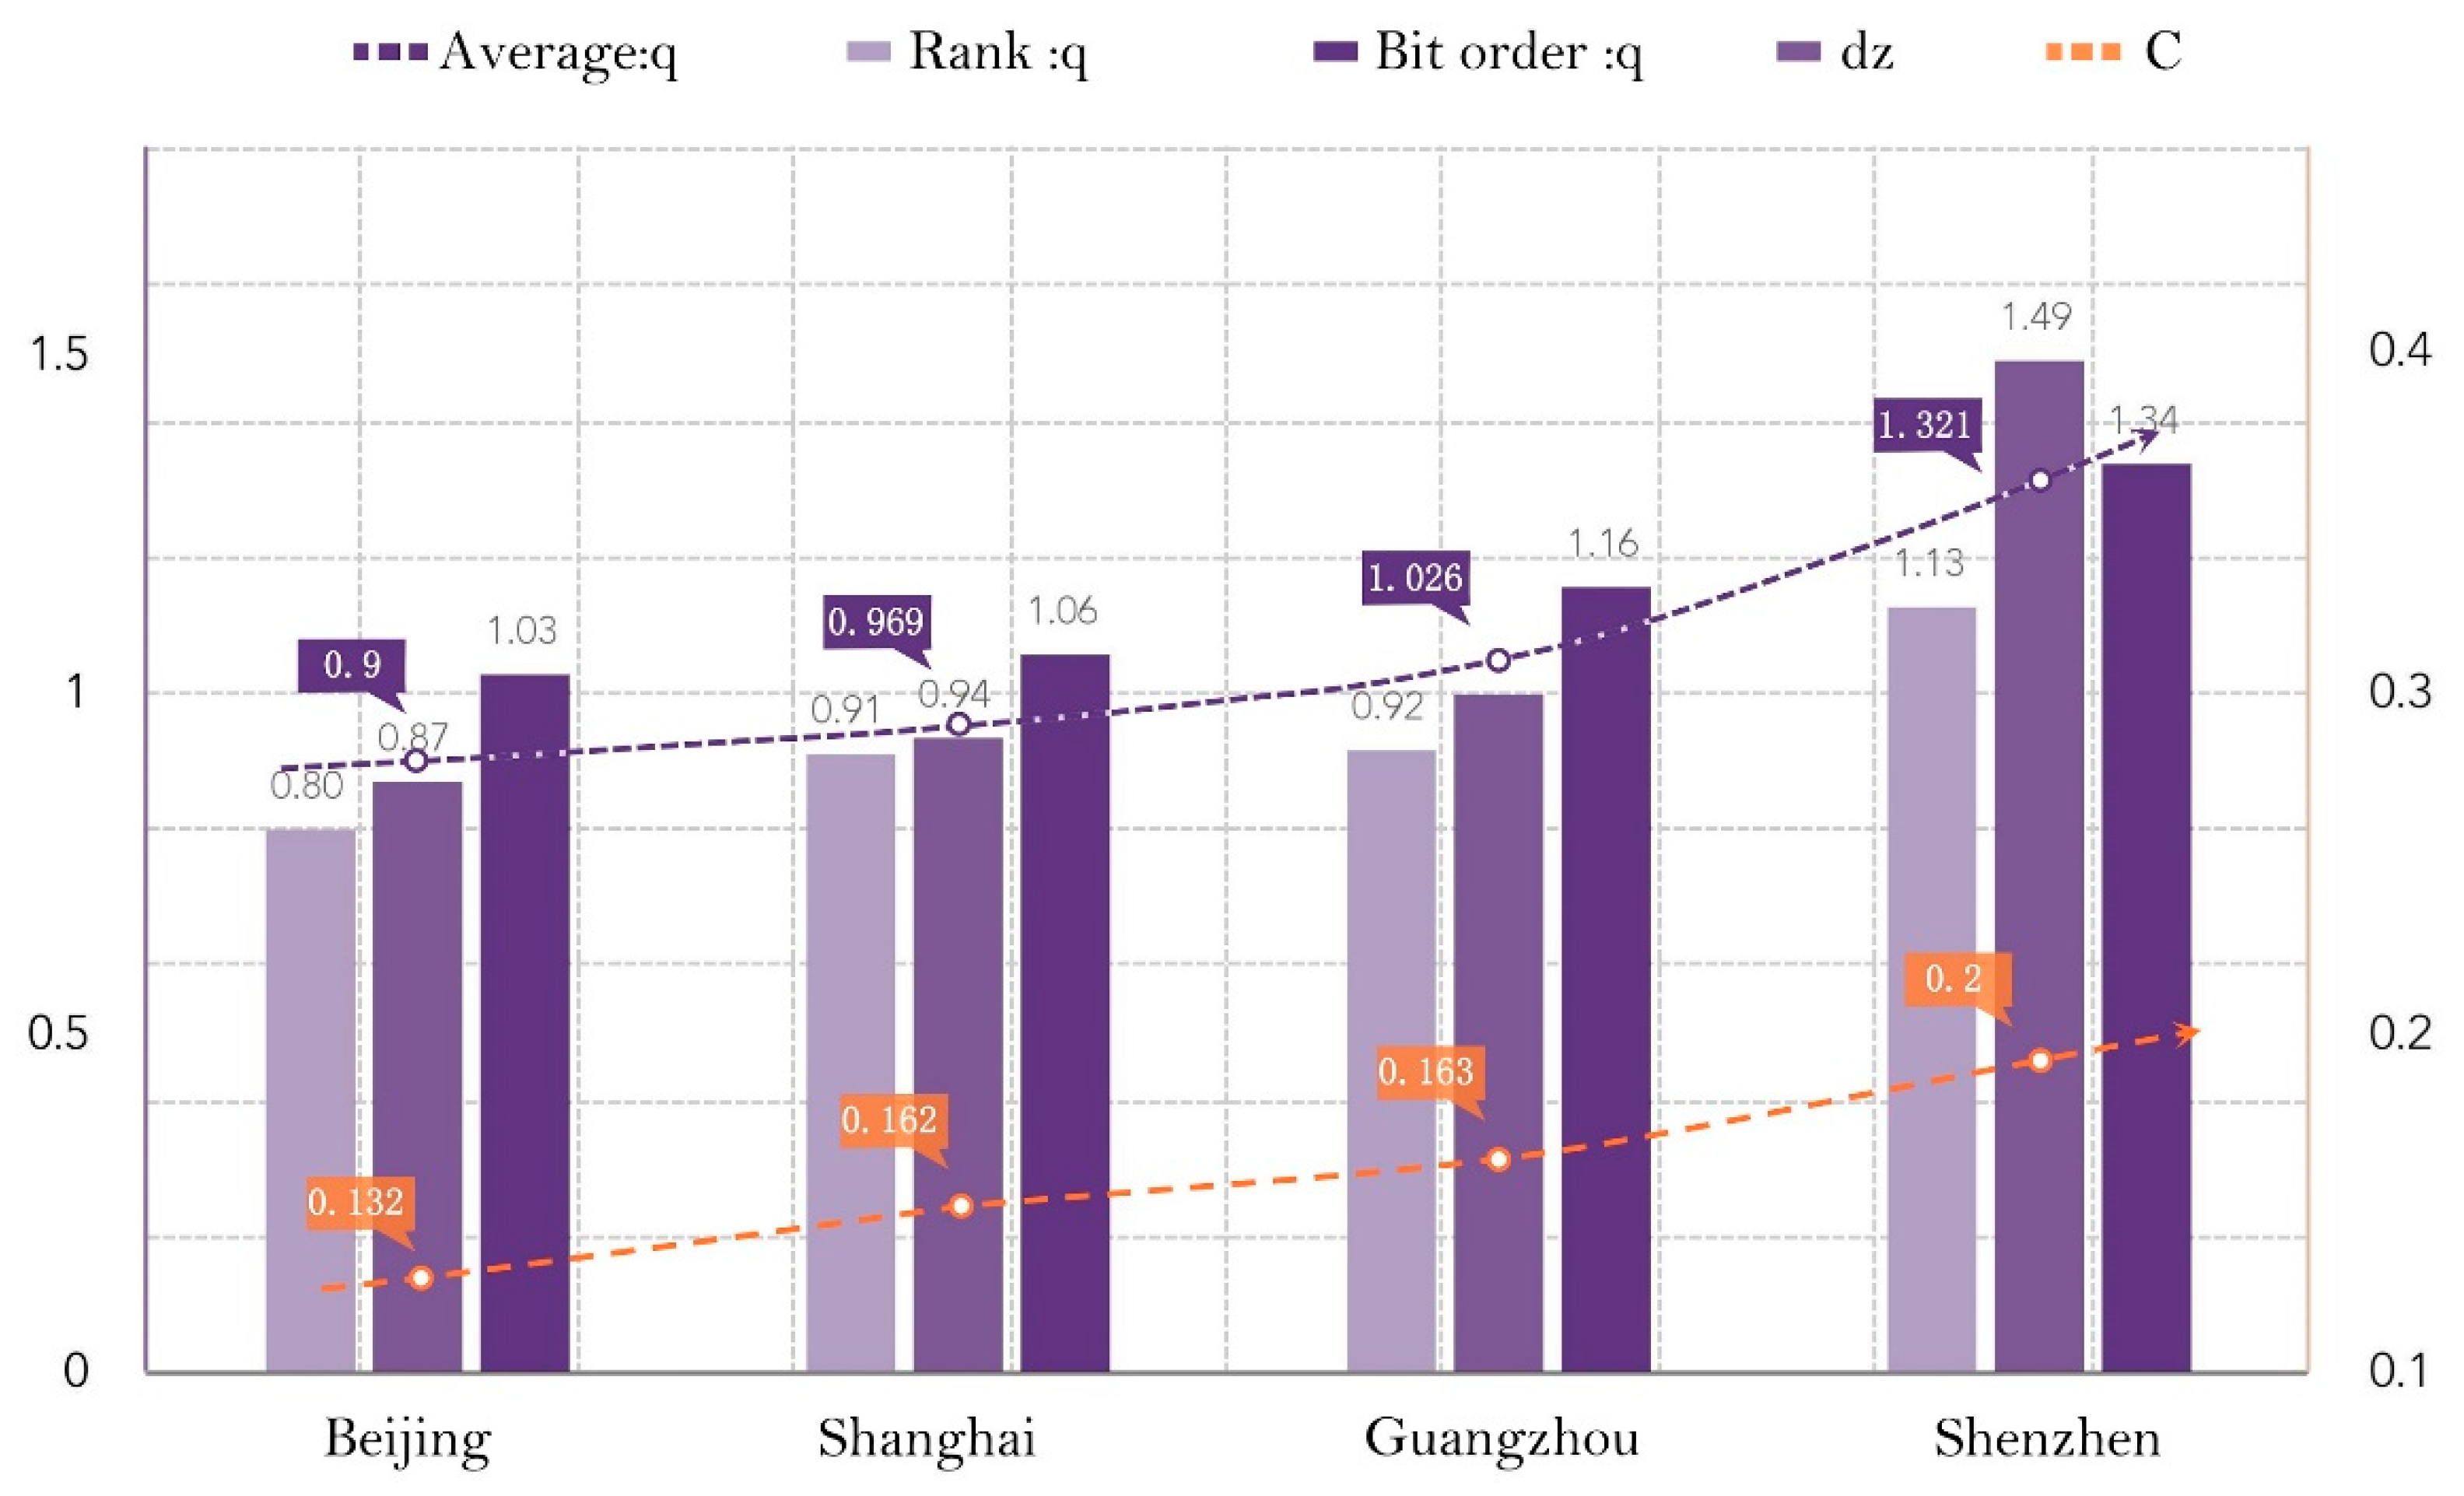
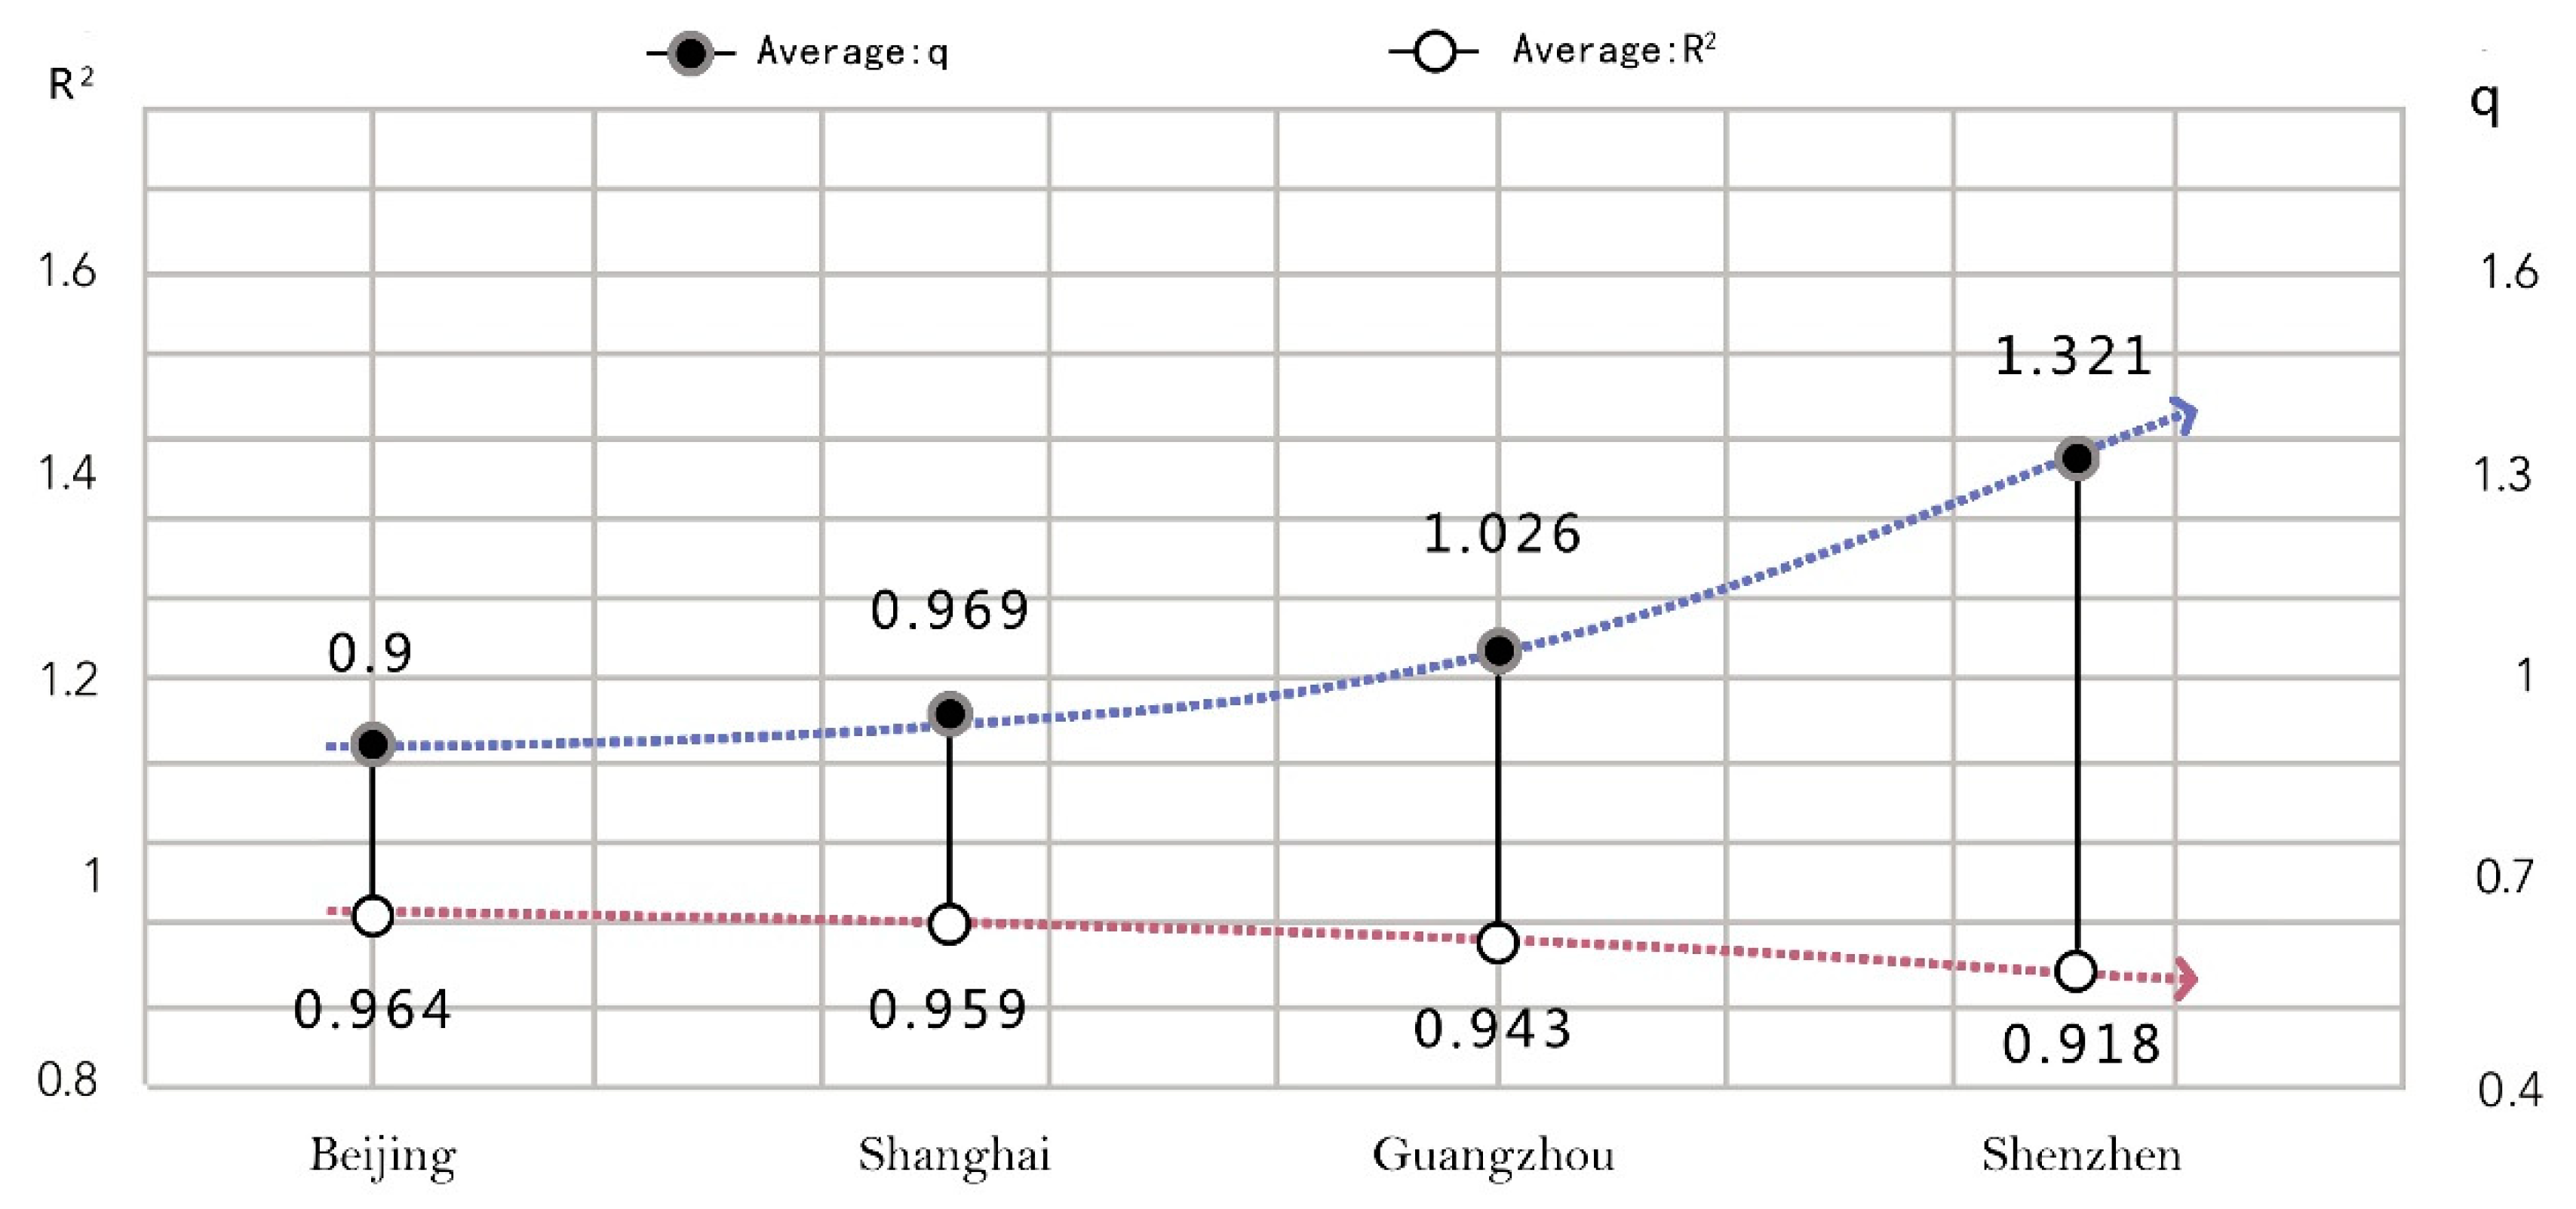
3.2. Comparison of Indicators

By categorizing and comparing the model output indicators of the research object, the fractal dimension q-value and the degree of fit, R2, are analyzed (Figure 4). The analysis reveals that the calculation results of the four cities maintain a highly consistent ordering rule regardless of the single indicator or the composite average. The fractal dimension results show that the corresponding cities of the order q-value, grade q-value, dz, and average q-value rank from smallest to largest are Beijing, Shanghai, Guangzhou, and Shenzhen. Among these, the average fractal value of Beijing and Shanghai is less than 1, the lowest being 0.9 in Beijing, while the average fractal dimension of Guangzhou and Shenzhen is greater than 1, the highest being 1.32 in Shenzhen. According to the difference from the ideal value, the cities with an average fractal dimension close to 1 are Guangzhou, Shanghai, Beijing, and Shenzhen. In other words, the scale-size structure distribution of park green space in Guangzhou is the most reasonable of such distribution in the four megacities in this study. The results of the degree of fit show that the whole presents a law contrary to the fractal dimension value for Shenzhen, Guangzhou, Shanghai, and Beijing. Among the four, Beijing has the largest quantitative index (R12 = 96.31%, R22 = 96.38%), indicating that the fractal feature of its urban park green space is the most prominent and the fitting effect is the best.

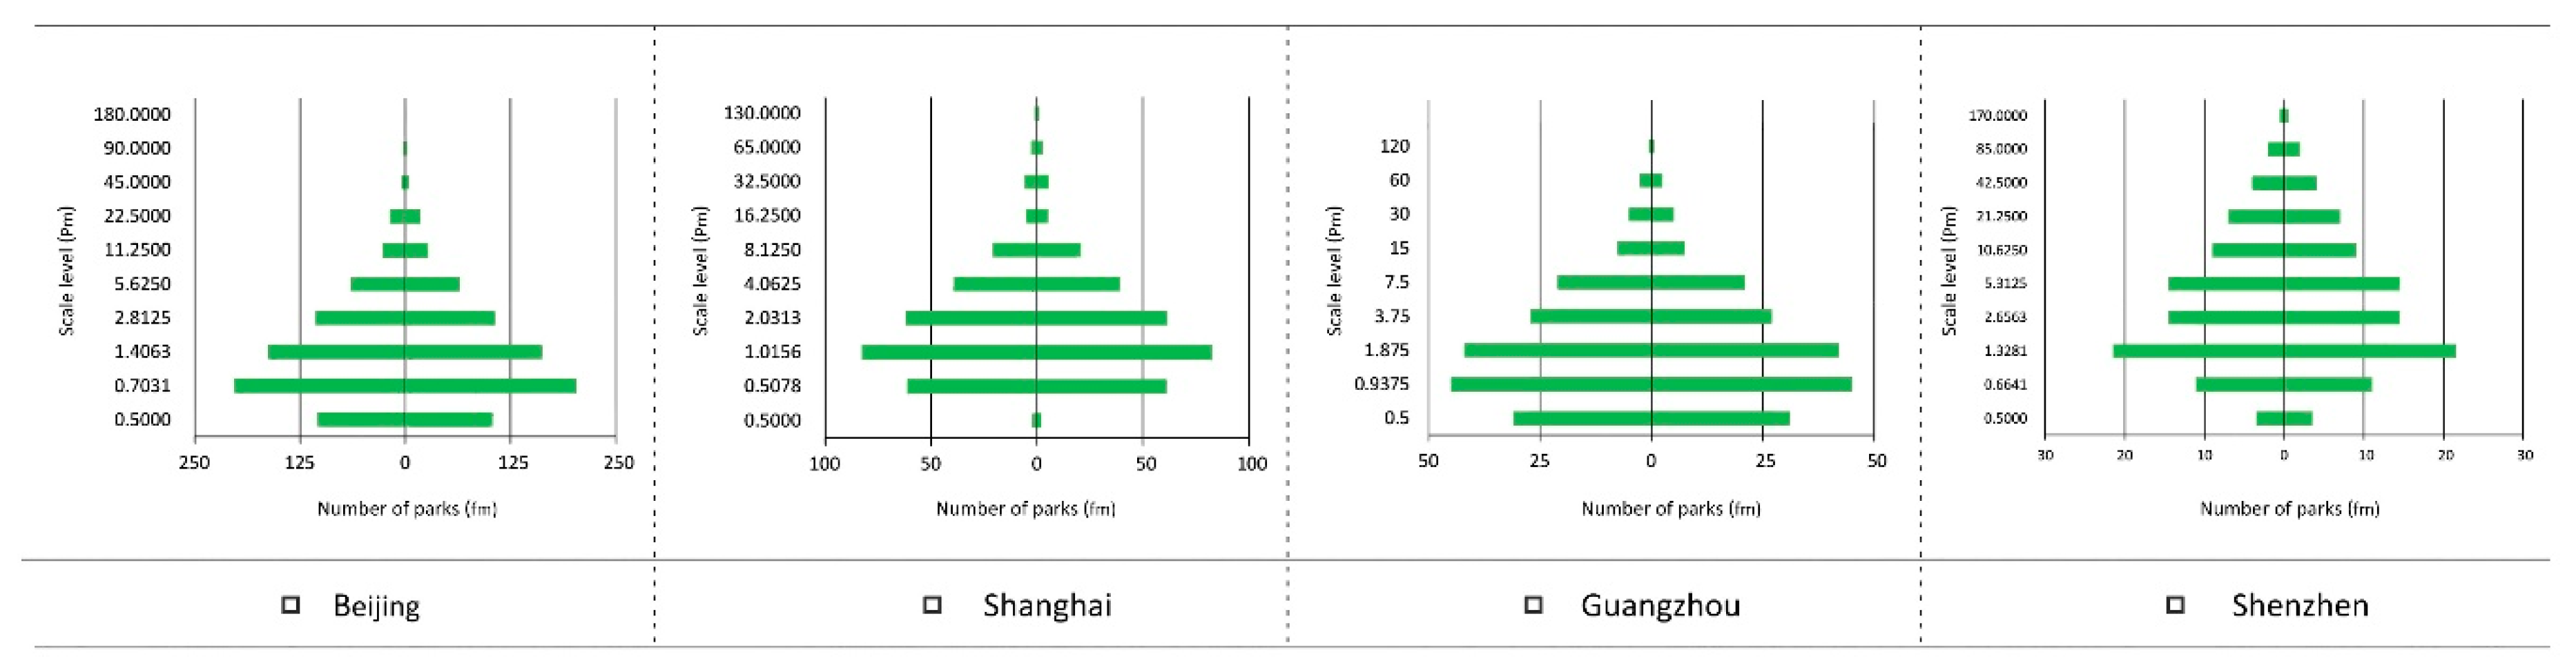
3.3. Comparison of Scale Levels

Among the multilevel relationships, the park green space should be similar to the growth structure of the fractal veins of nature, with multiple connections and gradual iterative integrity. The next level is always reconstructed based on the previous level with certain rules, showing self-similarity. Therefore, combined with the double-law grading system in Figure 3, the number of park green spaces at each scale level was counted, and the ratio δ of adjacent levels (m + 1/m) was calculated to evaluate the current park distribution level and determine whether there were missing or insufficient levels (Table 3).
According to the statistical situation, all four cities have insufficient allocation levels, albeit to different degrees. Both Shanghai and Shenzhen have a shortage of green space resource allocation at the two lowest levels and other small- and medium-scale levels, and the proportion of insufficient levels is the highest, reaching 30%. Small-park green spaces from 0.5 to 1.4 hectares in Beijing are lacking, and the proportion of insufficient levels is 20%. Compared with the other three megacities, only Guangzhou shows that the number of parks is insufficient at the lowest level, and the percentage of lacking parks is the lowest.
In summary, there are obvious problems of insufficient grades in the four megacities, which is not conducive to constructing the continuous fractal order, especially the insufficient construction of small- and medium-scale park green space. It is worth noting that although the proportion of insufficient grades in some cities is high, the fractal structure is not necessarily bad. This is because the lack of parks and green space accounts for a small proportion of these grades. For example, Shanghai has the largest proportion of under levels, but the overall degree of fit is still as high as 95–96%, and the fractal dimension is also close to ideal.

4. Discussion

4.1. Fractal Characteristics and Laws

4.1.1. Correlation between Fractal Dimension and Complexity of System Structure

Influenced by modernist urban planning ideas, megacities in China have begun to evolve from a leaf-like structure to a tree-like one. As an important component of the spatial layout, urban parks inherently have endless clarity, order, and simplification of the internal generation logic, resulting in a loss of plasticity and adaptability based on organic growth. Park green space is an important urban ecosystem [32,33], and the more complex the system is, the more stable its resistance is and the less stable its resilience is; otherwise, the stability of resilience is greater than that of resistance [34]. The construction of park green space does not need to be improved, nor does the system need to be more complex to be more stable; instead, a quantifiable equilibrium state should be the goal. Fractal theory can be used to measure and describe this kind of seemingly disordered and chaotic state and show that it is, in fact, highly redundant, complex, and controllable.
With the help of the difference index formula, the difference index of the park green space scale distribution is calculated to reflect the complexity of the system structure. The results of the four cities are 0.1315 (Beijing), 0.1618 (Shanghai), 0.1627 (Guangzhou), and 0.1998 (Shenzhen). Compared with Figure 4, it is found that there is a highly consistent positive correlation law between the fractal dimension and the degree of difference (Figure 5). That is, the larger the fractal dimension of the park green space scale is, the higher the complexity of the system is, and the stronger the ability to adapt to new functional requirements in the process of dynamic evolution is. Therefore, by introducing fractal theory, the study of park green space can quantitatively evaluate and diagnose the complexity of the system structure, repair damaged ecosystems, safeguard the habitats renewed through the active intervention of humans and the self-regulation of the system, and finally realize fractal optimization and ductile growth of the park green space structure.

4.1.2. Hierarchical Iterative Characteristics of Park Green Space

Based on analyzing the mathematical relationship between the fractal dimension of the research object and the degree of fit and comparing the average level extracted, it is found that there is a roughly opposite trend between the fractal dimension q-value of the four cities and the degree of fit R2 (Figure 6). The lower the q-value of the park green space is, the higher the fitting index is, and the wider the scale-free area is. Many small- and medium-scale green spaces lead to a structural distribution that is more in line with the fractal law.
The fractal dimension characterizes the level iteration of park green space to some extent and reflects the internal order of the scale distribution. However, the connotation of the degree of fit focuses on quantifying the degree of conformity with fractal theory and judging the complex relationship of the multilayer topology of the system at different scales, which does not mean that the higher the degree of fit is, the more reasonable the green space structure is. It is necessary to combine the q-value to comprehensively consider whether the internal order of the level iteration is close to the ideal state.

4.1.3. Deviation of Grade Distribution of Park Scale from Ideal Pyramid Configuration

The ideal urban park scale distribution should follow an inverse power–law relationship. Except for the lowest level (that is, the lame-duck class), the curve reflecting the number of parks at all levels should be smooth and upward as a whole, showing a smaller change in the number of large-scale green spaces and a larger change in the number of small- and medium-scale green spaces, which means that the first half of the curve is gentle and the second half is steep. Figure 7 shows that the park scale hierarchical structure of the four megacities deviates somewhat from the ideal pyramid structure. The park green space structure in Beijing is too balanced and concentrated, and the level iterative relationship needs further improvement. Shanghai and Shenzhen are in a clear spindle state, and there is a turning point in the number of green spaces declining in the penultimate scale. In comparison, the park scale in Guangzhou has the smallest deviation, which can be optimized by increasing the number of small-scale parks.
Park green spaces at different scales have different contributions in terms of ecological, social, and economic benefits. Combined with the hierarchical distribution configuration, it is seen that the more concentrated the second half is, the greater the dominant advantage of small- and medium-scale parks is, and the greater the accessibility, fairness, and convenience of usage are, which contributes to economic and social benefits. In contrast, the greater the proportion of the upper half of the hierarchical distribution configuration is, the more obvious the ecological benefits of large-scale parks are, and the greater the reduction in social benefits is. Therefore, under the condition of limited total resources, analyzing the deviation of the current park scale distribution from the pyramid configuration helps assess the insufficiency of allocation levels, which provides support for specific optimization measures to maximize the comprehensive benefits.

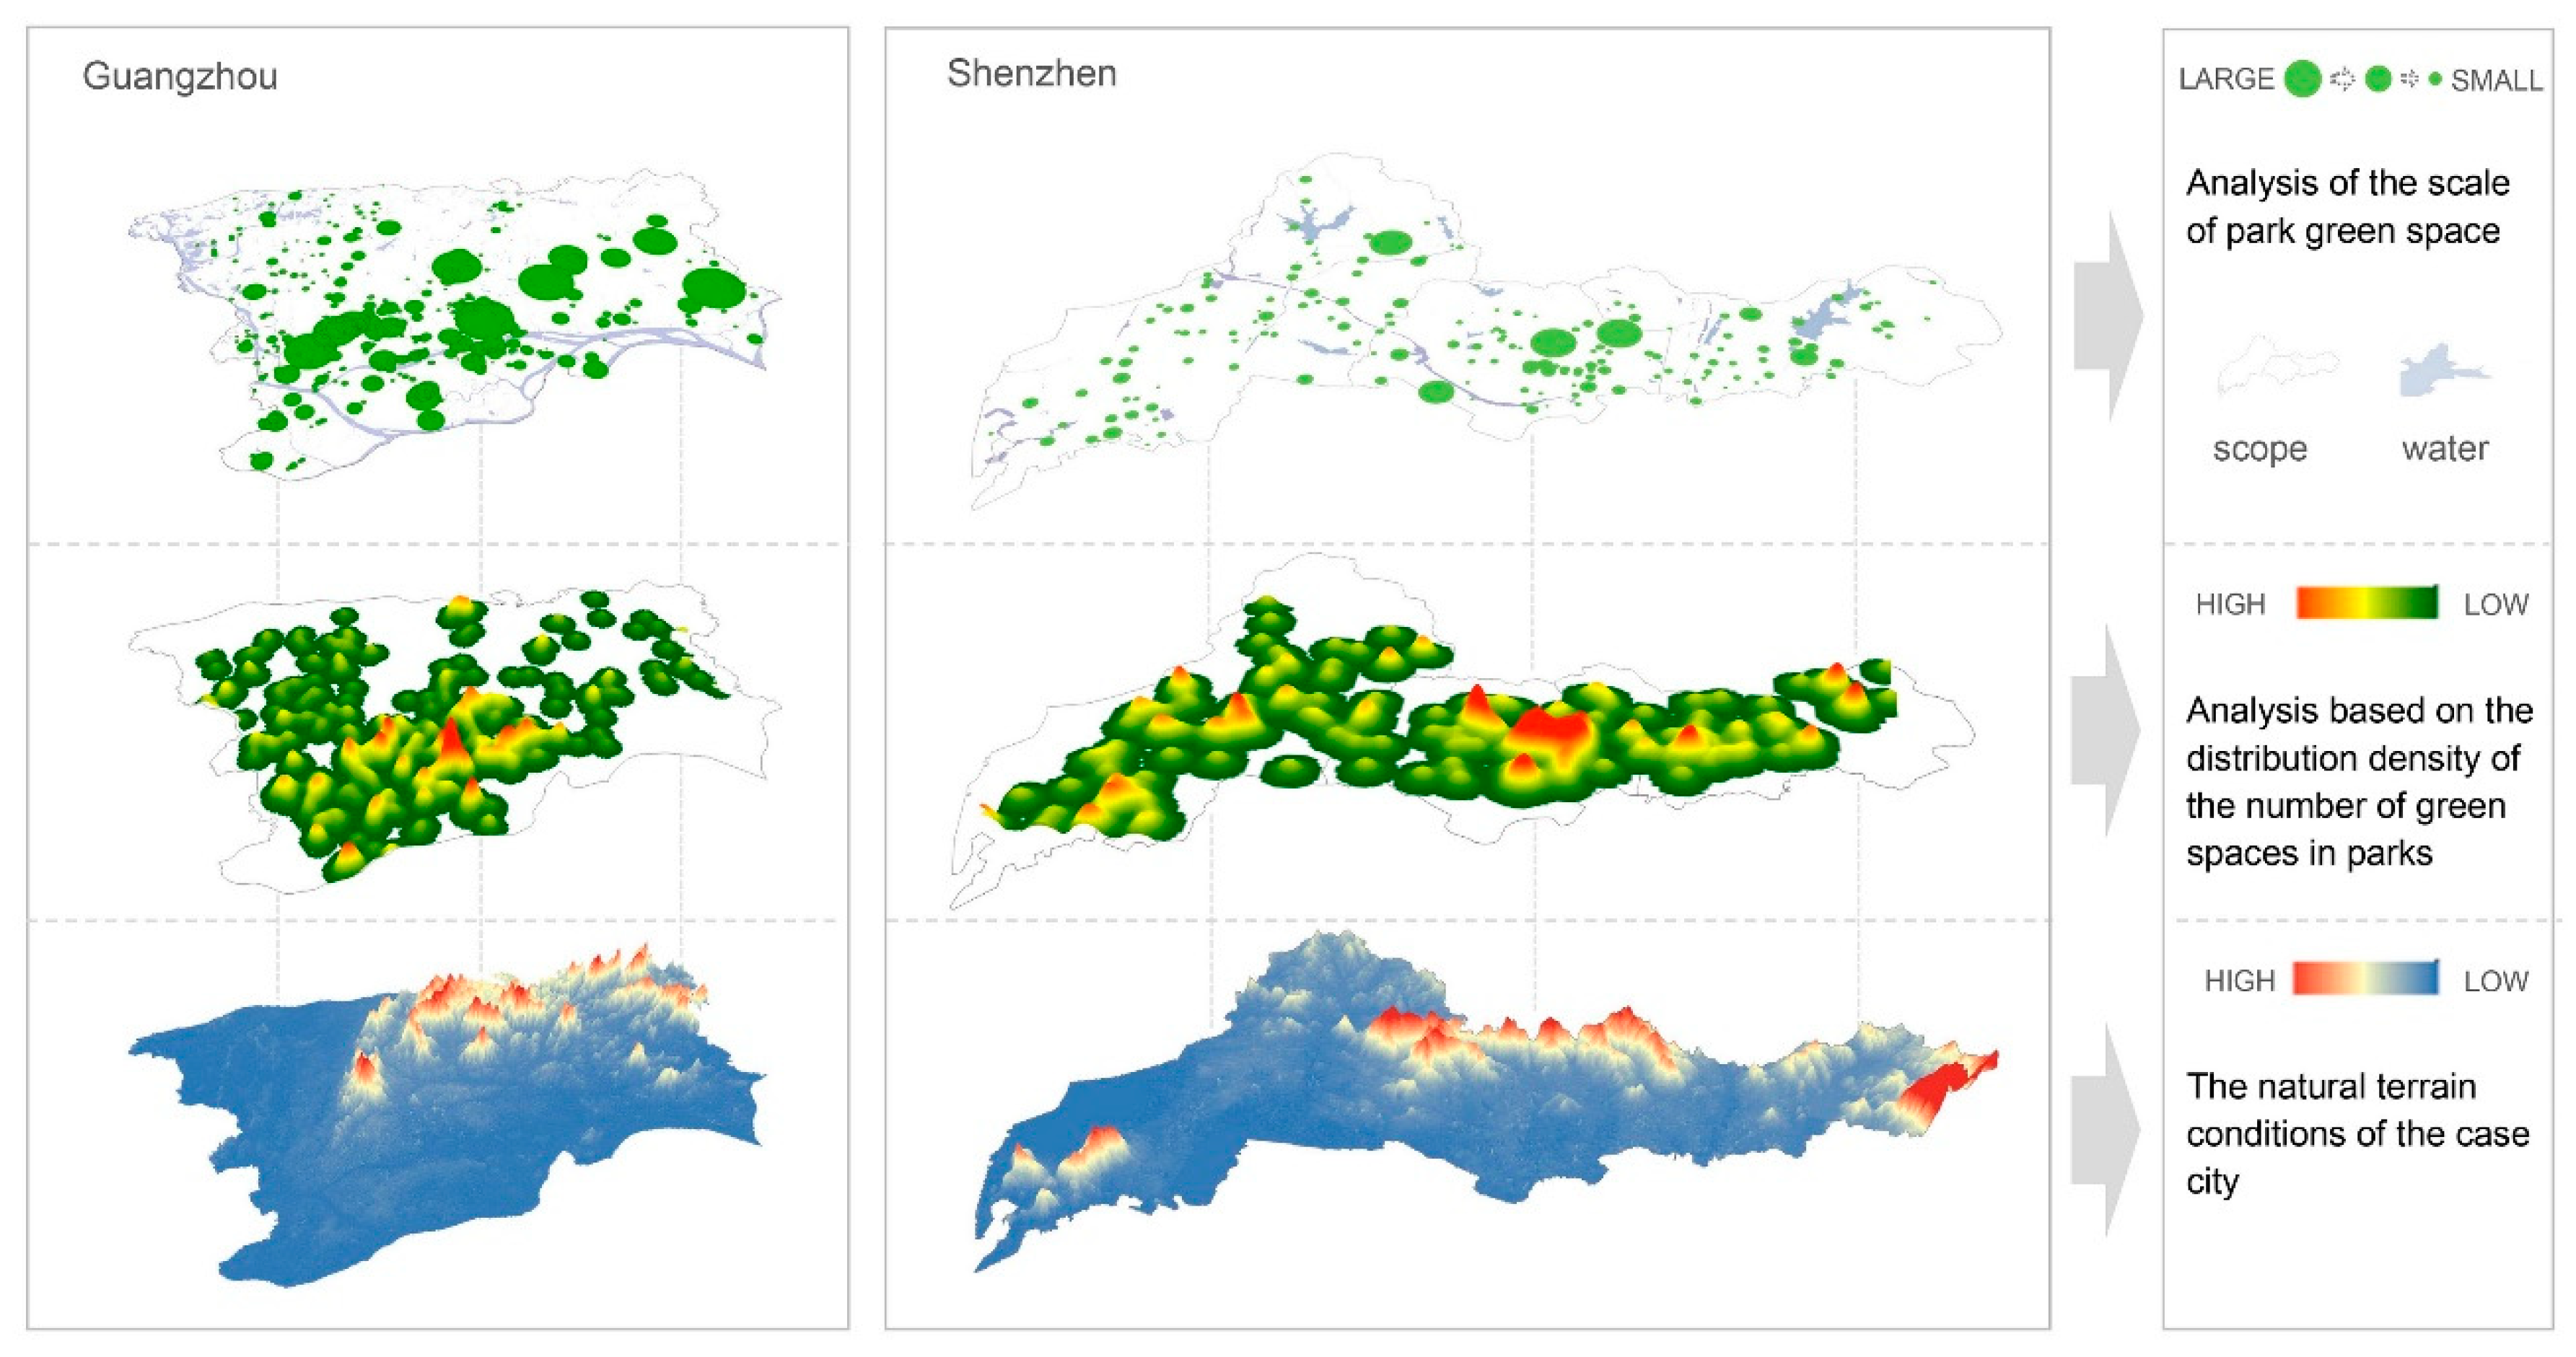
4.1.4. Factors Influencing the Hierarchical Structure of Park Green Space

As the supporting content of urban public services, the scale hierarchy structure of park green space is affected by many factors, which can be summarized as follows: (1) Natural basic conditions. Differences in location distribution and natural geographical environment will directly lead to different background conditions for urban growth. The innate landscape pattern significantly affects the area, location, and fragmentation of green space patches. Urban parks are clustered in regions with superior natural resource endowments and often on a larger scale. Specifically, the richer the natural resources in the region are, the more complex the park hierarchy structure is, the more obvious the difference in scale distribution is, and the higher the fractal dimension value is. For example, there is a large forest park in the northeastern hilly area in Guangzhou, with a number of wetland parks and ecological parks distributed along the river; there are a large number of large-scale park green spaces, combined with waterfront and natural hills (Figure 8). (2) Urban spatial structure. Elements such as the economy, population, and society are comprehensively projected on the spatial structure layout, and then games are played in urban development, and ecological environment protection, land compact development, and human settlement environment quality [35,36] are constantly seeking dynamic balance, in which the scale distribution of park green space has been adjusted “passively” with the urban spatial structure, showing clear relevance. For example, the park green structure in Beijing with circle expansion is a type of ring network radial, and the park green structure in Guangzhou with a cluster network is a type of block decentralized structure. Therefore, the more dispersed the urban spatial structure is, the greater the difference in the distribution of park green space levels is. Affected by the law of supply and demand, the closer one gets to the center of the spatial structure, the smaller and denser the green spaces are. In contrast, the farther away from the center of the structure one gets, tending to the marginal area, the larger and more dispersed the green space is. (3) Historical genes continuing. As public open spaces, many parks are constructed in areas with richer historical accumulation and greater protection needs. Additionally, there are multiple attributes for parks, such as culture, ecology, and entertainment, whose scale characteristics also show a historical extension, especially Beihai Park, Old Summer Palace, and Summer Palace.

4.2. Optimization of Park Green Space Structure

From the perspective of the application of fractal theory, based on the fractal characteristics and laws of summarized park green space, the authors are thinking further about the fractal optimization of the park scale hierarchical structure (Figure 9), hoping to provide new methods and implementation approaches for more scientific planning practices.

4.2.1. Localized Grading Standards and Continuous Grading System

The park green space system is a subsystem in a large urban system that is affected by many factors [37], such as natural conditions, historical culture, economic development, and population distribution. There are significant differences in the growth environment of park green space in different cities, especially the large bodies of large cities. Volume and high-speed development bring complexity to the construction of the park system, especially its complexity given the very large volume and high-speed development of megacities. Therefore, it is necessary to follow the urban development laws and adjust the park grading system to create a regional grading standard suitable for economic, social, and ecological needs. On this basis, along with Davis’s double law and the number of adjacent parks δ, the indicator connotation can correspond to the fractal order of diagnosing the current park green space structure. There are specific problems with hierarchical fractures and missing or excessive fractures. Furthermore, according to the multilayer iterative relationship of the ideal pyramid configuration, the park hierarchy system can be repaired by urban progressive updating to improve and perfect the continuity of the hierarchy so that the scale and number of park green spaces are inversely distributed with hierarchy changes to achieve high agreement between the hierarchical structure of the park and the maximization of comprehensive benefits.

4.2.2. Adjustment of Fractal Structure of Park Green Space under the Integration of Land Factors

It is necessary to abandon the common thinking of utilizing park green space to fill the gap in the building development of the past and re-examine the importance of green space system planning in the integration and distribution of space resources. Drawing on the urban renewal growth theory [38,39], the renewal scope can be extended from old urban areas to new-old areas, and the functions of different levels can be mixed and replaced in multiple ways on the integration of land elements of small-scale urban units, by which the scale hierarchical structure of park green space can be optimized. Specifically, the fractal dimension q and the fitting measurement coefficient R2 are used as quantitative indicators. When there are a large number of large-scale parks playing a monopoly role, the functions to implant business, culture, and residences can be superimposed, which can not only save land to alleviate the pressure of insufficient space in megacities and stimulate urban vitality but also increase the positive impact of parks and realize the optimization and adjustment of the park scale. When the number of small-scale parks is insufficient, based on the management of urban space and evaluation of land resources, there are many measures for revitalizing the stock space, optimizing the land structure, and governing the ecological environment to supplement small- and medium-scale parks with missing levels. In addition, the least-square linear regression method is used to detect the fractal features of the green space system, further adjust the distribution sequence relationship between the number and scale of parks, and promote the park green space system to realize continuous fractal optimization toward the ideal state.

4.2.3. Reservation of Dynamic Elastic Growth Space

Park green space, as an integral part of complex and giant urban systems, is characterized by uncertainty, openness, and dynamism [40,41]. Development and evolution are essentially spatial movements based on self-organization, which is a complex adaptation process under natural logic. It is seen that the park green space distribution dynamically “evolved” in the cycle mechanism of feedback, control, adjustment, and re-feedback with more changes in the urban development stage and further improvement of human needs. Thus, it is vital to reserve elastic space and increase system toughness to make the park green space system “grow” toward the ideal state, incorporating balance and stability in megacities with complicated and difficult updating work. Once the system deviates from the optimal state, the fractal model can be used to measure the degree and direction of deviation, mobilize the implicit order of the internal system with appropriate manual intervention, and exert the system’s adaptive ability with the help of land blank spaces. At the same time, the elastic growth space should be integrated with the urban development strategy and layout consistent with the development time sequence. In particular, more attention should be given to the urban core areas and control of the population distribution and land development intensity, which provide more buffer room to balance the fractal order of park green space.

5. Conclusions

In this paper, fractal theory was introduced into the research field of urban park green space to reveal the fractal characteristics and laws of green land in China’s megacity parks by constructing a Zipf measurement model and providing specific strategies for scale optimization. Compared with other research results in this field, the contribution of this article can be summarized as follows: (1) using an interdisciplinary research perspective, this paper proposes fractal theory as a tool to explore the relationship of the park green space scale and address the shortcomings of structural evaluation in existing studies; (2) it objectively selects research objects, establishes mathematical models, analyzes a very large urban park system on multi-indicators, and quantifies and presents laws and existing problems on multiple levels; (3) it proposes the fractal optimization strategy of park green space scale structure based on recognizing and evaluating objects, which is feasible to implement and operate and has great practical significance. It is worth noting that the authors mainly focus on the scale and hierarchical structure of urban parks and that the structure of park green space is a complex system problem. Therefore, in specific practice, we can analyze the balance, dispersion, and land use degree of integration of park green space with the help of grid dimensions; we use the radius dimension to quantify the degree of distribution of green space, changes in circle density, etc.
To sum up, the structure of urban park green space includes not only the structure of scale level, but also the structure of spatial layout, which is related to the comprehensive benefit level of the park. However, this article focuses more on the mathematical logic of the scale of the park green space and lacks discussion on the rationality of the green space distribution. Based on this limitation, future research should combine the Zipf dimension with the grid dimension, the radius dimension, the boundary dimension, etc., to better optimize the distribution pattern of park green space in urban space. In addition, with the development of discipline research and the improvement of people’s living needs, the vision of future research should be expanded from the two-dimensional plane to three-dimensional space, so as to enrich the application scope of the theory to support the specific practical work.

Author Contributions

Z.L.: Conceptualization, Methodology, Software, Validation, Resources, Writing—original draft preparation, Writing—review and editing, Visualization, Project administration. W.Z.: Formal analysis, Data curation, Writing—review and editing, Supervision. M.N.: Conceptualization, Validation, Investigation, Resources. All authors have read and agreed to the published version of the manuscript.

Funding

This research was funded by “Research on the Construction of Ecological Infrastructure System Disaster Prevention and Mitigation in Mountain Towns” (No. 51678086) of the National Natural Science Foundation Project in China and “Research on Planning Construction and Operation Management Mechanism of Urban Rain and Flood Disaster Prevention Facilities in Mountain Cities” (No. 16XGL001) of the Western Project of the National Social Science Foundation.

Institutional Review Board Statement

Not applicable.

Informed Consent Statement

Not applicable.

Data Availability Statement

Not applicable.

Acknowledgments

The authors appreciate the two anonymous reviewers for their valuable and constructive comments. We would like to express our appreciation to the editor and two anonymous reviewers for the time and effort you have taken to provide such insightful guidance.

Conflicts of Interest

The authors declare no conflict of interest.

References

  1. Kaczynski, A.T.; Henderson, K.A. Environmental Correlates of Physical Activity: A Review of Evidence about Parks and Recreation. Leis. Sci. 2007, 29, 315–354. [Google Scholar] [CrossRef]
  2. Lachowycz, K.; Jones, A.P. Greenspace and obesity: A systematic review of the evidence. Obes. Rev. 2011, 12, e183–e189. [Google Scholar] [CrossRef] [PubMed]
  3. Li, M.; Tong, Y.; Li, J. Study on the Major Planning Indexes of Urban Park Green Space Related to the National Standard. Chin. Landsc. Architect. 2020, 36, 6–10. [Google Scholar]
  4. Walker, S.E.; Duffield, B.S. Susan, Urban parks and open spaces: An overview. Landsc. Res. 1983, 8, 2. [Google Scholar] [CrossRef]
  5. Jimenez, M.P.; Wellenius, G.A.; James, P.; Subramanian, S.; Buka, S.; Eaton, C.; Gilman, S.E.; Loucks, E.B. Associations of types of green space across the life-course with blood pressure and body mass index. Environ. Res. 2020, 185, 109411. [Google Scholar] [CrossRef]
  6. Zhang, L.; Tan, P.Y.; Richards, D. Relative importance of quantitative and qualitative aspects of urban green spaces in promoting health. Landsc. Urban Plan. 2021, 213, 104131. [Google Scholar] [CrossRef]
  7. Dinnie. Reprint of Community, cooperation and conflict: Negotiating the social well-being benefits of urban greenspace ex-periences. Landsc. Urban Plan. 2013, 112, 1–9. [Google Scholar] [CrossRef]
  8. Putra, I.G.N.E.; Astell-Burt, T.; Cliff, D.P.; Vella, S.A.; Feng, X. Association between green space quality and prosocial behaviour: A 10-year multilevel longitudinal analysis of Australian children. Environ. Res. 2021, 196, 110334. [Google Scholar] [CrossRef]
  9. Engstrom, G.; Gren, A. Capturing the value of green space in urban parks in a sustainable urban planning and design context: Pros and cons of hedonic pricing. Ecol. Soc. 2017, 22, 2. [Google Scholar] [CrossRef] [Green Version]
  10. Zhang, B.; Xie, G.; Zhang, C.; Zhang, J. The economic benefits of rainwater-runoff reduction by urban green spaces: A case study in Beijing, China. J. Environ. Manag. 2012, 100, 65–71. [Google Scholar] [CrossRef]
  11. Larson, L.; Jennings, V.; Cloutier, S.A. Public Parks and Wellbeing in Urban Areas of the United States. PLoS ONE 2016, 11, e0153211. [Google Scholar] [CrossRef]
  12. Li, Z.; Fan, Z.; Shen, S. Urban Green Space Suitability Evaluation Based on the AHP-CV Combined Weight Method: A Case Study of Fuping County, China. Sustainability 2018, 10, 2656. [Google Scholar] [CrossRef] [Green Version]
  13. Morales, D. The contribution of trees to residential property value. J. Arboricult. 1980, 6, 11. [Google Scholar]
  14. Tan, C.; Tang, Y.; Wu, X. Evaluation of the Equity of Urban Park Green Space Based on Population Data Spatialization: A Case Study of a Central Area of Wuhan, China. Sensors 2019, 19, 2929. [Google Scholar] [CrossRef] [Green Version]
  15. Jalkanen, J.; Fabritius, H.; Vierikko, K.; Moilanen, A.; Toivonen, T. Analyzing fair access to urban green areas using multimodal accessibility measures and spatial prioritization. Appl. Geogr. 2020, 124, 102320. [Google Scholar] [CrossRef]
  16. Jin, Y.; Wang, X. A Study of Green Space Resources and the Evaluation System. Urban Plan. Forum 2014, 1, 106–111. [Google Scholar]
  17. Wei, X.Y.; Cai, J.H.; Ye, Y.C.; Zhou, Y.; Liu, C.Q. Landscape pattern analysis and optimum design of park green space in Nanchang City, China based on GIS. J. Appl. Ecol. 2018, 29, 2852–2860. [Google Scholar]
  18. Hejkal, J.; Buttschardt, T.K.; Klaus, V.H. Connectivity of public urban grasslands: Implications for grassland conservation and restoration in cities. Urban Ecosyst. 2016, 20, 511–519. [Google Scholar] [CrossRef]
  19. Shen, S.; Chen, L.; Fan, C.; Gao, Y. Dynamic simulation of urban green space evolution based on ca-markov model-a case study of hexi new town of Nanjing city, China. Appl. Ecol. Environ. Res. 2019, 17, 8569–8581. [Google Scholar] [CrossRef]
  20. Zhang, Y.; Murray, A.; Turner, B. Optimizing green space locations to reduce daytime and nighttime urban heat island effects in Phoenix, Arizona. Landsc. Urban Plan. 2017, 165, 162–171. [Google Scholar] [CrossRef]
  21. Zhou, Z.; Shao, T.; Tang, W.; Wang, P.; Li, X.; Xu, Y. The different urban green-land spatial patterns and their environmental effects:A case of the central district of Yichang city, Hubei Province. Acta Ecol. Sin. 2004, 2, 186–192. [Google Scholar]
  22. Benoit. How Long Is the Coast of Britain? Statistical Self-Similarity and Fractional Dimension. Science 1967, 156, 3775. [Google Scholar]
  23. Jankovic, S. Sociological field, fractal distinctions and morals: On emergence of analytical sociology. Sociology 2019, 61, 5–31. [Google Scholar] [CrossRef] [Green Version]
  24. Lin, J.; Wang, Z.-J. Multi-area economic dispatch using an improved stochastic fractal search algorithm. Energy 2019, 166, 47–58. [Google Scholar] [CrossRef]
  25. Oh, S.; Ryu, K.; Moon, I.; Cho, H.; Jung, M. Collaborative fractal-based supply chain management based on a trust model for the automotive industry. Flex. Serv. Manuf. J. 2010, 22, 183–213. [Google Scholar] [CrossRef]
  26. Zuo, R.; Cheng, Q.; Xia, Q. Application of fractal models to characterization of vertical distribution of geochemical element concentration. J. Geochem. Explor. 2009, 102, 37–43. [Google Scholar] [CrossRef]
  27. Fernández, M. Fractal dimension for fractal structures. Topol. Appl. 2014, 163, 93–111. [Google Scholar] [CrossRef]
  28. Feng, Z.; Sun, X. Box-counting dimensions of fractal interpolation surfaces derived from fractal interpolation functions. J. Math. Anal. Appl. 2014, 412, 416–425. [Google Scholar] [CrossRef]
  29. Ouyang, P.; Yi, H.; Deng, Z.; Huang, X.; Yu, T. Boundary dimensions of fractal tilings. Fractals-Complex Geometry Patterns and Scaling in Nature and Society. World Sci. 2015, 23, 4. [Google Scholar]
  30. Feng, Y.; Liu, M.; Tong, X. Weighted radial dimension: An improved fractal measurement for highway transportation networks distribution. Geoinformation 2007, 6753, 67530. [Google Scholar] [CrossRef]
  31. Lan, T.; Zhang, H.; Wu, X.; Cao, W.; He, J. A Modified Radius Fractal Dimension for Capturing Spatial Complexity of a Pol-ycentric City. In Proceedings of the International Conference on Intelligent Earth Observing and Applications International Society for Optics and Photonics, Guilin, China, 23–24 October 2015; Volume 9808. [Google Scholar]
  32. Jennings, V.; Larson, L.; Yun, J. Advancing Sustainability through Urban Green Space: Cultural Ecosystem Services, Equity, and Social Determinants of Health. Int. J. Environ. Res. Public Health 2016, 13, 196. [Google Scholar] [CrossRef] [Green Version]
  33. Wolch, J.R.; Byrne, J.; Newell, J.P. Urban green space, public health, and environmental justice: The challenge of making cities ‘just green enough. Landsc. Urban Plan. 2014, 125, 234–244. [Google Scholar] [CrossRef] [Green Version]
  34. López, D.R.; Brizuela, M.A.; Willems, P.; Aguiar, M.R.; Siffredi, G.; Bran, D. Linking ecosystem resistance, resilience, and stability in steppes of North Patagonia. Ecol. Indic. 2013, 24, 1–11. [Google Scholar] [CrossRef]
  35. Veneri. Urban spatial structure in OECD cities: Is urban population decentralising or clustering? Papers Reg. Sci. 2018, 97, 4. [Google Scholar]
  36. Wang, K.; Gao, X.; Chen, T. Influencing factors for formation of urban and rural spatial structure in metropolis fringe area—Taking Shuangliu County of Chengdu in China as a case. Chin. Geogr. Sci. 2008, 18, 224–234. [Google Scholar] [CrossRef]
  37. Aly, D.; Dimitrijevic, B. An ecocentric approach to defining a public park system. Archnet-Ijar Int. J. Architect. Res. 2021. [Google Scholar] [CrossRef]
  38. Hyra, D.S. Conceptualizing the New Urban Renewal: Comparing the Past to the Present. Urban Affairs Rev. 2012, 48, 498–527. [Google Scholar] [CrossRef]
  39. Zhao, W. Recognition and Practice of Urban Renewal Theory. J. Hum. Settle. West. China 2018, 33, 1–11. [Google Scholar]
  40. Neal, S.; Bennett, K.; Jones, H.; Cochrane, A.; Mohan, G. Multiculture and Public Parks: Researching Super-diversity and Attachment in Public Green Space. Pop. Space Place 2015, 21, 463–475. [Google Scholar] [CrossRef]
  41. Nor, A.N.M.; Corstanje, R.; Harris, J.; Brewer, T. Impact of rapid urban expansion on green space structure. Ecol. Indic. 2017, 81, 274–284. [Google Scholar] [CrossRef]
Figure 1. Framework of the research ideas.
Sustainability 13 08554 g001
Figure 2. Location map of the research object.
Sustainability 13 08554 g002
Figure 3. Calculation results of the fractal dimension of urban park green space.
Sustainability 13 08554 g003
Figure 4. Comparison of the fractal results of the research objects.
Sustainability 13 08554 g004
Figure 5. Correlation diagram of the fractal dimension and complexity of the system structure.
Sustainability 13 08554 g005
Figure 6. Comparative analysis of the fractal dimension q-value and the fitting degree R2.
Sustainability 13 08554 g006
Figure 7. Distribution map of park green space scale of the research object.
Sustainability 13 08554 g007
Figure 8. Factors affecting the scale of park green space: natural base.
Sustainability 13 08554 g008
Figure 9. Illustration of fractal optimization thinking.
Sustainability 13 08554 g009
Table 1. Basic information of research objects.
CityBeijingShanghaiGuangzhouShenzhen
Current status Sustainability 13 08554 i001 Sustainability 13 08554 i002 Sustainability 13 08554 i003 Sustainability 13 08554 i004
Location distributionNorthern ChinaEastern ChinaSouthern ChinaSouthern China
Geographical environmentPlain cityAlluvial plain, facing the sea beside the riverHills, backed by mountains and facing the seaLower hills, coastal plains
Green space area5821.07 ha2929.49 ha2380.47 ha2254.34 ha
Total number of green spaces1375560363175
Urban spatial structureType of circle expansionType of multicenter circleType of cluster networkType of grouped ribbon
Park green space layoutStyle of ring radialStyle of corridor networkStyle of block decentralizedMixed type
Note: The total area and the total number of park green spaces are calculated based on the above 0.5 hectares of park green areas.
Table 2. List of urban park and green space scale classification boundaries.
CityLower Limit of Large Scale (hm2)Lower Limit of Medium Scale (hm2)Lower Limit of Small Scale (hm2)
Beijing11.25001.40630.5
Shanghai8.12501.01560.5
Guangzhou15.00001.87500.5
Shenzhen10.62501.32810.5
Average value11.25001.40620.5
Table 3. Statistical table of the insufficient grade of park green space.
CitiesNumber Ratio δInsufficient LevelInsufficient SeriesTotal SeriesProportion
Beijingδ9 = 1.25
δ10 = 0.511
m = 9 (0.703–1.406)
m = 10 (0.5–0.703)
21020%
Shanghaiδ4 = 0.909
δ9 = 0.739
δ10 = 0.033
m = 4 (16.25–32.5)
m = 9 (0.508–1.016)
m = 10 (0.5–0.508)
31030%
Guangzhouδ9 = 0.689m = 9 (0.5–0.938)1911%
Shenzhenδ7 = 1
δ9 = 0.512
δ10 = 0.318
m = 7 (2.656–5.313)
m = 9 (0.664–1.328)
m = 10 (0.5–0.664)
31030%
Publisher’s Note: MDPI stays neutral with regard to jurisdictional claims in published maps and institutional affiliations.

