Article

The Structural Relationship among Perceived Service Quality, Perceived Value, and Customer Satisfaction-Focused on Starbucks Reserve Coffee Shops in Shanghai, China

1
Department of Leisure Service Sport, PaiChai University, 55-40 Baejae-ro (Doma-Dong), Seo-Gu, Daejeon 35345, Korea
2
School of Cultural Industry and Tourism Management, Henan University, Kaifeng 475001, China
*
Author to whom correspondence should be addressed.
Sustainability 2021, 13(15), 8633; https://0-doi-org.brum.beds.ac.uk/10.3390/su13158633
Submission received: 25 June 2021 / Revised: 26 July 2021 / Accepted: 27 July 2021 / Published: 3 August 2021
(This article belongs to the Collection Intention and Tourism/Hospitality Development)

Abstract

:
In today’s increasingly competitive coffee industry, the point of running a good coffee shop is no longer to run a coffee and beverage shop simply, but to focus on the quality of service and the value that customers feel as a result. Previous studies have mainly discussed the customer satisfaction and behavioral intention of restaurants, while few studies have explored the influencing factors of customer satisfaction and behavioral intention of chain coffee shops. Given that the perceived service quality theory and DINESERV model can effectively predict customer satisfaction and behavioral intention, this study took 385 consumers in the first Starbucks Reserve flagship store in China as survey objects. SmartPLS 3.0 software was used to explore the relationship among respondents’ perceived service quality, customer perceived value, satisfaction, and behavioral intention. The results show that service quality has a partially significant positive effect on perceived value. Perceived service quality and customers’ perceived value both have significant positive effects on satisfaction. Customers’ satisfaction has a significant positive effect on their behavioral intention. These results indicate that enterprises should strengthen the emotional bond between consumers and enterprises and improve the reliability, assurance, and empathy of perceived service quality to create a better emotional resonance between consumers and the Starbucks brand to improve customer satisfaction. At the same time, it should also promote the symbolic perceived value of Chinese consumers to Starbucks to realize the sustainable development of coffee-shop operation and consumer repurchase. This study expands the research on the service quality, perceived value, and behavioral intention of coffee chain enterprises in the context of non-habitual coffee-drinking countries. Moreover, it provides case support for the operation and research of regional cultural consumption habits of international catering chain enterprises.

1. Introduction

Coffee is one of the most widely used non-alcoholic beverages, and its consumption is spreading globally. It is the second most crucial commodity exchange after crude oil in the world market [1]. Unlike the West, which regards coffee as a daily drink, China is a non-conventional coffee drinker who prefers traditional beverages, such as tea. In recent years, the acceptance of coffee has gradually been changing in China. Since 2010, the production of coffee beans in China has been increasing by the year. In 2016, the total output reached a maximum of 160,300 tons. In 2019, China’s coffee bean production was approximately 144,300 tons, an increase of nearly 100,000 tons over 2010. Coffee consumption in China also shows a trend of increasing. According to statistics from the Global Coffee Industry Trends released by the US Department of Agriculture at the end of June 2020, from 2019 to 2020, China’s coffee consumption was 3.25 million bags, equivalent to 195,000 tons (15 cups per capita per year), a year-on-year increase of 4.8% [2]. At the same time, China’s green coffee consumption is also increasing. Compared with 2012, green coffee consumption in 2018 increased by 250%. Although it only accounts for 2.4% of global green coffee consumption, the annual growth rate of coffee consumption in China is considerable. Chinese consumers’ demand for coffee continues to rise, and the growth rate of the coffee-shop market has also increased from 15.6 billion yuan in 2014 to 27.1 billion yuan. The data show that China’s coffee industry has a better market prospect.
The coffee market is an essential part of the food and beverage industry, and coffee consumption has been growing globally [3]. With the steady growth of average annual global coffee consumption, competition in the coffee market has become increasingly fierce [4]. Therefore, it is necessary to understand the consumer’s behavior preferences and their reasons. As one of the world’s largest and most successful coffee chain brands [5,6,7], Starbucks has approximately 30,000 stores worldwide. After entering the Chinese market in 1999, it has more than 4400 stores in more than 180 cities in Mainland China. In 2019, Starbucks’ global revenue reached US$26.5 billion, reaching a year-on-year increase of 7.2%. In the same year, the sales volume of Starbucks in Mainland China increased by 5%. Before the COVID-19 outbreak, Starbucks had predicted that, in the 2021 fiscal year, there would be a net increase of about 2000 Starbucks stores worldwide, of which the growth rate in China would be 10–19% [8]. With the rapid economic development and improved residents’ living standards, people’s lifestyles are changing. Foreign coffee culture is gradually being accepted by the Chinese and integrated into their daily lives.
The success of Starbucks worldwide is a hot topic in marketing management and other industry research. Existing studies have extensively discussed Starbucks’ brand value, brand assistance, and Starbucks’ ethnocentrism in developing countries from psychology, marketing, and management perspectives [9,10]. However, few studies are discussing Starbucks’ customer satisfaction and behavioral intentions from the perspective of the service quality provided by Starbucks. It is undeniable in developing countries (such as China), especially in emerging economies that are not habitually drinking coffee because the coffee culture in these countries developed later than in Europe and the United States. Furthermore, since the adaptability of the traditional service-quality model DINESERV in subdivided service industries has been controversial, the adaptability of its dimensions in the beverage industry, such as coffee shops, still needs further discussion.
In summary, the primary purpose of this study was as follows: First, in countries where coffee is not habitually consumed, the actual acceptance of new beverages, represented by Starbucks coffee, that started to be popular in China later is explored. This study tries to answer why and how Chinese coffee consumers have a better level of satisfaction and positive behavior intentions for chain coffee brands. Specifically, by constructing the relationship between perceived service quality, perceived value, customer satisfaction, and behavioral intentions, the determinants of satisfaction and behavioral intentions and their relationship are discussed. Second, by further identifying the commonalities and individualities between the existing models of service quality, this study further discusses whether the coffee and beverage service industry, a branch of the service industry subordinate to the catering industry, is suitable to use the DINESERV model and perform service quality in the context of developing countries. The evaluation of this model is used to measure the various effects that the model may have on consumers.
Finally, this study proposes targeted management and practical recommendations based on the empirical results, explaining how consumers’ perceived service quality affects their perceived value and promotes their satisfaction and behavioral intentions. The results will contribute to coffee business managers and operators reasonably judging consumer demand and value perception for coffee products and services, maintaining customer relationships, and achieving sustainable development in marketing.

2. Literature Review

2.1. Perceived Value

The development of the customer perceived value (CPV) theory originated from the thinking of product value by two management scholars, Peter F. Drucker and Michael E. Porter, in the last century. Given its importance in the field of service marketing, research on perceived value has received extensive attention [11,12,13,14]. Perceived value usually involves the trade-off between what customers get and what they give up to obtain service [15,16]. Studies related also believe that perceived value is a “consumer’s overall assessment of the utility of the product (or service) based on the perception of what they have received and what they have given” [15]. More specifically, perceived value comes from the trade-off between perceived benefit and perceived cost [17]. Based on this conceptual feature, existing studies have shown that perceived value can effectively predict customer satisfaction and behavioral intentions [18,19,20,21,22].
Although perceived value is a hot topic in related academic fields, there is no consensus on its definition. It is described as the customer’s utility, or the ratio of perceived benefits relative to sacrifice, quality, value, etc., according to the different context. In the catering industry and service industry, this study believes that perceived value represents the overall evaluation of the utility of the product or service after weighing the perceived benefits of customers and the cost of acquiring the product or service. It embodies the customer’s subjective perception of the value of the products or services provided by the company, which is different from the objective value of the products and services. The concept of customer perceived value is gradually accepted by people and is used when conducting in-depth research. There have been extensive discussions on the operationalization of the concept on perceived value. The common ones are mainly two-dimensional and multi-dimensional frames.
In the two-dimensional classification of perceived value, two frameworks are more popular. One is to divide perceived value into utilitarian value and hedonic value [23,24]. Utilitarian value refers to practical and rational evaluation related to monetary value [25]. It is defined as an overall value assessment that includes characteristics such as quality, convenience, and value for money [26]. Hedonic value is based on the positive emotional response experienced by consumers during the consumption process [27] and is based on sensory experience or emotional satisfaction related to product consumption [28,29].
Another framework is to divide perceived value into symbolic and functional values [26]. Moreover, the functional value represents consumers’ overall value evaluation of service or product quality, traditional cost-effectiveness, and convenience characteristics. Its function is to meet the tangible needs of users. In the coffee shop industry, empirical research has been conducted, and Du, Liu, and Sheth have used this dimension classification to conduct in-depth research in service areas such as hotels and electric vehicles [30,31,32]. This kind of classification has been widely cited. Therefore, this study decided to use the two-dimensional classification of functional value and symbolic value to explore the perceived value of chain coffee brand consumers. Symbolic value refers to the overall representative of the experiential value perception from the social, emotional, aesthetic, and reputation aspects, and its function is to meet the intangible needs of users.
In addition, some researchers have proposed a multi-dimensional framework. Sweeney and Soutar designed a four-dimensional perception value framework that includes the functional value (price), functional value (quality), social value, and emotional value [33]. Petrick and Backman developed a five-dimensional framework to measure the perceived value of restaurants, including quality, emotional response, currency prices, behavioral prices, and reputation [20]. Sanchez et al. developed a six-dimensional framework to measure the perceived value of travel agencies, involving the functional value of travel agencies (facilities); the functional value of travel agency liaison personnel (professionalism); and the functional value (quality) of purchased travel packages (quality), price value, emotions value, and social value [34].
The related research shows many different classification methods in the dimensional conceptual framework. However, the focus and content emphasis of these dimensional classifications are pretty different. At the same time, the service environment is rarely considered on the basis of the existing dimensional classification [35]. Because of this, this study decided to use the two-dimensional framework (functional value and symbolic value) based on the service perspective of Chen and Hu to explore the perceived value of chain coffee brand consumers [26]. This framework has been extensively empirically tested in service industries such as hotels and electric vehicles [30,31]. Furthermore, functional value and symbolic value can also cover the related content in several other dimensional frameworks, which has universal significance [26]. More importantly, the content expressed by functional value and symbolic value is more in line with coffee companies’ service and product content and has reasonable objectivity and maneuverability.

2.2. Perceive Service Quality

Since the 1970s and 1980s, with the development of the global economy, people’s consumption structure has been continuously upgraded, and the proportion of service consumption has become higher and higher. The research on service quality in the academic world has been enduring. Grönroos defines service quality as the result of a comparison of consumer expectations and perceptions. He pointed out that service quality is consumers’ subjective feeling, which is the combination of consumers’ expectations and the actual perception of the service [36]. If the actual service meets or exceeds the expectation, it will be beneficial to the enterprise. Gronroos, Parasuraman, Zeithaml, and Berry (PZB) believe that service quality is a subjective evaluation of customers after a series of studies relating banking, securities brokerage, and other service industries [36,37]. A large number of studies also believe that service quality is the comparison between expected service and perceived actual service [38,39,40,41]. Although service quality is a hot topic in the academic area, the definition has not yet been unified.
Extensive investigations have been conducted on the measurement of perceived service quality. The most famous one is the SERVQUAL model established by Parasuraman et al. [37]. This model is composed of two parts: consumers’ expected service quality and perceived service quality. Moreover, it is divided into five dimensions: reliability, responsiveness, assurance, tangibles, mobility, and empathy. Responsiveness indicates a quick response and the ability to get help if there is a problem or question. Tangibles refers to the physical surrounding and appearance of employees. Reliability stands for the extent to which all the service functions operate typically and consistently, with problems that arise being solved on time [42,43,44,45]. Assurance indicates the ability of employees to inspire trust and confidence. Empathy shows the individualized attention provided to customers. The evaluation of the SERVQUAL model depends on the degree of difference between the perceived service level and the expected service level by the user. The key to providing high-quality services is to exceed the user’s expectations.
Based on the SERVQUAL scale, Steven developed the DINESERV model for the service quality aim at the catering industry [46]. The DINSERV model is derived from the SERVQUAL model, which is an optimization and improvement of the SERVQUAL model. The model believes that customers can tell which restaurant meets their psychological expectations and value standards. Restaurants that fail to meet the standards will soon see a decline in the number of customers. DINESERV is a reliable and relatively simple tool for determining the evaluation of perceived quality. Its dimensional structure is the same as that of the SERVQUAL model (reliability, assurance, accountability, tangibility, and empathy). Later studies have further developed dimensions to measure the service quality of different industries, such as the service quality of group package tourism GPTCCC [47], the theme parks [48], festivals [49], electronics [50], casino [51], e-government [43], and hot spring hotel [52,53].
In the catering industry, the DINESERV model has been extensively tested and accepted. Compared with the SERVQUAL model, the DINESERV model focuses on the catering industry. At the same time, existing studies have used the DINESERV model to measure the service quality of coffee shops [54]. In view of this, considering that the target object of this research was coffee-beverage service, this research used the DINESERV model to explore the service quality of chain coffee brands. In addition, this research conducted only empirical research on perceived service quality. The reasons are as follows: First of all, this research is a survey of consumers in a non-coffee habitual country. The purpose of the research is to explore why and how consumers produce satisfaction and a willingness to repurchase to coffee, an unusual beverage. Therefore, the investigation of perceived service quality is a direct response to research purpose. Second, due to the strategic location of the Starbucks in Shanghai flagship store, the flow of people is relatively large, and the Starbucks brand has a long-standing reputation in China. Therefore, investigating consumers’ actual perceptions of coffee-shop service quality is far more practical than exploring their expectations.

2.3. Customer Satisfaction

Customer satisfaction (CS) is an important part of marketing. Since American scholars in the 1960s proposed it, it has been a hot topic in academic research. Cardozo pioneered the use of empirical research to analyze customer satisfaction. He pointed out that customer satisfaction is mainly influenced by two factors: consumers’ expectations of products and services and the actual products or services they have obtained. The level of customer satisfaction is determined not only by the quality of the products or services but also by way of acquisition, and customer satisfaction is the core factor affecting consumers’ repeated purchase behavior [55]. Since then, scholars from all walks of life have begun to study customer satisfaction from different perspectives. Howard and Sheth found that customer satisfaction is based on the consumer’s ability to pay and obtain. Lee and Goudeau argued that satisfaction is an assessment of the matching degree of perceived value and a psychological state resulting from it [56]. Oliver believed that customer satisfaction is the embodiment of consumers’ psychological satisfaction, and consumers experience is the basic function of products or services. In the context of the resulting degree of pleasure [57], Churchill pointed out that customer satisfaction is the inner comparison of consumers, resulting from the consumer’s income after using the products or receiving related services. In the context of the comparison cost [58], Crompton and MacKay claimed that customer satisfaction is the consumers’ perception, and this perception arises after consumers’ experience expectations of products or services. Then, the result of this comparison is customer satisfaction [59]. Customer satisfaction belongs to the category of emotional factors produced by comparing the post-consumer sensory system with the level of psychological expectations. The level of customer satisfaction depends on consumers’ evaluation of service quality, which in turn affects consumers’ willingness to consume next time [60].

2.4. Behavioral Intention

Behavior intention is a measure of customer loyalty to the product that shows customers’ repurchase and recommendation intention. Customer loyalty is consumers’ preference to choose products or services, indicating that consumers may have repeatedly purchased the brand product many times. The intensity and duration of such consumption is customer loyalty. However, this repeated purchase process has not yet been explained in detail, and the research also has a certain degree of subjectivity. Subsequent studies have shown that preference for repeat purchases may be result from spatial convenience or a regional monopoly of product type. If competitive products appeared or are purchased more conveniently, this preference may be eliminated. Olive reviewed the research gap in prior studies, defining customer loyalty as the inherent persistent purchase preference, which will not change due to the change of sales environment or practices but is a kind of continuous consumer credit attitude. However, Gremler et al. believed this definition ignores consumption behavior and considers customer loyalty a combination of behavior and attitude. In this context, customer loyalty means consumers’ continuous purchase of certain products or services and their positive perception of the purchase process [61]. Therefore, the discussion about customer loyalty focuses on behavioral loyalty and attitude loyalty. However, behavioral loyalty is difficult to measure objectively, and it is susceptible to many factors. Therefore, judging the behavior intention of customers through attitude loyalty has become the mainstream research method.
In the 1990s, studies on behavior intention emerged in the service categories or products such as hotels, resorts, tourist commodities, or entertainment projects in tourism-related industries. As behavior intention is affected by customers’ subjective and external environment, factors such as tourism motivation, perceived value, and perceived risk will have certain positive or negative impacts [57,61].
By analyzing the above loyalty and behavior intention literature, this study holds that the behavioral intention represents the customer’s preference and trust, the willingness to purchase repeatedly, and the willingness to recommend a certain brand to families or friends.

2.5. Hypothetical Relationship

2.5.1. The Relationships between Service Quality and Perceived Value

There is an important relationship between the customer perceived service quality and perceived value [45]. In the context of coffee shop service, Wang and Yu developed a perceived value model and then conducted empirical research where service quality has a positive impact on perceived value [29]. Ali et al. pointed out that good service quality can improve customers’ perception of the value of a product or service. If the quality of service is excellent, then customers will be satisfied, and the perceived value will be higher [62]. Bashir studied the relationship between service quality and perceived value in the field of electronic banking. It is found that, the higher the service quality, the higher the perceived value of customers using e-banking [45]. Chen and Hu found, in an empirical survey, that, the higher the service quality, the higher the perceived value in the field of marketing [26].
In the research of the relationship between quality and perceived value, most of the empirical studies have pointed out that service quality positively influences perceived value [26,27]. Therefore, the relationship between service quality and perceived value is examined hypothetically, and the hypotheses are developed as follows:
Hypothesis 1.
Perceived service quality has a positive effect on perceived value.

2.5.2. The Relationships between Perceived Service Quality and Satisfaction

Perceived Service quality is committed to improving customer satisfaction and the company’s market share [37,63,64,65]. The relationship between service quality and satisfaction has been extensively verified in various studies. For example, Pakurá and Raza both found that, the higher the service quality of the bank, the higher the degree of customer satisfaction [44,60]. Marinković et al. believes that the high level of service quality of travel agencies is related to tourists’ high level of satisfaction, and there is a significant positive correlation between them [66]. Zeithaml et al. explored the catering service industry and found that customers’ perception of service quality is the key factor in customer satisfaction [67]. Other studies also verified this conclusion and got similar results [44,66]. In summary, most existing studies believe that service quality has a significant positive impact on satisfaction. Therefore, this study puts forward the following hypothesis about the relationship between service quality and satisfaction:
Hypothesis 2.
Perceived service quality has a positive effect on satisfaction.

2.5.3. The Relationships between Perceived Value and Satisfaction

Perceived value is considered to be one of the determinants of customer satisfaction. Studies have shown that perceived value strongly affects customer satisfaction [12,68]. Wu et al. explored the relationship between patients’ perceived value and satisfaction in the field of medical tourism and found that, the higher the patients’ perceived value, the higher their satisfaction [69]. Eid explored the relationship between perceived value and satisfaction in the tourism industry [70]. The study found that, when tourists obtained psychological and emotional satisfaction during the travel process or believe that their cost has received the corresponding service, their satisfaction will be significantly improved. Related studies on the relationship between perceived value and satisfaction mostly agree that service quality has a significant positive impact on satisfaction [45,71,72]. Therefore, the relationship between perceived value and satisfaction is assumed as follows:
Hypothesis 3.
Perceived value has a positive effect satisfaction.

2.5.4. The Relationship between Satisfaction and Behavior Intention

Many studies have shown that customer satisfaction can positively promote their behavior intentions [26,30,73,74]. Changes in customer satisfaction levels will directly affect their intention to revisit, repurchase, and word-of-mouth communications. Therefore, this study assumes the following assumption about the relationship between customer satisfaction and behavioral intentions.
Hypothesis 4.
Satisfaction has a positive effect on behavior intention.

3. Research Method

3.1. Study Location

This survey was conducted at the Shanghai Starbucks Reserve coffee shop. It was chosen as the study location focus for two reasons. Firstly, Shanghai is a worldwide city in the world. It was listed as the global financial center, ranking third in the Global Financial Centres Index (“GFCI 28 Rank”), after New York and London. [75]. Furthermore, Shanghai is China’s economic, financial, and trade center. It was approved to establish Shanghai Free Trade Zone in 2013 [76]. Moreover, it achieves a significant position in the world of finance and commerce, ranking 5th in the world in 2020 [77]. Nowadays, it is the second most-populous city in China [78].
Another reason is that the world’s biggest Starbucks coffee shop, the Reserve Roastery, was opened at Nanjing Road in Shanghai and measures with 30,000 sq. ft. (2787 sq. meters). Nanjing Road in Shanghai is equivalent to New York’s Fifth Avenue and France’s Champs Elysées. This street is famous for luxury shops and various high-end shopping malls [79]. Since opening in December, the cafe is usually packed with customers and, at peak times, has a line out the door. As the first Starbucks Reserve Roastery and Tasting Room outside the United States, the Shanghai Starbucks Reserve Roastery has welcomed an average of 8000 customers every day since its opening, with about 40 percent of its customers coming from overseas [80].
China has gradually become an indispensable partner for Starbucks Corporation. In terms of China’s coffee-market-share ranking, Starbucks has a market share distribution of 51%. With the increasing number of Starbucks stores, the return rate is increasing year by year and higher than in other countries. In the future, China will surpass the US and become the largest market for Starbucks’ global revenue [80].
When one enters the Starbucks Reserve Coffee shop, one will find that the store has taken great care to set up a coffee-bean-roasting facility in the center of the first floor and a large Chinese bronze bucket with tea drinks. There are also various coffee-related cultural displays and specialty chocolate and bread booths. The second floor is Starbucks’ tribute to the tea industry, TEAVANA. It is just as impressive as the coffee bar. In addition to tea, the second floor features a cold-brew-coffee area, a pastry and bakery counter, another brew station, and a coffee bar, as well as a roaster. There is plenty of seating on the second floor for people to sit and enjoy their drinks and occasionally hear the sound of coffee beans shooting out of the pipes above. The menu of Starbucks Reserve in Shanghai is quite extensive. Their unique marketing approach has attracted many residents and coffee-loving Starbucks tourists from all around the world to flock to the Starbucks Reserve Roastery to experience it. People visiting Shanghai today have a huge passion for this coffee shop. Opened on 5 December 2017, the Shanghai Starbucks Roastery is now a commercial landmark in the city, and it was also listed in the 2018 Shanghai Industrial Tourism Attractions Demonstration Unit. In general, Starbucks Reserve Roastery is not only a coffee chain. It is also a tourist destination with the characteristics of coffee culture display and dissemination. This is also the main reason why we selected this iconic case site for our study [79].

3.2. Questionnaire Development

Based on the requirements of DeVellis [81] and Churchill and Gilbert [82] on questionnaire development and dimension management, this study developed a self-administered questionnaire for empirical research on the relationship between service quality, perceived value, customer satisfaction, and behavioral intention. The self-administered questionnaire consisted of four sections: Firstly, DINESERV (service quality), with five dimensions, by Steven et al., was adopted in a coffee chain brand to understand customers’ service needs and perceptions for service improvement. The five dimensions are reliability, assurance, responsiveness, tangibles, and empathy, with 29 indicators in total [15,60,65,83]. Secondly, the perceived value, which had two dimensions (symbolic value and functional value) with eight indicators, was adopted from the theory of perceived value demonstrated by Zeithaml et al. [65], Eid [70], Yen and Teng [84], Albrecht [85], and El-Adly [72] to measure consumers’ perceived value after experiencing a Starbucks Reserve Roastery versus the cost of the product or service. Thirdly, the customer satisfaction section had four indicators adopted from Cardozo to measure the customers’ satisfaction on Starbucks Reserve Roastery in Shanghai [55]. Fourthly, the behavioral intention section had two indicators adopted from Tucker to explore customers’ intention to revisit and spread word of mouth about Starbucks Reserve Roastery [86]. Finally, the demographic profile section was composed of gender, age, occupation, education level, and monthly income level adopted from Song et al. [87]. In the first five sections, all the indicators were measured on a five-point Likert scale ranging from 1 = “strongly disagree” to 5 = “strongly agree”.

3.3. Data Collection and Analysis

The survey was conducted from 21 to 30 August 2018, in Shanghai, China. A self-administrated questionnaire was used to collect samples. Five hundred samples were sent out to the customers in Shanghai Starbucks Reserve Roastery, and 450 questionnaires were collected. Three hundred eighty-six samples were finally retained after excluding the invalid samples due to incomplete and not serious enough, with an effective rate of 85.7%.
In this study, SPSS 24.0 and SmartPLS 3.0 were used to analyze the data. Descriptive analysis was undertaken by using SPSS 24.0. The measurement model, structural model, and the proposed hypotheses were tested by using the partial least squares structural equation model (PLS-SEM) through SmartPLS 3.0. Compared to the traditional covariance-based SEM, PLS-SEM is preferred for theory broadening and development, especially for predicting a target construct (e.g., behavioral intention) [88].

4. Results

4.1. Respondents’ Profile

In this part, descriptive analysis is utilized to show the characteristics profiles of respondent’s characteristics. Table 1 shows the gender, age, occupation, education, income, frequency of coffee shop visits, and marital status of the respondents.
The demographic profile of this study’s research subjects is as follows: The proportion of female respondents (60.9%) is higher than that of male (39.1%). In terms of age, most of the respondents were in the 25–34 age range (45.3%), and the remaining 15–24 years old, 35–44 years old, and 45–59 years old accounted for 28.5%, 11.4%, and 14.5%, respectively. Respondents’ occupations involve students (18.7%), sales and service personnel (7.5%), technicians or academicians (14.2%), office workers (32.1%), self-employed workers (6.0%), retirement and unemployment (5.4%), professors and teachers (4.9%), and others (11.1%). Half of the respondents’ academic qualifications are college (54.9%), followed by high school (23.3%), master’s or doctoral degree (19.9%). In terms of income, the monthly income of the respondents is mainly distributed in the range of 0–6000 yuan (36.8%) and 6001–12,000 yuan (33.7%), with 12,000 yuan or more accounting for 29.5%, specifically 12,001–18,000 for 14.2%, 18,001–24,000 is 4.9%, and 24,001–30,000 is 3.9%. Most people visit coffee shops less than 3 times per month (54.4%) or 4–7 times per month (30.8%). In terms of marital status, 65.5% of the respondents were unmarried, and the remaining 34.5% were married.

4.2. Measurement Model

As mentioned earlier, the proposed research model was estimated with PLS-SEM, using SmartPLS 3.0. According to Hair et al. [89,90], the model fit of the measurement model can be performed by using criteria such as factor loading (>0.7), composite reliability (CR) (>0.7), Cronbach’s α (>0.7), and average variance extracted (AVE) (>0.5) to achieve. Then, the AVE values should be greater than the squared inter-construct correlations of corresponding constructs to gain a better discriminative validity [91].
Table 2 shows that all factor loadings were above the cutoff value of 0.7 and AVE values were above the required criteria of 0.5, thereby confirming convergent validity of the measurement model. Cronbach’s α and CR were also above the required criteria of 0.7, thereby supporting the reliability of the model. Table 3 shows that all square roots of the AVE values were greater than the correlations of the corresponding constructs, which confirms discriminant validity [91].

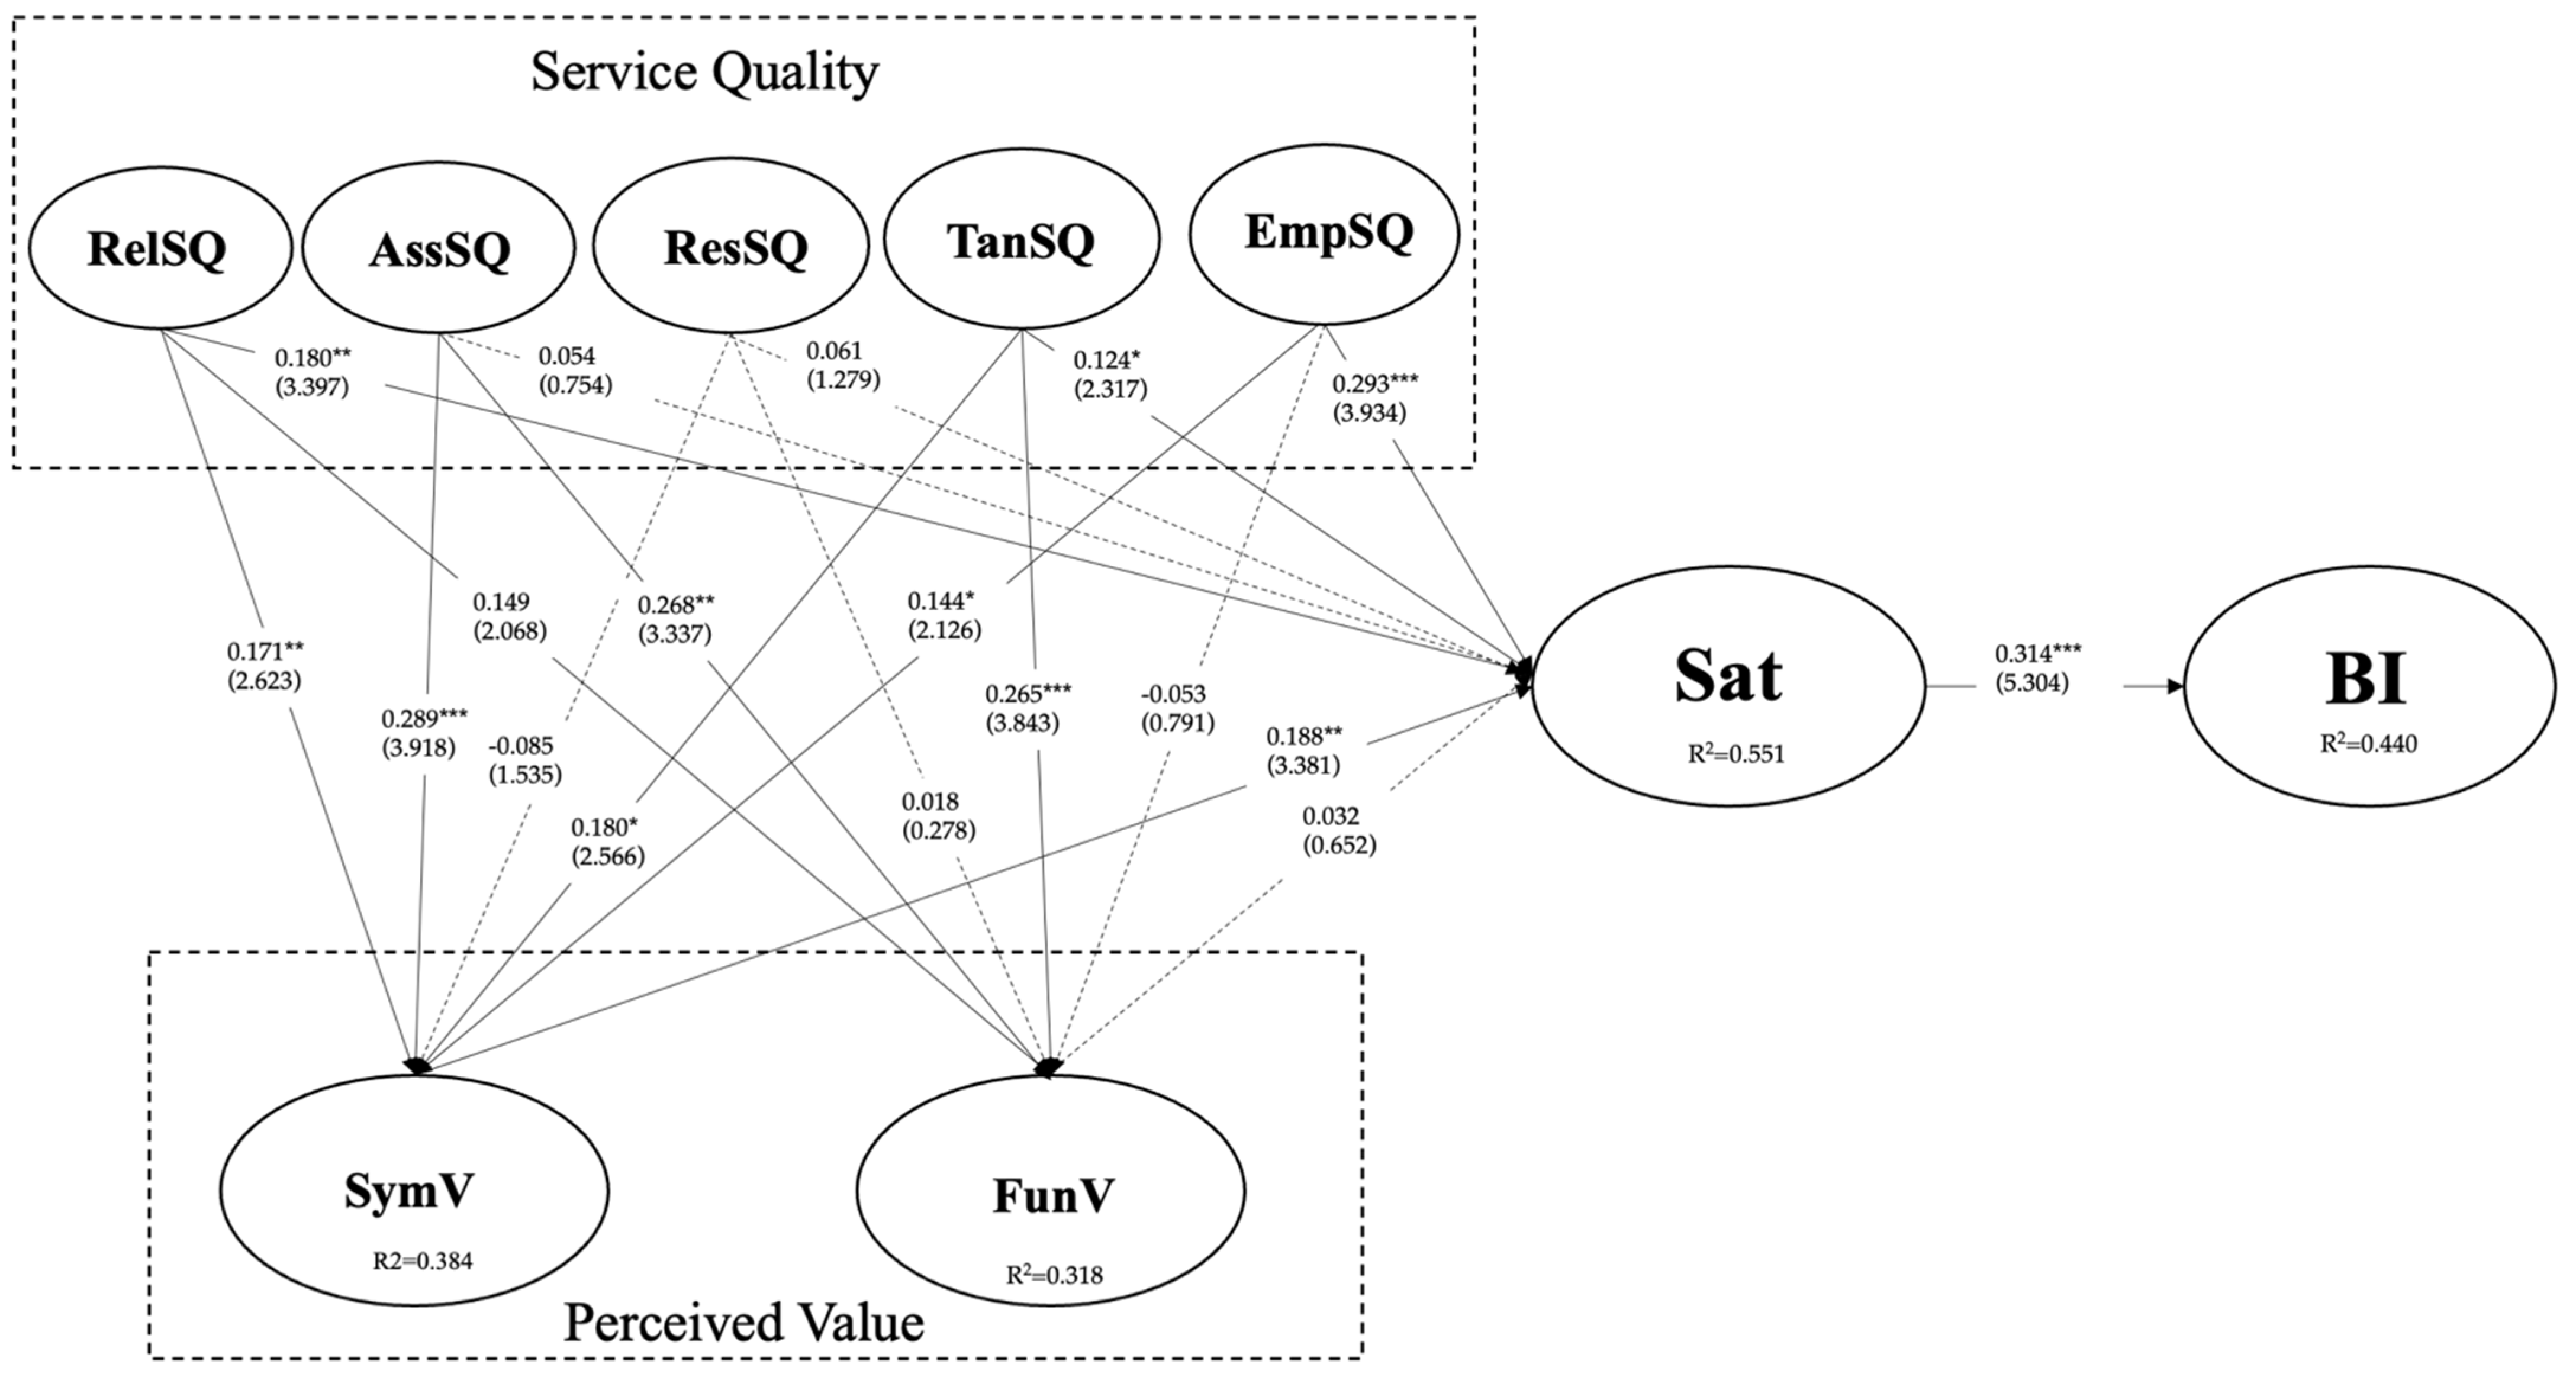
4.3. Structural Model and Hypothesis Testing

The structural model was tested by running a Bootstrap re-sampling procedure of 3000 samples, using SmartPLS 3.0. Previous studies on SmartPLS [89,90,92] recommend the following criteria to assess the model fit of the structural model: variance inflation factor (VIF) (<3.0), coefficient of determination (R2) (>0.25), and standardized path coefficients. Table 4 shows that all VIF values were below the cutoff value of 3.0, indicating the absence of a multi-collinearity problem. Figure 1 shows that all R2 values ranged from 0.318 to 0.551, indicating an adequate predictive power of the proposed model.
Figure 1 shows that reliability (β = 0.171, t = 2.623, p < 0.01), assurance (β = 0.298, t = 3.918, p < 0.001), tangibles (β = 0.180, t = 2.566, p < 0.05), and empathy (β = 0.144, t = 2.126, p < 0.05) positively affected symbolic value, while responsiveness has no significant effect on symbolic value. Therefore, H1-1a (RelSQ→SymV), H1-1b (AssSQ→SymV), H1-1d (TanSQ→SymV), and H1-1e (EmpSQ→SymV) are supported, but H1-1c (ResSQ→SymV) is not supported. Furthermore, reliability (β = 0.149, t = 2.068, p < 0.05), assurance (β = 0.268, t = 3.337, p < 0.01), and tangibles (β = 0.268, t = 3.843, p < 0.001) positively affected functional value, while responsiveness and empathy did not significantly affect functional value. Therefore, H1-2a (RelSQ→FunV), H1-2b (AssSQ→FunV), and H1-2d (TanSQ→FunV) are supported, but H1-2c (ResSQ→FunV) and H1-2e (EmpSQ→FunV) are not supported. As for satisfaction, it is found to be affected by reliability (β = 0.180, t = 3.397, p < 0.01), tangibles (β = 0.124, t = 2.317, p < 0.05), empathy (β = 0.293, t = 3.934, p < 0.001), and symbolic value (β = 0.188, t = 3.381, p < 0.01) positively, but not be influenced by assurance, responsiveness, and functional value. Therefore, H2a (RelSQ→Sat), H2d (TanSQ→Sat), H2e (EmpSQ→Sat), and H3a (SymV→Sat) are supported, but H2b (AssSQ→Sat), H2c (ResSQ→Sat) and H3b (FunV→Sat) are not supported. Additionally, it is found that satisfaction has a positive effect on behavioral intention (β = 0.663, t = 21.609, p < 0.001); thus, H4 is supported.

5. Discussion and Implications

This study explores the relationship among service quality, perceived value, satisfaction, and behavioral intention of the brand chain coffee shop by taking the visiting customers of Starbucks in Shanghai flagship store as the survey objects. The study results explain why and how Chinese coffee consumers decide to visit Starbucks Reserve Café Shanghai. This study is of great significance to guide coffee chain enterprises and their marketing personnel to achieve higher coffee-brand stickiness.
In developing countries, especially those that are non-conventional coffee-drinking countries, it is necessary to pay attention to the adaptability of the existing dimensional framework and evaluation system of perceived service quality. In this study, the responsiveness and empathy of service quality do not significantly affect the functional perceived value and symbolic perceived value. Service-quality guarantee, service-quality responsiveness, and functional perceived value do not significantly determine customers’ satisfaction. Therefore, the existing service quality and perceived-value framework need more adaptive discussions in developing countries and non-conventional coffee-drinking countries.
In terms of practice and management implications, this study provides some management and marketing suggestions for service-oriented enterprise managers from Starbucks’ business perspective. First, improve the quality of service. The research shows that perceived service quality is an essential factor that affects customers’ perceived value. Business operators can organize professional skills and individual quality training to service personnel to provide accurate services to customers quickly. At the same time, besides intangible services, such as the professionalism and attitude of service personnel, operators also need to pay attention to store decoration and facade design to reflect a tangible atmosphere that matches the brand and product. In addition, the number of parking spaces (including parking services), the sanitation in the coffee shop, and the dressing of service personnel are also in the area of service quality improvement, which coffee-chain store operators need to consider. For example, service personnel should carefully observe consumers’ demands for products and promptly inform the product’s taste, the suitability of the crowd, and optional choice. Let them feel the responsiveness and guarantee in the service process and enhance their relationship with the customer coffee shop so that emotional connection can be promoted and subjective evaluation can be improved.
Second, improve the customers’ symbolic perceived value. The conclusion shows that the perceived symbolic value of customers will positively affect customers’ satisfaction. Therefore, it is vital to enhance the symbolic perceived value of customers. Coffee-shop managers should focus on establishing deeper communication and contact with coffee consumers in emotional and psychological aspects, such as psychology, emotion, aesthetics, and reputation. For example, targeted-language and body-language training can be used to improve the expression of employees so that customers can generate more robust emotional feedback in the consumption process. In addition, business operators can also use creative and content-oriented advertising strategies to deepen the brand image, respect, and emotion in the consumers’ market, and then rely on excellent brand prestige to affect consumers’ emotional value and social value indirectly. In this way, the enterprise can realize the promotion of customer satisfaction, the guidance of repurchase behavior, and the formation of a good reputation.
Finally, pay attention to the sustainable development of services. Whether it emphasizes service quality or the management of symbolic perceived value, the ultimate goal is to improve customers’ satisfaction and behavioral intentions(loyalty). From the perspective of the service process, positive customer satisfaction and behavioral intentions mean that service production and consumption have achieved a sustainable cycle. In the context of sustainable development goals (SDGs) advocated by the United Nations, coffee-shop managers should focus on improving the sustainability of the service process. This kind of sustainability is embodied in the change-of-service concept from customer-centric to life-centric. At the macro-level, customers’ needs should be placed at the core of business operations while maintaining the dynamic balance among corporate profitability, customer perceived value, coffee-product-manufacturing technology, and the coffee market environment are vital to achieving goal-driven marketing. At the micro-level, this requires managers and operators to simplify the complex service process to create a valuable coffee-consumption experience. For example, enterprises can continue to promote the low-energy-consumption materials for coffee packaging and store decoration, the usage of energy-saving electronic products, and self-carrying food containers.

6. Conclusions

This study explored the relationship among service quality, perceived value, satisfaction, and behavioral intention of the brand chain coffee shop by taking the visiting customers of Starbucks in Shanghai flagship store as the survey objects. The study results explain why and how Chinese coffee consumers decide to visit Starbucks Reserve Café Shanghai. This study is of great significance to guide coffee chain enterprises and their marketing personnel to achieve higher coffee brand stickiness.
The results show that the service quality of branded chain coffee shops has a partial significant positive impact on perceived value [18,93,94] which agrees with the study of Park’s [95]. Among them, the dimensions of reliability, assurance, tangibility, and empathy of perceived value have significant positive effects on symbolic value. This conclusion is consistent with the previous research of Lai and Chen that determined that high-quality service quality can effectively improve the symbolic value of customers’ perceived value [96].
The better the professionalism of corporate service personnel, the better the external image of the company, and the higher the ability to meet the needs and wishes of customers, the more likely it is for customers to obtain the symbolic value brought by social emotions, aesthetics, and reputation.
In addition, if the staff in the coffee shop are highly professional, and the equipment, personnel, and communication carriers related to the service can better maintain the consistency and professionalism, then customers can feel that the cost they have paid in obtaining services is worthwhile, and they have obtained satisfactory service quality. This is consistent with Tam’s study, which finds that higher quality reliability, assurance, tangibles, and service quality can effectively enhance the functional value of the customer’s perceived value [94].
However, in this study, good responsiveness during the service of Starbucks could not significantly promote the generation of functional perceived value and symbolic perceived value, which was contrary to the previous research conclusions. The possible explanation is that, in this study, the subject was Starbucks Reserve Coffee Shop, which is very large, located in Shanghai. Moreover, the massive queue has been the norm because of the prosperous location and large customer flow. At the same time, in recent years, many chain tea brands have emerged in China whose consumers often have to queue for more than one hour to get the products they need [97]. To some extent, Chinese consumers have better patience with famous brand chain catering enterprises. Therefore, consumers’ perceived efficiency of service personnel in handling consumer needs during peak hours does not affect their evaluation of Starbucks’ functionality and symbolic value and products.
In addition, this study also finds that empathy in service quality has no significant positive impact on functional value in perceived value, which is contrary to some previous research conclusions. Possibly because coffee is a gourmet experience, the quality of the experience is determined by the taste and flavor and has little to do with the emotional exchange and communication in the service process. As a result, the empathetic services that customers receive during the consumption process may not be enough to make them believe that the price they paid is the proper return.
This study also shows that service quality has partial significant positive effects on satisfaction. Reliability, tangibles, and empathy in service quality are essential prerequisites for determining customer’s satisfaction. Such a conclusion is consistent with some study results [44,93], which show that a higher trust in the coffee shop, a better evaluation of internal facilities, and more attentive service perceived by customers can lead to a higher level of satisfaction.
However, the study also finds that the guarantee and responsiveness of service quality did not significantly positively impact customer satisfaction, which is contrary to previous studies. The possible explanation is that Starbucks coffee has a good brand effect and customer stickiness in China, and all kinds of coffee products have a good reputation and emotional identity. At the same time, the Starbucks Shanghai flagship store has been meticulously planned in terms of decoration, atmosphere, and service. Therefore, during consumption, customers’ satisfaction may not be determined by the guarantee and responsiveness of the service quality.
The symbolic value of perceived value has a significant positive effect on satisfaction [93]. This conclusion indicates that, the better the customers’ experience (including psychology, emotion, aesthetics, and reputation) in the process of enjoying the service in the coffee shop, the more likely they are to get a better satisfaction level. However, functional value of perceived value does not significantly positively impact satisfaction in this study, contrary to the existing research conclusions. The possible reason is that symbolic value, which represents how customers improve their views of products and services and how they enjoy themselves in fashionable coffee shops with good reputations, which is a decisive value perception beyond functional value [26].
The findings confirm that higher customer satisfaction could increase behavior intention. The quality of satisfaction is an essential factor for consumers to decide whether to continue buying Starbucks coffee [93,98]. In short, the more satisfied customers are with the service they enjoy in the Shanghai Starbucks flagship store, the more likely they will revisit the coffee shop and convey an excellent word-of-mouth [26].
The potential contributions of this research are as follows: First, this research explored the relationship and mechanism of consumers’ perceived service quality, perceived value, satisfaction, and behavioral intentions in the context of non-conventional coffee-drinking countries. In this study, we found that coffee is a common and popular daily drink in Western countries, while Asian countries, represented by China, Japan, India, and Sri Lanka, are different. Tea is the main beverage for daily consumption. Therefore, many Chinese consumers are not accustomed to drinking coffee that tastes sour and bitter, different from traditional sweet or fragrant beverages. Given this, this study further explored the perceived service quality, perceived value, and behavioral intentions of consumers in the non-conventional coffee-drinking countries to Starbucks, a well-known global coffee chain company. In previous studies, service quality and perceived value are often applied to restaurants in Western countries. Therefore, this study expanded the application areas of the relationship between related variables. It also offers a gaze and evaluation of Starbucks and the coffee-beverage industry from an Asian perspective.
Secondly, this research discusses the application of the DINESERV framework in coffee chains, especially in developing countries. The framework has been widely used in developed countries and restaurants before [46,99,100,101,102], but the research conclusions further extend the application scope of the service quality.
Thirdly, the study found some interesting conclusions. For example, responsiveness and empathy of service quality cannot determine functional perceived value. At the same time, the guarantee and responsiveness of service quality and the functional value of perceived value cannot determine consumer satisfaction. Therefore, it can be inferred that, in non-conventional coffee-drinking countries, beverages such as coffee have to rely on taste and quality to attract consumers. The traditional service quality and perceived value framework cannot fully interpret why and how consumers are satisfied with related products and their behavioral intentions. This conclusion expands the consumer’s understanding of the satisfaction evaluation of coffee products, repurchase, word-of-mouth (loyalty), and user stickiness.

7. Limitations and Future Research

This study has some limitations. The limitations of the study are mainly three kinds. First of all, because the object of the study is China’s commercial center, Shanghai, the current results can only explain the consumption propensity of consumers in China’s first-tier cities to a certain extent. However, on a China-wide scale, the results in this study still need in-depth discussions through more cases and chain coffee brands. Second, according to the attitude theory, the generation of people’s behavior requires the process of cognition and emotion. In this research, perceived value, service quality, satisfaction, and behavioral intention are mature models. The related studies emphasize the mechanism of coffee-purchase behavior from a cognitive level. Future research can try more to explore the variables of consumers’ feelings about products, such as brand attachment, brand preference, etc., to explain the process of brand stickiness better. Finally, since the empirical investigation of this study was conducted in 2019, the respondents were not severely affected by the COVID-19 epidemic. China’s business is rapidly recovering in the context of China’s stricter epidemic prevention and control policies. The impact of the epidemic on the behavioral intentions of Chinese coffee consumers still needs to be further explored. Therefore, it is necessary to re-verify relevant content in the post-epidemic era.

Author Contributions

Conceptualization, Y.G., Q.Y. and K.P.; methodology, Y.G., Q.Y. and, K.P.; software, Y.G., Q.Y. and K.P.; validation, Y.G., Q.Y. and K.P.; formal analysis, Y.G., Q.Y. and K.P.; investigation, Y.G., Q.Y. and K.P.; resources, Y.G., Q.Y. and K.P.; data curation, Y.G., Q.Y. and K.P.; writing—original draft preparation, Y.G.; writing—review and editing, Y.G., Q.Y., Y.W. and K.P.; visualization, Y.G., Q.Y. and K.P.; supervision, K.P.; project administration, Y.G., Q.Y. and K.P.; funding acquisition, Y.G. and Q.Y. All authors have read and agreed to the published version of the manuscript.

Funding

This paper did not receive external funding.

Informed Consent Statement

Informed consent was obtained from all subjects involved in the study.

Conflicts of Interest

The authors declare no conflict of interest.

References

  1. Haile, M.; Kang, W.H. The role of microbes in coffee fermentation and their impact on coffee quality. J. Food Qual. 2019. [Google Scholar] [CrossRef]
  2. Sohu. Analysis on Market Size, Competition Pattern, and Development Prospect of Chinese Coffee Industry. Available online: https://www.sohu.com/na/472203725_120991242 (accessed on 15 June 2021).
  3. Cardello, A.V. Food quality: Relativity, context and consumer expectations. Food Qual. Prefer. 1995, 6, 163–170. [Google Scholar] [CrossRef]
  4. Chinappa, R.K.; Rajashekar, H. Export performance: Indian coffee. SCMS J. Indian Manag. 2012, 9, 46–54. [Google Scholar]
  5. Kuo, Y.F.; Wu, C.M.; Deng, W.J. The relationships among service quality, perceived value, customer satisfaction, and post-purchase intention in mobile value-added services. Comput. Hum. Behav. 2009, 25, 887–896. [Google Scholar] [CrossRef]
  6. Kable. Starbucks Coffee Roasting Plant, United States of America. Available online: http://www.foodprocessing-technology.com/projects/starbucks-roasting/starbucks-roasting2.html (accessed on 20 October 2016).
  7. Wu, H.C. What drives experiential loyalty? A case study of Starbucks coffee chain in Taiwan. Br. Food J. 2017, 119, 468–496. [Google Scholar] [CrossRef]
  8. Baidu. Starbucks’ Year End Summary in 2020. Available online: https://baijiahao.baidu.com/s?id=1685702504438435650&wfr=spider&for=pc (accessed on 12 December 2020).
  9. Richey, L.A.; Ponte, S. Brand aid and coffee value chain development interventions: Is Starbucks working aid out of business? World Dev. 2021, 143, 105–193. [Google Scholar] [CrossRef]
  10. Areiza-Padilla, J.A.; Cervera-Taulet, A.; Manzi Puertas, M.A. Ethnocentrism at the Coffee Shop Industry: A Study of Starbucks in Developing Countries. J. Open Innov. Technol. Mark. Complex. 2020, 6, 164. [Google Scholar] [CrossRef]
  11. Cronin, J.; Brady, M.; Brand, R.; Hightower, R.; Shemwell, D. A cross-sectional test of the effect and conceptualization of service value. J. Serv. Mark. 1997, 11, 375–391. [Google Scholar] [CrossRef]
  12. Patterson, P.; Spreng, R. Modelling the relationship between perceived value, satisfaction and repurchase intention in a business-tobusiness, service context: An empirical examination. Int. J. Serv. Ind. Manag. 1997, 8, 414–434. [Google Scholar] [CrossRef]
  13. McDougall, G.; Levesque, T. Customer satisfaction with services: Putting perceived value into the equation. J. Serv. Mark. 2000, 14, 392–410. [Google Scholar] [CrossRef]
  14. Varki, S.; Colgate, M. The role of price perceptions in an integrated model of behavioral intentions. J. Serv. Res. 2001, 3, 232–240. [Google Scholar] [CrossRef]
  15. Zeithaml, V.A. Consumer perceptions of price, quality and value: A means-end model and synthesis of evidence. J. Mark. 1988, 52, 2–22. [Google Scholar] [CrossRef]
  16. Monroe, K. Pricing—Making Profitable Decisions; McGraw-Hill: New York, NY, USA, 1991. [Google Scholar]
  17. Lovelock, C.H. Service Marketing, 4th ed.; Prentice Hall International: Hoboken, NJ, USA, 2000. [Google Scholar]
  18. Cronin, J.J.; Brady, M.K.; Hult, G.T.M. Assessing the effects of quality, value and customer satisfaction on consumer behavioral intentions in service environments. J. Retail. 2000, 76, 193–218. [Google Scholar] [CrossRef]
  19. Petrick, J.F. The roles of quality, value and satisfaction in predicting cruise passengers’ behavioral intentions. J. Travel Res. 2004, 42, 397–407. [Google Scholar] [CrossRef]
  20. Petrick, J.F.; Backman, S.J. An examination of the construct of perceived value for the prediction of golf travelers’ intentions to revisit. J. Travel Res. 2002, 41, 38–45. [Google Scholar] [CrossRef]
  21. Woodruff, R.B. Customer value: The next source for competitive edge. J. Acad. Mark. Sci. 1997, 25, 139–153. [Google Scholar] [CrossRef]
  22. Chen, C.F. Investigating structural relationships between service quality, perceived value, satisfaction, and behavioral intentions for air passengers: Evidence from Taiwan. Transp. Res. Part A Policy Pract. 2008, 42, 709–717. [Google Scholar] [CrossRef]
  23. Hung, W.T.; Tsang, S.S.; Liu, H.Y. Website characteristics and the impact of user perceived value on user behavior in Web 2.0. Acad. Inf. Manag. Sci. J. 2010, 13, 1–18. [Google Scholar]
  24. Babin, B.J.; Darden, W.R.; Griffin, M. Work and/or fun: Measuring hedonic and utilitarian shopping value. J. Consum. Res. 1994, 20, 644–656. [Google Scholar] [CrossRef]
  25. Hu, F.; Chuang, C.C. A study of the relationship between the value perception and loyalty intention toward an e-retailer website. J. N. A. Bank. Commer. 2012, 17, 1–18. [Google Scholar]
  26. Chen, P.T.; Hu, H.H. How determinant attributes of service quality influence customer-perceived value. Int. J. Contemp. Hosp. Manag. 2010, 22, 535–551. [Google Scholar] [CrossRef]
  27. Lin, K.; Lu, H. Predicting mobile social network acceptance based on mobile value and social influence. Internet Res. 2015, 25, 107–130. [Google Scholar] [CrossRef]
  28. Lee, H.; Goudeau, C. Consumers’ beliefs, attitudes, and loyalty in purchasing organic foods. Br. Food J. 2014, 116, 918–930. [Google Scholar] [CrossRef]
  29. Wang, E.S.T.; Yu, J.R. Effect of product attribute beliefs of ready-to-drink coffee beverages on consumer-perceived value and repurchase intention. Br. Food J. 2016, 118, 963–2980. [Google Scholar] [CrossRef]
  30. Du, H.; Wang, Y. An empirical study on the relationship among perceived value, satisfaction and behavioral intentions of battery electric vehicle user in china. IOP Conf. Ser. Earth Environ. Sci. 2020, 546, 022011. [Google Scholar]
  31. Liu, Y.; Kou, Y.; Guan, Z.; Hu, J.; Pu, B. Exploring hotel brand attachment: The mediating role of sentimental value. J. Retail. Consum. Serv. 2020, 55, 102143. [Google Scholar] [CrossRef]
  32. Sheth, J.N.; Newman, B.I.; Gross, B. Why we buy what we buy: A theory of consumption values. J. Bus. Res. 1991, 22, 159–170. [Google Scholar] [CrossRef]
  33. Sweeney, J.C.; Soutar, G.N. Consumer perceived value: The development of a multiple item scale. J. Retail. 2001, 77, 203–220. [Google Scholar] [CrossRef]
  34. Sanchez, J.; Callarisa, L.; Rodriguez, R.M.; Moliner, M.A. Perceived value of the purchase of a tourism product. Tour. Manag. 2006, 27, 394–409. [Google Scholar] [CrossRef]
  35. Rintamaki, T.; Kanto, A.; Kuusela, H.; Spence, M.T. Decomposing the value of department store shopping into utilitarian, hedonic and social dimensions. Int. J. Retail. Distrib. Manag. 2006, 34, 6–24. [Google Scholar] [CrossRef]
  36. Grönroos, C. A service quality model and its marketing implications. Eur. J. Mark. 1984, 18, 36–44. [Google Scholar] [CrossRef]
  37. Parasuraman, A.; Zeithaml, V.A.; Berry, L.L. A conceptual model of service quality and its implications for future research. J. Mark. 1985, 49, 41–50. [Google Scholar] [CrossRef]
  38. Rust, R.T.; Keiningham, T.; Clemens, S.; Zahorik, A. Return on quality at chase Manhattan bank. Interfaces 1999, 29, 62–72. [Google Scholar] [CrossRef]
  39. Rust, R.T.; Zahorik, A.J.; Keiningham, T.L. Return on quality (ROQ): Making service quality financially accountable. J. Mark. 1995, 59, 58–70. [Google Scholar] [CrossRef]
  40. Brady, M.K.; Cronin, J.J. Some new thoughts on conceptualizing perceived service quality: A hierarchical approach. J. Mark. 2001, 65, 34–49. [Google Scholar] [CrossRef] [Green Version]
  41. Chakrabarty, S.; Whitten, D.; Green, K. Understanding service quality and relationship quality in is outsourcing: Client orientation & promotion, project management effectiveness, and the task-technology-structure fit. J. Comput. Inf. Syst. 2007, 48, 1–15. [Google Scholar]
  42. Papadomichelaki, X.; Mentzas, G. A multiple-item scale for assessing e-government service quality. In International Conference on Electronic Government; Springer: Berlin/Heidelberg, Germany, 2009; pp. 163–175. [Google Scholar]
  43. Li, Y.; Shang, H. Service quality, perceived value, and citizens’ continuous-use intention regarding e-government: Empirical evidence from China. Inf. Manag. 2020, 57, 103197. [Google Scholar] [CrossRef]
  44. Pakurár, M.; Haddad, H.; Nagy, J.; Popp, J.; Oláh, J. The service quality dimensions that affect customer satisfaction in the Jordanian banking sector. Sustainability 2019, 11, 1113. [Google Scholar] [CrossRef] [Green Version]
  45. Bashir, M.A.; Ali, M.H.; Wai, L.M.; Hossain, M.I.; Rahaman, M.S. Mediating Effect of Customer Perceived Value on the Relationship between Service Quality and Customer Satisfaction of E-Banking in Bangladesh. Int. J. Adv. Sci. Technol. 2020, 29, 3590–3606. [Google Scholar]
  46. Stevens, P.; Knutson, B.; Patton, M. DINESERV: A tool for measuring service quality in restaurants. Cornell Hotel Restaur. Adm. Q. 1995, 36, 5–60. [Google Scholar] [CrossRef]
  47. Wang, K.C.; Hsieh, A.T.; Chou, S.H.; Lin, Y.S. GPTCCC: An instrument for measuring group package tour service. Tour. Manag. 2007, 28, 361–376. [Google Scholar] [CrossRef]
  48. Tsang, N.K.; Lee, L.Y.; Wong, A.; Chong, R. THEMEQUAL—Adapting the SERVQUAL scale to theme park services: A case of Hong Kong Disneyland. J. Travel Tour. Mark. 2012, 29, 416–429. [Google Scholar] [CrossRef]
  49. Tkaczynski, A.; Stokes, R. FESTPERF: A service quality measurement scale for festivals. Event Manag. 2010, 14, 69–82. [Google Scholar] [CrossRef]
  50. Parasuraman, A.; Zeithaml, V.A.; Malhotra, A. E-s-qual: A multiple-item scale for assessing electronic service quality. J. Serv. Res. 2005, 7, 213–233. [Google Scholar] [CrossRef]
  51. Wong, I.A.; Fong, V.H.I. Development and validation of the casino service quality scale: CASERV. Int. J. Hosp. Manag. 2012, 31, 209–217. [Google Scholar] [CrossRef]
  52. Hsieh, L.F.; Lin, L.H.; Lin, Y.Y. A service quality measurement architecture for hot spring hotels in Taiwan. Tour. Manag. 2008, 29, 429–438. [Google Scholar] [CrossRef]
  53. Parasuraman, A.; Zeithaml, V.A.; Berry, L. SERVQUAL: A multiple-item scale for measuring consumer perceptions of service quality. J. Retail. 1988, 64, 12–40. [Google Scholar]
  54. Kim, H.; Kim, B.G. Comparison with service quality models in coffee shop. Culin. Sci. Hosp. Res. 2015, 21, 50–58. [Google Scholar]
  55. Cardozo, R.N. An experimental study of customer effort, expectation, and satisfaction. J. Mark. Res. 1965, 2, 244–249. [Google Scholar] [CrossRef]
  56. Howard, J.A.; Sheth, J.N. The Theory of Buyer Behavior; John Wiley & Sons, Inc.: New York, NY, USA, 1969. [Google Scholar]
  57. Oliver, R.L. Measurement and evaluation of satisfaction processes in retail settings. J. Retail. 1981, 57, 25–48. [Google Scholar]
  58. Churchill, G.A.; Surprenant, C. An investigation into the determinants of customer satisfaction. J. Mark. Res. 1982, 19, 491–504. [Google Scholar] [CrossRef]
  59. Crompton, J.L.; Mackay, K.J. Users’ perceptions of the relative importance of service quality dimensions in selected public recreation programs. Leis. Sci. 1989, 11, 367–375. [Google Scholar] [CrossRef]
  60. Raza, S.A.; Umer, A.; Qureshi, M.A.; Dahri, A.S. Internet banking service quality, e-customer satisfaction and loyalty: The modified e-SERVQUAL model. TQM J. 2020, 32, 1443–1466. [Google Scholar] [CrossRef]
  61. Gremler, D.D.; Brown, S.W. The loyalty ripple effect: Appreciating the full value of customers. Int. J. Serv. Ind. Manag. 1999, 10, 271–293. [Google Scholar] [CrossRef]
  62. Ali, F.; Hussain, K.; Ragavan, N.A. Memorable customer experience: Examining the effects of customers experience on memories and loyalty in Malaysian resort hotels. Procedia Soc. Behav. Sci. 2014, 144, 273–279. [Google Scholar] [CrossRef] [Green Version]
  63. Anderson, E.W.; Fornell, C.; Lehmann, D.R. Customer satisfaction, market share, and profitability: Findings from Sweden. J. Mark. 1994, 58, 53–66. [Google Scholar] [CrossRef]
  64. Buzzell, R.D.; Gale, B.T. The PIMS Principles: Linking Strategy to Performance; Free Press: New York, NY, USA, 1987. [Google Scholar]
  65. Zeithaml, V.A. Service quality, profitability, and the economic worth of customers: What we know and what we need to learn. J. Acad. Mark. Sci. 2000, 28, 67–85. [Google Scholar] [CrossRef] [Green Version]
  66. Marinković, V.; Senić, V.; Kocić, M.; Šapić, S. Investigating the impact of SERVQUAL dimensions on customer satisfaction: The lessons learnt from Serbian travel agencies. Int. J. Tour. Res. 2013, 15, 184–196. [Google Scholar] [CrossRef]
  67. Zeithaml, V.A.; Berry, L.L.; Parasuraman, A. The behavioral consequences of service quality. J. Mark. 1996, 60, 31–46. [Google Scholar] [CrossRef]
  68. Eggert, A.; Ulaga, W. Customer perceived value: A substitute for satisfaction in business markets? J. Bus. Ind. Mark. 2002, 17, 107–118. [Google Scholar] [CrossRef]
  69. Wu, H.C.; Li, T.; Li, M.Y. A study of behavioral intentions, patient satisfaction, perceived value, patient trust and experiential quality for medical tourists. J. Qual. Assur. Hosp. Tour. 2016, 17, 114–150. [Google Scholar] [CrossRef]
  70. Eid, R. Integrating Muslim customer perceived value, satisfaction, loyalty and retention in the tourism industry: An empirical study. Int. J. Tour. Res. 2015, 17, 249–260. [Google Scholar] [CrossRef]
  71. Morris, B. The Service Profit Chain: How leading companies link profit and growth to Loyalty, Satisfaction, and Value. Int. J. Serv. Ind. Manag. 1998, 9, 312–313. [Google Scholar] [CrossRef]
  72. El-Adly, M.I. Modelling the relationship between hotel perceived value, customer satisfaction, and customer loyalty. J. Retail. Consum. Serv. 2019, 50, 322–332. [Google Scholar] [CrossRef]
  73. Kim, W.G.; Ng, C.; Kim, Y.S. Influence of institutional DINESERV on customer satisfaction, return intention, and word-of-mouth. Int. J. Hosp. Manag. 2009, 28, 10–17. [Google Scholar] [CrossRef]
  74. Khan, N.; Latifah, S.; Kadir, S.A. The impact of perceived value dimension on satisfaction and behavior intention: Young-adult consumers in banking industry. Afr. J. Bus. Manag. 2011, 5, 4087–4099. [Google Scholar]
  75. China Development Institute. The 28th Global Financial Centre Index: Shanghai Enters the Top Three, Shenzhen among the Top Ten Worldwide. Available online: https://baijiahao.baidu.com/s?id=1678811311579909248&wfr=spider&for=pc (accessed on 25 September 2020).
  76. China (Shanghai) Pilot Free Trade Zone Administration. China (Shanghai) Free Trade Zone Established. Available online: http://www.china-shftz.gov.cn/Homepage.aspx (accessed on 29 September 2013).
  77. Yuan, E.Z.; Sun, H.M. 30 Years of Shanghai: Reform and Open and Economic Development; Shanghai University of Finance & Economics Press: Shanghai, China, 2008. [Google Scholar]
  78. Wikipedia. Shanghai. Available online: https://en.wikipedia.org/wiki/Shanghai#Finance (accessed on 10 October 2015).
  79. Barrettish. Shanghai, China: Starbucks Reserve Roastery. Available online: https://www.barrettish.com/travel/post/asia/china/shanghai-starbucks-reserve-roastery (accessed on 20 June 2020).
  80. Netease. Analysis on the Number and Market Share of Starbucks in China in 2018. Available online: https://www.163.com/dy/article/DCCREV42051481OF.html (accessed on 8 March 2018).
  81. DeVellis, R.F. Scale Development: Theory and Application, 4th ed.; SAGE: Los Angeles, CA, USA, 2016. [Google Scholar]
  82. Churchill, J.; Gilbert, A. A paradigm for developing better measures of marketing constructs. J. Mark. Res. 1979, 16, 64–73. [Google Scholar] [CrossRef]
  83. McAlexander, J.H.; Kaldenberg, D.O.; Koenig, H.F. Service quality measurement. J. Health Care Mark. 1994, 14, 34–40. [Google Scholar]
  84. Yen, C.H.; Teng, H.Y. Celebrity involvement, perceived value, and behavioral intentions in popular media-induced tourism. J. Hosp. Tour. Res. 2015, 39, 225–244. [Google Scholar] [CrossRef]
  85. Albrecht, K. Only Thing That Matters. Exec. Excell. 1992, 9, 7. [Google Scholar]
  86. Tucker, W.T. The development of brand loyalty. J. Mark. Res. 1964, 1, 32–35. [Google Scholar] [CrossRef]
  87. Song, H.; Kim, M.; Choe, Y. Structural relationships among mega-event experiences, emotional responses, and satisfaction: Focused on the 2014 Incheon Asian Games. Curr. Issues Tour. 2019, 22, 575–581. [Google Scholar] [CrossRef]
  88. Hair, J.F.; Ringle, C.M.; Sarstedt, M. PLS-SEM: Indeed a silver bullet. J. Mark. Theor. Pract. 2011, 19, 139–152. [Google Scholar] [CrossRef]
  89. Hair, J.F.; Risher, J.J.; Sarstedt, M.; Ringle, C.M. When to use and how to report the results of PLS-SEM. Eur. Bus. Rev. 2019, 31, 2–24. [Google Scholar] [CrossRef]
  90. Ali, F.; Dogan, S.; Hussain, K.; Amin, M.; Ryu, K. Brand anthropomorphism, love and defense: Does attitude towards socialdistancing matter? Serv. Ind. J. 2021, 41, 58–83. [Google Scholar] [CrossRef]
  91. Fornell, C.; Larcker, D.F. Evaluating structural equation models with unobservable variables and measurement error. J. Mark. Res. 1981, 18, 39–50. [Google Scholar] [CrossRef]
  92. Nisar, Q.A.; Haider, S.; Ali, F.; Naz, S.; Ryu, K. Depletion of psychological, financial, and social resources in the hospitality sector during the pandemic. Int. J. Hosp. Manag. 2021, 93, 102794. [Google Scholar] [CrossRef]
  93. Hu, H.H.; Kandampully, J.; Juwaheer, T.D. Relationships and impacts of service quality, perceived value, customer satisfaction, and image: An empirical study. Serv. Ind. J. 2009, 29, 111–125. [Google Scholar] [CrossRef]
  94. Tam, J.L. Customer satisfaction, service quality and perceived value: An integrative model. J. Mark. Manag. 2004, 20, 897–917. [Google Scholar] [CrossRef]
  95. Park, C.H. Efficient or enjoyable? Consumer values of eating-out and fast food restaurant consumption in Korea. Hosp. Manag. 2004, 23, 87–94. [Google Scholar] [CrossRef]
  96. Lai, W.T.; Chen, C.F. Behavioral intentions of public transit passengers—The roles of service quality, perceived value, satisfaction and involvement. Transp. Policy 2011, 18, 318–325. [Google Scholar] [CrossRef]
  97. Xinhua. Waiting in Line for Three Hours Just to Buy a Cup of Tea, Why Are Red-Hot Tea Shops So Popular? Available online: https://baijiahao.baidu.com/s?id=1618880884550096037&wfr=spider&for=pc (accessed on 18 September 2018).
  98. Chen, C.F.; Chen, F.S. Experience quality, perceived value, satisfaction and behavioral intentions for heritage tourists. Tour. Manag. 2010, 31, 29–35. [Google Scholar] [CrossRef]
  99. Kim, H.J.; McCahon, C.; Miller, J. Assessing service quality in Korean casual-dining restaurants using DINESERV. J. Foodserv. Bus. Res. 2003, 6, 67–86. [Google Scholar] [CrossRef]
  100. Keith, N.K.; Simmers, C.S. Measuring service quality perceptions of restaurant experiences: The disparity between comment cards and DINESERV. J. Foodserv. Bus. Res. 2011, 14, 20–32. [Google Scholar] [CrossRef]
  101. Abanto, R.A.; Abanto, T.; Fajutagana, R.; Moreno, D.K. Measuring Service Quality of Rose and Grace Restaurant—Sto. Tomas Batangas Branch Using DINESERV Scale. LPU Laguna J. Bus. Account. 2019, 3, 79–92. [Google Scholar]
  102. Abezie, H. Assessing a Restaurant Service Quality Using the DINESERV Model: A Quantitative Study on Pizza Hut. Master’s Thesis, Umeå University, Umeå, Sweden, 2020. [Google Scholar]
Figure 1. The results of structural equation model. Note: * p < 0.05, ** p < 0.01, *** p < 0.001.
Sustainability 13 08633 g001
Table 1. Profile of respondents.
Characteristicsn = 386%Characteristicsn = 386%
Gender Occupation
Male15139.1Student7218.7
Female23560.9Service297.5
Age Technician/academician5514.2
Younger than 15–2411028.5Office staff12432.1
25–3417545.3Self-employed236.1
35–444411.4Retired/Unemployment215.4
45–595614.5Professor/Teacher194.9
60 years and older10.3Others4311.1
Frequency to coffee shop
(per month)
Personal monthly income (RMB)
3 times or more379.66000 or less14236.8
4–7 times21054.46001–12,00013033.7
8–11 times11930.812,001–18,0005514.2
12 times or more205.218,001–24,000194.9
Education 24,001–30,000153.9
No official education10.330,001 or more256.5
Junior high school61.6Marital status
High school9023.3Unmarried25365.5
University21254.9Married13234.5
Postgraduate (Doctorate)7719.9
Table 2. Validity and reliability of the constructs.
Constructs and IndicatorsFactor LoadingCronbach’s αCRAVE
Reliability 0.8680.9110.718
Serves you in the time promised.0.798
Quickly corrects anything that is wrong.0.820
Is dependable and consistent.0.901
Serves your food exactly as you ordered it.0.867
Assurance 0.8870.9140.639
Has employees who can answer your questions completely.0.810
Makes you feel comfortable and confident in your dealings with them.0.800
Has personnel who are both able and willing to give you information about menu items, their ingredients, and methods of preparation.0.764
Makes you feel personally safe.0.847
Has personnel who seem well-trained, competent, and experienced.0.788
Seems to give employees support so that they can do their jobs well.0.784
Responsiveness 0.9680.9790.940
During busy times has employees shift to help each other maintain speed and quality of service.0.973
Provides prompt and quick service.0.976
Gives extra effort to handle your special requests.0.959
Tangibles 0.9590.9640.730
Has visually attractive parking areas and building exteriors0.832
Has a visually attractive drinking area.0.840
Has staff members who are clean, neat, and appropriately dressed.0.868
Has a décor in keeping with its image and price range.0.878
Has a menu that is easily readable0.869
Has a visually attractive menu that reflects the coffee shop’s image.0.767
Has a dining area that is comfortable and easy to move around in.0.894
Has rest rooms that are thoroughly clean.0.879
Has drinking areas that are thoroughly clean.0.882
Has comfortable seat in the drinking room.0.826
Empathy 0.8780.9110.673
Has employees who are sensitive to your individual needs and wants, rather than always relying on policies and procedures0.767
Makes you feel special.0.822
Anticipates your individual needs and wants.0.827
Has employees who are sympathetic and reassuring if something is wrong.0.846
Seems to have the customers’ best interests at heart.0.836
Symbolic value 0.8230.8820.652
Improves the way I am perceived.0.809
Makes me feel delighted.0.845
Starbucks Reserve coffee shop is stylish.0.801
Has a good reputation.0.774
Functional value 0.9640.9770.933
Is easy to locate.0.962
Is outstanding.0.974
Offers good value for money.0.962
Satisfaction 0.8140.8770.642
I like the Starbucks coffee shop more than other coffee chains.0.790
An employee at the Starbucks coffee shop has high understanding of my requests.0.780
An employee at the Starbucks coffee shop has professional knowledge about coffee.0.812
I am generally satisfied with the service that the Starbucks coffee chain provides.0.821
Behavioral intention 0.8640.9360.880
I intend to visit the Starbucks coffee shop again in the future.0.937
I will recommend Starbucks coffee shop to other people.0.939
Table 3. Discriminant validity of the constructs.
ItemsRelSQAssSQResSQTanSQEmpSQSym VFun VSatBI
RelSQ0.847
AssSQ0.6550.799
ResSQ0.5510.6250.969
TanSQ0.5450.6260.5310.854
EmpSQ0.5190.6490.5970.6790.820
Sym V0.4920.5630.3770.5120.4970.808
Fun V0.4510.5080.3760.4870.3890.5530.966
Sat0.5750.6000.5170.5990.6480.5570.4420.801
BI0.5330.5270.4720.5430.4550.4910.4940.6630.938
Note: RelSQ = reliability, AssSQ = assurance, ResSQ = responsiveness, TanSQ = tangibles, EmpSQ = empathy, Sym V = symbolic value, Fun V = functional value, Sat = satisfaction, BI = behavioral intention. Values on the diagonal are the square root of average variance extracted (AVE), and those outside the diagonal are the correlations.
Table 4. Variance inflation factor.
ItemSym VFun VSatBI
RelSQ 1.9241.9851.924
AssSQ 2.5422.7312.542
ResSQ 1.9171.9321.917
TanSQ 2.1592.2802.159
EmpSQ 2.3392.3902.339
Sym V 1.819
Fun V 1.645
Sat1.000
Publisher’s Note: MDPI stays neutral with regard to jurisdictional claims in published maps and institutional affiliations.

