
Financial and Labour Obstacles and Firm Employment: Evidence from Europe and Central Asia Firms


1
Mekong Development Research Institute, Hanoi 100000, Vietnam
2
Adelaide Business School, University of Adelaide, Adelaide, SA 5000, Australia
*
Author to whom correspondence should be addressed.
Sustainability 2021, 13(15), 8650; https://0-doi-org.brum.beds.ac.uk/10.3390/su13158650
Submission received: 24 June 2021
/
Revised: 27 July 2021
/
Accepted: 29 July 2021
/
Published: 3 August 2021
/
Corrected: 2 January 2022
(This article belongs to the Section Economic and Business Aspects of Sustainability)
Abstract
:This paper examines how obstacles in access to finance, labour regulations, and employment quality affect employment growth and the permanent worker ratio at the firm level. Using firm-level data of 11,691 firms in 33 low-income and middle-income countries in Europe and Central Asia, where unemployment rates are the highest worldwide, this paper demonstrates that access to finance and employment quality obstacles hinder employment growth. The paper also shows that the greater the obstacles in access to finance and labour regulations, the lower the permanent worker ratio. The findings are robust when applying a two-stage least-squares method to address endogeneity issues. Furthermore, quantile regression analysis shows that access to finance obstacles impede the lowest-growth firms the most and the highest-growth firms the least. Our results indicate that significant financial and regulatory reforms are needed to spur sustainable employment growth.
1. Introduction
The literature on business obstacles has examined how they affect firms’ growth and decisions. In particular, most theoretical and empirical studies aim to measure the effects on investment decisions and sales growth (for example, see [1,2,3]). However, studies on how business obstacles affect employment decisions are scant.
The current literature indicates that obstacles in access to finance, labour regulation, and employment quality have a direct impact on employment decisions at the firm level. Specifically [4,5,6], among others, find that access to finance is a crucial determinant of employment growth and the firms’ choice between permanent and non-permanent workers. Employment protections at the national level are well documented in the literature as constraints to employment growth and the choice between permanent and non-permanent workers. Refs. [7,8] have reported a positive impact of labour market liberalisation on employment growth and the use of permanent workers at the firm level. Hence, it is important to examine how labour regulation obstacles at the firm level affect employment growth and the permanent worker ratio. Furthermore, recent studies show that there is a positive correlation between the quality of the labour force and employment growth, as well as the proportion of permanent workers at the country level. Average unemployment rates are higher for those with a lower education level because the labour market is systematically oversupplied with low-education labourers. In addition, non-permanent workers are relatively less educated than permanent workers [9,10]. The current literature has been heavily focused on barriers to employment growth and labour structure with regard to access to finance, but have largely ignored the impact of labour regulation and the quality of labour at the firm level on employment decisions. Thus, this paper contributes to the literature by exploring how labour regulation and employment quality obstacles affect employment growth and the permanent worker ratio at the firm level.
Our study utilises firm-level data from 33 low- and middle-income countries in Europe and Central Asia, where the unemployment rates are the highest and labour force participation rates are the lowest in the world. A significant increase in employment and workforce participation rates in these areas is particularly important to achieve the sustainable growth objectives highlighted in the 2030 Agenda for Sustainable Development [11,12]. By showing how business obstacles affect employment growth and the permanent worker ratio, our study provides policymakers with empirical evidence to tackle the current employment and labour structure issues impeding this sustainability target.
We propose instrumental variables (IVs) regression models to address potential endogeneity concerns in the literature. The existing studies employ a standard ordinary least-squares (OLS) regression model to explore the effect of business obstacles on firm growth and performance [13,14,15]. However, the OLS model may suffer from an endogeneity issue: a correlation between the error term and one or more obstacle variables. This leads to an endogeneity problem, creating bias and inconsistent estimates [16,17]. To overcome the endogeneity issue, this paper uses the industry-country averages of obstacles as instrumental variables to break the correlations between the error terms and the obstacle variables. These IVs are carefully selected and satisfy two conditions for good IVs: (1) they are uncorrelated with the error term, but (2) are partially or fully correlated with the obstacle measures once other independent variables are controlled for. The results of the F-tests in the first-stage regressions were significant, indicating that our IVs are relevant. Furthermore, our chosen IVs may help to isolate the exogenous variation of obstacles because the causality is likely to be from average obstacles to individual firms, not vice versa. Finally, this paper utilises the quantile regression method to explore the different effects of the business obstacles across employment growth quartiles. Thus, this paper complements the work of [18,19], who found that the partial impacts of reported obstacles differed across different segments of employment growth.
This paper investigates how obstacles in access to finance, labour regulation, and employment quality affect employment growth and the permanent worker ratio in 33 low- and middle-income countries in Europe and Central Asia. Our results show that access to finance obstacles have a significant and adverse impact on employment growth and that this effect varies across employment growth quantiles. Specifically, access to finance obstacles constrains the lowest-growth firms the most and the highest-growth firms the least. This paper also shows that employment quality obstacles weaken employment growth. Finally, we found that the higher the level of access to finance and labour regulation obstacles, the lower the permanent worker ratio at the firm level.
The rest of the paper proceeds as follows. In the next section, we review the relevant literature and discuss the development of our hypothesis. Then, the data sample and variable estimations are described in Section 3. Section 4 discusses the methodology. Regression results are analysed in Section 5, and Section 6 offers conclusions.
2. Literature Review and Hypothesis Development
This paper relates to two streams of business obstacles and firm performance literature. The first stream focuses on the relationship between business obstacles and growth at the firm level. The second stream explores the link between the obstacles and the choice between permanent and non-permanent workers.
Several studies employ aggregate measures of national development and firm-level survey data to examine the economic and institutional effect on firm growth. These studies report a positive correlation between financial and institutional development and sales growth at the firm level. Their findings all emphasize the importance of financial and institutional development at the macro level in driving growth and performance at the firm level [20,21,22,23,24,25,26,27].
Other studies explore firm-level survey data, mainly from the World Bank, to examine how reported obstacles affect firms’ growth and operation. These studies utilise firms’ responses on the extent to which various obstacles affect their business operations and performance [13,28,29]. Existing studies show that the impact of reported obstacles on firm growth is unclear. Differences in economic and institutional development across countries are the main reason for the differences in the impact [13]. In countries with less developed systems, firms are affected by all obstacles to a greater extent than firms in countries with a more advanced legal and financial system and less corruption [15,30,31], among others, reported that access to finance, as well as legal and corruption obstacles, hinder firm growth [30]. Investigated the correlation between firm performance and the business environment in various developing countries, including Bangladesh, China, India, and Pakistan. Business environments were measured based on the number of days required for customs clearance (import/export), the number of days without power during the year, and the number of days required to set up a landline. They found that a poor business environment was correlated with lower productivity, profits, and employment growth at the firm level. Higher power outages and longer customs clearance times reduced productivity and profitability. Firms with easier access to financial services showed higher growth in assets, employment and output [32], found that access to finance obstacles negatively affected firm growth in four out of five countries in the Euro area after controlling for growth opportunities, characteristics of the firms, time, and industry effects [33], investigated the impact of financial development on labour participation and employment ratios in China. They found that the effects were different across regions [15], did not find an impact of access to finance obstacles on the sales and employment growth of 27 Eastern European and Central Asian countries from 2002 to 2009 [34], observed that firms that experienced financial distress showed reductions in both employment and wages.
Empirical studies on the link between reported labour regulations and employment quality obstacles and firm performance receive little attention [28], used the World Bank Enterprise Survey (WBES) of 30 African countries and found that labour regulation and employment quality obstacles have a significant adverse impact on employment growth [35], investigated the link between labour skill deficits and firm performance in Tanzania. They found that firms with a higher proportion of skilled workers were more productive [36], explored the employment implications of the severance payment policy in China. They found that the policy of increased severance payments led to an increase in median firm size. Based on the above analysis, we propose the first hypothesis:
Hypothesis 1 (H1).
Firms with higher reported obstacles have lower employment growth.
Investigating the impact of obstacles on low-growth and high-growth firms will allow us to determine which factors help explain why some firms grow slower/faster than the average [37,38]. Moreover, recent studies show differing effects of reported obstacles on employment growth across segments of employment growth [18,19,39]. Ref. [39] investigated the effects of access to finance on firm growth across growth quantiles during the global financial crisis. They observed differences in the growth dynamics between high-growth and low-growth firms. The credit crisis in Europe after 2008 seriously affected low-growth firms, whereas high-growth firms were barely affected. Therefore, we propose the second hypothesis:
Hypothesis 2 (H2).
The impact of business obstacles varies across different segments of employment growth.
A higher number of obstacles in the access to finance, on the one hand, requires firms to increase labour productivity to increase the profitability of the capital they have raised, leading to an increase in demand for permanent workers. On the other hand, firms with a greater number of obstacles in the access to finance are uncertain about their ability to attract capital in the future, leading to a lower demand for permanent workers to enable higher flexibility [40]. Refs. [41,42] show that firms tend to increase non-permanent workers when facing higher financing obstacles. The financial crisis in 2008 had a positive effect on Germany’s employment status. Meanwhile, the opposite effect was found in relation to women and young people with disabilities in Spain [43,44].
Labour regulations, which often aim to protect permanent workers, create substantial layoff costs for permanent workers compared to those of non-permanent workers. These costs include firing costs (e.g., separation pay, costs associated with lawsuits), search costs (e.g., fees to recruitment agencies, advertising costs), recruitment costs (e.g., viewing applications, conducting interviews), and training costs for new workers [4,45,46,47] among others, observed that a greater number of labour protection regulations causes higher layoff costs and thus reduces permanent employment at the firm level [47], also showed that labour regulation reforms in Europe that aim to relax restrictions on layoffs raise the proportion of permanent workers [48], found evidence of a substantial increase in the permanent worker ratio after reforms of employment protection that lowered the firing costs in Italy in 2015.
Based on these theoretical and empirical observations, we hypothesize the following:
Hypothesis 3 (H3).
Firms with higher business obstacles reduce their share of permanent workers.
3. Data Description and Variable Construction
This study used data from the most recent World Bank Enterprise Surveys (WBES) of 33 countries in Europe and Central Asia: http://www.enterprisurveys.org (accessed on 11 July 2020). The World Bank’s sampling method aims to achieve two main goals: first, to benchmark the business of individual economies worldwide; and second, to conduct performance analyses of how obstacles in business affect productivity and job creation. To achieve these two goals simultaneously, the World Bank proposes two sampling principles: (1) to create a sample that represents the entire private non-agricultural economy, and therefore includes service and other related sectors; and (2) generate sample sizes that are large enough for selected industries to perform robust statistical analyses with accuracy levels of at least 7.5 percent precision for 90 percent confidence intervals.
The World Bank uses stratified random sampling to select firms in the sample. First, the World Bank divides entire firms in each country into stratified groups based on size (small, medium, and large), the business sector (manufacturing, retail, and other services), and the geographic region within a given country. Then, the surveyed firms are selected by means of the simple random sampling method in each group. This technique ensures that the sample represents the population of firms by size, industry, and geographic region.
The initial sample includes 21,459 firms; however, some firms did not answer all the questions used in the empirical analysis, so we exclude firms with missing values for any explanatory and control variables. In addition, since statistical measures such as mean and standard deviation are sensitive to outliers, we trimmed values less than the 2.5th percentile or greater than the 97.5th percentile of the independent variables. The final sample size used in the empirical analysis included 11,691 firms across 33 countries in Europe and Central Asia.
The number of firms surveyed in each country depended on their gross national income (GNI) in 2008. Accordingly, the World Bank selected 150 firms in very small economies (GNI < 15 billion); 360 firms in small economies (GNI from 15 billion to 100 billion); 1000 in medium economies (GNI from 100 billion to 500 billion); and 1320 firms in large economies (GNI > 500 billion). Table 1 presents the number of firms, the macroeconomic indicators, and the mean values of the obstacles in each country after removing missing values and outliers. The number of sampled firms varied across countries in the region. Seven major economies, including Portugal, Uzbekistan, Russia, Ukraine, Kazakhstan, and Turkey, had 4431 chosen firms, accounting for more than 36 percent of the sample size. At the other extreme were the four smallest economies—Azerbaijan, Tajikistan, Montenegro, and Kosovo—from which less than 120 firms were included for each country.
This study used macro-level data on GDP growth, GDP per capita, and inflation as country-level controls in each country. We select annual GDP growth and GDP per capita because they positively correlate with investment opportunities at the firm level. We also included the inflation rate, as it is an indicator of whether the local currency provides a stable measure of values in contracts between firms [49,50]. Country-level variables are the average of the values for the three years prior to the surveyed year. Detailed definitions of these measures and data sources are presented in Table A1 in Appendix A. Countries in the sample showed significant differences in GDP per capita. The countries with the lowest per-capita GDP were the Kyrgyz Republic and Tajikistan, with an average income of around USD 1000 per year compared to approximately USD 30,000 in the two highest per-capita income countries, Italy and Cyprus.
The World Bank collected firm owners’ opinions on 15 different business obstacles to determine their perceptions of how the obstacles constrained their growth and performance by answering the following question:
“To what extent is ________ an obstacle to the current operations of this establishment?”
The blank spaces contained each of the 15 obstacles, which were access to finance, access to land, business licensing and permits, corruption, courts, crime, trade regulations, electricity, employment quality, labour regulations, political instability, practices of the informal sector, tax administration, tax rates, and transportation. Firm owners rated obstacles on the same scale from 0 to 4, indicating no obstacle (0), small obstacle (1), moderate obstacle (2), large obstacle (3), and very serious obstacle (4). Information about the perceptions is helpful because they implicitly provide a measure of impact. Firms are asked to assess how each of the obstacles affects their ability to operate and grow. Therefore, areas that may involve a significant increase in costs but receive little attention, or where the firm already has alternatives, will be unlikely to rate highly in the obstacle ranking [20].
Answering the question of how reported obstacles affect employment growth and the permanent worker ratio is significant in practice. It helps policymakers to prioritise the obstacles that need to improve to create more incentives for firms. Even if firms benefit from improvements in all business environment aspects, addressing them all at once would be challenging for any government. This paper focuses on three main elements of the business environment: access to finance, labour regulation, and employment quality. Table 1 reports the average level of owners’ perceptions on access to finance, labour regulation, and employment quality obstacles. Interestingly, none of the country averages was two or higher, suggesting that all three obstacles were low and moderate at the country level.
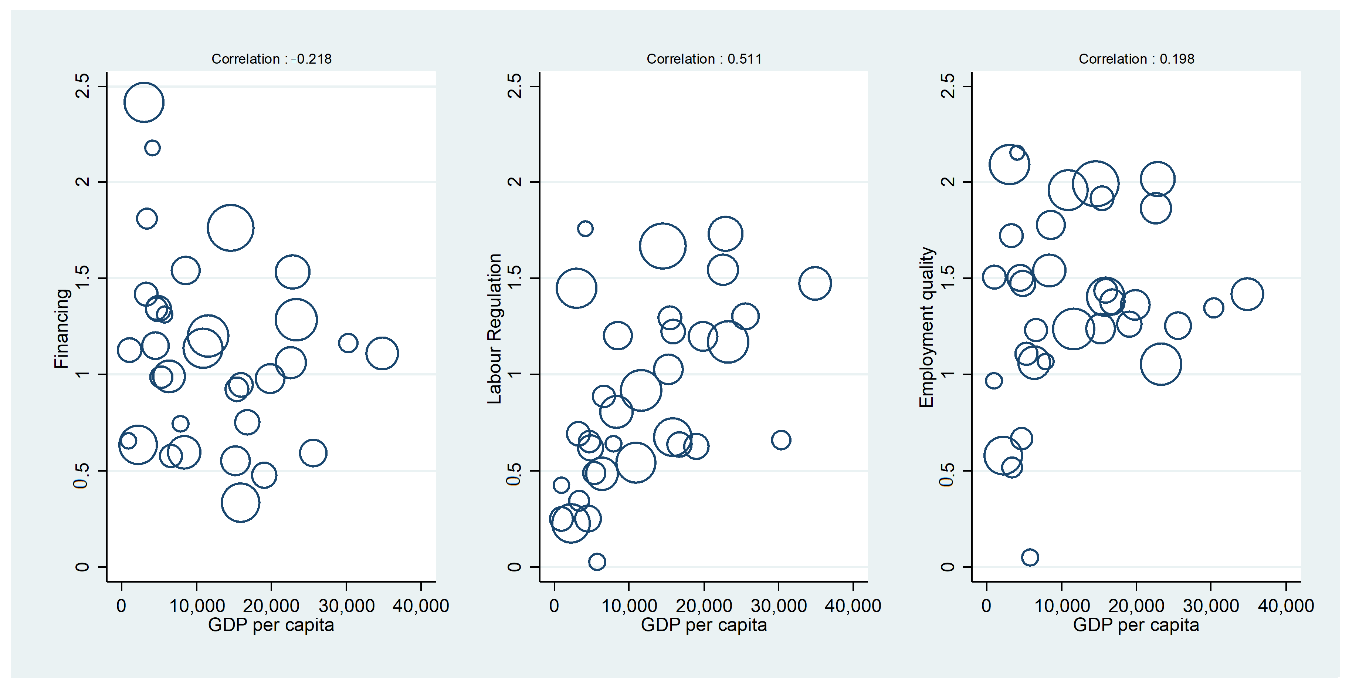
See Table A1 for variable definitions and data sources. Figure 1 shows the relationship between economic development, measured by the GDP per capita, and the average level of obstacles at the country level. Each circle represents a country in the sample. The size of the circles shows the relative number of firms included in each country—the bigger the ring, the more firms are included in the sample. Figure 1 shows that firms tended to report lower levels of access to finance obstacles in more developed countries. A similar pattern is shown when using the ratio of private sector loans to GDP as a proxy for each country’s level of financial market development. An exciting finding is that in more developed economies, firms reported higher levels of labour regulation obstacles. This result is consistent with the literature that less developed economies are more likely to relax regulations on worker protection [51]. The correlation between GDP per capita and employment quality obstacles is relatively weak. Finally, we found a higher variation in the level of the reported obstacles in less developed economies.
One potential shortcoming when the owners’ perceptions are used in the analysis is that unsuccessful owners may blame business obstacles for their failure [17,52]. However, the prime purpose of WBES was to assess the business environment, not the firm’s performance. Accordingly, the interviewee only answered questions on their operation after completing questions in the business environment section. This sequence reduces respondents’ ability to justify their unsuccessful performance, having answered earlier questions about the business environment. We acknowledge that bias in self-reported data cannot be eliminated. However, it is less likely to be a significant source of bias (see [13] for a detail discussion).
Table 2 presents summary statistics of the variables at the firm level used in our analysis. Employment growth is the percentage change in the number of permanent workers the firm has at the surveyed time compared to three years prior. Permanent workers are utilised because their growth reflects the firm performance and is of interest to policymakers [14]. Employment growth is calculated as follows:
where is the employment growth of firm i in year t. and are the number of permanent workers of firm in year and three years ago , respectively. The main advantage of using the average number of permanent workers in the denominator is that it results in the same absolute value of employment growth between two numbers of workers, regardless of whether there is an increase or decrease in workers.
Employment in a firm includes permanent and non-permanent workers. Non-permanent workers, who generally have lower job satisfaction and receive less training and income than permanent workers, are less desirable [53,54]. We measured the permanent worker ratio by calculating the percentage of permanent workers out of the total full-time equivalent (FTE) as follows:
where is the number of months that non-permanent workers worked in the last 12 months. and are the total number of non-permanent and permanent workers, respectively. Table 2 shows that the employment growth and permanent worker ratio averages were 1.956 percent and 96 percent, respectively. Employment growth in Europe and Central Asia was much lower than in other regions, which is also consistent with the literature [55]. On average, the levels of access-to-finance obstacles, labour regulations, and employment quality obstacles were 1.148, 0.962 and 1.448, respectively. The employment quality obstacles in Europe and Central Asia were much higher than in other regions and the global average, which is consistent with other studies showing that the proportion of trained workers and the labour participation rate in these regions are well below those of the rest of the world [11].
Table A2, in Appendix A, presents the Pearson’s pairwise correlation matrix of the 16 firm-level variables listed in Table 2. All three obstacles were positively correlated, implying that firms that reported a higher level of one obstacle were also more likely to face higher constraints in the others.
4. Methodology
This paper explores the effect of access-to-finance obstacles, labour regulations, and employment quality obstacles on employment growth and the permanent worker ratio. All regressions are estimated using firm-level data across 33 countries and country-year fixed effects. The inclusion of country-year fixed effects allows the model to capture time-varying and country-specific unobservable factors such as national culture. We also control for the country- and firm-specific variables, including firm size and age, CEO experience, ownership, certified financial statements, labour costs per sales, and sales growth. These control variables are widely used in the literature [56,57,58,59,60,61]; Shibia and Barako (2017); Grazzi and Moschella (2018); Di Cintio, Ghosh and Grassi (2017)). We follow the World Bank classification system to divide firms into three groups based on the number of workers: small (<20), medium (20–99), and large (>100) with the reference group being large firms. We include two dummy variables: small and medium to control for the firm size. We measure the CEO’s experience by the number of years of management experience in the relevant business. Audited financial statements are more reliable and informative, which significantly influences the decisions of investors and creditors. We include a dummy variable as an indicator of the reliability of a firm’s financial statements. This variable takes the value of one if the financial statements were audited by an independent auditing firm and zero otherwise. We also control for the effect of ownership by including two dummy variables, government and foreign. Finally, we control for other firm-level variables, including industry, firm age, labour costs per sales, and sales growth. Table A1 in Appendix A provides detailed descriptions and the sources of each variable.
To assess the impact of access-to-finance obstacles, labour regulations, and employment quality obstacles on employment growth and the permanent worker ratio, we have estimated the following regression:
where are the dependent variables of interest, which are either employment growth or the percentage of permanent workers of firm in country and year , and are country and year fixed effects, respectively, and denotes the error term.
We first run a standard ordinary least-squares (OLS) regression to find the mean relationship between the regressors and the outcome variables based on the conditional mean . Estimates in Equation (1) may encounter an endogeneity problem because of the non-random assignment of obstacles. For example, unobserved firm characteristics may cause some firms to grow faster and employ more permanent workers, and these characteristics may not be distributed randomly. As a result, OLS might produce bias and inconsistent estimates [62]. The source of the endogeneity problem in this case is the correlation between the error term and one or more obstacle variables.
Our strategy to solve the problem is to apply instrumental variables (IVs) with the two-stage least-squares (2SLS) estimates to break the correlation between the error term and the independent variables. To use the 2SLS method, we need to find instrumental variables that are, firstly, uncorrelated with the error term, and secondly, partially and fully correlated with the predictive variables. This paper follows [63] in using the average values of obstacles in each country-industry as instrumental variables. In practice, we are unable to verify the first condition as the error term is unobservable. The F-statistics in the first stage regressions are all greater than 100 and statistically significant in all models, indicating that the industry-country averages of obstacles satisfy the second condition for good instruments. Moreover, instrumenting the obstacles with the averages in each industry group helps to isolate the exogenous part because when obstacles are measured at the aggregate country-industry level, causality is likely to occur from average obstacles to individual firms, not vice versa.
Refs. [18,19] find that the partial impact of reported obstacles on employment growth differs across different segments of employment growth. We follow the quantile estimation method of [62] to investigate such effects. The regression models for the quantile level of the response are as follows:
where is the percentile of the firm’s employment growth in country and year . is a vector of firm-level control variables. In the quantile regression, the estimated slopes and intercept coefficients depend on . Unlike the OLS estimator, we estimate the parameters of the conditional quantile function by means of the quantile regression estimator that minimises the objective function :
In the quantile regression, the slope coefficient for a predictor , , indicates the amount of change in the conditional quantile of , , associated with a one-unit change in .
We also estimate the economic impact of the obstacles on the mean sample by multiplying its corresponding coefficients by the sample mean of the obstacles. This result measures the total effect of the obstacles on employment growth and the permanent worker ratio that considers both the magnitude of the average obstacles and the size of the corresponding coefficients.
To test the hypothesis that a reported obstacle influences firm employment growth and the permanent worker ratio, we have performed a t-test to determine if its corresponding coefficient is significantly different from zero.
5. Results and Analysis
Table 3 reports the impact of access-to-finance obstacles, labour regulations, and employment quality obstacles on employment growth at the firm level. Columns (1) and (2) provide estimates using 2SLS (IV) and OLS for the conditional mean, respectively. Columns 3–5 are estimates for the 25th, 50th, and 75th percentiles. The IV estimates show that access-to-finance obstacles hinder employment growth and the impact is statistically significant. On average, each additional level of access-to-finance obstacles reduces firm employment growth by 0.812 percent. This result is consistent with our first hypothesis that firms with higher reported obstacles have lower employment growth.
We computed the economic impact of each obstacle by multiplying the coefficients of the obstacle variables by the mean level of the reported obstacles. Estimates of the economic impact of the access-to-finance obstacles on the sample mean also show a reduction of 0.93 percent in employment growth. Our results show that the access-to-finance obstacle coefficient is large enough to affect the employment growth of firms at the sample mean level. Our findings are consistent with the current literature, confirming that access-to-finance obstacles are a relevant factor in explaining firm growth [32,64] The quartile estimates in columns 3–5 show that access-to finance obstacles affect employment growth differently across quartiles. Access-to-finance obstacles constrain the lowest-growth firms the most and the highest-growth firms the least. On average, each additional level of access-to-finance obstacles reported by the firms reduced employment growth for quartile 1 and median firms by 0.043 percent and 0.039 percent, respectively.
The labour regulation obstacle was positively correlated with firm growth. This observation seems like a paradox at first glance. However, when answering the business environment questions, firms ranked the obstacles in the context of how they affected their business. Accordingly, firms that do not need to expand their labour force are less concerned with the labour regulation obstacle and will likely score low for the obstacle. Finally, an increase in the employment quality obstacle by one level causes a 0.536 percent reduction in employment growth.
When considering the effects of the control variables on employment growth, the results of our estimates are consistent with the literature. The employment growth of small firms is lower than that of large firms (the control group). State-owned firms have lower employment growth rates. Young firms have a higher growth rate than mature and old firms. One interesting feature from the estimates is that labour-intensive firms, as measured by the ratio of labour costs to sales, have higher employment growth rates.
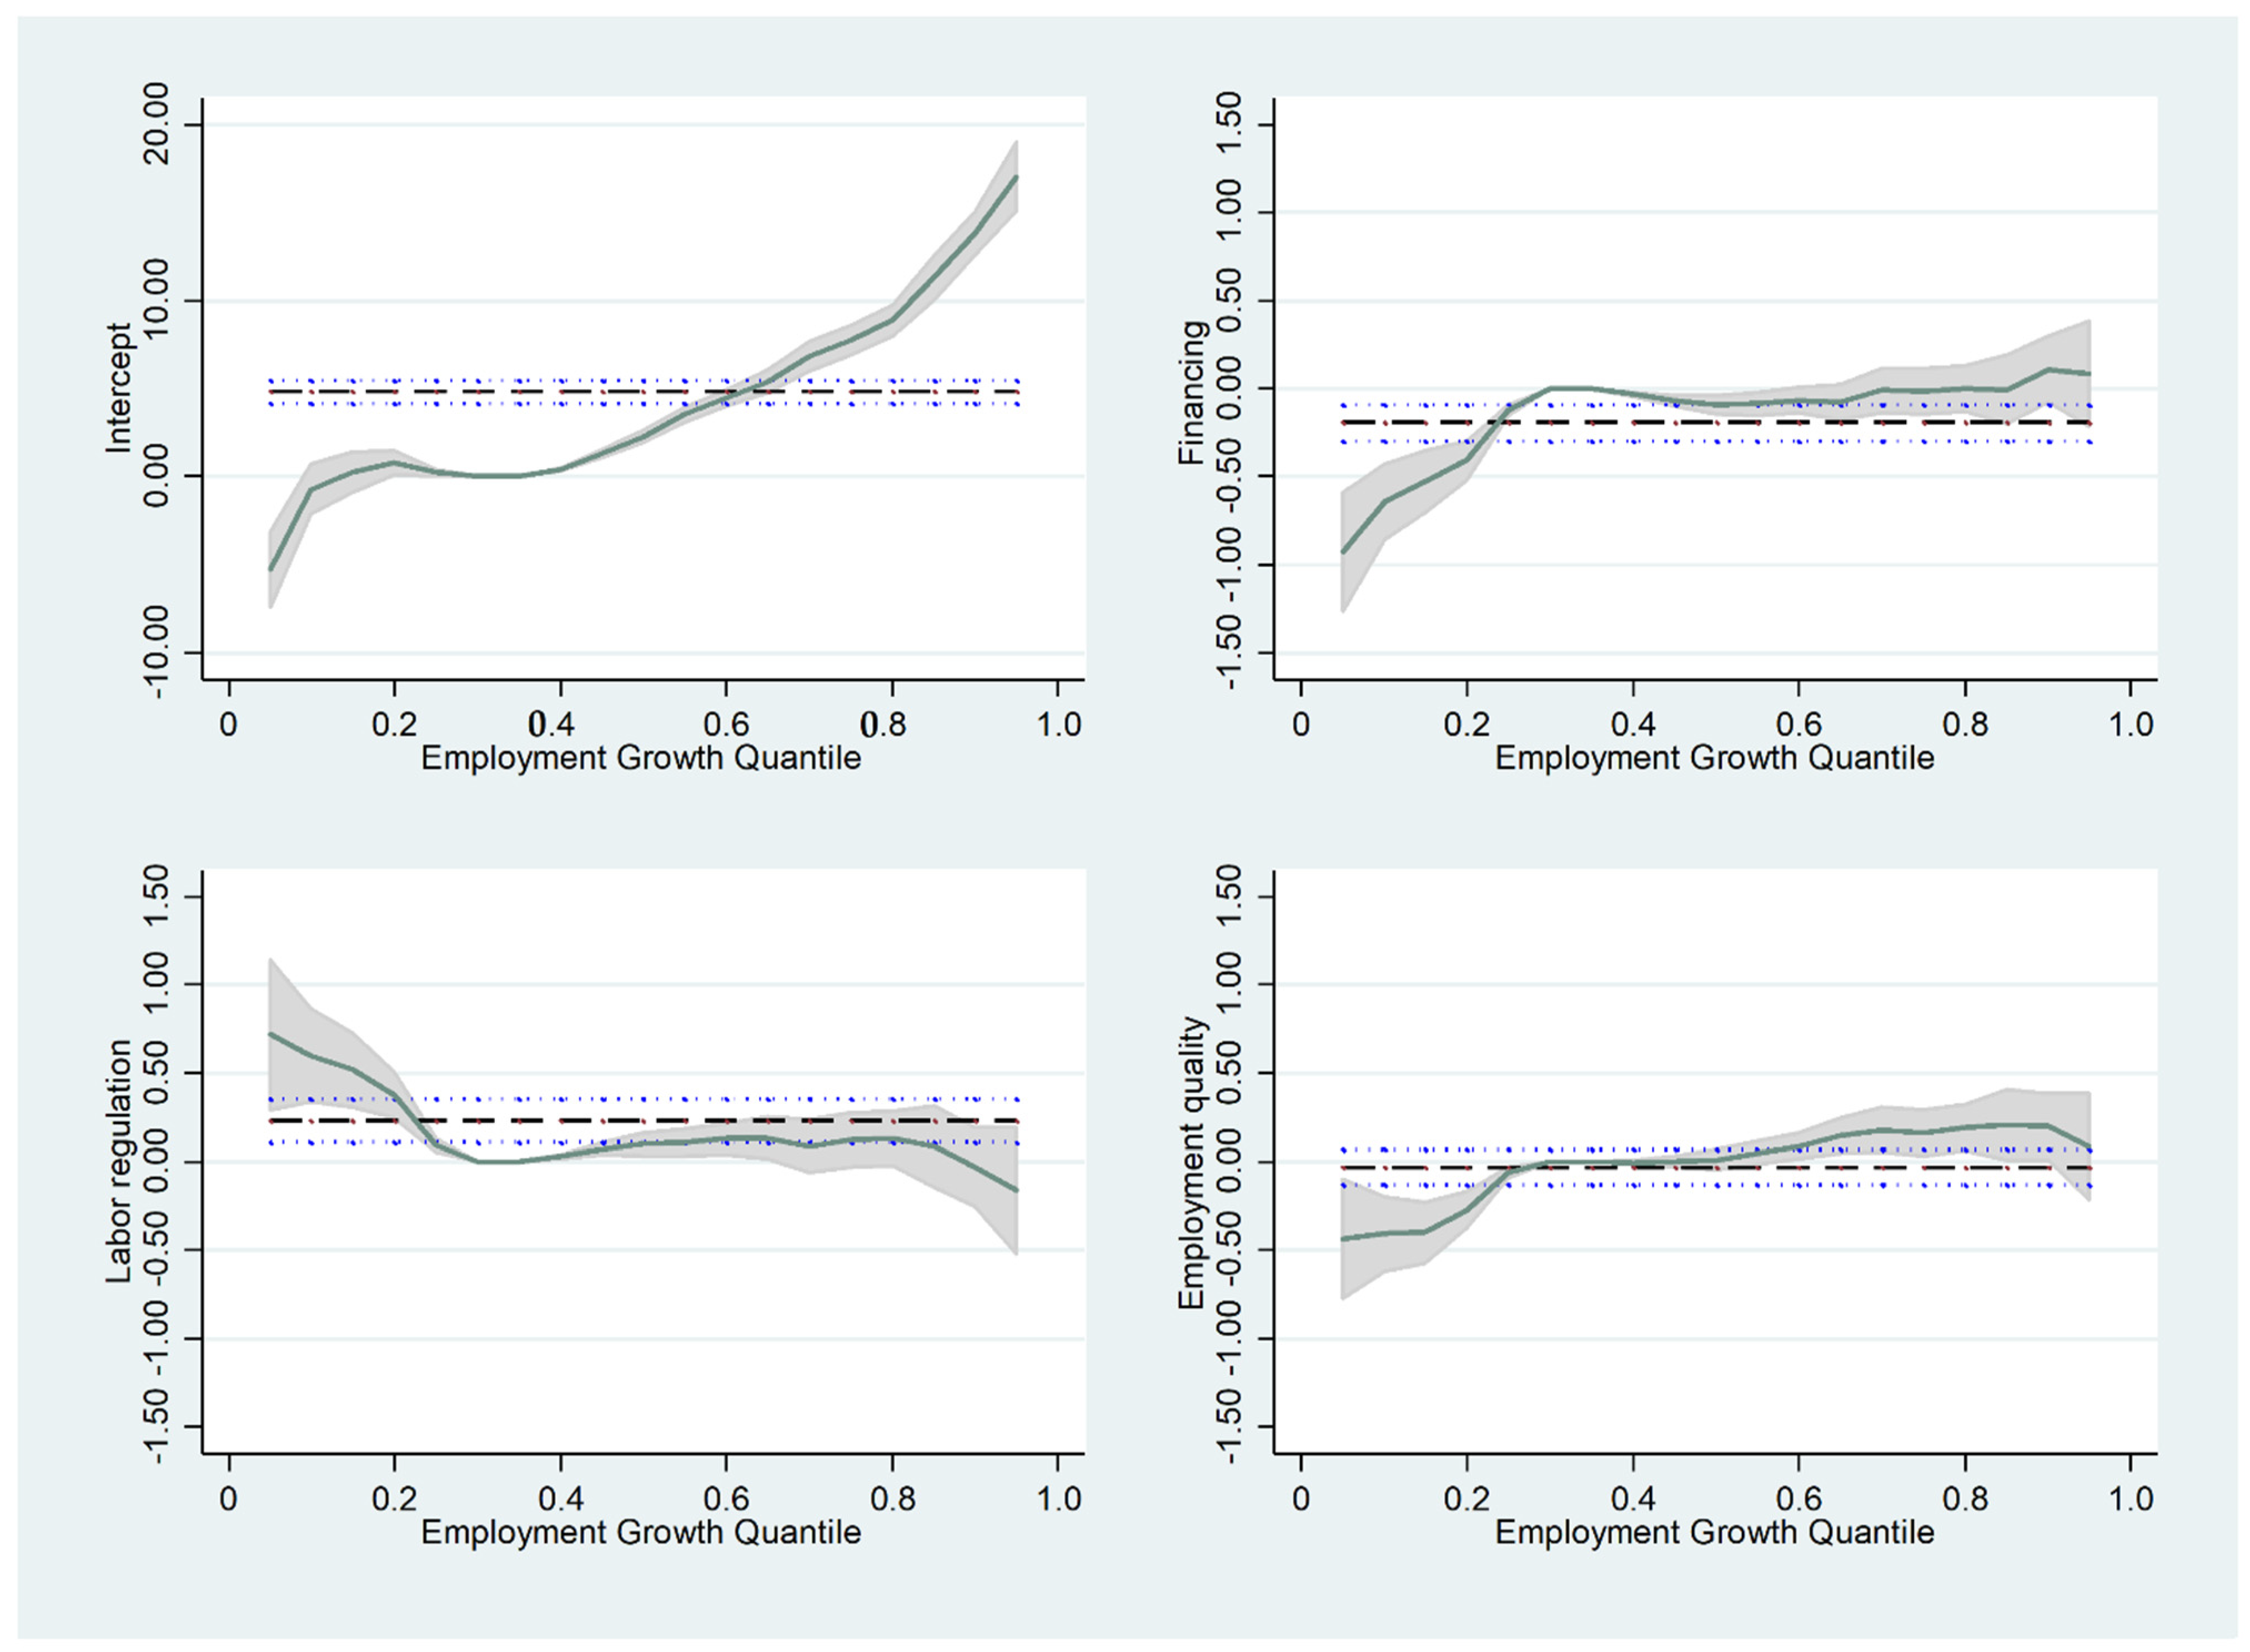
Figure 2 summarises our estimates of the access-to-finance obstacles, labour regulations, and employment quality obstacles’ coefficients across employment growth quantiles. The absolute values of the estimated coefficients of all three obstacles around the median of employment growth were statistically significant. However, the size of the coefficients were relatively small, suggesting that their economic effects are marginal. Access-t-finance and employment quality obstacles hindered the lowest-growth firms the most and the highest-growth firms the least. The labour regulations obstacle was positively correlated to slow-growth firms, as discussed above.
Table 4 reports how these obstacles affected the permanent worker ratio at the firm level. We estimated five model specifications for robustness checks. We first ran the regression using 2SLS-IV (1) and OLS (2) methods, in which all three obstacles—access-to-finance obstacles, labour regulations, and employment quality—were included. We then investigated the individual effects of each obstacle using the OLS method (models 3–5). Access-to-finance obstacles were negatively correlated with the permanent worker ratio. Each additional level of access-to-finance obstacles lowered the permanent worker ratio by 1.92 percent.
When entered individually, both labour regulation and employment quality obstacles negatively affected the permanent worker ratio, as expected. However, the employment quality coefficient lost its significance in the presence of the remaining two obstacles, suggesting that the access-to-finance and labour regulation obstacles played a more significant role in determining the permanent worker ratio at the firm level. This result is also consistent with the work of Ferreira (2017) and the prediction of [4] that the access-to-finance obstacle and other obstacles that relate to permanent hiring and firing costs are the main determinants when firms choose the form of their employment contracts (Ferreira (2017) and [4]). Our results suggest that increased labour regulation obstacles may cause an increase in the hiring and firing costs of permanent workers. As a result, firms use fewer permanent workers in order to minimise these costs. Our estimation results support the third hypothesis, that firms with higher business obstacles use fewer permanent workers.
When looking at the control variables, smaller firms used relatively more permanent workers than large firms. Mature firms, old firms, and firms with audited financial statements employed fewer non-permanent workers since their growth and operations were more stable. Other control variables had a marginal influence on the structure of labour.
Low-income and middle-income countries in Europe and Central Asia share some common features: they have a large share of the state-owned sector, undeveloped financial systems, a shortage of educated workforce, and high unemployment rates [12,65]. Thus, promoting employment is a priority for countries in this region. Table 5 summarises challenges that firms in this area are facing, focusing on SMEs. This table also highlights some opportunities and solutions for these nations to facilitate firms’ financial and human demands.
6. Conclusions
This study investigated how access-to-finance obstacles, labour regulations, and employment quality obstacles affect employment growth and the composition of permanent workers. When deciding on the optimal permanent worker ratio, firms consider both demand for labour and productivity and the requirement of labour flexibility. A greater number of obstacles in the access to finance requires firms to increase labour productivity, whereas future financing obstacles increase the need for labour flexibility. Furthermore, when firms face more significant labour regulation obstacles, the hiring and firing costs of permanent workers tend to be higher.
This paper focuses on 33 low-income and middle-income countries in Europe and Central Asia, where unemployment rates are the highest worldwide. Creating more and better jobs is arguably the most critical challenge in relation to promoting the prosperity of countries in this region.
Our results show that access-to-finance obstacles and employment quality obstacles constrained employment growth at the firm level. Our findings suggest that easing access to finance is vital in order to promote employment growth and increase the permanent worker ratio at the firm level.
Author Contributions
Conceptualization, A.T.B. and T.P.P.; methodology, A.T.B. and T.P.P.; software, A.T.B. and T.P.P.; validation, A.T.B. and T.P.P.; formal analysis, A.T.B.; investigation, A.T.B.; resources, A.T.B. and T.P.P.; data curation, A.T.B.; writing—original draft preparation, A.T.B.; writing—review and editing, A.T.B. and T.P.P.; funding acquisition, A.T.B. and T.P.P. All authors have read and agreed to the published version of the manuscript.
Funding
This research is funded by the Vietnam National Foundation for Science and Technology Development (NAFOSTED) under grant number 502.01-2017.09.
Institutional Review Board Statement
Not applicable.
Informed Consent Statement
Not applicable.
Data Availability Statement
https://www.enterprisesurveys.org/en/data (accessed on 1 July 2021).
Acknowledgments
We thank the World Bank Group’s Global Development Economics Index Enterprise Unit for providing the WBES data.
Conflicts of Interest
The authors declare no conflict of interest.
Appendix A

Table A1.
Variable definitions and sources.
| Description | Data Source | |
|---|---|---|
| Permanent worker ratio | Number of permanent workers over the total number of workers (adjusted for the actual number of months non-permanent workers worked) | WBES |
| Employment growth | The average growth rate in the number of permanent workers over the last three years | WBES |
| Small | Dummy variable; equals one if the firm is small-sized (<20 workers) and equals 0 otherwise. | WBES |
| Medium | Dummy variable; equals one if the firm is medium-sized (from 21 to 100 workers) and equals 0 otherwise. | |
| Government | Dummy variable that takes the value of 1 if the firm has government ownership. | WBES |
| Foreign | Dummy variable that takes the value of 1 if the firm has foreign ownership. | WBES |
| Experience | The number of years the firm’s top managers worked in the sector. | WBES |
| Mature firm | Firm age is between 6 and 15 years | WBES |
| Old firm | Firm age is 16 years and above | WBES |
| Certified | Dummy that indicates if the firm’s financial statement was checked and certified by an external auditor. | WBES |
| Manufacturing | Dummy variable that takes the value of one if the firm is in the manufacturing industry. | WBES |
| Labour cost per sales | Total labour cost/total sales | WBES |
| Sales growth | The average sales growth rate in the past three years | WBES |
| Access-to-finance obstacles | A measure of the level of access-to-finance obstacles to the operation and growth of the business. It takes values from 0 (no obstacles) to 4 (very severe obstacles) | WBES |
| Labour regulation obstacle | A measure of the level of labour regulation obstacles to the operation and growth of the business. It takes values from 0 (no obstacle) to 4 (very severe obstacle) | WBES |
| Employment quality obstacle | A measure of the level of employment quality obstacles to the operation and growth of the business. It takes values from 0 (no obstacle) to 4 (very severe obstacle) | WBES |
| GDP per capita | Average of real GDP per capita (in US dollars) in the last three years | WDI |
| GDP growth | Average growth rate of real GDP in US dollars in the last three years | WDI |
| Inflation | Average of the natural logarithm of the difference in the consumer price index in the last three years | IFS |
Table A2.
Pairwise correlation coefficients.
| (1) | (2) | (3) | (4) | (5) | (6) | (7) | (8) | (9) | (10) | (11) | (12) | (13) | (14) | (15) | ||
|---|---|---|---|---|---|---|---|---|---|---|---|---|---|---|---|---|
| Employment growth | (1) | |||||||||||||||
| Permanent worker ratio | (2) | −0.0143 | ||||||||||||||
| Access-to-finance obstacles | (3) | −0.0306 *** | 0.0339 *** | |||||||||||||
| Legal regulation obstacle | (4) | 0.0114 | −0.0147 | 0.3006 *** | ||||||||||||
| Employment quality obstacle | (5) | 0.001 | −0.0290 *** | 0.2758 *** | 0.4405 *** | |||||||||||
| Small | (6) | −0.0510 *** | 0.0572 *** | 0.0184 ** | −0.0691 *** | −0.0887 *** | ||||||||||
| Medium | (7) | 0.0503 *** | −0.0402 *** | 0.008 | 0.0195 ** | 0.0292 *** | −0.6496 *** | |||||||||
| Government | (8) | −0.039 2*** | 0.0096 | −0.0134 | −0.0459 *** | −0.0335 *** | −0.0965 *** | −0.0340 *** | ||||||||
| Foreign | (9) | −0.0003 | −0.0108 | −0.0827 *** | −0.0012 | 0.0109 | −0.1832 *** | −0.0194 ** | 0.0173 * | |||||||
| Experience | (10) | −0.0538 *** | −0.0171 * | −0.007 | 0.0294 *** | 0.0159 * | −0.0385 *** | 0.0113 | −0.0360 *** | −0.0365 *** | ||||||
| Mature firm | (11) | 0.0906 *** | 0.0133 | 0.0298 *** | −0.0457 *** | −0.0311 *** | 0.0981 *** | 0.0068 | −0.0511 *** | 0.0106 | −0.1612 *** | |||||
| Old firm | (12) | −0.1407 *** | 0.0032 | −0.0315 *** | 0.0531 *** | 0.0328 *** | −0.1351 *** | 0.0109 | 0.0584 *** | −0.0083 | 0.2094 *** | −0.8874 *** | ||||
| Certified | (13) | 0.0211 ** | −0.0035 | −0.0266 *** | 0.0736 *** | 0.0908 *** | −0.2816 *** | 0.0438 *** | 0.0823 *** | 0.1658 *** | 0.0474 *** | −0.0808 *** | 0.1162 *** | |||
| Manufacturing | (14) | −0.004 | 0.0527 *** | 0.0740 *** | 0.0439 *** | 0.0677 *** | −0.1766 *** | 0.0645 *** | 0.0112 | 0.0575 *** | 0.0243 *** | −0.0643 *** | 0.0688 *** | 0.0370 *** | ||
| Labour cost per sale | (15) | −0.0587 *** | 0.0220 ** | 0.0428 *** | 0.0286 *** | 0.0408 *** | 0.0284 *** | −0.0112 | −0.0083 | −0.0197 ** | −0.0088 | −0.0178 ** | 0.0059 | −0.0271 *** | 0.0893 *** | |
| Sales growth | (16) | 0.2618 *** | −0.0376 *** | −0.0304 *** | −0.0525 *** | −0.0146 | −0.0113 | 0.0217 ** | 0.0295 *** | −0.0048 | −0.0501 *** | 0.0689 *** | −0.1142 *** | −0.0134 | 0.0108 | −0.1222 *** |
Note: * significant at 10%; ** significant at 5%; *** significant at 1%.
References
- Oliveira, B.; Fortunato, A. Firm growth and liquidity constraints: A dynamic analysis. Small Bus. Econ. 2006, 27, 139–156. [Google Scholar] [CrossRef] [Green Version]
- Bottazzi, G.; Secchi, A.; Tamagni, F. Financial constraints and firm dynamics. Small Bus. Econ. 2014, 42, 99–116. [Google Scholar] [CrossRef]
- Secchi, A.; Tamagni, F.; Tomasi, C. Financial constraints and firm exports: Accounting for heterogeneity, self-selection, and endogeneity. Ind. Corp. Chang. 2016, 25, 813–827. [Google Scholar] [CrossRef] [Green Version]
- Caggese, A.; Cuñat, V. Financing Constraints and Fixed-term Employment Contracts. Econ. J. 2008, 118, 2013–2046. [Google Scholar] [CrossRef]
- Adomako, S.; Danso, A.; Ofori Damoah, J. The moderating influence of financial literacy on the relationship between access to finance and firm growth in Ghana. Ventur. Cap. 2016, 18, 43–61. [Google Scholar] [CrossRef]
- Chauvet, L.; Jacolin, L. Financial Inclusion, Bank Concentration, and Firm Performance. World Dev. 2017, 97, 1–13. [Google Scholar] [CrossRef] [Green Version]
- Saha, B.; Sen, K.; Maiti, D. Trade openness, labour institutions and flexibilisation: Theory and evidence from India. Labour Econ. 2013, 24, 180–195. [Google Scholar] [CrossRef] [Green Version]
- Cirillo, V.; Fana, M.; Guarascio, D. Labour market reforms in Italy: Evaluating the effects of the Jobs Act. Econ. Politica 2017, 34, 211–232. [Google Scholar] [CrossRef]
- Galarneau, D. Temporary employment in the downturn. Perspect. Labour Income 2010, 22, 5–17. [Google Scholar]
- Bhorat, H.; Cassim, A.; Tseng, D. Higher education, employment and economic growth: Exploring the interactions. Dev. S. Afr. 2016, 33, 312–327. [Google Scholar] [CrossRef]
- Arias, O.S.; Sánchez-Páramo, C.; Dávalos, M.E.; Santos, I.; Tiongson, E.R.; Gruen, C.; de Andrade Falcão, N.; Saiovici, G.; Cancho, C.A. Back to Work: Growing with Jobs in Europe and Central Asia; World Bank Publications: Washington, DC, USA, 2014. [Google Scholar]
- ILO. What Future for Decent Work in EUROPE and Central Asia: Opportunities and Challenges; ILO Publications: Geneva, Switzerland, 2017. [Google Scholar]
- Beck, T.; Demirgüç-Kunt, A.; Maksimovic, V. Financial and legal constraints to growth: Does firm size matter? J. Financ. 2005, 60, 137–177. [Google Scholar] [CrossRef]
- Aterido, R.; Hallward-Driemeier, M.; Pagés, C. Big Constraints to Small Firms’ Growth? Business Environment and Employment Growth across Firms. Econ. Dev. Cult. Chang. 2011, 59, 609–647. [Google Scholar] [CrossRef] [Green Version]
- D’Souza, J.; Megginson, W.L.; Ullah, B.; Wei, Z. Growth and growth obstacles in transition economies: Privatized versus de novo private firms. J. Corp. Financ. 2017, 42, 422–438. [Google Scholar] [CrossRef]
- Hosny, A. Firm Performance and their Perception of Political Instability in Egypt: Evidence from an Endogenous Treatment Regression Model. J. Afr. Dev. 2018, 20, 61–68. [Google Scholar]
- Lakuma, C.P.; Marty, R.; Muhumuza, F. Financial inclusion and micro, small, and medium enterprises (MSMEs) growth in Uganda. J. Innov. Entrep. 2019, 8, 15. [Google Scholar] [CrossRef] [Green Version]
- Reichstein, T.; Dahl, M.S.; Ebersberger, B.; Jensen, M.B. The devil dwells in the tails. J. Evol. Econ. 2010, 20, 219–231. [Google Scholar] [CrossRef] [Green Version]
- Distante, R.; Petrella, I.; Santoro, E. Gibrat’s law and quantile regressions: An application to firm growth. Econ. Lett. 2018, 164, 5–9. [Google Scholar] [CrossRef] [Green Version]
- Aterido, R.; Hallward-Driemeier, M. Investment climate and employment growth the impact of access to finance, corruption and regulations across firms. In Discussion Paper No 3138; IZA: Bonn, Germany, 2007. [Google Scholar]
- Beck, T.; Demirguc-Kunt, A.S.; Laeven, L.; Levine, R. Finance, Firm Size, and Growth. J. Money Credit. Bank. 2008, 40, 1379–1405. [Google Scholar] [CrossRef] [Green Version]
- Soriano, M.T. Department of Labor and Employment’s Response to the Impact of the Financial Crisis. Asia-Pac. Soc. Sci. Rev. 2009, 9, 9. [Google Scholar] [CrossRef]
- Dalgety, J.; Dorsett, R.; Johnston, S. Tax Reform in Open EconomiesInternational and Country Perspectives. In Employment Incentives for Sole Parents: Labour Market Effects of Changes to Financial Incentives and Support; Edward Elgar Publishing: Cheltenham, UK, 2010. [Google Scholar] [CrossRef] [Green Version]
- Waring, P.; Lewer, J. The global financial crisis, employment relations and the labour market in Singapore and Australia. Asia Pac. Bus. Rev. 2013, 19, 217–229. [Google Scholar] [CrossRef] [Green Version]
- Durand, C.; Miroudot, S. Is labour the fall guy of a financial-led globalisation? A cross-country inquiry on globalisation, financialisation and employment at the industry level. Rev. World Econ. 2015, 151, 409–432. [Google Scholar] [CrossRef]
- Clemens, J. Cross-Country Evidence on Labor Market Institutions and Young Adult Employment through the Financial Crisis. South. Econ. J. 2019, 86, 573–612. [Google Scholar] [CrossRef]
- Daway-Ducanes, S.L.S.; Gochoco-Bautista, M.S. Aspects of financial development and manufacturing and services growth: Which matter? Int. J. Financ. Econ. 2021, 26, 2560–2580. [Google Scholar] [CrossRef]
- Fowowe, B. Access to finance and firm performance: Evidence from African countries. Rev. Dev. Financ. 2017, 7, 6–17. [Google Scholar] [CrossRef]
- Beck, T.; Demirguc-Kunt, A. Small and medium-size enterprises: Access to finance as a growth constraint. J. Bank. Financ. 2006, 30, 2931–2943. [Google Scholar] [CrossRef]
- Dollar, D.; Hallward-Driemeier, M.; Mengistae, T. Investment Climate and Firm Performance in Developing Economies. Econ. Dev. Cult. Chang. 2005, 54, 1–31. [Google Scholar] [CrossRef] [Green Version]
- Seker, M.; Correa, P.G. Obstacles to Growth for Small and Medium Enterprises in Turkey, in World Bank Policy Research Working Paper No 5323, 2010, The World Bank. Available online: https://ssrn.com/abstract=1617127 (accessed on 1 July 2021).
- Coluzzi, C.; Ferrando, A.; Martinez-Carrascal, C. Financing obstacles and growth: An analysis for euro area non-financial firms. Eur. J. Financ. 2015, 21, 773–790. [Google Scholar] [CrossRef]
- Chen, G.; Chen, S. Financial Development, Labor Participation, and Employment in Urban China. Emerg. Mark. Financ. Trade 2016, 52, 754–764. [Google Scholar] [CrossRef]
- Popov, A.; Rocholl, J. Do credit shocks affect labor demand? Evidence for employment and wages during the financial crisis. J. Financ. Intermediat. 2018, 36, 16–27. [Google Scholar] [CrossRef]
- Tan, H.; Bashir, S.; Tanaka, N. Skill Use, Skill Deficits, and Firm Performance in Formal Sector Enterprises: Evidence from the Tanzania Enterprise Skills Survey, 2015; The World Bank: Washington, DC, USA, 2016. [Google Scholar]
- Cooper, R.; Gong, G.; Yan, P. Costly Labour Adjustment: General Equilibrium Effects of China’s Employment Regulations and Financial Reforms. Econ. J. 2018, 128, 1879–1922. [Google Scholar] [CrossRef]
- Wadho, W.; Goedhuys, M.; Chaudhry, A. Young innovative companies and employment creation, evidence from the Pakistani textiles sector. World Dev. 2019, 117, 139–152. [Google Scholar] [CrossRef]
- Coad, A.; Rao, R. Innovation and firm growth in high-tech sectors: A quantile regression approach. Res. Policy 2008, 37, 633–648. [Google Scholar] [CrossRef] [Green Version]
- Dimelis, S.; Giotopoulos, I.; Louri, H. Can Firms Grow Without Credit? A Quantile Panel Analysis in the Euro Area. J. Ind. Competition Trade 2017, 17, 153–183. [Google Scholar] [CrossRef]
- Garmaise, M.J. Production in Entrepreneurial Firms: The Effects of Financial Constraints on Labor and Capital. Rev. Financ. Stud. 2008, 21, 543–577. [Google Scholar] [CrossRef]
- Le Queux, S. Industrial Democracy, Partnership and Decent Work in Response to the Global Financial Crisis-7th Asian Congress of the International Labour and Employment Relations Association, 20–23 September 2010. Transf. Eur. Rev. Labour Res. 2011, 17, 127–129. [Google Scholar] [CrossRef]
- Fernandes, A.P.; Ferreira, P. Financing constraints and fixed-term employment: Evidence from the 2008-9 financial crisis. Eur. Econ. Rev. 2017, 92, 215–238. [Google Scholar] [CrossRef] [Green Version]
- Blossfeld, P.N. Labor Market Entry in Germany before and after the Financial Crisis: An Analysis of Duration of Labor Market Entry, Quality of First Job, and Fixed- Term Employment. In Young People’s Development and the Great Recession: Uncertain Transitions and Precarious Futures; Schoon, I., Bynner, J., Eds.; Cambridge University Press: Cambridge, UK, 2017; pp. 208–232. [Google Scholar] [CrossRef]
- Garrido-Cumbrera, M.; Chacón-García, J. Assessing the Impact of the 2008 Financial Crisis on the Labor Force, Employment, and Wages of Persons with Disabilities in Spain. J. Disabil. Policy Stud. 2018, 29, 178–188. [Google Scholar] [CrossRef]
- Aepli, M.; Kuhn, A. Open labor markets and Firms’ substitution between training apprentices and hiring workers. Labour Econ. 2021, 70, 101979. [Google Scholar] [CrossRef]
- Kahn, L.M. Employment protection reforms, employment and the incidence of temporary jobs in Europe: 1996–2001. Labour Econ. 2010, 17, 1–15. [Google Scholar] [CrossRef] [Green Version]
- Cahuc, P.; Malherbet, F.; Prat, J. The detrimental effect of job protection on employment: Evidence from France. In IZA Discussion Papers; Institute of Labor Economics (IZA): Bonn, Germany, 2019. [Google Scholar]
- Boeri, T.; Garibaldi, P. A tale of comprehensive labor market reforms: Evidence from the Italian jobs act. Labour Econ. 2019, 59, 33–48. [Google Scholar] [CrossRef] [Green Version]
- Tanaka, M.; Bloom, N.; David, J.M.; Koga, M. Firm performance and macro forecast accuracy. J. Monet. Econ. 2020, 114, 26–41. [Google Scholar] [CrossRef]
- Ruiz, J.L. Financial development, institutional investors, and economic growth. Int. Rev. Econ. Financ. 2018, 54, 218–224. [Google Scholar] [CrossRef]
- Botero, J.C.; Djankov, S.; La Porta, R.; Lopez-de-Silanes, F.; Shleifer, A. The regulation of labor. Q. J. Econ. 2004, 119, 1339–1382. [Google Scholar] [CrossRef]
- Ur Rehman, N.; Çela, A.; Morina, F.; Sulçaj Gura, K. Barriers to growth of SMEs in Western Balkan countries. J. Manag. Dev. 2019, 38, 2–24. [Google Scholar] [CrossRef]
- Aleksynska, M. Temporary employment, work quality, and job satisfaction. J. Comp. Econ. 2018, 46, 722–735. [Google Scholar] [CrossRef]
- Aparicio-Fenoll, A. The effect of product market competition on job security. Labour Econ. 2015, 35, 145–159. [Google Scholar] [CrossRef]
- World Bank. The Jobs Crisis: Household and Government Responses to the Great Recession in Eastern Europe and Central Asia; The World Bank: Washington, DC, USA, 2011. [Google Scholar] [CrossRef]
- Begenau, J.; Farboodi, M.; Veldkamp, L. Big data in finance and the growth of large firms. J. Monet. Econ. 2018, 97, 71–87. [Google Scholar] [CrossRef] [Green Version]
- Hennessy, C.A.; Whited, T.M. How Costly Is External Financing? Evidence from a Structural Estimation. J. Financ. 2007, 62, 1705–1745. [Google Scholar] [CrossRef] [Green Version]
- Li, J.; Dutta, D.K. Founding team experience, industry context, and new venture creation. N. Engl. J. Entrep. 2018, 21, 2–21. [Google Scholar] [CrossRef]
- Zheng, Y.; Devaughn, M.L.; Zellmer-Bruhn, M. Shared and shared alike? Founders’ prior shared experience and performance of newly founded banks. Strat. Manag. J. 2016, 37, 2503–2520. [Google Scholar] [CrossRef] [Green Version]
- Minnis, M. The Value of Financial Statement Verification in Debt Financing: Evidence from Private U.S. Firms. J. Account. Res. 2011, 49, 457–506. [Google Scholar] [CrossRef]
- Kim, J.-B.; Simunic, D.A.; Stein, M.T.; Yi, C.H. Voluntary Audits and the Cost of Debt Capital for Privately Held Firms: Korean Evidence. Contemp. Account. Res. 2011, 28, 585–615. [Google Scholar] [CrossRef]
- Wooldridge, J.M. Econometric Analysis of Cross Section and Panel Data; MIT Press: Cambridge, MA, USA, 2010. [Google Scholar]
- Ayyagari, M.; Demirgüç-Kunt, A. How Important Are Financing Constraints? The Role of Finance in the Business Environment. World Bank Econ. Rev. 2008, 22, 483–516. [Google Scholar] [CrossRef]
- Léon, F. The provision of long-term credit and firm growth in developing countries. Econ. Model. 2020, 90, 66–78. [Google Scholar] [CrossRef]
- Mare, D. Europe and Central Asia financial systems in historical and cross-country contexts. In Risks and Returns: Managing Financial Trade-Offs for Inclusive Growth in Europe and Central Asia; The World Bank: Washington, DC, USA, 2017. [Google Scholar]
Figure 1.
GDP per capita and reported obstacles at the firm level.

Figure 2.
Coefficients of the obstacles to employment growth by quantile of employment growth distribution. The dashed and the dotted lines are the coefficient estimates and their 95% confidence intervals, respectively.
Figure 2.
Coefficients of the obstacles to employment growth by quantile of employment growth distribution. The dashed and the dotted lines are the coefficient estimates and their 95% confidence intervals, respectively.

Table 1.
Economic indicators of the selected countries in the sample.
| Country | Year | Number of Obs 1 | GDP Growth 2 | GDP per Capita 2 | Inflation 2 | Access-to-Finance Obstacle 3 | Labour Regulation Obstacle 3 | Employment Quality Obstacle 3 |
|---|---|---|---|---|---|---|---|---|
| Albania | 2019 | 281 | 3.124 | 4870.946 | 1.719 | 1.342 | 0.619 | 1.473 |
| Armenia | 2013 | 173 | 0.660 | 3407.045 | 5.516 | 1.809 | 0.341 | 0.514 |
| Azerbaijan | 2013 | 119 | 4.126 | 5773.652 | 3.707 | 1.311 | 0.025 | 0.050 |
| Belarus | 2018 | 465 | 0.210 | 6442.351 | 10.879 | 0.989 | 0.484 | 1.062 |
| Bosnia | 2013 | 209 | 0.065 | 4735.897 | 1.449 | 1.344 | 0.651 | 0.665 |
| Bulgaria | 2019 | 448 | 3.553 | 8343.521 | 1.415 | 0.596 | 0.804 | 1.538 |
| Croatia | 2019 | 362 | 2.938 | 15,305.550 | 0.362 | 0.550 | 1.028 | 1.240 |
| Cyprus | 2019 | 155 | 4.354 | 30,358.400 | −0.262 | 1.161 | 0.658 | 1.348 |
| Czech Republic | 2019 | 426 | 3.505 | 22,631.570 | 1.688 | 1.063 | 1.542 | 1.862 |
| Estonia | 2019 | 282 | 3.864 | 19,105.350 | 1.757 | 0.479 | 0.628 | 1.262 |
| Georgia | 2019 | 318 | 4.156 | 4544.734 | 3.928 | 1.151 | 0.252 | 1.500 |
| Greece | 2018 | 520 | 0.710 | 22,889.400 | −0.425 | 1.533 | 1.733 | 2.015 |
| Hungary | 2019 | 619 | 4.078 | 15,954.390 | 1.774 | 0.336 | 0.672 | 1.405 |
| Italy | 2019 | 477 | 0.968 | 34,910.950 | 0.584 | 1.109 | 1.476 | 1.415 |
| Kazakhstan | 2019 | 670 | 3.000 | 10,950.360 | 7.983 | 1.136 | 0.542 | 1.958 |
| Kosovo | 2019 | 100 | 4.076 | 4137.221 | 0.991 | 2.180 | 1.760 | 2.150 |
| Kyrgyz Republic | 2019 | 236 | 4.243 | 1068.966 | 2.549 | 1.127 | 0.250 | 1.504 |
| Latvia | 2019 | 232 | 3.061 | 15,485.310 | 1.718 | 0.922 | 1.293 | 1.918 |
| Lithuania | 2019 | 289 | 3.282 | 16,842.880 | 1.755 | 0.751 | 0.633 | 1.377 |
| Moldova | 2019 | 252 | 3.304 | 3327.610 | 6.098 | 1.417 | 0.694 | 1.722 |
| Montenegro | 2019 | 105 | 3.951 | 7881.853 | 0.743 | 0.638 | 1.067 | |
| North Macedonia | 2019 | 202 | 2.811 | 5346.064 | 0.607 | 0.985 | 0.490 | 1.109 |
| Poland | 2019 | 251 | 4.267 | 15,934.570 | 0.915 | 0.948 | 1.223 | 1.434 |
| Portugal | 2019 | 753 | 2.424 | 23,311.700 | 0.759 | 1.284 | 1.169 | 1.056 |
| Romania | 2013 | 351 | −0.364 | 8542.666 | 4.958 | 1.538 | 1.202 | 1.778 |
| Russia | 2019 | 761 | 0.785 | 11,623.630 | 6.722 | 1.202 | 0.915 | 1.235 |
| Serbia | 2019 | 206 | 3.149 | 6641.880 | 1.891 | 0.578 | 0.883 | 1.233 |
| Slovak Republic | 2019 | 377 | 3.257 | 19,922.750 | 1.129 | 0.976 | 1.199 | 1.363 |
| Slovenia | 2019 | 304 | 3.345 | 25,587.250 | 0.844 | 0.592 | 1.299 | 1.253 |
| Tajikistan | 2019 | 113 | 6.962 | 1026.229 | 0.655 | 0.425 | 0.965 | |
| Turkey | 2019 | 902 | 4.089 | 14,571.710 | 11.620 | 1.762 | 1.669 | 1.991 |
| Ukraine | 2019 | 701 | 0.313 | 3010.432 | 19.178 | 2.414 | 1.447 | 2.091 |
| Uzbekistan | 2019 | 644 | 5.803 | 2298.253 | 0.635 | 0.225 | 0.579 |
1 Number of Obs is the number of firms in the sample. 2 GDP growth, GDP per capita, and inflation variables are averages of three years before the year of the survey. 3 Access-to-finance obstacle, labour regulation obstacle, and employment quality obstacle are the country’s averages of these obstacles.
Table 2.
Summary statistics.
| Count | Mean | Std. Dev. | Min. | Max. | |
|---|---|---|---|---|---|
| Employment growth | 11,691 | 1.956 | 6.854 | −32.253 | 41.071 |
| Permanent worker ratio | 12,290 | 96.000 | 11.818 | 3.654 | 100.000 |
| Access-to-finance obstacles | 12,303 | 1.148 | 1.256 | 0.000 | 4.000 |
| Labour regulation obstacles | 12,303 | 0.962 | 1.132 | 0.000 | 4.000 |
| Employment quality obstacles | 12,303 | 1.448 | 1.336 | 0.000 | 4.000 |
| Small | 12,303 | 0.444 | 0.497 | 0.000 | 1.000 |
| Medium | 12,303 | 0.346 | 0.476 | 0.000 | 1.000 |
| Government | 12,303 | 0.017 | 0.129 | 0.000 | 1.000 |
| Foreign | 12,303 | 0.088 | 0.284 | 0.000 | 1.000 |
| Experience | 12,303 | 20.937 | 10.637 | 1.000 | 55.000 |
| Mature firm | 12,303 | 0.361 | 0.480 | 0.000 | 1.000 |
| Old firm | 12,303 | 0.582 | 0.493 | 0.000 | 1.000 |
| Certified | 12,303 | 0.360 | 0.480 | 0.000 | 1.000 |
| Manufacturing | 12,303 | 0.547 | 0.498 | 0.000 | 1.000 |
| Labour cost per sale | 12,303 | 0.219 | 0.163 | 0.002 | 1.527 |
| Sales growth | 12,303 | 0.104 | 0.260 | −0.423 | 2.249 |
Table 3.
Employment growth and firm-level obstacles.
| IV (1) | OLS (2) | 0.25 Quartile (3) | 0.50 Quartile (4) | 0.75 Quartile (5) | |
|---|---|---|---|---|---|
| Access-to finance-obstacles | −0.812 *** | −0.072 | −0.043 ** | −0.039 * | 0.069 |
| (−5.176) | (−1.252) | (−2.249) | (−1.877) | (1.255) | |
| Labour regulation obstacles | 0.880 *** | 0.165 ** | 0.029 | 0.081 ** | 0.066 |
| (5.347) | (2.597) | (1.387) | (3.164) | (1.003) | |
| Employment quality obstacles | −0.536 ** | 0.007 | −0.028 | 0.066 ** | 0.180 ** |
| (−3.115) | (0.126) | (−1.368) | (2.991) | (3.261) | |
| Small | −0.859 *** | −0.948 *** | −0.189 ** | −0.733 *** | −0.194 |
| (−4.694) | (−5.722) | (−2.657) | (−12.662) | (−1.033) | |
| Medium | 0.090 | 0.073 | −0.041 | 0.167 ** | 0.347 ** |
| (0.518) | (0.480) | (−0.869) | (2.195) | (2.460) | |
| Government | −2.459 *** | −2.148 *** | −1.052 ** | −1.383 *** | −2.048 *** |
| (−5.067) | (−4.662) | (−3.220) | (−14.541) | (−6.090) | |
| Foreign | −0.663 ** | −0.490 ** | −0.042 | −0.163 * | −0.456 ** |
| (−2.948) | (−2.312) | (−0.546) | (−1.690) | (−2.766) | |
| Experience | −0.007 ** | −0.010 | −0.002 | −0.008 * | −0.024 ** |
| (−2.587) | (−1.641) | (−0.404) | (−1.690) | (−2.657) | |
| Mature firm | −1.835 *** | −1.686 *** | −0.097 | −0.882 * | −2.325 *** |
| (−6.652) | (−4.816) | (−1.171) | (−1.956) | (−5.192) | |
| Old firm | −3.364 *** | −3.117 *** | −0.229 ** | −1.394 ** | −4.012 *** |
| (−12.297) | (−8.898) | (−2.106) | (−3.104) | (−8.989) | |
| Certified | 0.044 | −0.114 | −0.059 | −0.037 | −0.195 |
| (0.343) | (−0.886) | (−1.343) | (−0.765) | (−1.368) | |
| Manufacturing | −0.953 ** | −0.652 * | −0.333 ** | −0.277 * | −0.303 |
| (−2.545) | (−1.683) | (−2.113) | (−1.930) | (−0.788) | |
| Labour cost per sale | 0.365 ** | 0.353 ** | 0.066 | 0.195 ** | 0.157 |
| (2.617) | (2.587) | (1.498) | (3.137) | (1.176) | |
| Sales growth | 6.519 *** | 6.293 *** | 1.619 *** | 5.817 *** | 11.128 *** |
| (27.031) | (15.638) | (5.522) | (16.498) | (19.964) | |
| _cons | 5.095 *** | 5.438 *** | −0.750 | 4.128 *** | 10.523 *** |
| (11.486) | (8.515) | (−0.734) | (7.505) | (14.321) | |
| Impact (Access-to-finance) | −0.932 *** | −0.083 | −0.049 ** | −0.045 * | 0.079 |
| Impact (Labour regulation) | 0.847 *** | 0.159 ** | 0.028 | 0.078 | 0.063 |
| Impact (Employment quality) | −0.776 ** | 0.010 | −0.041 | 0.096 ** | 0.261 |
| Year fixed effect | Yes | Yes | Yes | Yes | Yes |
| Country fixed effect | Yes | Yes | Yes | Yes | Yes |
| N | 11,691 | 11,691 | 11,691 | 11,691 | 11,691 |
| F | 80.115 | 19.461 | |||
| R2 | 0.074 | 0.115 |
Note: The OLS t-statistics (in parentheses) are robust to heteroscedasticity. The quantile regression estimates, along with t-statistics (in parentheses), were obtained using Stata 14.0. * significant at 10%; ** significant at 5%; *** significant at 1%.
Table 4.
Permanent employment and firm-level obstacles.
| IV (1) | OLS (2) | OLS (3) | OLS (4) | OLS (5) | |
|---|---|---|---|---|---|
| Access-to-finance obstacle | −1.920 ** | −0.115 | −0.203 ** | ||
| (−2.048) | (−1.299) | (−2.372) | |||
| Labour regulation obstacle | −3.921 *** | −0.191 * | −0.307 ** | ||
| (−4.059) | (−1.683) | (−2.957) | |||
| Employment quality obstacle | −0.702 | −0.166 * | −0.255 ** | ||
| (−0.968) | (−1.817) | (−3.029) | |||
| Small | 1.101 ** | 1.882 *** | 1.964 *** | 1.901 *** | 1.891 *** |
| (2.684) | (6.034) | (6.277) | (6.098) | (6.070) | |
| Medium | −0.077 | 0.238 | 0.273 | 0.250 | 0.239 |
| (−0.227) | (0.754) | (0.864) | (0.790) | (0.758) | |
| Government | 0.074 | 0.186 | 0.238 | 0.183 | 0.173 |
| (0.078) | (0.231) | (0.296) | (0.228) | (0.215) | |
| Foreign | −0.340 | 0.387 | 0.390 | 0.421 | 0.421 |
| (−0.730) | (0.986) | (0.991) | (1.073) | (1.073) | |
| Experience | −0.005 | −0.000 | −0.000 | −0.001 | −0.000 |
| (−0.898) | (−0.092) | (−0.061) | (−0.104) | (−0.047) | |
| Mature firm | 1.394 ** | 1.684 ** | 1.703 ** | 1.686 ** | 1.693 ** |
| (2.738) | (2.945) | (2.971) | (2.949) | (2.957) | |
| Old firm | 1.248 ** | 1.892 ** | 1.916 *** | 1.901 ** | 1.920 *** |
| (2.380) | (3.271) | (3.304) | (3.287) | (3.314) | |
| Certified | 1.912 *** | 1.651 *** | 1.651 *** | 1.616 *** | 1.645 *** |
| (6.961) | (7.050) | (7.062) | (6.954) | (7.031) | |
| Manufacturing | 0.191 | −0.978 | −1.062 * | −1.038 * | −0.997 |
| (0.253) | (−1.604) | (−1.737) | (−1.698) | (−1.634) | |
| Labour cost per sale | 0.664 ** | 0.224 | 0.172 | 0.206 | 0.224 |
| (2.220) | (0.976) | (0.745) | (0.894) | (0.976) | |
| Sales growth | −1.949 *** | −1.751 *** | 0.000 | 0.000 | 0.000 |
| (−4.261) | (−3.407) | (.) | (.) | (.) | |
| _cons | 98.444 *** | 96.175 *** | 95.732 *** | 95.835 *** | 95.882 *** |
| (56.910) | (124.061) | (128.410) | (129.693) | (126.810) | |
| Impact (Access to finance) | −2.204 ** | −0.132 | −0.233 ** | ||
| Impact (Labour regulation) | −3.772 *** | −0.184 * | −0.295 ** | ||
| Impact (Employment quality) | −1.016 | −0.240 * | −0.369 ** | ||
| Year fixed effect | Yes | Yes | Yes | Yes | Yes |
| Country fixed effect | Yes | Yes | Yes | Yes | Yes |
| N | 12,290 | 12,290 | 12,290 | 12,290 | 12,290 |
| F | 30.780 | 17.177 | 17.813 | 17.883 | 17.907 |
| r2 | 0.114 | 0.121 | 0.121 | 0.121 | 0.121 |
Note: The OLS t-statistics (in parentheses) are robust to heteroskedasticity. * Significant at 10%; ** significant at 5%; *** significant at 1%.
Table 5.
Summary of barriers, drivers, and solutions relating to the promotion of employment growth and job security.
Table 5.
Summary of barriers, drivers, and solutions relating to the promotion of employment growth and job security.
| Barriers | Drivers | Solutions |
|---|---|---|
|
|
|
Publisher’s Note: MDPI stays neutral with regard to jurisdictional claims in published maps and institutional affiliations. |
© 2021 by the authors. Licensee MDPI, Basel, Switzerland. This article is an open access article distributed under the terms and conditions of the Creative Commons Attribution (CC BY) license (https://creativecommons.org/licenses/by/4.0/).
Share and Cite
MDPI and ACS Style
Bui, A.T.; Pham, T.P. Financial and Labour Obstacles and Firm Employment: Evidence from Europe and Central Asia Firms. Sustainability 2021, 13, 8650. https://0-doi-org.brum.beds.ac.uk/10.3390/su13158650
AMA Style
Bui AT, Pham TP. Financial and Labour Obstacles and Firm Employment: Evidence from Europe and Central Asia Firms. Sustainability. 2021; 13(15):8650. https://0-doi-org.brum.beds.ac.uk/10.3390/su13158650
Chicago/Turabian StyleBui, Anh Tuan, and Thu Phuong Pham. 2021. "Financial and Labour Obstacles and Firm Employment: Evidence from Europe and Central Asia Firms" Sustainability 13, no. 15: 8650. https://0-doi-org.brum.beds.ac.uk/10.3390/su13158650
Note that from the first issue of 2016, this journal uses article numbers instead of page numbers. See further details here.