Article

A Methodological Approach to Designing Circular Economy Indicators for Agriculture: An Application to the Egg Sector

1
Department of Agricultural Economics and Consumer Science, Laval University, 2425, Rue de l’Agriculture, QC G1V 0A6, Canada
2
Department of Biology, Irving K. Barber Faculty of Science, University of British Columbia Okanagan, 340-3247 University Way, Kelowna, BC V1V 1V7, Canada
*
Author to whom correspondence should be addressed.
Sustainability 2021, 13(15), 8656; https://0-doi-org.brum.beds.ac.uk/10.3390/su13158656
Submission received: 25 June 2021 / Revised: 22 July 2021 / Accepted: 26 July 2021 / Published: 3 August 2021
(This article belongs to the Collection Circular Economy and Sustainable Strategies)

Abstract

:
Analysing production systems from a circular economy (CE) perspective helps to pinpoint interventions to mitigate the environmental footprint by improving resource use efficiency, waste recovery, and prolonged product usage, recycling and reuse. Few studies exist on the measurement of CE at the micro-level. Additionally, available metrics/indicators address only certain aspects of the CE’s socio-economic metabolism, ignoring important components of the CE concept. Other frameworks propose a single indicator that aggregates and summarizes several facets of CE. This study develops a holistic approach for designing indicators with a structured methodology and an analytical framework to assess CE at the micro (unit of production) level in agriculture. The proposed approach is based on the ECOGRAI method for indicator development, and on validation of the methods with experts and final users via an application to egg production in Canada. Twenty-five performance indicators (PI) were generated for 11 decision variables that were selected as important for the sector. This resulted in a practical tool that proposes fourteen actions to improve the economic circularity (EC) of egg farms. Our methodological approach could be replicated to assess CE performance in other agricultural sectors.

1. Introduction

The circular economy (CE) offers opportunities to reduce the environmental footprint of production by reducing the use of resources and increasing waste recovery. CE arose in response to the organizational problems of the standard linear model consisting of extracting, producing, consuming and throwing away [1,2,3,4,5,6,7]. Kirchherr et al. [8] reviewed 114 CE definitions and provided the following synthetic definition:
“(…) an economic system that replaces the ‘end-of-life’ concept with reducing, alternatively reusing, recycling and recovering materials in production/distribution and consumption processes. It operates at the micro level (products, companies, consumers), meso level (eco-industrial parks) and macro level (city, region, nation and beyond), with the aim to support achieving sustainable development, thus simultaneously creating environmental quality, economic prosperity and social equity, to the benefit of current and future generations. It is enabled by novel business models and responsible consumers” [8] (p. 229).
The transition to CE happens in parallel to ongoing efforts under the umbrella of sustainable development (SD), including resource efficiency, supply chain management, critical raw material risk mitigation, etc. [9]. Sustainable development (SD) is defined as “development that meets the needs of the present without compromising the ability of future generations to meet their own needs. It contains within it the concept of ‘needs’, in particular the essential needs of the world’s poor, to which overriding priority should be given; and the idea of limitations imposed by the state of technology and social organization on the environment’s ability to meet present and future needs” [10] (p. 15). As a broader concept [2], CE is a promising framework to attain SD objectives [11,12,13,14]. From this perspective, the recent goal of the European Commission to close material loops and develop the European economy towards a more circular system reflects the key role that CE can play in reaching SD goals [15,16]. This view is also supported by countries such as Canada, China, Japan, and the USA, and organizations such as the OECD and the United Nations [17,18].
To facilitate the transition to CE, industries need not only a clear vision of the different CE options, but also indicators and targets to monitor progress towards its objectives [19]. Despite efforts to make the transition from a linear economy towards a more circular model, there is currently no consensus on the accepted monitoring framework to assess progress towards a CE [20,21]. Moreover, common practice is to study only certain aspects of the CE’s socio-economic ecosystem such as waste disposal and recycling efficiency, even though the CE concept inherently requires a global perspective. For example, with respect to resource efficiency, which is most frequently understood as producing more output from less input, the European Commission states that the existing metrics miss the main goal of the CE, which is to maintain the value of products, parts, and materials over a maximum period of time [20]. Therefore, pure resource efficiency metrics do not necessarily track the progress of CE, because their main aim is not the cyclic use of materials and products, but rather reduced resource consumption [22]. For authors such as Cayzer et al. [23] and Elia et al. [24], focusing on one single dimension of the CE (e.g., resource use) represents a limitation in the assessment of CE models, since no single existing indicator encompasses all of the requirements of the CE paradigm.
The lack of systemic assessment of CE is also highlighted by Parchomenko et al. [18] and Saidani et al. [19]. For instance, Parchomenko et al. [18] analyzed 63 metrics available for CE assessment and found poor integration between resource-efficiency metrics and product-centric metrics. The same authors stressed that the systemic measures are least frequently assessed. The lack of adequate indicators to comprehensively measure CE at the micro scale is similarly a major obstacle to its application [4,9]. Elia et al. [24] analyzed fourteen environmental assessment methodologies of products, services and processes in relation to their ability to accurately and comparably measure different CE objectives and concluded that none of the methodologies satisfactorily meet all of these objectives.
The application of CE to the agricultural sector and agri-food industry is particularly promising because of the immanent characteristics of agricultural activities (i.e., the use of biological cycles) as well as the considerable volume of wastes generated throughout the agri-food supply chain [25]. The sector also offers distinctive opportunities to move towards greater CE, in particular through a wide range of possibilities for bio-waste to become inputs to new production [6]. However, developing suitable indicators to monitor this progress requires a conceptual framework adapted to this sector [26]. The current literature does offer indicators at the farm level, but few publications address approaches to develop them and guidance on how to apply them to improve CE [27,28].
This article hence seeks to propose a methodological approach to design indicators that can holistically measure CE at the farm level in agriculture. Towards this end, the article is positioned as a contribution to the overall objective of developing indicators for systemic measurement of CE at the scale of specialized farms. Specifically, this study proposes a methodological approach to develop and validate CE indicators, and to use these indicators to inform managers about areas where performance could be improved. The proposed methodology is applied to egg production in Canada. This sector is of interest due to its short value chain, its profitability and its capacity for innovation [29]. Additionally, on-farm inputs and activities in egg production contribute to roughly 60% of life cycle energy, greenhouse gas and nutrient emissions associated with the complete egg supply chain [30].
It is important to mention that, in this article, the indicators which are presented, and which have been developed for the egg production sector, are only indicative to better materialize the applicability of the methodological approach that we propose and to provide information on the nature of the results that one can expect. The primary is to propose a novel methodological approach that assures a systemic coverage of all CE objectives, with validation by scientists and end users.
Our approach uses an analytical framework that assures that all objectives are covered, supporting coherence between indicators and CE goals. An iterative process of consultation with farm managers will validate their practicality and a validation by experts will permit a classification as well as a prioritization of the indicators’ importance. These indicators can then be applied to improve CE by pairing them with a benchmark or by using a decision tree to identify areas where interventions would be needed.
The first part of Section 2 presents the analytical framework to define the measurement of CE at the farm (unit of production) level. In the second part, the developed approach is illustrated through an application in the egg production sector. Section 3 and Section 4 discuss results and areas where trade-off analysis is necessary. The last section provides concluding remarks.

2. Methodological Approach and Its Outcomes

This section presents the analytical framework that was constructed and the methodological approach developed for designing CE indicators. Figge et al. [31] encouraged the combination of circularity measures and life cycle sustainability indicators, since only a few of the CE indicators attempt to provide a more holistic approach, taking into account both intrinsic circularity and the effects of this circularity on the three pillars of sustainable development [24,32]. The analytical framework developed for our study will be constructed in the light of these recommendations by combining previous approaches.

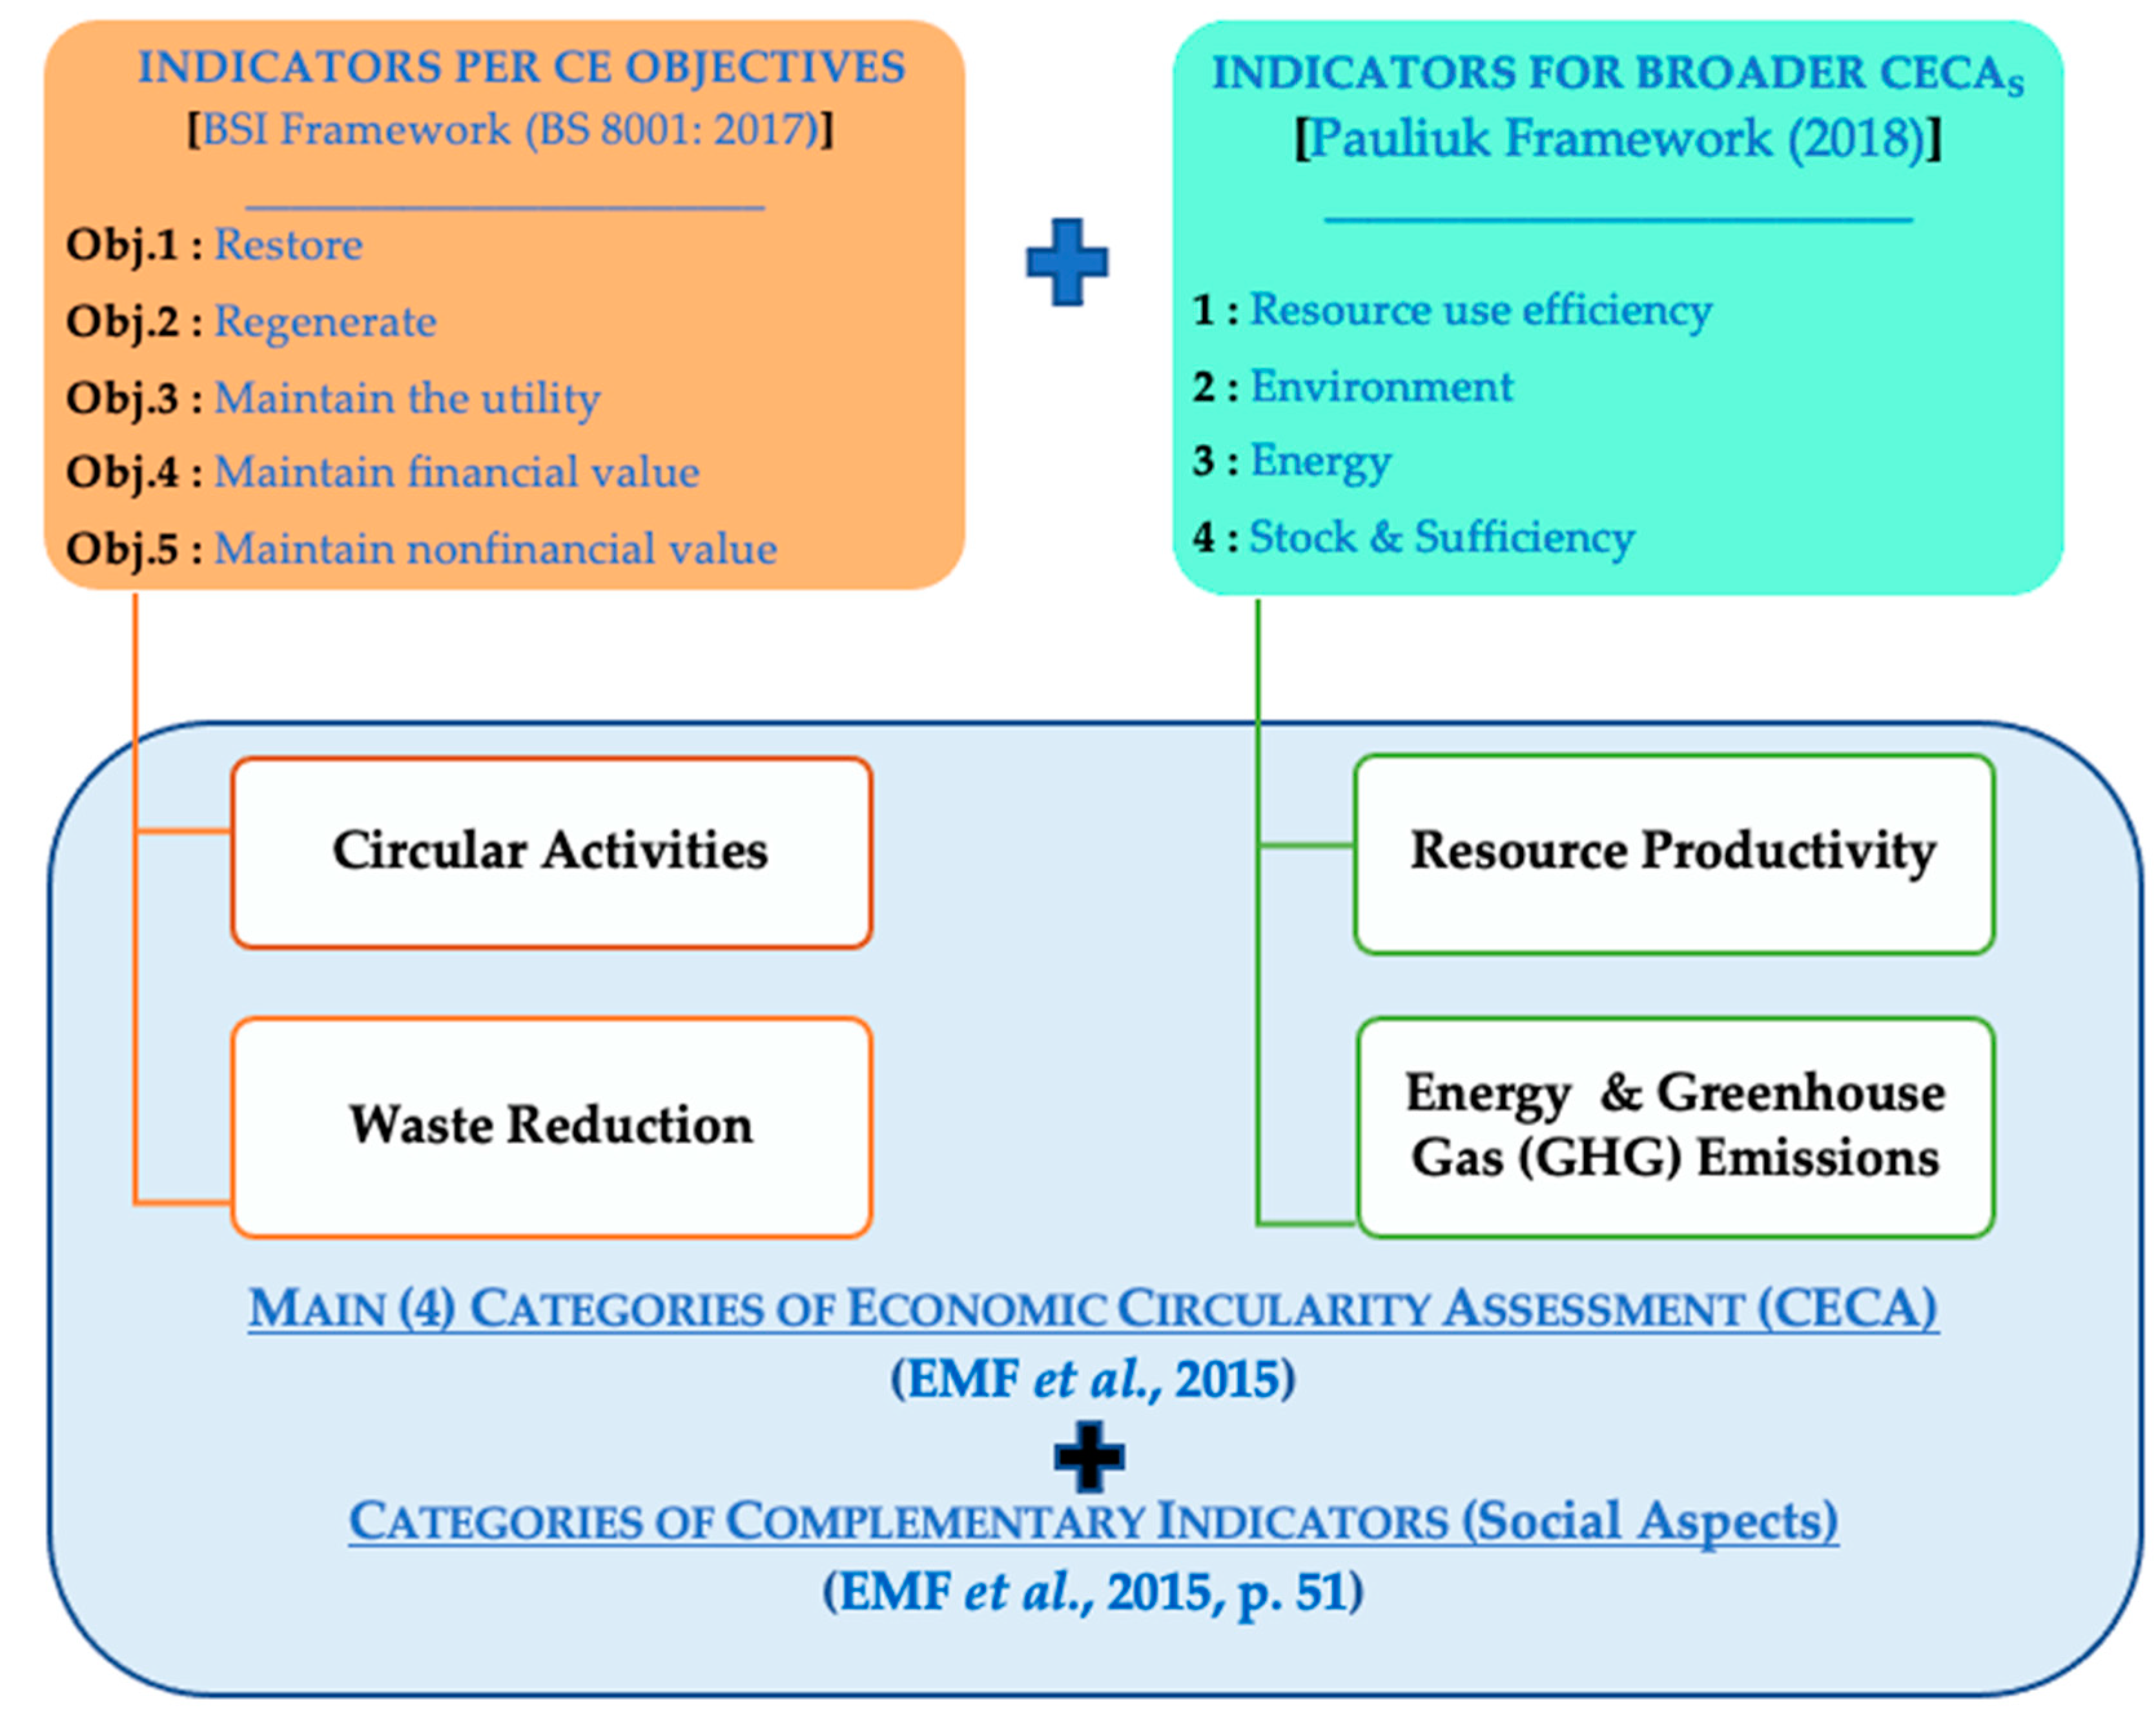
2.1. Analytical Framework
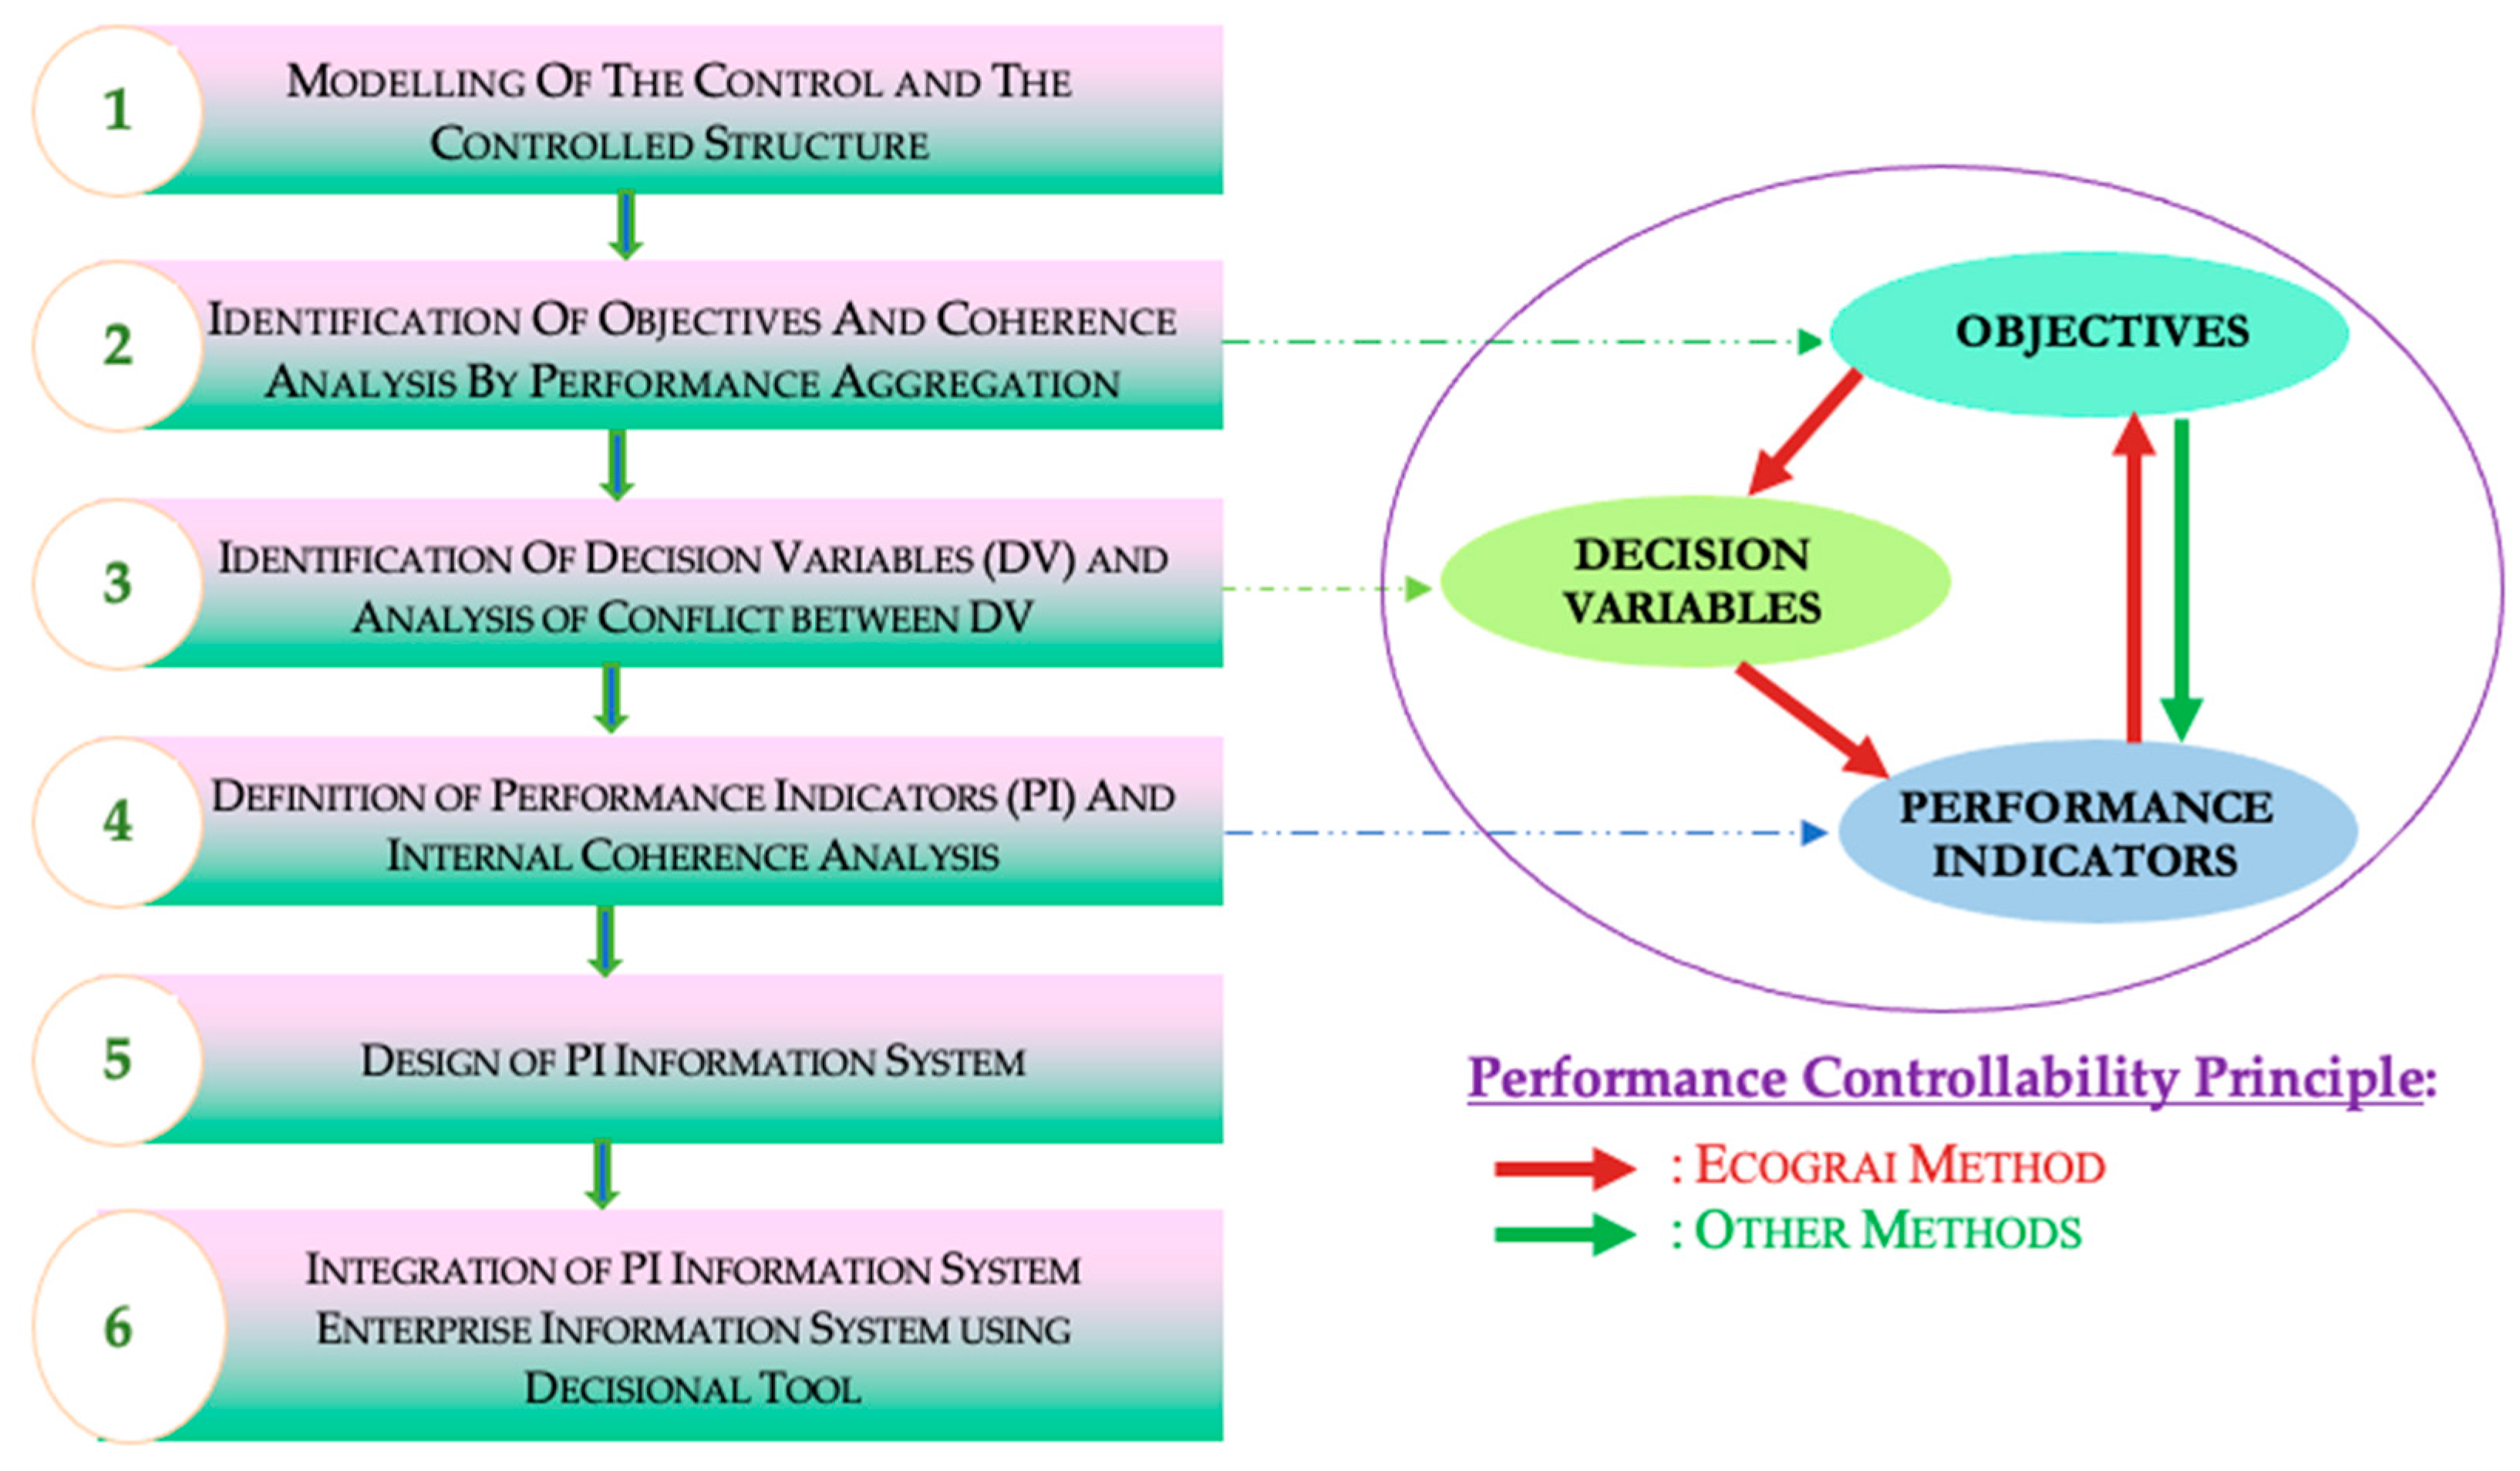
The initial set of indicators for our analytical framework combines elements from the Ellen MacArthur Foundation (EMF) and the British Standards Institution (BSI). The Ellen MacArthur Foundation (EMF) identified four main categories for economic circularity assessment (Categories of Economic Circularity Assessment (CECA)) [4]: (1) resource productivity; (2) circular activities; (3) waste production and reduction; and (4) energy and greenhouse gas emissions. The British Standards Institution (BSI) established the first normative framework (BS 8001) for designing CE indicators at the unit of production level [9]. Proposed indicators of the BSI framework are defined with the following CE objectives: to (i) restore, (ii) regenerate, (iii) maintain utility, (iv) maintain financial value and (v) maintain nonfinancial value [33].
Pauliuk [9] remarked that the BSI framework focuses mainly on circular activities and waste production and reduction. He proposed an analytical framework that includes broader categories such as: (a) resource efficiency; (b) environment; (c) energy and (d) stock and sufficiency. Combining these two frameworks seems appropriate for two reasons: (i) waste production and reduction are important CE activities for the agricultural sector because of the considerable volume of organic wastes generated throughout the agri-food supply chain [25], which offers a wide range of possibilities for bio-waste to become inputs in other sectors [6]; and (ii) the resulting framework offers a complete coverage of the four main CECAs identified by the EMF [4].
To facilitate the assessment of the CE across all components, the EMF recommends adding to the main CECAs, and propose a set of 45 complementary indicators [4]. Among these, we selected 7 that we believed are the most relevant for the agricultural sector: (a) economic performance, (b) indirect economic impacts, (c) employment, (d) occupational health and safety, (e) supplier assessment for impacts on society (includes procurement practices and policy), (f) effluent management and (g) biodiversity (plant protection and animal welfare). These parameters have been selected by the research team to include any component that would likely apply to the egg sector. They are later validated through discussions with experts in CE as well as with farm managers. Figure 1 presents the analytical framework we propose for CE indicator design in the agricultural sector.
Our analytical framework assures that all CECAs are covered. Furthermore, it adds features that capture the aspects related to the maintenance of value (financial and non-financial) of products, parts, and materials. In the context of CE and in the context of this article, the nonfinancial value refers to the anthropogenic lifetime of material in production: the average residence time of a material in the anthroposphere [9]. These aspects are often lacking in CE metrics [18,20] or not fully covered in other frameworks, such as those of Wisse [34] and Akerman [35]. There are other indicator frameworks, such as 4Agro (a method for the evaluation of environmental, social and economic sustainability in agriculture) [36] and IDEA (IDEA stands for (in French): indicateurs de durabilité des exploitations agricoles (farm sustainability indicators in English)) [37,38]. However, these frameworks are suitable for integrated farms but are incomplete for highly specialized farms [39].

2.2. Methodology

Following the literature review, an iterative process of consultation with farm managers was used to validate the indicators’ practicality and a scientific validation with CE experts permitted a classification as well as a prioritisation of the indicators’ importance. The following sub-sections present an overview of the phases of the methodological approach, followed by a detailed description of each phase.

2.2.1. Overview of the Methodological Phases and Their Expected Results

Our approach consists of a methodical suite of development (or elaboration), validation (general, practical and by experts) and transformation into areas for actions, as summarized in Table 1.

2.2.2. Methodological Phase 1: Indicator Development

The expected result of this phase is a set of identified performance indicators (PI) for measuring CE in agriculture. To this end, we used the ECOGRAI (developed in France by the University of Bordeaux, which stands for (in French): ECO: economy, GRAI: Groupe de Recherche en Automatisation Intégrée (Research Group for Integrated Automation) [40]) method, which is a recommended method for the design of performance indicators [7,40,41] due to its originality and controllability [41].
The originality of the ECOGRAI method is that it is built upon the concept of decision variables (DVs) on which stakeholders can act to reach their objectives (Figure 2). Thus, the core of the method is its controllability principle, based on the triplet: objectives—decision variables—performance indicators (PI) by a top-down approach (from objective to performance indicator) for the design and a bottom-up (from performance indicator to objective) approach for the implementation [41].
One of the advantages of the ECOGRAI method is that it can be used in any production system while offering an original approach to clearly define objectives [7]. The ECOGRAI method has previously been used by several researchers to design indicators [41,42,43,44].
The logical, structured approach of the method can be decomposed into six steps [41]. The first step consists of modeling the control structure (decision system) and the controlled structure (physical transformation system) of the enterprise or the studied domain. The second and third steps of the method aim at identifying the coherent objectives (performance to achieve by the controlled activity of the physical system) and the decision variables to reach this performance. The fourth step consists of identifying the performance indicators, the fifth of designing the information system to build the performance indicators, and the sixth consists of implementing it inside the enterprise’s information system. Figure 2 shows the 6 steps followed in the ECOGRAI methodology to design performance indicators and the originality of this method (the performance controllability principle).
A description of each step is provided below, along with our empirical example for the egg production sector.
Step 1. ECOGRAI: Modeling of the control structures of the physical system.
The objective of this step is to determine, first, the physical system for which the performance will be analyzed and, second, the decision centers of the management system in which the decisions are made to control and to improve the performance. The ECOGRAI method uses the GRAI grids to model the control structure of the physical system in order to identify the set of decision centers of the studied system, as well as their links. The decision centers control part of the physical system more or less globally depending on the decision level, with the whole GRAI grid controlling the whole physical system [41].
The physical system considered in this study is the farm or unit of production. Specifically, our system is an agricultural production system, which combines various inputs or raw materials (seed, feed, water, energy, etc.) and other resources such as land, equipment and machinery, and labor into farm outputs (crops/livestock). Our application will focus on typical egg production (in cages) from commercial or industrial egg farms for the table egg market. The boundary (i.e., frontier) of our analysis will exclude the egg processing sector (washing and grading). This is done to focus our attention on the effect of farm practices on the EC of egg production. This will allow us to pinpoint interventions that farm managers can implement to improve EC. The processing sector is a separate nodule in the provision chain that would need its own EC analysis. The choice of transportation to the grader will be included.
Following this logical frame, the decision centres (or control structures) for the physical system built to design CE performance indicators in agriculture will be the four main categories of economic circularity assessment (CECAs) presented in our analytical framework (Figure 1): resource productivity, circular activities, waste production and reduction, and energy and greenhouse gas emissions.
Step 2. ECOGRAI: Identification of CE Objectives and coherence analysis.
This phase identifies the objectives of the CECAs and their coherence [41]. Following a top-down approach, we first identified the objective of the whole system and then the objectives for each CECA. The underlying objective of our system is to improve the economic circularity of egg production at the farm level. Using a literature review [4,9,33,45], we identified the circularity objectives for the four CECAs in the egg sector. Coherence is verified when at least one activity category is associated with one or more objectives. Table 2 presents the identified circularity objectives by CECA.
Step 3. ECOGRAI: Identification of decision variables.
In this step, DVs corresponding to each objective of the CECA need to be identified. This identification must be interpreted as the central step leading to the building of the control triplet objectives/decision variables/performance indicators [40]. Using the following literature [4,9,30,33,45,46,47,48,49], we identified 14 DVs for the four CECAs of the physical system of egg production. These are variables that make it possible to monitor and quantify the use of resources (land, water and energy), the production inputs (pullets, feeds, etc.), the recovery of materials (manure/litter, mortalities, spent hens, downgraded eggs, packaging material and other disposables), greenhouse gas and nutrient emissions and human capital (occupational health and employment) [46,49]. The internal coherence analysis was used to classify the DVs by CECA (Figure 3). Thus, 5 DVs are classified for the CECA of resource use efficiency, 4 DVs for the CECA of waste reduction and circular activities, 2 DVs for the CECA of energy and greenhouse gas emissions and 3 DVs for the CECA of complementary indicators.
Step 4. ECOGRAI: Definition of performance indicators (PI) and internal coherence analysis.
This article adopts the OECD [50] view, where a performance indicator (PI) is defined as “a quantitative or qualitative factor or variable that provides a simple and reliable means to measure achievement, to reflect changes connected to an intervention, or to help assess the performance of a development actor” [50] (p. 13). Therefore, both quantitative and qualitative performance indicators are developed in our study.
Performance indicators (PI) are identified for each DV using the literature [1,4,6,9,13,14,30,33,45,46,47,49,51,52,53,54]. A set of 36 PIs have been identified for 14 DVs, based on information taken from the above-mentioned literature. In Figure 3, next to each DV, the number of the first (identified) PI is indicated in parentheses in roman numerals. Non-roman numerals represent numbers of PIs that will be discussed later.
We verify that this set of PIs is coherent. By definition, a PI is considered coherent (both with its respective DV and CECA) if it allows for measuring the efficiency of activities deployed to reach the objective and is influenced by actions on the DV [7]. To verify this, coherence panels provide a pairing between PIs and DVs as well as between PIs and CECAs. The links are given weights according to the connection: strong link (**), weak link (*), no link ( ) [41].
Coherence analysis for the information gathered in Figure 3 is illustrated in Table 3 for the CECA “Resource Use Efficiency”, illustrating how each of all of the circularity objectives are related to a PI and that all the DVs influence at least one indicator. The panels for the remaining CECAs can be found in the Supplementary Material S1 (i.e., S1a and S1b). The coherence panels that are presented are those that have been validated for the egg production sector by producers’ representatives (provincial committee) and farm managers.
Steps 5 and 6. ECOGRAI: Design of performance indicator information systems and their integration in the farm’s information system.
ECOGRAI is oriented towards the possible automation of the performance evaluation system [41]. The last two steps (fifth and sixth) of the ECOGRAI method consist of implementing the indicators in the company’s information system for automation of the performance evaluation system. Although this offers the ultimate objective of streamlining the integration of CE performance indicators into the farm’s overall performance monitoring system, the current study does not implement this phase. In fact, for a study such as ours, whose objective is limited to developing CE type indicators that could be used to monitor the implementation of more sustainable practices, only the first four steps of the ECOGRAI process are executed for our empirical application.
To conclude on phase 1 of our methodological approach (indicators development), the application of the ECOGRAI method and our analytical framework to the egg production sector led to the development of 36 coherent performance indicators (roman numerals reported in parentheses next to DVs in Figure 3).

2.2.3. Methodological Phase 2: General Validation

The first identified performance indicators (PI) were presented to a focus group consisting of nine egg producers. As a result of the focus group, some identified PIs were revised to better match terms and units used by farm managers. Furthermore, we eliminated three PIs (namely (1) renewal rate of light production equipment (cages, feeder and waterers, scraping pads, etc.); (2) intensity use (in terms of cost) of material and other disposables; and (3) practices that are put in place by the company to avoid eutrophication and water pollution, and to control the air quality in its direct environment) that were determined to be of low value, reducing the number of identified PIs from 36 to 33 (Cf. first set of non-roman numerals reported in parentheses next to DVs in Figure 3).

2.2.4. Methodological Phase 3: Practical Validation

A practical validation was executed by meeting farm managers on three egg farms in Quebec (Canada). Every element of the indicators (formulation, unit of measurement, etc.) was validated to confirm (1) that the indicators are practical enough and (2) that the data are available at the farm. The questionnaire was used to structure our open discussion during these meetings and included discussion points for each indicator identified previously.
This phase resulted in the removal of one indicator (“Share of food that is wasted in farm’s operations. Of this percentage, what part is recovered or reused?”) because it was judged non-practical. Additionally, other indicators were reformulated to be more user friendly. In sum, after this phase, we had 32 PIs left (Cf. last non-roman numerals reported in parentheses beside DVs in Figure 3).

2.2.5. Methodological Phase 4: Expert Validation (DELPHI)

The DELPHI method is a structured and interactive process aimed at gathering the opinions or knowledge of a group of experts on a specific topic [55]. This method is used to validate new concepts for which the academic literature provides insufficient guidance, as is the case for the measurement of CE at the farm level. The DELPHI process uses a questionnaire to consult a group of experts that are anonymous to each other. This is an iterative process, since once the questionnaires are received, an anonymous summary of the opinions is prepared by the facilitator and is shared with the experts. The experts are then encouraged to revise or justify their initial responses in light of this new information. Iterations continue until a state of consensus or saturation is obtained [56,57]. The advantages of this approach are that the use of questionnaires avoids interferences of interactive social behavior that may occur in a face-to-face discussion [58] and provides equal weight to every voice.
The experts contacted for this study had published in environmental and agricultural peer-reviewed journals on subjects related to CE. The questionnaire had two objectives: (i) identifying the order of priority of the variables to improve CE in the egg production sector, and (ii) analyzing trade-offs between various management options. The DELPHI questionnaire was administered online using LimeSurvey (2019) software. The questionnaire is available as Supplementary Material S2. Sixteen experts were invited (8 from Europe and 8 from North America), seven of whom agreed to participate. This number, based on the literature [59,60], is appropriate.
Using the final ranking of the experts, 11 DVs (out of 14 DVs assessed) were selected as important for the egg production sector. The selection and ranking processes of these final DVs and their respective PI are described in Section 3.1. Validated PIs (corresponding to 11 final DVs) are presented in Table 4 in Section 3.2.

2.2.6. Methodological Phase 5: Transforming Validated Performance Indicators into Intervention Priorities on Egg Farms

Validated performance indicators (PIs) were paired with benchmark values to help guide farm managers to identify areas where management improvements on CE are needed. The transition from decision variables (DVs) and their respective PI into actions was tested on three other egg farms in Quebec and Ontario for representativeness. These two provinces alone contribute 56% of egg production in Canada [17].

3. Results of the Methodological Phases of Validation and Transformation of Indicators

The methodological steps result in three main outputs: (1) identification of a final set of variables (DVs) selected for the egg production sector; (2) the ranking of options for better identification of trade-offs, and (3) the way the validated indicators could be transformed to prioritize actions to improve CE.
The goal of this paper is to present a methodological approach that can be used to design CE indicators in the agricultural sector. On this basis, we do not give full details of results, but rather show selected and important results to illustrate the outcome of our methodology, with the hope that this could be carried over to other agricultural sectors.

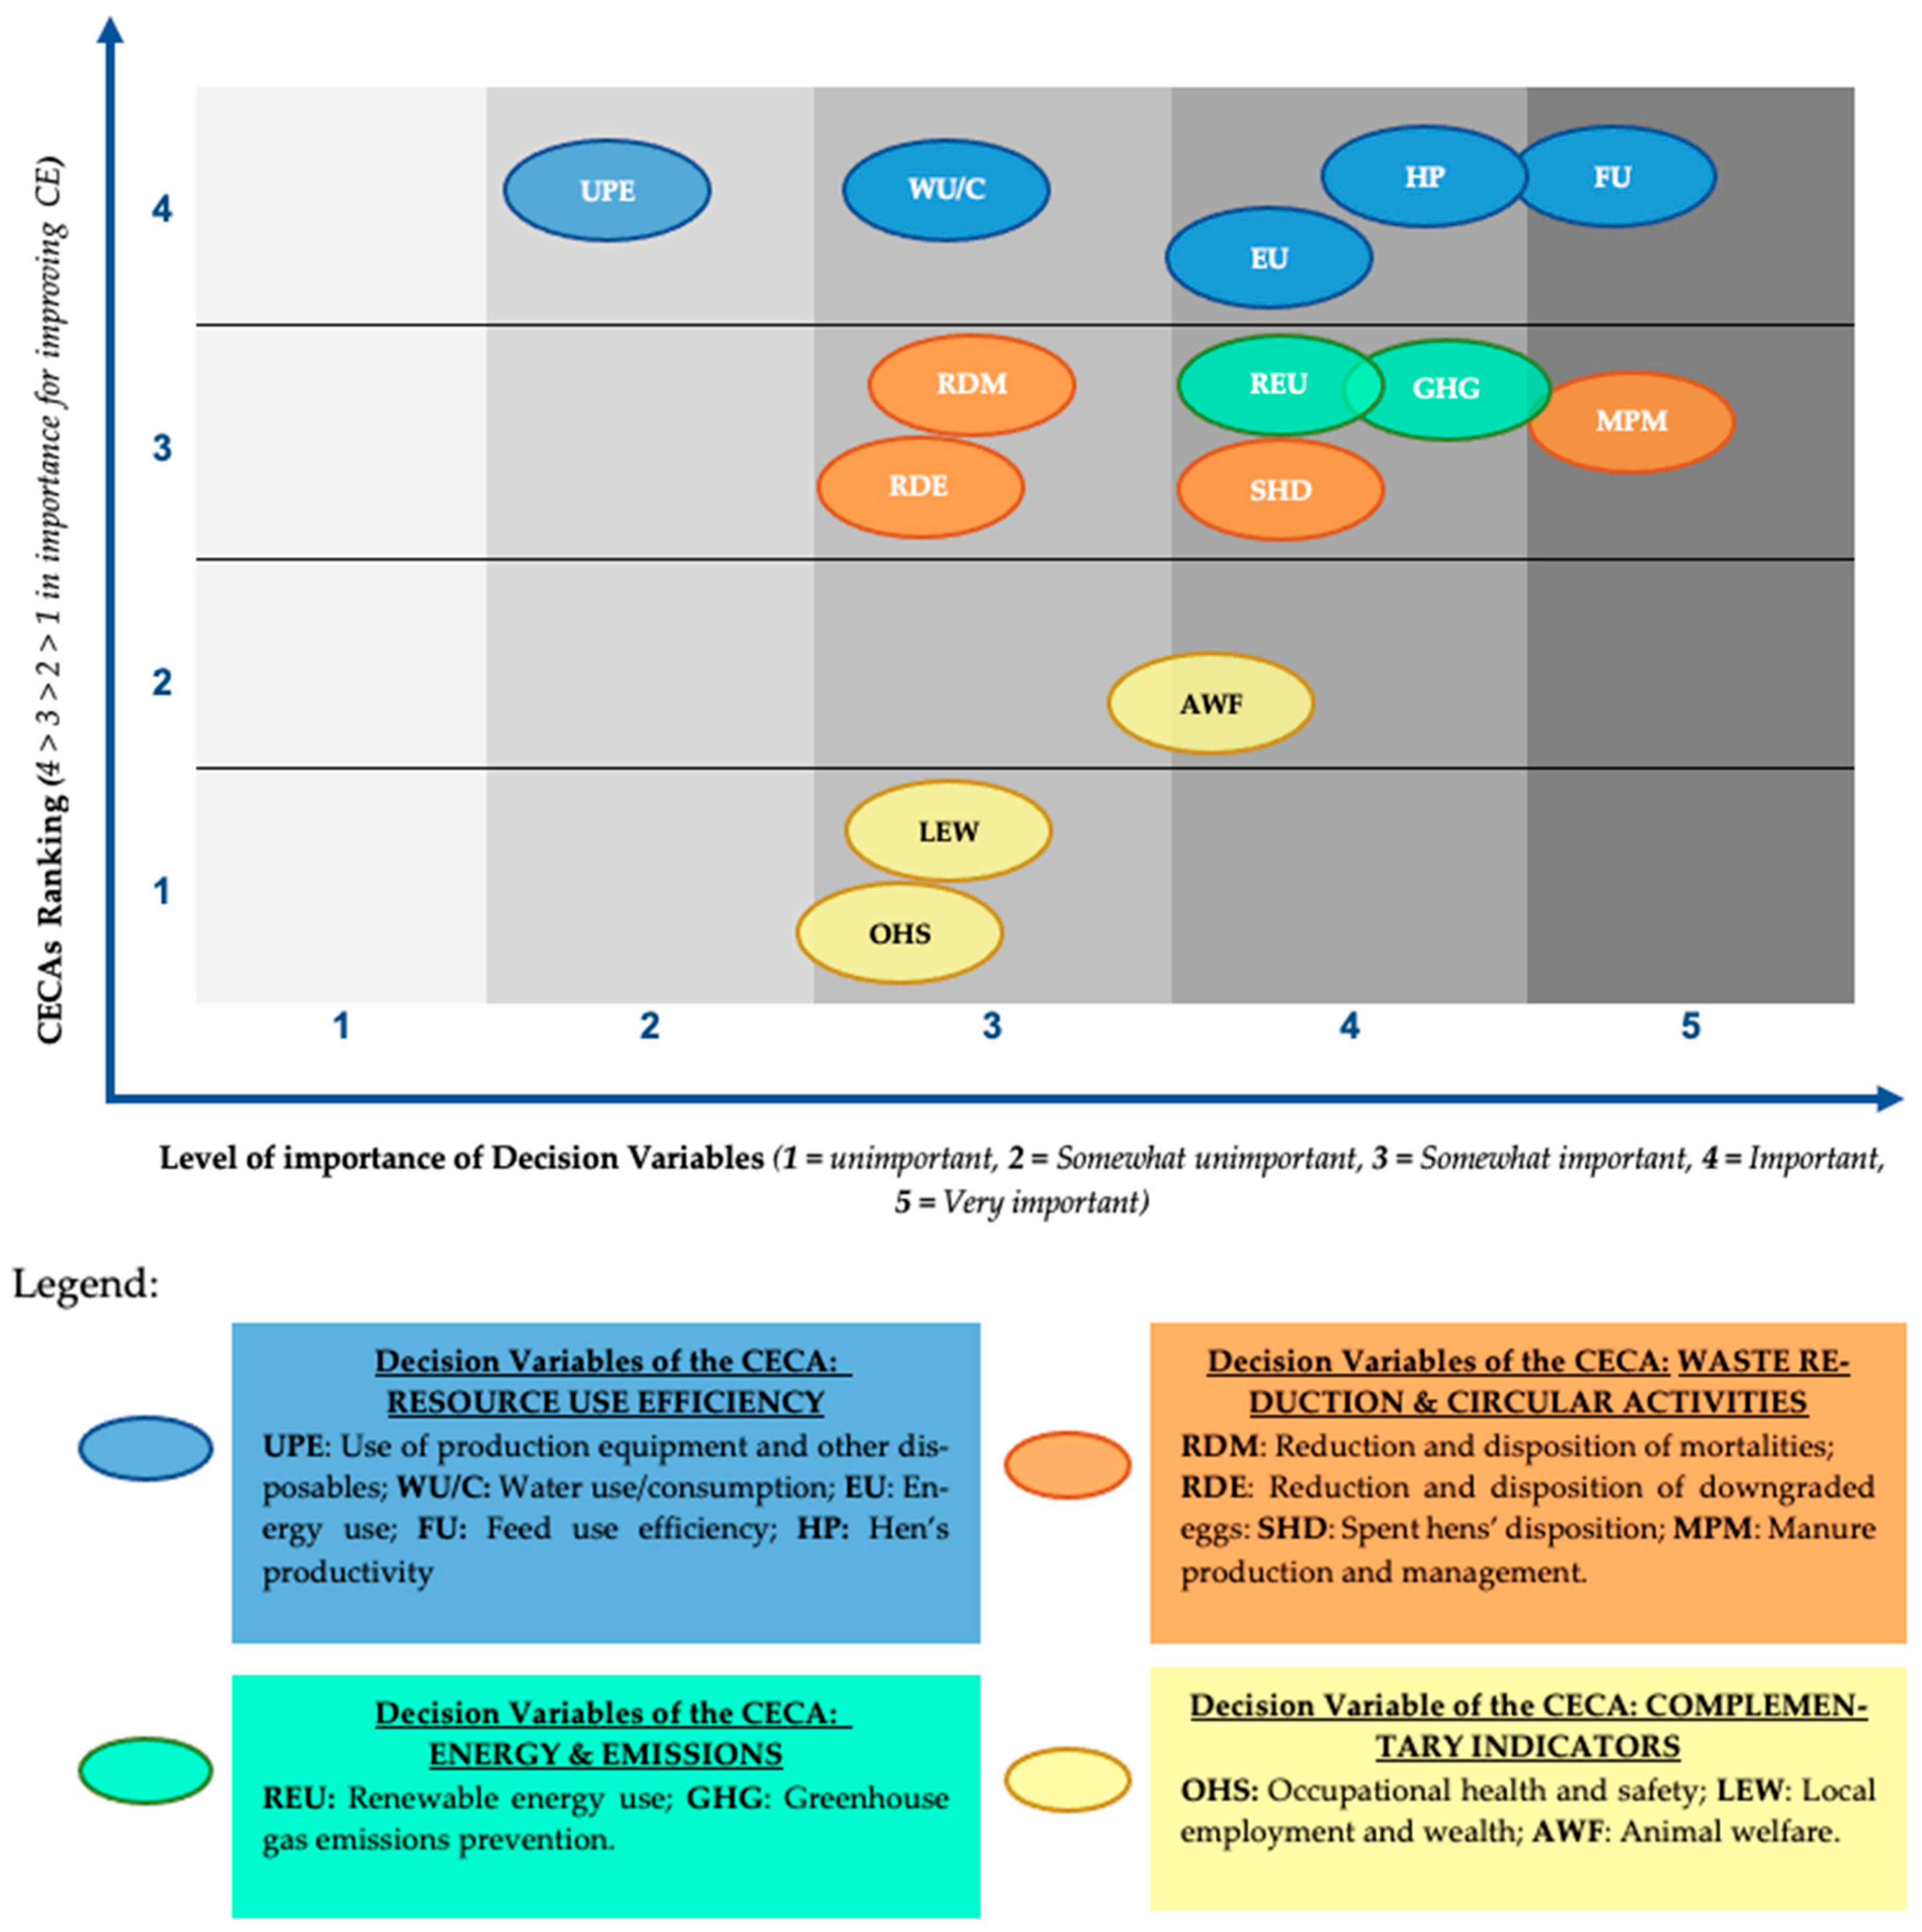
3.1. Results of DV Ranking

The experts participating in the DELPHI survey performed a two-level ranking. They ranked the 14 DVs as well as the 4 CECAs by their degree of importance. Figure 4 illustrates the results of this ranking, with the top-right being the DVs ranked as the most important. Following this ranking, three DVs were dropped, as they were unanimously classified as of lesser importance for the egg production sector. These DVs are: LEW: local employment and wealth, OHS: occupational health and safety and UPE: use of production equipment and other disposables. Therefore, 11 DVs that are associated with 25 PIs of CE in the egg production sector remain important variables to be controlled by the egg farms aiming to improve the economic circularity of their production model (Cf. Table 4).
Figure 4 shows that feed use efficiency (dv1) and manure production and management (dv2) are two variables that have been ranked as most important. Five other variables (hen productivity (dv3), energy use (dv4), use of renewable energy (dv5), GHG emissions prevention (dv6) and, spent hen disposition (dv7)) were ranked as important. Animal welfare (dv8), water use/consumption (dv9), reduction and disposition of mortalities (dv10) and reduction and disposition of downgraded eggs (dv11) were ranked as being less important for circularity in the egg production sector.

3.2. Actions to Monitor Validated CE Performance Indicators

The last phase of our methodology translates the 11 DVs into concrete actions that can guide farm managers towards areas where CE improvements might be most needed. To accomplish this, benchmark values from the literature were used when possible. Some actions, however, are dependent on location and geographic resource availability. In such cases, decision trees were developed. Table 4 presents the fourteen actions towards expected performance and their relationship with the twenty-five validated PIs (of 11 selected DVs). Once again, the objective of presenting this is to showcase the ways in which validated PIs (25) could be associated with actions which can help to monitor on site performance in a “matching plan” which allows a rapid global view, as presented in Table 4.

4. Discussion: Trade-Off Analysis between Options for Specific Variables

To improve circularity on egg farms, several management options can be adopted. These options are often difficult to evaluate. For example, which source of energy is more sustainable from the CE perspective? The DELPHI panel helped to prioritize and validate the sets of PIs (Table 4) for the following DVs (Figure 4): energy use (PI5 and PI6), animal welfare (PI10, PI11 and PI12), manure production and management (PI16 and PI17), spent hen disposition (PI18, PI19, PI20 and PI21), reduction and disposition of mortalities (PI22, PI23 and PI24) and hen productivity (PI25). Table 5 provides the result of options ranking for the sources of energy used on farm, suggesting that wind, hydroelectricity and solar occupy the first three best sources of energy from the CE perspective, and geothermal energy, biogas and biomass rank in the second three. It should be noted that such tables should help guide consideration for energy use. Other farm-specific factors need be considered when determining best source of energy, such as the presence of wind, hours of sunlight, infrastructure needed for geothermal energy, etc.
The same exercise (options ranking) was performed for the above-mentioned remaining DVs for which trade-off analysis between options is deemed necessary. However, for some indicators of DVs, such as manure production and management, spent hen disposition and reduction and disposition of mortalities, the most suitable option can depend on the specific context of the farm, since not all options are suitable for every farm. Decision trees are a means to render a decision based on criteria. Figure 5 offers an illustration of a decision tree for options related to manure production and management.
Two other decision trees were developed to provide guidance on a context-specific assessment for options of the DVs spent hen disposition and reduction and disposition of mortalities. For these options, local conditions such as the presence (or not) in the region (radius of 50 km from the farm) of a slaughterhouse or rendering facility had to be taken into account in order to assess whether the performances achieved by a farm regarding PI18 through PI24 (Table 4) are optimal.
The last point of discussion is related to how the value (financial and non-financial) is maintained throughout the egg production value chain. As an outcome of deploying our analytical framework and the entire methodological approach, this aspect can be measured or monitored using PI25: duration of the production cycle, which contributes to DV1: hen productivity in the CECA resource use efficiency (In the same CECA (Resource Use Efficient); DV4: use of production equipment and other disposables (Cf. Figure 3) would be the other variable that might be used to monitor the aspect of the maintenance of value (financial and non-financial). However, it is important to recall that this DV was not selected by the DELPHI panel as an important variable for CE in egg production. This was revealed to be consistent, since prior to this phase, two indicators of this variable: DV4 ((1) renewal rate of light production equipment (cages, feeder and waterers, scraping pads, etc.) and (2) intensity use (in terms of cost) of production material and other disposables) (Cf. PI8 and PI11 in Table 3) were even rejected by the focus group during the second methodological phase of General Validation. In fact, the farmers’ representatives pointed out that all of the equipment, such as cages and other associated materials and accessories, are designed to last up to 25 years, which makes them less of a concern with regard to the economic circularity of poultry farms). Besides that, it seems rather obvious that the indicators which assess the options for disposition of spent hens especially through human consumption (PI18) and rendering (PI19) also contribute, to a certain extent, to the measurement of the maintenance of the value of resources (animal stock in our application).
Extending the laying cycle beyond 51 weeks (i.e., beyond 70 weeks of a hen’s age) is an option that is of great interest for CE. Thus, the PI25: duration of the production cycle makes it possible to measure to what extent a given farm maintains the value of the animal resource. To make the assessment of this indicator context-specific (since we cannot already be sure that all farms are exploiting strains of pullets with the same genetic potential and/or that they use the same feed formulations), decision trees were also proposed to take into account determining factors, such as the laying rate and the feed conversion rate both reached at the 51st week (70 weeks of hen age), as well as the variability of egg physical quality.
Our analytical framework, unlike others, allows a holistic assessment of CE in its aspects and components. Indeed, it allows us to deploy and articulate a structured methodology for the development and validation of PIs that cover important DVs and all the recommended CECAs for specialized farms (unit of production level). This approach, tested on egg farms, led to the development of PIs and actions to monitor and improve the CE performance in the sector. Moreover, the analytical framework developed better captures and covers aspects such as the maintenance of financial and non-financial value than do current analytical frameworks. The development of decision trees improves the practicality of using PIs or actions by being context specific.

5. Conclusions

This paper presents a structured methodological approach and a framework for designing CE indicators at the micro (unit of production) level in agriculture. The approach we propose is based on several methods established in the literature, with indicators being validated by stakeholders and experts in environmental science.
The proposed methodology consists of three major steps. The first step is to use the analytical framework that we developed in conjunction with the ECOGRAI method to generate a first set of coherent performance indicators (PI). The second step is to validate the PI through consultations with stakeholders, testing on farms and consultation of experts using the DELPHI method. This two-track consultation is crucial to the process, as it allows a validation of the pragmatism of the PI as well as expert guidance to set priorities. The third and final step is to use these indicators to help find paths to improve EC, either with comparison against a benchmark or with the analysis using a decision tree to identify areas where interventions would be needed. Not all of these PI will be evaluated to the same standard for all farms: a trade-off analysis will be necessary to help determine farm-specific best practices by taking into consideration the specific constraints of specific farms.
Our study provides a novel application for the development of systemic PIs for CE at the farm level in agriculture. The methodological approach presented here could be replicated in other agricultural production sectors. This study has provided a method to both identify system-based indicators and a validation process to assure these indicators match industry needs. Identifying EC performance indicators by combining both of these aspects and the proposed framework with the Delphi has shown promise in reaching this goal.
The PIs developed provide a full view of CE at the farm level. A limitation of the current study is that it identifies areas where CE could be improved but falls short of providing specific guidance on interventions to do so. Further research would be needed to find the best farm management practices to reach these goals. For example, while feed conversion ratios are addressed here, guidance on feed formulations to improve conversion and reduce loss would need to be determined according to specific farm situations, bird species and feed availability and affordability. Hence, reaching the specific benchmarks should be an industry effort between agronomists, farm managers, feed formulators and veterinarians.
Implementing an information system would ease the gathering of information and would provide a platform to quickly assess indicators against up-to-date benchmarks to identify areas where improvements should be focused. The current suite of CE performance indicators can be used on farm to capitalize on future opportunities or amend planned investments, from the perspective of better economic circularity.

Supplementary Materials

The following are available online at https://0-www-mdpi-com.brum.beds.ac.uk/article/10.3390/su13158656/s1. S1-a: Coherence analysis (Panel) for the category of circular economy assessment (CECA) waste reduction and circular activities; S1-b: Coherence analysis (panel) for the CECAs energy and greenhouse gas emissions prevention and complementary indicators (social aspects and biodiversity); S2: DELPHI questionnaire.

Author Contributions

Conceptualization, R.R., I.B. and M.D.; Data curation, R.R.; Formal analysis, R.R.; Funding acquisition, R.R., S.B., I.B. and M.D.; Investigation, R.R., S.B., I.B. and M.D.; Methodology, R.R., I.B. and M.D.; Project administration, M.D.; Resources, M.D.; Software, R.R.; Supervision, S.B., I.B. and M.D.; Validation, R.R., S.B., I.B., M.D. and N.P.; Visualization, R.R. and S.B.; Writing—original draft, R.R.; Writing—review and editing, R.R., S.B., I.B., M.D. and N.P. All authors have read and agreed to the published version of the manuscript.

Funding

This project was funded by the Egg Farmer of Canada Research Grant Program and by the Economic research chair for the egg industry in Canada.

Institutional Review Board Statement

Ethical review and approval were waived for this study since no personal data was gathered from participants and because their participation was regarded as a professional contribution in their respective field.

Informed Consent Statement

Participation in validation discussion with farm managers always started with consent statement to make sure participants agreed to have results published, while informing them that their answers remain anonymous. Participants in the DELPHI survey were told that by answering the survey they implicitly consented to have their views shared and potentially published while remaining anonymous.

Data Availability Statement

The data used for this study is available upon request by contacting the corresponding author.

Acknowledgments

The authors address a special thanks to the international experts who participated in our DELPHI survey and the farmers and farm managers that have participated in the study.

Conflicts of Interest

The authors declare no conflict of interest. The funders had no role in the design of the study; in the collection, analyses, or interpretation of data; in the writing of the manuscript, or in the decision to publish the results.

References

  1. Aurez, V.; Georgeault, L.; Stahel, W.; Bourg, D. Économie Circulaire: Système Économique et Finitude des Ressources; De Boeck Supérieur: Louvain-La-Neuve, Belgium, 2016; 371p. [Google Scholar]
  2. Le Moigne, R. L’économie Circulaire: Comment la Mettre en Œuvre dans L’entreprise Grâce à la Reverse Supply Chain? Dunod: Paris, France, 2014; p. viii. 215p. [Google Scholar]
  3. Ross-Carré, H. L’économie Circulaire; Afnor Éditions: La Plaine Saint-Denis, France, 2016; 138p. [Google Scholar]
  4. EMF; GRANTA; LIFE. Circularity Indicator. An Approach to Measuring Circularity. Methodology, London, UK. Available online: https://www.ellenmacarthurfoundation.org/assets/downloads/insight/Circularity-Indicators_Methodology_May2015.pdf (accessed on 18 January 2020).
  5. Sauvé, S.; Normandin, D.; McDonald, M. L’économie Circulaire: Une Transition Incontournable; Les Presses de l’Université de Montréal: Montréal, QC, Canada, 2016; 189p. [Google Scholar]
  6. Justyna, G.-B. The role of agriculture in the circular economy. Przegląd Prawa Rolnego 2016, 1, 81–95. [Google Scholar]
  7. Ducq, Y.; Gentil, M.; Merle, C.; Doumeingts, G. Conception et implantation de systèmes d’indicateurs de performance, in: Tahon, Christian (2003), Edition Hermès, Evaluation des performances des systèmes de production. Chapitre 2003, 7, 143–175. [Google Scholar]
  8. Kirchherr, J.; Reike, D.; Hekkert, M. Conceptualizing the circular economy: An analysis of 114 definitions. Resour. Conserv. Recycl. 2017, 127, 221–232. [Google Scholar] [CrossRef]
  9. Pauliuk, S. Critical appraisal of the circular economy standard BS 8001:2017 and a dashboard of quantitative system indicators for its implementation in organizations. Resour. Conserv. Recycl. 2018, 129, 81–92. [Google Scholar] [CrossRef]
  10. Brundtland, G.H. Brundtland report. Our common future. Comissão Mund. 1987, 4, 17–25. [Google Scholar]
  11. Diesendorf, M. Sustainability and sustainable development. Sustain. Corp. Chall. 21st Century 2000, 2, 19–37. [Google Scholar]
  12. Geng, Y.; Doberstein, B. Developing the circular economy in China: Challenges and opportunities for achieving ‘leapfrog development’. Int. J. Sustain. Dev. World Ecol. 2010, 15, 231–239. [Google Scholar] [CrossRef] [Green Version]
  13. Ghisellini, P.; Cialani, C.; Ulgiati, S. A review on circular economy: The expected transition to a balanced interplay of environmental and economic systems. J. Clean. Prod. 2016, 114, 11–32. [Google Scholar] [CrossRef]
  14. Sauvé, S.; Bernard, S.; Sloan, P. Environmental sciences, sustainable development and circular economy: Alternative concepts for trans-disciplinary research. Environ. Dev. 2016, 17, 48–56. [Google Scholar] [CrossRef] [Green Version]
  15. Environment European Commission. Closing the Loop—An EU Action Plan for the Circular Economy; European Commission: Brussels, Belgium, 2015; Volume 614, 21p, Available online: https://eur-lex.europa.eu/resource.html?uri=cellar:8a8ef5e8-99a0-11e5-b3b7-01aa75ed71a1.0012.02/DOC_1&format=PDF (accessed on 22 October 2019).
  16. Geissdoerfer, M.; Savaget, P.; Bocken, N.M.; Hultink, E.J. The Circular Economy–A new sustainability paradigm? J. Clean. Prod. 2017, 143, 757–768. [Google Scholar] [CrossRef] [Green Version]
  17. AAFC. Canada’s Table and Processed Egg Industry at a Glance; Agriculture and Agri-Food Canada: Ottawa, ON, Canada, 2019. Available online: https://agriculture.canada.ca/en/canadas-agriculture-sectors/animal-industry/poultry-and-egg-market-information/table-and-processed-eggs (accessed on 11 March 2020).
  18. Parchomenko, A.; Nelen, D.; Gillabel, J.; Rechberger, H. Measuring the circular economy—A Multiple Correspondence Analysis of 63 metrics. J. Clean. Prod. 2019, 210, 200–216. [Google Scholar] [CrossRef]
  19. Saidani, M.; Yannou, B.; Leroy, Y.; Cluzel, F.; Kendall, A. A taxonomy of circular economy indicators. J. Clean. Prod. 2019, 207, 542–559. [Google Scholar] [CrossRef] [Green Version]
  20. Environment European Commission. Resource Efficiency Scoreboard. 2015. Available online: https://ec.europa.eu/environment/resource_efficiency/targets_indicators/scoreboard/pdf/EU%20Resource%20Efficiency%20Scoreboard%202015.pdf (accessed on 23 September 2020).
  21. Smol, M.; Kulczycka, J.; Avdiushchenko, A. Circular economy indicators in relation to eco-innovation in European regions. Clean Technol. Environ. Policy 2017, 19, 669–678. [Google Scholar] [CrossRef] [Green Version]
  22. Bocken, N.M.P.; de Pauw, I.; Bakker, C.; van der Grinten, B. Product design and business model strategies for a circular economy. J. Ind. Prod. Eng. 2016, 33, 308–320. [Google Scholar] [CrossRef] [Green Version]
  23. Cayzer, S.; Griffiths, P.; Beghetto, V. Design of indicators for measuring product performance in the circular economy. Int. J. Sustain. Eng. 2017, 10, 289–298. [Google Scholar] [CrossRef] [Green Version]
  24. Elia, V.; Gnoni, M.G.; Tornese, F. Measuring circular economy strategies through index methods: A critical analysis. J. Clean. Prod. 2017, 142, 2741–2751. [Google Scholar] [CrossRef]
  25. Borrello, M.; Lombardi, A.; Pascucci, S.; Cembalo, L. The seven challenges for transitioning into a bio-based circular economy in the agri-food sector. Recent Pat. Food Nutr. Agric. 2016, 8, 39–47. [Google Scholar] [CrossRef]
  26. Repar, N.; Jan, P.; Dux, D.; Nemecek, T.; Doluschitz, R. Implementing farm-level environmental sustainability in environmental performance indicators: A combined global-local approach. J. Clean. Prod. 2017, 140, 692–704. [Google Scholar] [CrossRef] [Green Version]
  27. Bonisoli, L.; Galdeano-Gómez, E.; Piedra-Munoz, L. Deconstructing criteria and assessment tools to build agri-sustainability indicators and support farmers’ decision-making process. J. Clean. Prod. 2018, 182, 1080–1094. [Google Scholar] [CrossRef]
  28. De Olde, E.M.; Oudshoorn, F.W.; Sørensen, C.A.; Bokkers, E.A.; De Boer, I.J. Assessing sustainability at farm-level: Lessons learned from a comparison of tools in practice. Ecol. Indic. 2016, 66, 391–404. [Google Scholar] [CrossRef]
  29. Tamini, L.D.; Doyon, M.; Zan, M.M. Investment behavior of Canada egg producers: Analyzing the impacts of change in risk aversion and in the variability of eggs prices and production costs. Br. Food J. 2016, 120, 96–107. [Google Scholar] [CrossRef]
  30. Pelletier, N.; Doyon, M.; Muirhead, B.; Widowski, T.; Nurse-Gupta, J.; Hunniford, M. Sustainability in the Canadian Egg Industry- Learning from the PAst, Navigating the Present, Planning for the Future. Sustainability 2018, 10, 3524. [Google Scholar] [CrossRef] [Green Version]
  31. Figge, F.; Thorpe, A.S.; Givry, P.; Canning, L.; Franklin-Johnson, E. Longevity and Circularity as Indicators of Eco-Efficient Resource Use in the Circular Economy. Ecol. Econ. 2018, 150, 297–306. [Google Scholar] [CrossRef]
  32. Singh, R.K.; Murty, H.R.; Gupta, S.K.; Dikshit, A.K. An overview of sustainability assessment methodologies. Ecol. Indic. 2012, 15, 281–299. [Google Scholar] [CrossRef]
  33. BSI. BS 8001:2017. Framework for Implementing the Principles of the Circular Economy in Organizations—Guide; The British Standards Institution: London, UK, 2017. [Google Scholar]
  34. Wisse, E. Assessment of Indicators for Circular Economy: The Case for the Metropole Region of Amsterdam. Master’s Thesis, Utrecht University, Utrecht, The Netherlands, 2016. [Google Scholar]
  35. Åkerman, E. Development of Circular Economy Core Indicators for Natural Resources: Analysis of Existing Sustainability Indicators as a Baseline for Developing Circular Economy Indicators. Master’s Thesis, Royal Institute of Technologie, Stockholm, Sweden, 2016. [Google Scholar]
  36. Bertocchi, M.; Demartini, E.; Marescotti, M.E. Ranking farms using quantitative indicators of sustainability: The 4Agro method. Procedia-Soc. Behav. Sci. 2016, 223, 726–732. [Google Scholar] [CrossRef] [Green Version]
  37. Briquel, V.; Vilain, L.; Bourdais, J.-L.; Girardin, P.; Mouchet, C.; Viaux, P. La Méthode IDEA (Indicateurs de Durabilité des Exploitations Agricoles): Une Démarche Pédagogique. Ingénieries Eau-Agriculture-Territoires 2001. pp. 29–39. Available online: https://bibliotheques.wallonie.be/index.php?lvl=bulletin_display&id=22899 (accessed on 7 December 2019).
  38. Vilain, L. La Méthode IDEA: Indicateurs de Durabilité des Exploitations Agricoles; Educagri Éditions: Dijon, France, 2008. [Google Scholar]
  39. Vilain, L.; Boisset, K.; Girardin, P.P.; Guillaumin, A.; Mouchet, C.; Viaux, P.; Zahm, F. La Méthode IDEA: Indicateurs de Durabilité des Exploitations Agricoles: Guide D’utilisation; Educagri Editions: Dijon, France, 2008; p. 162. [Google Scholar]
  40. Doumeingts, G.; Clave, F.; Ducq, Y. ECOGRAI—A method to design and to implement Performance Measurement Systems for industrial organizations—Concepts and application to the Maintenance function. In Benchmarking—Theory and Practice; Springer: Boston, MA, USA, 1995; pp. 350–368. Available online: https://0-link-springer-com.brum.beds.ac.uk/chapter/10.1007/978-0-387-34847-6_39 (accessed on 7 December 2019).
  41. Ducq, Y.; Vallespir, B. Definition and aggregation of a performance measurement system in three aeronautical workshops using the ECOGRAI method. Prod. Plan. Control. 2005, 16, 163–177. [Google Scholar] [CrossRef]
  42. Lobna, K.; Mounir, B.; Hichem, K. Using the ECOGRAI method for performance evaluation in maintenance process. In Proceedings of the 2013 International Conference on Advanced Logistics and Transport, Sousse, Tunisia, 29–31 May 2013; pp. 382–387. [Google Scholar]
  43. Bonvoisin, F. Evaluation de la Performance des Blocs Opératoires: Du Modèle aux Indicateurs. Ph.D. Thesis, Université de Valenciennes et du Hainaut-Cambresis, Lille, France, 2011. [Google Scholar]
  44. Bitton, M. ECOGRAI: Méthode de Conception et D’implantation de Systèmes de Mesure de Performances Pour Organisations Industrielles. Ph.D. Thesis, University of Bordeaux, Bordeaux, France, 1990. [Google Scholar]
  45. FAO. Sustainablity Assessment of Food and Agriculture Systems (SAFA); Guidelines Version 3.0; Food and Agriculture Organization: Roma, Italy, 2013; Available online: http://www.fao.org/3/i3957e/i3957e.pdf (accessed on 7 May 2020).
  46. Pelletier, N. Life cycle assessment of Canadian egg products, with differentiation by hen housing system type. J. Clean. Prod. 2017, 152, 167–180. [Google Scholar] [CrossRef]
  47. Veleva, V.; Ellenbecker, M. Indicators of sustainable production: Framework and methodology. J. Clean. Prod. 2001, 9, 519–549. [Google Scholar] [CrossRef]
  48. Sehnem, S.; Pandolfi, A.; Gomes, C. Is sustainability a driver of the circular economy? Soc. Responsib. J. 2019, 16, 329. [Google Scholar] [CrossRef]
  49. Costantini, M.; Lovarelli, D.; Orsi, L.; Ganzaroli, A.; Ferrante, V.; Febo, P.; Guarino, M.; Bacenetti, J. Investigating on the environmental sustainability of animal products: The case of organic eggs. J. Clean. Prod. 2020, 274, 123046. [Google Scholar] [CrossRef]
  50. OECD. Measuring and Managing Results in Development Cooperation: A Review of Challenges and Practices among DAC Members and Observers; Organisation for Economic Co-operation and Development: Paris, France, 2014; Available online: https://www.oecd.org/dac/peer-reviews/Measuring-and-managing-results.pdf (accessed on 12 February 2020).
  51. Arnsperger, C.; Bourg, D. Vers une économie authentiquement circulaire. Réflexions sur les fondements d’un indicateur de circularité. Rev. L’ofce 2016, 145, 91–125. [Google Scholar] [CrossRef]
  52. Verbeek, L.H. A Circular Economy Index for the Consumer Goods Sector. Master’s Thesis, Utrecht University, Utrecht, The Netherlands, 2016; p. 78. [Google Scholar]
  53. Ruiter, C. The Circular Economy Performance Index. Master’s Thesis, VU University, Amsterdam, The Netherlands, 2015. [Google Scholar]
  54. Estrada-González, I.E.; Taboada-González, P.A.; Guerrero-García-Rojas, H.; Márquez-Benavides, L. Decreasing the Environmental Impact in an Egg-Producing Farm through the Application of LCA and Lean Tools. Appl. Sci. 2020, 10, 1352. [Google Scholar] [CrossRef] [Green Version]
  55. Adler, M.; Ziglio, E. Gazing into the Oracle: The Delphi Method and Its Application to Social Policy and Public Health; Jessica Kingsley Publishers: London, UK, 1996. [Google Scholar]
  56. Mayer, R.; Ouellet, F. Méthodologie de Recherche Pour les Intervenants Sociaux; G. Morin: Boucherville, QC, Canada, 1991. [Google Scholar]
  57. Okoli, C.; Pawlowski, S.D. The Delphi method as a research tool: An example, design considerations and applications. Inf. Manag. 2004, 42, 15–29. [Google Scholar] [CrossRef] [Green Version]
  58. Wissema, J.G. Trends in technology forecasting. R D Manag. 1982, 12, 27–36. [Google Scholar] [CrossRef]
  59. Caffey, R.H.; Kazmierczak, R.F., Jr.; Avault, J.W. Developing consensus indicators of sustainability for Southeastern United States aquaculture. Louisiana Agricultural Experiment Station, LSU Agricultural Center (879). 2001. Available online: https://digitalcommons.lsu.edu/agexp/650 (accessed on 18 January 2019).
  60. Schmidt, R.; Lyytinen, K.; Keil, M.; Cule, P. Identifying software project risks: An international Delphi study. J. Manag. Inf. Syst. 2001, 17, 5–36. [Google Scholar] [CrossRef]
Figure 1. Analytical framework for CE indicators design at the unit of production level. BSI: British Standards Institution; CE: circular economy; CECA: categories of economic circularity assessment; EMF: Ellen MacArthur Foundation; GHG: greenhouse gas.
Sustainability 13 08656 g001
Figure 2. Six steps of the ECOGRAI method of indicators design and its performance controllability principle (originality). Source: Elaborated from [7,40].
Sustainability 13 08656 g002
Figure 3. General architecture of CE indicators for egg production (14 decision variables with their respective PI). Legend: Sustainability 13 08656 i001: categories of economic circularity assessment (CECA); Sustainability 13 08656 i002
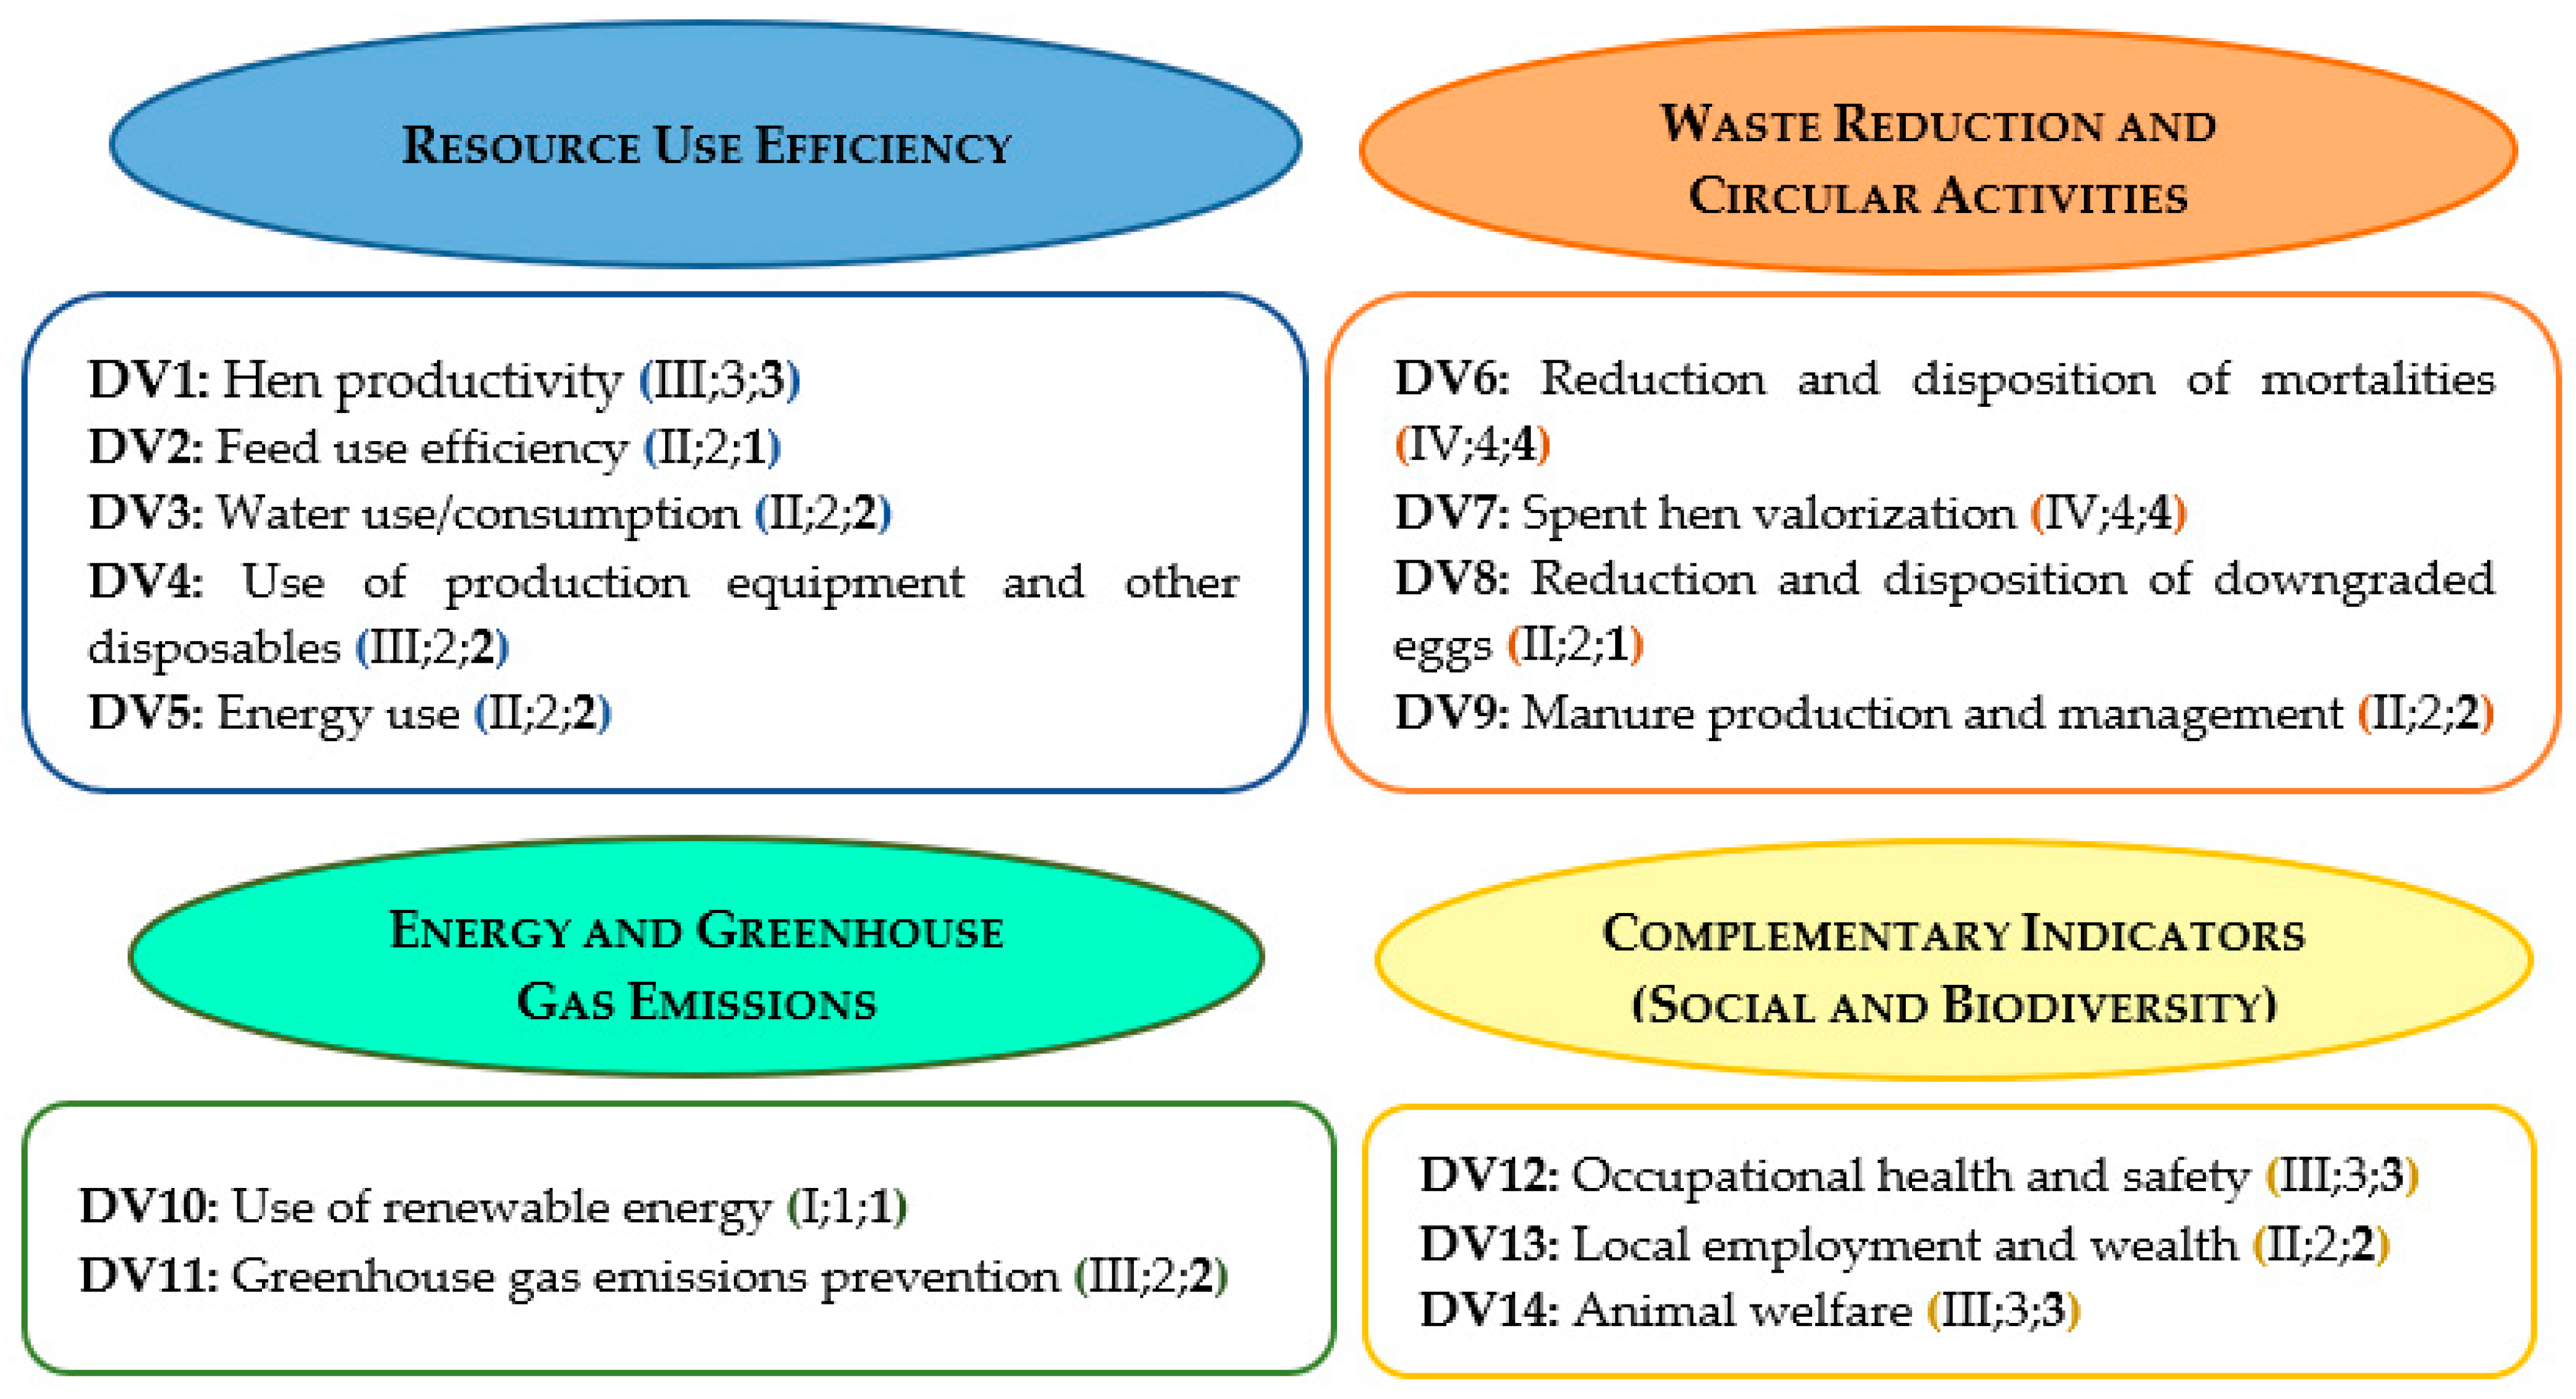
: set of decision variables (DVs) for each CECA; ( ): number of indicators for each decision variable (DV) after successive methodological phases: (1) 36 PIs after the (indicators) development phase (in roman numerals); (2) 33 PIs after the general validation (first set of non roman numerals); (3) 32 PIs after the practical validation (second and last set of non-roman numerals).
Sustainability 13 08656 g003
Figure 4. Matrix of decision variable (DV) ranking. Source: DELPHI Survey (2019).
Sustainability 13 08656 g004
Figure 5. Trade-offs between options for manure use. Source: DELPHI Survey (2019).
Sustainability 13 08656 g005
Table 1. Summary of the phases of the methodological approach.
Objective (s)Methods and ToolsStep (Expected) Results
Indicator DevelopmentDevelopment of CE performance indicators (PI) at the farm level using the relevant analytical framework and design method - Selected analytical framework, BSI and EMF
- ECOGRAI design method
A dashboard of identified (first) performance indicators (PI)
General ValidationCheck the specificity of the identified (first) PI for the production sector under study- Focus Group with representatives of farmers and other key stakeholders
- Interview guide
PIs are made specific
Practical ValidationEnsure that PIs are practical enough, and that the data are accessible by farm managers- Reality tests on farms (with farm managers)
- Interviews using semi-structured questionnaires
PIs are practical
Expert
Validation
Consultation with experts on prioritization of PIs and trade-off analysis between specific options- DELPHI consultation method
- DELPHI Questionnaires
- Validated PIs
- Prioritization of validated PIs
Transformation of indicators into actions- Transform validated PIs into Actions to monitor performance against benchmarks
- Guide the identification of areas that need improvement.
- Final tests on farms to collect indicators performance thresholds
- Interview with farm managers using semi-structured questionnaire
- PIs to monitor the CE performance of egg farms with benchmarks to help guide management improvements
CE: circular economy; EC: economic circularity; PI: performance indicators.
Table 2. Circularity objectives (CO) by category of economic circularity assessment (CECA).
CECAResource Use EfficiencyWaste Reduction and Circular Activities
Circularity
OBJECTIVES
1Minimize use of material inputs4Maximize rates of material reuse, recycling and recovery
2Minimize global energy consumption5Prevent waste production
3Reduce water consumption and use6Eliminate and dispose of waste in such a way that does not endanger human health and ecosystems
7Minimize food waste and feed loss
CECAEnergy and Greenhouse Gas EmissionsComplementary Indicators
(Social Aspects and Biodiversity)
Circularity
OBJECTIVES
8Maximize the use of renewable (sustainable) energy12Ensure a decent work environment (sanitary facilities, safe and ergonomic work environment, etc.)
9Reduce greenhouse gas (GHG) emissions13Support local economy through employment and added value creation
10Prevent emissions of pollutants and air contaminants14Protect animals from hunger, thirst, injury and disease
11Eliminate ozone-depleting substances15Keep animals in conditions adapted to their species and without discomfort, pain, fear and distress
Note: The CECA of waste production and reduction and the CECA of circular activities were grouped in one category (CECA of waste reduction and Circular Activities in Table 2), because they both aim to achieve the same circularity objectives (CO4 to CO7 in Table 2). For the category (CECA) of complementary indicators, out of 7 aspects deemed relevant and important for the agricultural sector (Cf. Section 2.1), only two aspects were considered for the studied domain (egg production). They are: social (occupational health and safety, supplier assessment for impacts on society) and biodiversity (animal welfare) aspects. The above-mentioned choices made by the research team (i.e., a grouped CECA of waste reduction and circular activities and the two aspects of complementary indicators for the egg sector) were later validated through discussions with experts in CE as well as with farm managers. Source: Elaborated from [4,9,33,45].
Table 3. Coherence analysis (panel).
Ceca: Resource Use Efficiency
Performance Indicators Developed for the CECAUnit of Measurement
PI 1Laying ratePercentage (%)
PI 2Duration of the production cycleWeeks
PI 3Variability of the duration of the downtime periodPercentage (%)
PI 4Feed conversion ratioKilogram of feed/kilogram produced egg
PI 5Quantity of fresh water usedLiters/tonne egg produced
PI 6Share of feed that is wasted in farm’s operations. Of this percentage, what part is recovered or reused?Percentage (%)
PI 7Strategy for responsible wastewater managementIndicator of Good Practices (IgP)
PI 8Intensity use (in terms of cost) of material and other disposables$/dozen eggs produced
PI 9Share of packaging material used that are made of biodegradable matterPercentage (%)
PI 10Total (quantity of) energy usedKilowatt-hour (kWh)/dozen eggs produced
PI 11Renewal rate of light production equipment (cages, feeder and waterers, scraping pads, etc.)Percentage (%)
PI 12Strategies to reduce energy consumptionIndicator of Good Practices (IgP)
Coherence Panel 1
CE
Objectives
CO 1Minimize use of material and energy inputs********************
CO 2Minimize global energy consumption ** ** **
CO 3Reduce water consumption and use ** ** **
Performance IndicatorsPI 1PI 2PI 3PI 4PI 5PI 6PI 7PI 8PI 9PI 10PI 11PI 12
Decision VariablesDV 1Hen productivity ******** **
DV 2Feed utilization **** **
DV 3Water use/consumption ** ** **
DV 4Use of production equipment and other disposables ** **** **
DV 5Energy use ** ** **
DV 6Reduction and disposition of mortalities
DV 7Spent hen valorization
DV 8Reduction and disposition of downgraded eggs
DV 9Manure production and management
DV 10Use of renewable energy * *
DV 11Greenhouse gas emissions ****
DV 12Occupational health and safety
DV 13Local employment and wealth
DV 14Animal welfare
1 The links between the performance indicators (PI), decision variables (DV) and circularity objectives (CO) are marked with (**): strong link, (*): weak link and (blank): no link.
Table 4. Actions (14) to monitor the CE on egg farms and their associated validated performance indicator (25) (relies on benchmark: B, or on decision tree: DT).
#Actions Towards Expected Performance#Associated IndicatorsRelies on
1Aim to keeping the feed conversion rate lower or equal to 1.71 (2.08) in cage (alternative) systems1Feed conversion rate (kg of feed/kg produced egg)B
2Maximize hen productivity: targeted laying rate > 92.2% (89.5%) in cage (alternative) systems2Laying rate (average for the entire production cycle and for the 51st week of the laying cycle)B
3Variability (in days) of down time between production cyclesB
3Reduce the amount of energy used to under 218.4 (367.4) kWh/tonne of egg produced in cage (alternative) housing systems 4Total direct energy used (kWh/dozen eggs produced)B
4Minimize overall energy consumption by adopting net zero-energy buildings and LED lighting5Strategies to reduce energy consumptionB
5Prioritize the use of renewable energy sources that are efficient from the CE perspective6Share (in %) of the total energy used which is from renewable sources B
6Prevent GHG emissions by reducing the distance traveled for input supply and for product delivery7Total annual distance (in km) done for inputs supply B
8Total annual distance (in km) done for products and by-products deliveryB
7Keep hens’ viability at a higher rate than 97.79% (97.36%) in the cage (alternative) systems 9Hens’ viability rate (100—mortality rate)B
8Ensure animals kept on farm live without disease, pain or stress and in conditions that suit their species10Percentage (%) of animals living with a good health status without curative treatments (annual basis)B
11Percentage (%) of animals kept with possibility to exhibit their natural behaviors throughout their life cycle (annual basis)B
12Percentage (%) of animals living without pain, discomfort, or stress throughout their life, including during transport and slaughter processes (annual basis)B
9Reduce and maintain overall water consumption below 2.4 (2.73) L/tonne egg produced in cage (alternative) systems 13Total (quantity) water used (L/tonne egg produced)B
10Aim to preserving water resources by adopting good management practices14Strategies for responsible water managementB
11Favor the recovery of all unsold eggs (downgraded on farm: approximately 0.9% (0.42%) in cage (alternative) systems)15Share (in %) of unsold eggs that are recovered on farm B
12Aim for the best options for manure valorization according to the specific context of the farm16Share of manure used for soil fertilization DT
17Manure management strategies (anaerobic digestion to produce biogas, drying, cubing and packaging to sell as fertilizer and composting)
13Favor the recovery of spent hens and mortalities through the best options available depending on the context of the farm18Share of spent hens valorized through human consumption (in %)DT
19Share of spent hens valorized through rendering (in %)
20Share of spent hens disposed through composting (in %)
21Share of spent hens disposed through incineration and/or landfilling (in %)
22Share of mortalities valorized through rendering (in %)
23Share of mortalities disposed through composting (in %)
24Share of mortalities disposed through incineration and/or landfilling (in %)
14Maximize hen’s production by exploiting the animal stock as long as possible25Total duration of the production cycleDT
Legend: B: benchmark; CE: circular economy; DT: decision tree; GHG: greenhouse gas; %: percentage; LED: light emitting diode.
Table 5. Ranking of sources of energy used on (egg) farms, from a CE perspective.
Rank Attributed
1 = Best Option or Source, 10 = Worst Option or Source
Source of EnergyRank
Wind1
Hydroelectricity2
Solar2
Geothermal energy3
Biogas4
Biomass4
Natural gas6
Propane7
Other electricity8
Coal-based electricity9
Source: DELPHI Survey (2019).
Publisher’s Note: MDPI stays neutral with regard to jurisdictional claims in published maps and institutional affiliations.

