
Meta-Analysis and Forest Plots for Sustainability of Heavy Load Carrier Equipment Used in the Industrial Mining Environment

 ,
,  and
and 
Abstract
:1. Introduction
1.1. Related Works
1.2. Methods for Meta-Analysis
1.3. Related Mathematical Formulae and Their Significances
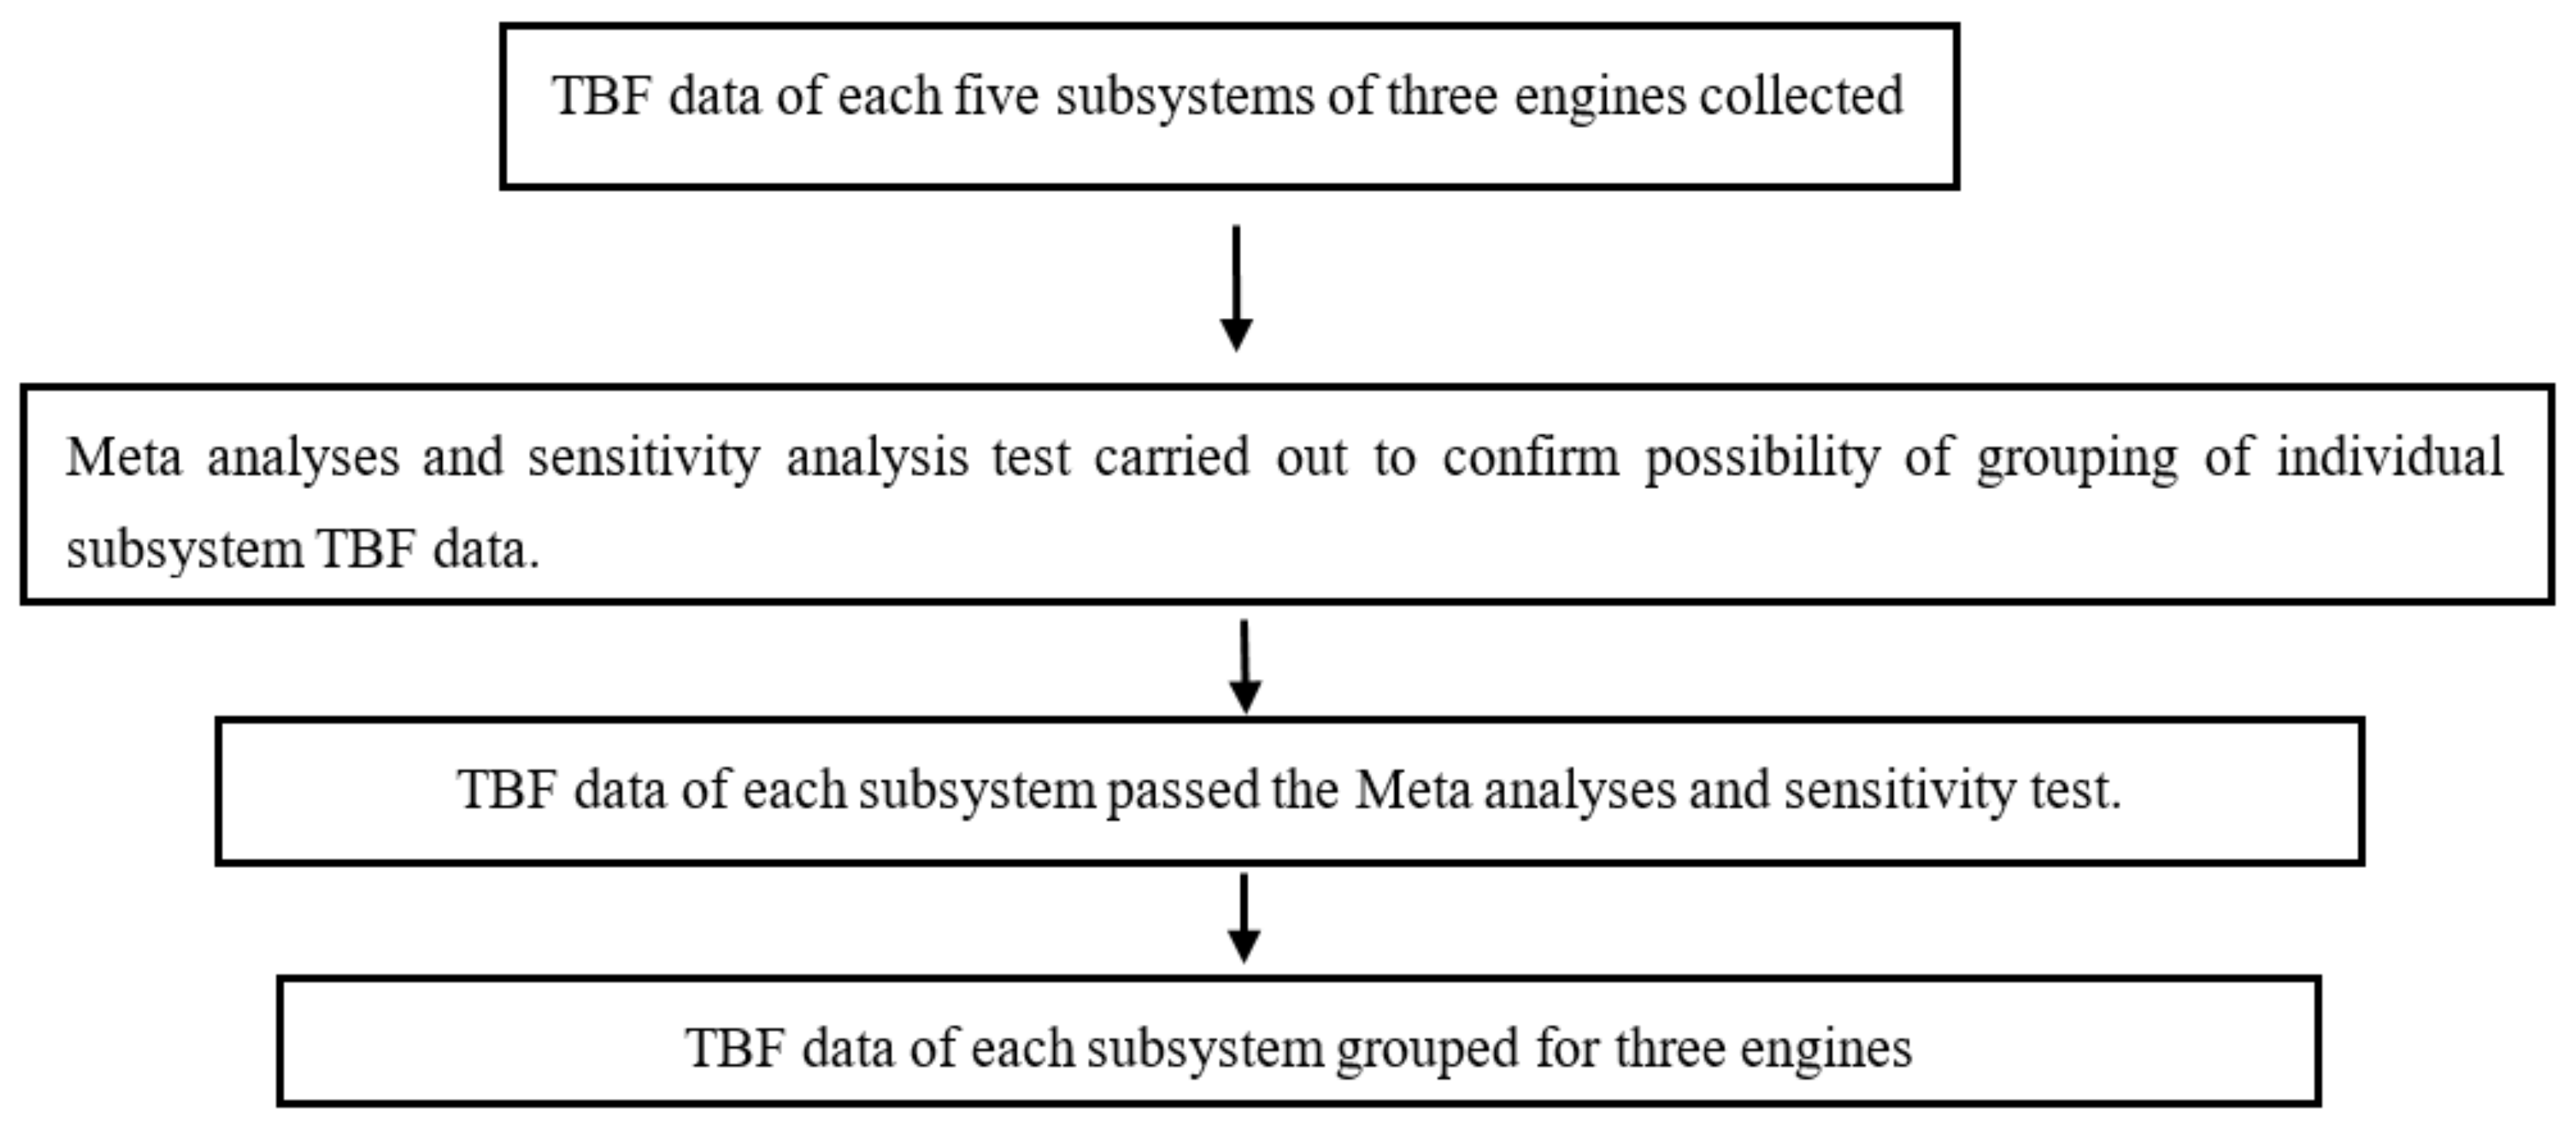
2. Research Methodology
3. Experimentation
3.1. Collection of Field Data
3.2. Grouping of Data
Meta-Analysis Test
4. Results and Discussions
4.1. Meta-Analysis Test
4.2. Sensitivity Analysis
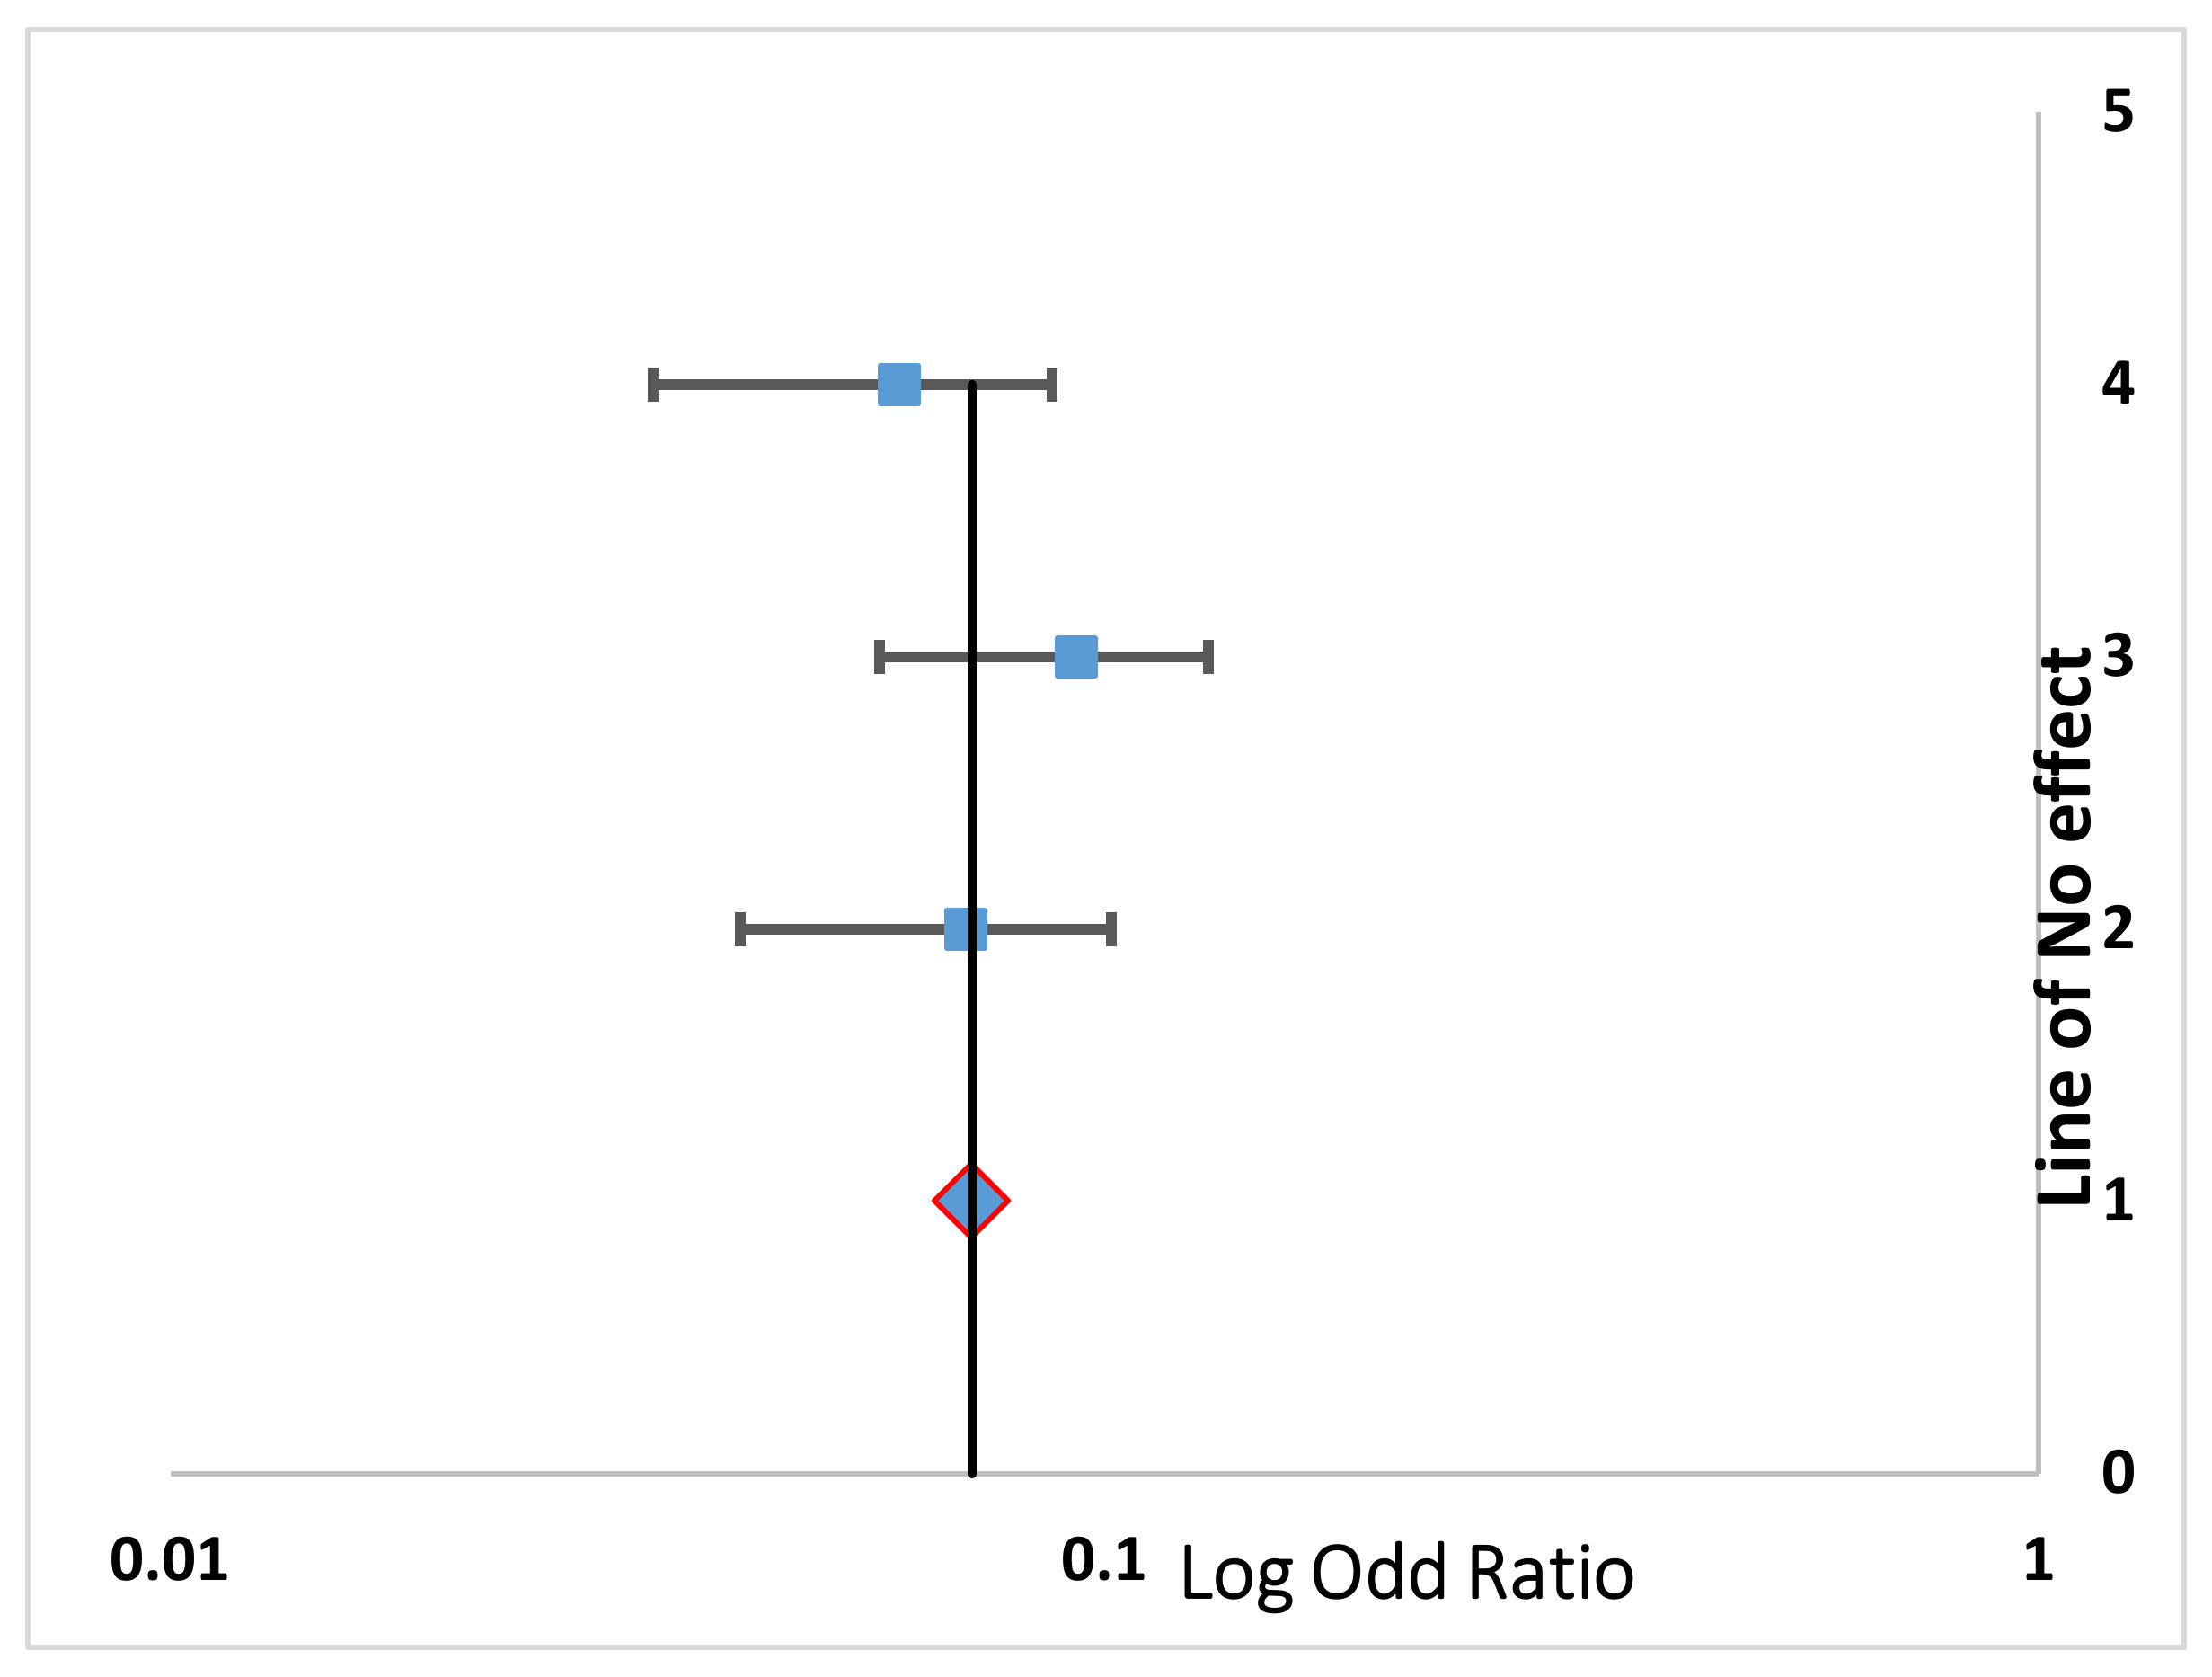
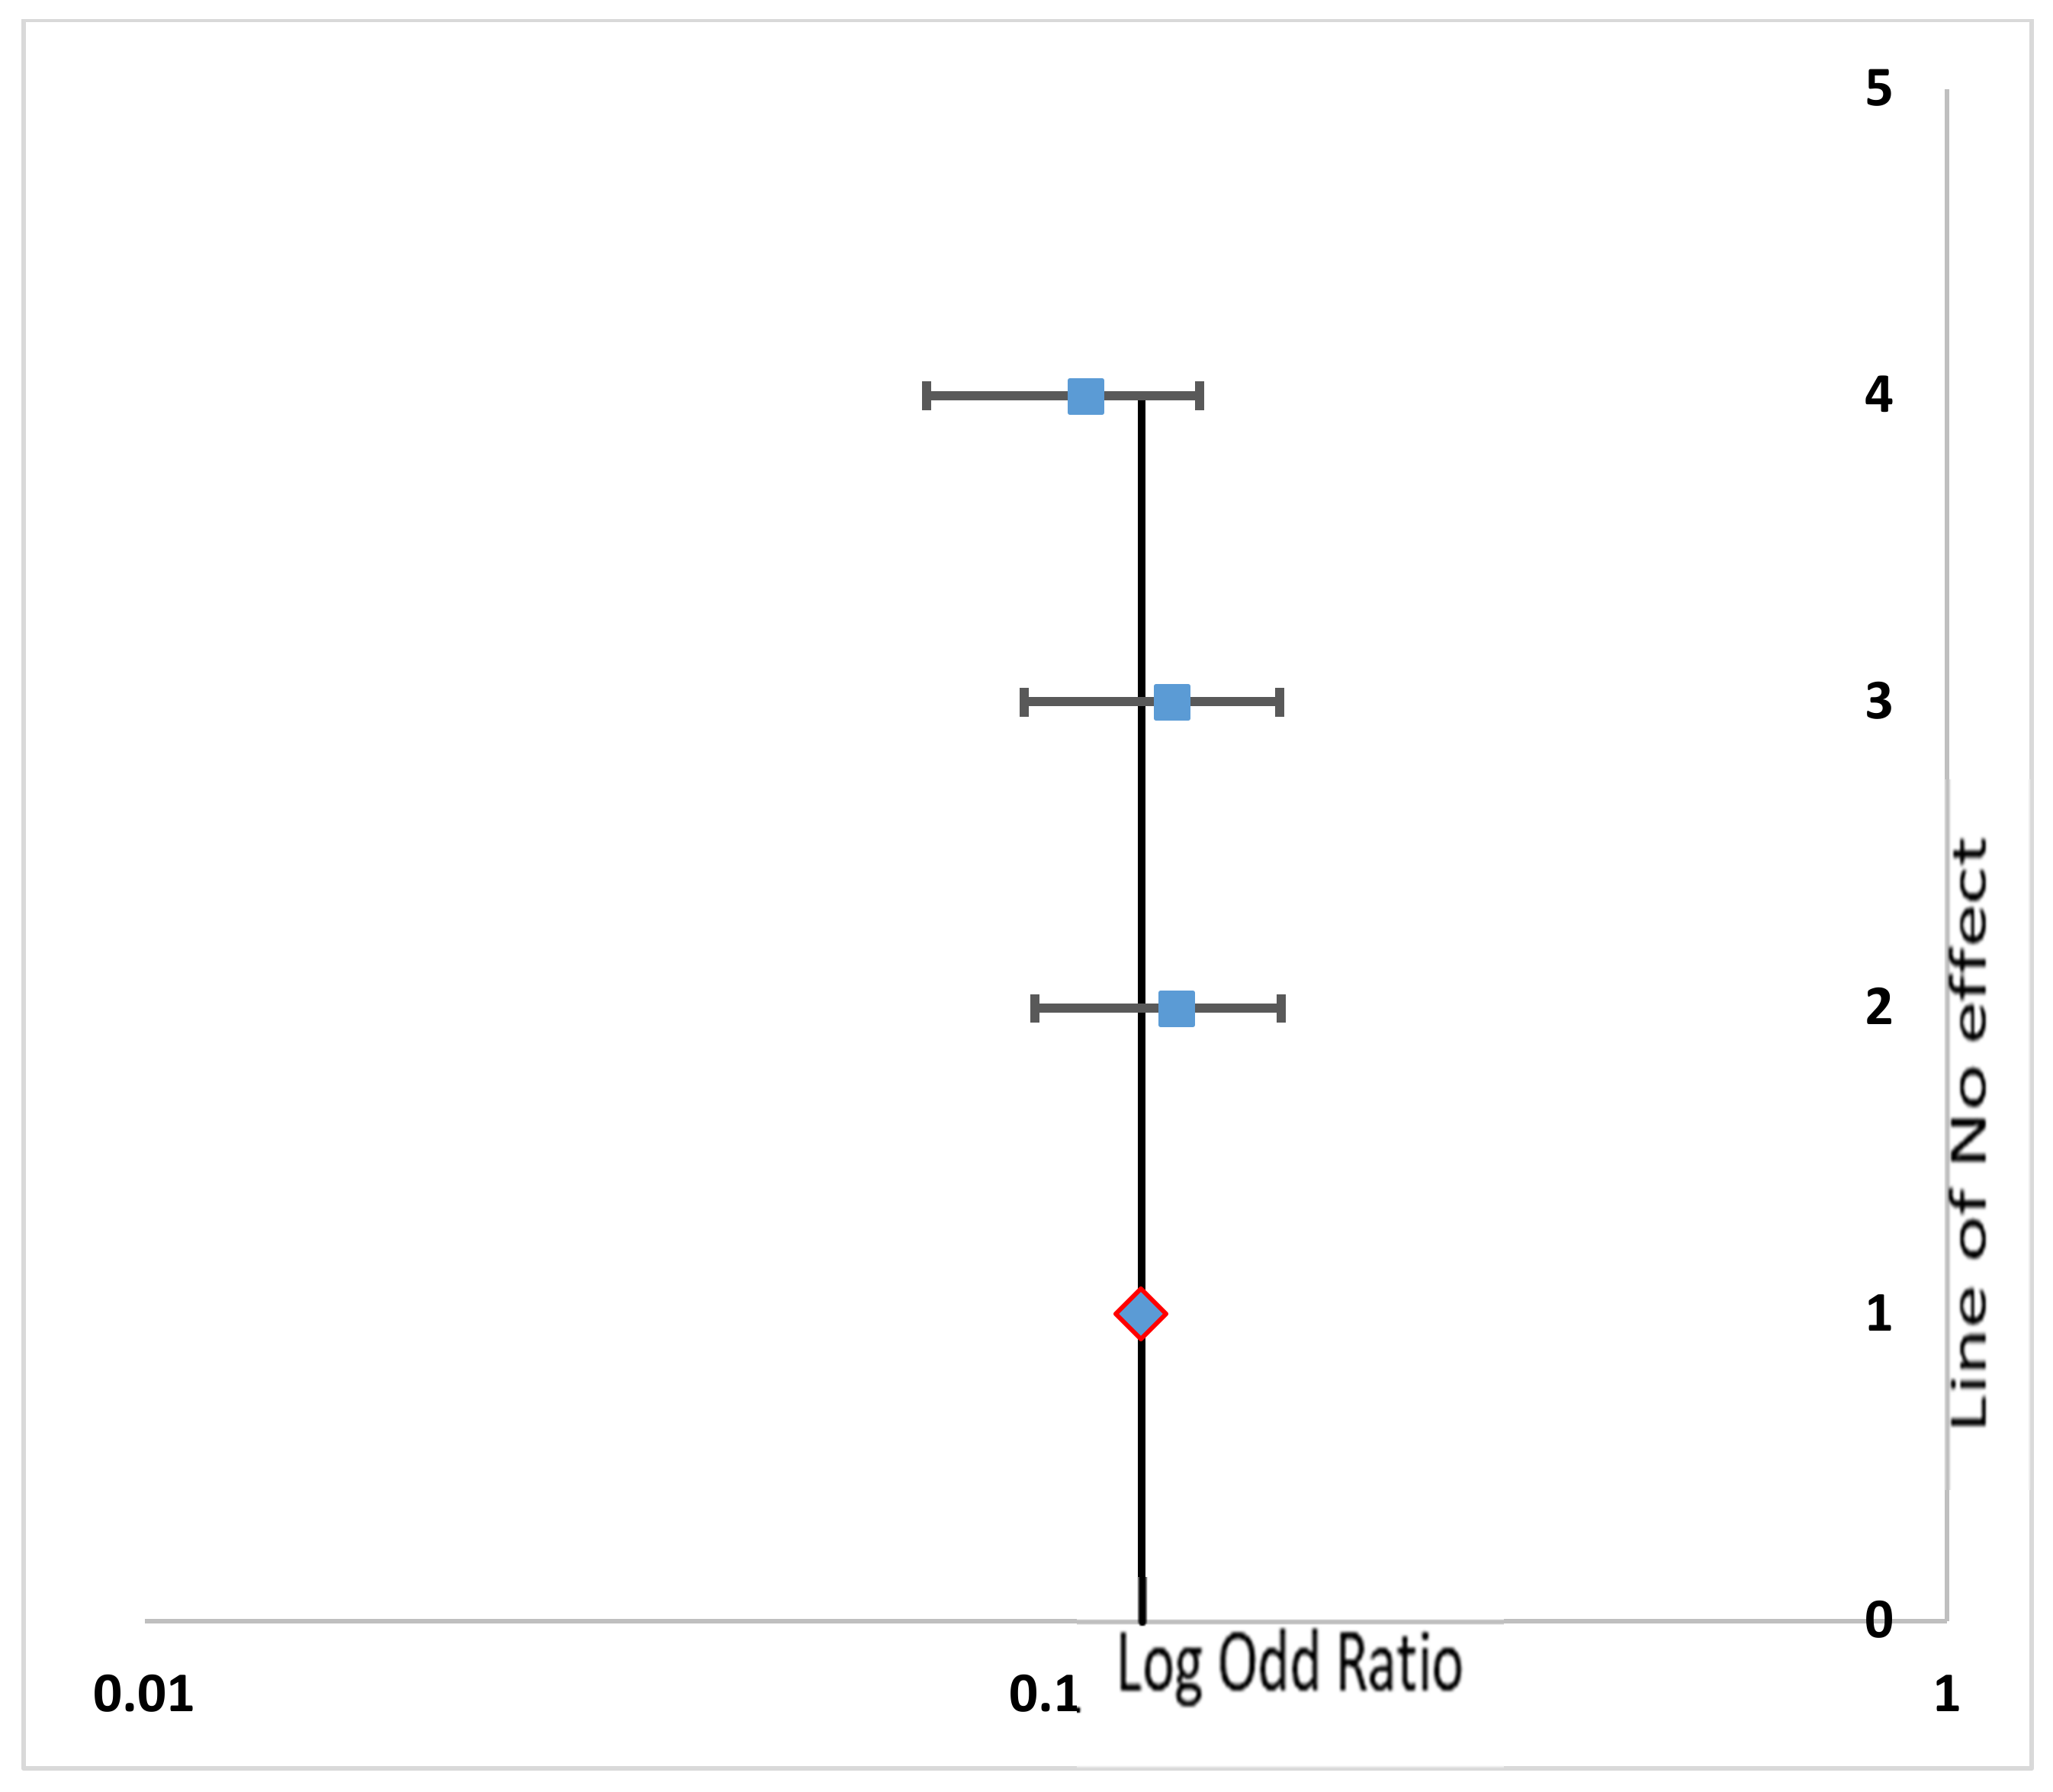
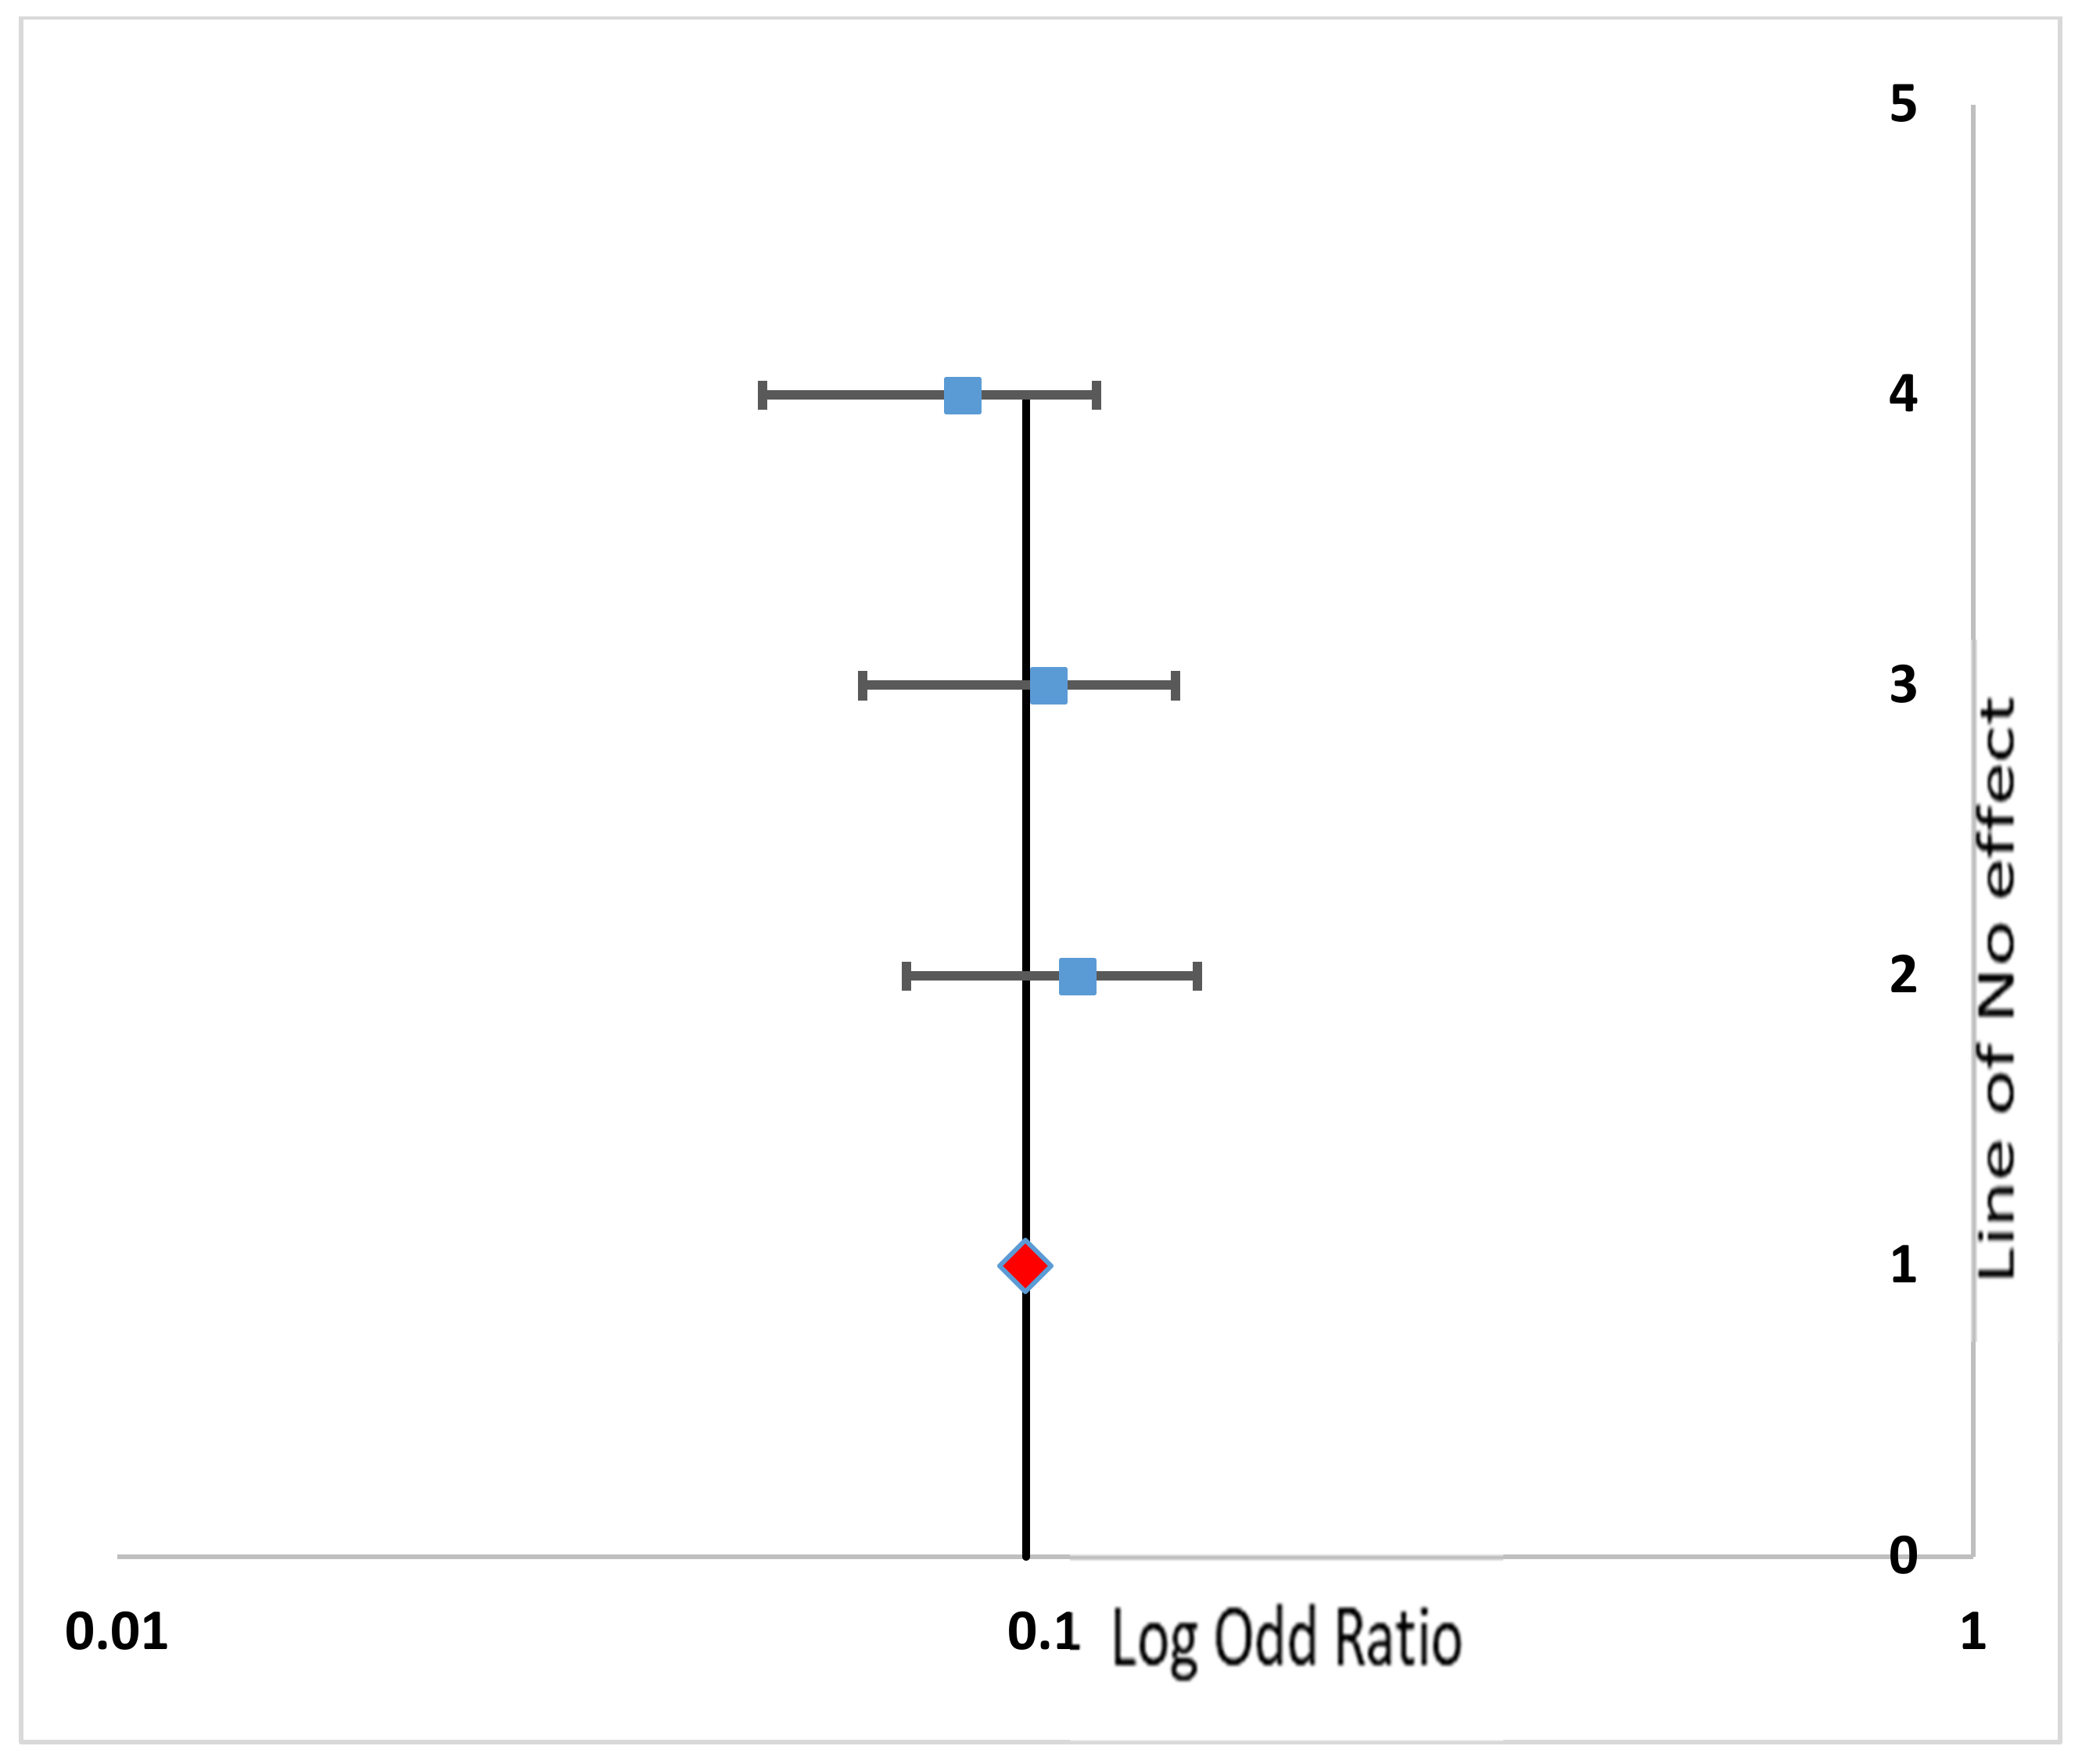
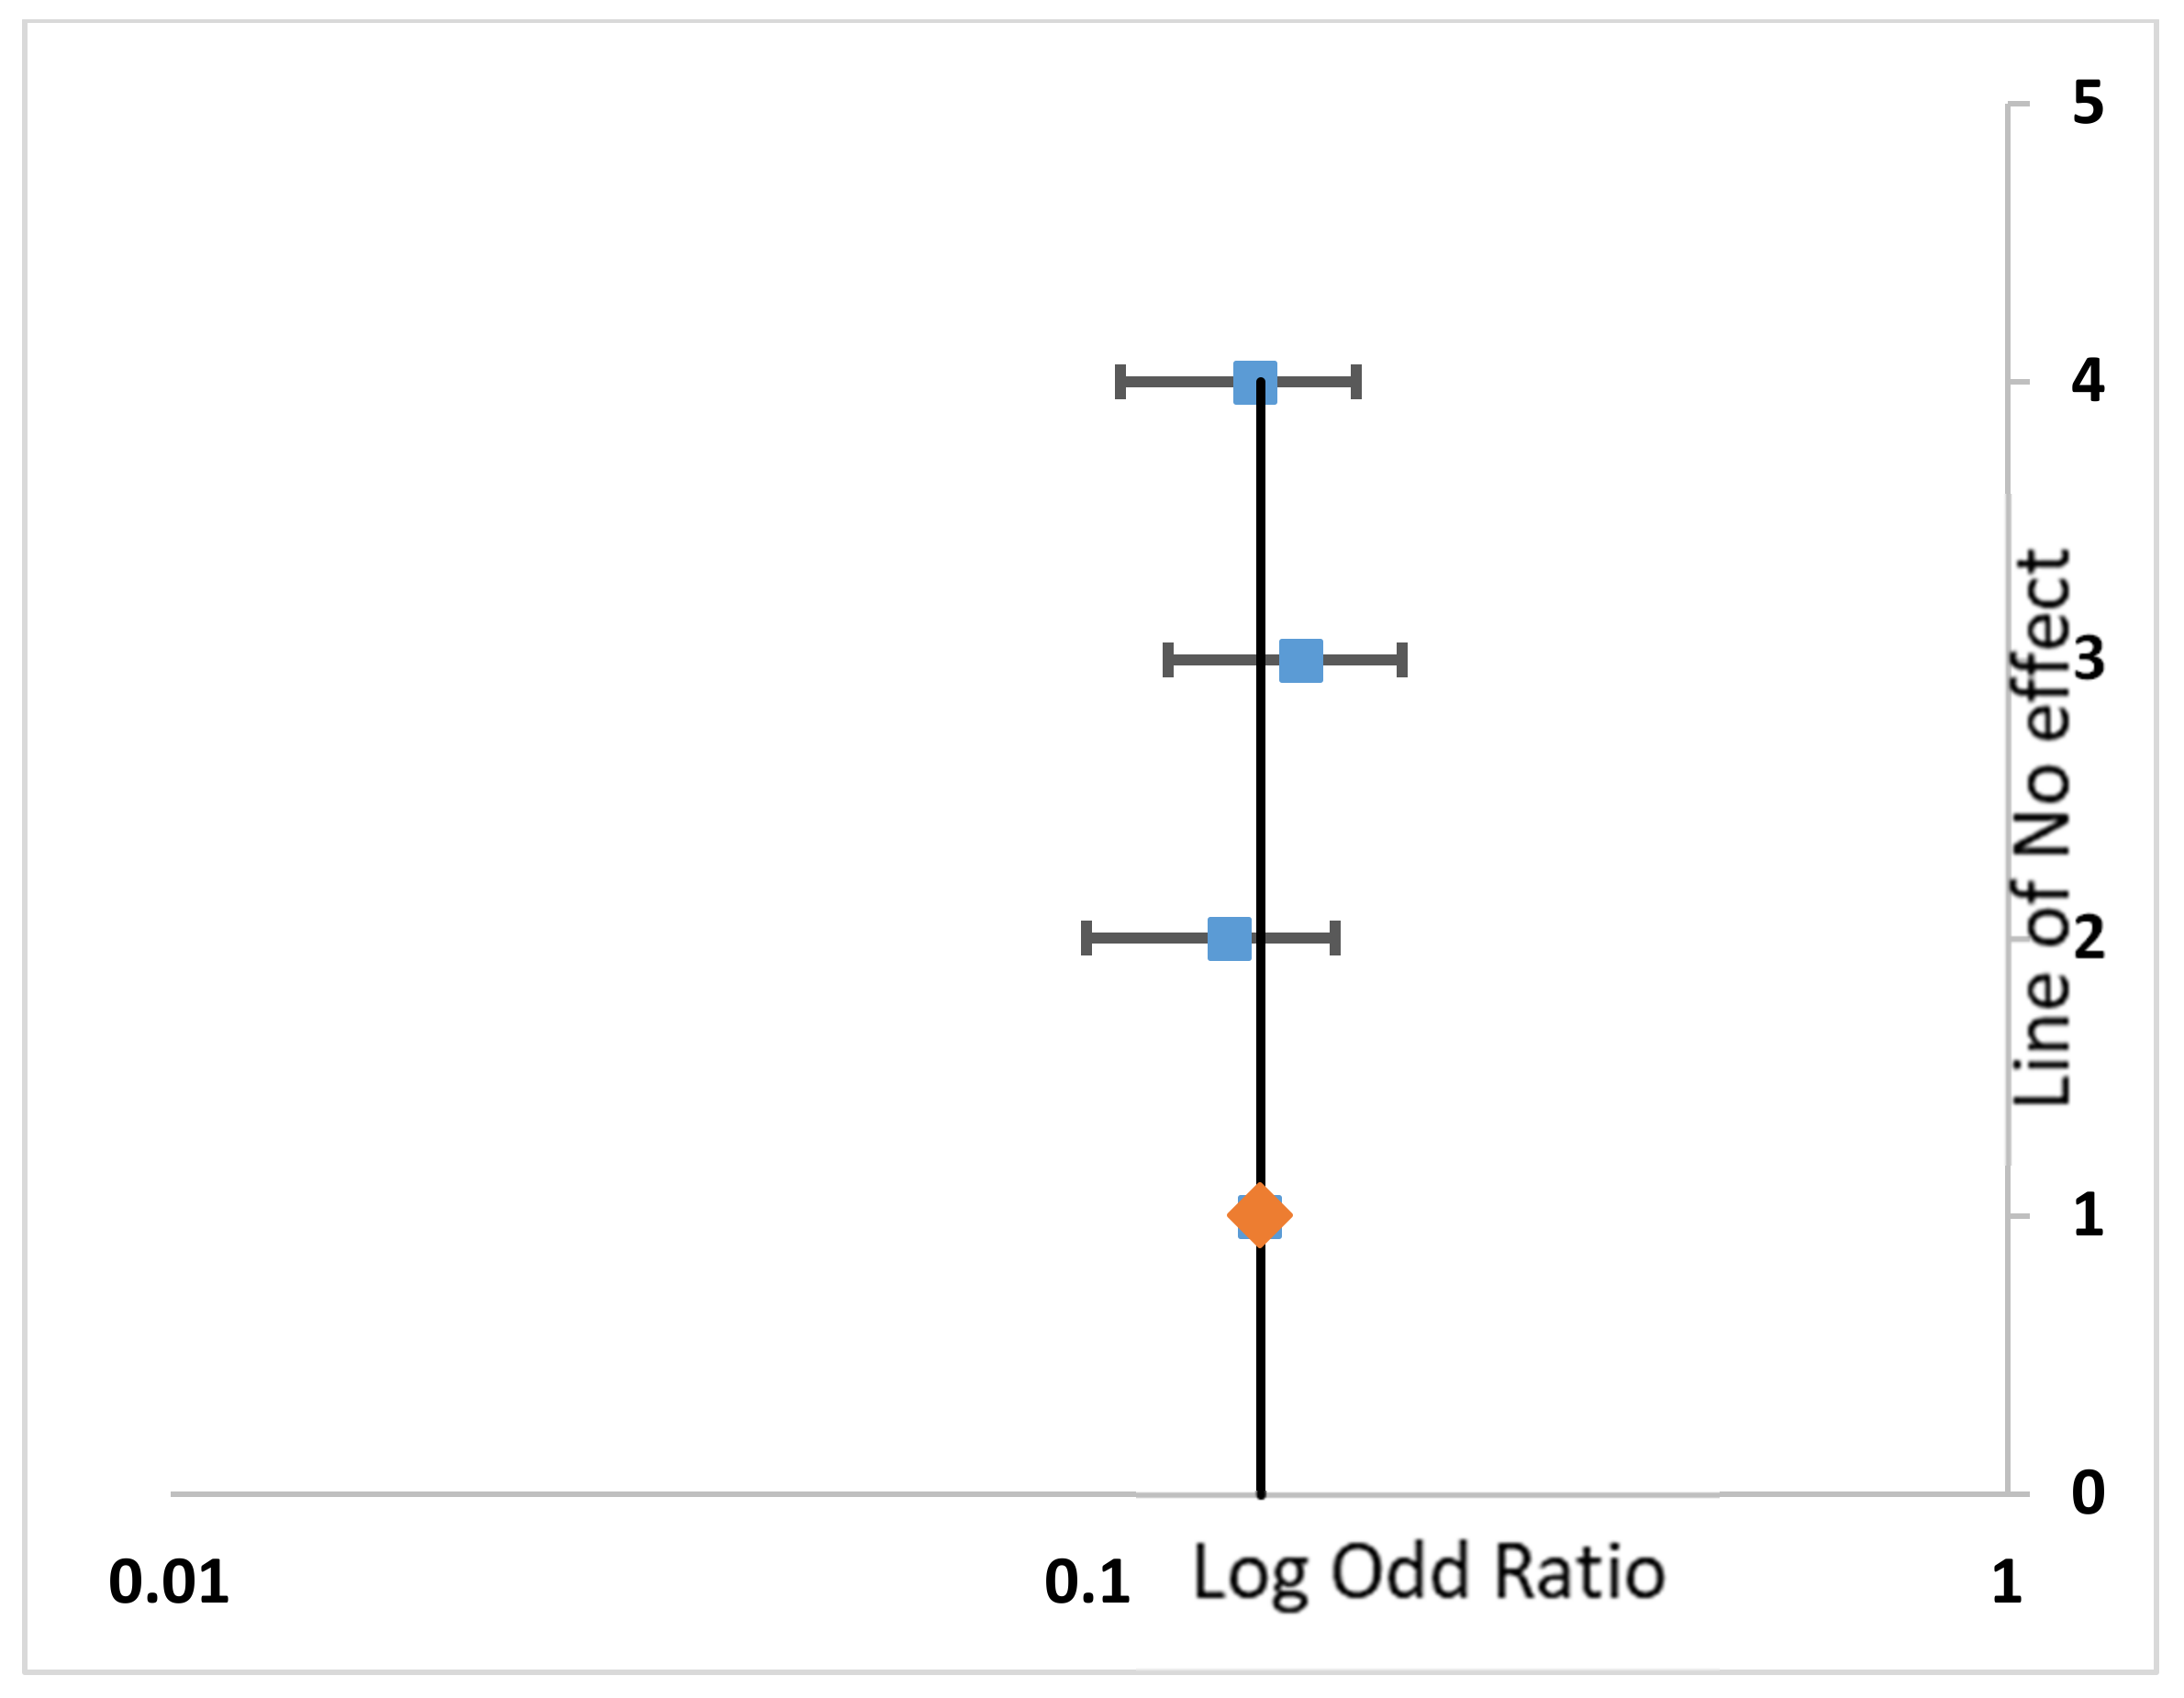
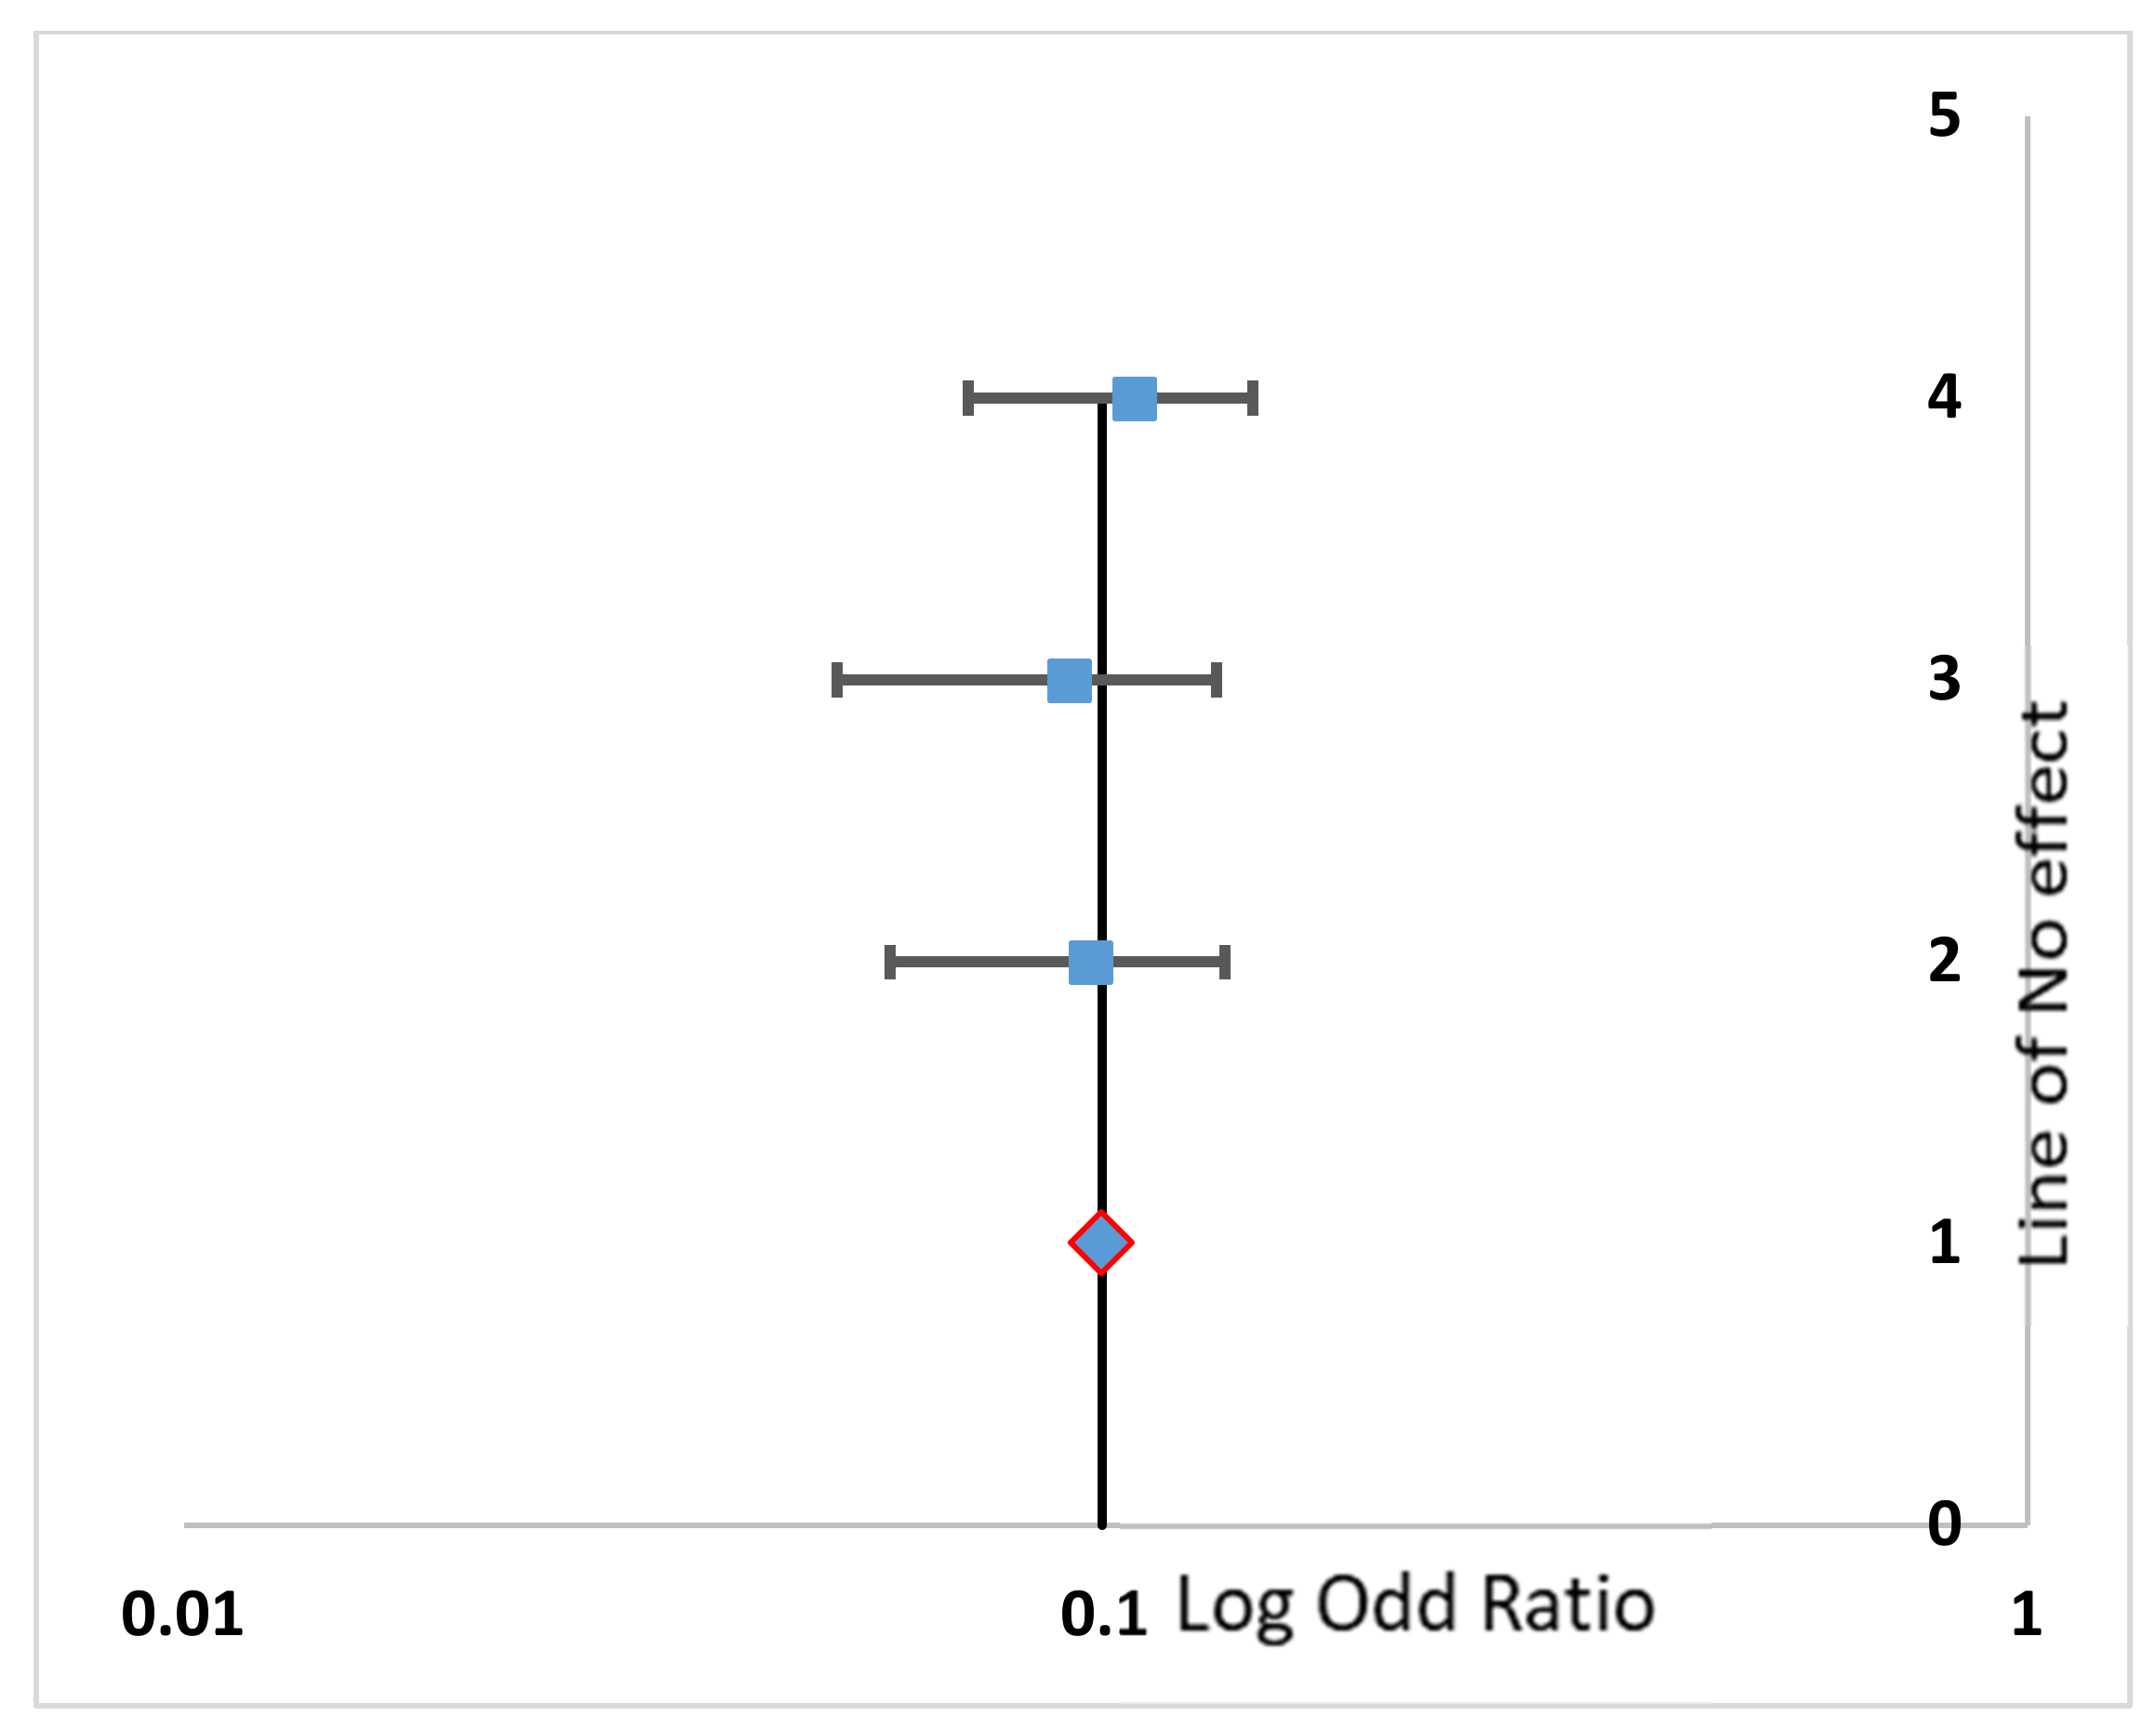
4.2.1. Sample Steps to Draw a Forest Plot for the Air Supply Subsystem
- First, a scatter plot is drawn in excel. X axis and Y axis values are taken from the Rate column and the Ordinal number column of Table 4, respectively.
- The error bars are subsequently added by clicking the “Error Bar” button on the right side. After right-clicking on the data series, click “format data series”, then choose the “X error bar” Table. In this window, assign the columns CI lower and CI upper as the lower and upper limit.
- The line marking values are then added to the summary effect value, first by right-clicking on the graph, followed by Select Data. Then click on “add” and choose X and Y values from the central tendency column of the table.
- A new set of points is seen on the graph. By right-clicking on any of the dots, “format data series” can be selected. The “no marker” and “solid line” can be chosen on the Marker Options and Line Color tabs.
- The X axis is further formatted by right-clicking on it and choosing the logarithmic scale, which also formats the Y axis up to value 5.
4.2.2. Log Odds Ratio
5. Conclusions
Author Contributions
Funding
Institutional Review Board Statement
Informed Consent Statement
Data Availability Statement
Conflicts of Interest
References
- Crow, L.H. Reliability analysis for complex repairable systems. In Reliability and Biometry; Proschan, F., Serfling, R.J., Eds.; SIAM: Philadelphia, PA, USA, 1975; pp. 379–410. [Google Scholar]
- Military Handbook. Reliability Growth Management; MIL-HDBK-189; U.S. Department of Defense: Washington, DC, USA, 1981.
- Littlewood, B.; Ascher, H.; Feingold, H. Repairable Systems Reliability: Modelling, Inference, Misconceptions and their Causes. J. R. Stat. Soc. Ser. A 1985, 148, 165. [Google Scholar] [CrossRef]
- Ascher, H.; Feingold, H. Repairable System Reliability; Dekker: New York, NY, USA, 1984. [Google Scholar]
- Jones, B.; Bethea, R.M.; Duran, B.S.; Boullion, T.L. Statistical Methods for Engineers and Scientists. J. R. Stat. Society. Ser. A 1985, 148, 390. [Google Scholar] [CrossRef]
- Crow, L.H. Evaluating the Reliability of Repairable Systems. In Proceedings of the Annual Reliability and Maintainability Symposium, Los Angeles, CA, USA, 23–25 January 1990; pp. 275–279. [Google Scholar]
- Charles, E.E. An Introduction to Reliability and Maintainability; McGraw-Hill Companies, Inc.: New York, NY, USA, 2000. [Google Scholar]
- Higgins, J.; Thompson, S.G.; Deeks, J.; Altman, D. Measuring inconsistency in meta-analyses. BMJ 2003, 327, 557–560. [Google Scholar] [CrossRef] [PubMed] [Green Version]
- Olwell, D.H.; Sorell, A. Warranty Calculations for Missiles with only Current-Status Data. In Proceedings of the Using Bayesian Methods, Annual Reliability and Maintainability Symposium, Philadelphia, PA, USA, 22–25 January 2001; pp. 144–148. [Google Scholar]
- Crombie, I.; Davies, H.T. What Is Meta-Analysis? 2nd ed.; Evidence Based Medicine; Hayward Medical Publishing: Little Bookham, UK, 2009; pp. 1–8. [Google Scholar]
- Neyeloff, J.L.; Fuchs, S.C.; Moreira, L.B. Meta-analyses and Forest plots using a microsoft excel spreadsheet: Step-by-step guide focusing on descriptive data analysis. BMC Res. Notes 2012, 5, 52. [Google Scholar] [CrossRef] [PubMed] [Green Version]
- Mayer, R.M.; Larean, J.P.; Crowford, S.L.; Anderson, M.T. Review of Literature on Model Assisted Probability Detection; Pacific Northwest National Laboratory (PNNL): Richland, WA, USA, 2014.
- Deepika. Reliability Analysis of Transit Fuel System in Diesel Engine. Bull. Pure Appl. Sci. Math. Stat. 2017, 36E, 51. [Google Scholar] [CrossRef]
- Wang, G.; Zhou, Y.; Zhang, Q.; Wang, S. The Small Sample Failure Distribution Model of Diesel Engine Component Parts Using the FMECA Approach. Int. J. Model. Optim. 2017, 7, 19–23. [Google Scholar]
- Qin, L.; Shen, X.; Chen, X.; Gao, P. Reliability Assessment of Bearings Based on Performance Degradation Values under Small Samples. J. Mech. Eng. 2017, 63, 248–254. [Google Scholar] [CrossRef]
- Ahn, E.J.; Kang, H. Introduction to Systematic Review and Meta-Analysis. Korean J. Anaesthesiol. 2018, 71, 103–112. [Google Scholar] [CrossRef] [PubMed] [Green Version]
- Dai, W.; Chi, Y.; Lu, Z.; Wang, M.; Zhao, Y. Research on Reliability Assessment of Mechanical Equipment Based on the Performance–Feature Model. Appl. Sci. 2018, 8, 1619. [Google Scholar] [CrossRef] [Green Version]
- Xintao, X.; Zhen, C.; Lijun, Z.; Xiaowei, Y. Estimation on Reliability Models of Bearing Failure Data. Math. Probl. Eng. 2018, 2018, 6189527. [Google Scholar] [CrossRef] [Green Version]
- Si, W.; Yang, Q.; Monplaisir, L.; Chen, Y. Reliability Analysis of Repairable Systems with Incomplete Failure Time Data. IEEE Trans. Reliab. 2018, 67, 1043–1059. [Google Scholar] [CrossRef]
- Zhang, L.; Jin, G.; You, Y. Reliability Assessment for Very Few Failure Data and Weibull Distribution. Math. Probl. Eng. 2019, 2019, 8947905. [Google Scholar] [CrossRef]
- Darmanto, S.; Atmanto, I.S.; Permana, B.H. Reliability Analysis of Diesel Engine at LNG Plant Using Counting Process. J. Vocat. Stud. Appl. Res. 2019, 1, 1–4. [Google Scholar]
- Krittanawong, C.; Virk, H.U.H.; Bangalore, S.; Wang, Z.; Johnson, K.W.; Pinotti, R.; Zhang, H.; Kaplin, S.; Narasimhan, B.; Kitai, T.; et al. Machine learning prediction in cardiovascular diseases: A meta-analysis. Sci. Rep. 2020, 10, 16057. [Google Scholar] [CrossRef] [PubMed]
- Kumar, N.S.H.; Choudhary, R.P.; Murthy, C.S. Reliability-based analysis of probability density function and failure rate of the shovel–dumper system in a surface coal mine. Model. Earth Syst. Environ. 2020. [Google Scholar] [CrossRef]
- Ghazy, R.M.; Almaghraby, A.; Shaaban, R.; Kamal, A.; Beshir, H.; Moursi, A.; Ramadan, A.; Taha, S.H.N. A systematic review and meta-analysis on chloroquine and hydroxychloroquine as monotherapy or combined with azithromycin in COVID-19 treatment. Sci. Rep. 2020, 10, 22139. [Google Scholar] [CrossRef] [PubMed]
- Agrawal, A.K.; Murthy, V.M.S.R.; Chattopadhyaya, S. Investigations into reliability, maintainability and availability of tunnel boring machine operating in mixed ground condition using Markov chains. Eng. Fail. Anal. 2019, 105, 477–489. [Google Scholar] [CrossRef]
- Agrawal, A.; Chattopadhyaya, S.; Murthy, V.; Legutko, S.; Krolczyk, G. A Novel Method of Laser Coating Process on Worn-Out Cutter Rings of Tunnel Boring Machine for Eco-Friendly Reuse. Symmetry 2020, 12, 471. [Google Scholar] [CrossRef] [Green Version]
- Bisht, V.; Kumar, S.; Agrawal, A.K.; Siddiqui, M.A.H.; Chattopadhyaya, S. Prediction of breakdown hours of load haul dumper by long short term memory network. In IOP Conference Series: Earth and Environmental Science; IOP Publishing: Bristol, UK, 2021; Volume 1104, p. 12006. [Google Scholar]
- Vashishta, S.; Kumar, S.; Agrawal, A.K.; Siddiqui, M.A.H.; Chattopadhyaya, S. Reliability and Maintainability Analysis of LHD Loader at Saoner Mines, Nagpur, India. In IOP Conference Series: Earth and Environmental Science; IOP Publishing: Bristol, UK, 2019; Volume 691, p. 12013. [Google Scholar]
- Kumar, G.; Agrawal, A.K.; Chattopadhyaya, S.; Siddiqui, M.A.H. Reliability and maintainability analysis of universal drill machine at Saoner mines, Nagpur, India. In IOP Conference Series: Earth and Environmental Science; IOP Publishing: Bristol, UK, 2021; Volume 691, p. 12014. [Google Scholar]
- Dinkar, B.K.; Mukhopadhyay, A.K.; Chattopadhyaya, S.; Sharma, S.; Alam, F.; Machado, J. Statistical Reliability Assessment for Small Sample of Failure Data of Dumper Diesel Engines Based on Power Law Process and Maximum Likelihood Estimation. Appl. Sci. 2021, 11, 5387. [Google Scholar] [CrossRef]


| Sub-System | Component | Repairable | Non-Repairable | Importance in Operation |
|---|---|---|---|---|
| Air supply | Turbo charger | Yes | Increase the intake of air. | |
| Compressor | Yes | Compress the air. | ||
| Air Distribution System | yes | It delivers air to all systems. | ||
| Oil Remover | Yes | The oil remover removes the oil carried out by the air during the compression cycle. | ||
| Pressure Gauge | yes | It indicates system output pressure. | ||
| Moisture Separator | yes | It removes moisture from the incoming air. | ||
| After Cooler | Yes | It cools the air leaving the air compressor. | ||
| Inlet Air Filter | Yes | The dust and dirt from atmospheric air is removed. | ||
| Electric motor | yes | It provides rotary motion to drive the compressor. | ||
| Self-starting system | Starter gear | Yes | Connected to flywheel. | |
| solenoid | Yes | It has one small connector for the starter control wire and two large terminals. | ||
| Motor | yes | Supply torque to main system. | ||
| battery | Yes | Supply electric spark. | ||
| Gear pump | Yes | Pump out the fuel from tank. | ||
| Filter | Yes | Clean the fuel. | ||
| Fuel supply system | Pulsation damper | Yes | Reduce vibration produced due to vacuum. | |
| Magnetic screen | Yes | Caught ferrous particles. | ||
| Injector | Yes | Inject spray of fuel. | ||
| Throttle | Yes | Control amount of fuel supply. | ||
| Shut down valve | Final control of fuel to injector is performed by this valve. | |||
| Push rod | Yes | Regulate injector by cam movement. | ||
| Cam | Yes | Time management regulation of fuel. | ||
| Fuel tank | Yes | Accumulate fuel. | ||
| Lubrication system | Crankshaft main bearings | Yes | To reduce friction. | |
| Big end bearings | Yes | To reduce friction. | ||
| Piston pins and small end bushes | Yes | To reduce friction. | ||
| Cylinder walls | Yes | Its function is to provide sliding surface. | ||
| Piston rings | Yes | Sealing the combustion chamber. Improving heat transfer from the piston. | ||
| Timing Gears | Yes | Allow the camshaft and crankshaft to turn the timing chain. | ||
| Camshaft and bearings | Yes | Controls the action of the valves, rotates at half the crankshaft speed. | ||
| Valves | Yes | To supply oil. | ||
| Tappets and push-rods | Yes | Regulate oil. | ||
| Oil pump parts | Yes | To pump oil to lubrication system. | ||
| Water pump bearings | Yes | To reduce friction. | ||
| In-Line Fuel Injection Pump bearings | Yes | To reduce friction. | ||
| Turbocharger bearings | Yes | To reduce friction. | ||
| Cooling system | Radiator Cooling Fans | Yes | The radiator fans maintain the air flow going through the radiator and cools the air. | |
| Pressure Cap and Reserve Tank | Yes | It allows the coolant to safely reduce temperatures if they exceed limit. | ||
| Water Pump | Yes | A water pump circulates the coolant. | ||
| Thermostat | Yes | The thermostat measures the temperature of the coolant. | ||
| Freeze Plugs | Yes | It provides the coolant passages in the engine block. | ||
| Head Gaskets and Intake Manifold Gaskets | Yes | It prevents combustion gases from escaping past the mating surfaces. | ||
| Hoses | Yes | Connect the components of the cooling system. | ||
| Radiator | Yes | Radiate heat. | ||
| Fins | Yes | Part of radiator. |
| S. No. | Subsystems | TBF (Engine 1) | TBF (Engine 2) | TBF (Engine 3) |
|---|---|---|---|---|
| 1 | Air supply |
|
|
|
| 2 | Self-starting |
|
|
|
| 3 | Fuel supply |
|
|
|
| 4 | Lubrication |
|
|
|
| 5 | Cooling |
|
|
|
| Air Supply Subsystem | |||||||||
| Engines | Downtime Hours | Total Run of Engine | Outcome | S.E. | Rate | W | W × ES | W × ES2 | Level of Heterogeneity (i2) |
| 1 | 18.5 | 30,641 | 0.000604 | 0.00014 | 0.060377 | 50,749,777.35 | 30,641 | 18.5 | 2.23% |
| 2 | 26 | 27,857 | 0.000933 | 0.000183 | 0.093334 | 29,846,632.65 | 27,857 | 26 | |
| 3 | 21 | 29,520 | 0.000711 | 0.000155 | 0.071138 | 41496685.71 | 29,520 | 21 | |
| Self–Starting Subsystem | |||||||||
| Engines | Downtime Hours | Total Run of Engine | Outcome | S.E. | Rate | W | W × ES | W × ES2 | Level of Heterogeneity (i2) |
| 1 | 46.5 | 30,641 | 0.001518 | 0.000223 | 0.151757 | 20,190,772 | 30,641 | 46.5 | −170.23% which is taken as 0 |
| 2 | 47.5 | 27,857 | 0.001705 | 0.000247 | 0.170514 | 16,337,104 | 27,857 | 47.5 | |
| 3 | 42 | 29,520 | 0.001423 | 0.00022 | 0.142276 | 20,748,343 | 29,520 | 42 | |
| Fuel Supply Subsystem | |||||||||
| Engines | Downtime Hours | Total Run of Engine | Outcome | S.E. | Rate | W | W × ES | W × ES2 | Level of Heterogeneity (i2) |
| 1 | 33 | 30,641 | 0.001077 | 0.000187 | 0.107699 | 28,450,633 | 30,641 | 33 | −452.77% which is taken as 0 |
| 2 | 25.5 | 27,857 | 0.000915 | 0.000206 | 0.091539 | 23,515,529 | 21,525.86 | 19.70 | |
| 3 | 28.5 | 29,520 | 0.000965 | 0.000195 | 0.096545 | 26,406,982 | 25,494.55 | 24.61 | |
| Lubrication Subsystem | |||||||||
| Engines | Downtime Hours | Total Run of Engine | Outcome | S.E. | Rate | W | W × ES | W × ES2 | Level of Heterogeneity (i2) |
| 1 | 34 | 30,641 | 0.00111 | 0.00019 | 0.110962 | 27,613,849 | 30,641 | 34 | −52.67% which is taken as 0 |
| 2 | 38.5 | 27,857 | 0.001382 | 0.000223 | 0.138206 | 20,156,168 | 27,857 | 38.5 | |
| 3 | 41.3 | 29,520 | 0.001399 | 0.000218 | 0.139905 | 21,100,010 | 29,520 | 41.3 | |
| Cooling Subsystem | |||||||||
| Engines | Downtime Hours | Total Run of Engine | Outcome | S.E. | Rate | W | W × ES | W × ES2 | Level of Heterogeneity (i2) |
| 1 | 25 | 30,641 | 0.000816 | 0.000163 | 0.08159 | 37,554,835 | 30,641 | 25 | −58.85% which is taken as 0 |
| 2 | 28.1 | 27,857 | 0.001009 | 0.00019 | 0.100872 | 27,616,101 | 27,857 | 28.1 | |
| 3 | 32 | 29,520 | 0.001084 | 0.000192 | 0.108401 | 27,232,200 | 29,520 | 32 | |
| Engines | Q = W × ES2 | ||||||||
| 1 | 18.5 | ||||||||
| 2 | 26 | ||||||||
| 3 | 21 | ||||||||
| Air Supply Subsystem | |||||||
| Engines | Downtime Hours | Rate | Ordinal Numbers | CI Lower | CI Upper | Central Tendency | |
| 1 | 18.5 | 0.08 | 4 | 0.031 | 0.031 | 0 | 0.072 |
| 2 | 26 | 0.10 | 3 | 0.037 | 0.037 | 1 | 0.072 |
| 3 | 21 | 0.10 | 2 | 0.037 | 0.037 | 2 | 0.072 |
| Summary | 0.09 | 1 | 0.0005 | 0.0005 | 3 | 0.072 | |
| 4 | 0.072 | ||||||
| Self-Starting Subsystem | |||||||
| Engines | Downtime Hours | Rate | Ordinal Number | CI Lower | CI Upper | Central Tendency | |
| 1 | 46.5 | 0.15 | 4 | 0.043 | 0.043 | 0 | 0.154 |
| 2 | 47.5 | 0.17 | 3 | 0.048 | 0.048 | 1 | 0.154 |
| 3 | 42 | 0.14 | 2 | 0.043 | 0.043 | 2 | 0.154 |
| Summary | 0.15 | 1 | 0.0013 | 0.0013 | 3 | 0.154 | |
| 4 | 0.154 | ||||||
| Fuel Supply Subsystem | |||||||
| Engines | Downtime Hours | Rate | Ordinal Numbers | CI Lower | CI Upper | Central Tendency | |
| 1 | 33 | 0.10 | 4 | 0.036 | 0.036 | 0 | 0.099 |
| 2 | 25.5 | 0.09 | 3 | 0.040 | 0.040 | 1 | 0.099 |
| 3 | 28.5 | 0.09 | 2 | 0.038 | 0.038 | 2 | 0.099 |
| Summary | 0.09 | 1 | 0.00077 | 0.00077 | 3 | 0.099 | |
| 4 | 0.099 | ||||||
| Lubrication Subsystem | |||||||
| Engines | Downtime Hours | Rate | Ordinal Number | CI Lower | CI Upper | Central Tendency | |
| 1 | 34 | 0.11 | 4 | 0.0372 | 0.0372 | 0 | 0.127 |
| 2 | 38.5 | 0.13 | 3 | 0.0436 | 0.0436 | 1 | 0.127 |
| 3 | 41.3 | 0.13 | 2 | 0.0426 | 0.0426 | 2 | 0.127 |
| Summary | 0.12 | 1 | 0.00104 | 0.00104 | 3 | 0.127 | |
| 4 | 0.127 | ||||||
| Cooling Subsystem | |||||||
| Engines | Downtime Hours | Rate | Ordinal Numbers | CI Lower | CI Upper | Central Tendency | |
| 1 | 25 | 0.08 | 4 | 0.0319 | 0.0319 | 0 | 0.095 |
| 2 | 28.1 | 0.10 | 3 | 0.0372 | 0.0372 | 1 | 0.095 |
| 3 | 32 | 0.10 | 2 | 0.0375 | 0.0375 | 2 | 0.095 |
| Summary | 0.09 | 1 | 0.0007 | 0.0007 | 3 | 0.095 | |
| 4 | 0.095 | ||||||
| S. No. | Subsystems | TBF |
|---|---|---|
| 1 | Air supply | 2655, 633, 4112, 422, 600, 2036, 1479, 77, 3585, 1673, 646. |
| 2 | Self-starting | 1246, 44, 856, 2328, 3913, 759, 423, 185, 761, 1197, 1116, 3450, 1920, 797, 550, 191, 917, 1595. |
| 3 | Fuel supply | 423, 240, 525, 934, 3856, 96, 316, 914, 2036, 112, 1449, 290, 225, 2828. |
| 4 | Lubrication | 2566, 2278, 426, 1584, 757, 238, 991, 916, 855, 1115, 1503, 1367, 990, 2926. |
| 5 | Cooling | 3827, 2356, 577, 1823, 1177, 680, 1424, 3236, 170, 108, 219, 934, 329, 2149. |
Publisher’s Note: MDPI stays neutral with regard to jurisdictional claims in published maps and institutional affiliations. |
© 2021 by the authors. Licensee MDPI, Basel, Switzerland. This article is an open access article distributed under the terms and conditions of the Creative Commons Attribution (CC BY) license (https://creativecommons.org/licenses/by/4.0/).
Share and Cite
Chattopadhyaya, S.; Dinkar, B.K.; Mukhopadhyay, A.K.; Sharma, S.; Machado, J. Meta-Analysis and Forest Plots for Sustainability of Heavy Load Carrier Equipment Used in the Industrial Mining Environment. Sustainability 2021, 13, 8672. https://0-doi-org.brum.beds.ac.uk/10.3390/su13158672
Chattopadhyaya S, Dinkar BK, Mukhopadhyay AK, Sharma S, Machado J. Meta-Analysis and Forest Plots for Sustainability of Heavy Load Carrier Equipment Used in the Industrial Mining Environment. Sustainability. 2021; 13(15):8672. https://0-doi-org.brum.beds.ac.uk/10.3390/su13158672
Chicago/Turabian StyleChattopadhyaya, Somnath, Brajeshkumar Kishorilal Dinkar, Alok Kumar Mukhopadhyay, Shubham Sharma, and José Machado. 2021. "Meta-Analysis and Forest Plots for Sustainability of Heavy Load Carrier Equipment Used in the Industrial Mining Environment" Sustainability 13, no. 15: 8672. https://0-doi-org.brum.beds.ac.uk/10.3390/su13158672