
Demand for Storage and Import of Natural Gas in China until 2060: Simulation with a Dynamic Model


The Belt and Road School, Beijing Normal University, Beijing 100875, China
*
Author to whom correspondence should be addressed.
Sustainability 2021, 13(15), 8674; https://0-doi-org.brum.beds.ac.uk/10.3390/su13158674
Submission received: 9 July 2021
/
Revised: 30 July 2021
/
Accepted: 31 July 2021
/
Published: 3 August 2021
(This article belongs to the Section Energy Sustainability)
Abstract
:China has been reforming its domestic natural gas market in recent years, while construction of storage systems is lagging behind. As natural gas accounts for an increasing proportion due to the goal of carbon neutrality, large-scale gas storage appears to be necessary to satisfy the needs for gas peak shaving and national strategic security. Additionally, the domestic gas production in China cannot meet consumption demands, and imports will play a significant role on the supply side. This paper developed a system dynamics (SD) model and applied it to simulate gas market behaviors and estimated China’s gas storage capabilities and import demands over the next 40 years. To achieve carbon neutrality, it is necessary for China to make great progress in its energy intensity and improve its energy structure, which have a great impact on natural gas consumption. Thus, alternative scenarios were defined to discuss the changes in the gas market with different gas storage goals and environmental constraints. The results show that under low and medium carbon price scenarios, natural gas demand will continue to grow in the next 40 years, but it will be difficult to achieve the goal of carbon neutrality. Under the high carbon price scenario, natural gas consumption will grow rapidly and reach a peak in approximately 2040, after which renewable energy will play a more important role to help achieve carbon neutrality. At the peak time, China’s gas storage demand will be 205.5 billion cubic meters (bcm) and import demand will reach 635.4 bcm, accounting for 72.8% of total consumption. We also identified the contradiction between the estimated storage capability, import demand and infrastructure planning. There will be a gap of 28.1–69.3 bcm between the planned storage capacity and simulated demand by 2030, while import facilities may partly strand assets. Finally, we provided some policy recommendations for constructing gas storage and import management and operation systems.
1. Introduction
With China’s commitments to tackling global climate issues (e.g., carbon peak in 2030 and carbon neutral in 2060), clean energy will mainly replace coal and oil in the future. As the main clean, low-carbon energy source, natural gas could become the key alternative energy source to mitigate China’s economic-environmental problems [1].
Due to insufficient local natural gas production, China’s external gas dependence will rise to as high as approximately 65% in 2030 according to estimates by British Petroleum Company (BP) and has brought great challenges to China’s natural gas supply security [2]. Gas storage is an excellent tool for providing supply flexibility and for addressing the problem of possible gas supply cuts [3,4]. However, China’s total underground gas storage (UGS) capacity was only 11.2 billion cubic meters in 2018, accounting for less than 5% of the annual consumption, which is much lower than the world average of approximately 15%. The lack of storage also usually creates gas supply shortage problems with respect to seasonal peak shaving demands [5]. With the increased natural gas consumption in China, the demand for storage and imports will further increase. Consequently, to address these demands, China needs to strengthen its construction of supporting infrastructure, such as underground storage facilities (e.g., depleted gas or oil reservoirs, underground salt caverns or other geological structures), cross-border pipelines and liquified natural gas (LNG) receiving stations [6]. The very high gas storage and import demands in the future may affect the regional Asian market and even global market trends. Therefore, forecasting storage and import demands is of increasing significance, which is conducive to formulating plans to sign appropriate gas import contracts and conduct reasonable planning for the supporting infrastructure [7,8].
Regarding the assessments of gas storage demand and imports, a number of studies have been conducted using different methods. Confort and Mothe [9] assessed Brazil’s required storage capacity by investigating the relationships among storage capacities and the various characteristics of the gas sector via linear regression analysis. They compared the empirical analysis results from 38 countries and summed up the experience of countries with mature natural gas storage systems to predict Brazil’s natural gas storage demand. However, this did not consider the characteristics of Brazil’s own natural gas system, which may result in low effectiveness of the assessment. Hoffler and Kubler [10] estimated the additional gas requirements for underground storage facilities in northwestern Europe until 2030 by extrapolations based on gas production and consumption forecasts. The extrapolation method used is based on the main natural gas macro data, which is simple, intuitive and easy to replicate to other markets, but at the same time, it may not have good market simulation accuracy due to insufficient variables. de Joode and Ozdemir [11] also investigated future gas storage requirements as a source for seasonal flexibility provisioning in northwestern Europe using a game-theory equilibrium model. The model included micro-market entities, such as gas suppliers and consumers. It established a competition-game mechanism between entities, and infrastructure constraints are also taken into consideration. Other models have also been applied to energy and resource problems, such as Monte Carlo simulations [12,13,14], genetic fuzzy systems [15], artificial neural networks [16,17], econometric regression models [18], MARKAL models [19,20], and nonlinear hybrid models [21]. However, the above studies are mostly based on deductions of the historical data of individual variables, which are suitable for short-term forecasting but ignore the feedback mechanisms among the multiple variables of systems, which are helpful for medium- and long-term forecasting.
To study the gas storage demand and import demand, all of the consumption and supply components and influencing factors should be included in the system. For instance, gas consumption consists of residential gas and industrial gas consumption, which are related to population and economic growth, while gas production depends on the proved reserves and recovery efficiency [22]. Therefore, we need to comprehensively consider these factors as a unified system. The system dynamics (SD) approach is well-suited for analyzing systematic problems that contain multiple variables and complicated causal relationships among variables. The SD approach is consistent with traditional economic modelling of dynamic phenomena but employs different terminology and conventions [23]. The most important feature of this method is the feedback structure of the system, which is usually done using causal loop diagrams. A positive feedback drives the system to seek to return to equilibrium after a disturbance occurred in the system. By contrast, a negative feedback may result in a situation where the initial disturbance could be amplified. The model is composed mainly of two kinds of variables: stocks and flows. The operation of the model requires some initial values of variables as input, and the evolution of the system is mainly driven by the correlation between variables and then outputs the results. Various scenarios can be simulated in SD models to observe their different behaviors, which is helpful for policy decision-making [23,24,25,26]. Moreover, SD model pays close attention to the long-term trends in system behaviors, which is in line with our research goals in this study [25,26]. Compared with the other methods mentioned above, the SD model is less dependent on historical data but has higher requirements for the abstraction of the economic relationship of the system. The selection of variables needs to fully consider the market mechanism and the characteristics of the local energy system.
To quantify the natural gas growth trends for China, Li et al. [27] used a system dynamics model to forecast China’s gas consumption, in which the authors believed that China’s gas demand will continue to increase to 340.7 bcm in 2030. The gas consumption forecast by Mu et al. [28] will reach 450 bcm in 2035. These studies have not considered the environmental constraints that have gradually increased in recent years and the impact of carbon emission trading system on energy substitution [29,30]. We thus believe that their forecasts of China’s gas consumption are significantly underestimated. In addition, the above research on gas supply and demand systems ignores the storage part, while storage is the key link to reconcile supply and demand. Moreover, they rarely discuss the feasibility of the prediction scheme in combination with the actual supporting infrastructure conditions.
To fill these gaps, this paper explores the gas storage demands and corresponding import strategies in China. The supporting infrastructure planning and storage management regulations are also discussed to provide support for policy making. The remainder of the article is organized as follows: in the next section, a system dynamics model was developed, and we present the model structure, general description and validity analysis. Section 3 presents the results from alternative scenarios. Section 4 discusses natural gas-related infrastructure planning issues based on forecasted storage and import demand. Finally, we provide the major conclusions in the last section.
2. Method and Modeling
We used the system dynamics (SD) model to construct China’s natural gas supply-storage-demand system. The SD model can abstract and simplify the variables and relationships in the system according to the studied objects and problems and promote the evolution of the system through feedback relationships between variables.
2.1. Model Structure and General Description
We divided the natural gas system into three subsystems: the gas storage subsystem, gas demand subsystem and gas supply subsystem. Gas consumption is mainly attributable to residential consumption and economic activity in the primary, secondary and tertiary industries. Natural gas supplies are derived from national gas production and imports from abroad. In China, since the reserve work for natural gas is mainly managed by large state-owned enterprises in accordance with the national plan, this article does not distinguish between national strategic storage and commercial storage. All variables were included in the different subsystems, and the following provides a detailed introduction of the three subsystems by examining the causal relationships among variables. Historical data for most variables (e.g., population, gas consumption and imports) comes from the National Bureau of Statistics of China and China Energy Statistical Yearbook 2020. The numerical model was constructed by the popular system dynamics software Vensim, which is developed by Ventana Systems. The main task of the model is to simulate and forecast, over the long term, the gas storage and import demand under various alternative model specifications. The corresponding model equations (i.e., functional relationships among variables) are given in Appendix A.
2.1.1. Gas Storage Subsystem
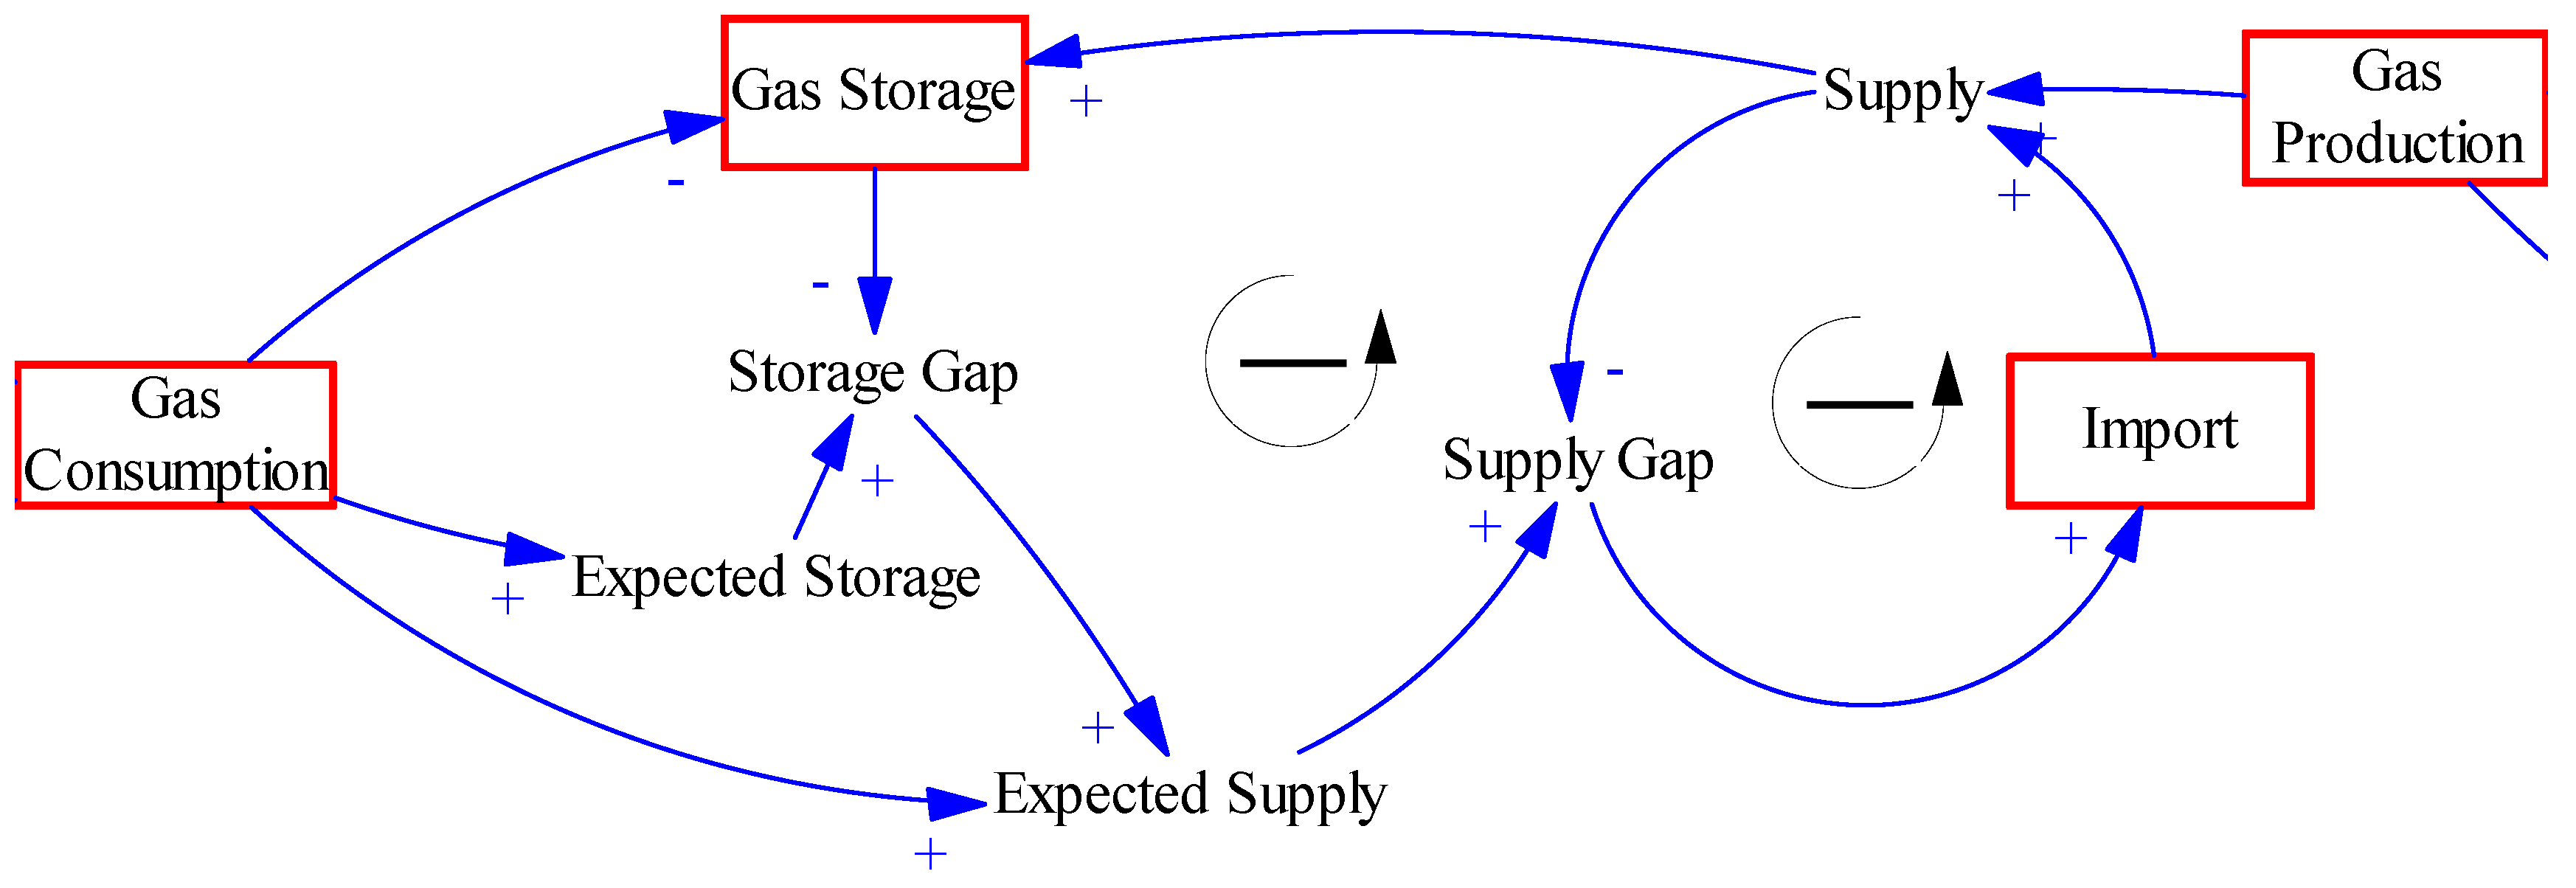
Figure 1 shows the causal relationships among the variables in the gas storage subsystem. A positive sign next to an arrow represents positive causality between variables, and vice versa. For example, there is a positive causal relationship between supply and imports, which is shown by the ‘+’ sign, which means that when gas imports increase, the total gas supply will also increase. The expected storage is determined by the storage ratio, which is a specific proportion of the gas demand, and its world average is approximately 15%. The storage gap between gas storage and expected storage indicates the amount of compensation for the gas storage target. The gas demand and storage gap constitute the total expected supply for the next year. An increase in the supply gap between the expected supply and real supply will boost import demands.
In this subsystem, there are two negative feedback loops (i.e., a feedback structure that could maintain local stability). One is “Supply Gap-Import-Supply-Supply Gap”, and the other is “Gas storage-Storage Gap-Expected Supply-Supply Gap–Import–Supply-Gas Storage”. These two feedback loops provide a “monitoring-early warning-adjustment” mechanism to ensure the dynamic adjustments of the gas storage scales.
2.1.2. Gas Demand Subsystem
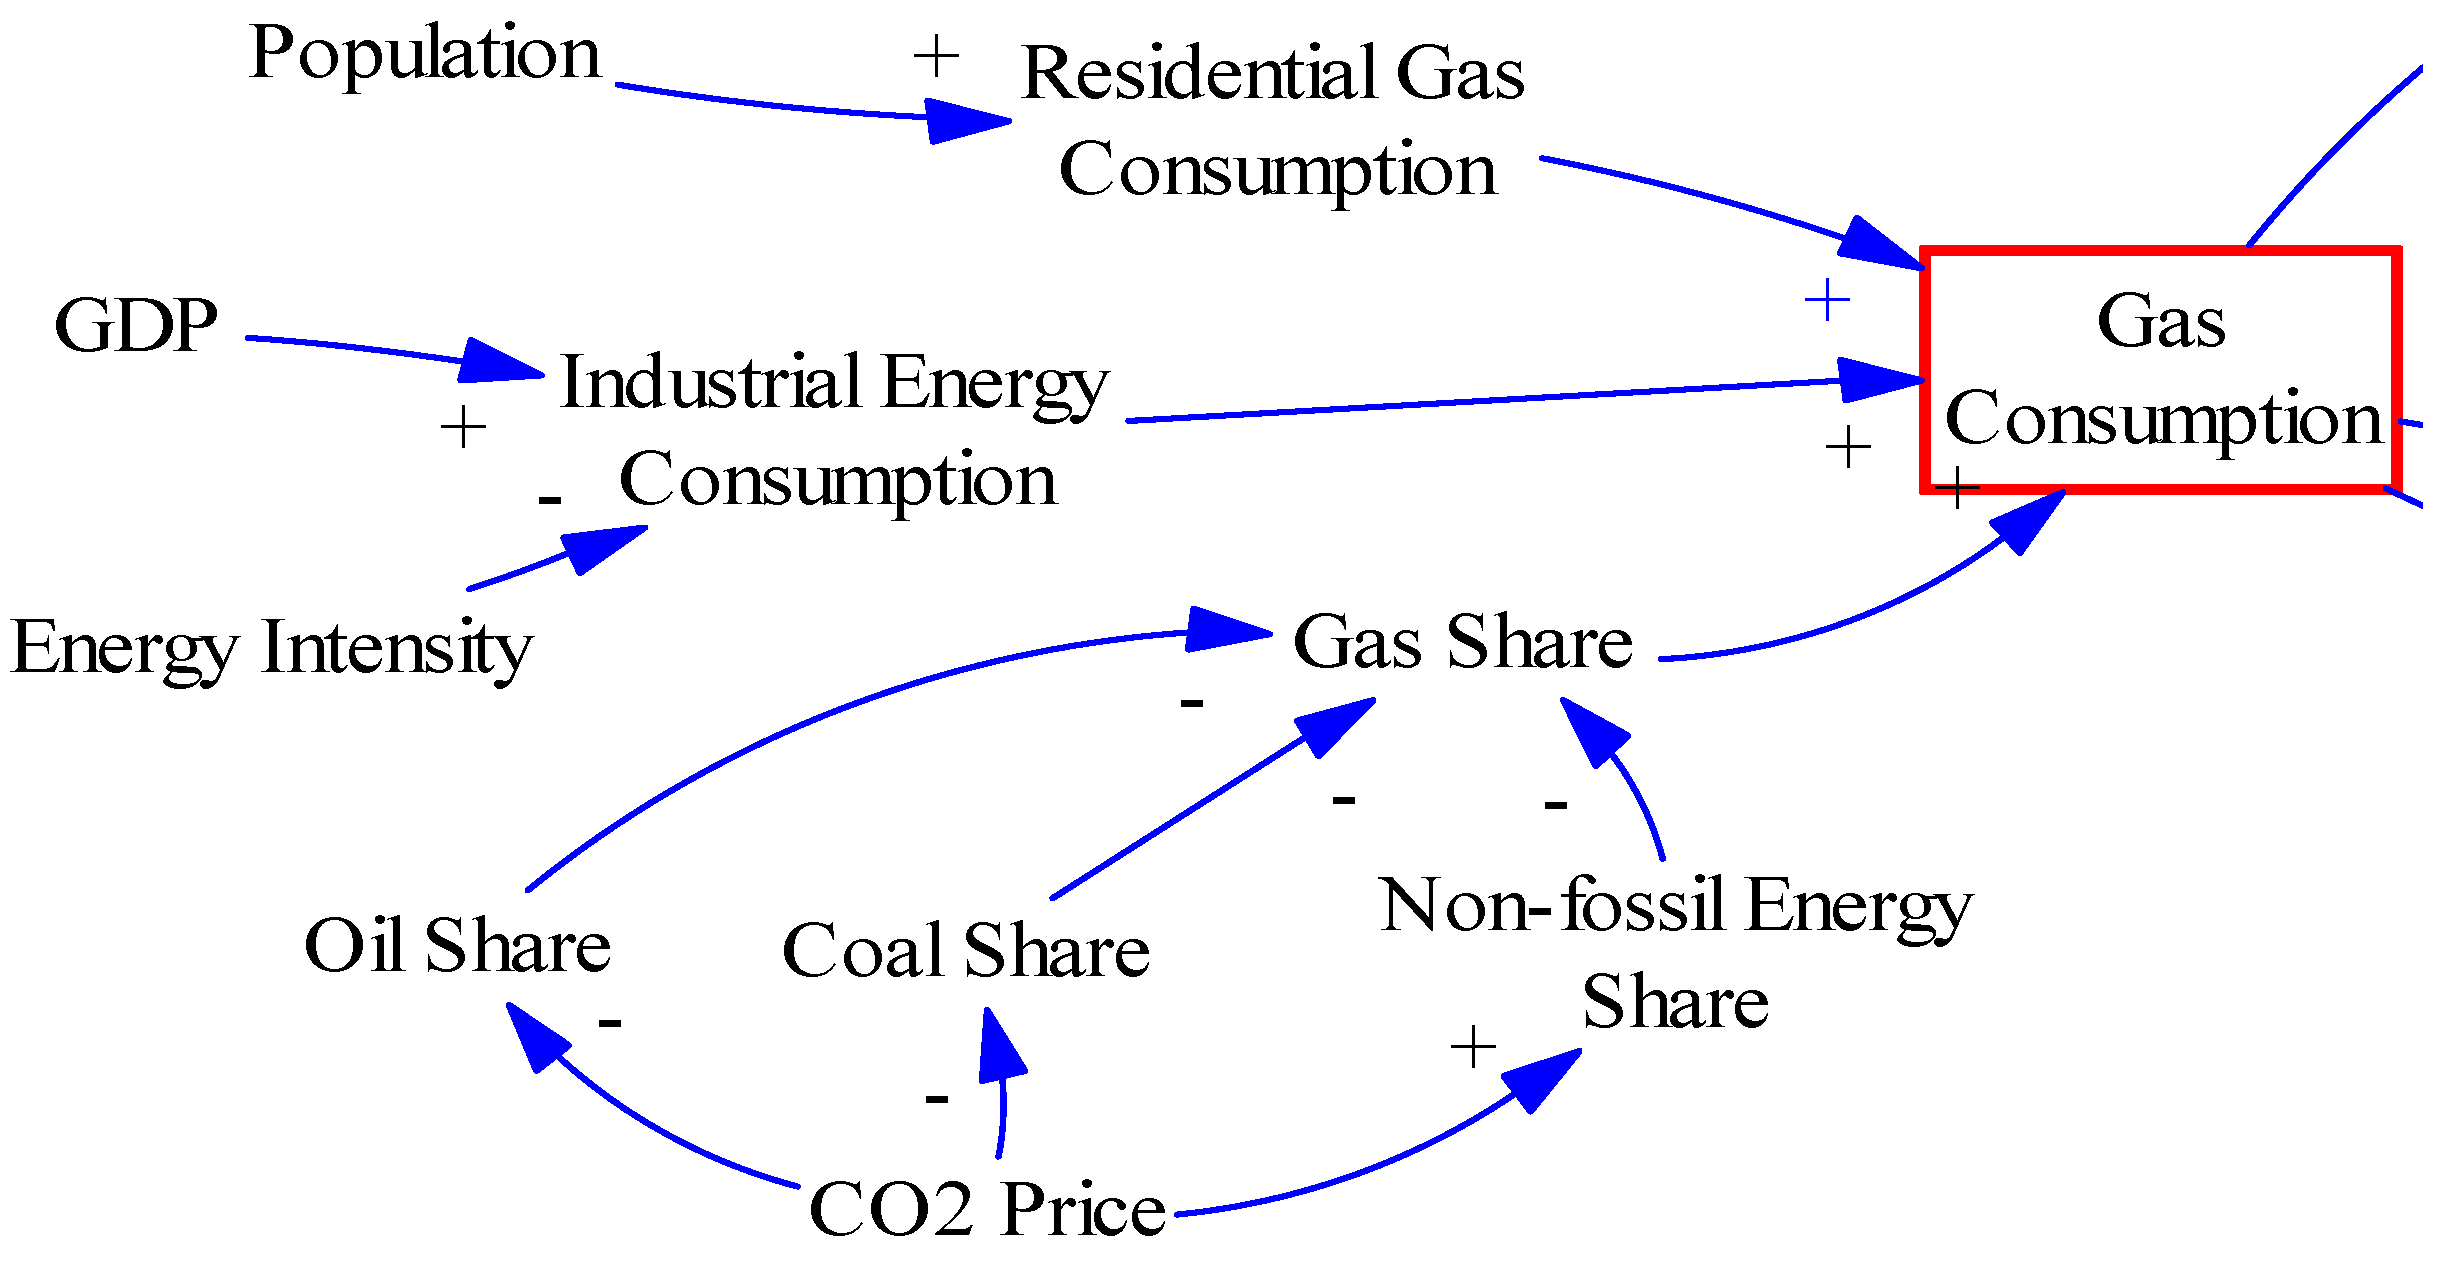
Figure 2 shows the main variables in the gas demand subsystem, which are linked by causal relationships. The total domestic gas consumption consists of residential consumption and economic industrial consumption. Residential gas consumption is mainly generated by the urban population and is determined by the total population and urbanization rate. The birth and death rates determine the population growth rate. GDP growth requires more energy, and a reduction in energy intensity will help to reduce energy consumption. Natural gas and other energy sources have a mutual substitution relationship. Reductions in the proportions of other energy sources (including coal, oil, renewable energy, etc.) will increase the proportion of natural gas used. China began piloting the domestic carbon trading market in 2011. With the gradual improvement of the carbon trading system, increases in carbon prices will inhibit the use of fossil energy and promote the transition to clean energy.
2.1.3. Gas Supply Subsystem
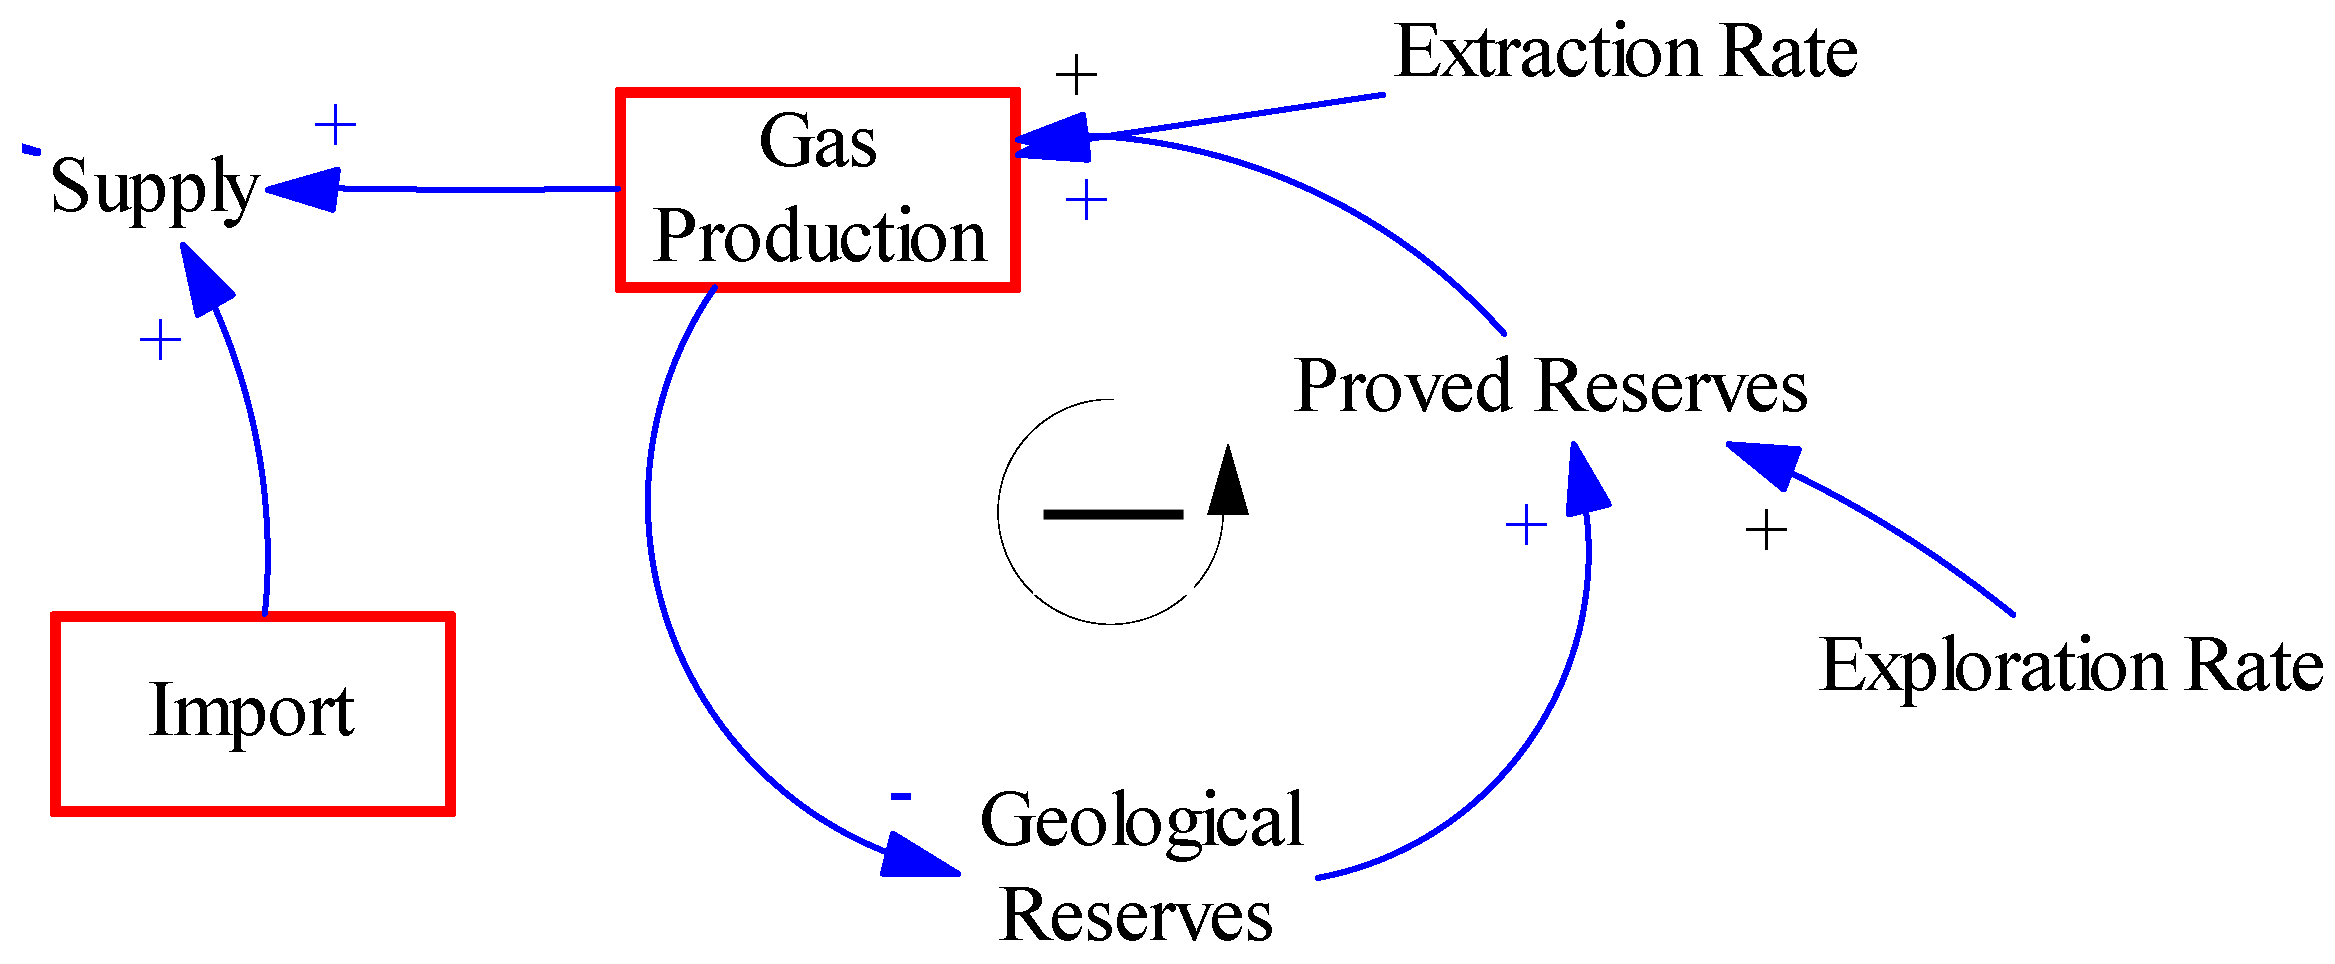
In the gas supply subsystem, similar to the gas consumption demand subsystem, the variables are linked by the causal relationships shown in Figure 3. Gas production, geological reserves and preserved reserves form a negative feedback loop, which is indicated by the ‘-’ sign with an arrow circle in the middle of the loop. The exploration rate determines the annual proved reserves, and the annual gas production depends on the gas extraction rate. These two technical factors were estimated from the historical data. By combining the gas storage subsystem and demand subsystem, increasing gas storage and consumption demands would require more imports. Domestic gas production and imports together provide the total gas supply capacity.
2.2. Model Settings and Assumptions
To abstract and simplify the system variables and components, some assumptions need to be applied:
(1) In a highly competitive market, price should be considered when forecasting demand and supply. However, China’s natural gas market is at an early stage of development, which lacks demand-price elasticity. The Chinese administration has imposed a price control system on natural gas, and gas import companies sometimes even sell gas at prices that are lower than their import prices [31,32]. Considering this, we do not include the price variable in the model.
(2) The remainder that was technologically recoverable proved natural gas reserves were nearly 197 trillion cubic meters, approximately 50 times that of the extracted part [33]. Considering the very large global reserves, we assume that China’s gas imports have good accessibility to meet the rising demand during the next 40 years. In other words, there are no restrictions on external imports.
(3) Because most of the available data only extend to 2019, we did not consider the economic impact of the coronavirus pandemic in 2020 in the model. From a long-term perspective, we assumed that the impact of the epidemic on China’s economy and energy consumption would be short lived; thus, this does not affect the model performance or the long-term energy supply and demand trends.
Moreover, assumptions need to be made for some key variables, such as China’s GDP growth rate and urbanization level. Based on these settings, the simulation results will be obtained as the base case and be used for validity checks.
2.2.1. Assumptions in Storage Subsystem
The data for the developed countries shows that the gas storage scale usually accounts for 15–30% of annual gas consumption. This value reaches approximately 17% in the U.S., 15% in Russia, approximately 22% in Germany and 30% in France [5,34]. Generally, a higher level of external dependence requires a higher storage ratio. According to the summary of [35], we assumed that the relationship between the storage ratio and degree of import dependence is as shown in Figure 4. That is, the storage ratio needs to reach 12% when the import dependency exceeds 30% and should be at least 20% when the import dependency exceeds 50%. When almost all gas is dependent on imports, the storage ratio should reach more than 30%. There is no clear evidence regarding when the storage plan started in China, and reliable storage data before 2017 are not available; thus, we assumed that the amount of gas storage was zero before 2017 and that the storage plan was implemented in 2017. A storage buffer period of 5 years was defined to achieve the storage target. A 5-year period was adopted because China typically uses 5-year periods to achieve its goals and plans, such as the “14 Five-Year Plan”.
2.2.2. Assumptions in Demand Subsystem
Economic growth determines the energy consumption level for economic activities, and China’s GDP growth rate in the future will be assumed by referring to the Development Research Center of the State Council and BP Energy outlook 2020 [2], as shown in Table 1.
Although China’s energy intensity (energy consumption per unit of GDP) in 2019 dropped by approximately 38% compared to 2005, it was still twice that of the United States. China is closest to the United States in terms of economic size; thus, we assumed that China’s energy intensity will drop by half by 2060 to help reduce energy consumption and carbon emissions, with an average annual decline rate of −2.0%.
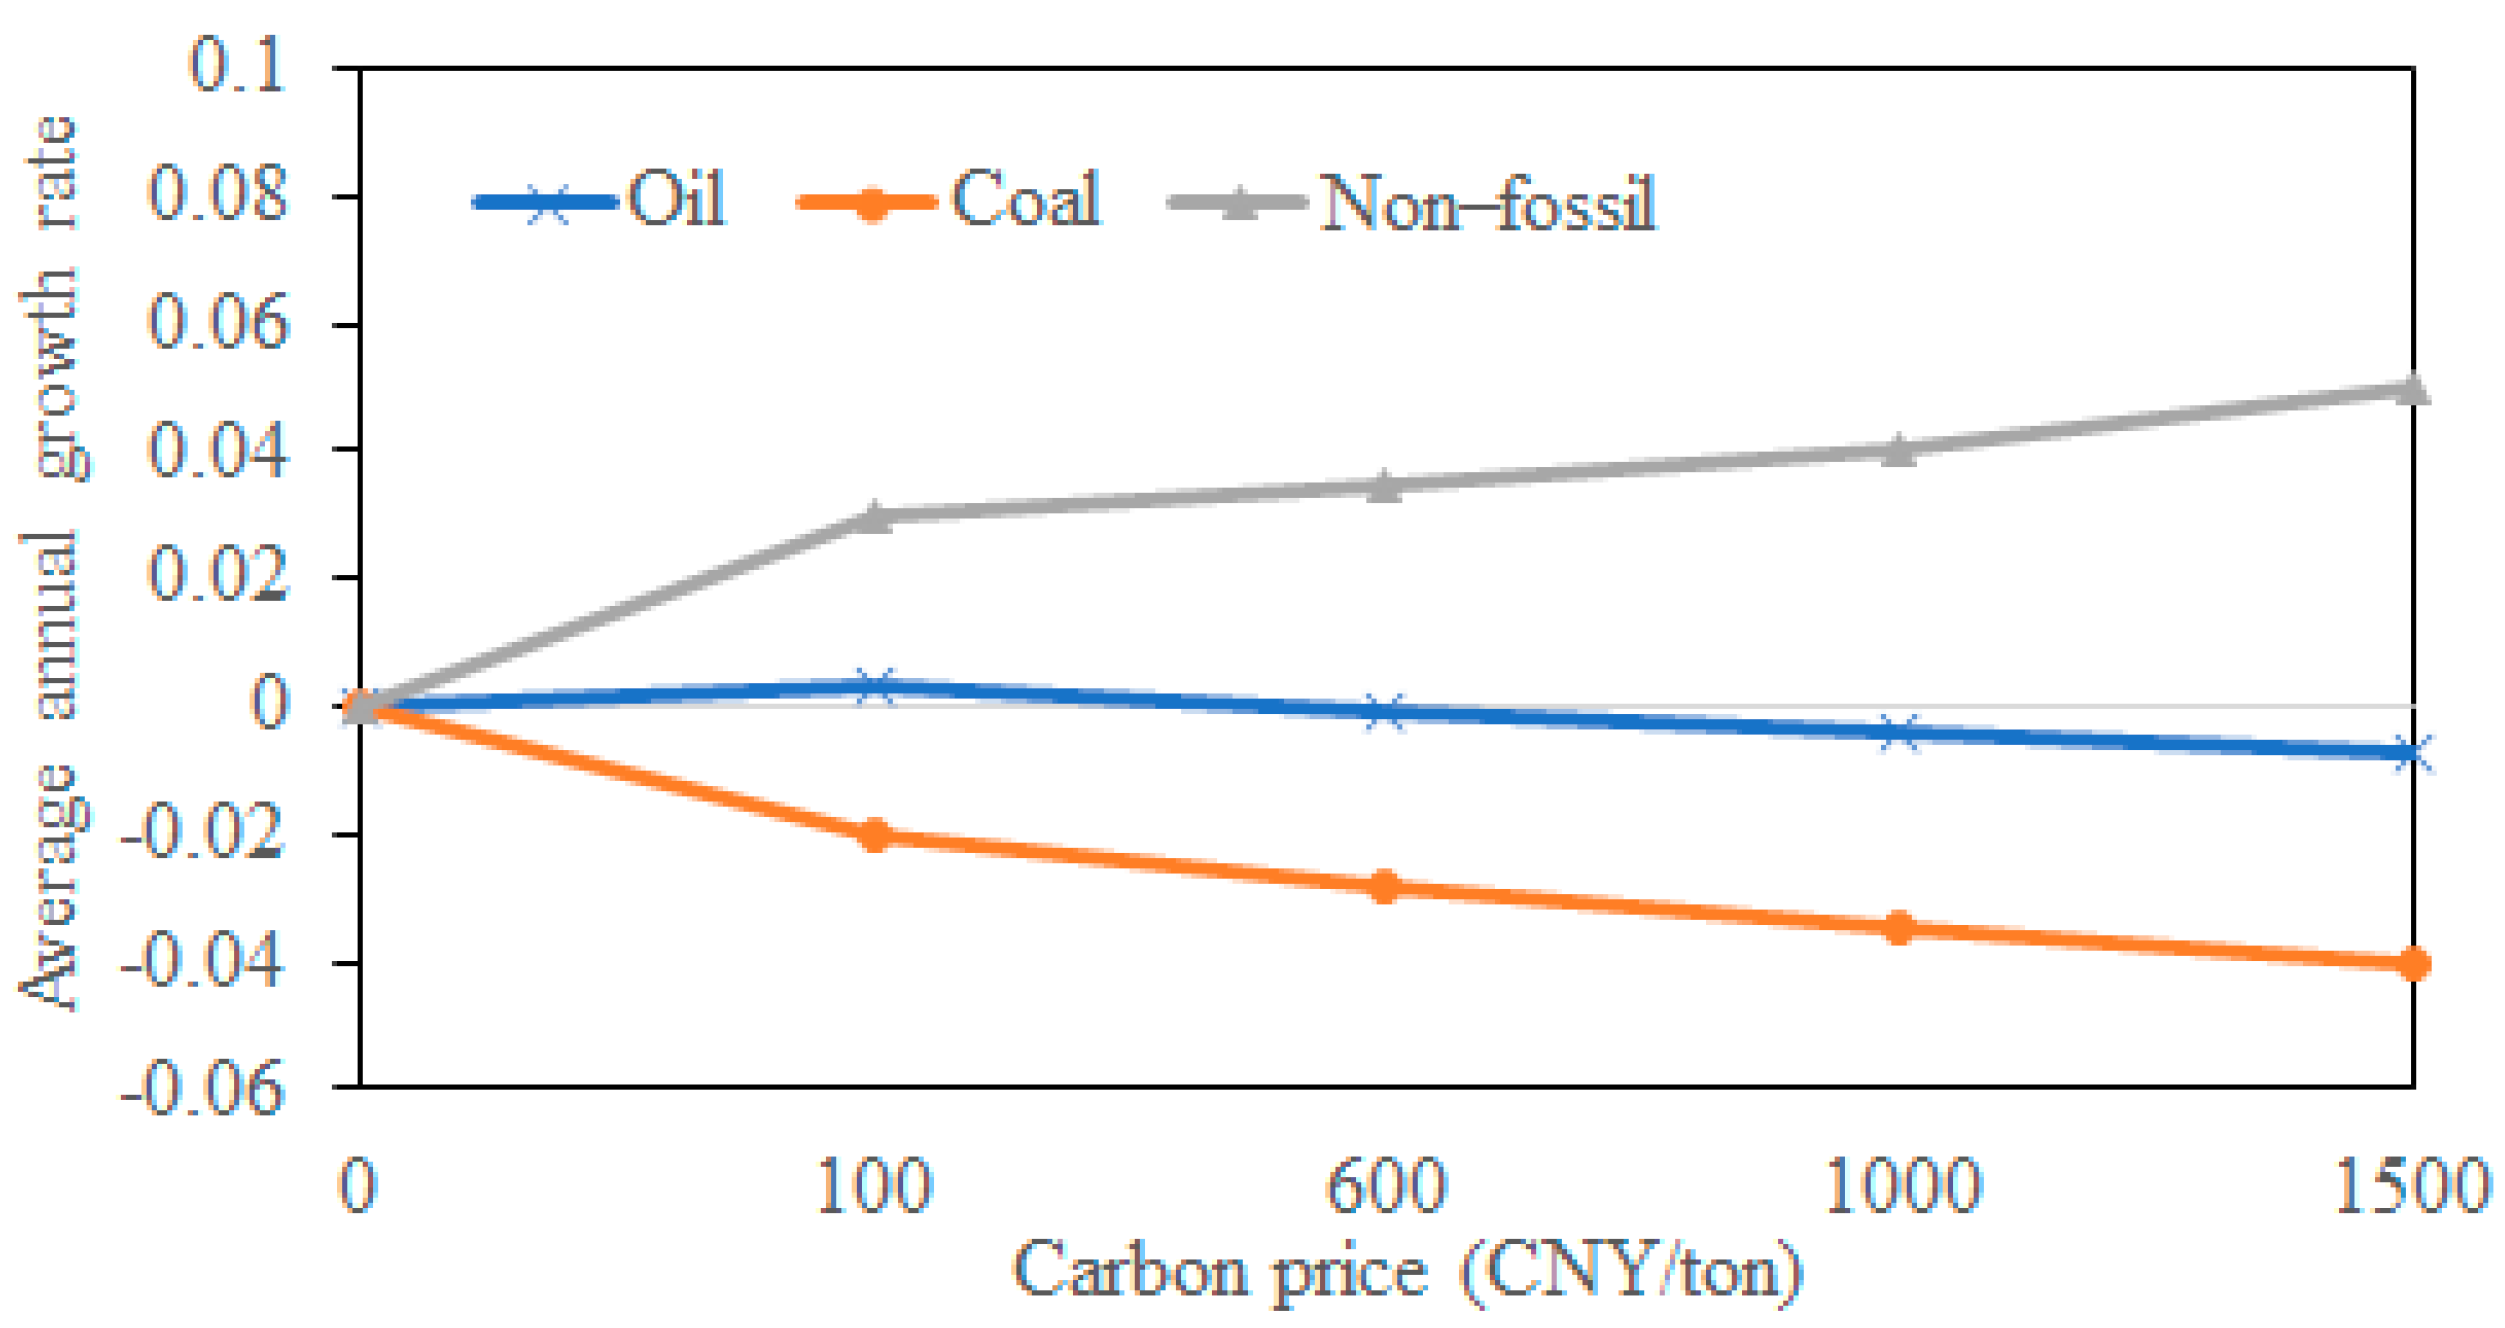
Fossil energy consumption produces greenhouse gas emissions and harms the climate and the environment. More and more countries have introduced environmental policies to promote the use of green energy [36]. In the context of carbon neutrality, China has introduced policies and measures such as “coal to gas” to promote this energy transition, and at the same time, it is gradually improving the carbon trading market to adjust the energy structure. Higher carbon price is considered to promote the replacement of high-carbon energy by clean energy [30]. In this article, carbon price is assumed to be a linear function of the growth rate of each energy share. By referring to the results of Wang [37] (which measured the impact of changes in carbon prices on China’s energy substitution from the perspective of energy equipment capacity investment), we estimated the relationship between carbon prices and the growth rate of energy share. As shown in Figure 5, the data pairs for coal are (100,−0.02), (600,−0.028), (1000,−0.035) and (1500,−0.04); for oil: (100,0.0033), (600,−0.001), (1000,−0.004) and (1500,−0.007); and for non-fossil energy: (100,0.03), (600,0.035), (1000,0.04) and (1500,0.05). The average carbon price in China’s pilot market basically fluctuates between 20 and 80 CNY/ton (Data from Shanghai Environment and Energy Exchange). The national carbon market of China was just established in July 2021, and the carbon price is floating around 50 CNY/ton. Thus, the carbon price in the model for the base case is set to 50 CNY/ton. With the establishment of China’s national carbon market, under the pressure of carbon neutrality, carbon price is believed to rise in the future.
Residential natural gas consumption is mainly determined by the urban population. With the increase in per capita income, the urbanization rate continues to increase, and people’s ability to buy energy is also rising [38]. Therefore, the urbanization rate is assumed to have a correlation with GDP per capita, and a regression was performed on data from 2005 to 2019, which is reported as a functional relationship by Equation (A4) in Appendix A. Then, a regression between Residents Energy consumption per capita and GDP per capita was also reported by Equation (A6) in Appendix A.
The death rates were relatively stable from 2005 to 2019, according to historical data, and were set to an average value of 0.007 in the model, shown in Table 2. As China’s birth rates have continued to decline in recent years, which fell to 0.008 in 2020 from 0.0124 in 2005, the average annual rate of decrease was −2.9%. This is closely related to the strict birth control measures implemented by China in the past (one-child policy from 1979 and two-child policy from 2016). With the implementation of the three-child policy from June 2021 in China, this downward trend is expected to slow down in the future. Chinese population experts predict that the population will peak around 2030; we thus assumed that the birth rate will drop to 0.007 by 2030 (the same as the death rate), with average annual rate of decline of −1.3%. The Chinese government could completely abolish birth control measures around 2030 to prevent population aging. Based on this, we assumed that the average annual rate of decline in fertility will further drop to around −0.5%, which will reduce the birth rate to 0.006 by 2060.
2.2.3. Assumptions in Supply Subsystem
The total natural gas supply is obtained from local production and imports. Import volumes are demand-driven, while local production is also limited by the extraction technology. The exploration and extraction rates indicate the technology level in the gas production processes. The values between 2005 and 2018 were estimated from historical data, shown in Table 3. The exploration rate has remained relatively stable in the past 15 years, so we assumed that in the next 40 years it will be consistent with the past level, stable at 0.0075. The extraction rate is assumed to grow slowly based on historical trends, which allowed it to grow to 0.04 by 2060 from 0.03 in 2019.
2.3. Validity Check and Simulation Results for the Base Case
The model simulation period is 2005–2060, where 2005–2019 is the check period and 2021–2035 is the forecast period. Most of the historical data before 2019 were obtained from the National Bureau of Statistics of China and China Statistical Yearbook 2020 [39]. Figure 6 shows the simulation results of our model and the historical data for gas consumption, production and imports, which are also listed in Appendix B. By using the Mean Absolute Percentage Error (MAPE) method, the error accuracy of the simulated consumption, production and imports is 2.1%, 1.8% and 9.1%, respectively, which means the simulation results fit well with the historical data.
Table 4 lists some studies that have used different methods to assess the demand for natural gas storage. Confort and Mothe [9] used regression analysis to evaluate the relationship between natural gas storage and production, consumption and other factors. This can only be used for short-term forecasting and cannot conduct scenarios analysis, and the error is high. Hoffler and Kubler [10] adopted top-down extrapolation method, which is similar to the system dynamics idea in this paper, but due to fewer variables, its depiction of the natural gas system is vague and cannot meet the prediction accuracy. de Joode and Ozdemir [11] adopted the market-based game-theory equilibrium model, which is suitable for long-term prediction, but the prediction accuracy cannot be guaranteed, and energy substitution and environmental constraints are not considered in the model. Artificial neural networks [17] have good prediction accuracy but over-rely on historical data and cannot evaluate the long-term system development trend caused by multi-factor changes. In summary, the simulation results in this paper prove the validity of the proposed model, which is very suitable for the research of natural gas systematic problems.
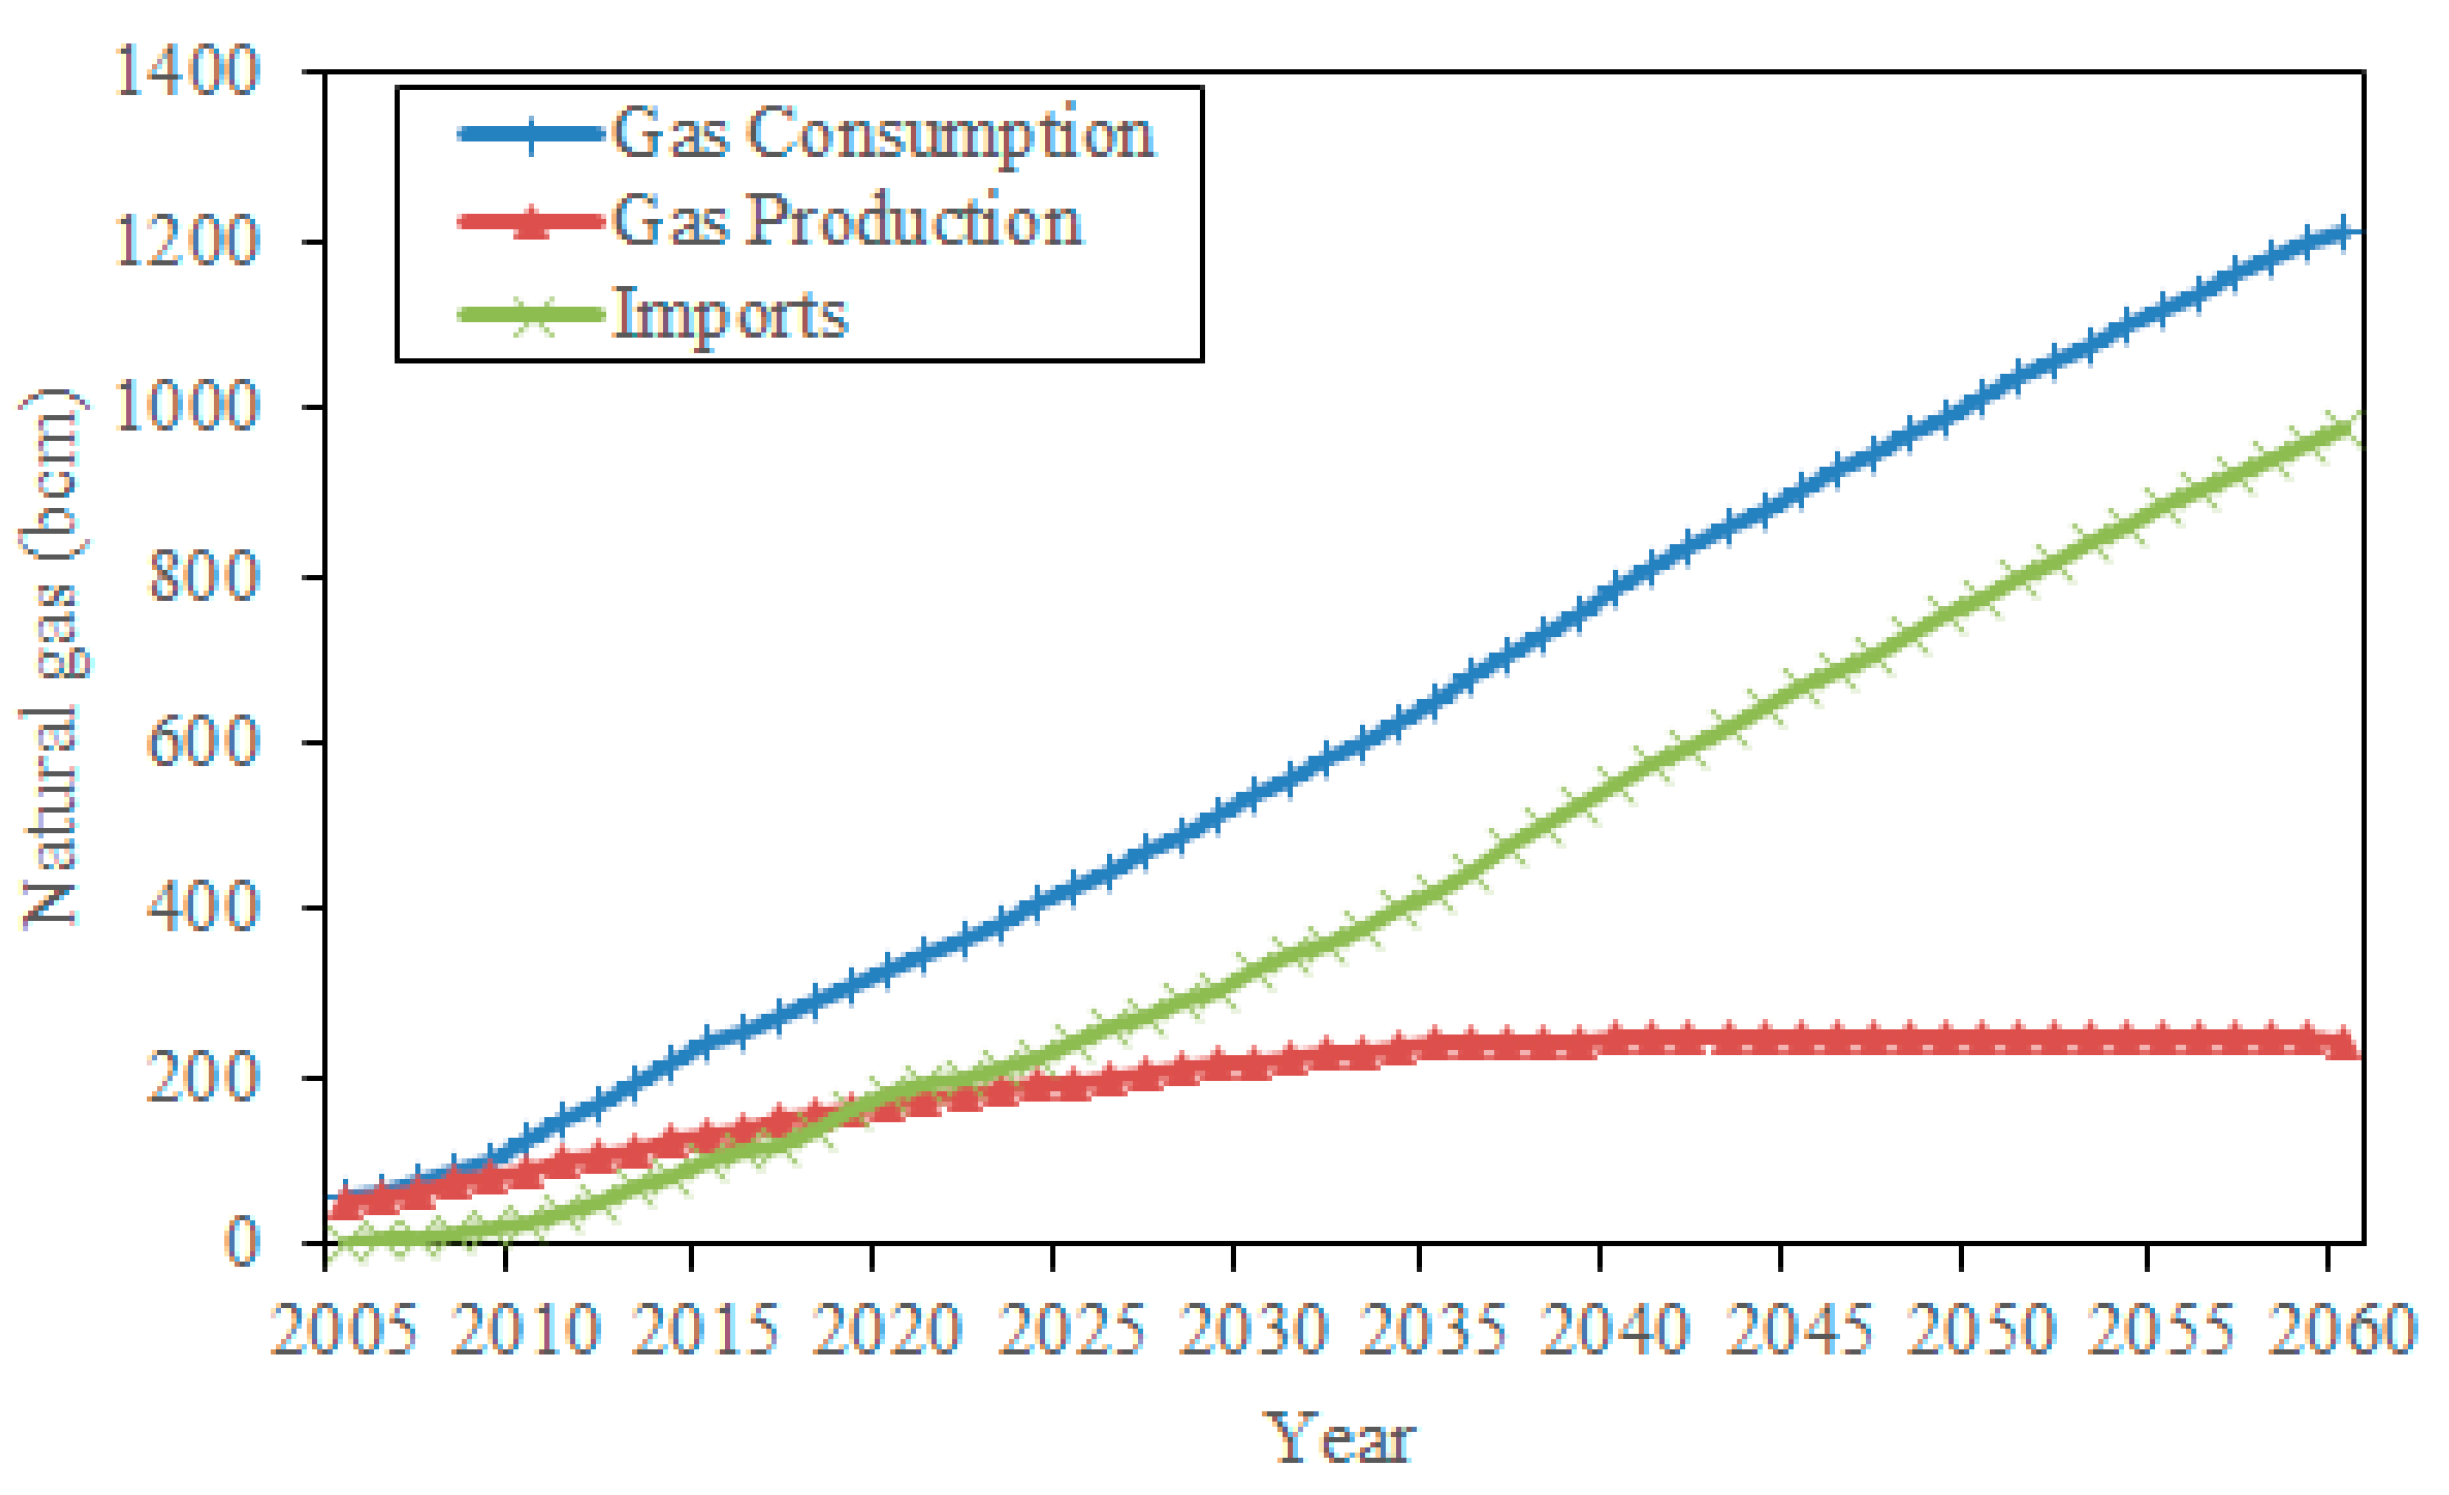
Figure 7 shows the simulation results of the base case for gas demand, production and imports before 2060; the detailed simulation results are listed in Appendix B. China’s natural gas consumption will grow at an annual average rate of 4.6% from 2019 to 2040 and reach to 782 bcm, and this number will continually rise to 1213 bcm by 2060. The study of Li, Dong, Shangguan and Hook [27] predicted that China’s gas demand will reach 340 bcm in 2030, and the predicted value in Mu, Li and Hu [28] is 450 bcm in 2035. In fact, China’s gas consumption in 2020 has already exceeded 320 bcm. The lack of energy substitution and environmental constraints in these studies has led to a greatly underestimation of the development of natural gas market. In the simulation of our model, the natural gas demand is predicted to reach 536.7 bcm in 2030 and 651.8 bcm in 2035. In the absence of major advances in production technology, the annual production rate will reach its peak of 248 bcm in approximately 2045, and gas imports will rise substantially, which increase China’s dependence on external gas. Figure 8 shows that the level of import dependence will reach 70% in 2040. Due to the growing natural gas demand and high import dependency in China, construction of large amounts of gas storage will be essential to address energy supply issues. For the 15% storage goal, the natural gas inventory will reach 93.6 bcm by 2030, which requires many reserve facilities to accommodate this goal.
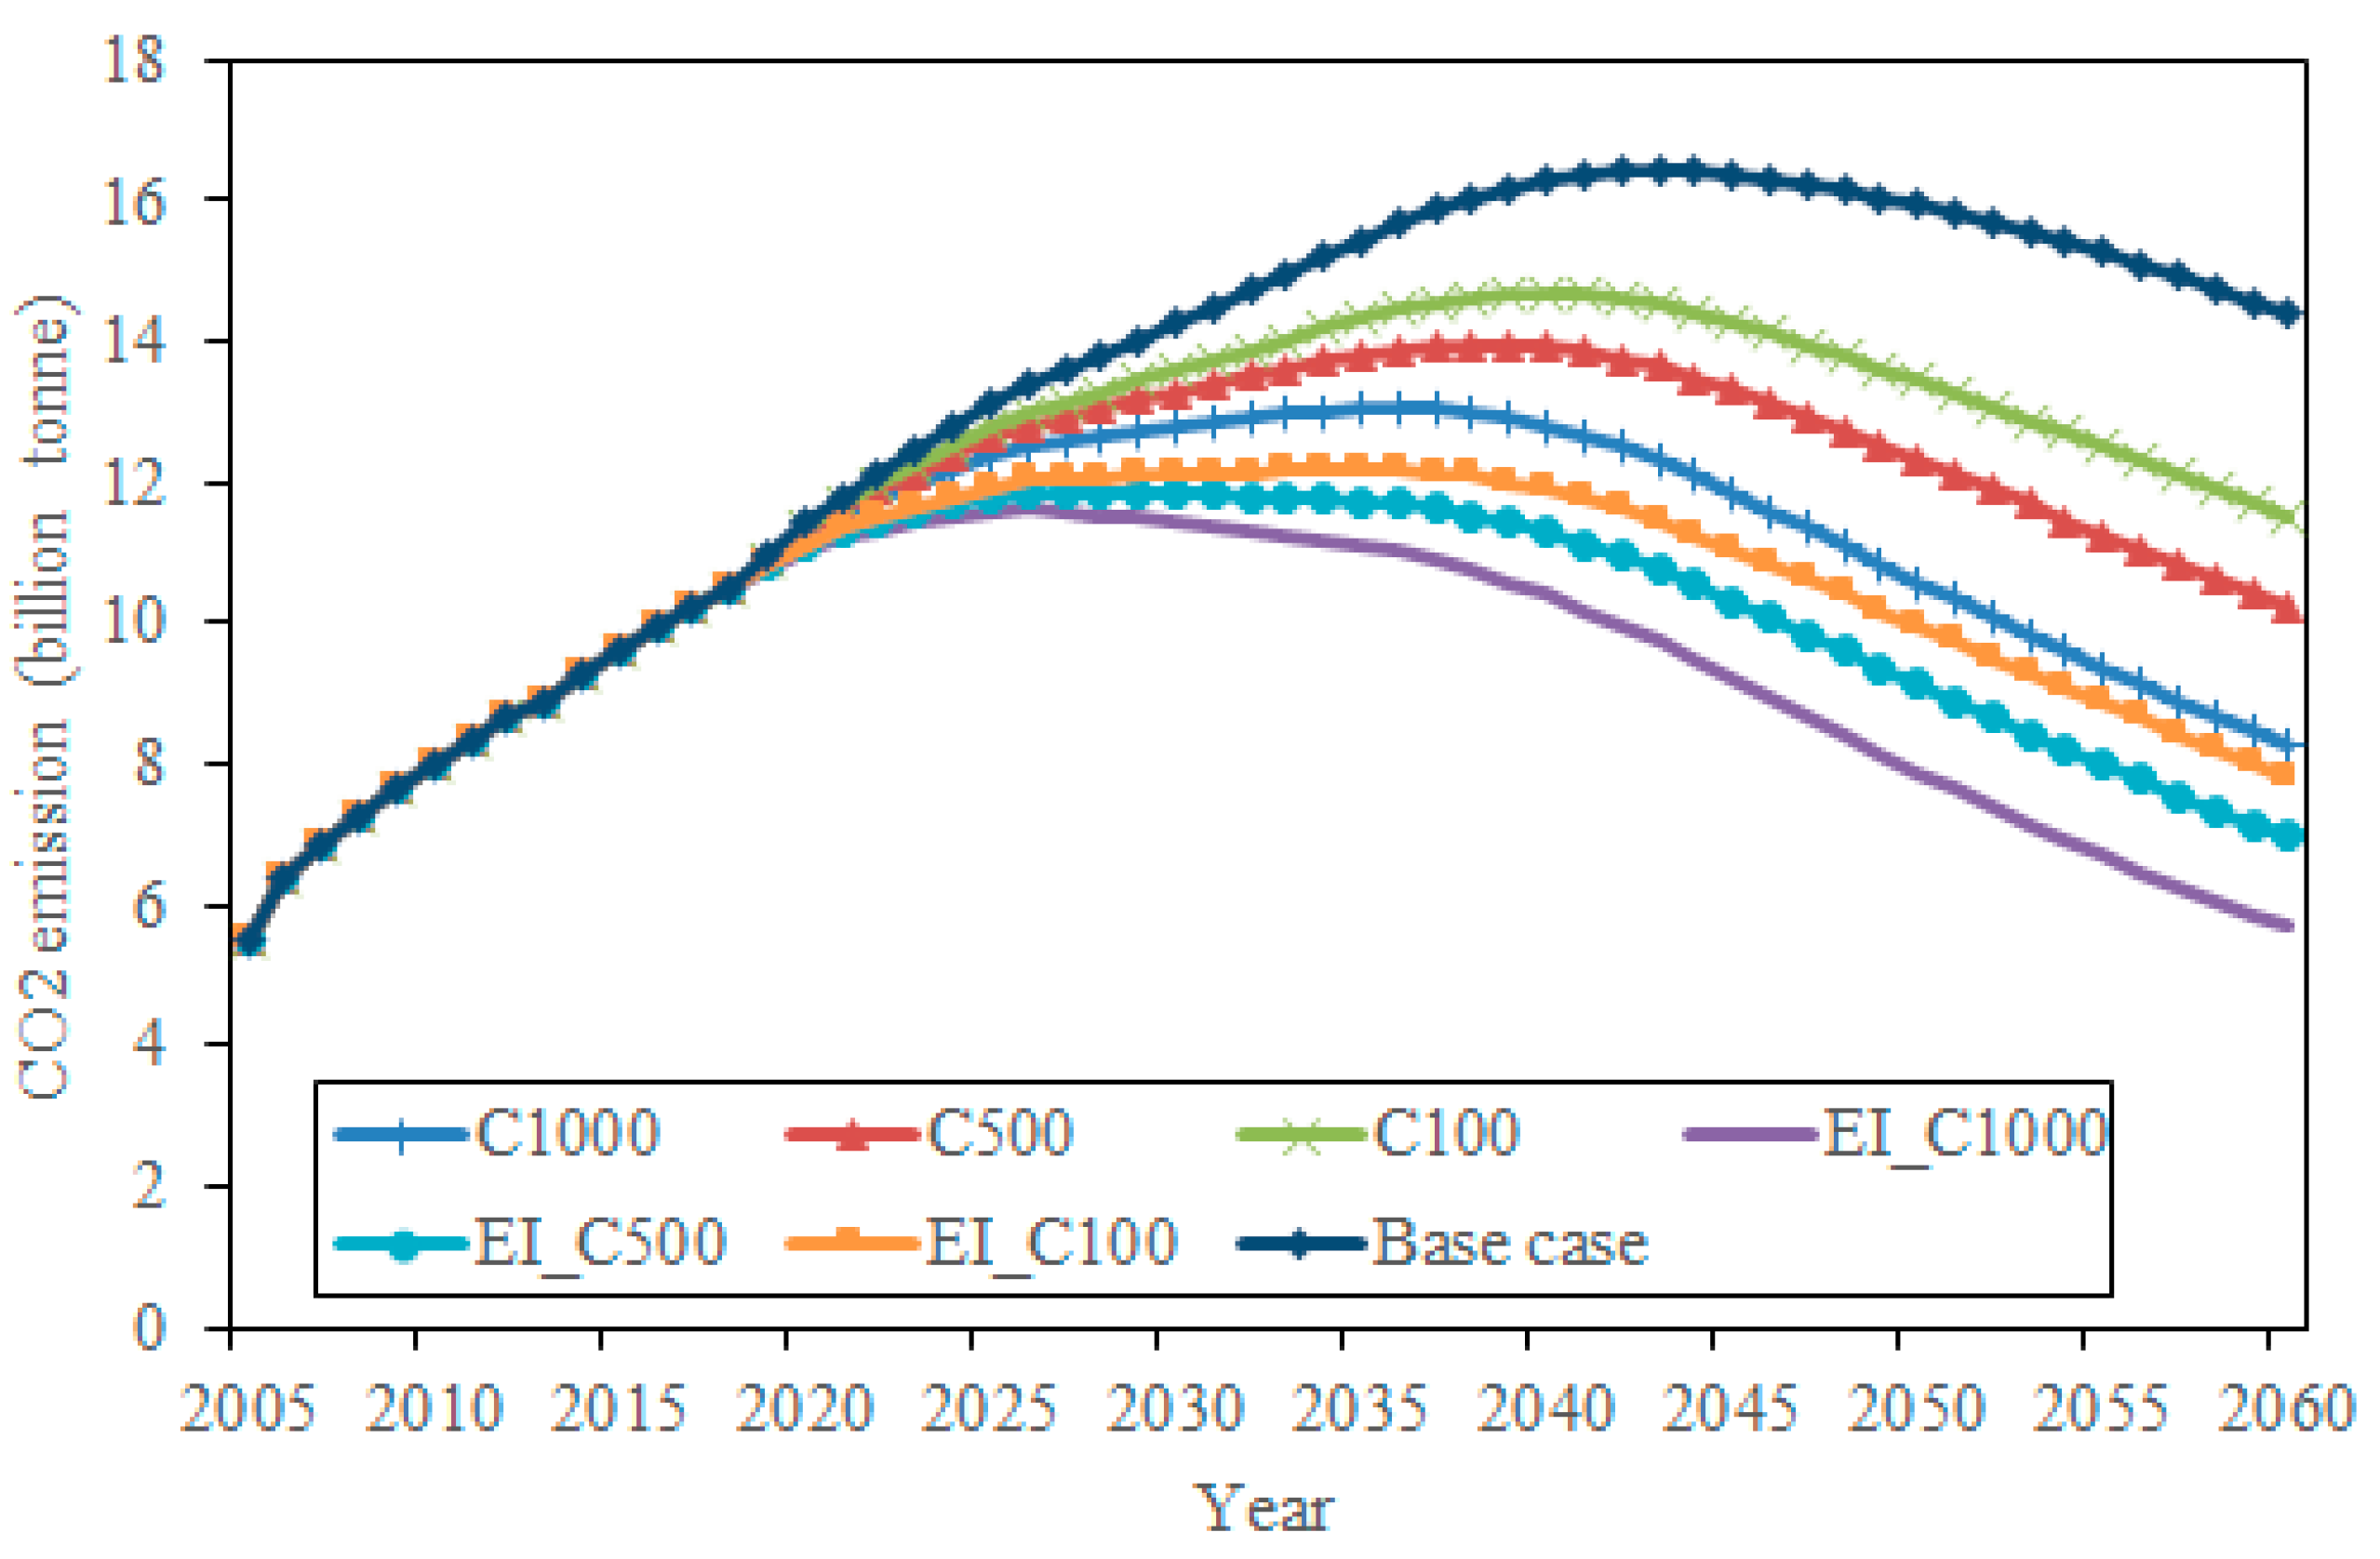
In the base case, the production of CO2 from primary energy consumption will peak at approximately 2042 and reach 16.4 billion tons; then, by 2060, it will drop to 14.4 billion tons. This is a long way from China’s aim to reach peak emissions before 2030 and achieve carbon neutrality by 2060. In Section 3, we will discuss the impacts of different energy structure adjustments and environmental constraints on the natural gas demand in the context of carbon neutrality and the corresponding natural gas storage and import demands.
3. Analysis of Alternative Scenarios
In the base case, the energy intensity growth rate was set to −2%, and the carbon price was 50 RMB. In the next 40 years, a higher energy intensity decline rate of −3% was considered with respect to the future accelerated industrial upgrading of China. To reduce carbon emissions, gas consumption might rise sharply along with its substitution for coal and may also decline due to the growth in renewable energy use. Carbon prices play a key role in the adjustment of the energy structure. Then, by referring to the development of European carbon markets and the high carbon prices, such as Sweden’s carbon price of up to US$125 (about 800 CNY) per ton, we assumed three future carbon price scenarios, namely, 100 RMB/ton, 500 RMB/ton and 1000 RMB/ton, to characterize the low, medium and high levels of environmental constraints, respectively. The corresponding combination scenarios with settings are shown in Table 5.
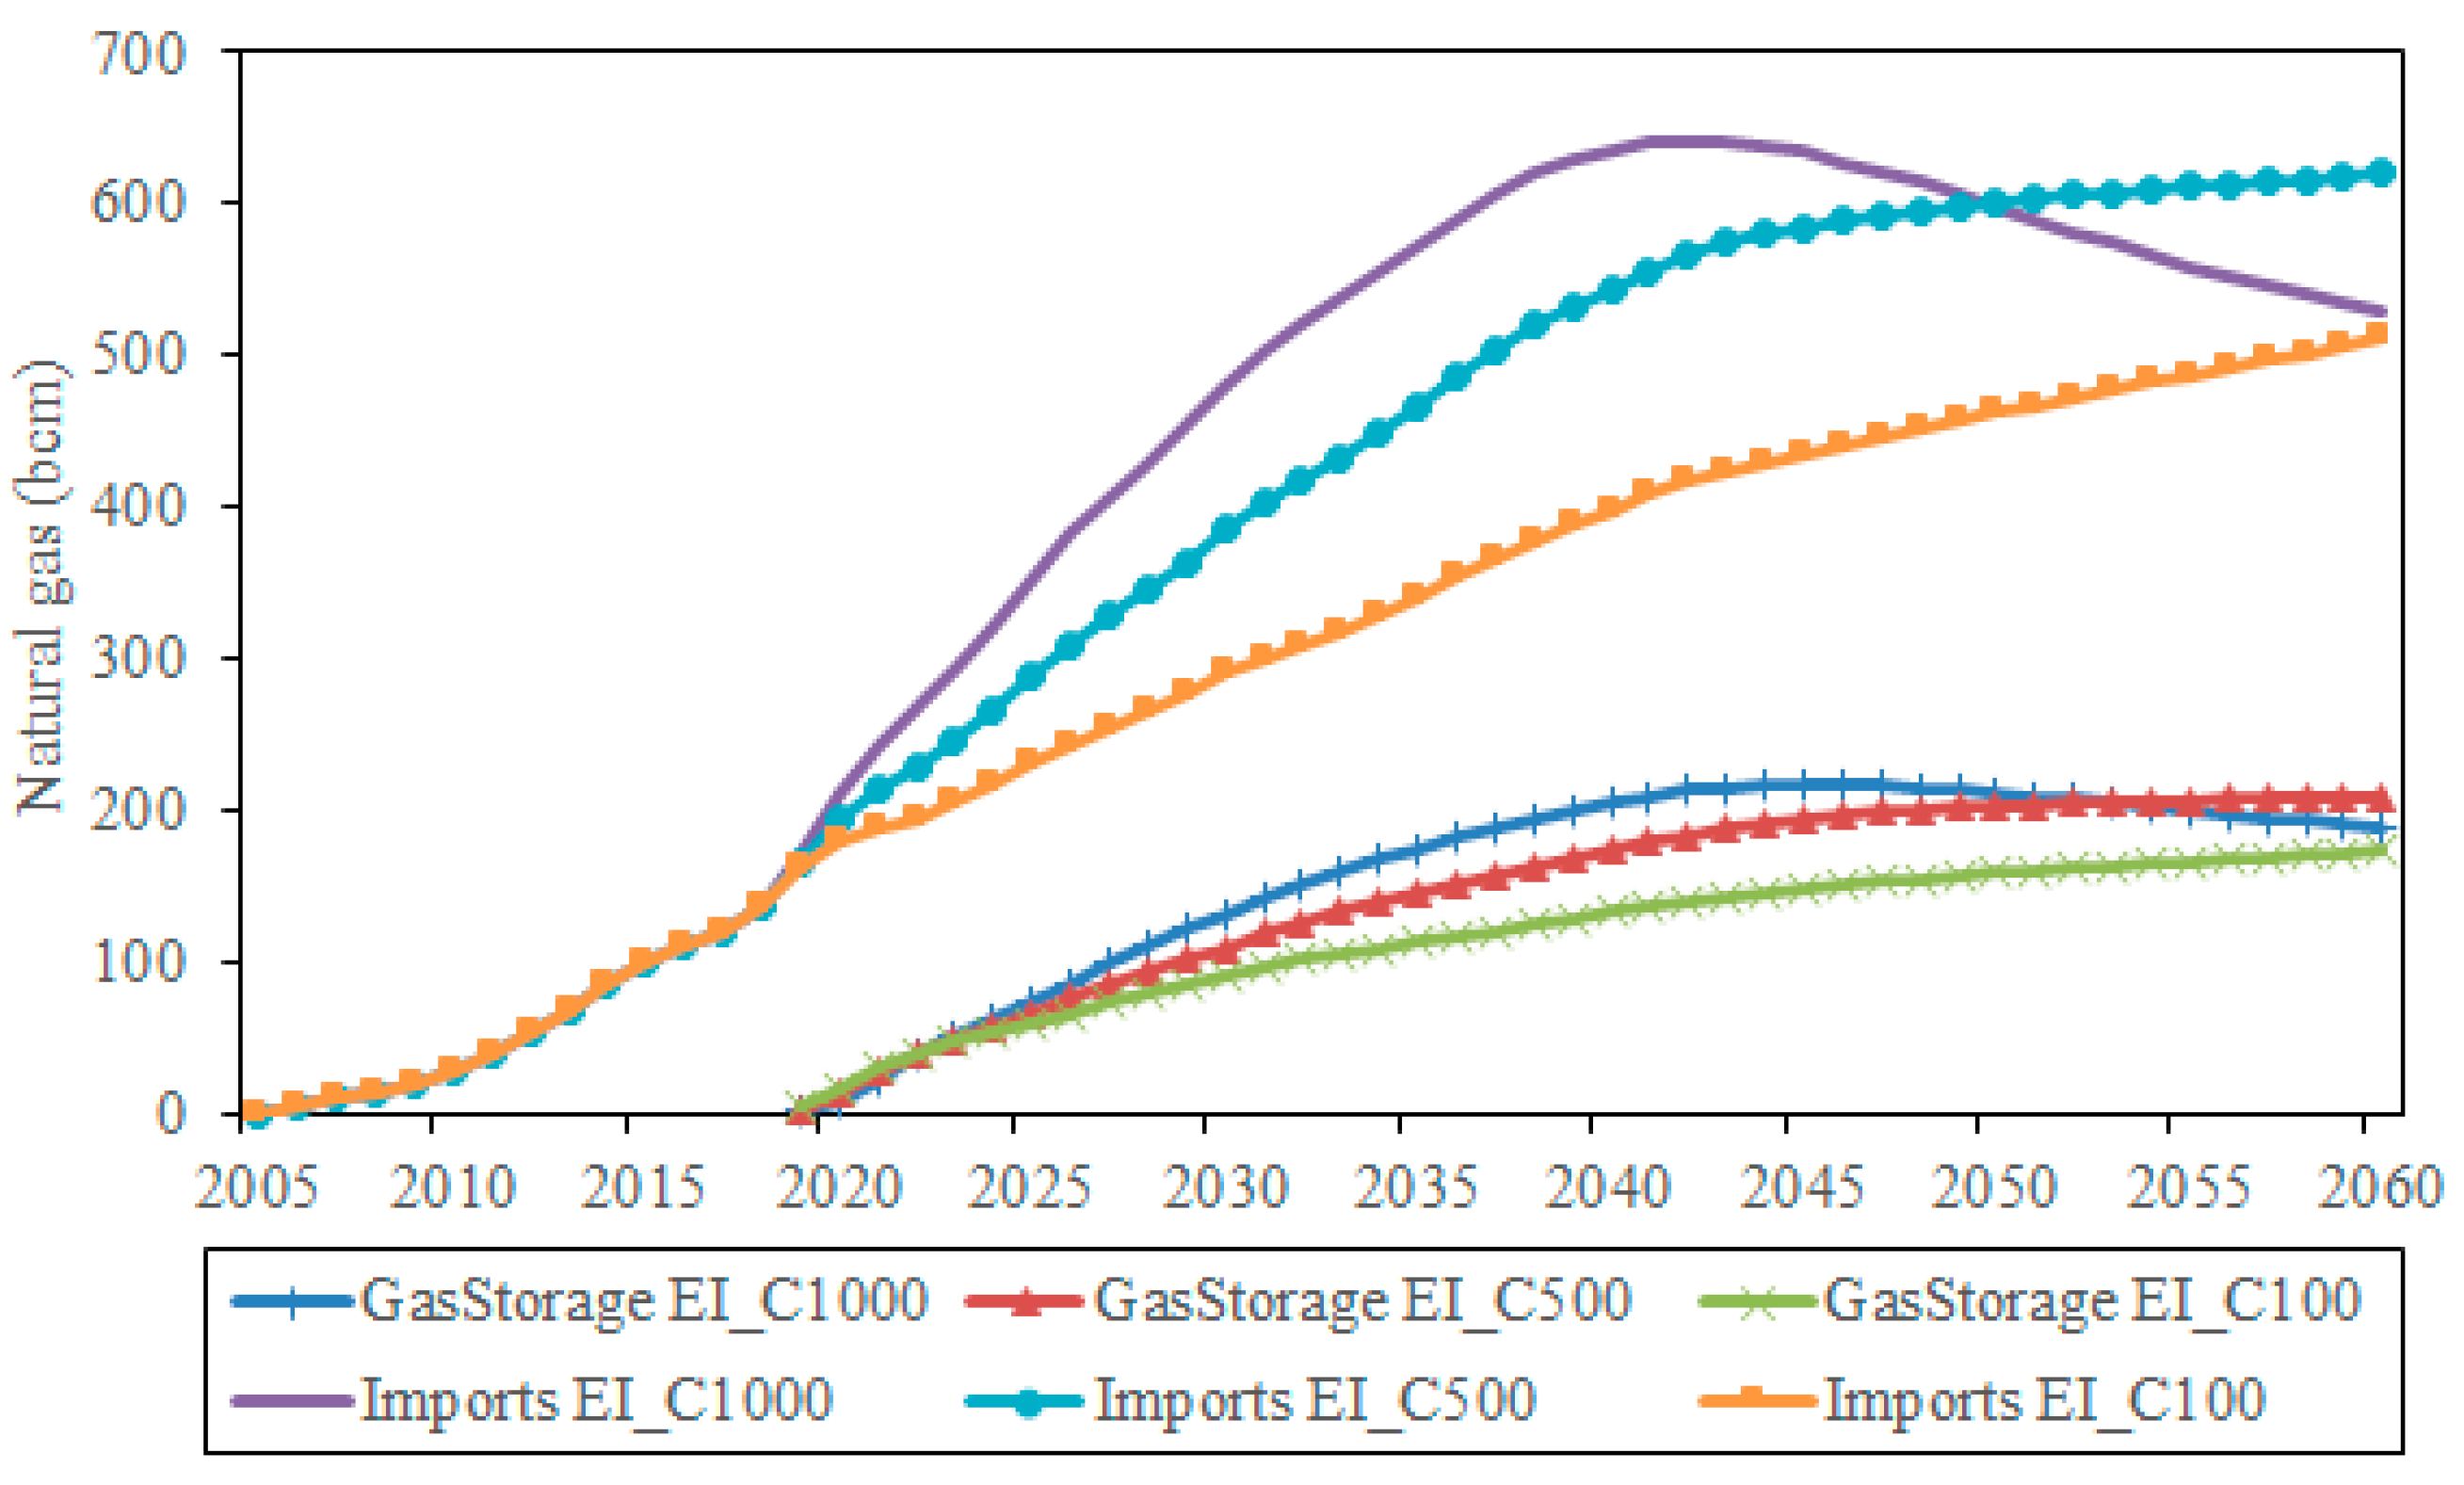
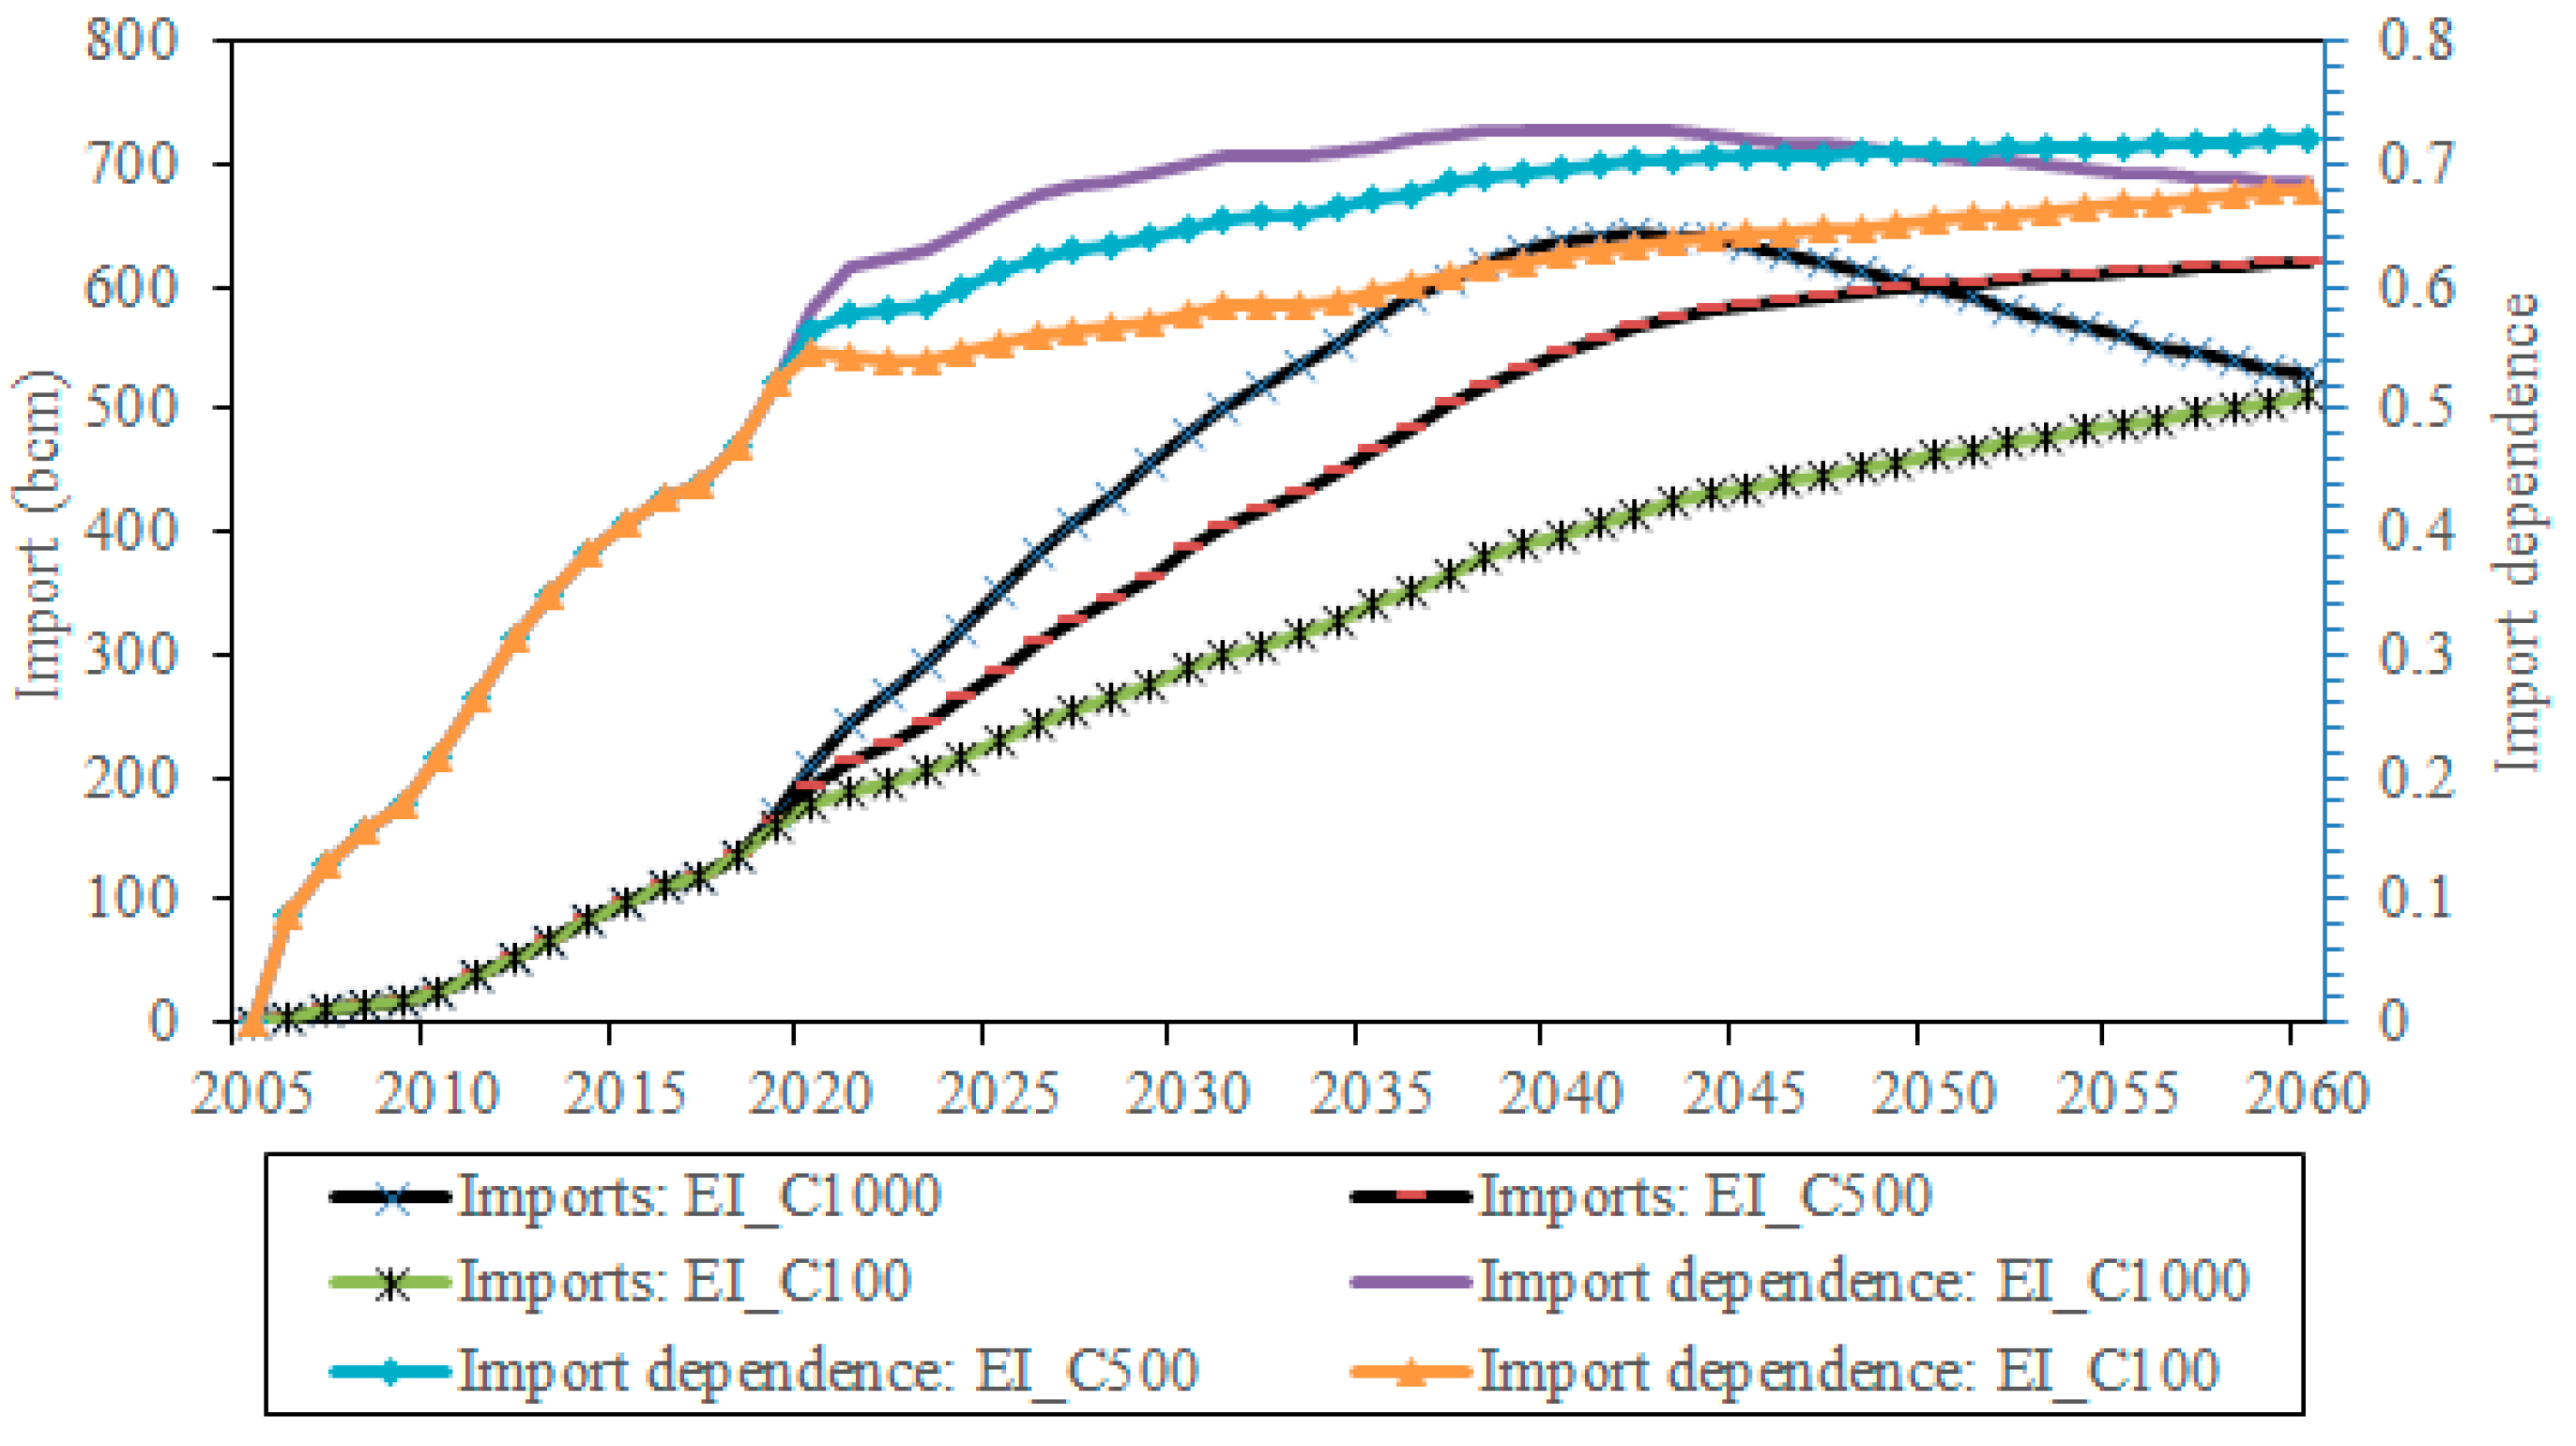
Figure 9 shows that an accelerated decline in carbon intensity will help achieve the peak of carbon emissions in 2030, and the high carbon prices will help to achieve the energy transition, increase the proportion of clean energy, reduce carbon emissions per unit of GDP and help to achieve carbon neutrality by 2060. On the whole, EI_C100, EI_C500 and EI_C1000 are more feasible for the carbon neutral route and will be used as the key analysis scenarios. Figure 10 and Figure 11 show the dynamics of natural gas consumption, storage and import demand for the EI_C100, EI_C500 and EI_C1000 cases. In all of three cases, the growth in gas consumption in the next 20 years will be very rapid. In 2030, natural gas consumption will be between 500–690 bcm; storage demand will reach 88–130 bcm; import demand will be 290–480 bcm; and at that time, the import dependence will rise to 58–70% (see Figure 11). In case EI_C1000, natural gas consumption will nearly double and reach a peak at 850 bcm in approximately 2040, and higher renewable energy use will compress the natural gas growth space after 2040. The storage demand will reach a peak in approximately 2045, and then import pressures will drop, but import dependence will still remain at high levels, i.e., above 60% before 2060.
4. Discussion
The storage strategy requires large-scale underground gas storage facilities, and the import demands also need to be satisfied by pipelines and LNG receiving facilities. Infrastructure has the characteristics of large investments, long construction periods and high operation and maintenance costs. Therefore, it is very important to plan the infrastructure construction in combination with the storage strategy to avoid the occurrence of insufficient facility capacity or asset stranding [40].
China has managed 27 natural gas storage reservoirs with approximately 11.2 bcm of working gas volume by 2018, which accounted for less than 5% of total gas consumption. The gas storage projects in China are planned to expand the working gas volume to approximately 61 bcm by 2030, which will account for approximately 9% of the forecasted consumption [35]. Table 6 shows that the storage demand will be 89.1–130.3 bcm by 2030, which means that China’s planned storage capacity is insufficient at present, with a gap at 28.1–69.3 bcm. More gas storage facilities are needed to reach the safe reserve target. The investments in the unit working gas volumes of the depleted oil and gas reservoirs in China are 3.5–4.0 RMB [6], which will require an additional planning investment of 98.35–277.2 billion yuan to expand the storage capacity.
The current and future gas import facilities should also be considered to test the feasibility of the import strategies. Table 7 presents China’s pipeline and LNG receiving facility operations and planning project data. According to the project data, we can calculate the annual expected maximum gas-import capacity of China, which is listed in Table 8. China’s maximum gas import capacity may reach 490.8 bcm in 2030, which is sufficient to meet the import demands for all cases shown in Table 6. In case EI_C1000, the storage and import demands will decline after 2040, which will make it possible for the facilities constructed in the early stage to exhibit serious asset stranding.
In summary, infrastructure planning must be combined with the energy development expectations. This is also the significance of our predictions of storage and import demands. In view of the changing supply and demand scenarios, the planning period for facilities should not be too long and should be dynamically adjusted. On the one hand, infrastructure construction in the early stage must meet the growing market demand; on the other hand, it is necessary to consider reuse of facilities when natural gas consumption declines. To avoid asset stranding of gas facilities, for instance, the excess LNG receiving stations and cross-border pipelines can be opened to serve overseas customers as distribution centers for transshipment to other natural gas importing countries in Asia. This may help China to establish an Asian gas trading center to make full use of the natural gas infrastructure, which would be a systematic project.
In China, as a supporting infrastructure for long-distance pipeline networks, control of the construction, operation and management of UGS and LNG receiving stations is controlled by giant state-owned enterprises. Other private enterprises and capital have difficulty competing with them. This single investment strategy has affected the construction of gas storage facilities, which has caused the market-oriented adjustments to lag somewhat, which is one of the key reasons for the current shortage in gas storage capacity. Therefore, in terms of systems and regulations, full use of market forces should be made, national and commercial reserves should be combined, the profit margins of reserves and imports should be released and enterprises should be encouraged to participate.
5. Conclusions
Gas storage is one of the most important sources for providing supply flexibility for the gas market, which plays a key role in peak shaving demand and national energy security. This study discussed the planning and construction of gas storage and import demands for China’s gas market in the future. We developed a system dynamic model to simulate the behavior of the natural gas market in China, in which related variables such as gas consumption, national production, and import and storage demand were included. Several alternative cases were defined to explore a variety of storage planning scenarios, such as changes in the energy consumption structure and carbon emission constraints.
The promise of carbon neutrality provides opportunities for natural gas growth, but at the same time, the development of non-fossil energy also brings uncertainty to natural gas growth. The simulation results show that the storage demand in 2030 will be between 89.1 and 130.3 bcm with a 24% reserve target, but the current planned energy storage is only 61 bcm, which shows that the storage capacity is not sufficient, while the imported capacity may be idle under high environmental constraint for achieving carbon neutrality after 2040. We believe that a complete storage system would facilitate the development of natural gas markets and help guide China’s natural gas market reforms. Based on our study and discussion, we provided some suggestions for China’s natural gas storage planning and supply guarantee.
(1) It is recommended to adopt a two-line strategy. One strategy is to make reasonable plans and control the development speed of domestic natural gas resources, protect high-quality gas field resources, and build large-scale underground gas storage facilities at the same time. Another way is to actively participate in the investment and development of overseas oil and gas resources to obtain overseas resources for import.
(2) To strengthen the construction of the storage and import infrastructure, scientific planning and demonstration are prerequisites. According to the long-term and short-term demands and development trends of a comprehensive domestic energy plan, underground gas storage, LNG receiving stations and pipeline network should be planned reasonably, which should not only avoid the case of insufficient facilities but also should avoid asset stranding.
(3) Adopt market-oriented methods to promote the development of the storage industry and remove the price controls on storage fees. Reserve gas fields and underground gas storage can adopt mixed ownership investment operations and attract diversified investments. It is important to ensure that the upstream and downstream industries are more closely linked through storage construction, which would form a tight and flexible operational system.
(4) Gradually establish and complete supporting laws and regulations to protect investor rights and interests. Encourage diversified capital sources to participate in the construction of strategic reserve gas fields and gas storage.
Author Contributions
Conceptualization, Z.C.; methodology, Z.C. and T.L.; validation, H.W. and I.S.; data curation, T.L.; writing—original draft preparation, Z.C.; writing—review and editing, T.L., H.W. and I.S.; visualization, H.W. All authors have read and agreed to the published version of the manuscript.
Funding
This research was funded by grants from the National Social Science Found of China (Grant No. 19ZDA100 and No.19VDL012).
Institutional Review Board Statement
Not applicable.
Informed Consent Statement
Not applicable.
Data Availability Statement
The data presented in this study are available on request from the corresponding author.
Conflicts of Interest
The authors declare no conflict of interest.
Abbreviations
| GC | Gas Consumption (cubic meters) |
| RGC | Residents Gas Consumption (cubic meters) |
| IGC | Industrial Gas Consumption (cubic meters) |
| RECC | Residents Energy consumption per capita (tce/capita) |
| GDPC | GDP per Capita (CNY/capita) |
| REC | Residential Energy Consumption (tce) |
| RGS | Residential Gas Share (%) |
| UP | Urban Population (capita) |
| TP | Total Population (capita) |
| UR | Urbanization Rate (%) |
| RCS | Residential Coal Share (%) |
| ROS | Residential Oil Share (%) |
| RNFES | Residential Non-fossil Energy Share (%) |
| BR | Birth Rate (capita per year) |
| DR | Death Rate (capita per year) |
| IEC: | Industrial Energy Consumption (tce) |
| EI | Energy Intensity (tce/CNY) |
| IGS | Industrial Gas Share (%) |
| ICS | Industrial Coal Share (%) |
| IOS | Industrial Oil Share (%) |
| INFES | Industrial Non-fossil Energy Share (%) |
| AGP | Annual Gas Production (cubic meters/year) |
| PGRR | Proved Gas Residual Reserve (cubic meters) |
| ETR | Extraction Rate (cubic meters/year) |
| APR | Annual Proved Reserve (cubic meters/year) |
| GR | Geological Reserves (cubic meters) |
| EPR | Exploration Rate (cubic meters/year) |
| IC | Import Change (cubic meters) |
| SG | Supply Gap (cubic meters) |
| TAI | Time to Adjust Import (1 year) |
| ID | Import Dependence (%) |
| GST | Gas Storage (cubic meters) |
| GS | Gas Supply (cubic meters) |
| STG | Storage Gap (cubic meters) |
| EST | Expected Storage (cubic meters) |
| SR | Storage Ratio (%) |
| ES | Expected Supply (cubic meters) |
| GP | Gas Production (cubic meters) |
| SA | Storage Adjustment (cubic meters) |
| TAS | Time to Adjust Storage (0.5 year) |
Appendix A
This appendix lists the equations between the main variables in the model.
(1) Gas demand subsystem
To explore the relationship between the Residents Energy Consumption per Capita (RECC) and the GDP per capita, a regression was performed on 2005–2018 data, which yielded:
Note: Throughout, the value in parentheses is the standard error. For Equation (A4), T and F statistics for this regression are significant at the 1 percent level.
Functional relationship between Urbanization Rate (UR) and GDPC is as follows:
Note: The T and F statistics for this regression are significant at the 1 percent level.
Note: INTEG is a dynamic integration function, which returns the integral of “Birth-Death”, and 1307.56 million is the population in 2005. This function has the same usage in the later equations.
Note: This GDP is a fixed-base index calculated at constant prices based on 1978, which is released by the National Bureau of Statistics of China, and 1215.3 is the initial value of GDP index in 2005.
Annual growth rate of ICS, IOS and INFES are a function of CO2 price, shown in Figure 5.
(2) Gas supply subsystem
Extraction Rate (ETR) and Exploration Rate (EPR) are listed in Table 3
40,000 billion cubic meters is the initial value of Geological Reserves (GR) in 2005.
2818.54 billion cubic meters is the value of PGRR in 2005.
0.001 billion cubic meters is the value of Imports in 2005.
(3) Storage subsystem
Note: SMOOTH is an exponential smoothing function; 5 years is the smoothing delay. Storage Ratio (SR) has a functional relationship with Import Dependence, shown in Figure 3
Appendix B
The historical and simulated data of main variables, such as gas consumption, production and imports, are listed in Table A1, which is related to Figure 6 and Figure 7. Table A2 shows the simulated data of gas storage and import demand in different scenarios, which is related to Figure 9 and Figure 10. Taking into account the length of the article, the data are shown at 5-year intervals after 2020.

Table A1.
The historical and simulated data of main variables in base case.
| Year | Production (bcm) | Consumption (bcm) | Import (bcm) | |||
|---|---|---|---|---|---|---|
| Sim Data | Real Data | Sim Data | Real Data | Sim Data | Real Data | |
| 2005 | 50.7337 | 49.32 | 41.8656 | 46.763 | 0.001 | 0.001 |
| 2006 | 58.0327 | 58.553 | 52.6966 | 56.141 | 1.206 | 0.99 |
| 2007 | 65.5992 | 69.24 | 65.162 | 70.523 | 3.512 | 4.02 |
| 2008 | 73.4019 | 80.3 | 80.1555 | 81.294 | 5.032 | 4.6 |
| 2009 | 81.409 | 85.269 | 93.5419 | 89.52 | 10.371 | 7.6 |
| 2010 | 89.5888 | 94.848 | 108.545 | 106.941 | 21.034 | 16.47 |
| 2011 | 97.9095 | 102.69 | 125.391 | 130.53 | 32.127 | 31.15 |
| 2012 | 106.34 | 107.22 | 144.316 | 146.3 | 40.6265 | 42.06 |
| 2013 | 114.848 | 117.38 | 161.984 | 170.537 | 53.202 | 52.54 |
| 2014 | 123.403 | 128.49 | 181.347 | 187.057 | 65.32 | 59.13 |
| 2015 | 131.976 | 134.61 | 202.567 | 193.175 | 79.1457 | 61.14 |
| 2016 | 140.537 | 136.865 | 224.29 | 207.806 | 87.7504 | 74.56 |
| 2017 | 149.057 | 148.035 | 247.7 | 239.37 | 105.096 | 94.56 |
| 2018 | 155.608 | 160.159 | 271.557 | - | 120.31 | - |
| 2019 | 162.039 | 176.174 | 297.141 | - | 141.833 | - |
| 2020 | 168.339 | - | 324.545 | - | 161.399 | - |
| 2025 | 195.263 | - | 426.956 | - | 241.953 | - |
| 2030 | 219.73 | - | 536.739 | - | 326.466 | - |
| 2035 | 239.34 | - | 651.794 | - | 422.107 | - |
| 2040 | 245.215 | - | 782.01 | - | 547.386 | - |
| 2045 | 248.291 | - | 902.392 | - | 664.544 | - |
| 2050 | 248.953 | - | 1013.04 | - | 774.003 | - |
| 2055 | 247.574 | - | 1119.11 | - | 881.154 | - |
| 2060 | 244.503 | - | 1213.44 | - | 977.89 | - |
Table A2.
The simulated data of storage and import demand in different cases.
| Year | Gas Storage (bcm) | Imports (bcm) | ||||
|---|---|---|---|---|---|---|
| EI_C1000 | EI_C500 | EI_C100 | EI_C1000 | EI_C500 | EI_C100 | |
| 2020 | 7.32 | 12.27 | 16.32 | 209.76 | 193.27 | 179.19 |
| 2025 | 72.65 | 64.89 | 58.66 | 351.81 | 287.51 | 230.39 |
| 2030 | 130.33 | 108.58 | 89.05 | 480.23 | 384.93 | 289.87 |
| 2035 | 174.17 | 143.82 | 112.36 | 573.03 | 466.95 | 340.13 |
| 2040 | 205.45 | 173.90 | 132.96 | 635.39 | 545.02 | 398.36 |
| 2045 | 217.30 | 193.83 | 148.66 | 634.54 | 585.16 | 436.02 |
| 2050 | 211.29 | 202.16 | 158.02 | 598.46 | 601.51 | 462.17 |
| 2055 | 199.69 | 206.43 | 165.93 | 558.74 | 611.78 | 487.38 |
| 2060 | 188.39 | 208.87 | 173.08 | 529.96 | 619.81 | 510.95 |
References
- Feng, T.; Yang, Y.; Xie, S.; Dong, J.; Ding, L. Economic drivers of greenhouse gas emissions in China. Renew. Sustain. Energy Rev. 2017, 78, 996–1006. [Google Scholar] [CrossRef]
- BP. Energy Outlook 2020 Edition; British Petroleum (BP p.l.c): London, UK, 2020. [Google Scholar]
- Baranes, E.; Mirabel, F.; Poudou, J.C. Access to natural gas storage facilities: Strategic and regulation issues. Energy Econ. 2014, 41, 19–32. [Google Scholar] [CrossRef]
- Quattrocchi, F.; Boschi, E.; Spena, A.; Buttinelli, M.; Cantucci, B.; Procesi, M. Synergic and conflicting issues in planning underground use to produce energy in densely populated countries, as Italy Geological storage of CO2, natural gas, geothermics and nuclear waste disposal. Appl. Energy 2013, 101, 393–412. [Google Scholar] [CrossRef]
- Ding, G.S.; Liang, J.; Ren, Y.S.; Zhao, X.F.; Ran, L.N. Suggestions on establishing peak-shaving reserve and emergency system in China. Nat. Gas Ind. 2009, 5, 98–100. [Google Scholar]
- Zhang, J.D.; Tan, Y.F.; Zhang, T.T.; Yu, K.C.; Wang, X.M.; Zhao, Q. Natural gas market and underground gas storage development in China. J. Energy Storage 2020, 29, 101338. [Google Scholar] [CrossRef]
- Xie, N.-M.; Yuan, C.-Q.; Yang, Y.-J. Forecasting China’s energy demand and self-sufficiency rate by grey forecasting model and Markov model. Int. J. Electr. Power Energy Syst. 2015, 66, 1–8. [Google Scholar] [CrossRef]
- Aktunc, E.A.; Yukseltan, E.; Yucekaya, A.; Bilge, A.H. Managing natural gas demand for free consumers under uncertainty and limited storage capacity. J. Nat. Gas Sci. Eng. 2020, 79, 103322. [Google Scholar] [CrossRef]
- Confort, M.J.F.; Mothe, C.G. Estimating the required underground natural gas storage capacity in Brazil from the gas industry characteristics of countries with gas storage facilities. J. Nat. Gas Sci. Eng. 2014, 18, 120–130. [Google Scholar] [CrossRef]
- Hoffler, F.; Kubler, M. Demand for storage of natural gas in northwestern Europe: Trends 2005–30. Energy Policy 2007, 35, 5206–5219. [Google Scholar] [CrossRef]
- de Joode, J.; Ozdemir, O. Demand for seasonal gas storage in northwest Europe until 2030: Simulation results with a dynamic model. Energy Policy 2010, 38, 5817–5829. [Google Scholar] [CrossRef]
- Flouri, M.; Karakosta, C.; Kladouchou, C.; Psarras, J. How does a natural gas supply interruption affect the EU gas security? A Monte Carlo simulation. Renew. Sustain. Energy Rev. 2015, 44, 785–796. [Google Scholar] [CrossRef]
- Zeng, Y.; Klabjan, D.; Arinez, J. Distributed solar renewable generation: Option contracts with renewable energy credit uncertainty. Energy Econ. 2015, 48, 295–305. [Google Scholar] [CrossRef]
- Yepes Rodriguez, R. Real option valuation of free destination in long-tern liquefied natural gas supplies. Energy Econ. 2008, 30, 1909–1932. [Google Scholar] [CrossRef]
- Askari, S.; Montazerin, N.; Zarandi, M.H.F. Forecasting semi-dynamic response of natural gas networks to nodal gas consumptions using genetic fuzzy systems. Energy 2015, 83, 252–266. [Google Scholar] [CrossRef]
- Yu, L.; Zhao, Y.; Tang, L. A compressed sensing based AI learning paradigm for crude oil price forecasting. Energy Econ. 2014, 46, 236–245. [Google Scholar] [CrossRef]
- Yu, F.; Xu, X. A short-term load forecasting model of natural gas based on optimized genetic algorithm and improved BP neural network. Appl. Energy 2014, 134, 102–113. [Google Scholar] [CrossRef]
- Guo, M.J.; Bu, Y.; Cheng, J.H.; Jiang, Z.Y. Natural Gas Security in China: A Simulation of Evolutionary Trajectory and Obstacle Degree Analysis. Sustainability 2019, 11, 96. [Google Scholar] [CrossRef] [Green Version]
- Strachan, N.; Kannan, R. Hybrid modelling of long-term carbon reduction scenarios for the UK. Energy Econ. 2008, 30, 2947–2963. [Google Scholar] [CrossRef]
- Morales, K. Response from a MARKAL technology model to the EMF scenario assumptions. Energy Econ. 2004, 26, 655–674. [Google Scholar] [CrossRef]
- Gao, F.; Shao, X. Forecasting annual natural gas consumption via the application of a novel hybrid model. Environ. Sci. Pollut. Res. 2021, 28, 21411–21424. [Google Scholar] [CrossRef]
- Wood, D.A. A review and outlook for the global LNG trade. J. Nat. Gas Sci. Eng. 2012, 9, 16–27. [Google Scholar] [CrossRef]
- Chi, K.C.; Nuttall, W.J.; Reiner, D.M. Dynamics of the UK natural gas industry: System dynamics modelling and long-term energy policy analysis. Technol. Forecast. Soc. Chang. 2009, 76, 339–357. [Google Scholar]
- Xiao, B.; Niu, D.; Guo, X. Can natural gas-fired power generation break through the dilemma in China? A system dynamics analysis. J. Clean. Prod. 2016, 137, 1191–1204. [Google Scholar] [CrossRef]
- Hsu, C.-W. Using a system dynamics model to assess the effects of capital subsidies and feed-in tariffs on solar PV installations. Appl. Energy 2012, 100, 205–217. [Google Scholar] [CrossRef]
- Jiao, J.-L.; Han, K.-Y.; Wu, G.; Li, L.-L.; Wei, Y.-M. The effect of an SPR on the oil price in China: A system dynamics approach. Appl. Energy 2014, 133, 363–373. [Google Scholar] [CrossRef]
- Li, J.C.; Dong, X.C.; Shangguan, J.X.; Hook, M. Forecasting the growth of China’s natural gas consumption. Energy 2011, 36, 1380–1385. [Google Scholar] [CrossRef] [Green Version]
- Mu, X.Z.; Li, G.H.; Hu, G.W. Modeling and scenario prediction of a natural gas demand system based on a system dynamics method. Pet. Sci. 2018, 15, 912–924. [Google Scholar] [CrossRef] [Green Version]
- Gomez, C.R.; Arango-Aramburo, S.; Larsen, E.R. Construction of a Chilean energy matrix portraying energy source substitution: A system dynamics approach. J. Clean. Prod. 2017, 162, 903–913. [Google Scholar] [CrossRef] [Green Version]
- Xiong, W.W.; Yan, L.; Wang, T.; Gao, Y.G. Substitution Effect of Natural Gas and the Energy Consumption Structure Transition in China. Sustainability 2020, 12, 7853. [Google Scholar] [CrossRef]
- Ejarque, J.M. Evaluating the economic cost of natural gas strategic storage restrictions. Energy Econ. 2011, 33, 44–55. [Google Scholar] [CrossRef]
- Green, R. Gas prices in the UK: Markets and insecurity of supply. Energy J. 2007, 28, 187–189. [Google Scholar]
- Zeren, F.; Akkus, H.T. The relationship between renewable energy consumption and trade openness: New evidence from emerging economies. Renew. Energy 2020, 147, 322–329. [Google Scholar] [CrossRef]
- Wang, X.L.; Economides, M.J. Purposefully built underground natural gas storage. J. Nat. Gas Sci. Eng. 2012, 9, 130–137. [Google Scholar] [CrossRef]
- Xu, D.T. Guoqiang, Policy evolution and research progress of investment, construction and operation management of gas storage in China. Oil Gas Storage Transp. 2020, 39, 481–491. [Google Scholar]
- Anser, M.K.; Yousaf, Z.; Zaman, K.; Nassani, A.A.; Alotaibi, S.M.; Jambari, H.; Khan, A.; Kabbani, A. Determination of resource curse hypothesis in mediation of financial development and clean energy sources: Go-for-green resource policies. Resources Policy 2020, 66, 101640. [Google Scholar] [CrossRef]
- Wang, X.L.; Cheng, J.H.; Chen, J.; Xiao, J.Z. Substitution effect of natural gas consumption and energy transition security in China. China Popul. Resour. Environ. 2021, 31, 138–149. [Google Scholar]
- Malzi, M.J.; Sohag, K.; Vasbieva, D.G.; Ettahir, A. Environmental policy effectiveness on residential natural gas use in OECD countries. Resources Policy 2020, 66, 101651. [Google Scholar] [CrossRef]
- National Bureau of Statistics of China. China Statistical Yearbook 2020 Edition; China Statistics Press: Beijing, China, 2020.
- Guo, Y.J.; Hawkes, A. Asset stranding in natural gas export facilities: An agent-based simulation. Energy Policy 2019, 132, 132–155. [Google Scholar] [CrossRef]
- Zhao, G.M. China’s LNG terminal construction and future development. Petrochem. Saf. Environ. Prot. Technol. 2020, 36, 1–6. [Google Scholar]
Figure 1.
Causal loop diagram of the gas storage subsystem.

Figure 2.
Causal loop diagram of the gas demand subsystem.

Figure 3.
Causal loop diagram of the gas supply subsystem.

Figure 4.
Storage ratio vs. import dependence.

Figure 5.
Carbon price vs. average annual growth rate of energy share.

Figure 6.
Simulation results vs. historical data.

Figure 7.
Gas consumption, production and imports in the base case.

Figure 8.
Gas storage demand and import dependence of China.

Figure 9.
Dynamics of primary energy CO2 emissions for the alternative cases.

Figure 10.
Dynamics of gas consumption and storage demand for the alternative cases.

Figure 11.
Dynamics of gas imports and external dependency for the alternative cases.

Table 1.
GDP growth rate assumptions.
| Year | 2005–2016 | 2017–2050 | 2051–2060 |
|---|---|---|---|
| GDP growth rate | 9.8% | 3.5% | 2.0% |
Table 2.
Birth and death rates.
| Year | 2005 | 2020 | 2030 | 2060 |
|---|---|---|---|---|
| Birth rate | 0.0124 | 0.008 | 0.007 | 0.006 |
| Death rate | 0.007 | |||
Table 3.
Average exploration and extraction rates.
| 2005–2018 | 2019 | 2030 | 2060 | |
|---|---|---|---|---|
| Exploration rate | 0.0075 | |||
| Extraction rate | 0.018 | 0.03 | 0.036 | 0.04 |
Table 4.
Comparative analysis of simulation research on natural gas storages.
| Studies | Methods | Study Area | Simulation Error | Features |
|---|---|---|---|---|
| Confort and Mothe [9] | Linear regression analysis | Brazil | 37.4–89.1% | Short-term forecast, No scenario analysis |
| Hoffler and Kubler [10] | Top-down extrapolation | Northwest Europe | No model calibration | Long-term forecast, Scenario analysis |
| de Joode and Ozdemir [11] | Game-theory equilibrium model | Northwest Europe | Unarticulated | Long-term forecast, Scenario analysis |
| Yu and Xu [17] | Artificial neural networks | Shanghai, China | Less than 10% | Short-term forecast, No scenario analysis |
| This study | System dynamics model | China | Less than 10% | Long-term forecast, Scenario analysis |
Table 5.
Energy intensity and carbon price scenarios.
| Alternative Cases | Energy Intensity Growth Rate | Carbon Prices (RMB/t) |
|---|---|---|
| Base case | −2% | 50 |
| C100 | −2% | 100 |
| C500 | −2% | 500 |
| C1000 | −2% | 1000 |
| EI_C100 | −3% | 100 |
| EI_C500 | −3% | 500 |
| EI_C1000 | −3% | 1000 |
Table 6.
Storage and import requirements for the alternative cases.
| Year | EI_C1000 | EI_C500 | EI_C100 | |
|---|---|---|---|---|
| Storage (bcm) | 2025 | 72.6 | 64.9 | 58.7 |
| 2030 | 130.3 | 108.6 | 89.1 | |
| 2060 | 188.4 | 208.9 | 173.1 | |
| Import (bcm) | 2025 | 351.8 | 287.5 | 230.4 |
| 2030 | 480.2 | 384.9 | 289.9 | |
| 2060 | 529.9 | 619.8 | 510.9 |
Table 7.
Gas pipeline and LNG terminal projects in China.
| Project Type | Status | Gas Source | Operating Date | Capacity (bcm/Year) |
|---|---|---|---|---|
| Gas Pipeline | In operation | Central Asia-A/B | 2012.12 | 30 |
| In operation | Central Asia-C | 2014.6 | 25 | |
| Under construction | Central Asia-D | 2022 | 30 | |
| In operation | Burma | 2013.6 | 12 | |
| In operation | Russia-eastern line | 2019 | 38 | |
| Under construction | Russia-western line | 2022 | 30 | |
| LNG Terminals | In operation | Middle East, Asia-Pacific | 2006–2019 | 126 |
| Under construction | Middle East, Asia-Pacific | 2020–2022 | 33.8 | |
| Planning | Middle East, Asia-Pacific | 2023–2030 | 166 |
Data source: [41].
Table 8.
Expected maximum gas import capacities of China.
| Year | 2019 | 2022 | 2030 |
|---|---|---|---|
| Pipeline gas (bcm/year) | 105 | 165 | 165 |
| LNG (bcm/year) | 126 | 159.8 | 325.8 |
| Total capacity (bcm/year) | 231 | 324.8 | 490.8 |
Publisher’s Note: MDPI stays neutral with regard to jurisdictional claims in published maps and institutional affiliations. |
© 2021 by the authors. Licensee MDPI, Basel, Switzerland. This article is an open access article distributed under the terms and conditions of the Creative Commons Attribution (CC BY) license (https://creativecommons.org/licenses/by/4.0/).
Share and Cite
MDPI and ACS Style
Chen, Z.; Wang, H.; Li, T.; Si, I. Demand for Storage and Import of Natural Gas in China until 2060: Simulation with a Dynamic Model. Sustainability 2021, 13, 8674. https://0-doi-org.brum.beds.ac.uk/10.3390/su13158674
AMA Style
Chen Z, Wang H, Li T, Si I. Demand for Storage and Import of Natural Gas in China until 2060: Simulation with a Dynamic Model. Sustainability. 2021; 13(15):8674. https://0-doi-org.brum.beds.ac.uk/10.3390/su13158674
Chicago/Turabian StyleChen, Zhihua, Hui Wang, Tongxia Li, and Ieongcheng Si. 2021. "Demand for Storage and Import of Natural Gas in China until 2060: Simulation with a Dynamic Model" Sustainability 13, no. 15: 8674. https://0-doi-org.brum.beds.ac.uk/10.3390/su13158674
Note that from the first issue of 2016, this journal uses article numbers instead of page numbers. See further details here.