Article

The Effects of Pedestrian Environments on Walking Behaviors and Perception of Pedestrian Safety

by
Byoung-Suk Kweon
1,*,
Jody Rosenblatt-Naderi
2,
Christopher D. Ellis
1,
Woo-Hwa Shin
3 and
Blair H. Danies
4
1
Department of Plant Science and Landscape Architecture, University of Maryland, College Park, MD 20742, USA
2
Department of Landscape Architecture, Ball State University, Muncie, IN 47306, USA
3
Daegu Gyeongbuk Development Institute, Daegu 42447, Korea
4
Low Impact Development Center, Beltsville, MD 20705, USA
*
Author to whom correspondence should be addressed.
Sustainability 2021, 13(16), 8728; https://0-doi-org.brum.beds.ac.uk/10.3390/su13168728
Submission received: 2 July 2021 / Revised: 22 July 2021 / Accepted: 30 July 2021 / Published: 5 August 2021
(This article belongs to the Special Issue The Innovation Thinking of Urban Green on Human Health)

Abstract

:
We investigated the effects of pedestrian environments on parents’ walking behavior, their perception of pedestrian safety, and their willingness to let their children walk to school. This study was a simulated walking environment experiment that created six different pedestrian conditions using sidewalks, landscape buffers, and street trees. We used within subjects design where participants were exposed to all six simulated conditions. Participants were 26 parents with elementary school children. Sidewalks, buffer strips, and street trees affected parents’ decisions to: walk themselves; let their children walk to school; evaluate their perception whether the simulated environment was safe for walking. We found that the design of pedestrian environments does affect people’s perceptions of pedestrian safety and their willingness to walk. The presence of a sidewalk, buffer strip, and street trees affected parents’ decision to walk, their willingness to let their children walk to school and perceived the pedestrian environment as safer for walking. The effects of trees on parents’ walking and perception of pedestrian safety are greater when there is a wide buffer rather than a narrow buffer. It was found that parents are more cautious about their children’s walking environments and safety than their own.

1. Introduction

Walking and biking are important sources of exercise for maintaining healthy children. Yet, walking and biking to school is becoming increasingly rare. This change may be linked to the documented increase in childhood obesity among children that has grown from 5% in 1978 to 18.5% in 2016 [1]. Previous studies found walking and biking to school dropped from 47.7% to 9.6% in the U.S. from 1969 to 2017 [2]. The age of a child may be a determining factor in whether a parent allows their child to bike or walk to school. A study found that parents of children aged 12–18 feel significantly more comfortable allowing their children to walk or bike to school than children younger than these ages [3]. Regardless of age, parents’ comfort level further increases if there is a place for children to walk safely [4]. Prior research explored the influences that individual, social, and physical environments have on walking and physical activity, but very few studies have focused primarily on parents’ perceptions of safety of pedestrian environments and the reasons why they are reluctant to allow their children to walk or bike to school. The purposes of this paper are twofold:
To understand the physical attributes of pedestrian environments that
(1)
Affect parents’ decision to walk themselves and allow their children to walk to school;
(2)
Affect parent’s perceptions of pedestrian safety for themselves and their children.

1.1. Research Background

Designing transportation space requires consideration of both vehicular and pedestrian perspectives. A study published by Landis et al. [5] examined a multitude of factors that contribute to a pedestrian’s sense of safety and comfort within a roadway corridor. These factors included personal safety (i.e., the threat of crashes); personal security (i.e., the threat of assault); architectural interest; pathway or sidewalk shade; pedestrian-scale lighting and amenities; presence of other pedestrians; and conditions at intersections. Additionally, Landis et al. [5] describes factors that significantly affect pedestrians’ sense of safety or comfort that include presence of a sidewalk; lateral separation from motor vehicle traffic; barriers and buffers between pedestrians and motor vehicle traffic; motor vehicle volume and composition; effects of motor vehicle traffic speed, and driveway frequency and access volume among other factors. In this paper, we focus on three physical attributes that affect parents’ perception of pedestrian environmental safety: sidewalks, landscape buffers, and trees.

1.1.1. Sidewalks

Less than 20% of the collector and arterial network of U.S. metropolitan areas have sidewalks [5]. Sidewalks are the pedestrian lanes that provide people with space to travel and allow people to interact with one another within the public right-of-way that are separated from roadway vehicles [6]. Sidewalks provide pedestrians with safety benefits, incentives to engage in physical activity, and opportunities for walking [7,8].
Sidewalks provide safety benefits to both pedestrians and vehicular drivers. Previous research found that a site with a paved sidewalk is 88.2% less likely to be a crash site than one without [9]. According to the Safe Routes to School, in 2017, 214 children (ages 14 and under) were killed by car while they were walking and 53 children were killed while they were pedal-cycling [10]. Installing sidewalks cuts the risk of a pedestrian being struck by a car by 50% [11]. Safer pedestrian environments may provide pedestrians with a greater incentive to utilize their physical environment for physical activity.
The presence of sidewalks provide pedestrians with incentives to engage in activities such as walking, jogging, and biking. Studies done by the Safe Routes to School, found that nearly one-third of all children and teens in the U.S. are obese. A study conducted by Giles-Corti and Donovan [12] suggests that informal facilities (including streetscapes) act as important components of the community infrastructure by supporting physical activity and contributing to obesity prevention. Informal recreational facilities such as streets, public open spaces, and beaches were the most frequently used facilities for physical activity [13]. Specifically, streets were utilized 45.6% compared to public open spaces (28.8%) and beaches (22.7%) [12]. With the popularity of walking for recreation and transportation purposes increasing, a greater focus on streetscape design is vital, as this is an important component to the physical activity infrastructure [12]. This is especially important for children, as it has been shown that children who walk or bicycle to school tend to be more active than students who are driven or take the bus to school [14], have lower body mass index (BMI) scores [15], lower obesity levels [16], and are more likely to meet physical activity guidelines [17].

1.1.2. Landscape Buffers

Landscape buffers can be a valuable amenity that provide a plausible solution to pedestrians’ concerns of their own sense of safety and of a parent’s perception of their child’s safety. A landscape buffer or tree lawn is a long-planted strip area between sidewalks and street curbs. Landscape buffers do not have to be complex. A simple grass strip that may include shrubs and/or trees can be used to create a buffer [18]. Buffer areas that separate motor vehicle traffic from pedestrians such as on-street parking, a line of trees, or a roadside swale barrier, aid in improving the pedestrians’ sense of protection and safety [5].
Landscape buffers can contribute to a pedestrian’s general sense of safety. Factors that intensified pedestrian’s feeling of being unsafe, include various functions of motor vehicles. For example, the speed of motor vehicle traffic was found to be a significant factor that affects pedestrians’ sense of safety; as speed increases, pedestrian discomfort also increases [5]. Additionally, the frequency of motor vehicles passing pedestrians, represented by the outside lane volume, was found to be a significant factor in pedestrian discomfort; as passing frequency increases, the pedestrians’ feeling of safety decreases [5]. As both the motor vehicle speed and passing frequency were found to have correlation with a pedestrian’s sense of personal safety (i.e., the threat of crashes), it is possible that these factors may also reduce a pedestrian’s decision to walk, or a parent to allow their child to walk along a route. However, an increase in lateral separation (e.g., landscape buffers) between motor vehicles and pedestrians, leads to increases in pedestrian’s comfort or sense of safety [5], and may increase a pedestrian’s decision to walk, or a parent to allow their child to walk along a route.
While there is evidence indicating that landscape buffers increase a pedestrian’s sense of safety, there is still a lack of evidence that a landscape buffer actually improves pedestrian safety. Texas Department of Transportation [19] indicated that “While [a landscape buffer] does seem to provide a higher sense of security for pedestrians along heavily traveled collectors and arterial streets, there is no evidence that the tree lawn actually increases the safety of the pedestrian. For this reason, provision of a tree lawn should be considered carefully”. Further studies are necessary to determine if landscape buffers actually contribute to pedestrian safety, are safety-neutral, or are less safe than sidewalks with no landscape buffers.

1.1.3. Trees

Landscape designs that incorporate trees into the buffer area can improve roadway aesthetics, provide shade, and improve pedestrians’ perception of safety with respect to motor vehicle traffic [18]. The benefits of a tree-line buffer may encourage a pedestrian’s decision to walk, and may heighten their personal sense of safety and their children’s safety.
Visual landscapes can affect people’s aesthetic appreciation, health, and well-being [20,21]. New knowledge about the effects that visual landscapes have on human health and wellbeing may help us combat the increasing prevalence of stress-related diseases in our society [20]. According to Landis et al. [5], a main factor that contributes to pedestrian’s sense of safety and comfort within a roadway corridor is personal security (i.e., the threat of assault). Greenery in the landscape is shown to lower aggression, fear, stress levels, and violence compared to landscapes with no greenery [20]. As a result, increasing greenery in the landscape may also affect people’s perceptions of safety and enhance their decisions to walk.
Other studies found that adjustment for attractiveness of public open spaces influences the likelihood of use [22]. For example, people who live on tree-lined streets are more likely to walk than those who live on streets without trees [23]. A study by Velarde, Fry and Tveit [20] identified that exposure to landscapes contributed to many aspects of human health including reduced stress levels, improved attention capacity, faster recovery from illness, increased physical well-being in elderly people, and shift in behavioral changes that improved mood and overall well-being. The study concluded that viewing natural landscapes during a walk is one of the factors mitigating negative effects that impact human health [20]. As a result, greater emphasis should be placed on creating tree-lined streetscapes that enhance human health as well as increase walking for recreation and transport [23].
Still, there is little understanding of how landscape buffers influence people’s walking behavior or decisions to engage in walking activities. Contrary to previous studies, this novel study aims to contribute to an improved understanding of the topic by examining the effects of pedestrian environments on parents’ willingness to let their children walk and on pedestrian perceptions of safety.

2. Materials and Methods

2.1. Research Design

An experimental design was constructed to evaluate the possible effects of pedestrian environments on parents’ willingness to walk and let their children walk or bike to school. It also examined parents’ perception of pedestrian safety for themselves and their children. We used a repeated measures design in which participants were exposed to all the environmental conditions.

2.2. Participants

Participants were selected using the convenient sample approach. Our participants were recruited by contacting local schools’ parent-teacher-student organizations’ presidents. The participants for this study were 26 parents with elementary school children from College Station and Bryan, Texas. Parents’ ages ranged from 25–48 years. The average parent age was 36 years old. Out of 26 participants, 19 participants were mothers; 7 were fathers. Out of 26 participants, 21 participants obtained at least a college degree.

2.3. Environmental Conditions

We used the DriverSafetyTM Version 1.6.2. simulator for our study. Environmental conditions were created using the HyperDriveTM Authoring Suite software. The conditions included features that could be manipulated to look similar to a College Station/Bryan neighborhood. We developed a simulated street environment that filled an area of 4 blocks by 6 blocks in dimension. In the simulation, we controlled for parked cars, number of driveways, amount of parking, housing type, and distances to the houses, and manipulated the amount of trees, sidewalks, and landscape buffers. More details about the simulation can be found in our method paper [24]. This article found that sidewalks, landscape buffers and trees were visually identifiable variables across different environmental conditions [24].
We created six different computer simulated pedestrian environmental conditions using sidewalks, 4 feet (narrow) and 8 feet (wide) landscape buffers, and trees within the narrow and wide landscape buffers (see Table 1 and Table 2). Condition 1 did not have any buffer, sidewalk, or street trees. Condition 2 had a sidewalk. In Condition 3, there were a sidewalk and a narrow 4 feet buffer. In Condition 4, we changed the buffer width to 8 feet. In Condition 5, there were a sidewalk, narrow buffer, and trees in the narrow buffer. In Condition 6, there was a sidewalk, wide buffer, and trees within the buffer. The goal of this simulation was to create students’ typical weekday commute environments around their schools. We introduced but controlled for the number and types of cars, the number of pedestrians, as well as traffic speed but manipulated landscape buffers (narrow vs. wide), sidewalk (no vs. yes), and trees (no vs. yes) in the landscape buffers.

2.4. Research Procedure and Questions

Each Participant viewed six different simulated pedestrian environments in a random order standing in a windowless room (20 feet × 20 feet) with three visualization screens set side-by-side. The scenes moved along the roadside at 3 miles per hour. The three screens created a 150-degree wraparound visual field with projectors for each of the integrated screens. Participants viewed each environmental condition for one and a half minutes and then completed the survey questionnaire. The environmental conditions were computer-generated simulations and participants could move through them. However, they could not interact within the simulations. The questions in the survey were originally designed by the research team. They were also reviewed by and pretested by parents with children but these were not the participants in this study.
Participants were asked to think of the following questions as they rated the various environmental conditions. A 4-point Likert-type scale was used (1: not at all to 4: very much)

2.4.1. Walkability

  • Would you like to walk in this environment?
  • Would you be willing to let your children walk in this environment?

2.4.2. Perception of Pedestrian Safety

  • What is your sense of the overall safety of the environment you just walked through?
  • How safe is this environment for your child to walk to school?

3. Results

The results are presented in two main parts. First, we present results based on environmental conditions. To investigate the effects of different environmental conditions, we present descriptive statistics for six environmental conditions, repeated measure of analysis of variance as well as mean comparison tests.
Next, we investigate the main effects of environmental factors: sidewalk, landscape buffers, and street trees. For each factor, we show multiple repeated measures of analysis of variance. Since we had only six environmental conditions, full three-way and two-way interactions were not possible to test so instead we focused on the main effects of sidewalks, landscape buffers and trees in this result section.

3.1. Environmental Conditions (Condition 1 through Condition 6)

The participants’ perception of pedestrian safety and walkability scores were analyzed for all six environmental conditions. Table 3 shows the means and standard deviations for each environmental condition. For all walking and safety variables, the means for the conditions with buffers was higher than the grand mean, while the means for the conditions without buffers was lower than the grand mean. In general, participants who viewed the wide buffer (8 feet) with trees in the buffer area and a sidewalk rated the highest on all four major variables (ranged 2.52 to 3.28) while the no buffer environment with no sidewalk rated the lowest (ranged from 1.15 to 1.40). In addition, parents rated more conservatively for their children’s walking and safety than their own.
To investigate the effects of six pedestrian environmental conditions (within subjects) on the walking and perception of pedestrian safety variables, we ran repeated measures of analysis of variance. We used experimental orders as a between subject variable. As seen in Table 4, there were significant environmental effects for all walking and safety variables. However, there were no significant order effects or interaction effects for all variables.
As a follow-up analysis, we ran least significant difference (LSD) tests and reported the significant results in Table 5. The results indicated that conditions without buffer were significantly different from conditions with buffers for all walking and safety variables. In other words, participants were more likely to walk, allow their children to walk, and to feel safer for themselves and their children in the conditions with buffers than without buffers. In addition, compared to sidewalk with trees in an 8′ buffer, sidewalk with trees in a 4′ buffer was significantly less walkable and perceived to be less safe for both parents and their children.

3.2. Environmental Factors (Sidewalks, Landscape Buffers, and Street Trees)
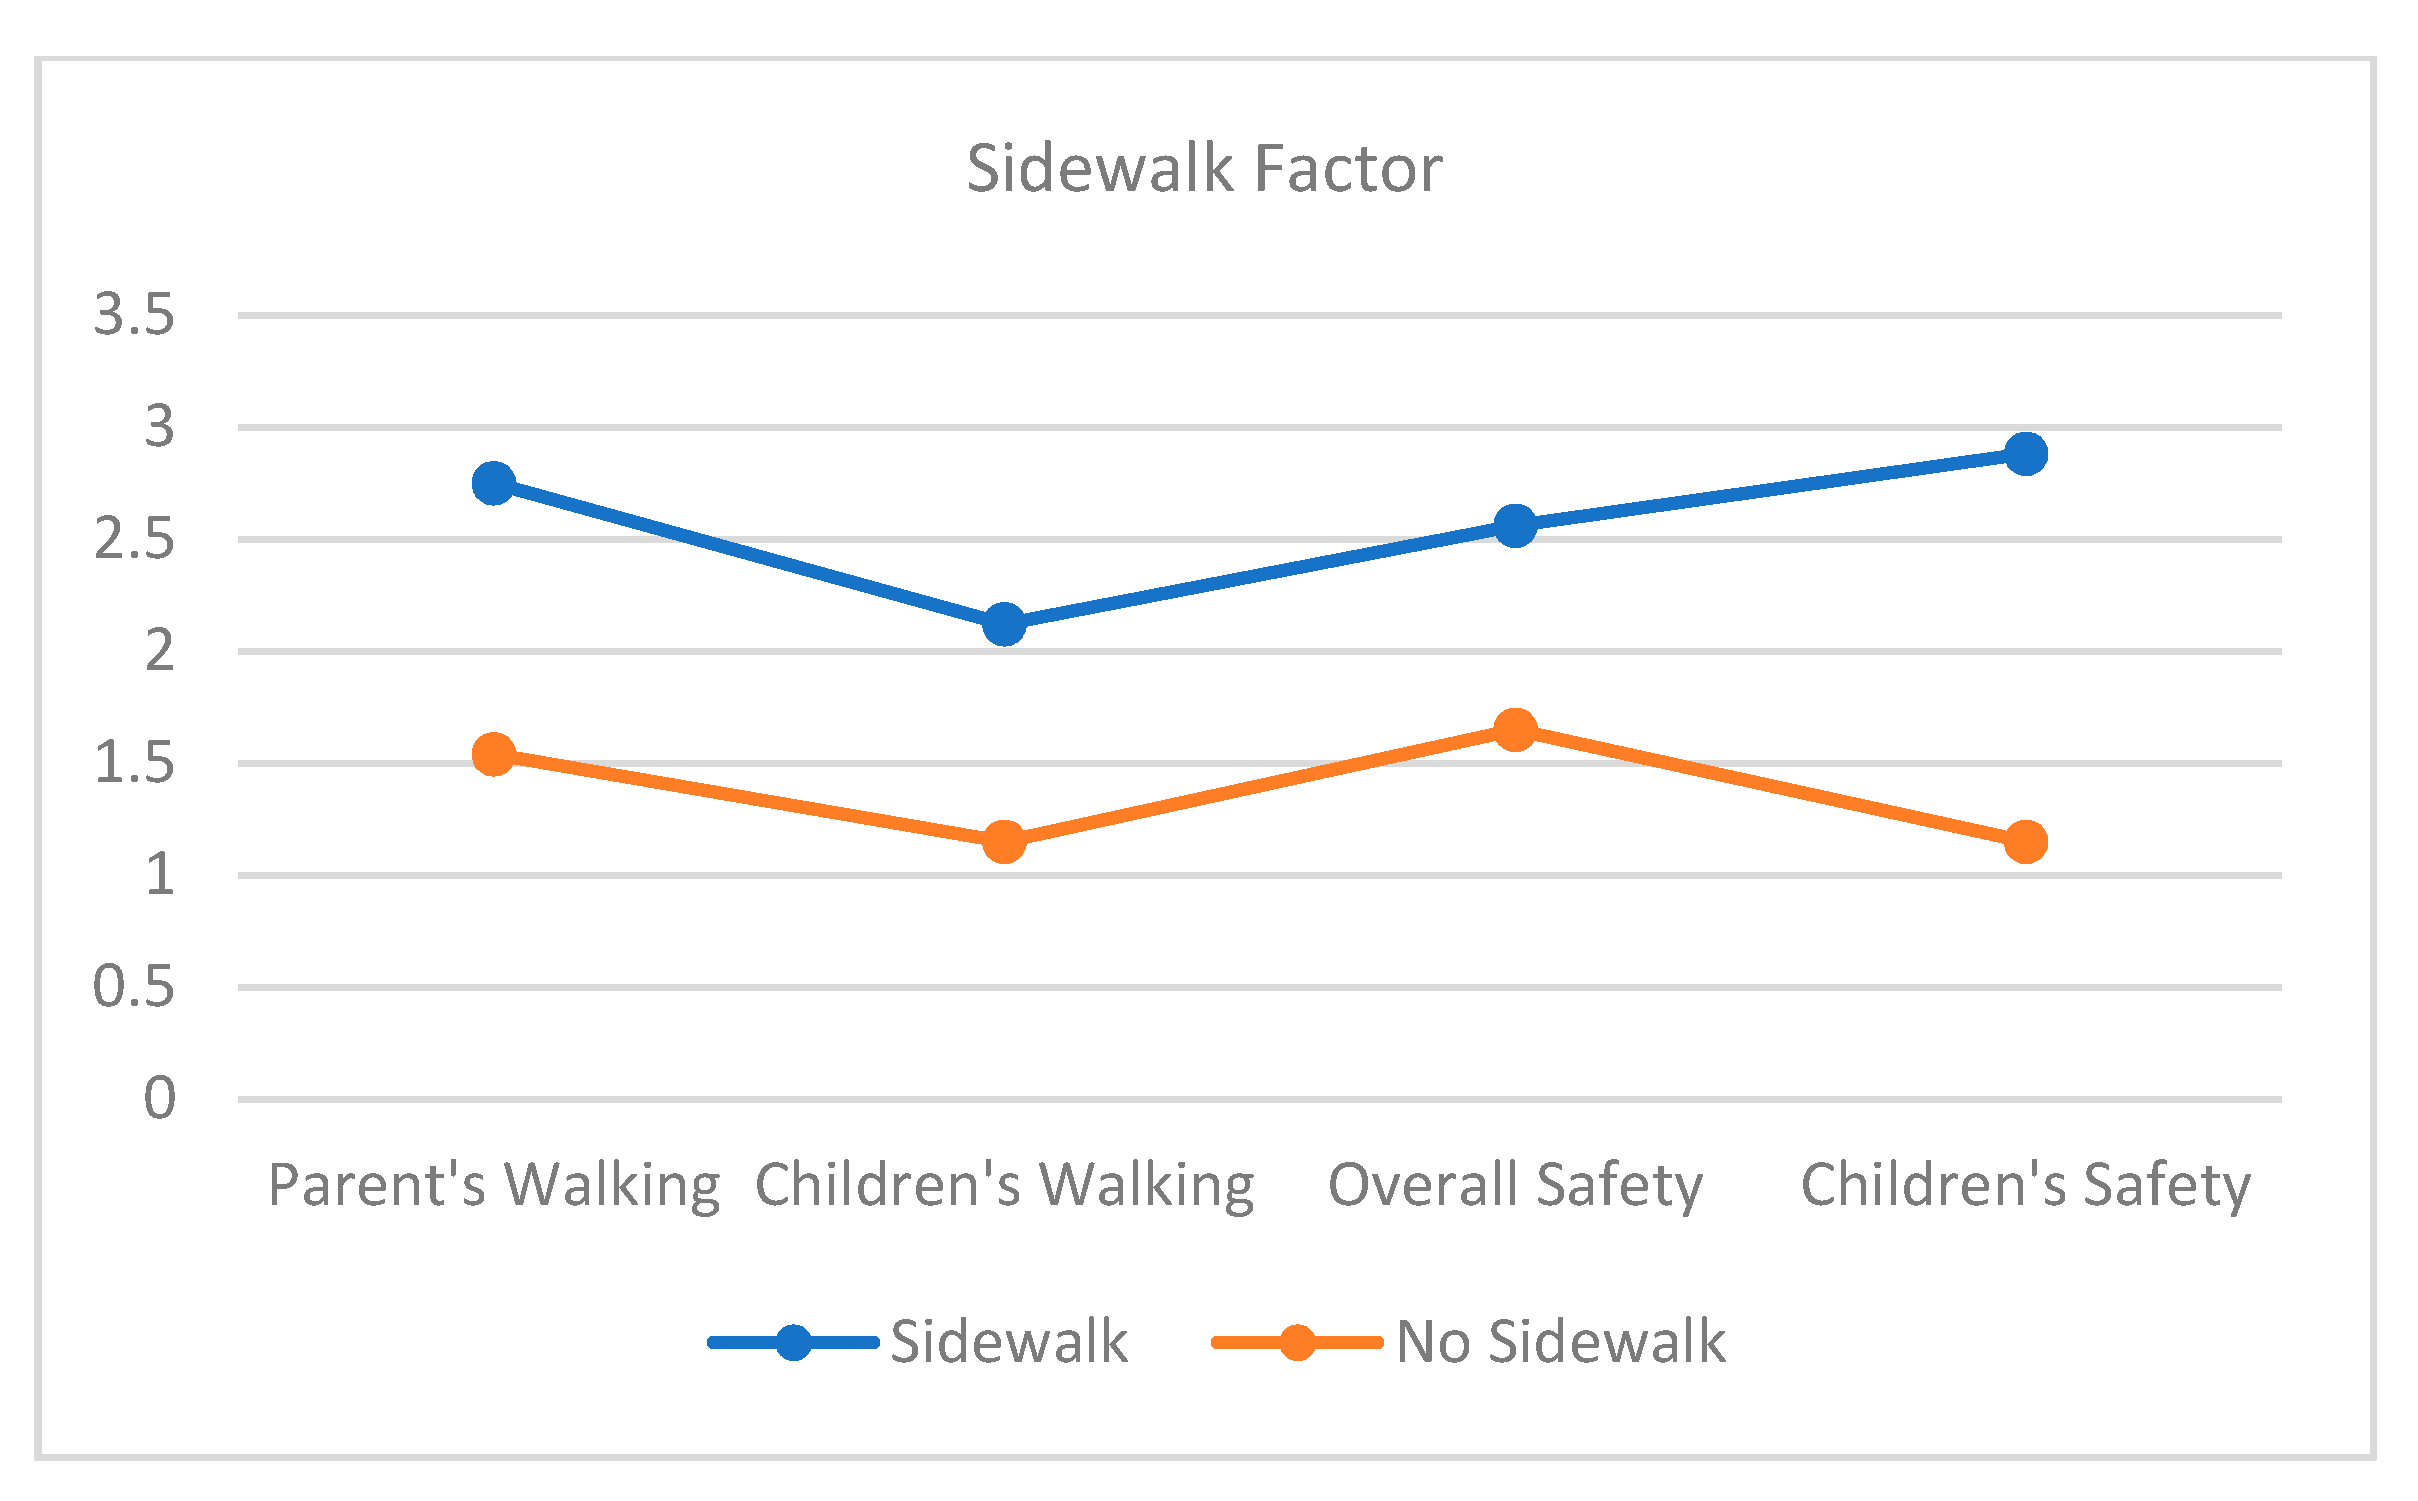
3.2.1. Sidewalks

The existence of sidewalks significantly affected all walking and perception of pedestrian safety variables. Figure 1 and Table 6 showed significant mean differences between sidewalk and no sidewalk simulations for all walking and safety variables. The lowest partial eta square was 0.74 indicating that 74% of parents walking variance was explained by the existence of sidewalks. The partial eta square for children’s walking increased to 0.85. For both safety variables, it was increased to 0.86. Overall, these results indicated that sidewalks were highly significant at predicting parents’ and children’s walking and their perception of pedestrian safety of the pedestrian environments.

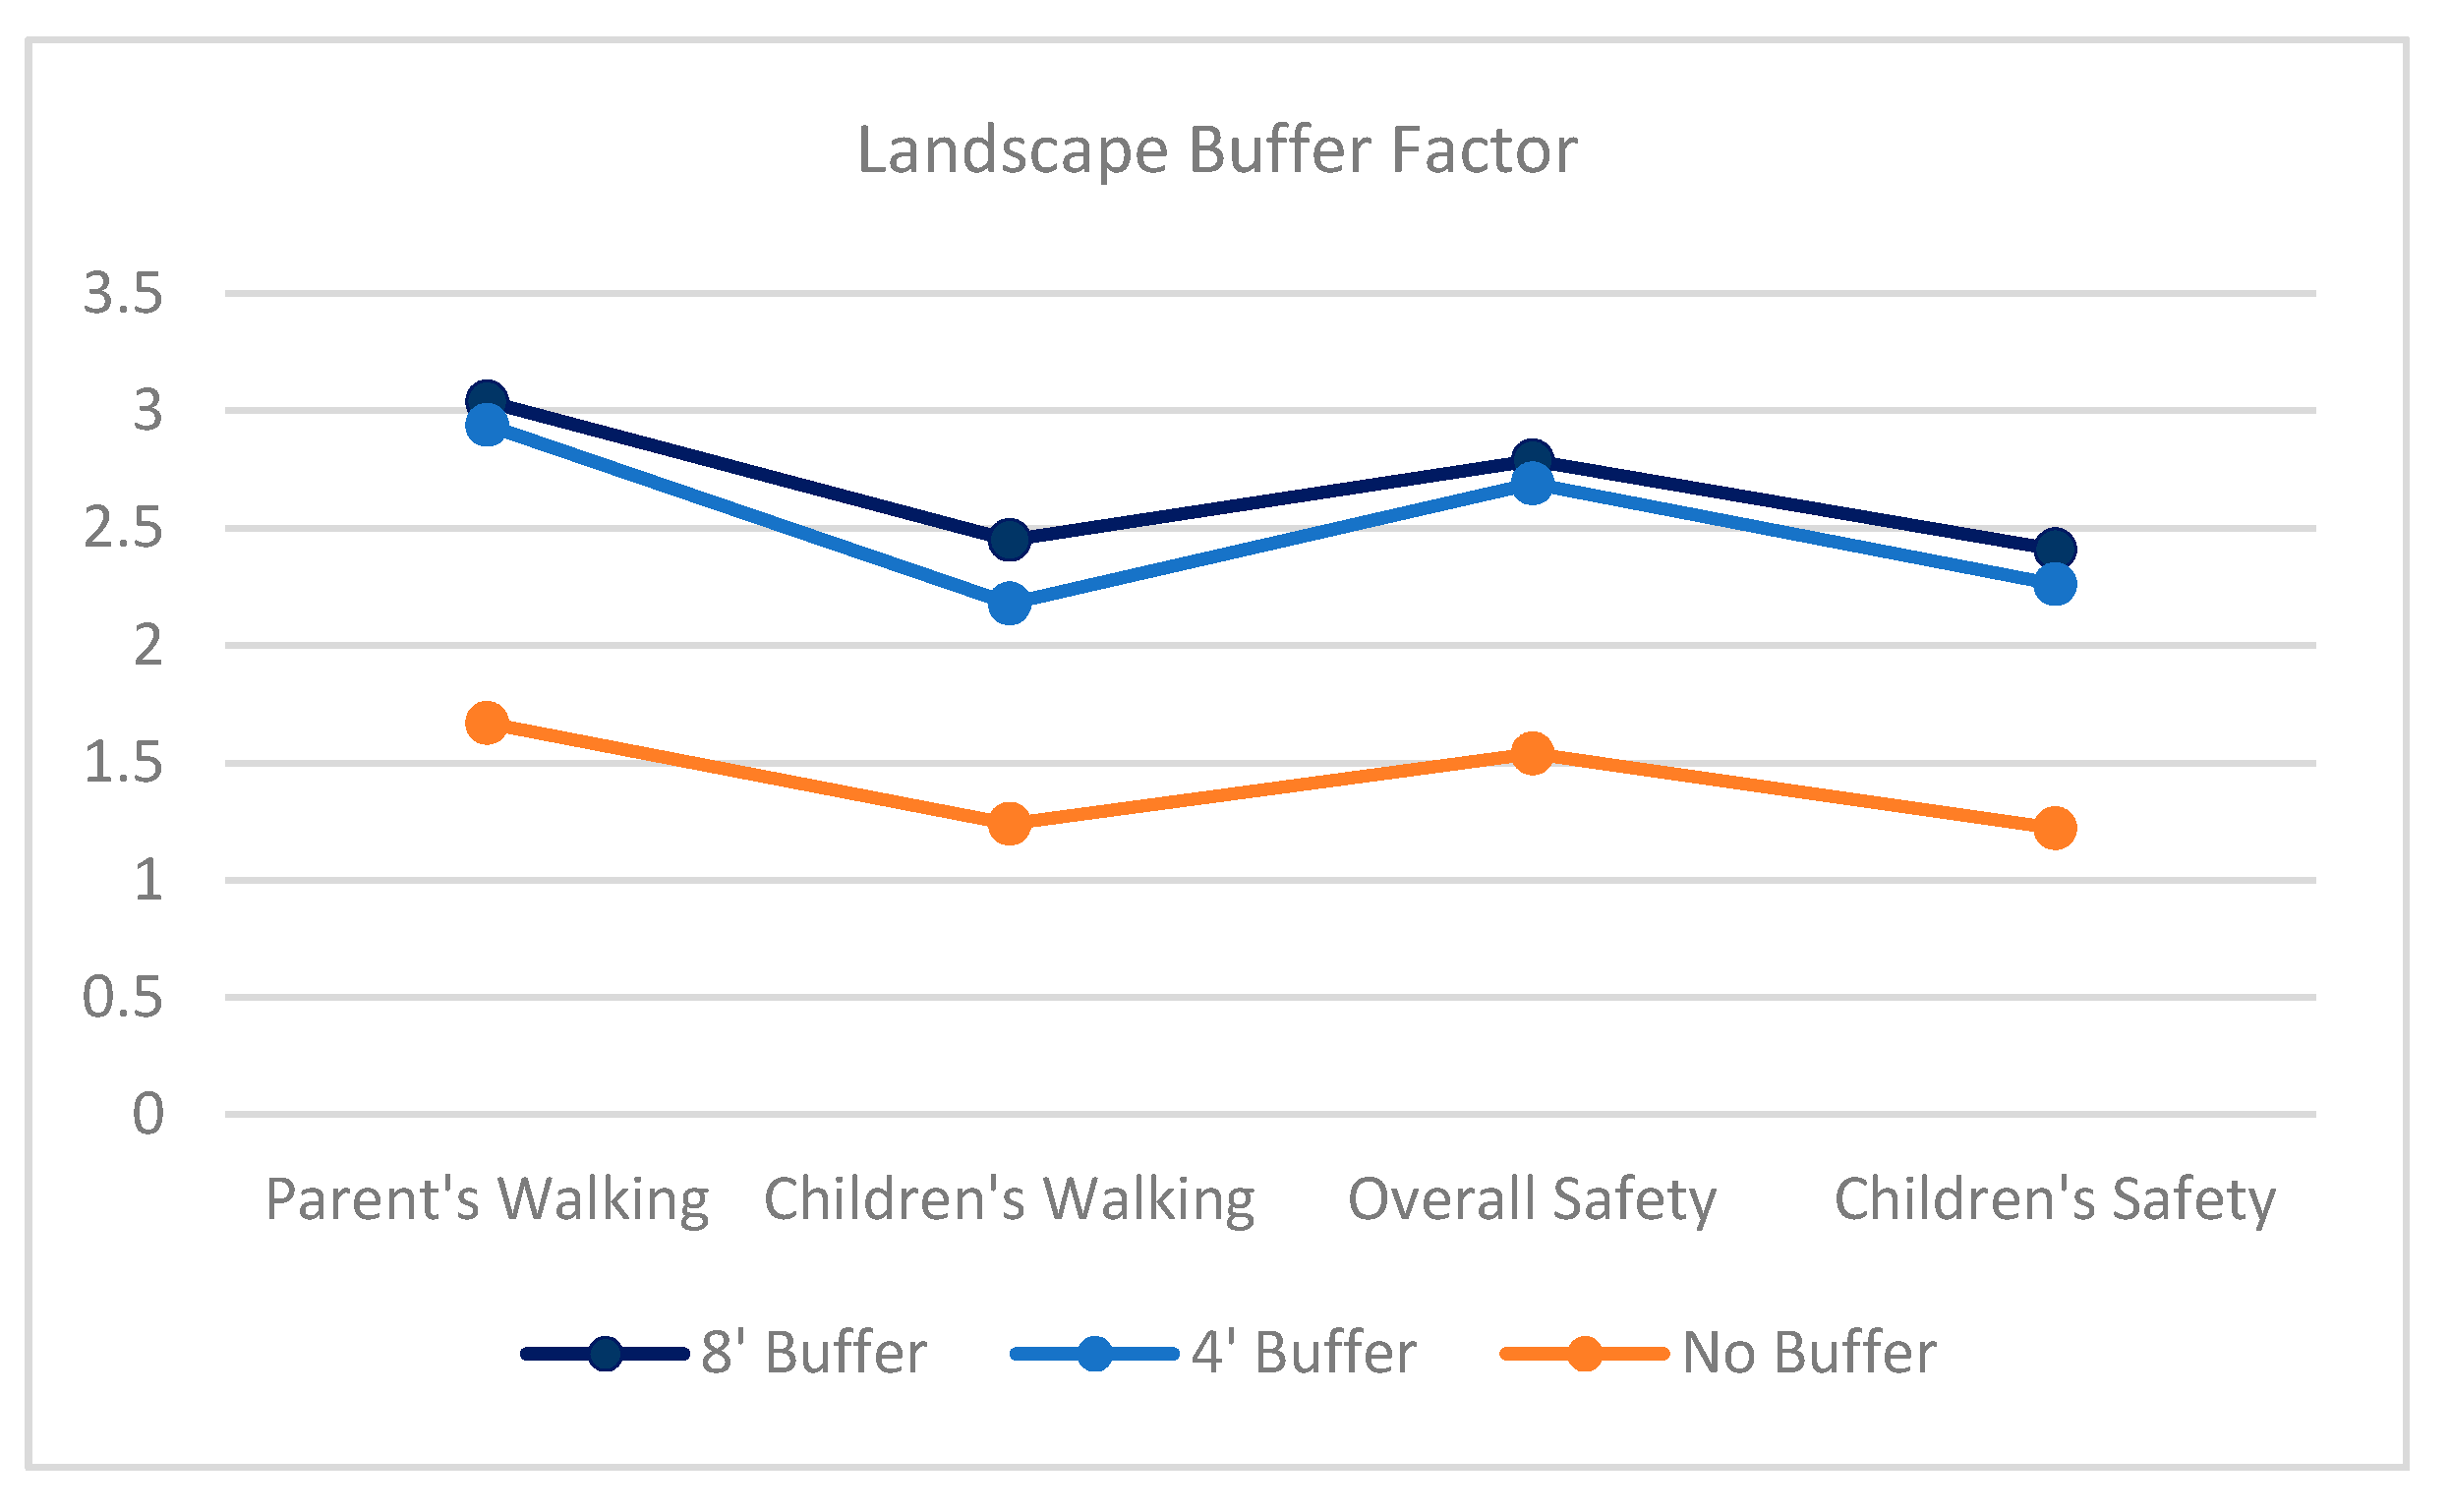
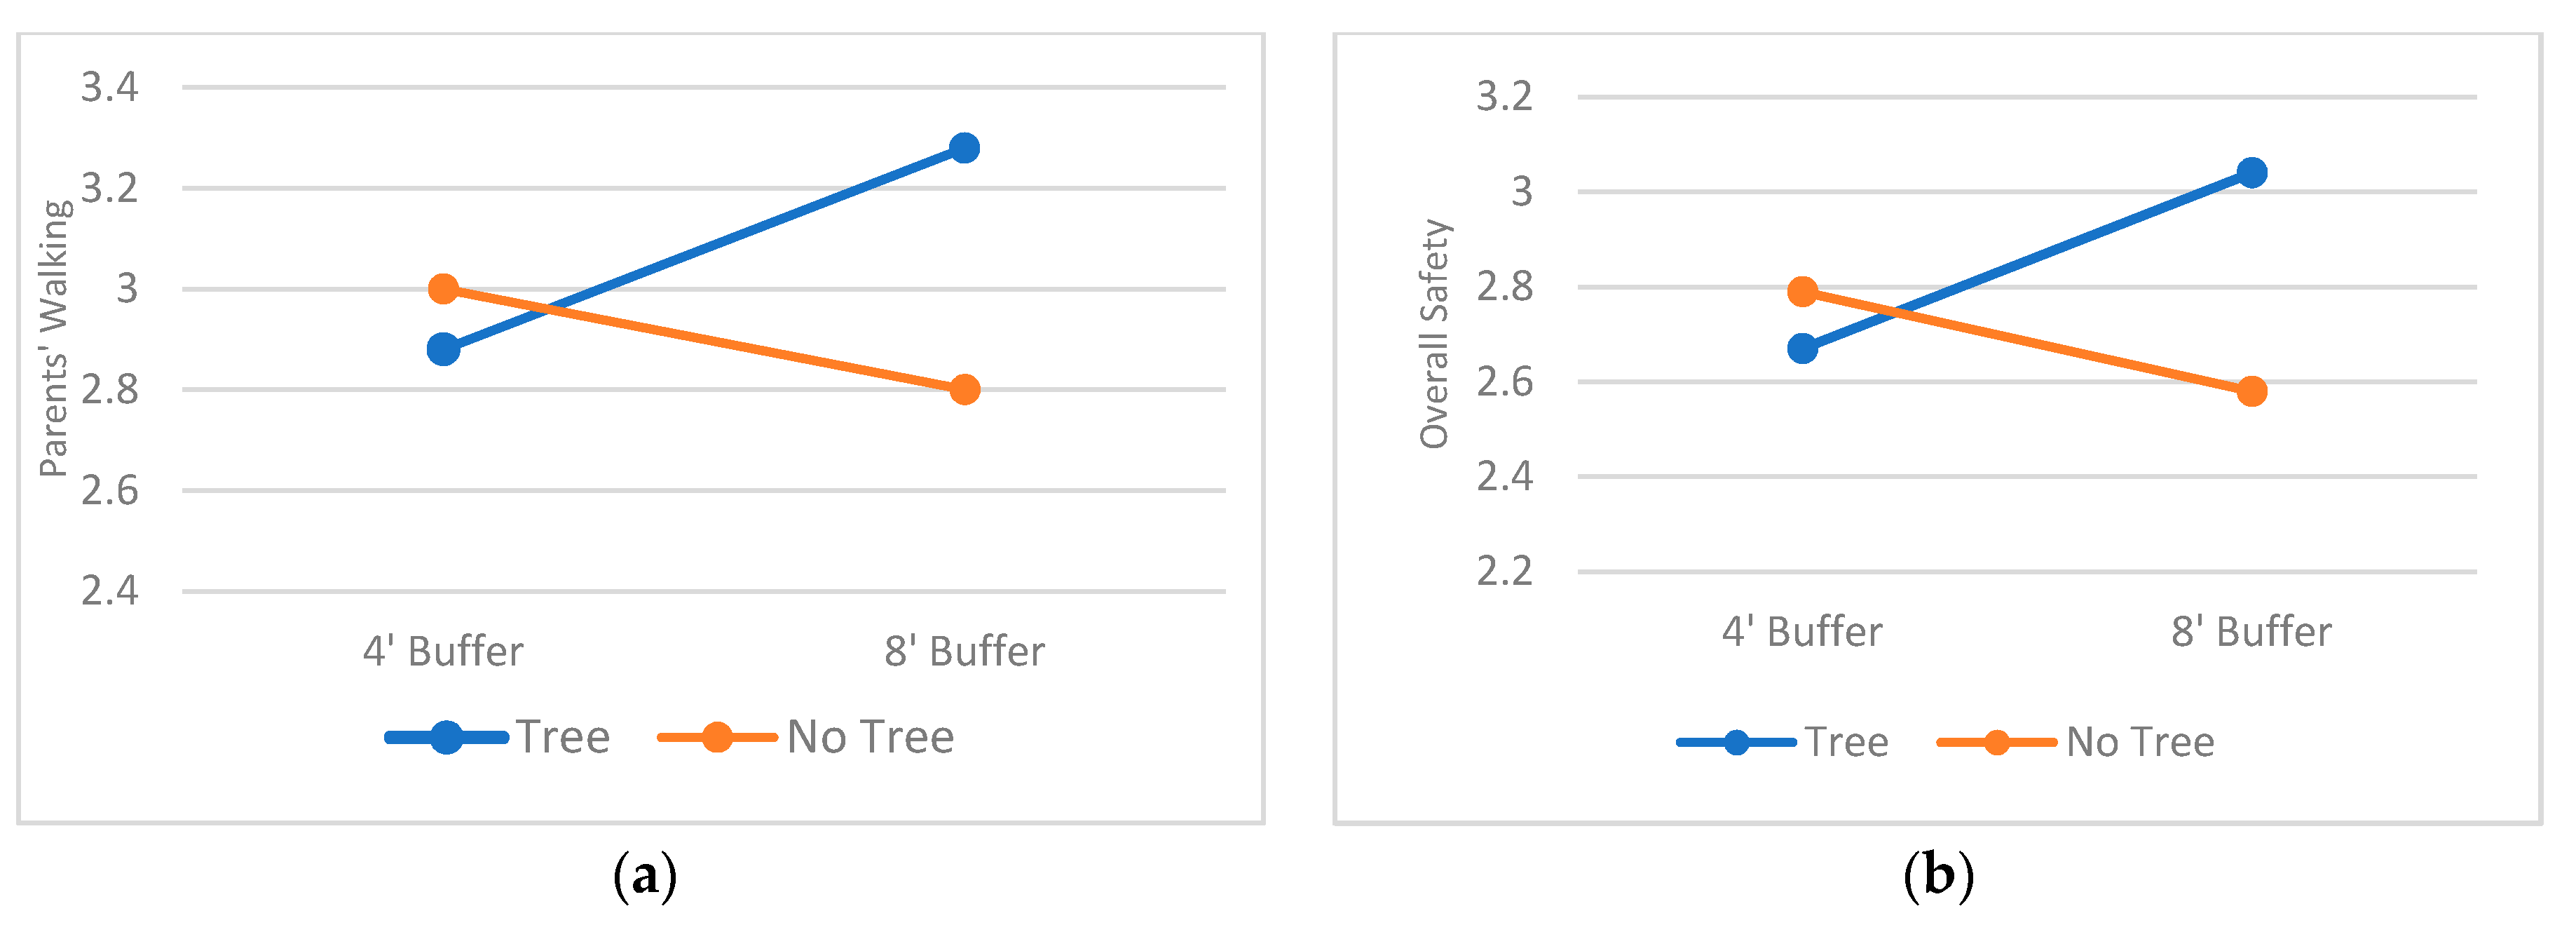
3.2.2. Landscape Buffers
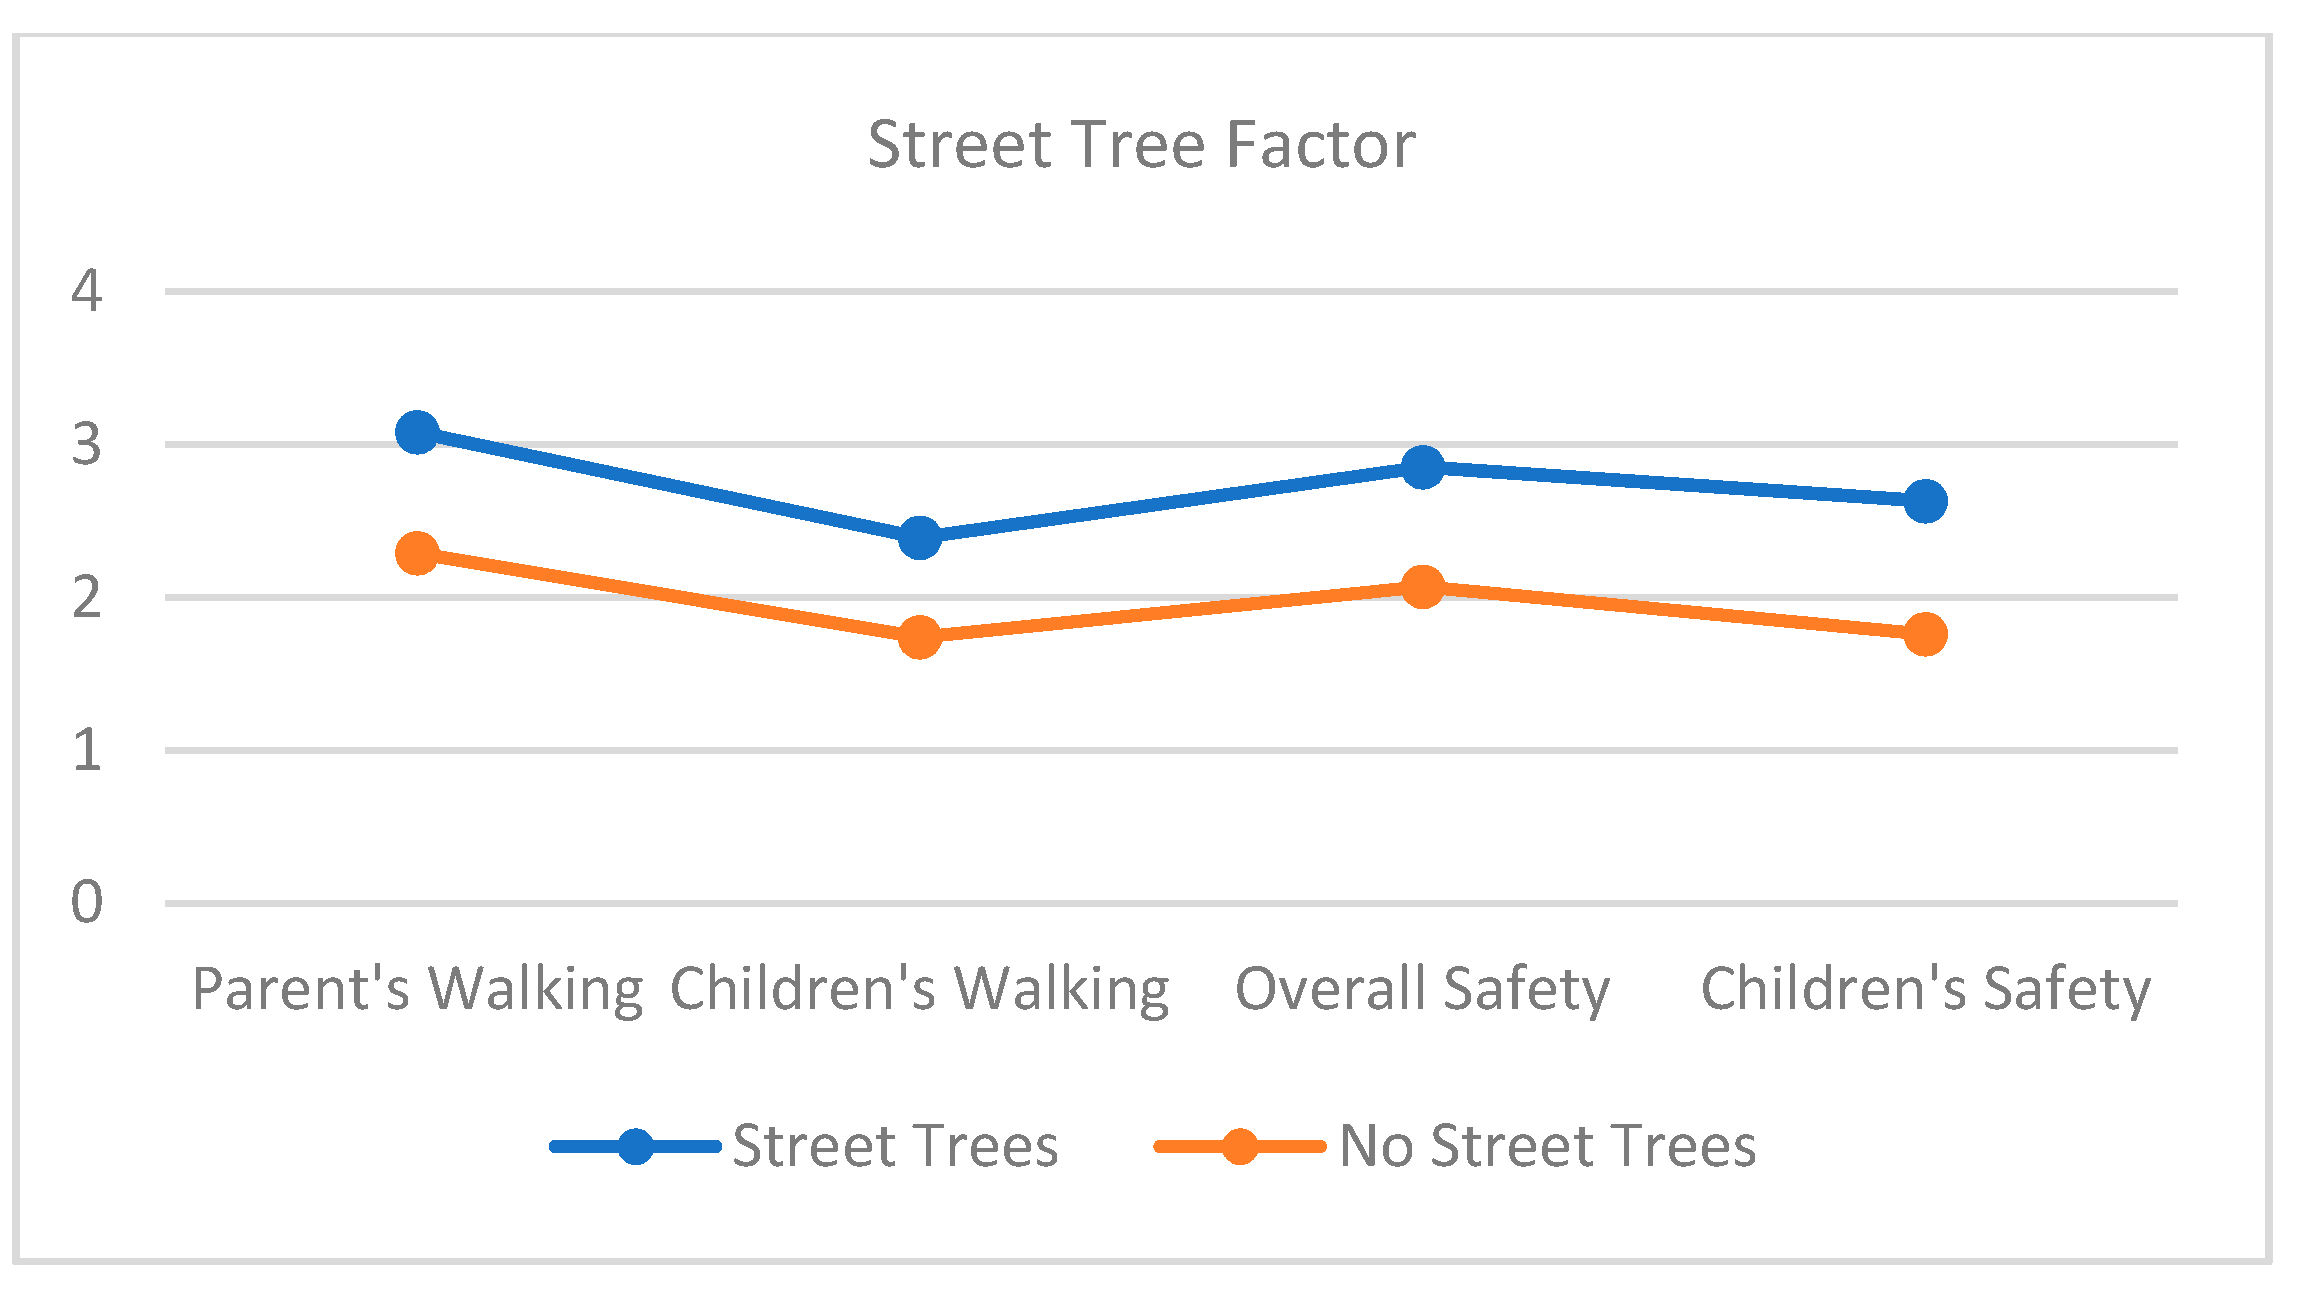
We tested three landscape buffer variables: No buffer, 4′ buffer, and 8′ buffer. As seen in Figure 2 and Table 7, all walking and perception of pedestrian safety variables were significantly different among the three pedestrian environments with three buffer types. The range of the partial eta square from 0.69 to 0.76 indicating that at least 69% of walking and safety variables were explained by landscape buffers. As a follow-up, we conducted LSD comparison tests and found that a significant difference existed between non-buffer and buffer conditions regardless of the buffer widths for all walking and safety variables. There were no significant differences between 4′ and 8′ buffers.
There were significant interactions between buffer widths and trees for parents’ walking and safety scores (Figure 3 and Table 8). In other words, parents’ decision to walk and perception of pedestrian safety increased when there were street trees in an 8′ buffer. On the contrary, parents were less likely walk or experienced decreased safety when there were trees in a 4′ buffer. These interaction effects are not significant for children’s walking and safety.

3.2.3. Street Trees

Figure 4 visually indicates the effects of trees. The partial eta square indicated that 66% of parent’s decision to walk and 64% of parent’s willingness to let their children walk can be explained by street trees (Table 9). Trees also contributed to the overall safety (ηp2 = 0.67) and children’s safety (ηp2 = 0.43).

4. Discussion and Conclusions

In summary, we found that the design of pedestrian environments does affect people’s perception of pedestrian safety and their willingness to walk. The presence of a sidewalk, buffer strip, and street trees affected parents’ decision to walk, their willingness let their children walk to school and perceived the environment as safer for walking. The effects of trees on parents’ walking and perception of pedestrian safety are greater when there is a wide buffer than a narrow buffer. It was also found that parents are more cautious about their children’s walking environments and safety than their own.
Compared to landscape buffers and trees, sidewalks had the largest partial eta squares for children’s walking (ηp2 = 0.85) and safety (ηp2 = 0.85). To parents, the existence of a sidewalk was the most important pedestrian environment factor for their children’s commute route for walkability and safety. It is important to have a sidewalk for all streets but it is especially important to have sidewalks within school walk zones. Buffers also played a critical role on parent’s perception of pedestrian safety for themselves and their children and their willingness to walk or let their children walk to school. This lateral separation from motor vehicle traffic is particularly important for their children’s walking and biking to school. This finding is not new but is consistent with other research findings [5,18].
Our important contribution is the finding of interaction effects between trees and landscape buffers for parents (Figure 3). In our study, not all trees improved the perception of pedestrian safety and walkability. Trees in an 8′ buffer still played an important role improving perceptions of safety and walkability for an adult population; however, trees in a 4′ buffer did not have a positive influence. It is also interesting to note that this interaction effect was not significant for children’s walking and safety. Previous research compared tree-lined streets with streets without trees [23] and found the positive effects of tree-lined streets on walkability. Our study suggests the size of the buffer used in tree-lined streets is an important consideration for improving a sense of safety and walkability. It is also important to note that designing pedestrian environments for children might be different from designing for adults alone.
The most frequently used physical activity facility was found to be streets (45.6%) compared to public spaces (28.8%) and beaches (22.7%) [12]. Including landscape buffers in street design may play an important role in this regard, not only in improving people’s health through increased walking activity, but also by decreasing anxiety levels while walking. Specifically, designing streets to include sidewalks, trees and landscape buffers increased parent’s perception of pedestrian safety for their children, and may lead to greater physical activity and healthier children. Creating supportive pedestrian environments that encourage greater physical activity behaviors should be a priority in the design of transportation infrastructure.
There are several specific limitations of this study as well. First, no two-way or three-way interaction effects were possible because not all binary conditions for all three factors were available (sidewalk, landscape buffers, and street trees). To understand the contribution of each factor relative to the other factors, a more complete dataset with all the binary conditions would be needed.
Second, even though our research design was within subjects, our sample size was still small and therefore not representative of a larger population. Furthermore, participants volunteered through a parent-teacher school group which is subject to self-selection bias. The approach was feasible because the convenience kept the costs low. To improve generalizability across a larger population, it might be cost effective to replicate this study with schools in other geographic regions. In combination with other similar studies, the aggregate findings may paint a bigger picture.
Another approach would be to conduct a much larger study with significantly more participants from a broader population. This could strengthen any conclusions and make them more generalizable, but it would also allow a more detailed look at related variables. Questions of tree size, spacing, deciduous versus evergreen, and pruning practices could be investigated. Various traffic patterns, speeds and flow volumes might be introduced. A larger study might also include a qualitative dimension where participants explained why they answered as they did. This may help connect findings to established theories of environmental behavior such as the prospect refuge theory posited by Jay Appleton [25].
Although the benefits and limitations of environmental simulation research have been published extensively elsewhere [26,27], it is worth noting a few benefits and limitations for this study. First, environmental simulation allows better control over the variables being studied at a more reasonable cost than actually building these same environments for testing purposes. Moreover, finding the exact mixes of variables and conditions to compare effectively from the real world would be unlikely. Thus, simulation offers an opportunity to study such conditions that otherwise might not be possible. Second, there are limitations such as ecological validity that suggest findings from simulations should only be used as one piece of evidence used to inform design and decision making. The benefits of abstracting environmental conditions for research purposes, is at the same time limiting the considerably wide variety of different circumstances one might actually find in the field. In short, these findings are best used to inform and not dictate design.
The findings presented here suggest that implementing landscape buffers and planting trees in wide buffers may lead to more walking by improving people’s perceptions of pedestrian safety. This may lead to improvements in people’s health by increasing their walking activity [28]. Creating supportive roadway environments that facilitate walking should be an important goal for designing pedestrian environments.

Author Contributions

Conceptualization, B.-S.K. and J.R.-N.; methodology, B.-S.K. and J.R-N.; software, W.-H.S.; validation, B.-S.K.; formal analysis, B.-S.K. and W.-H.S.; investigation, B.-S.K. and J.R.-N.; resources, B.-S.K. and J.R.-N.; data curation, W.-H.S.; writing—original draft preparation, B.-S.K., C.D.E. and B.H.D.; writing—review and editing, B.-S.K., C.D.E. and B.H.D.; visualization, B.-S.K. and W.-H.S.; supervision, B.-S.K. and J.R.-N.; project administration, B.-S.K. and J.R.-N.; funding acquisition, B.-S.K. and J.R.-N. All authors have read and agreed to the published version of the manuscript.

Funding

This research was funded by the Southwest Region University Transportation Center, grant number 167722.

Institutional Review Board Statement

The study was conducted according to the guidelines of the Declaration of Helsinki, and approved by the Institutional Review Board of Texas A&M University.

Informed Consent Statement

Informed consent was obtained from all subjects involved in the study.

Data Availability Statement

The data that support the findings of this study are available from the corresponding author, Byoung-Suk Kweon, upon reasonable request.

Conflicts of Interest

The authors declare no conflict of interest.

References

  1. Anderson, P.M.; Butcher, K.F.; Schanzenbach, D.W. Understanding recent trends in childhood obesity in the United States. Econ. Hum. Biol. 2019, 34, 16–25. [Google Scholar] [CrossRef] [PubMed]
  2. Kontou, E.; McDonald, N.C.; Brookshire, K.; Pullen-Seufert, N.C.; LaJeunesse, S.U.S. active school travel in 2017: Prevalence and correlates. Prev. Med. Rep. 2020, 17, 101024. [Google Scholar] [CrossRef] [PubMed]
  3. Weigand, L. A Review of Literature: The effectiveness of Safe Routes to School and Other Programs to Promote Active Transportation to School; Portland State University: Portland, OR, USA, 2008. [Google Scholar]
  4. Boarnet, M.G.; Anderson, C.L.; Day, K.; McMillan, T.; Alfonzo, M. Evaluation of the California Safe Routes to School legislation: Urban form changes and children’s active transportation to school. Am. J. Prev. Med. 2005, 28, 134–140. [Google Scholar] [CrossRef] [PubMed]
  5. Landis, B.W.; Vattikuti, V.R.; Ottenberg, R.M.; McLeod, D.S.; Guttenplan, M. Modeling the Roadside Walking Environment: Pedestrian Level of Service. Transp. Res. Rec. J. Transp. Res. Board 2001, 1773, 82–88. [Google Scholar] [CrossRef]
  6. USA Department of Transportation, Federal Highway Administration. Pedestrian Facilities Users Guide—Providing Safety and Mobility. Available online: https://www.fhwa.dot.gov/publications/research/safety/01102/01102.pdf (accessed on 28 May 2021).
  7. Eyler, A.A.; Brownson, R.C.; Bacak, S.J.; Housemann, R.A. The Epidemiology of Walking for Physical Activity in the United States. Med. Sci. Sports Exerc. 2003, 35, 1529–1536. [Google Scholar] [CrossRef] [PubMed] [Green Version]
  8. Knell, G.; Durand, C.P.; Shuval, K.; Kohl III, H.W.; Salvo, D.; Olyuomi, A.; Gabriel, K.P. If you build, will they come? A quasi-experiment of sidewalk improvements and physical activity. Transl. J. Am. Coll. Sports Med. 2018, 3, 66–67. [Google Scholar] [PubMed]
  9. McMahon, P.J.; Zegeer, C.V.; Duncan, C.; Knoblauch, R.L.; Stewart, J.R.; Khattak, A.J. An Analysis of Factors Contributing to ‘Walking Along Roadway’ Crashes: Research Study and Guidelines for Sidewalks and Walkways; University of North Carolina Highway Safety Research Center: Chapel Hill, NC, USA, 2002. [Google Scholar]
  10. USA Department of Transportation, National Highway Traffic Safety Administration. Traffic Safety Facts: 2017 Data. Available online: https://crashstats.nhtsa.dot.gov/Api/Public/ViewPublication/812719 (accessed on 28 June 2021).
  11. Knoblauch, R.; Tustin, B.; Smith, S.; Pietrucha, M. Investigation of Exposure-Based Pedestrian Accident Areas: Crosswalks, Sidewalks, Local Streets, and Major Arterials; US Department of Transportation: Washington, DC, USA, 1988. [Google Scholar]
  12. Giles-Corti, B.; Donovan, R.J. The relative influence of individual, social and physical environment determinants of physical activity. Soc. Sci. Med. 2002, 54, 1793–1812. [Google Scholar] [CrossRef]
  13. Sallis, J.F. Measuring Physical Activity Environments: A Brief History. Am. J. Prev. Med. 2009, 36, S86–S92. [Google Scholar] [CrossRef] [PubMed] [Green Version]
  14. Cooper, A.R.; Andersen, L.B.; Wedderkopp, N.; Page, A.S.; Froberg, K. Physical Activity Levels of Children Who Walk, Cycle, or Are Driven to School. Am. J. Prev. Med. 2005, 29, 179–184. [Google Scholar] [CrossRef] [PubMed]
  15. Rosenberg, R.E.; Sallis, J.F.; Conway, T.L.; Cain, K.L.; McKenzie, T.L. Active Transportation to School Over 2 Years in Relation to Weight Status and Physical Activity. Obesity 2006, 14, 1771–1776. [Google Scholar] [CrossRef] [PubMed]
  16. Mendoza, J.; Watson, K.; Nguyen, N.; Cerin, E.; Baranowski, T.; Nicklas, T.A. Active Commuting to School and Association with Physical Activity and Adiposity Among US Youth. J. Phys. Act. Health 2011, 8, 488–495. [Google Scholar] [CrossRef] [PubMed]
  17. Sirard, J.R.; Riner, W.F.; McIver, K.L.; Pate, R.R. Physical Activity and Active Commuting to Elementary School. Med. Sci. Sports Exerc. 2005, 37, 2062–2069. [Google Scholar] [CrossRef] [PubMed]
  18. Nabors, D.; Schneider, R.; Leven, D.; Lieberman, K.; Mitchell, C. Chapter 3: Actions to Increase the Safety of Pedestrian Accessing Transit. Pedestrian Safety Guide for Transit Agencies; Federal Highway Administration: Washington, DC, USA, 2008; pp. 24–48. Available online: https://safety.fhwa.dot.gov/ped_bike/ped_transit/ped_transguide/transit_guide.pdf (accessed on 23 May 2021).
  19. Texas Department of Transportation. Landscape and Aesthetics Design Manual. Available online: http://onlinemanuals.txdot.gov/txdotmanuals/lad/lad_mn.htm (accessed on 12 May 2021).
  20. Velarde, M.; Fry, G.; Tveit, M. Health effects of viewing landscapes—Landscape types in environmental psychology. Urban. For. Urban. Green. 2007, 6, 199–212. [Google Scholar] [CrossRef]
  21. Opdam, P. Implementing human health as a landscape service in collaborative landscape approaches. Landsc. Urban. Plan. 2020, 199, 103819. [Google Scholar] [CrossRef]
  22. Chen, Y.; Liu, T.; Xie, X.; Marušić, B.G. What Attracts People to Visit Community Open Spaces? A Case Study of the Overseas Chinese Town Community in Shenzhen, China. Int. J. Environ. Res. Public Health 2016, 13, 644. [Google Scholar] [CrossRef] [PubMed] [Green Version]
  23. Giles-Corti, B.; Donovan, R.J. Relative Influences of Individual, Social Environmental, and Physical Environmental Correlates of Walking. Am. J. Public Health 2003, 93, 1583–1589. [Google Scholar] [CrossRef] [PubMed]
  24. Maghelal, P.; Natesan, P.; Rosenblatt-Naderi, J.; Kweon, B. Investigating the use of virtual reality for pedestrian environment. J. Archit. Plan. Res. 2011, 28, 104–117. [Google Scholar]
  25. Appleton, J. The Expereince of Landscape; John Wiley & Sons: New York, NY, USA, 1996. [Google Scholar]
  26. Marans, R.W.; Stokols, D. (Eds.) Environmental Simulation: Research and Policy Issues; Plenum Press: New York, NY, USA, 1993. [Google Scholar] [CrossRef]
  27. Caffò, A.O.; Tinella, L.; Lopez, A.; Spano, G.; Massaro, Y.; Lisi, A.; Stasolla, F.; Catanesi, R.; Nardulli, F.; Grattagliano, I.; et al. The Drives for Driving Simulation: A Scientometric Analysis and a Selective Review of Reviews on Simulated Driving Research. Front. Psychol. 2020, 11, 917. [Google Scholar] [CrossRef] [PubMed]
  28. Rosenblatt Naderi, J. On the Nature of Walking and Learning Pedestrian Environments. ARCC Conference Repository 2019, 1. Available online: https://www.arcc-journal.org/index.php/repository/article/view/792 (accessed on 22 July 2021).
Figure 1. Sidewalk vs. no sidewalk means for walking and perception of pedestrian safety variables.
Sustainability 13 08728 g001
Figure 2. Landscape buffer factor means for walking and perception of pedestrian safety variables.
Sustainability 13 08728 g002
Figure 3. Interactions between buffer widths and trees: (a) parents’ walking; (b) overall safety.
Sustainability 13 08728 g003
Figure 4. Street tree factor means for walking and perception of pedestrian safety variables.
Sustainability 13 08728 g004
Table 1. Environmental Conditions.
Condition 1Condition 2Condition 3Condition 4Condition 5Condition 6
SidewalksNoYesYesYesYesYes
Landscape BufferNoNo4 feet8 feet4 feet8 feet
Street TreesNoNoNoNoYesYes
Table 2. The comparison between environmental condition simulations and actual environments.
ConditionsSimulationsActual Environments
1 Sustainability 13 08728 i001 Sustainability 13 08728 i002
2 Sustainability 13 08728 i003 Sustainability 13 08728 i004
3 Sustainability 13 08728 i005 Sustainability 13 08728 i006
4 Sustainability 13 08728 i007 Sustainability 13 08728 i008
5 Sustainability 13 08728 i009 Sustainability 13 08728 i010
6 Sustainability 13 08728 i011 Sustainability 13 08728 i012
Table 3. Means and Standard Deviations among Major Variables.
Condition 1
Mean (SD)
Condition 2
Mean (SD)
Condition 3
Mean (SD)
Condition 4
Mean (SD)
Condition 5
Mean (SD)
Condition 6
Mean (SD)
Grand
Mean (SD)
SidewalkNoYesYesYesYesYes
Landscape BufferNoNo4 feet8 feet4 feet8 feet
Street TreesNoNoNoNoYesYes
Parents’ Walking1.54 (0.76)1.81 (0.85)3.00 (0.69)2.81 (0.80)2.88 (0.77)3.28 (0.61)2.55 (0.49)
Children’s Walking1.15 (0.37)1.33 (0.60)2.19 (0.72)2.29 (0.84)2.17 (0.76)2.60 (0.78)1.97 (0.47)
Overall Safety1.40 (0.58)1.65 (0.63)2.76 (0.60)2.52 (0.82)2.65 (0.75)3.04 (0.72)2.34 (0.48)
Children’s Safety1.15 (0.37)1.25 (0.48)2.28 (0.77)2.31 (0.75)2.23 (0.86)2.52 (0.78)1.96 (0.47)
Table 4. Repeated measures of analysis of variance for major variables.
Between SubjectsWithin SubjectsInteraction
Order (O)Pedestrian Environments (PE)O × PE
SSdfMSFSSdfMSFSSdfMSF
Parents’ Walking10.6352.131.6862.64512.5335.63 ***12.41250.501.41
Children’s Walking6.8951.381.0941.5358.3125.18 ***6.51250.260.79
Overall Safety5.7251.150.9043.4758.6929.61 ***10.91250.441.49
Children’s Safety6.9951.401.4044.6458.9324.47 ***8.34250.330.92
Note. SS: Sum of square, MS: Mean square, *** p < 0.001.
Table 5. Significant pairwise comparisons among different conditions.
ConditionsConditionsMean Difference
Parent’s WalkingChildren’s WalkingOverall SafetyChildren’s Safety
13−1.52 ***−1.04 ***−1.35 ***−1.13 ***
4−1.32 ***−1.14 ***−1.13 ***−1.16 ***
5−1.40 ***−1.02 ***−1.22 ***−1.08 ***
6−1.80 ***−1.48 ***−1.57 ***−1.38 ***
23−1.24 ***−0.86 ***−1.09 ***−1.00 ***
4−1.04 ***−0.96 ***−0.87 ***−1.03 ***
5−1.12 ***−0.84 ***−0.96 ***−0.95 ***
6−1.52 ***−1.3 ***−1.30 ***−1.25 ***
63ns0.44 *nsns
640.48 **0.34 *0.44 **ns
650.40 **0.46 **0.35 **0.14 *
Note. * p < 0.05, ** p < 0.01, *** p < 0.001.
Table 6. Repeated measures of analysis of variance for sidewalk factor.
Sidewalks
SSdfFηp2
Parents’ Walking19.20172.33 ***0.74
Children’s Walking12.071135.96 ***0.85
Overall Safety16.531147.35 ***0.86
Children’s Safety38.711149.04 ***0.86
Note. SS: Sum of square, ηp2: Partial eta square, *** p < 0.001.
Table 7. Repeated measures of analysis of variance for landscape buffer factor.
Landscape Buffers
SSdfMSFηp2
Parents’ Walking30.20215.1078.36 ***0.76
Children’s Walking21.05210.5254.92 ***0.69
Overall Safety25.16212.5861.83 ***0.71
Children’s Safety21.95210.9759.30 ***0.70
Note. SS: Sum of square, MS: Mean square, ηp2: Partial eta square, *** p < 0.001.
Table 8. Repeated measures of analysis of variance for testing the interaction between buffer widths and trees.
Main EffectsInteraction
Buffer Widths (BW)Street Trees (ST)BW × ST
SSdfFηp2SSdfFηp2SSdfFηp2
Parents’ Walking0.8111.630.060.2510.800.032.25121.6 ***0.47
Children’s Walking0.6411.840.071.9613.910.140.8113.940.14
Overall Safety0.6711.960.080.1710.610.032.04110.53 **0.31
Children’s Safety0.1710.310.010.6413.380.120.4511.460.06
Note. SS: Sum of square, ηp2: Partial eta square, ** p < 0.01, *** p < 0.001.
Table 9. Repeated measures of analysis of variance for street tree factor.
Street Trees
SSdfFηp2
Parents’ Walking8.08148.47 ***0.66
Children’s Walking5.56145.30 ***0.64
Overall’ Safety7.89149.99 ***0.67
Children’s Safety9.66119.21 ***0.43
Note. SS: Sum of square, ηp2: Partial eta square, *** p < 0.001.
Publisher’s Note: MDPI stays neutral with regard to jurisdictional claims in published maps and institutional affiliations.

