Article

Rapid-Survey Methodology to Assess Litter Volumes along Large River Systems—A Case Study of the Tamsui River in Taiwan

1
Department of Environmental Engineering, National Cheng Kung University, Tainan 701, Taiwan
2
Department of Geosciences, National Taiwan University, Taipei 106, Taiwan
3
IndigoWaters Institute, Kaohsiung City 807, Taiwan
*
Authors to whom correspondence should be addressed.
Sustainability 2021, 13(16), 8765; https://0-doi-org.brum.beds.ac.uk/10.3390/su13168765
Submission received: 29 June 2021 / Revised: 20 July 2021 / Accepted: 23 July 2021 / Published: 5 August 2021
(This article belongs to the Special Issue Research on Estimating Plastic Leakage into the Environment)

Abstract

:
Riverbanks are an important source of plastic pollution. However, the current assessment methods for riverbank litter are based on a point-based sampling which is time consuming and limited in scope. To quickly assess hotspot areas and litter compositions in larger areas, this study developed a new citizen science bicycle survey for riverine debris. Covering 281.5 km of the Tamsui river system in Taiwan, the new methodology was tested at one of the most plastics polluted rivers in the world. The results revealed an average litter density of 15.3 m3/km at the river mouth and of 0.2 m3/km to 2.8 m3/km along the riverbanks further upstream. The coastline was mainly polluted by derelict fishing gear whereas single-use plastics and illegally dumped waste dominated the upstream areas. A correlation between litter and population density could not be identified, but it was noted that litter hotspots occur at cut banks and near mangrove vegetation. Overall, the new methodology proved suitable to collect large quantities of data for scientific purposes and to quickly detect litter accumulations prior to clean-up activities.

1. Introduction

Marine litter poses a severe threat to marine life, human health, and the economy [1]. Its main impacts to marine life include entanglement and ingestion [2,3], but it can also spread invasive species [4], leak toxic additives [5], and contaminate the human food-chain [6]. In addition to derelict fishing gear [7,8], a major source of marine litter is single-use plastics [9] that can reach the ocean via inland waterways, wind and tides [10]. At an estimated annual input of 1.15–2.41 million tonnes, rivers are a key pathway for land-based plastic waste into the ocean [11,12]. So far, research about plastic pollution in rivers was focused on microplastic pollution and on discharge models that estimate the amount of plastic waste entering the oceans [13]. In general, little attention was paid to macroplastics which represent most riverine waste [13,14]. To effectively prevent and reduce marine litter, there is a need to better understand riverine macroplastics waste.
Starting in the early 2010s the number of studies on riverine plastic waste increased, whereby most of the studies took samples from bridges and boats [15]. For example, Moore et al. surveyed three rivers in California and found that an extrapolated 30 tonnes of plastics enter the Los Angeles basin per day [16]. However, such early studies were resource and labor intensive [16,17,18]. Only recently, with an increasing focus on macroplastics, less complicated visual observations [19] and an increasing number of citizen science studies appeared, e.g., [20,21]. From those, a majority concentrated on measuring floating macroplastics but not as much on riverbank debris. Yet, as riverbanks are an important source for macroplastics [20], and to develop budget models for whole catchment areas [13], there is a need to intensify research on riverbank debris.
One of the first studies on riverbank debris was carried out by Williams and Simmons, who counted the number of litter items in a 100 m long river transect at Cynon river in the United Kingdom [22]. Like other researchers [23,24], they found that riverbanks gradually deposit litter over time and reactivate it during periods of strong rainfall and floods. Another study that adopted 100 m long riverbank transects, sampled over 150 thousand litter items from the Rhine-Meuse river delta in the Netherlands [25]. The research classified the litter items into 110 categories, providing a very nuanced understanding of the riverbank waste composition. While datasets with a similar level of detail were obtained for the Adour river in France [26], the Seine river in France [27] and the Ems, Weser and Elbe rivers in Germany [28], other studies opted for narrower transects and less litter categories to sample larger areas with help of citizen scientists [21,29,30]. For example, Kiessling et al. employed over 5500 schoolchildren, to cover 250 survey sites at different rivers in Germany [20]. While this provided valuable snapshots of the river system, riverbank studies have not yet been able to provide continuous litter hotspot maps. One exception is Fujieda who developed a continuous bicycle survey for larger debris [31]. However, as the study is only available in Japanese and does not investigate the waste composition, its results have limited meaning and are difficult to replicate. Thus, there is a need for an improved methodology that can assess large rivers continuously with few people in a short time.
To date, most riverine litter studies have focused on Europe and North America [15]. Although Asian rivers are estimated to transport 86% of all riverine litter to the ocean [11], data on Asian rivers are still scarce, e.g., [21,32]. Taiwan is an East Asian island state that is heavily polluted by marine debris [33]. Previous research has focused on floating litter [34] and coastal macroplastics [33,35,36] but only to a very limited extent on the plastic pollution of its rivers, lakes, and freshwater reservoirs. The Tamsui river in north of Taiwan has been estimated to be the 16th most plastic polluting river in the world [11]. While its heavy metal and chemical pollution have been examined extensively [37,38,39], field data on its plastic pollution has only recently been collected for microplastics [24]. Data about macroplastics pollution of the Tamsui river, its potential sources and contribution to marine pollution are missing yet.
To address the methodological shortcomings of riverbank sampling, this study conducted a novel citizen science survey to quantify and classify litter along the Tamsui river system and its adjacent coastline. It is the first time to use bicycles as mode of transportation for citizen scientists to quickly cover large survey areas. We present first data about the amount, composition, and potential sources of macroplastics and other litter in an important urban river system in Asia. We discuss the advantages and disadvantages of the applied citizen science methodology and give suggestions for methodological improvements and actions to combat riverine debris.

2. Materials and Methods

2.1. Study Area

Located in East Asia, the Tamsui river network is the largest river system in northern Taiwan. It consists of the Tamsui river and its tributaries the Keelung river, the Xindian river and the Dahan river (Figure 1). It is 336 km long and has a catchment area of 2726 km2 in which 7.25 million people, approximately 30% of Taiwan’s population, live [24]. While its upstream area is mainly covered by forests [40], the downstream area is densely populated and urbanized. The river system is influenced by semidiurnal tides which carry seawater 25–40 km upstream from the river mouth [24] (Figure 1).
In this study, 242.5 km of the Tamsui river system and 39 km of its adjacent coastline were visually assessed in a bicycle survey (Figure 1). For this, the area was divided into continuous 500 m long sections, using GIS shapefiles of Taiwan [41]. While the exact coordinates of all 563 transects are provided in the Supplementary Materials, only 74.2% of the transects were accessible and considered for further analysis (Table 1).

2.2. Training of Volunteers

For this study, 24 volunteers from the Non-Governmental Organization (NGO) “Society of Wilderness” were recruited and trained. The training had the aim to improve volume-based litter estimates and included two rounds of the following three activities: (1) a visual estimation of the amount of litter in test areas along streets and riverbanks, (2) the collection of this litter in 14-L bags to verify the estimates, and (3) a comparison of the results to verify and improve the estimates. At the end of the training the participants were asked to collect different types of debris into one 14-L bag and spread it out on the ground as reference for future estimates. All citizen scientists were familiar with the 14-L bags as this is the official garbage bag size for residents in Taipei.

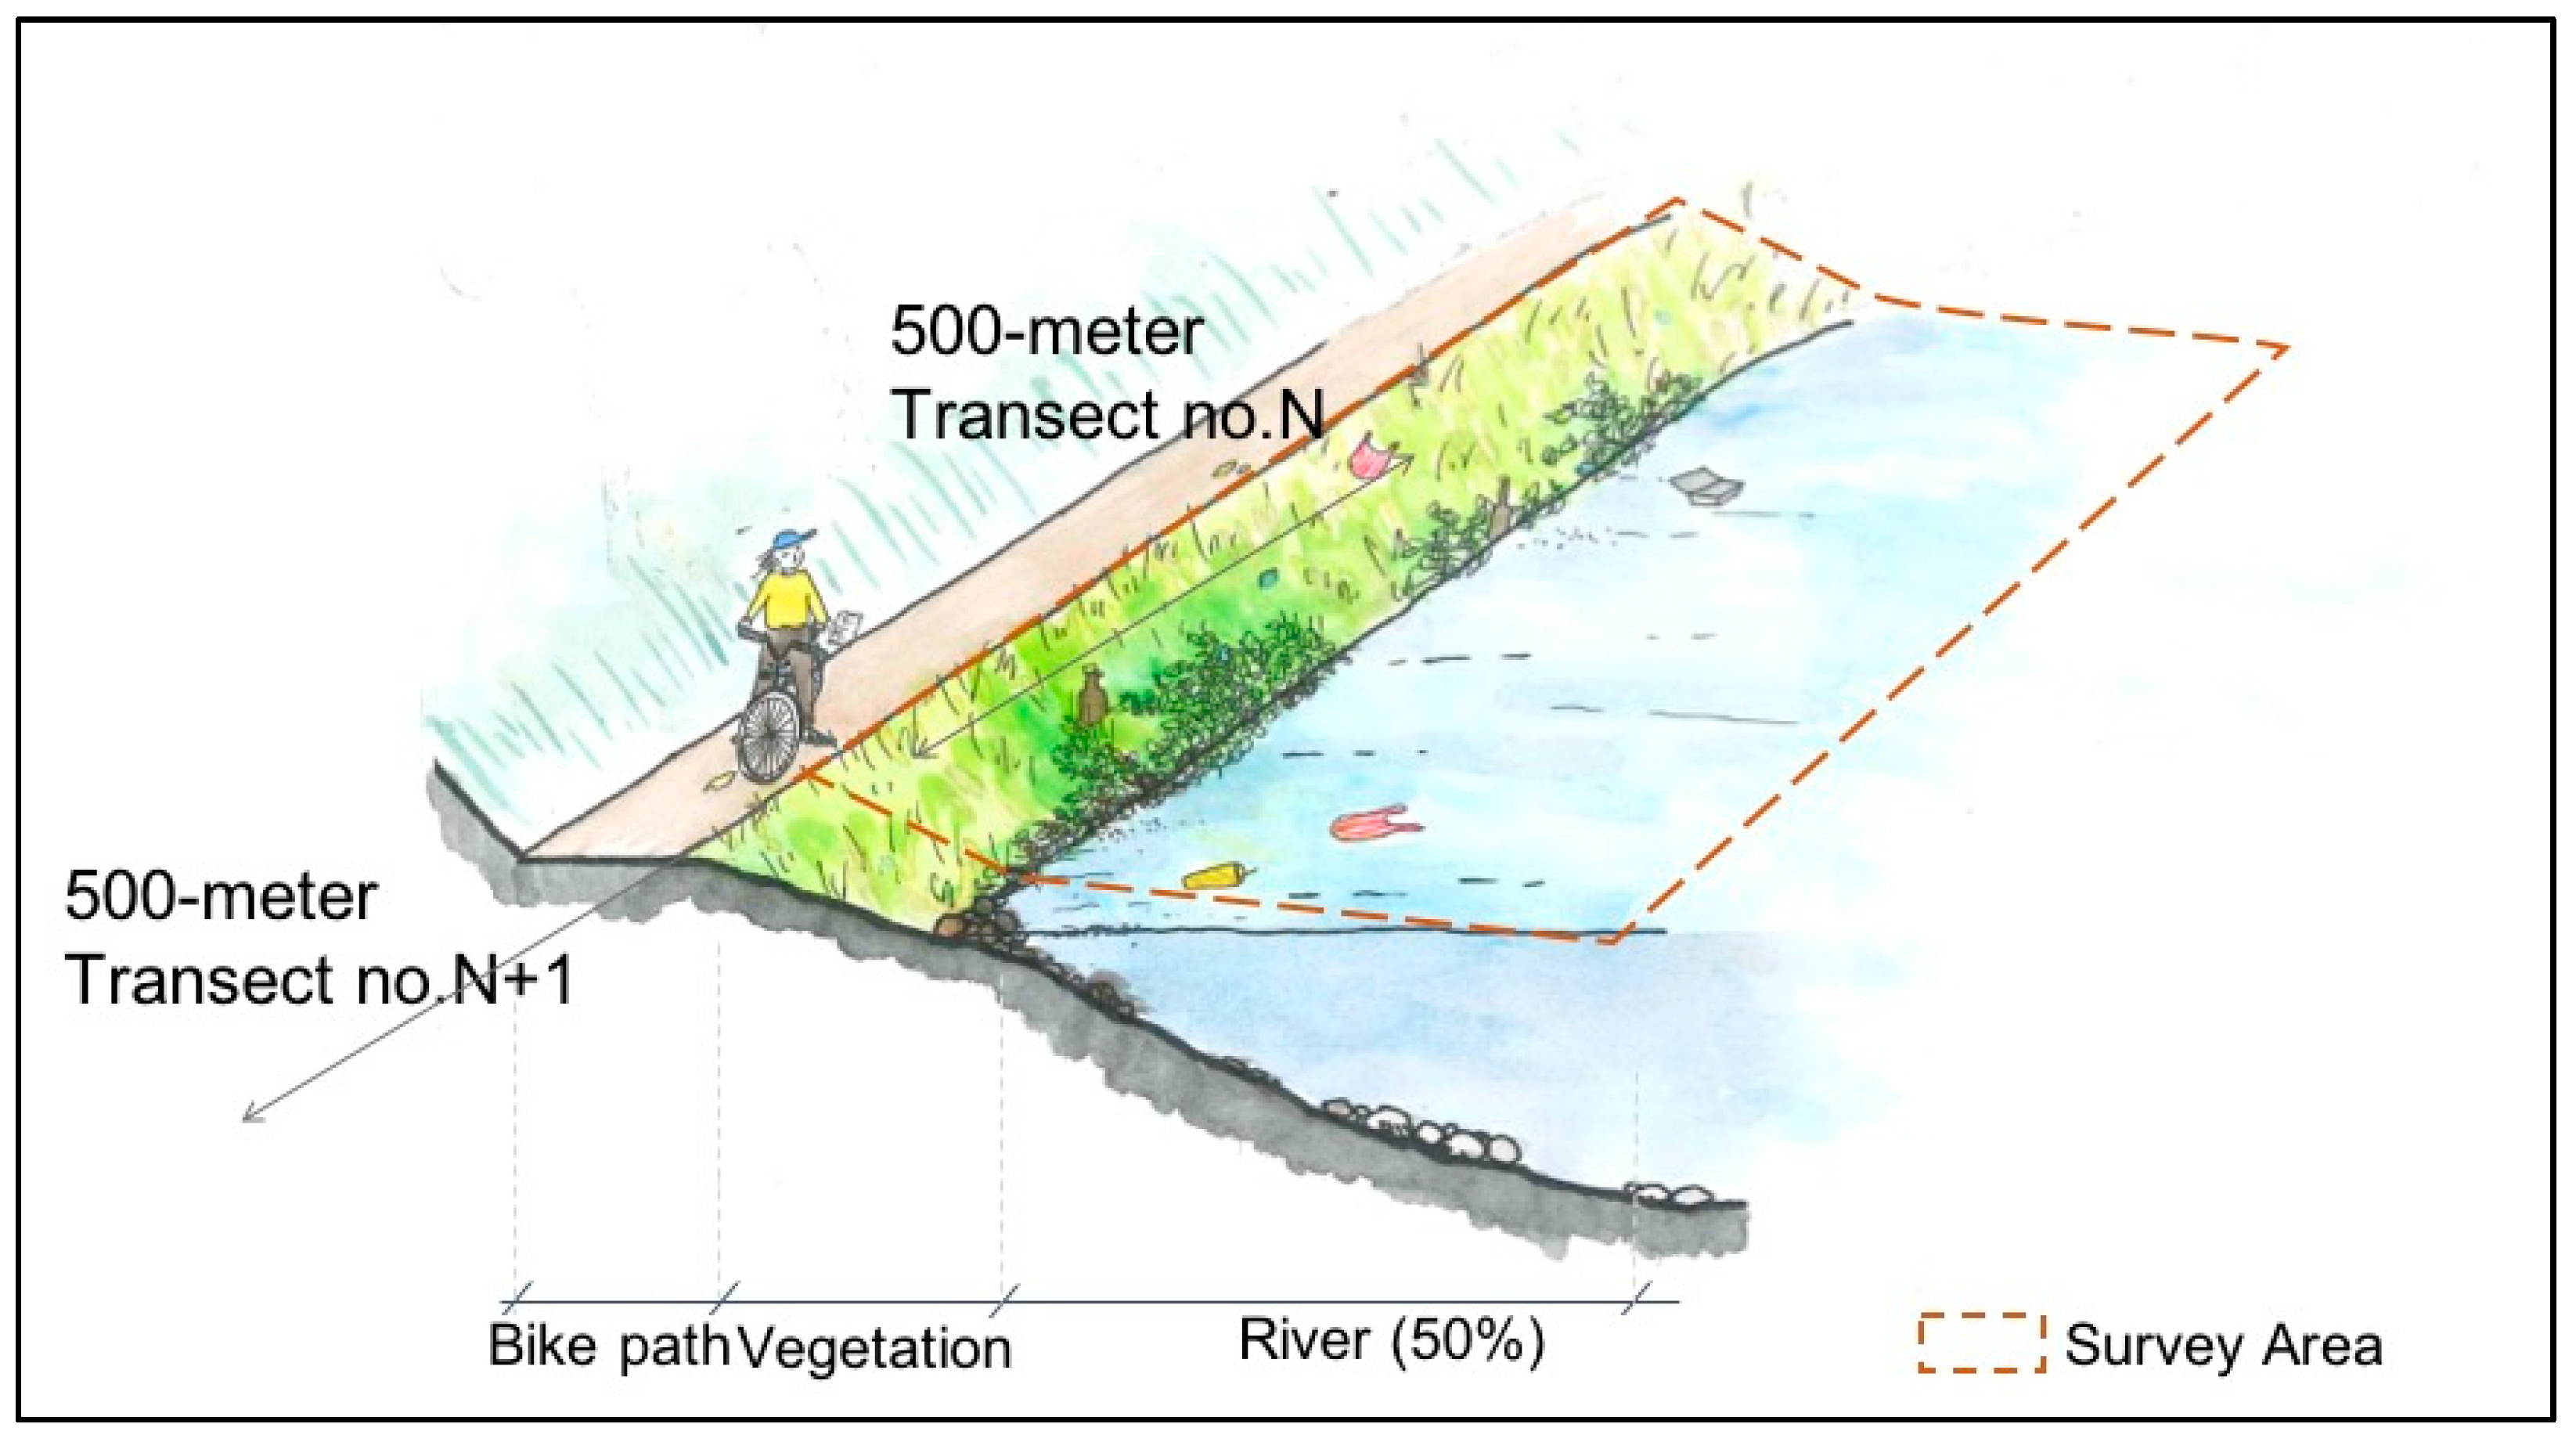
2.3. Monitoring Survey

After the workshops, the standing litter stock of the monitoring area (Figure 1) was assessed between February and April 2020. Like in a previous study from Japan [31], the volunteers covered the distance on a bicycle, considering all the area from the bicycle path until the middle of the river or the coastline front (Figure 2). Several pictures were taken during the assessment to verify the survey results.
At the end of each transect the volunteers were requested to fill in a survey on Google forms (Table 2). As basic information the surveyor’s name, survey date and time as well as the transects name, visibility and average width were recorded (Table 2). Visibility was used to describe how much of the surveyed area from the bike path to the water was visible. Four categories were used to describe visibility: (a) whole area from bike path to water line is visible, (b) water line is covered by plants of less than 1 m height, (c) water line is covered by plants taller than 1 m height, (d) whole transect is covered by vegetation or the view of the area is blocked.
The volunteers then estimated the litter volume within the transect adopting 14-L bags as a reference unit. For example, if a transect contained approximately three hand luggage of litter, an equivalent of 8× 14-L bags would be reported (Table 2). As in previous studies [8,43] the possible responses were limited to predefined values, with ranges between 0 and 2048 litter bags (Table 2). After the volume assessment, the three most common litter types were estimated based on the item frequency and volume. For this, the litter types were divided into 14 categories following previous classifications for common garbage on Taiwan’s coastline [33]. Depending on the level of pollution and composition, the volunteers could choose between zero and three dominating litter categories. Pictures of the most representative section, hotspot area and special find were uploaded.

2.4. Data Analysis

The uploaded survey data were transferred into an Excel sheet and manually checked for consistency. Jointly reported data for consecutive inaccessible transects were disaggregated. Any data entries from inaccessible transects were deleted and not used for further analysis. Composition data from transects that reported zero litter bags was not removed. This is because the litter quantities were rounded to the nearest predefined value (Table 2), so that zero litter bags could have represented up to 3.5 L waste.
After the data check, basic calculations were performed to convert the 14-L bags into cubic meters and to determine the total litter volume, length and average width for each section of the river system. A length-based litter density was calculated by dividing the length of the accessible transects by its litter volume. Additionally, an area-based litter density was calculated by dividing the length multiplied with its average width by its litter volume.
To visualize hotspot areas, each transect was assigned a pollution level ranging from 1 to 4 based on their length density (m3/km). Pollution level 1 was assigned to transects with a length density of less than 0.056 m3/km. Level 2 are transects with a length density of 0.11 m3 to 0.9 m3 debris per km. Transects with a length density between 1.8 m3/km to 7.2 m3/km were categorized as pollution level 3, and lastly transects with a length density larger than 14.3 m3 per km were classified as pollution level 4 (Table 3). A heatmap was created using QGIS version 3.16.7 to visualize areas with the highest pollution levels. Points in the heatmap are weighted using the pollution levels.
Information about the top three waste categories were summarized and converted into charts to identify differences between riverine and coastal litter compositions. The locations of the dominating litter categories were plotted in maps to better understand the litter distribution within the river sections. Representative pictures from hotspot sites were selected to identify potential sources of riverine and coastal debris.
To test for a correlation between pollution levels and population density we calculated the Pearson correlation coefficient and performed a linear regression. For this we first obtained the population data for each of Taipei’s city districts [42]. We then counted the number of level 1-4 polluted transects within each city district. Based on this the Pearson correlation coefficient was calculated for the differently polluted transects.

3. Results

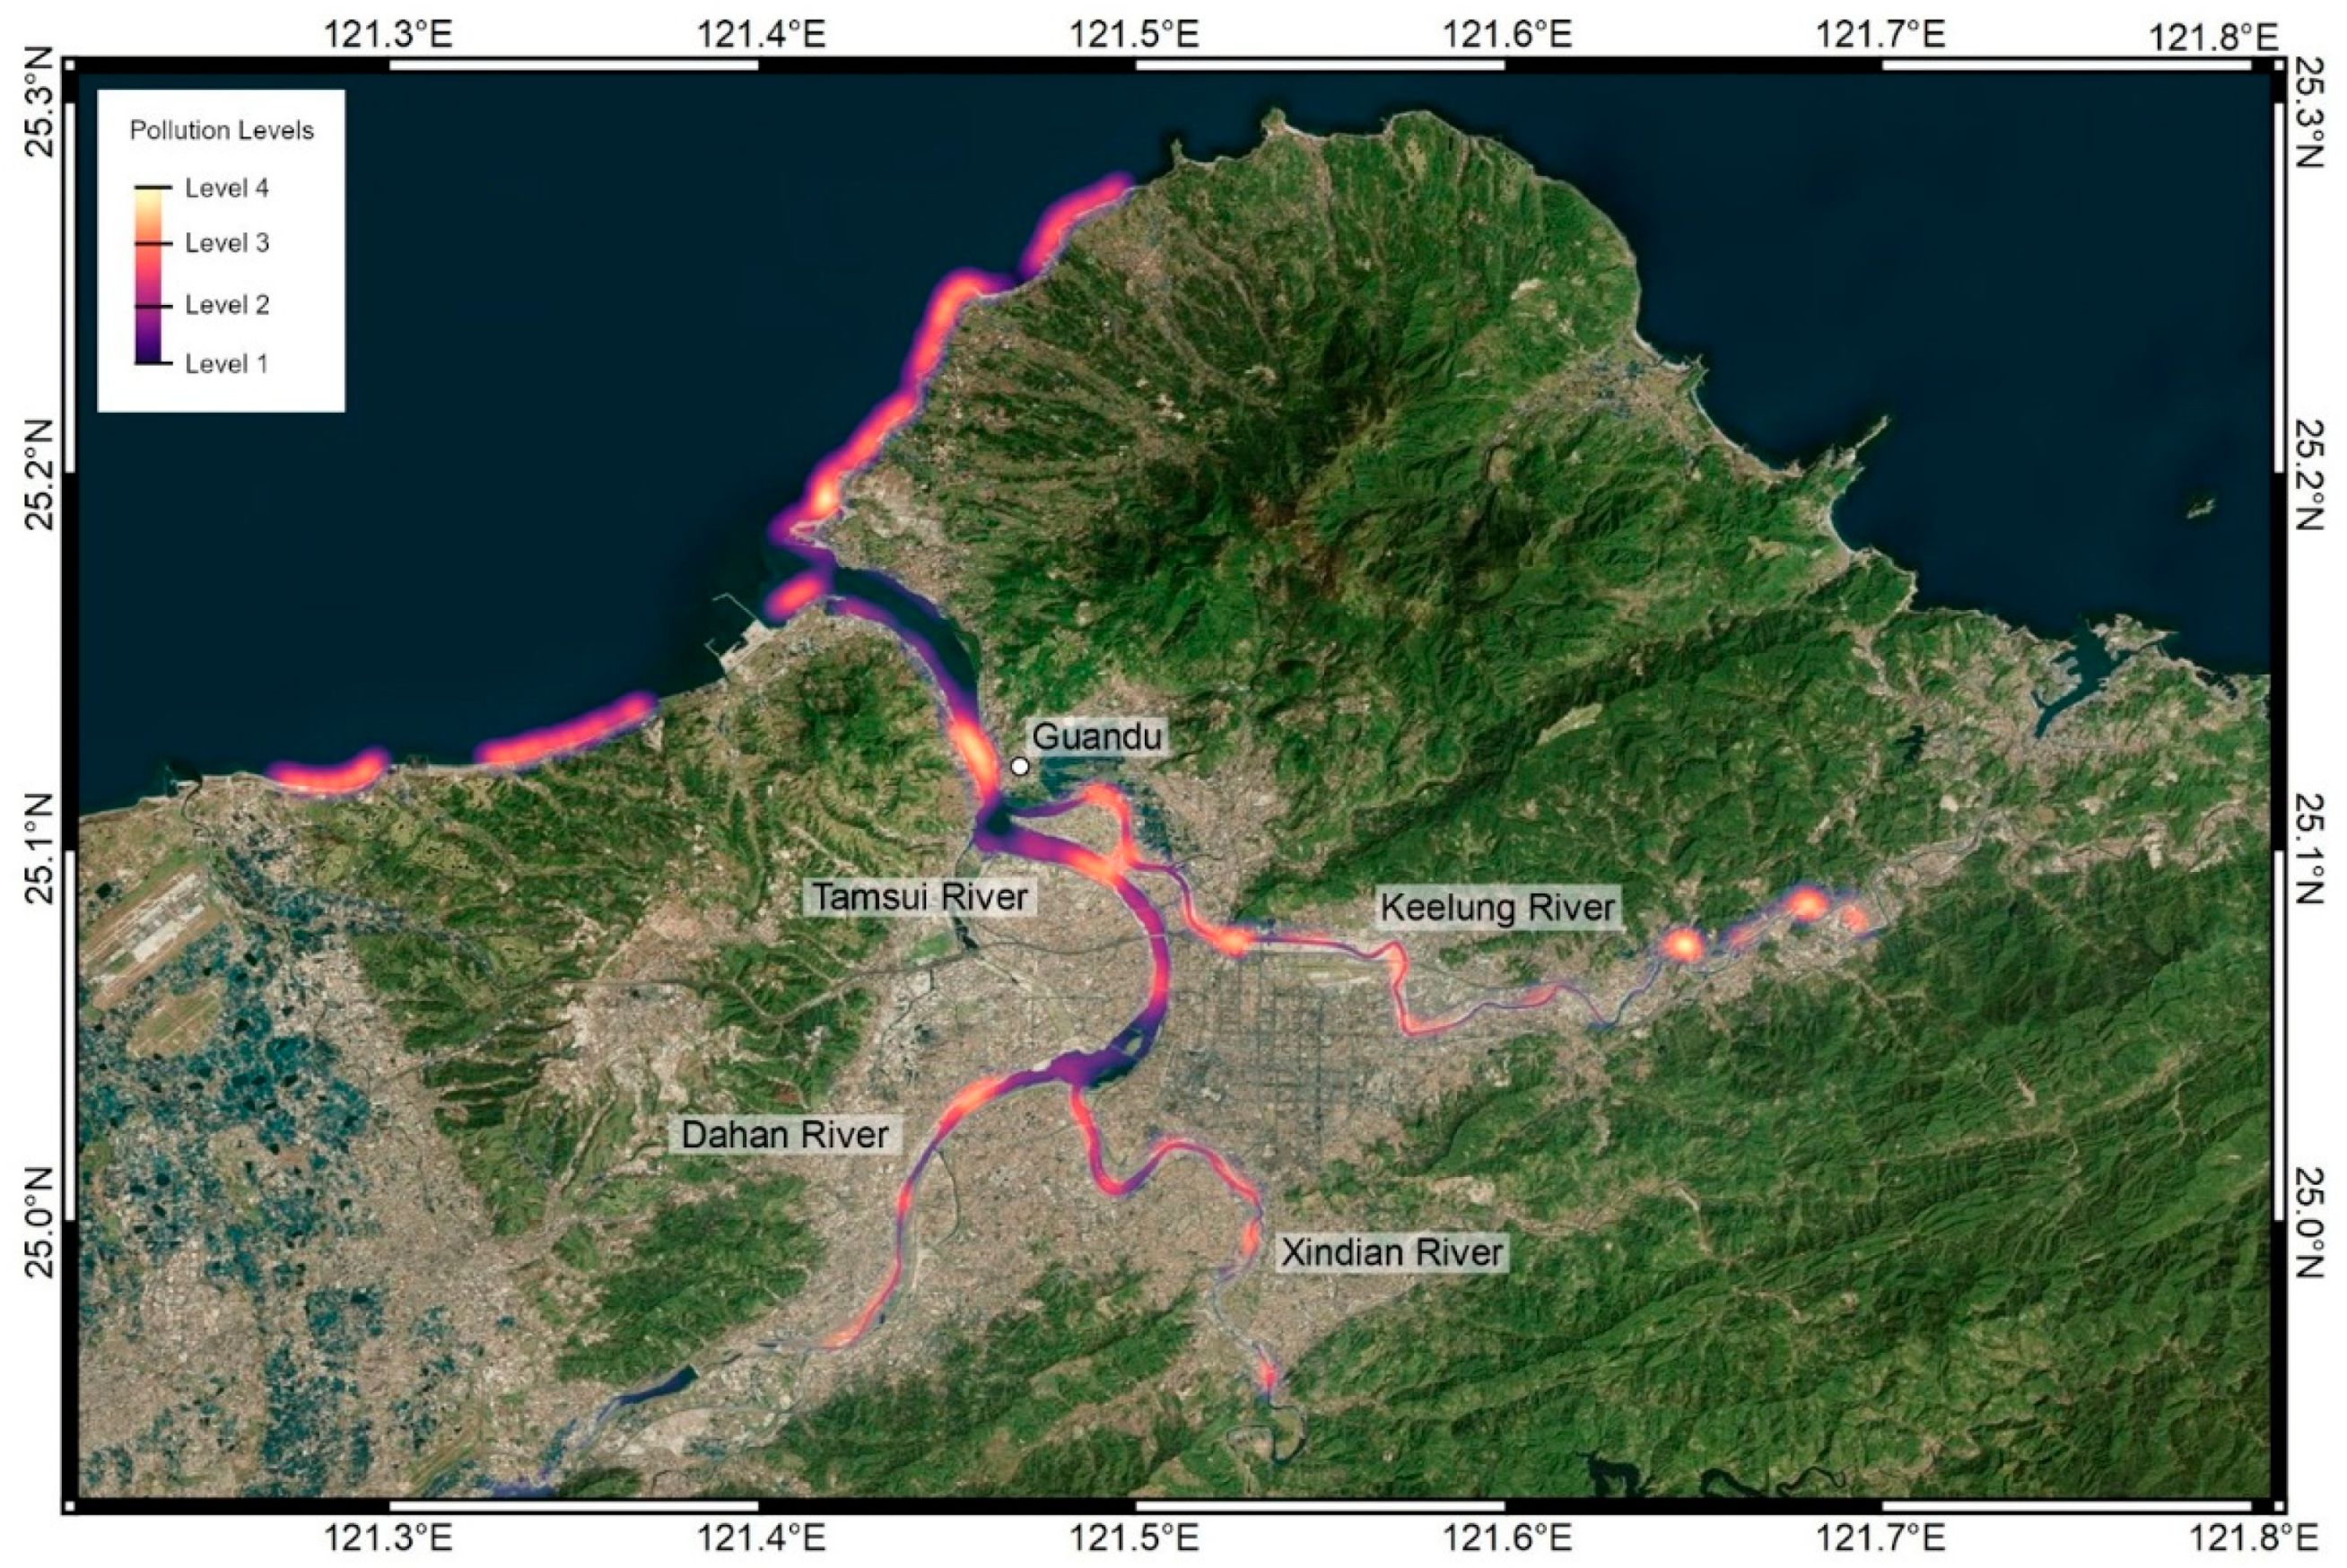
3.1. Litter Hotspots

Within the 418 accessible transects, a total of 648 m3 of litter was detected (Table 4). Of this, 72.0% accumulated at the coastline, 18.3% in the Tamsui river and 9.7% in the tributaries. Considering the length of the transects, the coastline, Tamsui river and its tributaries had a litter density of 15.3 m3/km, 2.8 m3/km and 0.2–0.6 m3/km respectively (Table 4). The amount of litter per square kilometer varied between 1.8 m3 and 410 m3, whereby the coastline contributed the highest and the tributaries the lowest values (Table 4).
The highest pollution levels at the riverbanks were found after the Keelung river merged with the Tamsui river near Guandu (Figure 3). In this area trash volumes of up to 57 m3/km have been reported. Smaller hotspots with litter volumes of 29 m3/km could also be detected in the first third of the western Keelung river and along the Tamsui river before it reached Guandu (Figure 3). The most polluted 5% of the accessible riverine transects accumulated 82% of the riverine debris.
At the coast, the litter was more evenly distributed. At the western side, most debris occurred adjacent to the Port of Taipei and next to a fishing harbor further west, whereas the hotspot at the eastern coast mainly concentrated around a North-side facing bay. The dirtiest 5% of the accessible coastal transects accumulated 18% of the coastal debris.

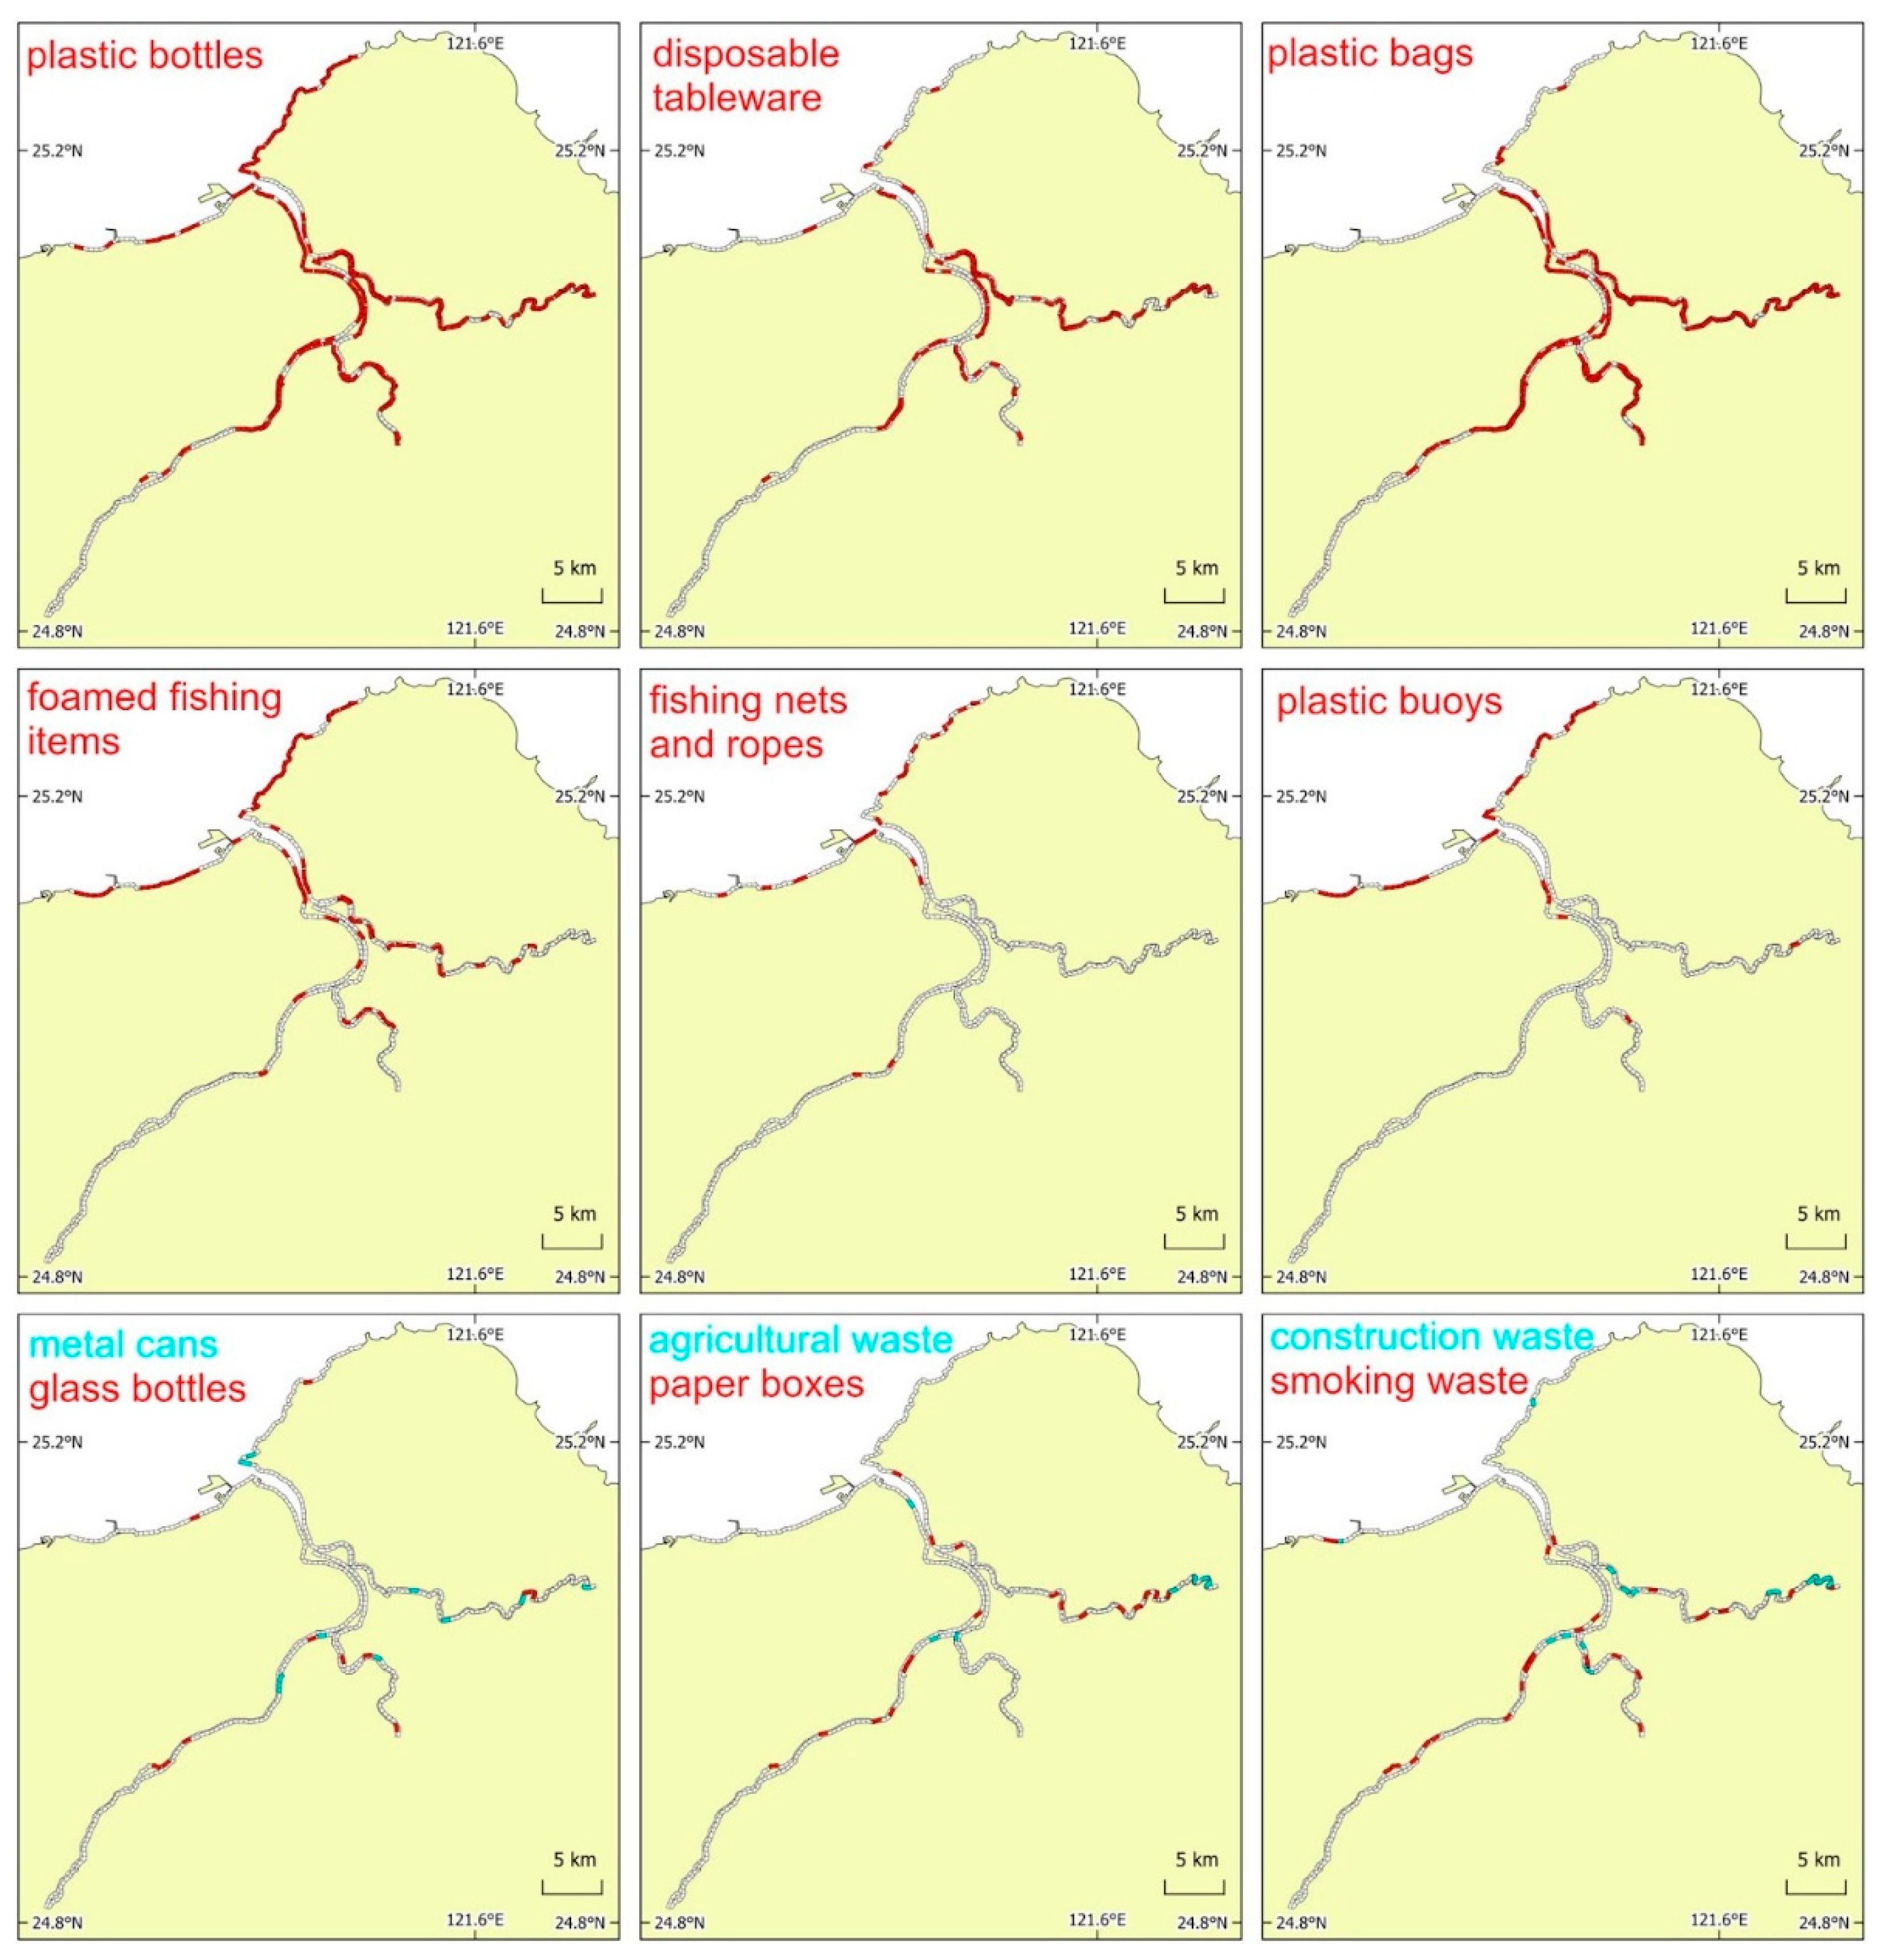
3.2. Litter Composition and Distribution

Single-use plastics were most abundant along the Tamsui river and its tributaries. As the waste composition was assessed by item frequency and by volume, ranges are used to present the different results from those two methods. From the 357 accessible riverine transects, 120–214 transects had plastic bags, 119–185 transects had plastic bottles and 44–96 transects had disposable tableware as one of the top three litter categories. Other items, foamed plastics and the remaining categories were a major source of pollution in 58–81, 47–63 and 65–99 transects respectively. In comparison to item frequency, the assessment by volume delivered higher relative values for foamed plastics and other items, whereas the share of single-use plastics reduced (Figure 4).
The 61 accessible transects at the coastline were mainly dominated by plastic bottles and fishing related waste. While plastic bottles were noted as a main waste contributor in 29–49 transects, foamed plastics, hard plastic buoys as well as fishing nets and ropes were among the top three litter categories in 43–47, 30–37 and 15–18 transects respectively. The remaining litter categories made it into the top three in 18–21 transects. Like before, the volume assessment compared to the item frequency, resulted in lower relative occurrences of plastic bottles and in higher shares for fishing related waste (Figure 4).
The spatial distribution of the dominating litter categories is shown in Figure 5. Paper boxes and agriculture waste were significant at several riverine transects, especially in the Keelung and Dahan river, but not along the coast. Glass bottles, metal cans and smoking related waste were randomly allocated across the whole river network. This was also the case for disposable tableware, plastic bags and other waste, but not for construction waste which mainly concentrated in the tributaries. Plastic bottles was the only littler category that contributed almost everywhere to both river and coastal transects. Foamed fishing items, hard plastic buoys and fishing nets and ropes formed an important part of the coastal transects, but also appeared in numerous riverine transects up to 40 km upstream. Fishing line and lure did not significantly contribute to any of the transect’s waste composition and was therefore not shown in Figure 5.
From the 839 photos that were taken during the survey, four river and coastal sections are represented in Figure 6. Figure 6b,d show upstream riverine litter presumably from illegal disposals that still had its original shape. Figure 6a,c on the other hand display downstream river transects that mainly contained buoyant individual items such as plastic bags, plastic bottles and fragmented debris. While upstream debris were mainly found near roads, downstream litter accumulated in branches of mangroves and reeds. Figure 6e–h show coastal debris which mainly occurred in the form of foamed and hard plastic buoys, fishing nets, ropes and other derelict fishing gear. The large orange buoy in Figure 6g is commonly used to protect submarine cables or pipelines. Apart from plastic bottles, typical riverine litter items (Figure 6a–d) could not be detected in large numbers at the coast.

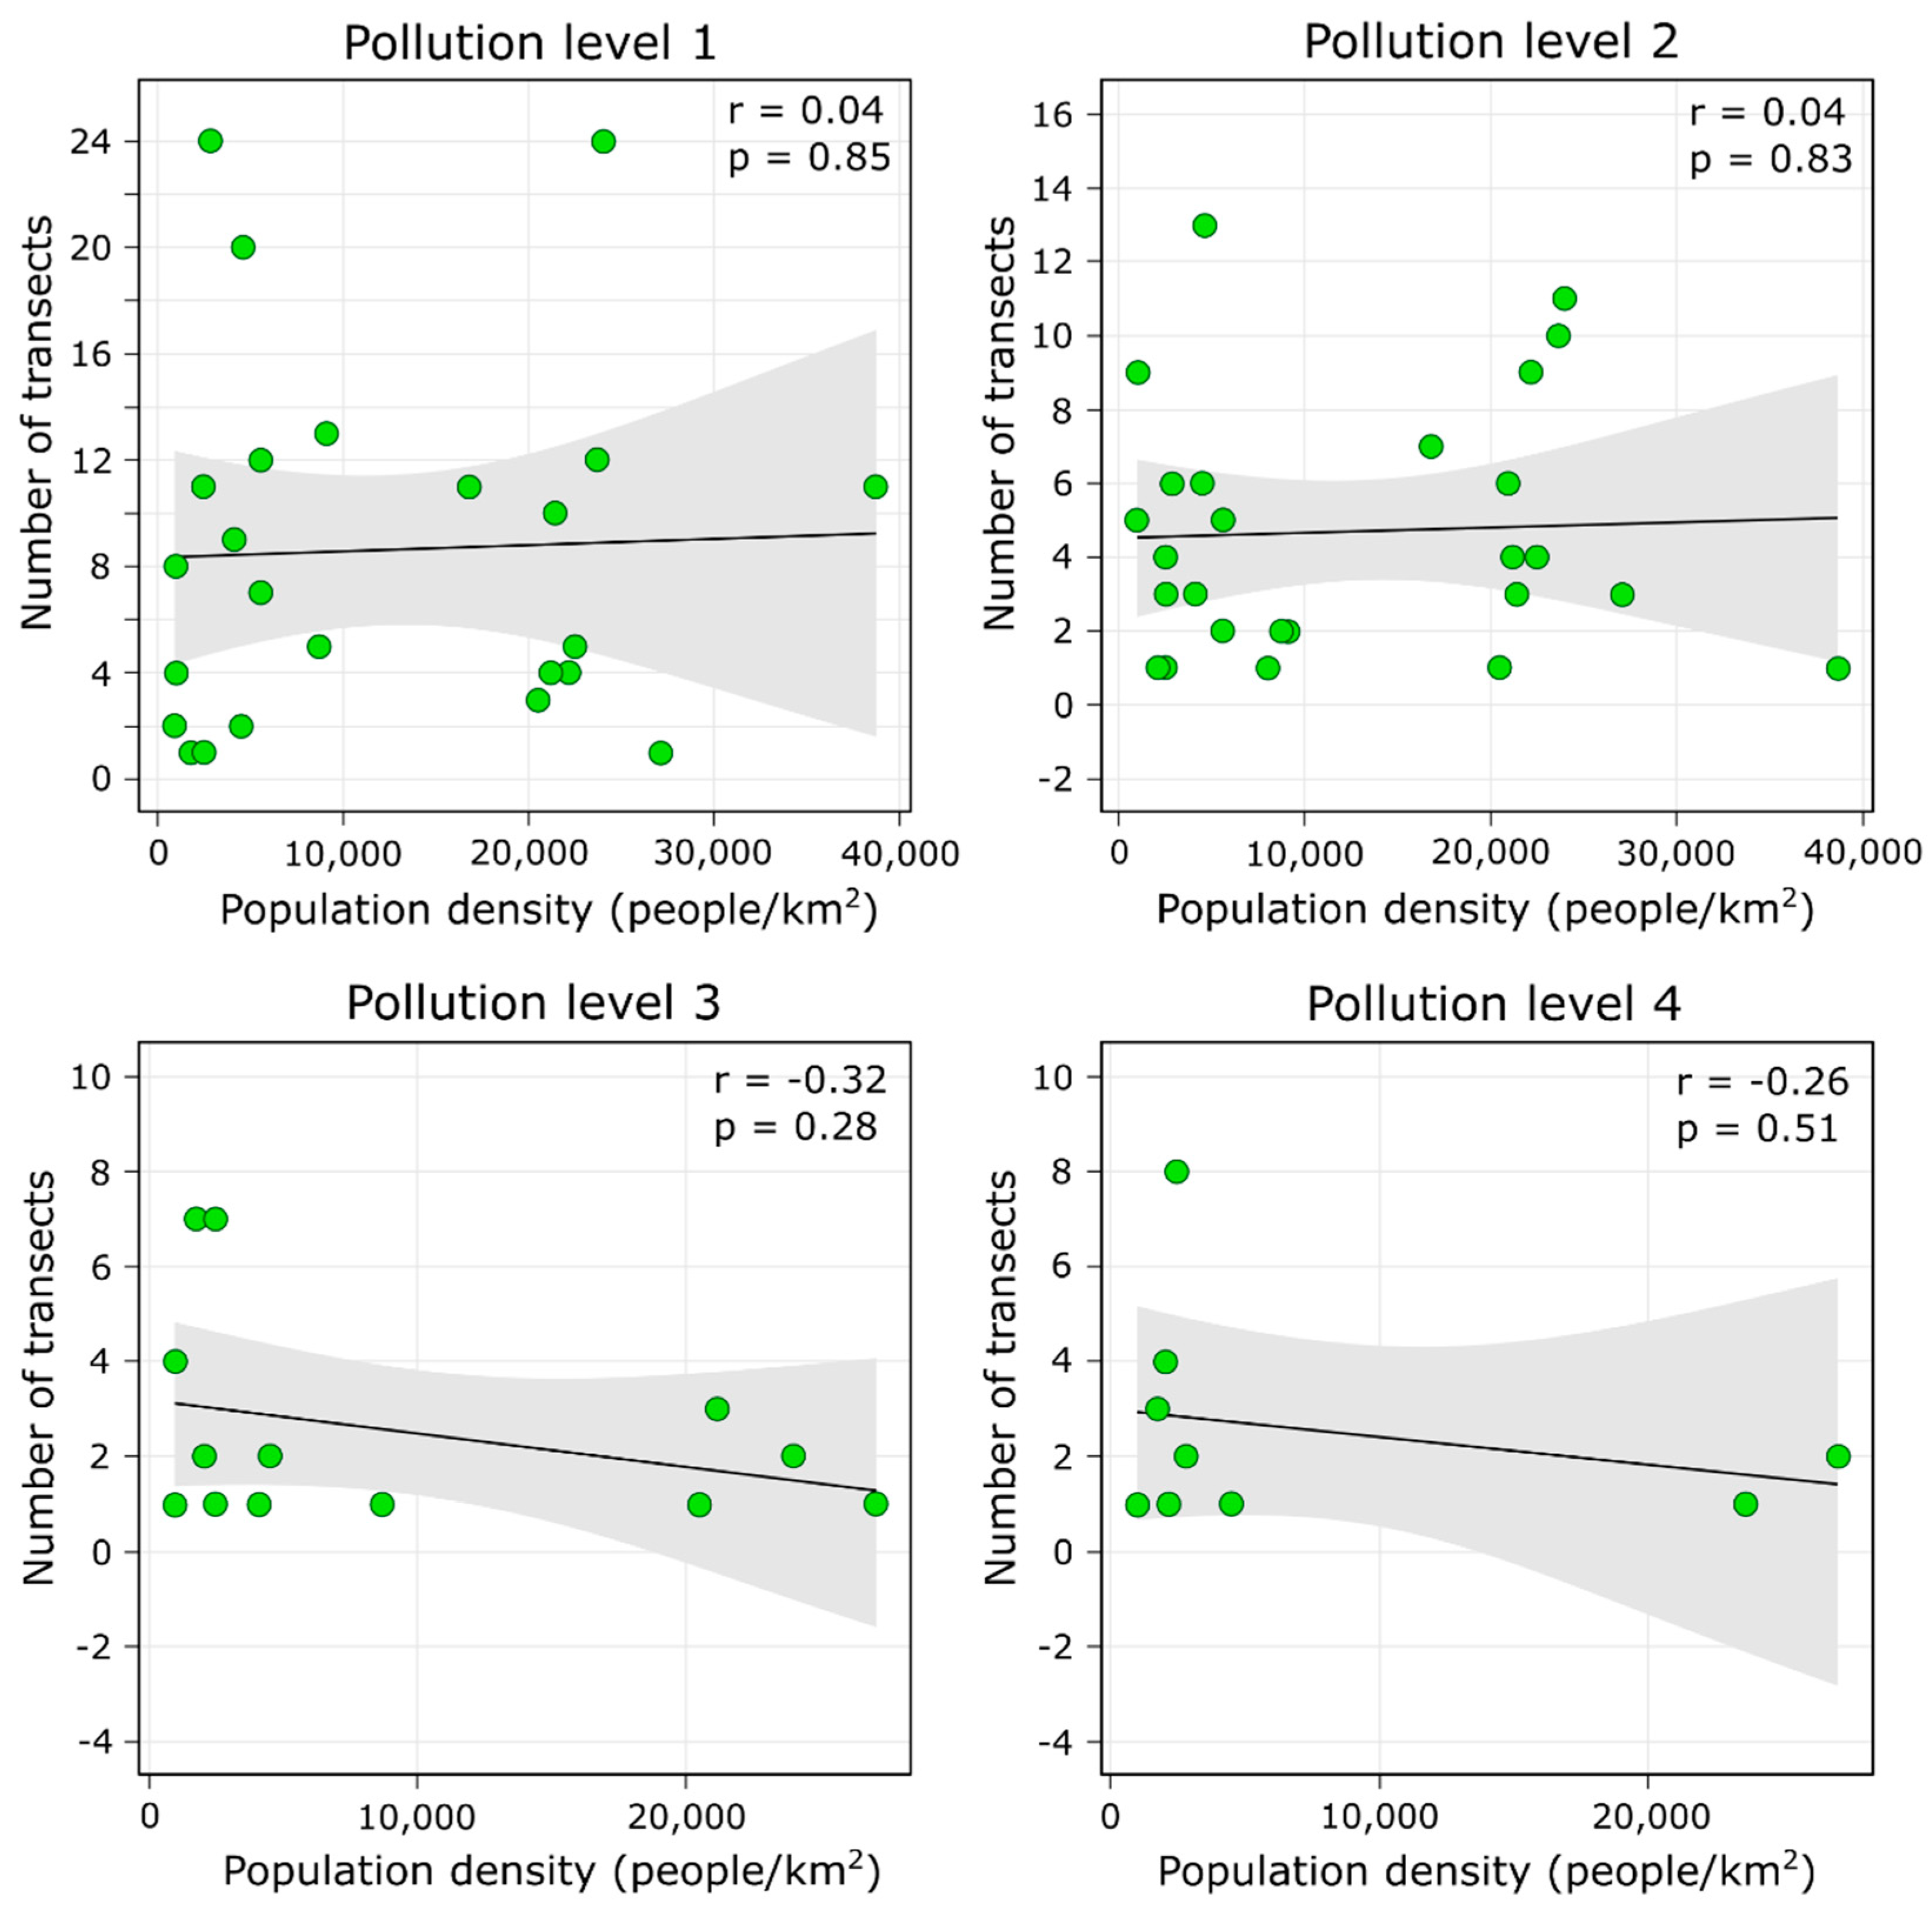
3.3. Correlation between Litter Volume and Population Density

The Pearson correlation coefficients for transects with pollution level 1 is r = 0.04 (p = 0.85) and for transects with pollution level 2 it is r = 0.04 (p = 0.83). However, for higher pollution levels a somewhat opposite trend can be observed (Figure 7). The correlation coefficients for pollution level 3 and pollution 4 transects are r = −0.32 (p = 0.28) and r = −0.26 (p = 0.51), respectively. The p-values for all four calculated Pearson correlations are >0.05, which means that the correlations are statistically not significant.

4. Discussion

4.1. Amount of Debris

This study observed an average litter density of 0.2 m3/km to 2.8 m3/km along the riverbanks of the Tamsui river network. As it was previously estimated that the Tamsui river is the 16th most polluted river in the world [11] and because riverbanks are an important source of riverine litter [20], it would be expected that those values reflect very high litter densities. However, the litter densities of the Tamsui river are nearly identical compared to the 2.82 m3/km of litter that were found in much smaller rivers near the Seto Inland Sea in Japan [31]. While this suggests that the Tamsui river may be less polluted than previously estimated, further research should confirm this.
Other studies also investigated riverbank litter, but due to a different survey setup it is difficult to compare their results with this study. For example, van Emmerik et al. sampled litter in 100 m transects in the Rhine-Meuse delta in the Netherlands providing an average litter density of 2060 items/km [25], while Kiessling et al. employed citizen scientists to sample circular transects across riverbanks in Germany, which revealed an average litter density of 0.54 litter items/m2 [20]. Although the reporting of litter densities by item number is more accurate and common, this study decided against this approach for two main reasons. First, the counting of items is labor intensive and thus not suitable for a rapid assessment that aims to cover large areas in a short time with few people. Second, the size of items varies and therefore item-based litter densities do not reflect the actual level of pollution, which is needed to identify the garbage truck capacity for cleanups. Still, to better compare riverbank studies in the future, research should determine conversion factors for item, volume and possible weight-based litter densities.
This study found that the average litter density increased from the upstream tributaries the Dahan, Xindian and Keelung river, to the Tamsui river and ultimately to the coast. This is in line with previous research from Bruge et al. who showed that the litter density of the Adour river in France almost doubled from typically 1 to 27 items/m2 upstream to 35 to 43 items/m2 at the coast [35]. While in France the high coastal debris accumulation was linked to the incoming riverine waste [35], in Taiwan high amounts of coastal debris can be noted along the entire North coast [33,34]. As such, the impact of riverine litter on the nearby coast is not directly possible to see. To quantify the litter contribution of the Tamsui river into the sea, future studies are needed that track the transport of floating, submerged and deposited riverine debris.

4.2. Composition and Spatial Distribution

The results show that there is a clear distinction in the composition of debris found at the coast and at the riverbanks. Transects at the coast were dominated by debris related to fishing, aquaculture and other marine activities, whereas debris found at the riverbanks was dominated by single-use plastic and items related to land-based activities such as household garbage, agricultural waste or construction waste (Figure 5). This is similar to a study by Morales-Caselles et al. who analyzed 12 million data points from 36 global datasets and found that the top three items at the riverbanks were food containers, bags and wrappers [44].
When looking closer at the distribution of certain debris that abundantly occur in the study area, such as plastic bottles, patterns can be seen. Transects with plastic bottles as the dominating type of debris in terms of volume occur in rivers and at the coastline. Notably, plastic bottles only dominate in transects that are located at the cut bank of the river. On the opposite side at the point bar no plastic bottles were documented, or at least plastic bottles were not the dominating type of debris (Figure 5). This distribution pattern can be observed in all rivers in the study area. Other debris items do not show a clear depositional pattern, mainly due to their low occurrence in the studied transects. We can also observe that a higher volume of debris seems to be accumulated in river bends and narrow river sections than in straight sections or wide riverbeds.
Transport and deposition of macroplastics in rivers is a complex process that involves a multitude of factors, such as density of the polymer, presence of air pockets, shape, volume to size ratio of the object [13]. The flow characteristics of the river, e.g., flow speed and turbulence, have an influence on transport and deposition of macroplastics [22,45]. Moreover, in estuaries, like the Tamsui river with a strong tidal influence and mixing of seawater and freshwater [46], the transport characteristics of macroplastics can be affected in such a way that heavier plastic that would sink in freshwater, becomes afloat [47]. Additionally, tidal currents reverse the water flow in the Tamsui river estuary [24], which might lead to transport of marine debris into the river.
Based on the observations in this study it could be possible that hydrodynamic conditions and morphology of the riverbed control the deposition of debris at the riverbanks of the Tamsui river and its tributaries. It is not clear how much mixing of marine and riverine debris happens in the estuary or how much debris is transported from the ocean into the river during high tides. Debris from commercial fishing that is one of the dominating debris types in the transects at the coastline, can also be found in transects up to 40 km upstream from the Tamsui river mouth (Figure 5). Since there is only recreational fishing in the Tamsui river, this could be an indicator for a reversed transport of debris from ocean to the river. However, this needs to be validated in future studies.
Additionally, we could observe that the highest volume of debris was trapped in the mangrove areas of the Tamsui river estuary. The mangroves stretch from the mouth of the Tamsui river on both river sides up to 20 km downstream [48]. The largest mangrove areas are near the river mouth and in the area of Guandu where the Keelung river enters the Tamsui river. This is also the area with the highest pollution in the study area (Figure 3). Mangroves and vegetation along the riverbanks in general have been identified in earlier studies as accumulation zones for macroplastics [49,50]. We could also observe the so-called ‘Christmas tree effect’ where plastic litter hangs on trees [50].

4.3. Correlation of Pollution Levels with Population Density

The number of transects with pollution levels 1 and 2 shows no positive correlation with population density (Figure 7). On the other hand, the number of transects with pollution levels 3 and 4 show a low negative correlation with population density (Figure 7), which is statistically not significant due to p-values > 0.05. Transects with pollution levels 1 and 2 can be mainly observed in districts with high and very high population densities. Whereas transects with pollution level 3 and 4 occur in districts with low population densities. For example, the section of the Xindian River that flows through Zhonghe, a district with the highest population density in northern Taiwan of more than 35,000 people per km2, has only transects with pollution level 1 and 2. Whereas the area of Guandu with a population density of around 5000 people per km2 north of the confluence of the Keelung river and Tamsui river, has a high number of transects with pollution levels 3 and 4.
A similar observation was made by Wong et al. that there is no correlation between microplastic pollution in the Tamsui river system and population density in the catchment area [24]. As already observed in other studies, e.g., in Vietnam [32], in France [51] or on a global scale [52], population density seems to be not necessarily a factor for high levels of plastic pollution. It could be possible that in areas of high population density debris enters the river but is then transported further downstream and deposited along the riverbanks. Therefore, it could be possible that the pollution observed in less densely populated areas derived from areas with high population density.

4.4. Survey Method

Compared to existing citizen science surveys for macroplastics in rivers, our method used a unique approach with bicycles and the litter was documented based on volume. One of the advantages was that with a low amount of people, large areas can be quickly monitored. During the survey time from the end of February 2020 to mid of April 2020 it took 24 volunteers only 16 days to cover a distance of 281.5 km. The effort for the citizen scientist is relatively low, as each survey team spent between 2 to 6 h per day. With the time needed to collect and upload the data for each transect, the participants were able to survey 5.7 km per hour. With optimized coordination and route planning, this method allows for time series or seasonal observations on a large scale.
Compared to sampling of macrolitter from small areas, which is the common method in many studies, e.g., [20,29,30] with this method continuous transects along the riverbanks and coastline were monitored. This gives a much more detailed picture of the pollution along the river and valuable information about the spatial distribution of litter as well as identifies litter hotspots that might not have been found before.
Additionally, using a volume-based approach over an item count approach has the advantage that people can more easily relate to the amount. In Taiwan trash disposal is done in garbage bags of defined volumes, therefore people have a better understanding when seeing trash volumes reported, which is beneficial for raising awareness. Moreover, when litter is reported in volume, then cleaning activities are easier to plan, such as hiring the right amount of people or garbage trucks.
Of course, this method cannot be applied to every river as it requires a road or bike path near the riverbank. In urban rivers this is likely the case, but in rural areas riverbanks are natural and access via bike is difficult. In this study, from 563 assigned transects 127 transects could not be accessed. Most of the inaccessible transects were in the downstream area of the Dahan river. This section of the river flows through a rural area and the riverbanks are not accessible via roads. A similar issue applies for coastal transects. Either there are no roads to access the coast easily or access to coastal areas is blocked, for example due to large industrial areas such as the Port of Taipei in this study.
Another shortcoming is that vegetation on the riverbank can impact the visibility on the debris. Or the bike path diverges too far from the river and not the entire area can be surveyed. This can result in underestimation of the volume data. In this study, from the 357 accessible transects along the river in 32% of them the whole area from the bike path to the water line was clearly visible, in 12% plants with a height of less than 1 m covered the water line, in 29% the water line was covered by plants taller than 1 m height, and in 27% of the accessible transects the whole area was covered by vegetation or the view was blocked. In contrast, all the accessible transects at the coast had an unobstructed view from the bike path to the water line. However, these issues with inaccessible or not clearly visible transects can be overcome with additional monitoring efforts such as reaching the covered areas by foot.

4.5. Social Implications

In Taiwan, river management falls under the jurisdiction of different authorities, resulting in situations where different sections of the same river can be managed by institutions under the central and local government. This complex setup is not only confusing to the public, but it also makes it unlikely that official large scale surveys and long-term monitoring efforts for riverine litter take place. In this study, volunteers from the Taiwanese NGO Society of Wilderness stepped in by surveying the Tamsui river network. The participation of the public in such activities not only raises awareness but also strengthens the connection with the environment. Since 2001 the Environmental Protection Administration of Taiwan encouraged the public to become so-called river volunteer squads. In 2020, 465 squads with more than 12,000 people were active in Taiwan [53]. Providing survey methods that are easy to understand and to conduct, helps to engage more people in river pollution surveys and cleanup activities.
Education, raising public awareness, and inspiring more people to join are important tasks for environmental organizations, such as the Society of Wilderness in Taiwan. Communicating the results of this survey with the public and media in an understandable way helped to increase the awareness of river pollution. The immediate effects were that the city government arranged cleanups at the hotspots, and a company offered financial support for future survey work. This shall illustrate that such long-term surveys can become win-win situations for governments, who can manage the river environment better, and NGOs who can build their volunteer base.
Even though the municipal solid waste in Taipei City decreased since 2000 to 0.81 kg per capita per day [54] and despite Taiwan’s high recycling rate, littering and dumping at upstream sections of the Tamsui river still occurs. This shows that further education and outreach programs for the public are necessary.

5. Conclusions

In this study, a novel bicycle survey for citizen scientists was used to assess riverine and coastal litter with a low number of participants in a short time. This was also the first study about macrolitter pollution in the Tamsui river and its tributaries in northern Taiwan. The results showed that the average litter densities increased from downstream to upstream river transects and was highest at the coastline. There was no positive correlation between litter densities and population density, but a somewhat opposite trend could be observed that in densely populated areas the riverbanks had the lowest pollution, whereas the highest pollution of riverbanks was found in areas of low population density. The spatial distribution of different litter types was linked to a variety of factors, such as hydrological parameters, morphology of the riverbed and vegetation along the riverbanks. The litter composition between the river and coastline varied significantly. While the riverbanks were mostly polluted with single-use plastics and illegally dumped waste, the coastline was mainly polluted by derelict fishing gear.
Overall, the new citizen science methodology was suitable to collect valuable data about the pollution of the Tamsui river system and its adjacent coastline. In addition to providing useful data to answer research questions, this method is a very good tool to map litter occurrences in large areas and to plan clean-up activities. The participation in such studies can raise awareness and provide first discoveries about litter sources to reduce future plastic pollution.

Supplementary Materials

The following are available online at https://0-www-mdpi-com.brum.beds.ac.uk/article/10.3390/su13168765/s1, Table S1: Additional information about the transects and river system, Table S2: Collected survey data.

Author Contributions

F.S.: Formal analysis, Writing—Original draft; A.K.: Formal analysis, Writing—Original draft; C.-S.H.: Conceptualization; Methodology, Investigation; N.Y.: Visualization; Writing—Review and Editing; H.-T.L.: Supervision, Writing—Review and Editing. All authors have read and agreed to the published version of the manuscript.

Funding

This research was funded by the Society of Wilderness (SOW) and the Taiwan Ocean Conservation Administration. A.K. received funding from the Ministry of Science and Technology Taiwan (R.O.C.), grant number MOST 108-2116-M-002-028-MY2. F.S. and H.-T.L. kindly acknowledge the financial support from the National Cheng Kung University.

Acknowledgments

We would like to thank Shigeru Fujieda who generously shared his survey method, experience and insights; Sadao Harada for his experience and encouragement, Yanling Chen for translations from Japanese, Taidi Chang for logistic support, Xiaojun Xu and Yuwei Zhuang for volunteer coordination and leadership; and the volunteers from SOW who executed the river litter surveys.

Conflicts of Interest

The authors declare no conflict of interest. The funders had no role in the design of the study; in the collection, analyses, or interpretation of data; in the writing of the manuscript, or in the decision to publish the results.

References

  1. Galgani, F.; Hanke, G.; Maes, T. Global Distribution, Composition and Abundance of Marine Litter. In Marine Anthropogenic Litter; Bergmann, M., Gutow, L., Klages, M., Eds.; Springer: Cham, Switzerland, 2015; pp. 29–56. [Google Scholar]
  2. Derraik, J. The pollution of the marine environment by plastic debris: A review. Mar. Pollut. Bull. 2020, 44, 842–852. [Google Scholar] [CrossRef]
  3. Gall, S.; Thompson, R. The impact of debris on marine life. Mar. Pollut. Bull. 2015, 92, 170–179. [Google Scholar] [CrossRef]
  4. Kiessling, T.; Gutow, L.; Thiel, M. Marine litter as habitat and dispersal vector. In Marine Anthropogenic Litter; Bergmann, M., Gutow, L., Klages, M., Eds.; Springer: Cham, Switzerland, 2015; pp. 141–181. [Google Scholar]
  5. Oehlmann, J.; Schulte-Oehlmann, U.; Kloas, W.; Jagnytsch, O.; Lutz, I.; Kusk, K.; Wollenberger, L.; Santos, E.; Paull, G.; Van Look, K.; et al. A critical analysis of the biological impacts of plasticizers on wildlife. Philos. Trans. R. Soc. B Biol. Sci. 2009, 364, 2047–2062. [Google Scholar] [CrossRef] [PubMed] [Green Version]
  6. Ribeiro, F.; O’Brien, J.; Galloway, T.; Thomas, K. Accumulation and fate of nano and microplastics and associated contaminants in organisms. TrAC Trends Anal. Chem. 2019, 111, 139–147. [Google Scholar] [CrossRef]
  7. Lebreton, L.; Slat, B.; Ferrari, F.; Sainte-Rose, B.; Aitken, J.; Marthouse, R.; Hajbane, S.; Cunsolo, S.; Schwarz, A.; Levivier, A.; et al. Evidence that the Great Pacific Garbage Patch is rapidly accumulating plastic. Sci. Rep. 2018, 8, 1–15. [Google Scholar] [CrossRef] [PubMed] [Green Version]
  8. Lee, J.; Hong, S.; Lee, J. Rapid assessment of marine debris in coastal areas using a visual scoring indicator. Mar. Pollut. Bull. 2019, 149, 110552. [Google Scholar] [CrossRef]
  9. Roman, L.; Hardesty, B.; Leonard, G.; Pragnell-Raasch, H.; Mallos, N.; Campbell, I.; Wilcox, C. A global assessment of the relationship between anthropogenic debris on land and the seafloor. Environ. Pollut. 2020, 264, 114663. [Google Scholar] [CrossRef] [PubMed]
  10. Jambeck, J.; Geyer, R.; Wilcox, C.; Siegler, T.; Perryman, M.; Andrady, A.; Narayan, R.; Law, K. Plastic waste inputs from land into the ocean. Science 2015, 347, 768–771. [Google Scholar] [CrossRef]
  11. Lebreton, L.; van der Zwet, J.; Damsteeg, J.; Slat, B.; Andrady, A.; Reisser, J. River plastic emissions to the world’s oceans. Nat. Commun. 2017, 8, 15611. [Google Scholar] [CrossRef]
  12. Schmidt, C.; Krauth, T.; Wagner, S. Export of Plastic Debris by Rivers into the Sea. Environ. Sci. Technol. 2017, 51, 12246–12253. [Google Scholar] [CrossRef]
  13. Al-Zawaidah, H.; Ravazzolo, D.; Friedrich, H. Macroplastics in rivers: Present knowledge, issues and challenges. Environ. Sci. Process. Impacts 2021, 23, 535–552. [Google Scholar] [CrossRef]
  14. Blettler, M.C.M.; Abrial, E.; Khan, F.R.; Sivri, N.; Espinola, L.A. Freshwater plastic pollution: Recognizing research biases and identifying knowledge gaps. Water Res. 2018, 143, 416–424. [Google Scholar] [CrossRef] [PubMed] [Green Version]
  15. Van Emmerik, T.; Schwarz, A. Plastic debris in rivers. WIREs Water 2019, 7, e1398. [Google Scholar] [CrossRef] [Green Version]
  16. Moore, C.; Lattin, G.; Zellers, A. Quantity and type of plastic debris flowing from two urban rivers to coastal waters and beaches of Southern California. Rev. De Gestão Costeira Integr. 2011, 11, 65–73. [Google Scholar] [CrossRef]
  17. Lechner, A.; Keckeis, H.; Lumesberger-Loisl, F.; Zens, B.; Krusch, R.; Tritthart, M.; Glas, M.; Schludermann, E. The Danube so colourful: A potpourri of plastic litter outnumbers fish larvae in Europe’s second largest river. Environ. Pollut. 2014, 188, 177–181. [Google Scholar] [CrossRef] [Green Version]
  18. Sadri, S.; Thompson, R. On the quantity and composition of floating plastic debris entering and leaving the Tamar Estuary, Southwest England. Mar. Pollut. Bull. 2014, 81, 55–60. [Google Scholar] [CrossRef] [PubMed]
  19. González-Fernández, D.; Hanke, G. Toward a Harmonized Approach for Monitoring of Riverine Floating Macro Litter Inputs to the Marine Environment. Front. Mar. Sci. 2017, 4, 86. [Google Scholar] [CrossRef] [Green Version]
  20. Kiessling, T.; Knickmeier, K.; Kruse, K.; Brennecke, D.; Nauendorf, A.; Thiel, M. Plastic Pirates sample litter at rivers in Germany—Riverside litter and litter sources estimated by schoolchildren. Environ. Pollut. 2019, 245, 545–557. [Google Scholar] [CrossRef]
  21. van Emmerik, T.; Seibert, J.; Strobl, B.; Etter, S.; den Oudendammer, T.; Rutten, M.; bin Ab Razak, M.; van Meerveld, I. Crowd-Based Observations of Riverine Macroplastic Pollution. Front. Earth Sci. 2020, 8, 298. [Google Scholar] [CrossRef]
  22. Williams, A.T.; Simmons, S.L. Movement patterns of riverine litter. Water Air Soil Pollut. 1997, 98, 119–139. [Google Scholar] [CrossRef]
  23. Hurley, R.; Woodward, J.; Rothwell, J.J. Microplastic contamination of river beds significantly reduced by catchment-wide flooding. Nat. Geosci. 2018, 11, 251–257. [Google Scholar] [CrossRef]
  24. Wong, G.; Löwemark, L.; Kunz, A. Microplastic pollution of the Tamsui River and its tributaries in northern Taiwan: Spatial heterogeneity and correlation with precipitation. Environ. Pollut. 2020, 260, 113935. [Google Scholar] [CrossRef]
  25. van Emmerik, T.; Roebroek, C.; de Winter, W.; Vriend, P.; Boonstra, M.; Hougee, M. Riverbank macrolitter in the Dutch Rhine–Meuse delta. Environ. Res. Lett. 2020, 15, 104087. [Google Scholar] [CrossRef]
  26. Bruge, A.; Barreau, C.; Carlot, J.; Collin, H.; Moreno, C.; Maison, P. Monitoring litter inputs from the Adour River (Southwest France) to the marine environment. J. Mar. Sci. Eng. 2018, 6, 24. [Google Scholar] [CrossRef] [Green Version]
  27. Tramoy, R.; Colasse, L.; Gasperi, J.; Tassin, B. Plastic debris dataset on the Seine river banks: Plastic pellets, unidentified plastic fragments and plastic sticks are the Top 3 items in a historical accumulation of plastics. Data Brief 2019, 23, 103697. [Google Scholar] [CrossRef] [PubMed]
  28. Schöneich-Argent, R.; Dau, K.; Freund, H. Wasting the North Sea?—A field-based assessment of anthropogenic macrolitter loads and emission rates of three German tributaries. Environ. Pollut. 2020, 263, 114367. [Google Scholar] [CrossRef] [PubMed]
  29. Rech, S.; Macaya-Caquilpán, V.; Pantoja, J.; Rivadeneira, M.; Campodónico, C.; Thiel, M. Sampling of riverine litter with citizen scientists—Findings and recommendations. Environ. Monit. Assess. 2015, 187, 335. [Google Scholar] [CrossRef] [PubMed]
  30. Bernardini, G.; McConville, A.; Castillo Castillo, A. Macro-plastic pollution in the tidal Thames: An analysis of composition and trends for the optimization of data collection. Mar. Policy 2020, 119, 104064. [Google Scholar] [CrossRef]
  31. Fujieda, S. Distribution of litter scattered along thirteen rivers flowing into the Seto Inland Sea. J. Coast. Zone Stud. 2010, 23, 35–46. [Google Scholar]
  32. Lahens, L.; Strady, E.; Kieu-Le, T.; Dris, R.; Boukerma, K.; Rinnert, E.; Gasperi, J.; Tassin, B. Macroplastic and microplastic contamination assessment of a tropical river (Saigon River, Vietnam) transversed by a developing megacity. Environ. Pollut. 2018, 236, 661–671. [Google Scholar] [CrossRef] [Green Version]
  33. Walther, B.A.; Kunz, A.; Hu, C.S. Type and quantity of coastal debris pollution in Taiwan: A 12-year nationwide assessment using citizen science data. Mar. Pollut. Bull. 2018, 135, 862–872. [Google Scholar] [CrossRef]
  34. Chiu, C.; Liao, C.; Kuo, T.; Huang, H. Using citizen science to investigate the spatial-temporal distribution of floating marine litter in the waters around Taiwan. Mar. Pollut. Bull. 2020, 157, 111301. [Google Scholar] [CrossRef]
  35. Liu, T.; Wang, M.; Chen, P. Influence of waste management policy on the characteristics of beach litter in Kaohsiung, Taiwan. Mar. Pollut. Bull. 2013, 72, 99–106. [Google Scholar] [CrossRef]
  36. Kuo, F.J.; Huang, H.W. Strategy for mitigation of marine debris: Analysis of sources and composition of marine debris in northern Taiwan. Mar. Pollut. Bull. 2014, 83, 70–78. [Google Scholar] [CrossRef]
  37. Huang, K.-M.; Lin, S. Consequences and implication of heavy metal spatial variations in sediments of the Keelung River drainage basin, Taiwan. Chemosphere 2003, 53, 1113–1121. [Google Scholar] [CrossRef]
  38. Hung, C.C.; Gong, G.C.; Jiann, K.T.; Yeager, K.M.; Santschi, P.H.; Wade, T.L.; Sericano, J.L.; Hsieh, H.L. Relationship between carbonaceous materials and polychlorinated biphenyls (PCBs) in the sediments of the Danshui River and adjacent coastal areas, Taiwan. Chemosphere 2006, 65, 1452–1461. [Google Scholar] [CrossRef]
  39. Wang, Y.B.; Liu, C.W.; Liao, P.Y.; Lee, J.J. Spatial pattern assessment of river water quality: Implications of reducing the number of monitoring stations and chemical parameters. Environ. Monit Assess 2014, 186, 1781–1792. [Google Scholar] [CrossRef] [PubMed]
  40. Jang, C.-S. Using probability-based spatial estimation of the river pollution index to assess urban water recreational quality in the Tamsui River watershed. Environ. Monit. Assess. 2016, 188, 36. [Google Scholar] [CrossRef]
  41. National Land Surveying and Mapping Center Taiwan. Available online: https://www.nlsc.gov.tw (accessed on 26 May 2021).
  42. Bureau of National Statistics Taiwan. Available online: https://www1.stat.gov.tw/mp.asp?mp=3 (accessed on 26 May 2021).
  43. Nationwide Survey of Drifted Litter in Japan: Report on the Investigation into Integrated Measures against Drifting Garbage on the Coast. Available online: https://www.mlit.go.jp/kokudoseisaku/kokudokeikaku_fr4_000017.html (accessed on 5 April 2021).
  44. Morales-Caselles, C.; Viejo, J.; Martí, E.; González-Fernández, D.; Pragnell-Raasch, H.; González-Gordillo, J.; Montero, E.; Arroyo, G.; Hanke, G.; Salvo, V.; et al. An inshore-offshore sorting system revealed from global classification of ocean litter. Nat. Sustain. 2021, 4, 484–493. [Google Scholar] [CrossRef]
  45. Haberstroh, C.J.; Arias, M.E.; Yin, Z.; Wang, M.C. Effects of hydrodynamics on the cross-sectional distribution and transport of plastic in an urban coastal river. Water Environ. Res. 2021, 93, 186–200. [Google Scholar] [CrossRef] [PubMed]
  46. Wang, C.-F.; Hsu, M.-H.; Kuo, A.Y. Residence time of the Danshuei River estuary, Taiwan. Estuar. Coast. Shelf Sci. 2004, 60, 381–393. [Google Scholar] [CrossRef]
  47. Andrady, A.L. Microplastics in the marine environment. Mar. Pollut. Bull. 2011, 62, 1596–1605. [Google Scholar] [CrossRef] [PubMed]
  48. Lee, T.-M.; Yeh, H.-C. Applying remote sensing techniques to monitor shifting wetland vegetation: A case study of Danshui River estuary mangrove communities, Taiwan. Ecol. Eng. 2009, 35, 487–496. [Google Scholar] [CrossRef]
  49. Martin, C.; Almahasheer, H.; Duarte, C.M. Mangrove forests as traps for marine litter. Environ. Pollut. 2019, 247, 499–508. [Google Scholar] [CrossRef] [PubMed]
  50. Williams, A.T.; Simmons, S.L. The degradation of plastic litter in rivers: Implications for beaches. J. Coast. Conserv. 1996, 2, 63–72. [Google Scholar] [CrossRef]
  51. Dris, R.; Gasperi, J.; Rocher, V.; Saad, M.; Renault, N.; Tassin, B. Microplastic contamination in an urban area: A case study in Greater Paris. Environ. Chem. 2015, 12, 592–599. [Google Scholar] [CrossRef]
  52. Schuyler, Q.; Wilcox, C.; Lawson, T.J.; Ranatunga, R.R.M.K.P.; Hu, C.-S.; Hardesty, B.D. Human Population Density is a Poor Predictor of Debris in the Environment. Front. Environ. Sci. 2021, 9, 583454. [Google Scholar] [CrossRef]
  53. Protection of Rivers: Press release of Water Quality Protection Section, Environmental Protection Agency. Available online: https://khenvedu.kcg.gov.tw/News/Detail?progId=NEWS001&dsn=3483 (accessed on 26 June 2021). (In Chinese)
  54. Open Data Platform for Environmental Data. Available online: https://data.epa.gov.tw (accessed on 26 June 2021). (In Chinese)
Figure 1. Location of the study area in northern Taiwan. Sampling sites along the coast are marked by blue dots. Sampling sites along the Tamsui river are marked by orange dots, along the Keelung river by green dots, along the Xindian river by red dots, and along the Dahan river by purple dots. Sampling was done at the left and right riverbank. Yellow diamonds indicate the maximum extent of the tide. Population density based on census from 2018 [42].
Sustainability 13 08765 g001
Figure 2. Bicycle survey approach and transect boundaries.
Sustainability 13 08765 g002
Figure 3. Heatmap showing the pollution levels in the study area. Please note, curved river and coastline sections have a higher density of points and can appear brighter compared to straight sections.
Sustainability 13 08765 g003
Figure 4. Number of transects with dominating litter categories. Please note: Up to three different dominating categories per transect could be reported. The number of transects are differentiated by item count and by volume estimate for each litter category.
Sustainability 13 08765 g004
Figure 5. Regional distribution of the dominating litter categories.
Sustainability 13 08765 g005
Figure 6. Representative pictures of riverine (ad) and coastal debris (eh).
Sustainability 13 08765 g006
Figure 7. Plots showing results of correlation analysis between number of transects with a certain pollution level and population density. Gray area represents the 95% confidence limits.
Sustainability 13 08765 g007
Table 1. Transect data summary.
SectionColorTransectsDistance [km]Access
NumberName (a)WestEastTotal[km][%]
Dahan riverPurple1711–1714342.585.537.543.9
Xindian riverRed69172–24017.51734.531.591.3
Keelung riverGreen155241–39538.53977.567.587.1
Tamsui riverOrange90396–4852223454293.3
CoastlineBlue78486–56319.519.53930.578.2
Total-563-140.5141281.520974.2
(a) Refers to naming in the Supplementary Materials.
Table 2. Survey form for volunteers to upload data onto Google forms.
1. Basic
Information
2. Litter Volume3. Litter Composition
14 L BagReference for EstimationTop Three Garbage Types byItemVolume
Transect:0Less than 2 PET bottles1. Plastic bottles
Surveyor:0.57–8 small PET bottles2. Disposable tableware.
Date:115 small PET bottles3. Plastic bags
Visibility:230 small PET bottles4. Cigarette butts, lighters
Fully visible42 hand luggage (20 inch)5. Glass bottles
Vegetation < 1 m83 hand luggage (20 inch)6. Tin and aluminum cans
Vegetation > 1 m161 oil drum (200 L)7. Paper boxes
Mainly invisible322 oil drums (200 L)8. Construction waste
Not accessible644.5 oil drums (200 L)9. Agriculture waste
Average width:1282 FIBC bag (1 m3)10. Foamed fishing items
1 m more2563.5 FIBC bags (1 m3)11. Fishing nets and ropes
10 m n/a5127 FIBC bags (1 m3)12. Hard plastic buoys
100 m 102414 FIBC bags (1 m3)13. Fishing line and lure
500 m 204828 FIBC bags (1 m3)14. Other items
4. Photo upload: → ☐ Most representative site → ☐ Hotspot site → ☐ Most special find
Table 3. Classification of pollution levels.
LevelLevel 1Level 2Level 3Level 4
Bags00.5124816326412825651210242048
m3/km00.0140.0280.0560.110.220.450.901.83.67.214.328.757.3
Table 4. Debris density of Tamsui River riverine and its adjacent coastline.
SectionTotal VolumeLength
[km]
Length Density
[m3/km]
Average
Width [m]
Area Density
[m3/km2]
[m3][%]
Dahan river12.61.937.50.3191.81.8
Xindian river7.21.131.50.262.63.7
Keelung river43.46.767.50.660.610.6
Tamsui river118.618.3422.8144.019.6
Coastline466.572.030.515.337.3410.1
Total648.31002093.194.632.8
Publisher’s Note: MDPI stays neutral with regard to jurisdictional claims in published maps and institutional affiliations.

