
A Circularity Indicator Tool for Measuring the Ecological Embeddedness of Manufacturing


1
Wolfson School of Mechanical, Electrical & Manufacturing Engineering, Loughborough University, Loughborough LE11 3TU, UK
2
School of Animal, Rural & Environmental Sciences, Nottingham Trent University, Southwell NG25 0QF, UK
3
School of Aerospace, Transport & Manufacturing, Cranfield University, Cranfield MK43 0AL, UK
*
Author to whom correspondence should be addressed.
Sustainability 2021, 13(16), 8773; https://0-doi-org.brum.beds.ac.uk/10.3390/su13168773
Submission received: 24 June 2021
/
Revised: 30 July 2021
/
Accepted: 2 August 2021
/
Published: 5 August 2021
(This article belongs to the Collection Circular Economy and Sustainable Strategies)
Abstract
:Circularity in manufacturing is critical to reducing raw material usage and waste. Ecological embeddedness examines circular relationships intended to benefit both economic actors and the natural environment. By understanding circular relationships in the value chain, manufacturers can formulate strategies that are eco-effective. This work develops and validates an original circularity tool to measure the ecological embeddedness of manufacturers using exploratory and confirmatory factor analysis. The tool is tested on process manufacturers selling products in the United Kingdom. The three main results are that the tool is useful and comprehensive (87% of users), enables simple comparisons with competitors, and identifies weaknesses in strategies related to the five dimensions connecting manufacturers, consumers, and the environment: understanding, realising, utilising, negotiating, and reclaiming. Manufacturers may use the tool to improve their ecological embeddedness, and sector-based circularity levels may be established for policy development. The novelty of the tool is in the use of ecological relationships to support achievement of a circular economy.
1. Introduction
Manufacturing is the target of much public concern over toxic waste, environmental disasters, pollution, loss of biodiversity, and climate change. However, many businesses remain anthropocentric and economically focused. Sustainable development has struggled to position itself as a compromise, but the incommensurability between the anthropocentric and ecocentric paradigms renders them irreconcilable [1].
The primary objectives of linear manufacturing have been to develop business models and strategies to increase economic profit and resource throughput. The linear business model represents an unsustainable approach to manufacturing and consumption [2]. The concept of a circular economy (CE) has been proposed to replace linear manufacturing [3]. The focus of CE is to close or slow loops in the entire economic system [4]. A CE is enabled by extending product use as well as restorative processes that take products, by-products, and waste materials back into the economy by repair, recondition, remanufacture, cannibalization, redesign, refurbishment, and recycling [5,6].
Circular and sustainable business models are seen as a means of achieving market differentiation, competitive advantage, and economic growth [7]. Although manufacturer engagement with circularity on any level may demonstrate some awareness of environmental issues, an ecocentric approach founded on ecological embeddedness will help ensure the full consideration of natural and social aspects for mature corporate sustainability worldviews associated with strong sustainability [8]. Ecological embeddedness is an ecocentric subset of a CE intended to benefit both the economic actors and the environment [9].
Integrating circularity into a business strategy is difficult because changes to the core business are required, and organizational networks are essential to closing resource loops [10]. Circularity assessment is relatively new and has not been adequately defined in the scientific literature [11,12,13]. What gets measured gets managed, and consequently, both the researchers and organizations are working toward the development of circularity indicators (e.g., [7,14]). Companies require indicators to increase their information, confidence, and capacity to transition toward a CE [15]. However, there is no common standard for measuring company level circularity, and the consideration of ecology is limited [16].
There is recognition of a need to bring more insights into circular indicators, including relationships with sustainability [17]. Indicators tend to focus on material and resource recirculation and are inadequate for assessing the sustainability performance of circular systems [13]. Existing circularity indicators have been categorised and analyzed using geographical levels (micro, meso, and macro), grouped according to the three dimensions of sustainability, and on the basis of the three Rs (reduce, reuse, and recycle) core CE principles [18]. The relationships described by these indicators focus mainly on the environment and economy. However, the relations among economic actors (especially consumers) and the natural environment are largely absent.
There is also recognition that there is low applicability of CE methods in industrial realities [19]. Hence, a holistic approach based on best practices and recognising maturity levels in industry together with accessible implementation is desirable.
This work recognises the need to extend corporate sustainability beyond the business case into ecological science and strong sustainability [20] by using a relational approach to business sustainability [21]. The relations among organizational and natural phenomena are mutually constitutive [22,23,24]. This research builds on previous investigations into ecological embeddedness for manufacturing [9,25] to propose a circularity indicator tool to assess the ecological relationships of manufacturing in support of a CE in a holistic manner based on the best practices in the industry. In [9], a template is proposed that highlights the importance of considering the product, production, and packaging as part of an ecologically embedded CE, and the authors of [25] developed a framework that manufacturers may use to formulate an ecologically embedded strategy. This research is an extension of [9,25], in which a CE indicator tool is proposed.
The proposed indicator is relatable to all industrial sectors and has dimensions corresponding to the previously developed ecologically embedded strategy formulation framework [25]. Calculation of the quantitative indicator requires no specialist knowledge and is based on the assignment of values reflecting the degree of circularity effort of the manufacturer in five dimensions: understanding, realising, utilising, negotiating, and reclaiming. The circularity indicator tool is verified using a survey of manufacturers in the United Kingdom (UK) with a positive outcome.
2. Literature Review
The following literature review employs the taxonomy of CE indicators [7] to position this research.
2.1. Product Circularity Assessment
The tool developed by the authors of [7] identifies 20 circularity indicators that may be used at the micro level. However, none of these indicators consider biological loops. A more recent work not included in [7], the Product Recovery Multi-Criteria Decision Tool (PR-MCDT), is proposed to take into account technical, economic, environmental, business, and societal aspects [26], but it is only relevant to end-of-life decision making when the product no longer satisfies the last user. The Material Circularity Indicator (MCI) tool of the Ellen MacArthur Foundation focuses on products and materials to mitigate risks but not production or packaging [27]. Circulytics® [28] claims to be the most comprehensive circularity measurement tool for companies, but it cannot be used independently of the Ellen MacArthur Foundation for the scorecard and does not consider relationships. However, it does consider company circularity, including packaging (see Section 2.3 below for further consideration of packaging indicators).
One of the biggest challenges of product circularity indicators is finding the data to reflect the performance and characteristics of the product in all its lifecycle stages [29]. A comprehensive bill of materials or bill of energy for the manufacturing process is unlikely to be available. In such cases, increasing knowledge and awareness may be more important than a single raw circularity score. Long-term and non-financial aspect evaluation are likely to require signposting of the indicative nature of the indicator output.
Furthermore, the role of consumers is only considered in a general sense through customer relations, often without issues such as reverse logistics. Consumers decide how to obtain, use, not use, and dispose of products and thus have a critical role to play in a CE, but their role to date has been underestimated and underexplored [30].
The proposed circularity indicator has a more holistic perspective of products which includes both biological loops and consumer roles in recovery.
2.2. Production Circularity Assessment
Circular production lies at the intersection of research areas such as sustainable product design, sustainable supply chains, and reverse logistics, but there is scarce information on how these concepts relate to a company’s transition to circularity [31]. Circular production systems need to monitor environmental impacts and provide these as feedback to the processing stages [32,33]. Industrial symbiosis may be used to proactively exchange resources such as raw materials, agricultural harvests, wastes, energy, and water for communities of businesses in close proximity, including reverse supply chains consisting of suppliers, plants, distributors, retailers, customers, collection centers, refurbishing centers, and manufacturing so that the actions are consistent with ecological principles [33,34,35,36,37].
A production circularity assessment methodology based on four principles—use less, absorb circularities, generate circularities, and use renewable resources—was proposed [37]. However, although energy, materials, and auxiliary resources are considered, the environmental impact is viewed only in relation to traditional alternatives, and there is no consideration of open-loop recycling of waste and by-product treatment.
The tool developed by the authors of [7] identifies nine circularity indicators that consider or aim to consider some form of impact, but only five of these take into account the environmental impact. Only one approach at the meso level (not applicable to individual companies) considers industrial symbiosis, but not environmental impact [38]. Few studies compare circularity indicators with environmental performance, and there is little understanding of the use phase [39].
The proposed circularity indicator includes consideration of upstream and downstream relationships and of the production site at the end of its life in terms of upgradability or remediation for a longer-term perspective on ecological relations.
2.3. Packaging Circularity Assessment
Increasing concerns for ecosystems have turned to the environmental burdens of packaging [40,41]. Although the micro-level tools identified in [7] may be applied to packaging, only one explicitly mentions packaging [42].
Few studies examine packaging in relation to CE strategy, including the customer [43,44]. There is a need for more studies examining packaging and its relationship with sustainability and supply chain management in a CE, in particular the interaction of the product with its packaging system and consumer behaviour toward packaging disposal, waste, and recycling [45].
The proposed circularity indicator includes considerations related to packaging based on the identification of best practices.
3. Methods
This research used mixed methods with pragmatism as the research paradigm. Pragmatism was used to focus on finding a solution that worked in the form of a CE indicator tool to measure the ecological embeddedness of manufacturers as opposed to an absolute truth or reality. Qualitative data collection and analysis were used to identify best practices in manufacturing and develop survey questions aided by expert opinions to support triangulation as guided by the theoretical framework [25]. Quantitative methods of statistical analysis were used to investigate the responses of manufacturers to these questions by using two methods (exploratory and confirmatory factor analysis) to support triangulation in the empirical part of the research.
Survey analysis was used to develop a circularity indicator tool to assess the ecological embeddedness of manufacturers. The planning and execution followed the guidelines of Forza [46] for confirmatory (theory testing) survey research using a roadmap common to product service systems and a circular economy [47]: (1) link to the theoretical level; (2) construction of the survey; (3) a pilot test; and (4) data collection and analysis.
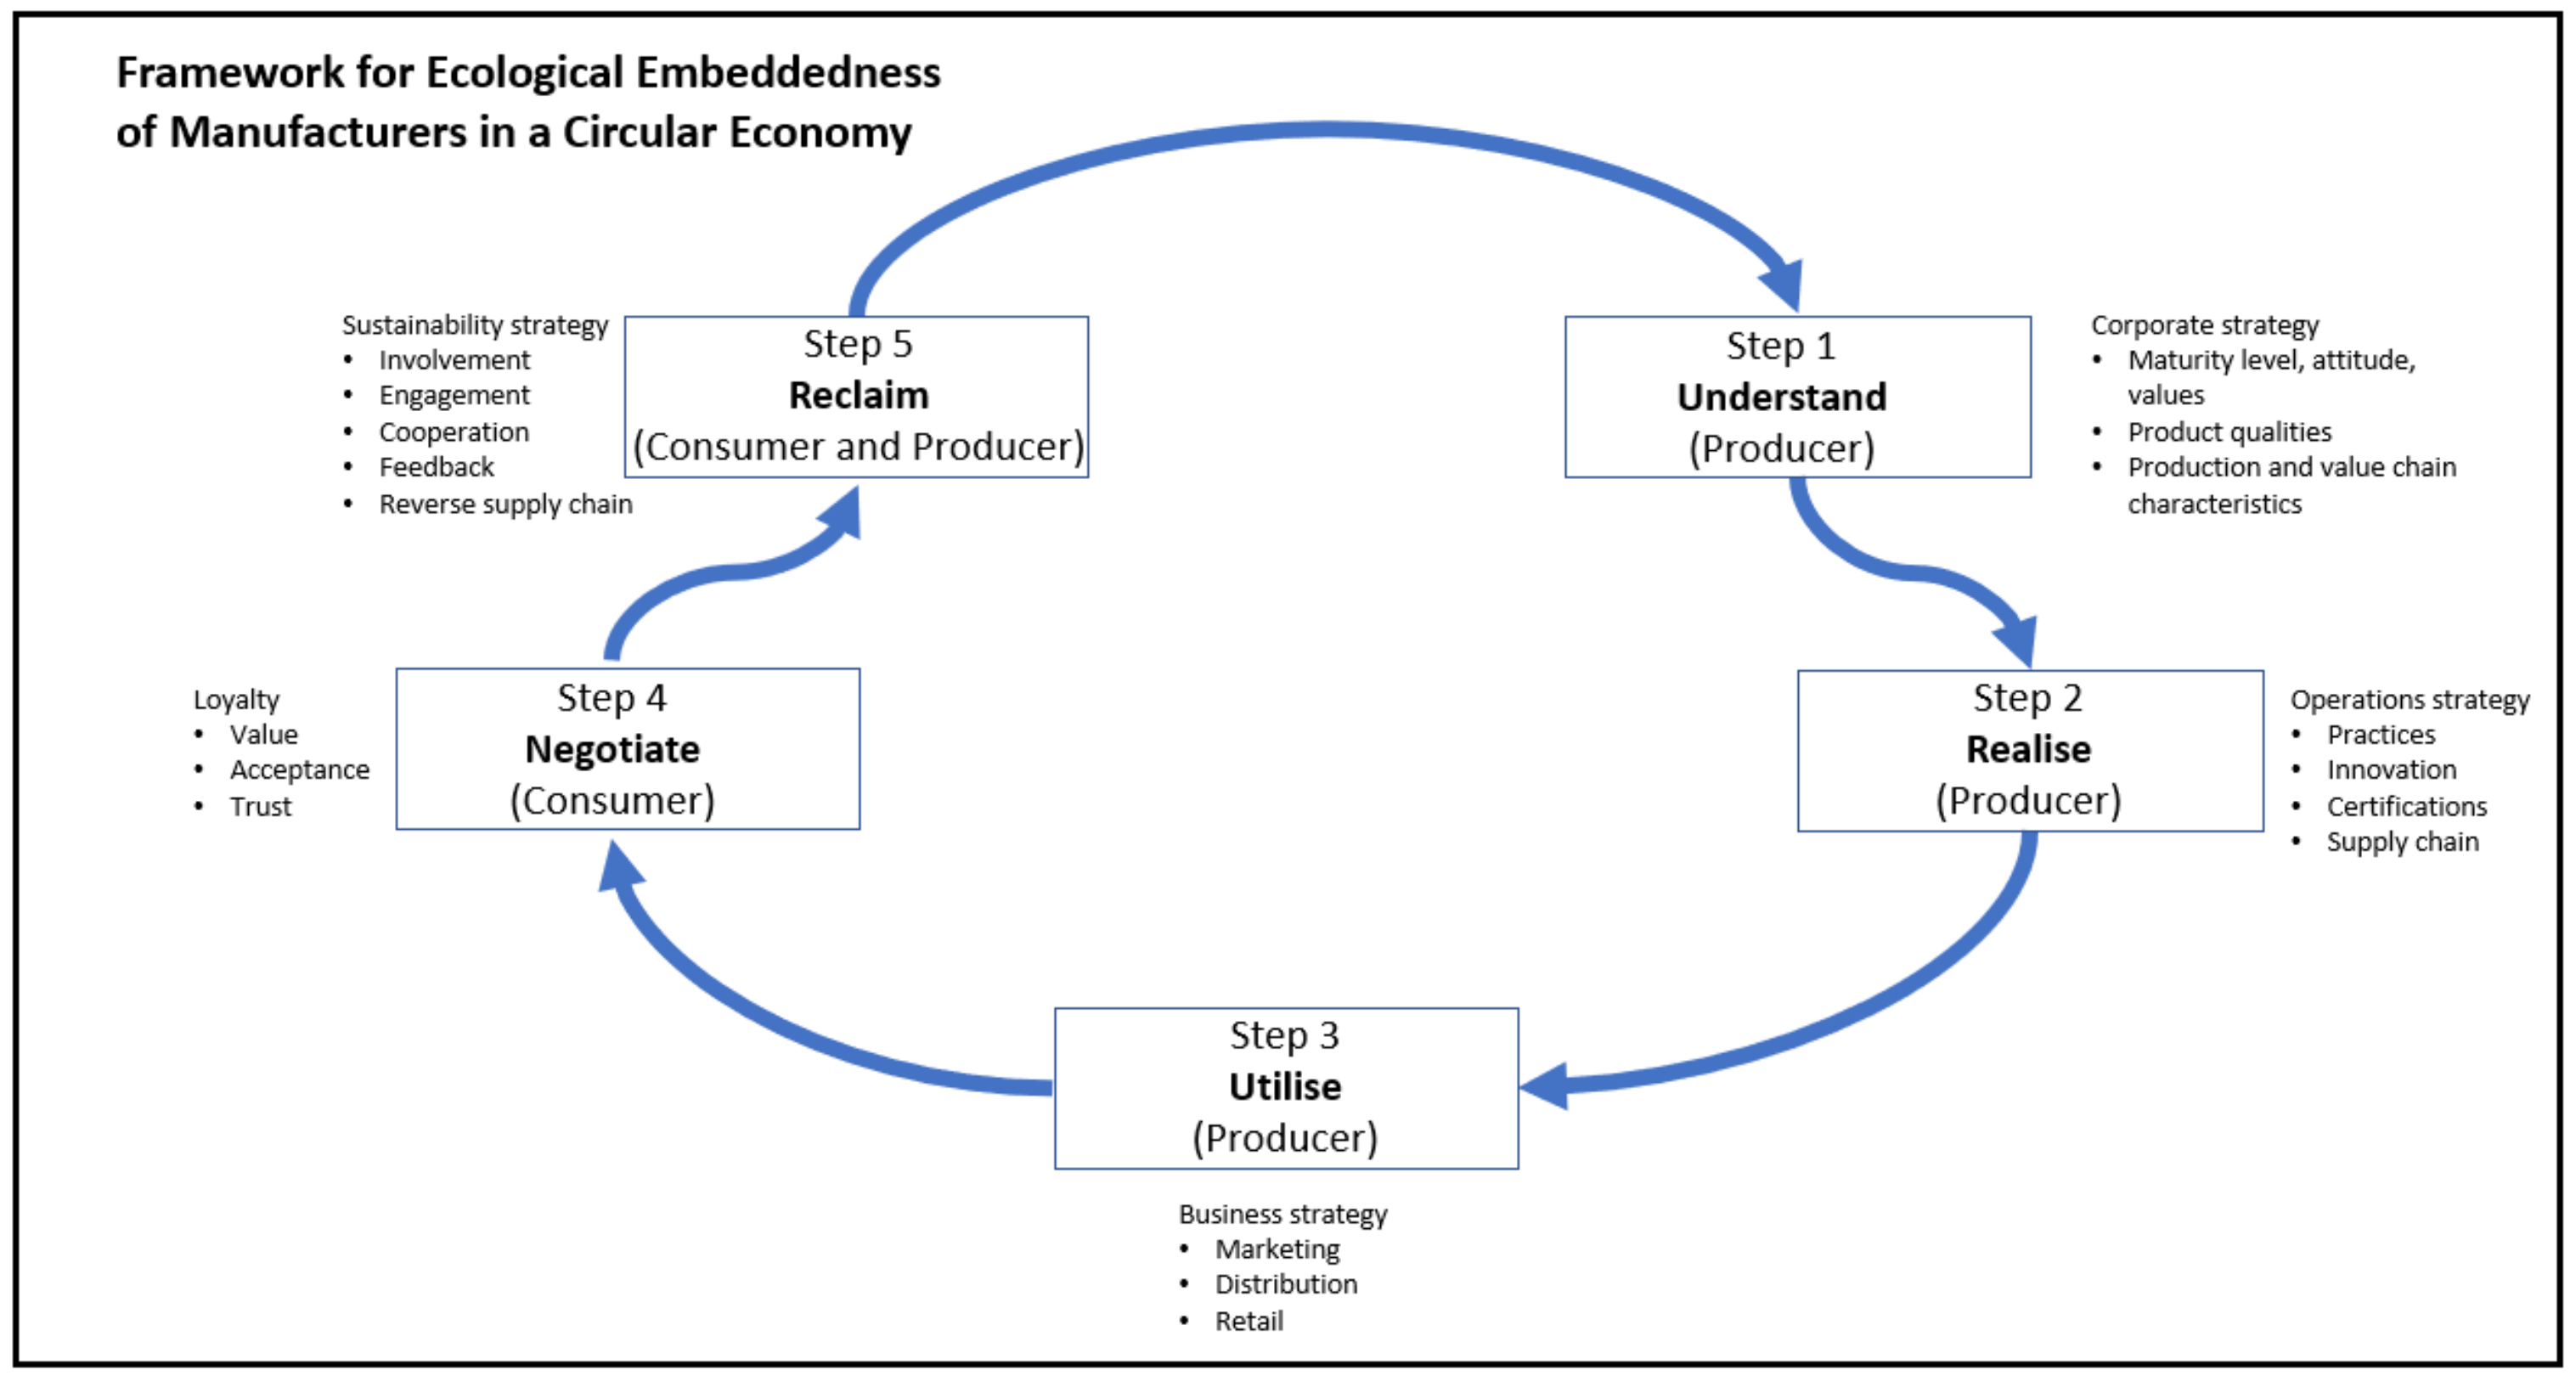
The schematic diagram depicting the theoretical framework consists of five dimensions: understanding, realising, utilising, negotiating, and reclaiming [25] (see Appendix A). Initially, the classification of best practices was undertaken based on manufacturer self-identification as selling sustainable, green, or circular products in the UK in the period from August to November 2019 [9]. The products were located through Sainsbury’s online shopping website feature for the selection of eco-friendly products, the Ellen MacArthur Foundation website, and Circular Economy Club member organizations in the UK.
Packaging was defined as what was discarded prior to or after product use, which included containers, pallets, dunnage, and unitisers (transportation packaging) [48] as well as primary (immediate product packaging) and secondary packaging (additional packaging used to protect the product that is removed by the consumer).
Biological loops were those in which food and biologically-based materials (e.g., wood or cotton) were intended to feed back through processes such as composting and anaerobic digestion, providing renewable resources for the economy.
Technical loops recover and restore materials, components, and products through reuse, repair, remanufacture, and recycling [49]. For example, the recycling of paper may only occur a limited number of times before the fiber properties are degraded, and thus paper is generally not considered a technical nutrient, and most current paper-making processes may render it unsafe as a biological nutrient for soil amendment or energy generation as well [50]. However, due to the intention of creating a biological loop, paper and similar biologically based materials were classified as biological nutrients.
Best practices with respect to the product, production, and packaging were identified and ranked, and questions were developed for each dimension of the theoretical framework. The selection of appropriate questions was nontrivial as they were proxies for the dimensions of the framework. For this reason, multiple questions were combined, as a single question would be unlikely to capture all of the meaning behind a concept or to counter distinctive sources of error or bias (see Appendix A for details).
A five-point itemised rating scale was used to code responses with assigned values reflecting the practices of manufacturers: “not ecological” = 1, “the least that can be done” = 2, “working on it” = 3, “very good” = 4, and “best practice” = 5. Such a qualitative scale does not capture the “distance” or amount of effort required to move between points on the scale. However, this is common for surveys which use Likert scales [51].
The resulting circularity indicator tool (15 questions) was piloted with industrialists to seek their opinions on adequate and appropriate coverage. This led to further refinement prior to the online survey. The online survey was anonymous to increase the probability of truthful responses. Distribution was via social media and through contacts. Data were collected from 12 December 2019 to 30 July 2020. During this time, a complete set of responses was collected for 50 respondents from process industries, predominantly food. The COVID-19 lockdown in the UK curtailed data collection.
Exploratory and confirmatory factor analysis were selected as methods for analyzing the survey results. Factor analysis is a technique that models the interrelationships among items. Factor analysis assumes that variance can be partitioned into two types: common and unique. Items that are highly correlated share a lot of common variance. Unique variance is either specific to a particular item (specific variance) or arises from errors of measurement or anything that is unexplained by common or specific variance (error variance). Principal component analysis assumes that there is no unique variance and just common variance. After deciding on the number of factors to extract, factor rotations may be used to interpret the factor loadings. Two general types of rotations are orthogonal rotation, which assumes factors are independent or uncorrelated with each other, and oblique rotation factors, which are not independent and are correlated. An unrotated factor solution simply tries to explain the maximum amount of variance with a minimal number of factors.
Exploratory factor analysis attempts to identify the smallest number of factors that can parsimoniously explain the observed covariation among a set of measured variables. The assumptions of exploratory factor analysis are more conceptual than statistical. Since the objective of exploratory factor analysis in this research was to identify the survey questions which loaded significantly on ecological embeddedness, principal component analysis and an unrotated factor solution were used in Statistical Product and Service Solutions (SPSS) version 25. Since only one factor was extracted based on examination of the scree plot, rotation was not required [52]. A subjective test of appropriateness of data is that a sizable number of correlations should exceed +/− 0.30. An objective test is of the factorability of the correlation matrix; Bartlett’s test of sphericity should produce a statistically significant chi-square value to justify the application of factor analysis. Bartlett’s test should be supplemented with a measure of sampling adequacy, namely the Kaiser-Meyer-Olkin measure, which is a ratio of correlations and partial correlations that reflects the extent to which correlations are a function of the variance shared across all variables rather than the variance shared by particular pairs of variables.
Confirmatory factor analysis is a conceptually and statistically distinct type of analysis from exploratory factor analysis. Confirmatory factor analysis may be used for the reason of testing a theory (to test if the measures of a factor are consistent with the researcher’s understanding of the nature of the factor) unlike exploratory factor analysis, which is not required to have any hypothesis related to the number of factors or what items will comprise them. Confirmatory factor analysis was done with SPSS AMOS version 25. Violations of normality in real data sets are common, so it is important to investigate skew and kurtosis. When this is the case, if there is no missing data, Bollen-Stine bootstrapping may be used to test the null hypothesis that the model is correct. With both univariate and multivariate normality, maximum likelihood estimates may be used.
Due to COVID-19, the sample size was unlikely to be sufficient for the full model. Consequently, Cronbach’s alpha (internal consistency), statistical significance (p values), and fit indices were used as proxies for an adequate sample size in identifying a parsimonious model by reducing the number of survey questions analyzed.
Table 1 summarises the tests performed in order to apply exploratory and confirmatory factor analysis.
The 50 cases associated with process manufacturing were investigated using SPSS version 25 for exploratory factor analysis. The five dimensions of the theoretical framework were confirmed to be correlated with each other under the single factor termed “ecological embeddedness” by visual inspection of the scree plot. The Kaiser-Meyer-Olkin (KMO) measure of the sampling adequacy was 0.662, indicating acceptability (>0.5), and Bartlett’s test of sphericity was significant (p < 0.001).
A >0.4 significance level was selected for the loadings (strictest condition); however, 0.3 or 0.35 could also have been used. Questions 1, 7, and 12 were removed from subsequent analysis due to the low component 1 loading (<0.4). When this was done, the KMO measure improved to 0.704. Removal of these questions caused question 11 to not load on component 1, so it was subsequently removed as well. The KMO measure improved to 0.734.
The internal instrument/scale reliability statistic (Cronbach’s Alpha measures reliability and internal consistency) for these 11 questions was 0.779, indicating that these questions were internally consistent.
Next, SPSS Analysis of Moment Structures (AMOS) version 25 was used for the confirmatory factor analysis. Initially, the unidimensional model was tested. This confirmed the findings of the exploratory factor analysis with regard to questions 1, 7, 11, and 12 not loading significantly on ecological embeddedness.
Multivariate non-normality was an issue, with the absolute value of kurtosis exceeding 5 and the Mahalanobis distance (observations farthest from the centroid) being significant for the 15 questions. The Bollen-Stine bootstrap was utilised to evaluate the overall fit of the 15-question indicator. The number of bootstrap samples was set to 2000 [53] with Bootstrap ML (maximum likelihood) in AMOS. It was possible to use the Bollen-Stine bootstrap as the 50 responses were complete. The Bollen-Stine bootstrap was found to not be significant (p = 0.598), confirming that the 15-question indicator should not be rejected.
However, statistical significance was an issue for some of the estimates, likely due to the sample size (50 cases). Consequently, iterative improvement was used to achieve statistical significance of the estimates. Deletion of questions 1, 7, 11, and 12 was performed in accordance with the exploratory factor analysis. Question 13 was found to be more appropriate for the utilising subscale. Question 5 was removed as it did not contribute significantly to the new model. This yielded the final parsimonious indicator (10 questions).
Maximum likelihood estimates were used for the parsimonious 10-question indicator, as both univariate and multivariate normality were present. Skewness fell between +/− 2, and absolute kurtosis was not greater than 7 for univariate normality [54,55]. Multivariate normality was demonstrated by the absolute normalised value for kurtosis (the corresponding critical ratio (c.r.) = 1.050) not being greater than 5 [56]. The Mahalanobis distance confirmed multivariate normality, as none of the values were statistically significant or outliers. All loadings were significant (p < 0.05) on the latent factors. The loadings were >0.4 except for question 2, which had a lower loading (0.324). This was the end point for refinement.
4. Results
First, data collected on manufacturers and their interpretations of circularity in the context of products sold in the UK are presented in Table A1 of Appendix B. An “X” in Table A2 of Appendix B indicates that the information was not obvious and was not being communicated to consumers.
Next, the practices used by manufacturers were captured and classified in terms of the lifecycle and product, production, and packaging, with the results shown in Table A2 of Appendix B.
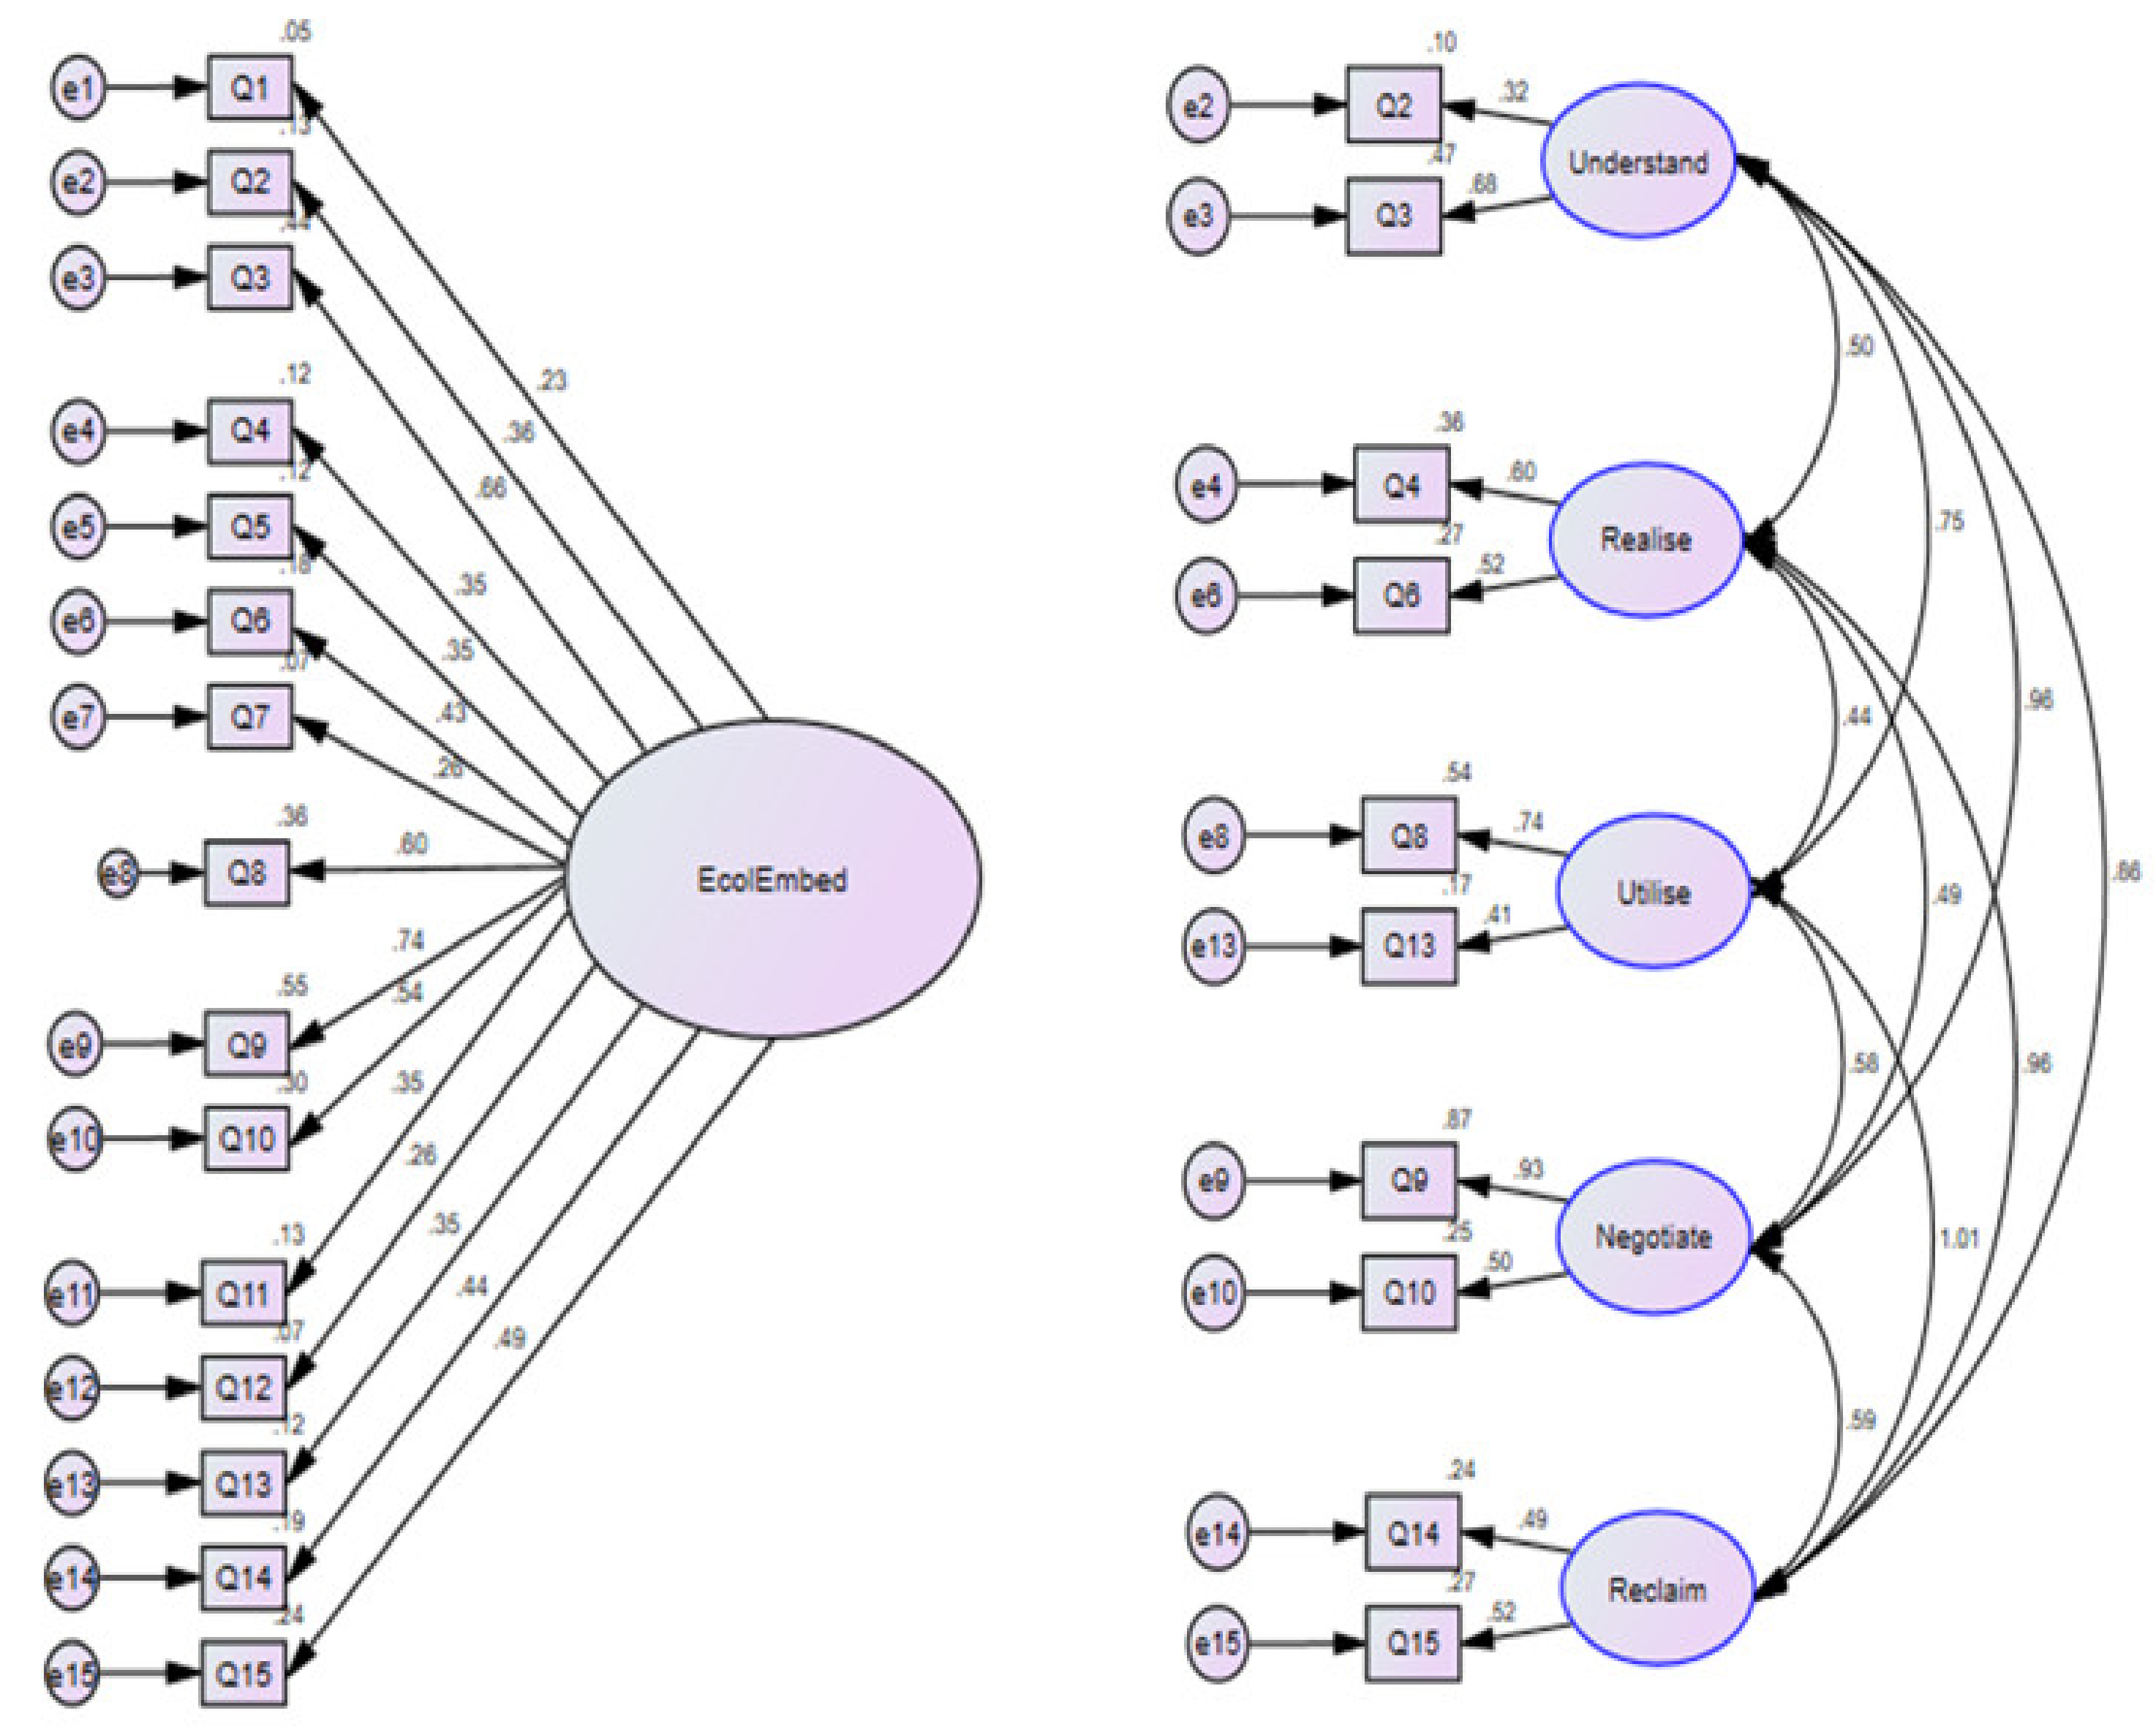
Table A2 of Appendix B was combined with the literature to develop the circularity indicator tool as described in the Methods section and Appendix A. Exploratory and confirmatory factor analysis were used to develop a parsimonious version based on 50 complete responses to the full tool by process manufacturers. Figure 1 shows the developed tool (15 questions from theory and practice) and the parsimonious version (10 questions) side by side. The numbers next to the arrows are the standardised regression weights. The numbers next to the questions (Q1–Q15) indicate how much of the variance of the survey question was explained (e.g., for Q9, 55% of the variance of Q9 was explained by ecological embeddedness). The remaining 45% was accounted for by the error (e9). The 0.55 was an estimate of the lower bound of the reliability of Q9. The numbers next to the arrows connecting the ovals in the parsimonious tool are the covariances.
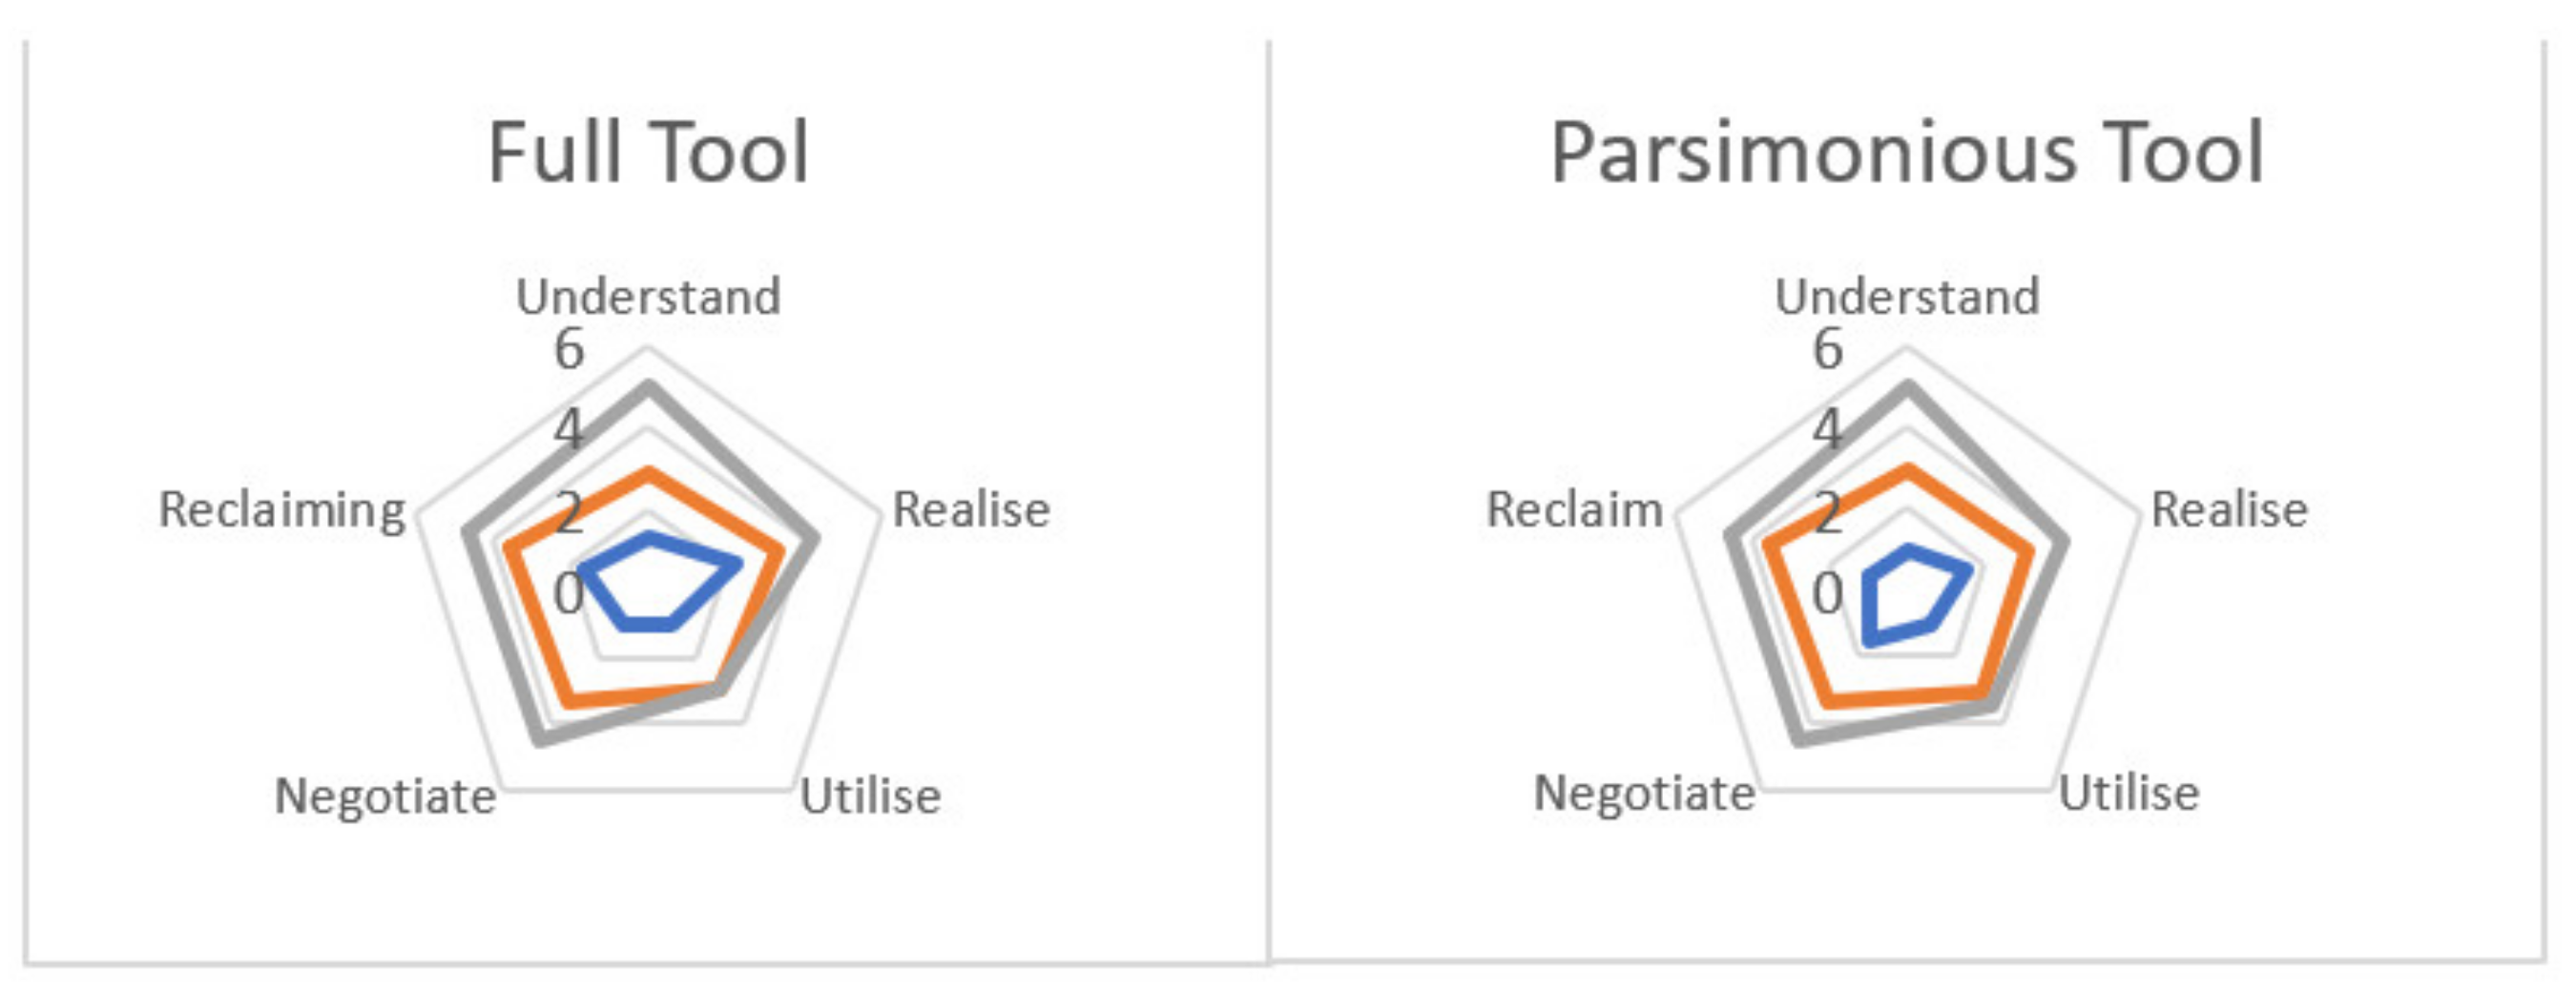
Figure 2 shows the low, mean, and high scores for the 50 process manufacturers with the full tool (15 questions) and the parsimonious tool (10 questions). The scores were converted to the five-point scale described in the Methods section. In Figure 2, the scores for both the full tool and parsimonious tool are similar and indicate that process manufacturers were weakest in the “Utilise” category, which represents how the ecological characteristics of the production, product, or packaging are communicated to consumers. The next weakest was the “Realise” category, or how manufacturers put into practice their ecological understanding. The relatively high score for the “Reclaim” category, or end-of-life treatment of the product and packaging, may have been driven by legislation in the United Kingdom. “Negotiate” represents customer perceptions as interpreted by the manufacturer, and responses may not have been based on market research. “Understand” is a self-assessment of the ecological impacts of a manufacturer’s product, method of production, and value chain. Consequently, the scores for “Negotiate” and “Understand” may have been inflated in the first use of the tool. If the tool was used as a learning experience to gain understanding of the best practices, the scores may have decreased.
Table 2 shows the summary statistics for the responses to the survey.
Question 1 correlated negatively with questions 4 and 5, indicating that there could be social desirability bias [57]; the respondents submitted more socially acceptable answers rather than the correct answers. Respondents could also believe that the approach of their business was holistic, integrative, and resilient, but their interpretation of what that entailed may not be so. Attempts to recode question 1 were unsuccessful.
Correlations among the latent variables were all high, as expected, because they were all part of the single ecological embeddedness factor. Covariances among the latent variables were significant, except for with Realise and Understand (p = 0.106) and Realise and Utilise (p = 0.131). These two p-values being >0.05 may indicate a critical area for improvement for process manufacturers, as actual implementation is affected through the Realise category. The design of a product and production (Realise) as guided by an ecological strategy (Understand) and advanced by better communication with the consumer (Utilise) may be a problem for manufacturers.
Unlike structural equation modelling (SEM), which is generally presented as data-driven in the literature, the tool being assessed is theory-driven and reflects an ideal future state of sustainability, which is currently rare. Of the manufacturers identified in Table A1 of Appendix B, which are on the forefront of sustainability in the UK, only two were confirmed as ecologically embedded [25]. This observation supports the identified disconnect with the Realise category.
Model fit for the parsimonious tool was found to be good. There were a number of indicators of model fit, as shown in Table 3 (e.g., [58,59,60]). The Tucker–Lewis Index (TLI) is an index that adjusts for parsimony (simpler models are favored over more complex ones). The TLI and Incremental Fit Index (IFI) are relatively unaffected by the sample size. The recommendation is to use a combination of an index, such as the Comparative Fit Index (CFI) or IFI, with values greater than approximately 0.95 together with a Standardised Root Mean Square Residual (SRMR) <0.08 or a Root Mean Square Error (RMSEA) <0.06 to minimize type I and type II errors [61]. In summary, overall, the parsimonious model fit well with the data. However, the 15-question circularity indicator tool was not rejected.
As a general indication of external validity, respondents to the survey were asked two questions: if they found the tool useful and if they felt anything important had been missed. There were 62 responses (including non-manufacturing) to these two questions; 54 respondents found the survey useful or informative, and 55 indicated nothing important had been missed.
5. Discussion
The original contribution of this paper is the presentation of a CE indicator tool to measure the ecological embeddedness of manufacturers. Ecological embeddedness has not been considered by existing CE indicator tools.
Indicators alert managers to unexpected problems or departure from goals and objectives. Indicators may be used to validate the success and achievements of interventions. The purpose of the developed circularity indicator tool was to identify progress toward achieving ecologically embedded manufacturing by supporting decision making for strategy formulation through the selection of appropriate interventions. The novelty of the tool is its concern with the ecological relationships required to achieve a CE. For ecological embeddedness, both the economic actors and the environment are required to benefit.
Ecological engineering is increasingly considered in terms of benefits to both humans and nature, with suggestions to integrate ecological principles, processes, and organisms with existing practices for a holistic approach to problem solving [62]. However, the majority of circularity indicators remain focused on economic considerations related to material and resource cycling, with few exceptions. For example, the eco-connectance and by-product and waste recycling rate [63] considers eco-connectance among companies in eco-industrial parks, and the Circularity and Maturity Firm-Level Assessment tool (CM-FLAT tool) recognises that maturity should be assessed together with circularity at the firm level [19].
Due to equifinality, the path to achieving ecologically embedded manufacturing may differ for each manufacturer, although there may be some commonalities in certain sectors. This is a desirable feature in that it supports differentiation. For each of the five dimensions of the proposed indicators (Understand, Realise, Utilise, Negotiate, and Reclaim), interventions involve defining inputs, outputs, and outcomes which are specific to a manufacturer. The inputs include resources, contributions, and investments, while the outputs include activities, services, events, and products. The outcomes are the results or changes related to the intervention that are experienced by the manufacturer.
The tool may be used in three ways:
- Identification of weaknesses when the results are compared with competitors;
- As a learning experience through analysis of the ranking of best practices;
- Scores on each of the dimensions may be compared internally to the manufacturer to identify areas for improvement.
Monitoring and evaluation plans should be developed by individual manufacturers to set specific actions and timelines. The first iteration of the tool should be used to develop a benchmark against which performance can be measured and as a learning experience. Following initial implementation, the tool may be used as an indicator to track progress.
The scoring of each question represents a desirable progression, and low scores in particular dimensions should be remedied for a uniform progression. The manufacturer needs to prioritise interventions based on the output of the tool. The interventions represent the formulated strategy based on the desired outcomes. Outcomes may be split into short-, medium- and long-term so that progress over time is easier to recognise. The tool supports consideration of the product, production, and packaging for improvement.
The data presented suggest that process manufacturers selling products in the UK would benefit from improved design of their products and production as guided by an ecological strategy and advanced through communication with consumers. Policy-makers may use the tool to establish sector-based circularity levels for policy and regulatory development.
The limitations of the tool include the scoring of responses, in that the effort required to move up the scale is not quantified. There may be variations in effort required both when comparing individual manufacturers in the same sector and among different sectors. Another limitation is related to the composition of the questions. The options presented are unlikely to fully capture the continuum on which manufacturers exist. The best response selected is not necessarily reflective of the true state of the manufacturer. Additionally, it is not unlikely that responses will be influenced by previous questions or that they will concentrate on either perceived positive or negative responses. Respondents may avoid choosing what they perceive to be extreme options due to negative implications, even if the extreme option would be the most accurate.
The statistically validated parsimonious tool was confirmed for use with process manufacturing. The small sample of manufacturers meant that it was not possible to validate the full tool, as COVID-19 lockdown curtailed data collection, but the full tool has not been rejected. Respondents to the survey indicated that the full tool was useful and informative. Further testing on a variety of industries is recommended. As the circularity indicator is based on the current best practices, it will need to be updated as innovation and new technology redefine the best practices and as research advances.
Future research will take into account the fallibility of human decision making in utilising the tool to seek an extension of the tool in which the application of big data and artificial intelligence is used to address the specifics of individual manufacturers.
Supplementary Materials
Supplementary Data Files are available online at https://0-www-mdpi-com.brum.beds.ac.uk/article/10.3390/su13168773/s1 and https://data.mendeley.com/datasets/fdxtczxprc/1, this is the url for the Mendeley DOI in my previous email.
Author Contributions
Conceptualization, H.T.; methodology, H.T.; software, H.T.; validation, H.T. and S.J.; formal analysis, H.T.; investigation, H.T. and S.J.; resources, J.C.; data curation, H.T. and S.J.; writing—original draft preparation, H.T.; writing—review and editing, H.T. and S.J.; visualization, H.T.; supervision, J.C.; project administration, H.T.; funding acquisition, J.C. All authors have read and agreed to the published version of the manuscript.
Funding
This research was funded by the Engineering and Physical Sciences Research Council (EPSRC), grant number EP/K030957/1. The APC was funded by the Engineering and Physical Sciences Research Council (EPSRC), grant number EP/K030957/1.
Institutional Review Board Statement
The study was conducted according to the guidelines of the Declaration of Helsinki, and approved by the Ethics Committee of LOUGHBOROUGH UNIVERSITY (Ethical Clearance Checklist and Risk Assessment 3 May 2019).
Informed Consent Statement
Informed consent was obtained from all subjects involved in the study.
Data Availability Statement
See Supplementary Data Files: “50 process industry complete.sav” (coded data file for SPSS) and “Amos 50 cases parsimonious final.amw” (path file for AMOS).
Conflicts of Interest
The authors declare no conflict of interest. The funders had no role in the design of the study; in the collection, analyses, or interpretation of data; in the writing of the manuscript, or in the decision to publish the results.
Appendix A
The framework for ecologically embedded strategy in manufacturing [25], shown in Figure A1, was used to develop the circularity indicator.
Figure A1.
Framework for ecological embeddedness of manufacturers in a circular economy [25].
Figure A1.
Framework for ecological embeddedness of manufacturers in a circular economy [25].

Appendix A.1. Step 1—Understanding
The “understanding” step of the framework (Figure A1) is meant to assess the maturity level, attitude, and values of the manufacturer in relation to their understanding of the ecological impacts of their product, method of production, and value chain. As is shown in Table A1 of Appendix B, the process, product and packaging are all important elements to assess, and these will have different weights based on the sector. For example, although the products of food manufacturing are generally biodegradable, the method of production or packaging may not be ecologically sound. The goal for the subscale is to differentiate strategic ecocentric perspectives from less ecological ones.
Although manufacturer practices (Table A2 of Appendix B) at the most advanced level are likely to indicate a corresponding advanced level of understanding, this is not assumed. Instead, the questions are based on previous research and interpreted for consistency with practices.
Decision making was investigated in [64]. Their research contributed to the following question (allocated points after each option):
Q1: Which of the following best describes ecological decision making in your company?
- (A)
- There is a holistic, integrative, resilient view of ecology that supports decision making. 5
- (B)
- Financial concerns are an obstacle to achieving ecological objectives. 2
- (C)
- Confusion about ecological complexities results in the continuation of business as usual. 1
- (D)
- Decision making is based on short-term as opposed to long-term views. 2
- (E)
- There are inadequate resources or knowledge allocated to decision making. 3
- (F)
- Decision making prioritises certain stakeholders over the wider group. 3
The next question is meant to assess attitudes toward strategies based on the work in [65]. Since an ecocentric strategy is ecologically embedded, it merits five points. On the other hand, market leadership (option E) reflects the legitimacy issue of design [9] in that it may be a public relations tool not accompanied by any positive impact.
Q2: Which of the following best describes ecological strategy in your company?
- (A)
- Risk mitigation: there is a focus on legal and other external standards concerning environmental and social aspects to avoid risks for the company. 2
- (B)
- The focus is on external relationships to demonstrate that we go beyond legislation. 3
- (C)
- The focus is on driving sustainability in society by example. 4
- (D)
- The focus is on eco-efficiency and cleaner production. 4
- (E)
- The focus is on being a market leader in ecological issues. 3
- (F)
- We demonstrate ecological leadership to both stakeholders and the market. 4
- (G)
- All of our strategy is ecocentric (i.e., it places intrinsic value on all living organisms and their natural environment, regardless of their perceived usefulness or importance to human beings). 5
- (H)
- We have no ecological strategy. 1
The final question for this dimension employs the results of [66] to determine how manufacturers view the relationship between the ecological conditions of production and product qualities or characteristics. Provenance is part of option A, and so it individually merits five points based on provenance being a causal pathway to ecological embeddedness [25]. Quality, part of another causal pathway to ecological embeddedness, is part of option D (via eco-design). Both options C and D have the same weighting because the economic actors each respectively benefit, in addition to the environment benefiting, but both the economic actors and the environment together benefit as part of option E for the maximum five points. Packaging is included for a holistic perspective and because packaging may facilitate ecological use.
Q3: What best describes the relationship between how you produce the product and the qualities or characteristics of the product?
- (A)
- Ecological production differentiates our product from competitors. 5
- (B)
- Ecological packaging differentiates our product from competitors. 4
- (C)
- The eco-design qualities of our product differentiate it from competitors. 4
- (D)
- The eco-design qualities of our product add value for our customers. 4
- (E)
- The eco-design qualities of our product both differentiate it from competitors and add value for our customers. 5
- (F)
- Being environmentally friendly is not how we compete on the market. 1
Appendix A.2. Step 2—Realising
The following questions are drawn from the best practices from the cases in Table A1 of Appendix B. These questions reflect how manufacturers realise (put into practice) their ecological understanding that is assessed by the previous understanding indicator.
In question 4, the decision was made not to differentiate functional from psychological consumer needs, although this may become important with greater resource scarcity. The first question addresses the purpose of the product. Quality and wholesomeness, which make up the second causal pathway to ecological embeddedness [25], are captured in this question (wholesome and quality in B and E, respectively, and quality in D).
Q4: How would you describe the product you manufacture?
- (A)
- The product fulfills a consumer need. 2
- (B)
- The product fulfills a consumer need and is environmentally benign (e.g., biodegradable). 5
- (C)
- The product fulfills a consumer need and balances the use phase environmental impact with the purchase price. 3
- (D)
- The product fulfills a consumer need and has minimal environmental impact in the use phase. 4
- (E)
- The product fulfills a consumer need and has minimal environmental impact in the use phase and at its end of life. 5
- (F)
- None of the above. 1
The remaining questions relate directly to best practices (Table A2 of Appendix B).
Q5: How would you describe the packaging of your product?
- (A)
- Primary packaging is biodegradable, recyclable, or reusable multiple times. 3
- (B)
- Secondary packaging is biodegradable, recyclable, or reusable multiple times. 3
- (C)
- Transportation packaging is biodegradable, recyclable, or reusable multiple times. 3
- (D)
- Primary and secondary packaging are biodegradable, recyclable, or reusable multiple times. 4
- (E)
- Primary and transportation packaging are biodegradable, recyclable. or reusable multiple times. 4
- (F)
- Secondary and transportation packaging are biodegradable, recyclable, or reusable multiple times. 4
- (G)
- Transportation, primary, and secondary packaging are all biodegradable, recyclable, or reusable multiple times. 5
- (H)
- None of the above. 1
Q6: How would you describe your production facilities?
- (A)
- The building is state of the art for environmental impact, with features such as adequate insulation, a green roof, and dual-flush WCs. 4
- (B)
- The production system is state of the art for the environment to minimise resource use and pollution. 4
- (C)
- Both the building and production system are state of the art for minimum environmental impact. 5
- (D)
- Some elements of the building or production system are state of the art to minimise environmental impact. 3
- (E)
- None of the above. 1
Q7: How would you describe the ecology of your upstream?
- (A)
- Short visible supply chain with lasting relationships that support ecological practices. 5
- (B)
- Long supply chain with lasting relationships that support ecological practices. 4
- (C)
- First-tier supplier visibility, transparency, and traceability. 2
- (D)
- Second-tier supplier visibility, transparency, and traceability. 3
- (E)
- Long supply chain with unknown provenance for many materials and components. 1
Appendix A.3. Step 3—Utilising
The focus of the question on utilization is to identify how manufacturers communicate the ecological characteristics of the production, product, or packaging to consumers. The question is based on the findings in [66], which are expanded to include packaging. The same pattern as for previous questions is used to determine the scoring, based on whether both the economic actors and the environment benefit in accordance with the definition of ecological embeddedness [24].
Q8: How do you communicate your ecological practices to consumers?
- (A)
- Production practices are highlighted as being environmentally friendly. 3
- (B)
- Packaging is highlighted as being environmentally friendly. 3
- (C)
- The eco-design of the product is highlighted as being environmentally friendly. 3
- (D)
- Production practices and packaging are highlighted as being environmentally friendly. 4
- (E)
- Production practices and eco-design are highlighted as being environmentally friendly. 4
- (F)
- Packaging and eco-design are highlighted as being environmentally friendly. 4
- (G)
- Production practices, packaging, and eco-design are highlighted as being environmentally friendly. 5
- (H)
- The eco-design of the product is highlighted as adding value for the consumer. 3
- (I)
- No ecological practices are communicated to the consumer. 1
Appendix A.4. Step 4—Negotiating
These questions examine customer perceptions as interpreted by the manufacturer. If respondents common to one manufacturer had different responses, this would indicate a need to revisit perceptions. If market research is available, it should be used preferentially in responding to these questions. The first question relates directly to the framework. The second question revisits provenance, quality, and wholesomeness from the consumer perspective with the end of life included.
Q9: What best describes your customers?
- (A)
- Our customers interpret ecological information as greenwashing. 2
- (B)
- Our customers accept (i.e., engage with as opposed to ignore) the ecological information we provide. 3
- (C)
- Our customers trust (i.e., believe) the ecological information we provide. 4
- (D)
- Our customers value (i.e., use to make a purchase decision) the ecological information we provide. 5
- (E)
- We do not provide ecological information to our customers. 1
Q10: Why do customers buy your product as opposed to a comparable product?
- (A)
- The materials and resources that are used to make the product are environmentally friendly and ethically sourced. 5
- (B)
- The production process is environmentally friendly and ethical. 5
- (C)
- The quality of the product minimises waste and conserves resources (e.g., water and energy) when used. 5
- (D)
- The product is a healthy alternative. 5
- (E)
- The product has environmentally friendly packaging. 4
- (F)
- The product is associated with services to extend life. 5
- (G)
- For the benefits of the eco-design of your product. 5
- (H)
- The product fulfills a functional or psychological need. 2
- (I)
- The cost of your product. 1
- (J)
- Do not know. 1
Appendix A.5. Step 5—Reclaiming
The following questions address the EOL treatment of the product and packaging, as well as the generally overlooked implications of production [67]. The options are based on Table A2 of Appendix B.
Q11: Which of the following best describes the relationships to your production?
- (A)
- Our production builds community relationships. 3
- (B)
- We have lasting relationships upstream. 3
- (C)
- We have lasting relationships downstream. 3
- (D)
- We have lasting relationships upstream and downstream. 4
- (E)
- We have lasting relationships upstream, downstream, and with the community. 5
- (F)
- We have temporary relationships that focus on maximising competitive advantage. 1
Q12: How do you see your production facility in the future?
- (A)
- Production is difficult or costly to upgrade to better ecological standards, so the site must be abandoned without remediation. 1
- (B)
- Production is difficult or costly to upgrade to better ecological standards, but the site may be remediated. 2
- (C)
- Production is upgradable for improved ecological performance. 5
Q13: How do your customers know what to do with the product at its end of life?
- (A)
- We provide a recycling locator online. 3
- (B)
- We identify end of life pathway(s) with the product such as composting, refurbishment, and remanufacture. 4
- (C)
- The product is leased, and we take back the product. 5
- (D)
- Customers are informed the product is not recyclable at this time. 2
- (E)
- The product is partially recyclable, and components or parts for recycling are marked for identification. 4
- (F)
- The product is partially recyclable, but components or parts are not marked for identification. 3
- (G)
- End of life information is not provided. 1
Q14: What is the aim for your product at its end of life?
- (A)
- It biodegrades. 5
- (B)
- It is recycled by a third party. 4
- (C)
- We take it back for recycling. 5
- (D)
- We take it back for refurbishment, remanufacture, reuse, or upgrade. 5
- (E)
- We take it back for component or part recovery. 5
- (F)
- We do not have an end of life aim for the product. 1
Q15: How do your customers or logistics providers know what to do with the packaging at its end of life?
- (A)
- We provide a recycling locator online. 3
- (B)
- We identify end of life pathway(s) for the packaging such as composting, refilling, and reuse. 4
- (C)
- We take back the packaging for reuse or recycling. 5
- (D)
- Information is provided that the packaging is not recyclable at this time. 2
- (E)
- The packaging is partially recyclable, and components or parts for recycling are marked for identification. 4
- (F)
- The packaging is partially recyclable, but components or parts are not marked for identification. 3
- (G)
- End of life information is not provided. 1
Appendix B

Table A1.
Manufacturers and their interpretations of circularity with respect to their products.
| Product | Manufacturer | Sector 1 | Circularity—Process, Product, and Packaging | Loops—Biological and Technical |
|---|---|---|---|---|
| Sugar (Silverspoon, 2 kg) | AB Sugar—British Sugar | Food and beverage sector | process, product, and packaging | process—technical and biological product—biological packaging—biological |
| Batteries (8 pack, AA) | Duracell | Machinery sector | product (cascading), packaging (85% recycled material with nontoxic inks) | process—X product—technical packaging—technical and biological |
| Toilet cleaner (pine and mint 750 mL) | Ecover | Chemical sector | process (state-of-the-art factory in completely sustainable process), product (completely biodegradable), and packaging (refillable and bottle and label recyclable) | process—technical and biological product—biological packaging—technical |
| Laundry liquid (1 L) | Bio-D | Chemical sector | product (suitable for septic or grey water systems), packaging (bottle 100% recycled high-density polyethylene (rHDPE), cap – polypropylene (PP) (100% UK post-consumer waste bottle), and can be recycled again) | process—X product—biological packaging—technical |
| Multi-purpose cleaner (spray, 700 mL) | Delphis | Chemical sector | process (all suppliers and business partners are UK-based for lower environmental and human impact from transport and supply chain visibility), product, and packaging (recycled British plastic (100%), bottle caps, spray triggers, and labelling can be recycled, and refills) | process—X product—X packaging—technical |
| Washing up liquid (400 mL) | Greenscents | Chemical sector | product (72% organic), packaging—recyclable, all bottles are plastic-free made from biopolymer plastics from the waste products of sugar cane, 20-L jerrycan may be returned for washing and reuse, filler in boxes is from renewable sources, 100% biodegradable and fully compostable, and packaging tape made from sustainable paper and 100% recyclable | process—X product—X packaging—technical or biological (box filler) |
| Kitchen cleaner (zesty lemon 750 mL) | Astonish | Chemical sector | process (lab, manufacture, packaging all under one roof, distribution partner next door, incorporate two journeys into one when possible, and local to reduce carbon footprint), product >99% biodegradable, and packaging recyclable | process—X product—biological (>99%) packaging—technical |
| Organic body wash (200 mL) | Kinn Living | Chemical sector | product (98.6% natural and 73.2% organic) and packaging (recyclable) | process—X product—X packaging—technical |
| Shampoo (lavender and geranium, 5 L) | Faith in Nature | Chemical sector | process (manufactured locally using only the best natural ingredients) and packaging (refills and recycling) | process—X product—X packaging—technical |
| Mop (Deep Clean Mop) | e-cloth | Other metals sector | durable, lightweight aluminum, special weave breaks up and holds grease and dirt ordinary mops leave behind, cleans just using water, no chemicals, the power is in the fibers, removes over 99% of bacteria, 3-year guarantee, use and care, and machine wash mop head regularly up to 60 °C with a little detergent | process—X product—technical or biological packaging—X |
| Alkimi glass and window cleaner (500 mL) | Challs International, Ltd. | Chemical sector | nature-engineered, made with natural ingredients from sustainable sources, naturally fast-acting, nontoxic, safe, environmentally friendly alternative to, for example, petrochemical solvents without parabens | process—biological product—biological packaging—X |
| Toast Ale Craft Lager (beer in can) | Toast Ale | Food and beverage sector | process (material input surplus bread) | process—X product—biological packaging—technical |
| Hardtack (beer in can) | Jaw Brew | Food and beverage sector | process (material input, heat recovery, and byproduct for cattle feed and mulch) | process—X product—biological packaging—technical or biological (biodegradable plastic connectors) |
| Thorough Bread (beer in bottle) | Bute Brew Co | Food and beverage sector | process (material input of unsold bread) | process—X product—biological packaging—technical |
| Hot-rolled steel for automotive industry | TaTa Steel (business consumer) | Iron and steel sector | process (material input, production process, and byproduct), product, and packaging | process—technical product—technical packaging—technical |
| Jeans | MUD Jeans | Textile and clothing industry | process (short supply chain with lasting relationships, recycling factory in Valencia, organic cotton, less water usage in production than industry standard, water output is cleaner than input, carbon neutral, renewable, fabrics are up to 40% recycled post-consumer denim, energy in factories, use recycled cotton, no toxic chemicals in production, and innovation in processes (e.g., laser instead of sandpaper and chemical), product (take-back for recycling, buttons and rivets are stainless steel for recycling and leather patch replaced with printed label for monomaterial), and packaging (reusable 20 times) | process—technical product—technical packaging—technical |
| Shoes | Veja Shoes | Footwear industry | process (material input—fair trade and organic, no polyvinyl chloride (PVC) in the supply chain, responsible production, and upcycling) and product (biodegradable alternative to leather in some shoes, with sneaker recycling yet to be established) | process—technical product—biological in part for some shoes packaging—X |
| Mobile phone | Fairphone | Machinery sector | process (material input, design, supply chain, and manufacturing and life cycle) product (design for longevity, easy repair and modular upgrades, and recyclable waste electrical and electronic equipment (WEEE) waste) | process—technical product—technical packaging—X |
| Washing machine (Eco 7 kg) | Miele | Machinery sector | product (built to last, energy and water consumption, and recyclable WEEE waste) | process—X product—technical packaging—X |
| American fridge freezer (LSR100) | LG | Machinery sector | product (Instaview door in door for less energy use, Smart Diagnosis, and recyclable WEEE waste) | process—X product—technical packaging—X |
| Insulation (6 pack, 1200 mm × 400 mm × 10 mm) | Rockwool | Non-metallic minerals sector | process (material input—made from naturally occurring volcanic rock which is 97% recyclable) and product (97% recyclable) | process—technical product—technical packaging—X |
| WorkForce Pro (WF-C8690DWF SERIES) | Epson (business consumer) | Machinery sector | product energy consumption | process—X product—technical packaging—X |
| Coffee pod machine (SENSEO Original) | Philips | Machinery sector | material input, packaging, auto shutoff, and energy consumption | process—X product—technical packaging—technical |
| Kitchen furniture (Kungsbacka) | IKEA | Furniture sector | process (material input—kitchen door made from recycled materials (min. 90% recycled foil and edging from polyethylene terephthalate (PET) bottles, recycled wood)), product (can recycle indefinitely, but service not available), and packaging | process—technical product—technical packaging—technical |
| Hybrid car (Camry) | Toyota | Machinery sector | fuel economy, emissions, regenerative braking hybrid brake pads last longer than conventional, hybrid service for improved fuel economy, aim to recycle over 50% of the weight of a hybrid battery, recycling info including marking plastic for easier recycling, and may qualify for free take back scheme or money | process—X product—technical packaging—X |
| Electric car (Leaf) | Nissan | Machinery sector | energy usage, emissions, and free recycling | process—X product—technical packaging—X |
| Landfill compactor (Cat 81 6K, one of Cat’s most rebuilt products) | Finning Caterpillar (business consumer) | Machinery sector | process (energy conservation, greenhouse gas emissions reductions, and water conservation), product (built for multiple lives, designed to last, remanufacturing, rebuilding, and component reuse) | process—technical product—technical packaging—X |
Table A2.
Ecological practices of manufacturers at life cycle stages with respect to production, product, and packaging (BOL = beginning of life, MOL = middle of life, and EOL = end of life).
Table A2.
Ecological practices of manufacturers at life cycle stages with respect to production, product, and packaging (BOL = beginning of life, MOL = middle of life, and EOL = end of life).
| Manufacturer Practices | BOL | MOL | EOL |
|---|---|---|---|
| Production | Virgin material
| Production emissions
| Production builds
|
| Product | Design or redesign for
| Consumer informed of
| Recycling locator or location
|
| Packaging | Virgin material
| Not reusable Not reusable but working on it Reusable
| Recycling locator or location
Partially recyclable
|
1 “Not recycled” means less than 20% of people have access to recycling facilities for such items. 2 “Check locally” means 20–75% of people have access to recycling facilities for such items. 3 “Widely recycled” means 75% of people have access to recycling facilities for these items [70].
References
- Purser, R.; Park, C.; Montuori, A. Limits to Anthropocentrism: Toward an Ecocentric Organization Paradigm? Acad. Manag. Rev. 1995, 20, 1053. [Google Scholar] [CrossRef]
- Geissdoerfer, M.; Savaget, P.; Bocken, N.; Hultink, E. The Circular Economy—A new sustainability paradigm? J. Clean. Prod. 2017, 143, 757–768. [Google Scholar] [CrossRef] [Green Version]
- Ghisellini, P.; Cialani, C.; Ulgiati, S. A Review on Circular Economy: The Expected Transition to a Balanced Interplay of Environmental and Economic Systems. J. Clean. Prod. 2016, 114, 11–32. [Google Scholar] [CrossRef]
- Bocken, N.; de Pauw, I.; Bakker, C.; van der Grinten, B. Product design and business model strategies for a circular economy. J. Ind. Prod. Eng. 2016, 33, 308–320. [Google Scholar] [CrossRef] [Green Version]
- Jawahir, I.; Bradley, R. Technological Elements of Circular Economy and the Principles of 6R-Based Closed-loop Material Flow in Sustainable Manufacturing. Procedia CIRP 2016, 40, 103–108. [Google Scholar] [CrossRef] [Green Version]
- Thierry, M.; Salomon, M.; van Nunen, J.; van Wassenhove, L. Strategic Issues in Product Recovery Management. Calif. Manag. Rev. 1995, 37, 114–135. [Google Scholar] [CrossRef] [Green Version]
- Saidani, M.; Yannou, B.; Leroy, Y.; Cluzel, F.; Kendall, A. A taxonomy of circular economy indicators. J. Clean. Prod. 2019, 207, 542–559. [Google Scholar] [CrossRef] [Green Version]
- Landrum, N.; Ohsowski, B. Identifying Worldviews on Corporate Sustainability: A Content Analysis of Corporate Sustainability Reports. Bus. Strategy Environ. 2018, 27, 128–151. [Google Scholar] [CrossRef] [Green Version]
- Trollman, H.; Colwill, J.; Brejnholt, A. Ecologically Embedded Design in Manufacturing: Legitimation within Circular Economy. Sustainability 2020, 12, 4261. [Google Scholar] [CrossRef]
- Eikelenboom, M.; de Jong, G. The Impact of Managers and Network Interactions on the Integration of Circularity in Business Strategy. Organ. Environ. 2021. [Google Scholar] [CrossRef]
- Camacho-Otero, J.; Ordoñez, I. Circularity assessment in companies: Conceptual elements for developing assessment tools. In Proceedings of the 23rd International Sustainable Development Research Society Conference, Bogota, Colombia, 14–16 June 2017. [Google Scholar]
- Lindgreen, E.R.; Salomone, R.; Reyes, T. A Critical Review of Academic Approaches, Methods and Tools to Assess Circular Economy at the Micro Level. Sustainability 2020, 12, 4973. [Google Scholar] [CrossRef]
- De Oliveira, C.T.; Dantas, T.E.T.; Soares, S.R. Nano and micro level circular economy indicators: Assisting decision-makers in circularity assessments. Sustain. Prod. Consum. 2021, 26, 455–468. [Google Scholar] [CrossRef]
- Ellen MacArthur Foundation. Available online: https://www.ellenmacarthurfoundation.org/resources/apply/circularity-indicators (accessed on 5 November 2019).
- Huhtala, A. Available online: https://www.doria.fi/bitstream/handle/10024/162122/European%20Academies%20Science%20Advisory%20Council%20-%20Circular%20economy%20a%20commentary%20from%20the%20perspectives%20of%20the%20natural%20and%20social%20sciences.pdf?sequence=1&isAllowed=y (accessed on 3 December 2020).
- Kristensen, H.S.; Mosgaard, M.A. A review of micro level indicators for a circular economy—Moving away from the three dimensions of sustainability? J. Clean. Prod. 2020, 243, 118531. [Google Scholar] [CrossRef]
- Martinho, V.J.P.D. Insights into circular economy indicators: Emphasizing dimensions of sustainability. J. Clean. Prod. 2021, 10, 100119. [Google Scholar] [CrossRef]
- De Pascale, A.; Arbolino, R.; Szopik-Depczyńska, K.; Limosani, M.; Ioppolo, G. A systematic review for measuring circular economy: The 61 indicators. J. Clean. Prod. 2021, 281, 124924. [Google Scholar] [CrossRef]
- Sacco, P.; Vinante, C.; Borgianni, Y.; Orzes, G. Circular Economy at the Firm Level: A New Tool for Assessing Maturity and Circularity. Sustainability 2021, 13, 5288. [Google Scholar] [CrossRef]
- Landrum, N.E. Stages of Corporate Sustainability: Integrating the Strong Sustainability Worldview. Organ. Environ. 2017, 31, 287–313. [Google Scholar] [CrossRef]
- Good, J.; Thorpe, A. The Nature of Organizing: A Relational Approach to Understanding Business Sustainability. Organ. Environ. 2019, 33, 359–383. [Google Scholar] [CrossRef]
- Whiteman, G.; Cooper, W.H. Ecological Embeddedness. Acad. Manag. J. 2000, 43, 1265–1282. [Google Scholar] [CrossRef]
- Whiteman, G.; Cooper, W.H. Ecological Sensemaking. Acad. Manag. J. 2011, 54, 889–911. [Google Scholar] [CrossRef]
- Morris, C.; Kirwan, J. Ecological embeddedness: An interrogation and refinement of the concept within the context of alternative food networks in the UK. J. Rural. Stud. 2011, 27, 322–330. [Google Scholar] [CrossRef]
- Trollman, H.; Colwill, J. A Transformational Change Framework for Developing Ecologically Embedded Manufacturing. Glob. J. Flex. Syst. Manag. 2020, 21, 341–368. [Google Scholar] [CrossRef]
- Alamerew, Y.; Brissaud, D. Circular economy assessment tool for end of life product recovery strategies. J. Remanuf. 2018, 9, 169–185. [Google Scholar] [CrossRef] [Green Version]
- Ellen MacArthur Foundation. Available online: https://www.ellenmacarthurfoundation.org/resources/apply/material-circularity-indicator (accessed on 18 November 2020).
- Ellen MacArthur Foundation. Available online: https://www.ellenmacarthurfoundation.org/resources/apply/circulytics-measuring-circularity (accessed on 18 November 2020).
- Cayzer, S.; Griffiths, P.; Beghetto, V. Design of indicators for measuring product performance in the circular economy. Int. J. Sustain. Eng. 2017, 10, 289–298. [Google Scholar] [CrossRef] [Green Version]
- Selvefors, A.; Rexfelt, O.; Renström, S.; Strömberg, H. Use to use—A user perspective on product circularity. J. Clean. Prod. 2019, 223, 1014–1028. [Google Scholar] [CrossRef]
- Franco, M. Circular economy at the micro level: A dynamic view of incumbents’ struggles and challenges in the textile industry. J. Clean. Prod. 2017, 168, 833–845. [Google Scholar] [CrossRef]
- Hall, J. Environmental Supply Chain Innovations. In Greening the Supply Chain; Sarkis, J., Ed.; Springer: Cham, Switzerland, 2006; Volume 35, pp. 233–249. [Google Scholar] [CrossRef] [Green Version]
- Vimal, K.; Rajak, S.; Kandasamy, J. Analysis of network design for a circular production system using multi-objective mixed integer linear programming model. J. Manuf. Technol. Manag. 2019, 30, 628–646. [Google Scholar] [CrossRef]
- Baas, L.; Huisingh, D. The synergistic role of embeddedness and capabilities in industrial symbiosis: Illustration based upon 12 years of experiences in the Rotterdam Harbour and Industry Complex. Prog. Ind. Ecol. 2008, 5, 399–421. [Google Scholar] [CrossRef] [Green Version]
- Grippo, V.; Romano, S.; Vastola, A. Multi-criteria Evaluation of Bran Use to Promote Circularity in the Cereal Production Chain. Nat. Resour. Res. 2019, 28, 125–137. [Google Scholar] [CrossRef]
- Fric, U.; Rončević, B. E-Simbioza—Leading the Way to a Circular Economy through Industrial Symbiosis in Slovenia. Soc. Ekol. Zagreb 2018, 27, 119–140. [Google Scholar] [CrossRef]
- Angioletti, C.; Despeisse, M.; Rocca, R. Product Circularity Assessment Methodology. In IFIP International Conference on Advances in Production Management Systems; Lödding, H., Riedel, R., Thoben, K.D., von Cieminski, G., Kiritsis, D., Eds.; Springer: Cham, Switzerland, 2017; Volume 512, pp. 411–418. [Google Scholar] [CrossRef] [Green Version]
- Wen, Z.; Meng, X. Quantitative assessment of industrial symbiosis for the promotion of circular economy: A case study of the printed circuit boards industry in China’s Suzhou New District. J. Clean. Prod. 2015, 90, 211–219. [Google Scholar] [CrossRef]
- Harris, S.; Martin, M.; Diener, D. Circularity for circularity’s sake? Scoping review of assessment methods for environmental performance in the circular economy. Sustain. Prod. Consum. 2021, 26, 172–186. [Google Scholar] [CrossRef]
- Flanigan, L.; Frischknecht, R.; Montalbo, T. An Analysis of Life Cycle Assessment in Packaging for Food and Beverage Applications; UNEPSETAC Life Cycle Initiative: Paris, France, 2013. [Google Scholar]
- Herbes, C.; Beuthner, C.; Ramme, I. Consumer attitudes towards biobased packaging—A cross-cultural comparative study. J. Clean. Prod. 2018, 194, 203–218. [Google Scholar] [CrossRef]
- Kingfisher. The Business Opportunity of Closed Loop Innovation; Kingfisher: Westminster, UK, 2014. [Google Scholar]
- Civancik-Uslu, D.; Puig, R.; Voigt, S.; Walter, D.; Fullana-I-Palmer, P. Improving the production chain with LCA and eco-design: Application to cosmetic packaging. Resour. Conserv. Recycl. 2019, 151, 104475. [Google Scholar] [CrossRef]
- Leissner, S.; Ryan-Fogarty, Y. Challenges and opportunities for reduction of single use plastics in healthcare: A case study of single use infant formula bottles in two Irish maternity hospitals. Resour. Conserv. Recycl. 2019, 151, 104462. [Google Scholar] [CrossRef]
- Meherishi, L.; Narayana, S.; Ranjani, K. Sustainable packaging for supply chain management in the circular economy: A review. J. Clean. Prod. 2019, 237, 117582. [Google Scholar] [CrossRef]
- Forza, C. Survey research in operations management: A process-based perspective. Int. J. Oper. Prod. Manag. 2002, 22, 152–194. [Google Scholar] [CrossRef] [Green Version]
- Pecorari, P.M.; Lima, C.R.C. Correlation of customer experience with the acceptance of product-service systems and circular economy. J. Clean. Prod. 2021, 281, 125275. [Google Scholar] [CrossRef]
- MHI. Available online: http://www.mhi.org/fundamentals/packaging (accessed on 3 December 2020).
- Ellen MacArthur Foundation. Available online: https://www.ellenmacarthurfoundation.org/circular-economy/concept (accessed on 5 November 2019).
- Cradle to Cradle Beyond Recycling. Available online: http://www.c2c-centre.com/news/blog-cradle-cradle%C2%AE-beyond-recycling (accessed on 3 December 2020).
- Malhotra, N.; Dash, S. Marketing Research: An Applied Orientation, 7th ed.; Pearson: New Delhi, India, 2016. [Google Scholar]
- Pérez, E.; Medrano, L. Exploratory factor analysis: Conceptual and methodological basis. Rev. Argent. Cienc. Comport. 2014, 6, 71–80. [Google Scholar]
- Nevitt, J.; Hancock, G. Performance of Bootstrapping Approaches to Model Test Statistics and Parameter Standard Error Estimation in Structural Equation Modeling. Struct. Equ. Modeling 2001, 8, 353–377. [Google Scholar] [CrossRef]
- Byrne, B. Structural Equation Modeling with AMOS: Basic Concepts, Applications, and Programming, 2nd ed.; Routledge: New York, NY, USA, 2010. [Google Scholar]
- Hair, J.; Black, W.; Babin, B.; Anderson, R. Multivariate Data Analysis: A Global Perspective, 7th ed.; Pearson Education: London, UK, 2010; Available online: https://pdfs.semanticscholar.org/6885/bb9a29e8a5804a71bf5b6e813f2f966269bc.pdf (accessed on 3 December 2020).
- Bentler, P. EQS 6 Structural Equations Program Manual; Multivariate Software: Encino, LA, USA, 2006. [Google Scholar]
- Crowne, D.; Marlowe, D. The Approval Motive; John Wiley: New York, NY, USA, 1964. [Google Scholar]
- Das, D. Development and validation of a scale for measuring Sustainable Supply Chain Management practices and performance. J. Clean. Prod. 2017, 164, 1344–1362. [Google Scholar] [CrossRef]
- Pathak, P.; Singh, M.; Badhotiya, G. Performance obstacles in sustainable manufacturing—Model building and validation. J. Adv. Manag. Res. 2020, 17, 549–566. [Google Scholar] [CrossRef]
- Valizadeh, N.; Hayati, D. Development and validation of an index to measure agricultural sustainability. J. Clean. Prod. 2021, 280, 123797. [Google Scholar] [CrossRef]
- Newsom, J. Some Clarifications and Recommendations on Fit Indices. Available online: http://web.pdx.edu/~newsomj/semclass/ho_fit.pdf (accessed on 2 December 2020).
- Schönborn, A.; Junge, R. Redefining Ecological Engineering in the Context of Circular Economy and Sustainable Development. Circ. Econ. Sustain. 2021, 1, 375–394. [Google Scholar] [CrossRef]
- Tiejun, D. Two quantitative indices for the planning and evaluation of eco-industrial parks. Resour. Conserv. Recycl. 2010, 54, 442–448. [Google Scholar] [CrossRef]
- Le Roux, C.; Pretorius, M. Navigating Sustainability Embeddedness in Management Decision-Making. Sustainability 2016, 8, 444. [Google Scholar] [CrossRef] [Green Version]
- Baumgartner, R.J.; Ebner, D. Corporate sustainability strategies: Sustainability profiles and maturity levels. Sustain. Dev. 2010, 18, 76–89. [Google Scholar] [CrossRef]
- Baritaux, V.; Houdart, M.; Boutonnet, J.-P.; Chazoule, C.; Corniaux, C.; Fleury, P. Ecological embeddedness in animal food systems (re-)localisation: A comparative analysis of initiatives in France, Morocco and Senegal. J. Rural. Stud. 2016, 43, 13–26. [Google Scholar] [CrossRef]
- Bowman, M.; Marriott, R.; Woroniecka, K.; Taylor, J. Too Much of a Bad Thing The Use and Misuse of UK Soil and Land to Grow Sugar; Feedback: London, UK, 2019; Available online: https://feedbackglobal.org/wp-content/uploads/2019/11/Too-much-of-a-bad-thing-the-use-and-misuse-of-land-and-soils-to-grow-sugar-Feedback-2019.pdf (accessed on 3 December 2020).
- EU MERCI. Available online: http://www.eumerci-portal.eu/documents/20182/38527/0+-+EU.pdf (accessed on 3 December 2020).
- European Commission. Available online: https://ec.europa.eu/growth/sectors_en (accessed on 6 November 2019).
- Recyclenow. Available online: https://www.recyclenow.com/recycling-symbols-explained (accessed on 11 November 2019).
Figure 1.
Parsimonious tool on the right (10 questions) and full model of the circularity indicator tool on the left (15 questions). The numbers represent standardised estimates. See Supplementary Data Files.
Figure 1.
Parsimonious tool on the right (10 questions) and full model of the circularity indicator tool on the left (15 questions). The numbers represent standardised estimates. See Supplementary Data Files.

Figure 2.
Comparison of scores for process manufacturers with the full and parsimonious circularity indicator tools. The lowest total score is in blue, the mean score is in orange, and the highest total score is in gray.
Figure 2.
Comparison of scores for process manufacturers with the full and parsimonious circularity indicator tools. The lowest total score is in blue, the mean score is in orange, and the highest total score is in gray.

Table 1.
Summary of conceptual assumptions and tests for factor analysis.
| Conceptual Assumptions | Tests |
|---|---|
| normality | skew and kurtosis |
| linearity | bivariate scatterplot inspection |
| multicollinearity | correlation matrix inspection |
| no outliers (extreme univariate cases and multivariate) | plot inspection and Mahalanobis distance |
| correlated variables | Bartlett’s test of sphericity, Kaiser-Meyer-Olkin (KMO) measure of sampling adequacy |
| extraction of factors | scree plot |
| maximum likelihood estimation | no missing data—Bollen-Stine bootstrap |
| adequate sample size | Cronbach’s Alpha, statistical significance (p values), and fit indices (proxies) |
Table 2.
Summary statistics for process manufacturing respondents.
| Process Manufacturing Sample (N = 50) | 1 Point | 2 Points | 3 Points | 4 Points | 5 Points | Mean | Standard Deviation |
|---|---|---|---|---|---|---|---|
| QUESTION 1 | 2 | 28 | 11 | - | 9 | 2.72 | 1.17872 |
| QUESTION 2 | 8 | 13 | 9 | 17 | 3 | 2.88 | 1.22291 |
| QUESTION 3 | 21 | - | - | 19 | 10 | 2.94 | 1.70725 |
| QUESTION 4 | 3 | 21 | 5 | 6 | 15 | 3.18 | 1.40973 |
| QUESTION 5 | 9 | - | 17 | 18 | 6 | 3.24 | 1.23817 |
| QUESTION 6 | 11 | - | 23 | 10 | 6 | 3.00 | 1.26168 |
| QUESTION 7 | 5 | 9 | 2 | 15 | 19 | 3.68 | 1.40611 |
| QUESTION 8 | 11 | - | 23 | 12 | 4 | 2.96 | 1.21151 |
| QUESTION 9 | 11 | - | 12 | 17 | 10 | 3.30 | 1.40335 |
| QUESTION 10 | 12 | 9 | - | 3 | 26 | 3.44 | 1.77465 |
| QUESTION 11 | 3 | - | 11 | 18 | 18 | 3.96 | 1.06828 |
| QUESTION 12 | 7 | 19 | - | - | 24 | 3.30 | 1.68123 |
| QUESTION 13 | 11 | 2 | 5 | 27 | 5 | 3.26 | 1.35240 |
| QUESTION 14 | 11 | - | - | 18 | 21 | 3.76 | 1.54603 |
| QUESTION 15 | 8 | 3 | 10 | 23 | 6 | 3.32 | 1.25259 |
Table 3.
Selected indicators of model fit for the parsimonious tool (10 questions).
| Absolute Fit Indices | Relative Fit Indices | Noncentrality-Based Indices | |||||||
|---|---|---|---|---|---|---|---|---|---|
| CMIN/DF (chi-Squared/Degrees of Freedom) | GFI (Goodness of Fit Index) | AGFI (Adjusted Goodness of Fit) | SRMR (Standardised Root Mean Square Residual) | TLI/NNFI (Tucker–Lewis Index/Non-Normed Fit Index) | NFI (Normed Fit Index) | IFI (Incremental Fit Index) | RMSEA (Root Mean Square Error) | CFI (Comparative Fit Index) | |
| Acceptable Limits | ≤3.00 | ≥0.9 | ≥0.8 | <0.08 (acceptable) | ≥0.9 (good) | >0.8 | ≥0.9 | ≤0.06 | ≥0.95 (very good) |
| Results for Parsimonious Model | 1.142 | 0.902 | 0.785 | 0.0831 | 0.916 | 0.764 | 0.963 | 0.054 | 0.953 |
Publisher’s Note: MDPI stays neutral with regard to jurisdictional claims in published maps and institutional affiliations. |
© 2021 by the authors. Licensee MDPI, Basel, Switzerland. This article is an open access article distributed under the terms and conditions of the Creative Commons Attribution (CC BY) license (https://creativecommons.org/licenses/by/4.0/).
Share and Cite
MDPI and ACS Style
Trollman, H.; Colwill, J.; Jagtap, S. A Circularity Indicator Tool for Measuring the Ecological Embeddedness of Manufacturing. Sustainability 2021, 13, 8773. https://0-doi-org.brum.beds.ac.uk/10.3390/su13168773
AMA Style
Trollman H, Colwill J, Jagtap S. A Circularity Indicator Tool for Measuring the Ecological Embeddedness of Manufacturing. Sustainability. 2021; 13(16):8773. https://0-doi-org.brum.beds.ac.uk/10.3390/su13168773
Chicago/Turabian StyleTrollman, Hana, James Colwill, and Sandeep Jagtap. 2021. "A Circularity Indicator Tool for Measuring the Ecological Embeddedness of Manufacturing" Sustainability 13, no. 16: 8773. https://0-doi-org.brum.beds.ac.uk/10.3390/su13168773
Note that from the first issue of 2016, this journal uses article numbers instead of page numbers. See further details here.