Article

An Empirical Approach to Differences in Flexible Electricity Consumption Behaviour of Urban and Rural Populations—Lessons Learned in Germany

1
Kelso-Professorship for Comparative Law, East European Economic Law and European Legal Policy, Faculty of Business Administration and Economics, European University Viadrina, Große Scharrnstrasse 59, 15230 Frankfurt, Germany
2
Department of Environmental Economics and Economic Policy, Technische Universität Berlin, Str. des 17. Juni 135, 10623 Berlin, Germany
3
Advyce GmbH, Brunnstraße 7, 80331 München, Germany
*
Author to whom correspondence should be addressed.
Sustainability 2021, 13(16), 9028; https://0-doi-org.brum.beds.ac.uk/10.3390/su13169028
Submission received: 30 June 2021 / Revised: 3 August 2021 / Accepted: 5 August 2021 / Published: 12 August 2021

Abstract

:
This article analyses two major trends of the 21st century. Firstly, the transition from fossil fuel-based energy production to renewable energy sources. Secondly, the inexorable urbanisation which can be witnessed all over the globe. The most promising renewable energy production technologies for the near future, i.e., wind and solar energy, are volatile by nature which makes matching supply and demand essential for a successful transition. Therefore, the aspects that determine the willingness of consumers to flexibilise their demand has gained growing attention. Initial research shows that different settings for (co-)ownership in terms of available prosumption options and used production technologies have a varying impact on demand flexibility. However, existing research has analysed flexibility drivers solely for the general population as an aggregate without any distinction regarding spatial, economic, or social factors. In this article, the authors go one step further and analyse whether those drivers for flexible consumption behaviour differ in rural or urban areas acknowledging differences in day-to-day life in both cases. This study is based on 2074 completed questionnaires from German consumers which were analysed using propensity score matching. The results show that people from rural and urban areas do not significantly differ in their willingness to be demand flexible in general. However, (co-)owners of RE installations from rural areas are generally significantly more demand flexible than (co-)owners of RE installations from urban areas. Further, when looking at different RE technologies, the results show that (co-)owners of solar installations are significantly more demand flexible if they are from rural areas. Lastly, when looking at usage options, people who solely consume produced electricity are more demand flexible if they are from rural areas as well.

1. Introduction

The electricity sectors around the globe are in a transition towards a more sustainable and smarter energy system by using more and more renewable energy sources (RES) and technical innovations. The growing importance of RES and technical innovations enabled social innovations such as peer-to-peer trading, the direct participation of citizens in the energy sector through various forms of (co-)ownership, and also had its effects on the regulation of the rights and obligations of consumers and prosumers in the electricity sector as well as the evolving role of distribution network operators and energy suppliers [1].
Among the just described social innovations and regulatory changes, (co-)ownership of citizens in energy infrastructures received particular interest among politicians, energy sector actors, citizens, and scientists. Initially, consumer ownership consisted mainly of individual self-supply concepts, e.g., through solar panels on rooftops, but lately, newer models aiming at realizing collaborative consumer ownership models have been gradually entering the market. Hence, aside from individual ownership, (co-)ownership forms such as bearer bonds, subordinated loans (e.g., in combination with cooperative shares), and joint collective investments differing with regard to the participants’ motivation, the business’s organisational form, and legal structure are known in the energy sector [2]. Proponents of the phenomenon of (co-)ownership in the energy sector ask for regulatory support of these participation schemes claiming among others that aspects related to the energy sector’s sustainable transition such as concern for the environment among citizens, education of citizens on energy-related topics, increased acceptance of renewable energy (RE) infrastructures, increase of self-consumption, improved grid stability, and regional economic development are promoted (e.g., [3,4,5]).
Several studies have examined these claims. For the context of the (co-)owners’ behaviour, mainly participation motives and consumption patterns such as efficiency and flexibility have been analysed through experimental and empirical approaches [6]. For the first, among others, Berry [7] reports that energy efficient behaviour of consumers is increased via community-based organisations as participatory social processes for planning and implementation of these projects lead to higher civic engagement encompassing learning, social interaction, and joint problem solving which ultimately results in improved energy efficiency behaviour. For the latter, Roth et al. [8] find that (co-)ownership of RE production facilities has an effect on the willingness of citizens to adjust their consumption behaviour to match their electricity demand to production levels. This article ties to this study and investigates, whether the location of (co-)owners, i.e., living in a rural or urban context, has an influence on their flexibility behaviour. Underlying this research question is the finding that citizens living in a rural environment are showing a different behaviour than their counterparts living in an urban area in contexts such as energy saving (e.g., [9,10]).
Therefore, we extended this question to the context of energy flexibility. To do so, we conducted a survey among users of Germany’s biggest online real estate platform and analysed their willingness to show flexible consumption behaviour using the propensity score matching technique (PSM) as an econometric analysis tool. Germany was chosen for several reasons as a case study for this research question. Germany has a pioneering role in the context of (co-)ownership in the energy sector. Empirical data from the mid-2010s found that more than 40% of the total installed RE capacity in Germany is owned by citizens [11]. Furthermore, Germany, as Europe’s largest economy, has shown significant progress regarding its energy sector’s transition towards RE while coping with significant resistance from its citizens due to high energy prices and the not-in-my-backyard (NIMBY) phenomenon with the latter being partly overcome by involving citizens through (co-)ownership and increasing the acceptance of RE deployment [4,12]. Hence, Germany serves either as a role model or cautionary tale for other countries, particularly countries with a comparable framework and business environment, such as the Netherlands or Denmark, but also for developing countries that are searching for examples on how to design their path towards a more sustainable energy sector. Furthermore, the German case serves as a reference point in the identification of some useful theories and methods for the study of (co-)ownership and its effects on demand flexibility [13].

2. Literature Review

Household energy consumption is one of the most important issues in the context of discussions related to climate change and the sustainable transformation of our economy and the energy sector as it accounts for almost one third of global primary energy demand and accordingly, significantly affects the environment. As such, it has served as a classic and compelling object of investigation in the academic literature, with a range of studies having analysed various aspects of household consumption, including energy conservation, energy poverty, energy efficiency, and flexible consumption [14].
As RE is increasingly replacing carbon-based technologies worldwide in electricity networks, the challenge of balancing intermittent generation with demand fluctuation becomes more and more important as currently only bioenergy provides a technically and financially viable solution for renewable base-load energy supply [15,16]. Hence, the question of flexible consumption and strategies to promote the goal of adapting consumption to supply patterns was in the focus of academia and practice in recent years (e.g., [17]). In order to explore the flexibility of residential electricity consumption, various approaches have been analysed to identify effective measures to promote household members’ willingness to shift energy consumption. These approaches include flexible pricing schemes such as time-of-use pricing (e.g., [18,19]), the provision of standardized or customized feedback interventions on residential electricity consumption (e.g., [20,21]) or the increase of involvement of electricity consumers in questions of energy supply and use through fostering (co-)ownership of energy infrastructures (e.g., [22,23]) with many studies showing for the latter that promoting (co-)ownership often offers a more deeply engaged participation in demand side management systems (e.g., [8,24,25]). Further research suggests a rather holistic approach to explain and guide consumer energy behaviour taking into account research from social science, economics, and humanities [26].
However, although in many energy markets for large industrial customers, direct participation in responsive demand schemes has long been possible, pushing this direct market participation model to residential consumers remains a challenge (e.g., [4,11]). On the one hand, end consumers will mostly neither have the capacity or the motivation to take action (e.g., [27,28]). On the other hand, given the substantial costs, they will be reluctant to install the necessary information and communications technology (ICT) infrastructure since they often lack an economic incentive to do so (e.g., [29]).
This changes when consumers become prosumers and have an intrinsic motivation to install smart meters, allowing them to decide when to absorb their RE production by own consumption in times of low prices on the markets due to oversupply and when to sell to third parties. To take full advantage of the cost-effective social and economic benefits of energy efficiency, broader and smarter use of consumer engagement programs (CEPs) is necessary. In comparison to conventional technology installation programs (TIPs), which are characterised by high barriers to entry for consumers and a lack of scalability, these “communication-based” programmes leverage innovative engagement strategies more effectively [30]. In addition, to modify consumers’ operating behaviour, CEPs aim at increasing investments in technology. However, while CEPs have generally proven to dramatically increase both the scale and cost effectiveness of consumer-funded efficiency investments, the installation cost of new technologies to the consumer (especially smart grid-related technologies) often impedes their implementation. Furthermore, although CEPs enable a large variety of measures without any technology-related restrictions and have the potential for a much more rapid educational process than TIPs, avoiding conflicting interests and aligning incentives is paramount for their success. In order to fully unleash their self-reinforcing features, they require all stakeholders to be involved in contrast to TIPs that are implemented unilaterally by the utility. Involving consumers as owners and co-producers is accordingly a holistic approach which activates a group of agents which so far have been difficult to include with both, spatial factors as well the question of control seeming to play a crucial role here [31,32]. In this context renewable energy communities (REC), that is, co-investment of heterogenous stakeholders in a project tackling renewable energy issues, can play a big role. However, the success of this newly developed approach still largely depends on the existence of a favourable energy production and consumption profile of its members, i.e., their willingness to adapt the latter through changed behaviour [33].
With socio-economic, normative, institutional, and technical factors influencing electricity demand and behaviour, the question arises to what extent spatial factors can have an influence. Here, first results analysing electricity demand for charging of electric vehicles show that individual charging behaviour differs between home and workplace regarding charging times and therefore influences the occurrence of daily load peaks [34]. This paper ties to this strand of literature and investigates the influence of three combined factors on energy consumption behaviour with the spatial component distinguishing between urban and rural places of residence, the institutional factor of being a (co-)owner of RE infrastructure, and the socio-economic factor of having the possibility to sell the (self-)produced energy. Therefore, several hypotheses that are explained in the next section guide the investigation.

3. Hypotheses

When looking at the installed capacity, the highest potential of RE technologies to substitute fossil fuels can be attributed to biomass, solar energy, and wind energy [35]. Therefore, those technologies are compared in the following analysis. In another study researchers found that the usage options of produced energy play a role in the willingness to apply demand flexible behaviour [8]. Therefore, the hypotheses system is built up along different stages. Firstly, a simple comparison between the demand flexibility of people from urban and rural areas is done. Secondly, the authors compare whether or not people from rural and urban areas who are generally involved with RE through (co-)ownership differ in the willingness to be demand flexible. In a next step, people from rural and urban areas are compared according to their different possibilities to use produced energy. Lastly, the comparison is done considering the kind of technology that people from urban and rural areas are involved with. Evidence in previous studies indicated that spatial proximity to the RE installation plays a role in the way (co-)ownership impacts the willingness to consume electricity flexibly [36]. Due to the nature of the urban environment (e.g., density of population) it is rather likely that people in rural areas live closer to their RE installations. Following this line of thought, the authors assume that people from rural areas are more willing to be demand flexible when drawing up the hypotheses.
Definitions of what counts as urban or rural vary to a large extent. The necessity to draw up a specific distinction for policy purposes and research undertakings led to countless publications on the matter by institutional researchers or branches of the government pate. Thereby, researchers try to define rural and urban characteristics [37,38] to ultimately develop respective classifications as to what counts as urban or rural [39] and how to develop measurement methods in the context of data gathering purposes [40]. Many publications draw attention to analysing conventional definitions and methods against country-specific characteristics [41,42] and evaluate the need for novel, dynamic approaches [43,44]. Thereby, the discussion leans mainly towards the complex problem of distinction between urban and rural populations facing global trends like urbanisation and suburbanisation. Associated boundary values like population density become rather indistinct which makes dichotomous differentiations increasingly difficult [45]. This study analyses differences in demand flexibility depending on whether people are living in urban or rural areas. The underlying assumption is that different technological means to produce RE and respective usage options of RE have distinct implications in urban and rural environments according to varying characteristics of production means. For instance, people from urban areas living densely populated residential districts characterised by apartment blocks might use electricity from a PV installation differently compared to people from medium-density areas with single-family houses. Therefore, in the context of this study, it makes sense to find a distinction that allows differentiating between apartment block-type living environments one the hand and single-family homes with space for individual PV installations on the other hand. Further, this study is made for an international audience. Therefore, comparability is essential. Hence, for a clear distinction within the study at hand, the authors decided to use an approach which lines up with the research matter and international standards. In 1991 the Statistical Office of the European Union (Eurostat) developed the degree of urbanisation methodology which demonstrates different spatial types according to varying density criteria [46]. The latest update of the degrees of urbanisation from 2011 was picked up by the OECD which defines an urban high-density centre (i.e., cities) as an area with more than 50,000 inhabitants. A so-called urban cluster holds between 5000 and 50,000 people (towns and suburbs). Everything below 5000 inhabitants is considered a rural area [47]. Further, density restrictions apply. For urban centres, the density amounts to at least 1500 inhabitants per km2. In urban clusters a density of at least 300 inhabitants per km2 is required. Accordingly, everything below 300 inhabitants per km2 is considered rural [46].
In line with the deliberations on the feasibility of different RE installation types in terms of available space, i.e., housing types, the density of those moderate clusters does still allow residents to live in close proximity to the installation, for instance on a single-family house. Therefore, to analyse the research question at hand, the aforementioned definition of high-density cluster as urban seems more appropriate for the comparison between people in urban and rural areas (e.g., also applied in [48,49]).
To simplify the analysis the following group names are used henceforth to describe group affiliation.
  • rurals:
people who are not involved with Renewables who live in rural areas
2.
urbans:
people who are not involved with Renewables who live in urban areas
3.
rural-owners:
(co-)owners of RE installations who live in rural areas
4.
urbans-owners:
(co-)owners of RE installations who live in urban areas
5.
rural-consumers:
(co)-owners of RE installations who live in rural areas and solely consume self-produced energy
6.
urban-consumers:
(co)-owners of RE installations who live in urban areas and solely consume self-produced energy
7.
rural-consumerSellers:
(co)-owners of RE installations who live in rural areas and consume as well as sell self-produced energy
8.
urban-consumerSellers:
(co)-owners of RE installations who live in urban areas and consume as well as sell self-produced energy
9.
rural-sellers:
(co)-owners of RE installations who live in rural areas and solely consume self-produced energy.
Against the background of the deliberations above the following hypotheses are analysed.
Simple urban versus rural on flexibility:
Hypothesis 1 (H1). 
Rurals are more willing to be demand flexible than urbans.
Hypothesis 2 (H2). 
Rural-owners are more willing than urban-owners.
Subdivision into energy usage possibilities:
Hypothesis 3 (H3). 
Rural-consumers are more willing to be demand flexible than urban-consumers.
Hypothesis 4 (H4). 
Rural-consumerSellers are more willing to be demand flexible than urban-consumerSellers.
Hypothesis 5 (H5). 
Rural-sellers are more willing to be demand flexible than urban-sellers.
Subdivision into technology:
Hypothesis 6 (H6). 
Rural-solars are more willing to be demand flexible than urban-solars.
Hypothesis 7 (H7). 
Rural-winds are more willing to be demand flexible than urban-wind.
Hypothesis 8 (H8). 
Rural-bios are more willing to be demand flexible than urban-bios.

4. Methodology

This study uses observational data gathered through an online questionnaire. The invitation to the questionnaire was sent via e-mail. The participants were randomly selected from the database of the online real estate platform ImmobilienScout24. ImmobilienScout24 has ca. 14.8 Mio monthly visitors the biggest online portal for real estate in Germany [50]. The invitation e-mail contained the purpose of the study and the involved institutions in data analysation. In total 130,685 invitation e-mails were delivered to potential participants. To improve data quality, solely answers from participants who answered the whole questionnaire were considered [51]. Ultimately, 2143 completed questionnaires were generated. In the course of the data cleansing process, a further 69 observations had to be excluded. (For a detailed overview of the data cleansing process see Appendix A.) Ultimately, 2074 observations entered the analysis.
To distinguish the research groups the survey contained questions regarding:
  • Participation in RE,
  • Used RE technology,
  • Possible usage possibility of produced energy,
  • People living in the area of the participant.
(The questionnaire flow the participants had to go through is depicted in Appendix B. Full version of the questionnaire is depicted in Appendix C. A data summary of the variables used to execute the analysis is provided in Appendix D.)
Further, participants had to rate their individual level of demand flexibility on a Likert Scale (1 for “I strongly disagree” to 5 “I strongly agree”) indicating their willingness to apply flexible behaviour for three domains of electricity consumption (the same scale as applied in [8]). The selected consumption domains correspond to different possibilities for demand flexibility approaches in a private context discussed in scientific literature:
10.
Household appliances,
11.
Electrical devices [52,53,54],
12.
Electrical means of transportation [23,55].
The sampling method, i.e., online-survey, does not allow for random sampling. Associated biases could lead to estimation inaccuracies when comparing group differences on distinguishing variables due to fundamentally different predisposition of the group members. In practical terms, in the context of this study, people who are living in rural areas could have fundamentally different characteristics than people who are living in urban areas. Those predefined dissimilarities could determine the willingness to be demand flexible rather than the group affiliation itself, i.e., living in an urban or rural environment. If this circumstance is not controlled for changes in the dependent variable cannot be attributed to independent variables in a statistical model. From a statistical perspective, this problem can be compared to studies with observational data where the treatment cannot be assigned randomly, for instance, the effect of living in an urban or rural environment. For numerous reasons, the independent treatment variable is predefined as random assignment to treatment group (i.e., lives in rural area) and control group (i.e., lives in the city) is not possible. To control for estimation biases as a result of non-random sampling, PSM is used as demonstrated in several other studies based on observational data (e.g., [56,57,58,59,60]).
PSM was developed by Rosenbaum and Rubin [61]. The score expresses the probability that a household will be a part of one of the analysed groups. PSM does not try to match the same values for all characteristics. Instead, it estimates a score for each household (from different groups) using logistic regression that channels all relevant characteristics into a single number which then represents the likelihood of a household falling in the respective group. It thereby mimics randomization by homogenising the sample (for more information on matching please see the work of the developers Rosenbaum and Rubin [61]). As a consequence, treatment and control group are comparable on crucial co-variates which could impact the dependent variable, i.e., demand flexibility in the different dimensions.
This score serves as a basis to form treatment and control group to ultimately calculate the Average Treatment Effect on the Treated (ATT). To do so several matching methods are available. In this instance, a nearest neighbour matching algorithm with common support restriction is used.
Alternative approaches to control for non-random sampling are, for instance, to work with weighted data or apply stratified sampling to reduce direct sampling errors. However, to weight cases is solely appropriate for under- or over-representation of specific groups (e.g., men or women, low-income or high-income households) [62]. In the case of this study, the overall assumption is that people with certain characteristics self-select into surveys on environmental issues, e.g., if they are especially environmentally friendly. Consequently, to weight data does not control for those predispositions. Further, stratified sampling may be used to obtain a representative sample and comparable subgroups when random sampling is not possible. Thereby, the researcher divides the population into sub-populations (called strata) and then randomly selects from the different strata to form test groups. Even with non-random selection of participants the random selection from the strata allows forming a sample that reflects the entire population [63]. However, the problem with the data generation process at hand is the predisposition of characteristics that determine participation in the survey (self-selection) rather than the representativity of the sample. Therefore, one must assume that even when forming respective strata, people with, e.g., a rather pro-environmental attitude or a higher income will still self-select into the different strata. In line with this problem, research has shown weaknesses of stratified matching in the context of online surveys [64]. Hence, an ex-post matching technique that considers all characteristics when forming treatment and control group seems more appropriate, especially as the value of this method has been repeatedly proven in association with online data gathering [57,58,59]. Therefore, it was decided to use the above-described PSM approach.
To execute the PSM the demographic variables age, income, and gender enter the propensity score. Consequently, the probabilistic model looks as follows:
T r e a t m e n t = ( P i 1 P i ) = β 0 + β 1 G e n d e r + β 2 A g e + β 3 N e t I n c o m e + ε i
with
  • ( P i 1 P i ) : outcome variable for observation i.
  • β 1   to β 4 : the slope coefficients for gender, age, and net-income.
  • ε i : error term holding variables that might influence the propensity score.
To account for the different scale levels all demographic variables in the model above were standardized using the z-score procedure where one subtracts the mean from the original variable and divided the result by the standard deviation [65]. The score is then used to calculate the ATT for each of the hypotheses.
When testing the mean difference for significance one must account for the data distribution. When looking at the outcome variable (demand flexibility in the different domains) the used data, like many other observational studies, is positively skewed. The resulting normality violation rules out simple parametric procedures. Hence, to calculate accurate confidence intervals and test statistics, the authors estimate the empirical distribution using a nonparametric bootstrap. The bootstrap is a procedure which can be used to obtain the empirical distribution function by resampling from the original sample. This allows us to calculate parametric test statistics without normality of the data or any specific distribution shape per se. For more information on the Bootstrap procedure for skewed data see Desgagné et al. [66]. As per recommendation from the literature, the resampling procedure is repeated until the effect of additional repetition do not further impact on the statistic of interest [67,68]. Therefore, to guarantee a maximum level of security, this study repeats the resampling 5000 times.

5. Results and Hypothesis Testing

The results follow the structure of the hypotheses system from Section 3. The diagnostics of the model specification of the PSM yield valid results for estimates. The common support restriction is used when calculating the ATT. A hypothesis is confirmed if the error probability is below 5% (i.e., α = 0.95).
H 1.
Rurals are more willing to be demand flexible than urbans.
In H1 the general difference between the demand flexibility of people who live in urban areas and those who do not live in urban areas is analysed. Table 1 summarises the results. No significant effects are detected. Consequently, H1 must be declined. In general, people in urban areas do not differ in their demand flexibility as compared to people from rural areas.
H 2.
Rural-owners are more willing to be demand flexible than urban-owners.
In the second hypothesis H2, all (co-)owners of renewable energies are compared based on whether they live in urban or rural areas. The results in Table 2 show that when looking at all people who are involved with Renewables, significant differences in the willingness to be demand flexible arise in one dimension. People who live in rural areas are approx. 0.5 ** scale points more willing to be demand flexible when it comes to the usage of household appliances. No significant effect was detected for charging other electrical appliances and electrical means of transportation. Therefore, H2 is partially confirmed. Rural-owners are more demand flexible than urban-owners when it comes to the usage of general household appliances.
H 3.
Rural-consumers are more willing to be demand flexible than urban-consumers.
In H3 people who are involved with Renewables and solely consume produced energy are compared according to whether they come from rural or urban areas. Table 3 shows significant effects in two dimensions. Based on the comparison of the usage of household appliances one can see that people who solely consume produced energy from rural areas are ca. 1** scale point significantly more demand flexible than people from urban areas who solely consume energy they produce. Further, there is a significant result with the charging of electrical appliances. In this dimension people are 0.782 ** scale points more demand flexible if they are from rural areas as compared to urban areas. H3 is partially confirmed, rural-consumers are more willing to be demand flexible than urban-consumers when it comes to the usage of household appliances as well as charging other electrical appliances.
H 4.
Rural-ConsumerSellers are more willing to be demand flexible than urban-consumerSellers.
In H4 the comparison concerns people from rural areas who consume as well as sell energy at the same time and people from urban areas with the same consumption options of self-produced energy. In this instance, no significant effect is detected (see Table 4). H4 must be utterly rejected. There are no demand flexibility differences between rural-consumersellers and urban-consumerSellers.
H 5.
Rural-sellers are more willing to be demand flexible than urban-sellers.
In H5 people from who (co-)own RE production facilities are compared based on whether they are from urban or rural areas. Again, no significant effect is detected (see Table 5). H5 must be rejected. Based on the data at hand, people who exclusively sell energy from their installations in urban and non-urban areas do not differ in their demand flexibility.
H 6.
Rural-solars are more willing to be demand flexible than urban-solars.
H6 is the first technology-related comparison where people who (co-)own solar installations are compared according to whether they live in urban or rural areas. Table 6 shows significant effects for the usage of household appliances with ca. 0.74 ** scale points. Therefore, H6 is partially confirmed. (Co-)owners of solar installations are significantly more willing to be demand flexible when they come from rural areas as compared to (co-)owners of solar installations from urban areas with regard to the usage of household appliances.
H 7.
Rural-winds are more willing to be demand flexible than urban-winds.
H 8.
Rural-bios are more willing to be demand flexible than urban-bios.
Within the last two hypotheses a comparison between people from rural and urban areas who (co-)own a wind turbine or a biogas plant, respectively, was carried out. However, due to the common support restriction when matching urban with non-urban groups combined with the generally low case numbers no results could be reported. Hence, a further analysation of H7 and H8 is not possible.

6. Discussions of Empirical Results and Methodological Limitations

When analysing the willingness to show demand flexibility between people living urban and rural areas in general (H1), the finding that there is no difference between both living areas differs from findings for the context of energy savings with different levels of energy-related education and the lack of energy awareness measures being the main determinant for this observation (e.g., [9,10]). In our analysis, these differences seem to be less effective as differences in energy-related education and lack of energy awareness are less on average between people living in urban and rural areas in Germany. Accordingly, no differences can be found in people’s willingness when comparing urban and rural populations on a general aggregated level.
However, when adding more depth and detail to the analysis, differences in people’s behaviour can be found and explained. The comparison of (co-)owners from rural and urban areas shows that people from rural areas are significantly more willing to show flexible demand (H2). This could be due to the proximity to the installation and related aspects such as energy awareness and involvement. People have different motives to (co-)own energy infrastructures. Among these are concern for the environment, the advancement of the energy transition, regional economic development, the desire to foster community cohesion and local identification, and return motives (i.e., the expectation to receive return on investment) (e.g., [13,69,70]). For people living in urban areas where the distance to energy infrastructures, they (co-)own is normally further away than in a rural context, financial motives might be more dominant so that there is, on average, less raised awareness to energy issues compared to people living in rural areas. They are likely to be more involved with the projects themselves because they often are installed very close to their housing (e.g., on their roofs for the case of small-scale PV or close to their village for PV and wind parks). This observation regarding rural people’s higher willingness to show flexible behaviour is further supported for the comparison of rural and urban (co-)owners who are limited to solely consume (and not sell) the produced energy (H3) and the case of (co-)ownership in PV (H6). For the first, it might also be the case that people from urban areas suffer to some extent from the rebound effect when (co-)owning energy infrastructures [70,71]. When financial incentives come into play (H4 and H5), effects that lead to differences in behaviour between people living in an urban and rural environment seem to have less influence or the same influence on people’s demand flexibility. This effect can be compared to general findings on pro-environmental behaviour and intrinsic motivation which can be crowded out when monetary incentives are provided parallelly [72,73].
When it comes to the methodological limitations, two aspects must be mentioned. In two instances (H3 and H4), the subdivision of (co-)owners with different usage possibilities of the produced energy yields small sample sizes, especially for the control groups. This could have a destabilising effect when calculating test statistics [74]. Nonetheless, the applied resampling technique (bootstrap) is a reliable method to estimate robust results with small samples (as demonstrated in [75,76]). It must be noted that due to the common support restriction the sample did not contain enough observations to form treatment and control group with H7 and H8. Hence, it was not possible to distinguish differences in the willingness to be demand flexible between people from urban and rural environments for wind turbine or biogas power plant owners. However, both technologies are associated with geographical conditions that can be found outside of urban areas (e.g., land use, noise) which helps to explain why the sample size is especially small in these instances. Still, considering the formation of RECs, i.e., bundled investment both technologies face rising importance in the energy transition. Therefore, further research which specifically focuses on individuals who are involved with electricity production from biogas or wind turbines could close a potentially important knowledge gap.
Another methodological limitation roots in the sampling procedure. The non-random character of online surveys causes a number of statistical problems when analysing treatment effects of group affiliation. In this study, PSM was used to control for those potential biases. In all cases, matching is based on observable characteristics, i.e., demographic variables. Consequently, other unobserved features that could have an influence on group affiliation cannot enter the econometric modelling but still cause biases. However, in literature PSM has proven to be a valid tool to yield robust results with non-random observational data; especially with online surveys (e.g., [57,58,59]). Further, all main demographic features entered the econometric model. Therefore, it is improbable that important variables which determine group affiliation were neglected.

7. Conclusions

In this paper, the authors investigated whether people from urban and rural areas differ in their willingness to show flexible electricity demand at different levels. First, a general comparison between the rural and urban population was done. Based thereon, people who (co-)own any kind of RE production installation were looked at. Lastly, it was analysed if people who (co-)own certain technologies to produce RE and use their produced energy differently. The results show that (co-)owners of RE installations from rural areas are generally willing to show more flexible energy consumption behaviour than (co-)owners of RE installations from urban areas. This finding is an important complement to previous research at the aggregate level that showed that (co-)owners are more willing to show flexible demand. Hence, the findings of this paper brought transparency to the question which particular group of people, i.e., people living in rural areas, contribute especially to the differences in behaviour on the aggregate level. Further, when looking at different RE technologies, the results show that (co-)owners of solar installations are significantly more demand flexible if they are from rural areas. This brings further detail to the overall perspective. Lastly, when looking at usage options, the findings show that people who solely consume produced electricity are more demand flexible if they are from rural areas while no differences were observed with regard to having the option to sell the produced electricity. In combination with findings from previous studies, this indicates that in rural settings, demand flexibility is less dependent on having the option to sell electricity additional to that of self-consumption. Accordingly, this more detailed analysis on people’s willingness to show flexible demand can help policy makers and practitioners to develop more effective measures to promote demand flexibility tailoring them to the respective setting be it urban or rural. This is even more important considering the current political framework. For example, the new objectives set for 2030 by the 2018/19 Clean Energy Package requiring the review and modification of EU directives, including the European Directive 2012/27/UE on energy efficiency which stress the challenge of demand side management.
A first deduction from the observation of higher willingness for demand flexibility among rural (co-)owners is that proximity to energy production is an important trigger for behavioural changes and accordingly can serve as a vehicle to promote behavioural changes in urban areas as well. The technical characteristics of PV are currently the only financially viable option for onsite RE production in urban areas although small-scale wind (e.g., vertical wind energy) and bioenergy recently also gained attention and show financial viability in pilot projects. Hence, measures to promote PV in urban areas and support mechanisms to improve the financial viability of micro-scale wind and bioenergy can be an effective strategy for policy makers to increase demand flexibility. Furthermore, when designing cities of the future, urban planners must consider the aspect of onsite energy production and develop respective architectural solutions despite of the spatial restrictions.
From a policy perspective, the findings gain further weight against the background of lessons learned from Germany as a fully industrialised country that has taken a pioneering role in RE deployment and citizen (co-)ownership in RE but also had to cope with resistance from its population in doing so. The insights on the positive effect of (co-)ownership on people’s willingness for flexible demand behaviour can be used as an additional argument to promote (co-)ownership in RE and ask policy makers to provide a more favourable corresponding regulatory framework. In addition, this relation between demand flexibility and policies to facilitate (co-)ownership in RE other than in industrialised countries has potentially even stronger policy implications for developing countries where rural settings are still very important, but an increasing trend of rural exodus can be observed. Hence, the data from Germany allows developing and emerging economies a view on demand flexibility in urban areas from a country with a certainly very advanced transition towards sustainable energy from volatile sources.
Finally, the findings of this paper can help urban planners and policy makers to take active measures to leapfrog technical and town planning developments to design a living environment where demand flexibility, as an important feature of sustainable energy systems based on RE, is promoted. Here supporting (co-)ownership of RE installations also makes consumers more aware of energy use in general and triggers an educational process which in turn contributes to: (i) facilitating the use of ICT solutions to foster closer alignment of consumption with volatile RE supply by increasing demand side flexibility (economic); (ii) encouraging the public to accept energy efficiency measures in residential buildings that are often viewed with suspicion and considered too costly as well as the installation of new RE production facilities (social). These complementary effects together can forward the transition to climate neutrality, a challenge that countries across the globe are confronted with, and in fact, the new Indian “Electricity Rights of Consumers Rules” of December 2020 introducing the right to prosume together with smart metering illustrate that these issues are increasingly also appearing on the political agenda of developing countries.
Hence, to conclude, our results are equally important for economically developed countries that have similar demographic characteristics and a similar level of urbanisation as for developing countries and emerging economies as their rapid population growth accelerates urbanisation trends and associated problems.

Author Contributions

Conceptualization, L.R., J.L. and Ö.Y.; methodology, L.R., J.L. and Ö.Y.; software, L.R.; validation, L.R. and Ö.Y.; formal analysis, L.R., J.L., and Ö.Y.; investigation L.R. and J.L.; resources, L.R., J.L., and Ö.Y.; data curation, L.R.; writing—original draft preparation L.R., J.L., and Ö.Y.; writing—review and editing, L.R., J.L., and Ö.Y.; visualization, L.R.; supervision, L.R., J.L., and Ö.Y.; project administration, L.R.; funding acquisition, L.R., J.L., and Ö.Y. All authors have read and agreed to the published version of the manuscript.

Funding

The work on this paper has received support by the Kelso Institute for the Study of Economic Systems, the Horizon 2020 project “SCORE” grant agreement No 784960 and the Friedrich Naumann Foundation for Freedom.

Institutional Review Board Statement

Not applicable.

Informed Consent Statement

Informed consent was obtained from all subjects involved in the study.

Data Availability Statement

Restrictions apply to the availability of these data. Data was obtained in cooperation with the online platform www.immobilienscout24.de (accessed on 3 August 2021) and are available from the corresponding author with the permission of www.immobilienscout24.de (accessed on 3 August 2021).

Acknowledgments

The authors would like to thank Jörn Hagenguth and Hans Mörmann for their support at ImmobilienScout24. Further, the authors thank the Kelso-Team at the European University Viadrina for their support.

Conflicts of Interest

The authors declare no conflict of interest.

Abbreviations

ATTAverage Treatment Effect on the Treated
CEP consumer engagement programs
ICTinformation and communications technology
NIMBY not-in-my-backyard
OBSobservations
OECD Organisation for Economic Co-operation and Development
PSM propensity score matching technique
PVphotovoltaic
RE renewable energies
RES renewable energy sources
TIP technology installation programs

Appendix A. Detailed Data Cleaning Process

Table A1. Data cleansing process (source: authors’ own calculations).
Generated Sample2143
Participants with else option−50
Cases with contradictory answers−7
(co-)owners of more than one installation−12
Remaining sample2074

Appendix B. Questionnaire Flow

Figure A1. Questionnaire flow participants had to go through.
Sustainability 13 09028 g0a1

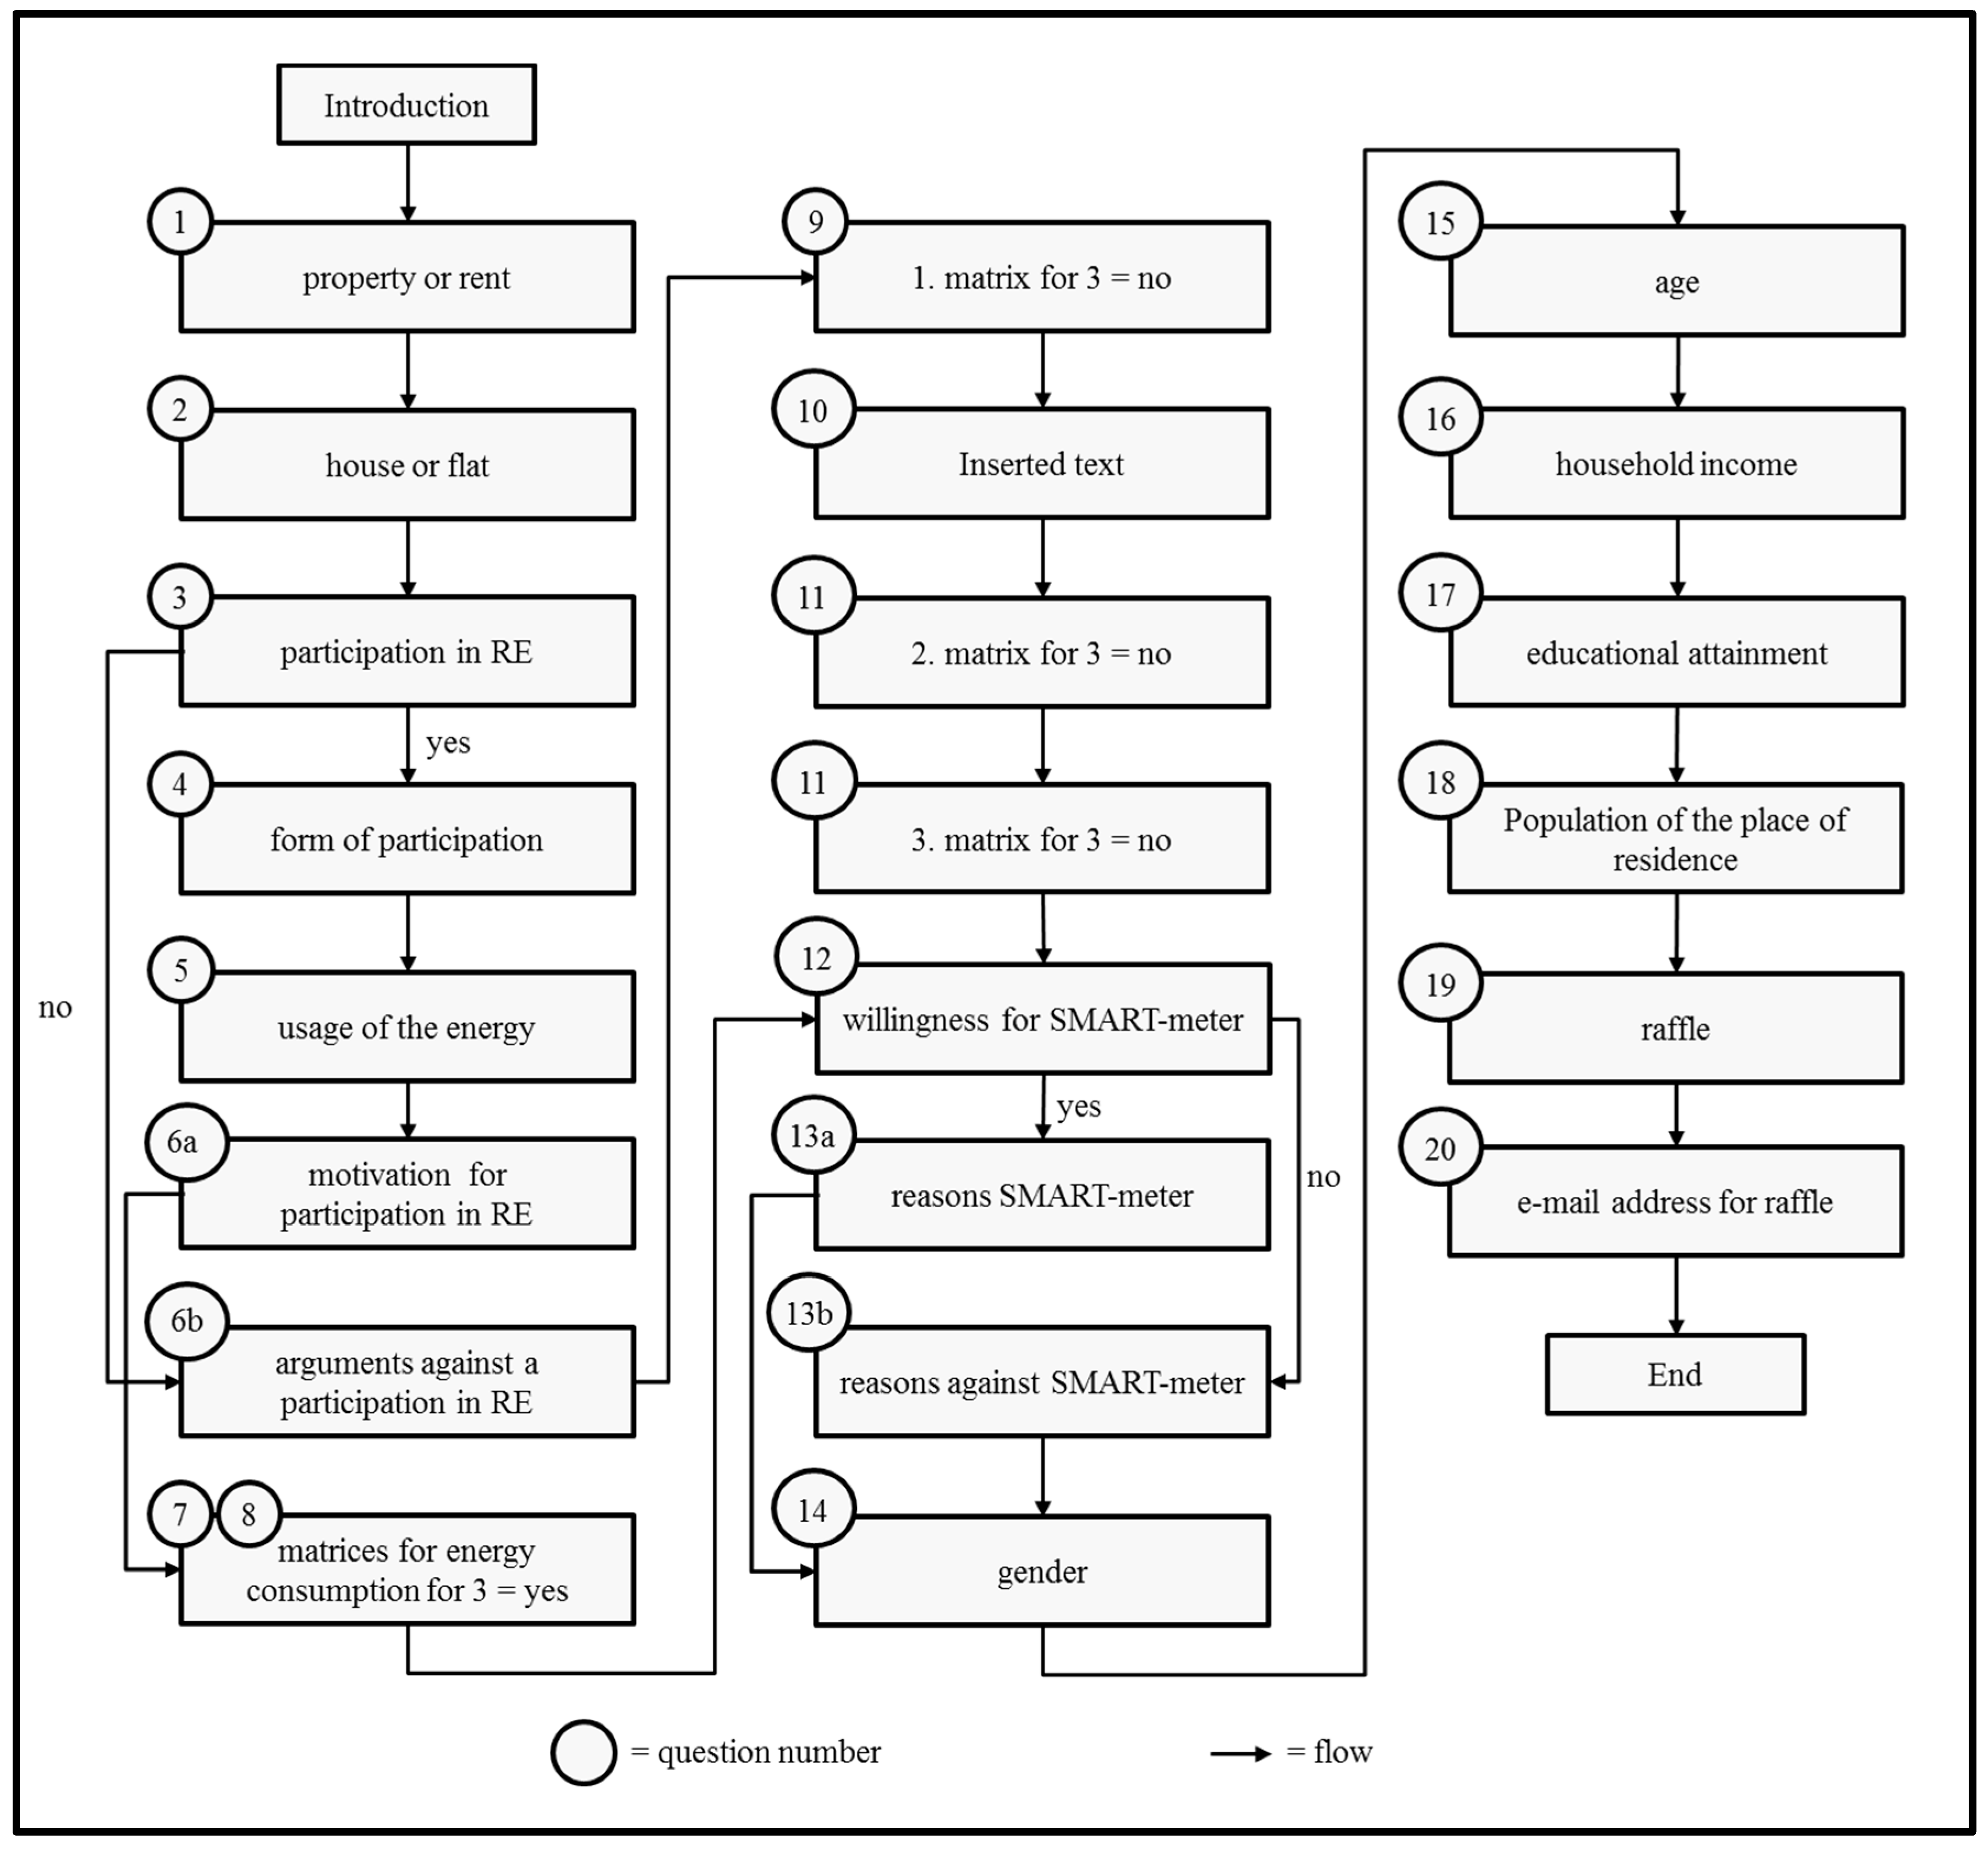
Appendix C. Questionnaire Screenshots and Translation

Figure A2. Original questionnaire: screenshot 1.
Sustainability 13 09028 g0a2
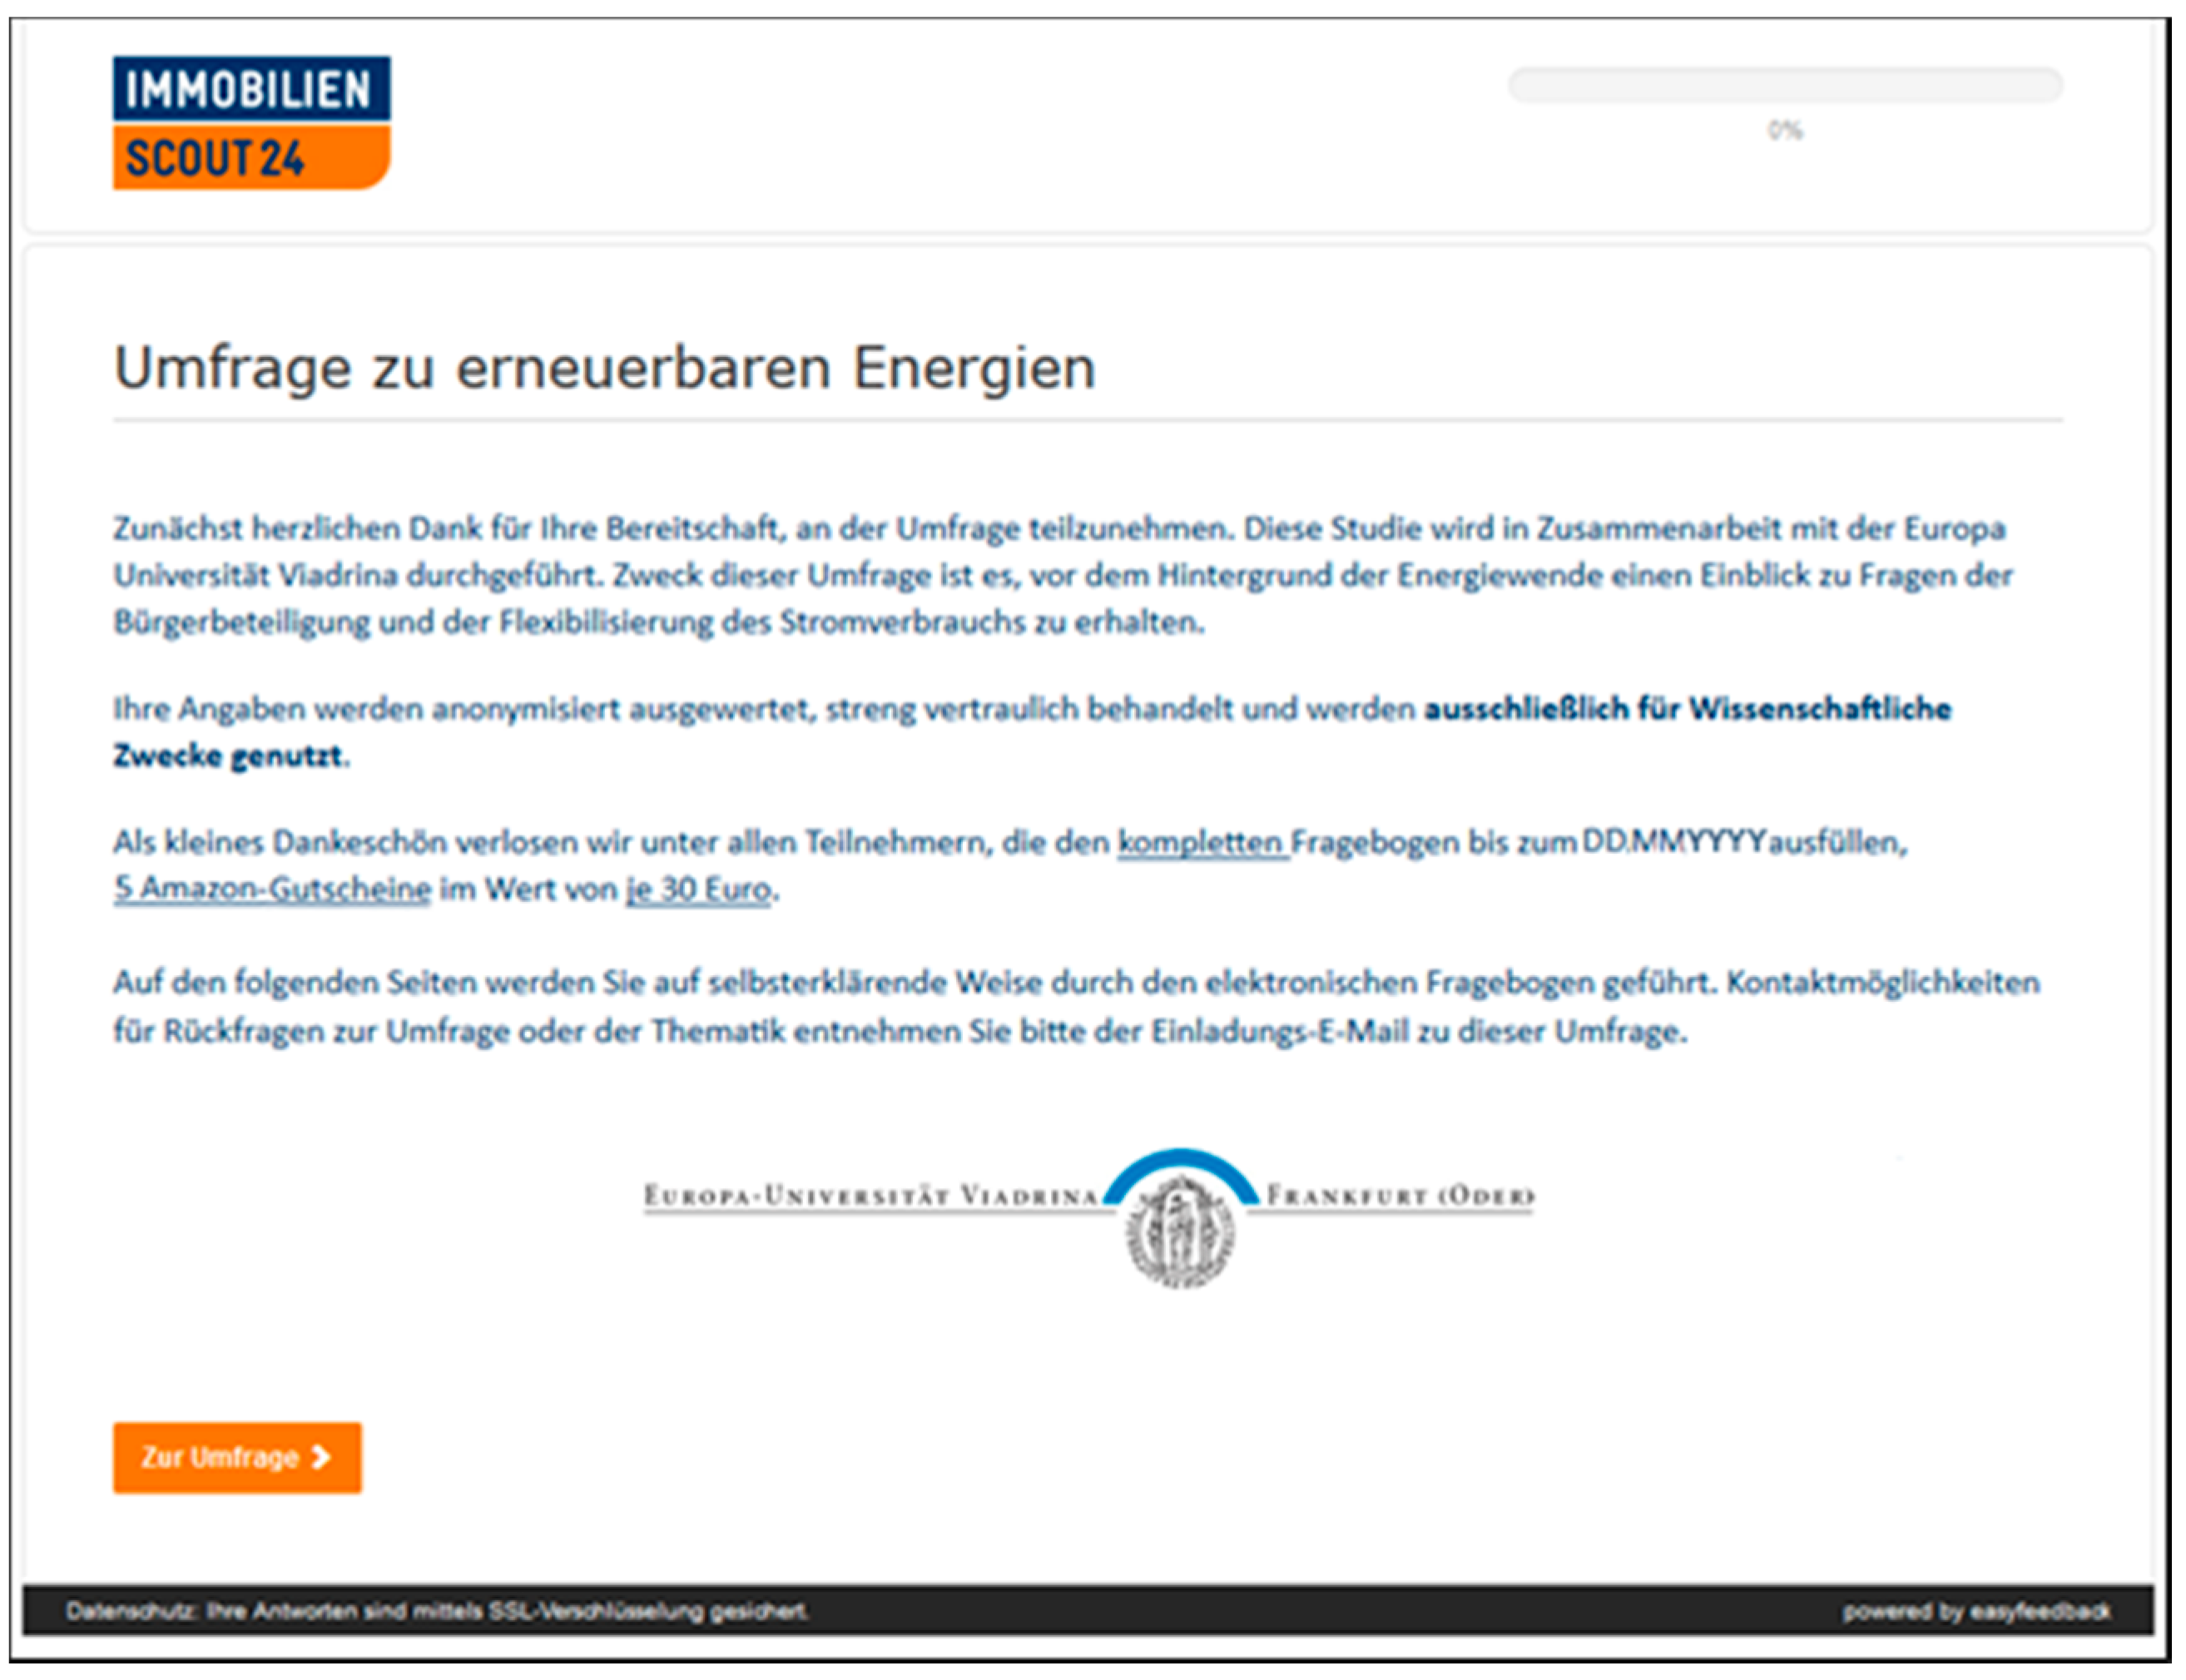
Renewable energy survey
First, thank you very much for your willingness to participate in the survey. This survey is conducted in cooperation with the European University Viadrina. The purpose of this survey is to gain insight into issues of citizen participation and the flexibilisation of electricity consumption against the background of the energy transition.
Your data will be evaluated anonymously, treated as strictly confidential and will be used exclusively for scientific purposes.
As a small thank you, we will raffle 5 Amazon vouchers worth 30 Euros each among all participants who complete the entire questionnaire by the dd.mm.yyyy
On the following pages you will be guided through the electronic questionnaire in a self-explanatory way. Contact options for queries about the survey or the subject matter can be found in the invitation e-mail for this survey.
Figure A3. Original questionnaire: screenshot 2.
Sustainability 13 09028 g0a3
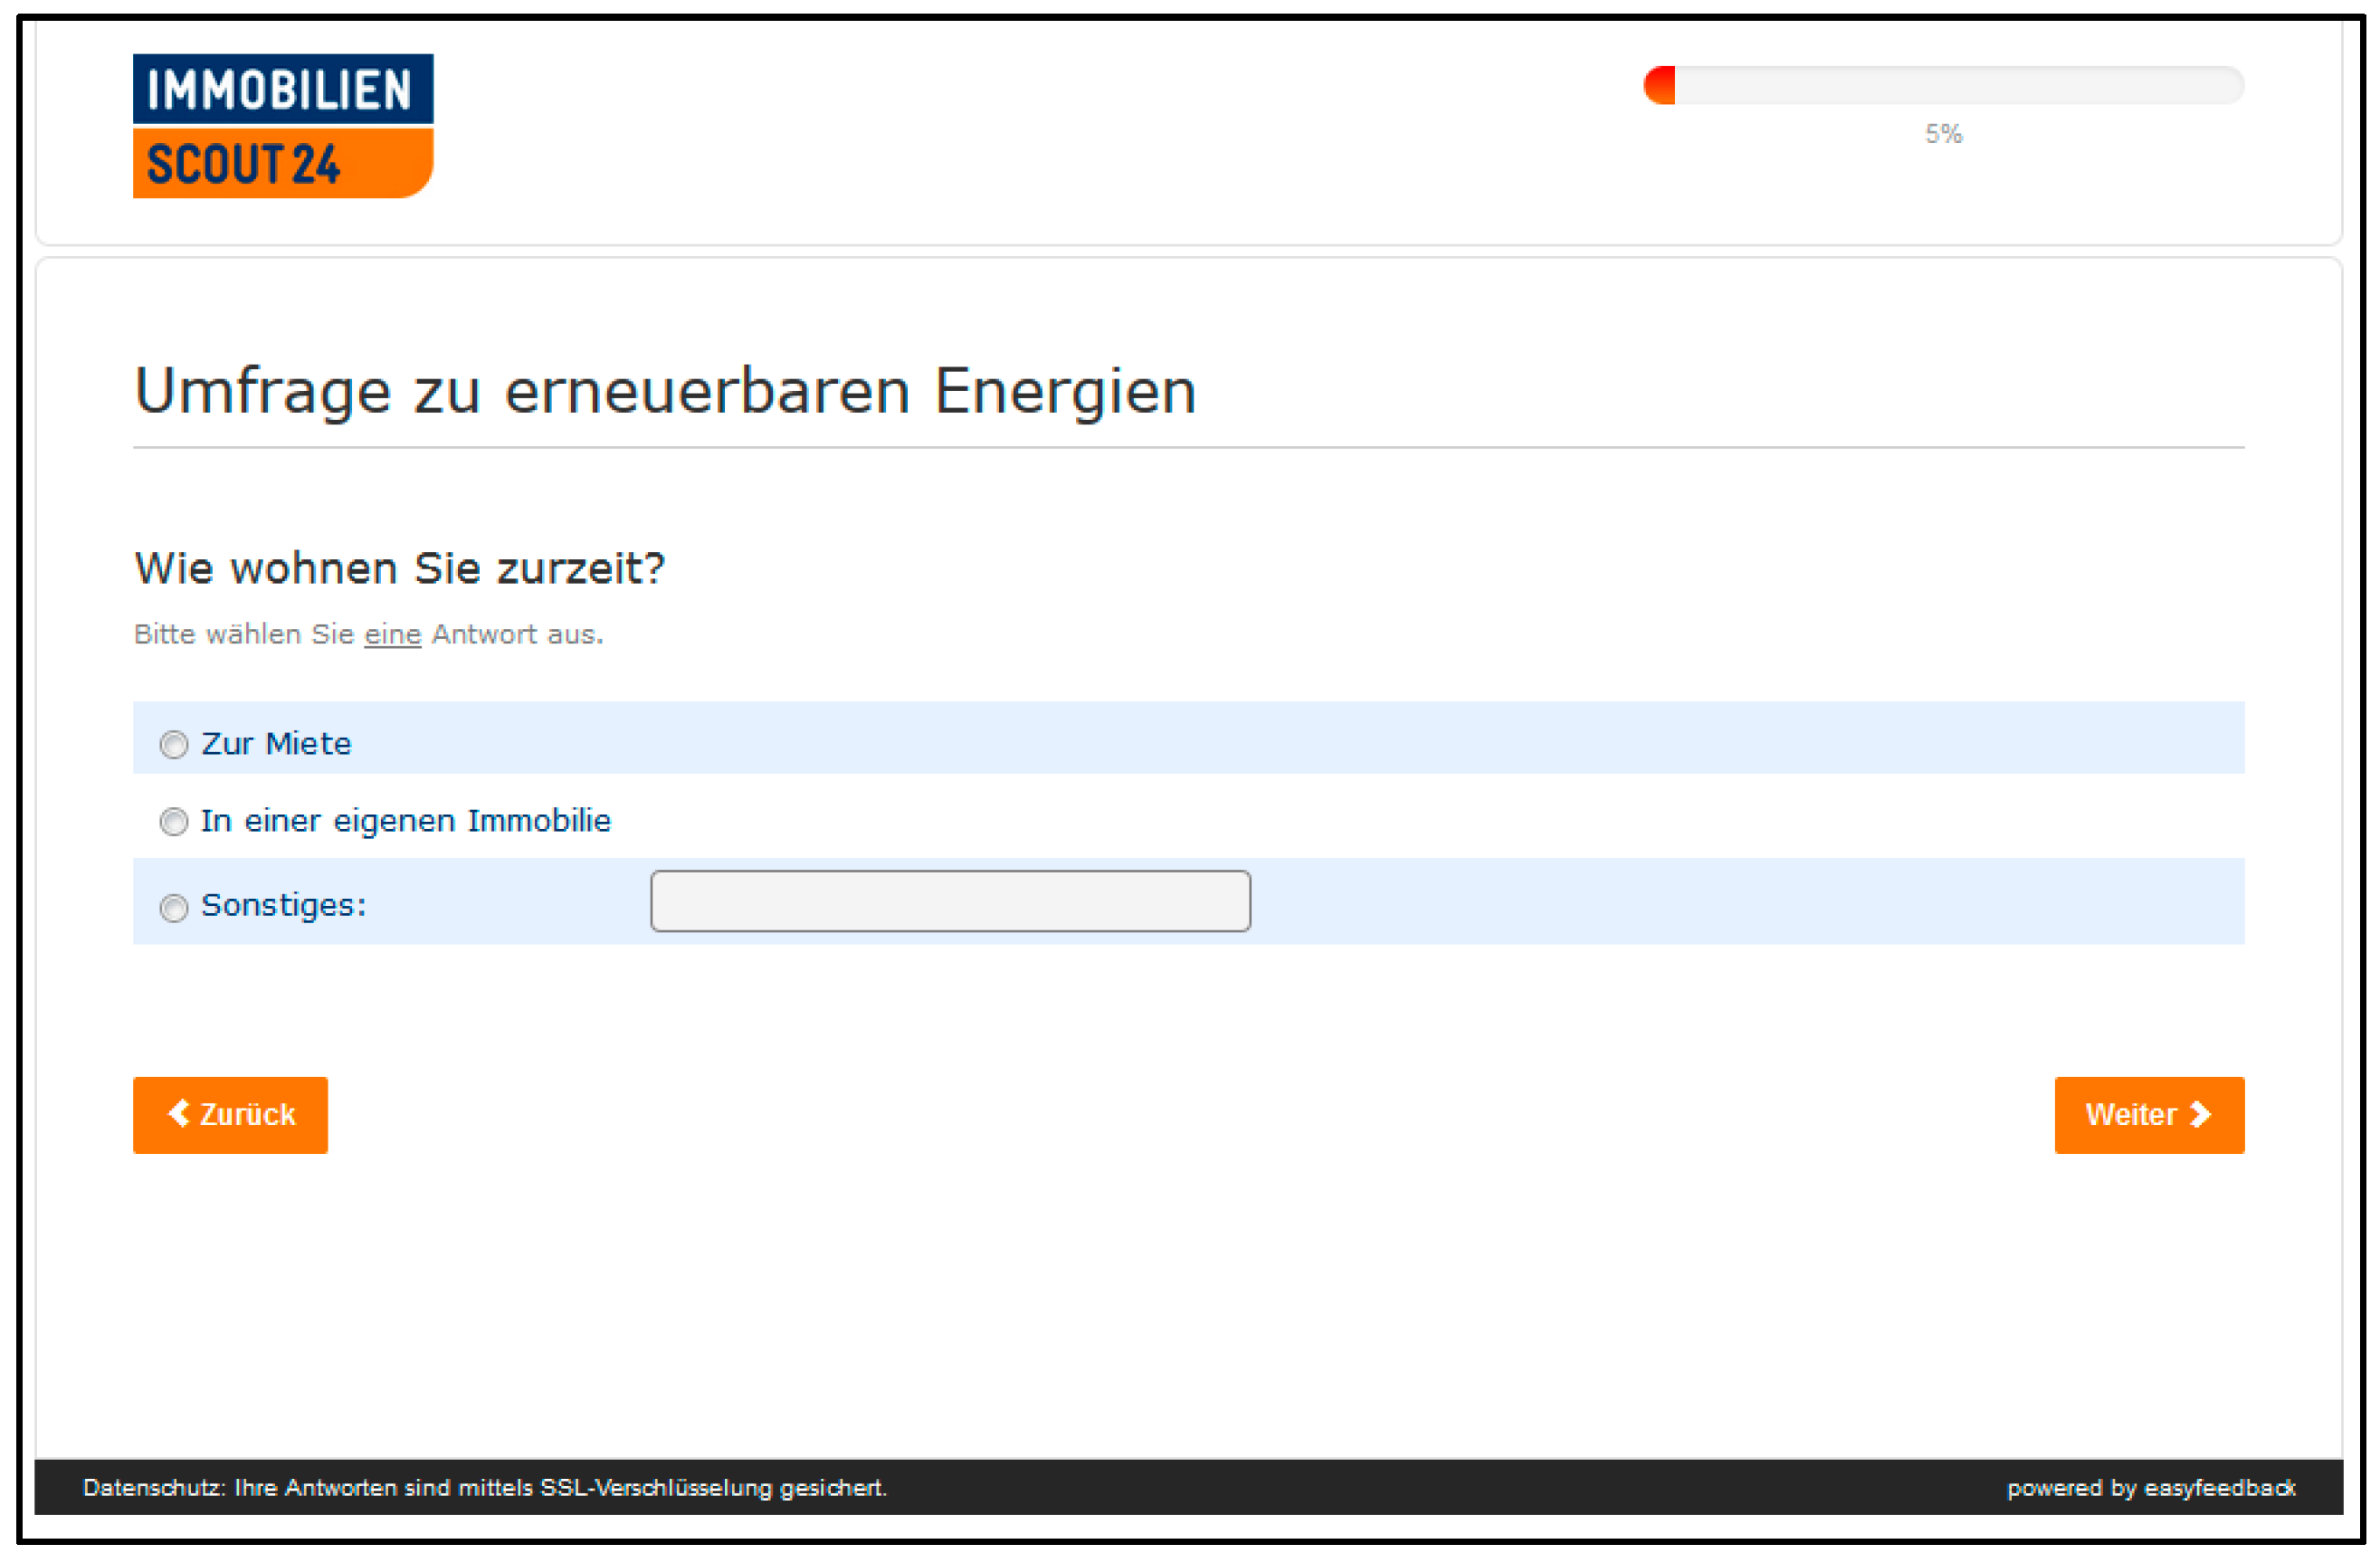
Where do you currently live?
Please select one single answer.
  • Rental.
  • In your own property.
  • Other:
Figure A4. Original questionnaire: screenshot 3.
Sustainability 13 09028 g0a4
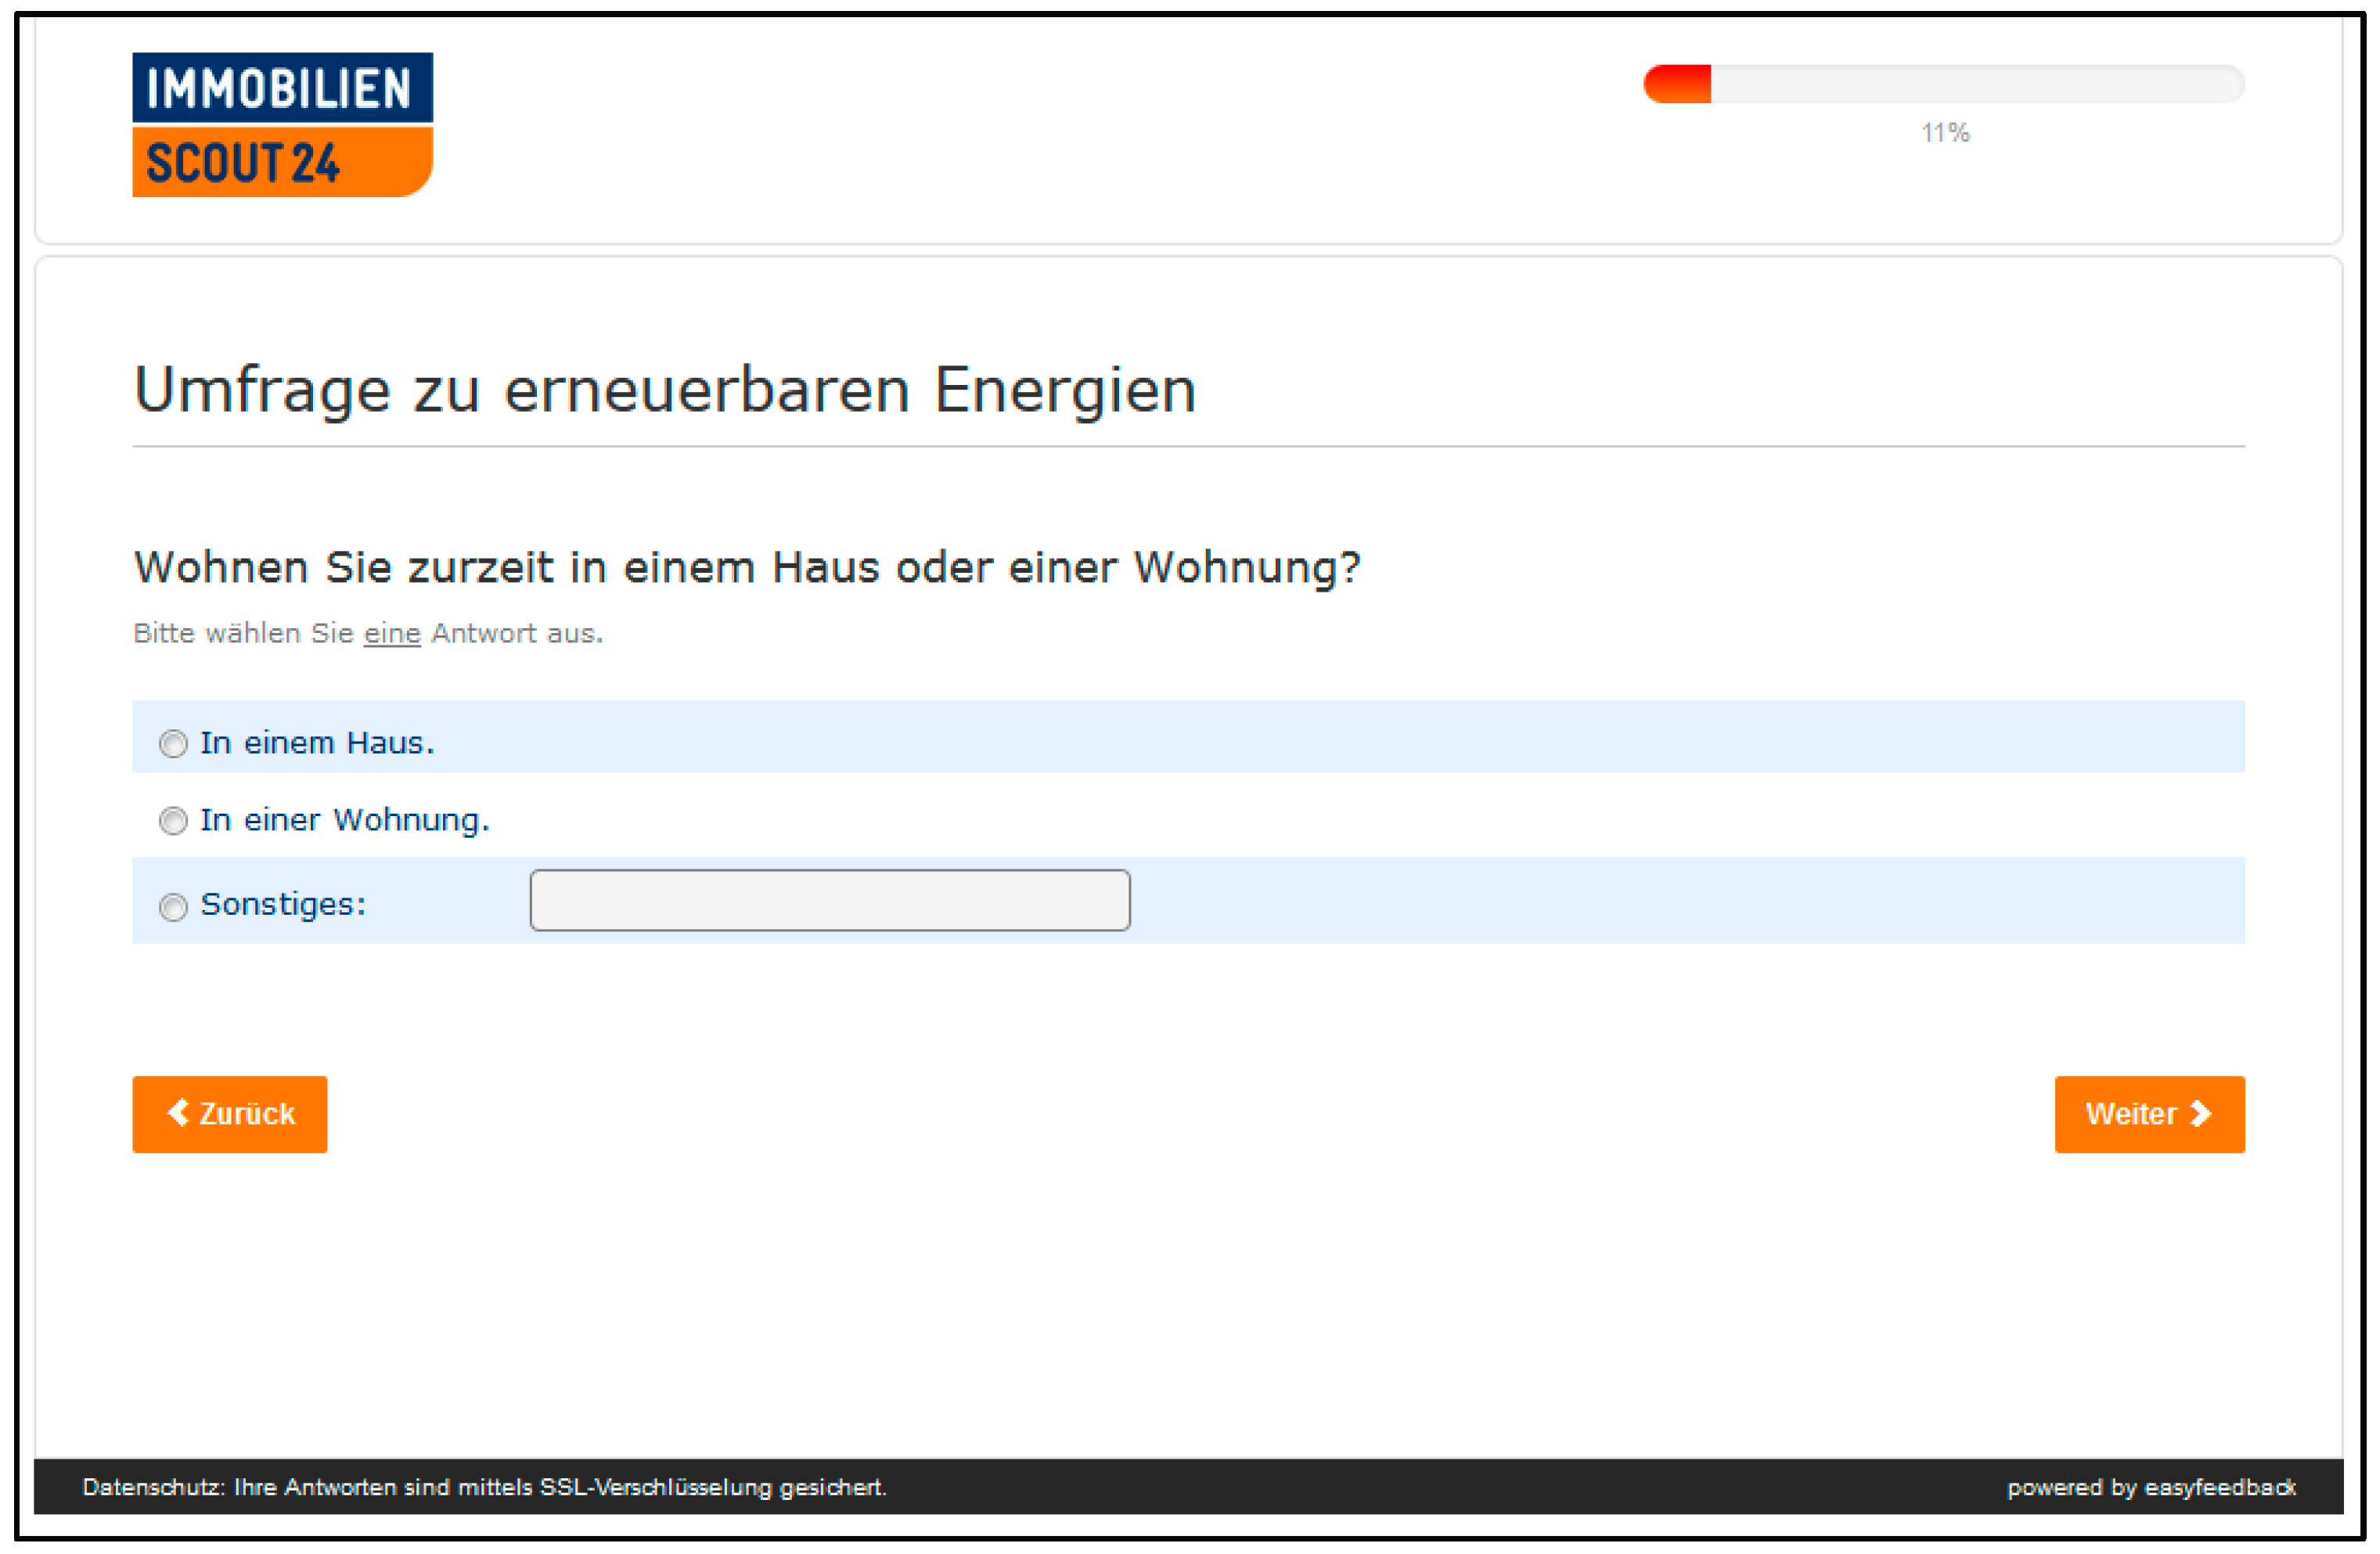
Do you currently live in a house or a flat?
Please select one single answer.
  • In a House.
  • In a flat.
  • Other:
Figure A5. Original questionnaire: screenshot 4.
Sustainability 13 09028 g0a5
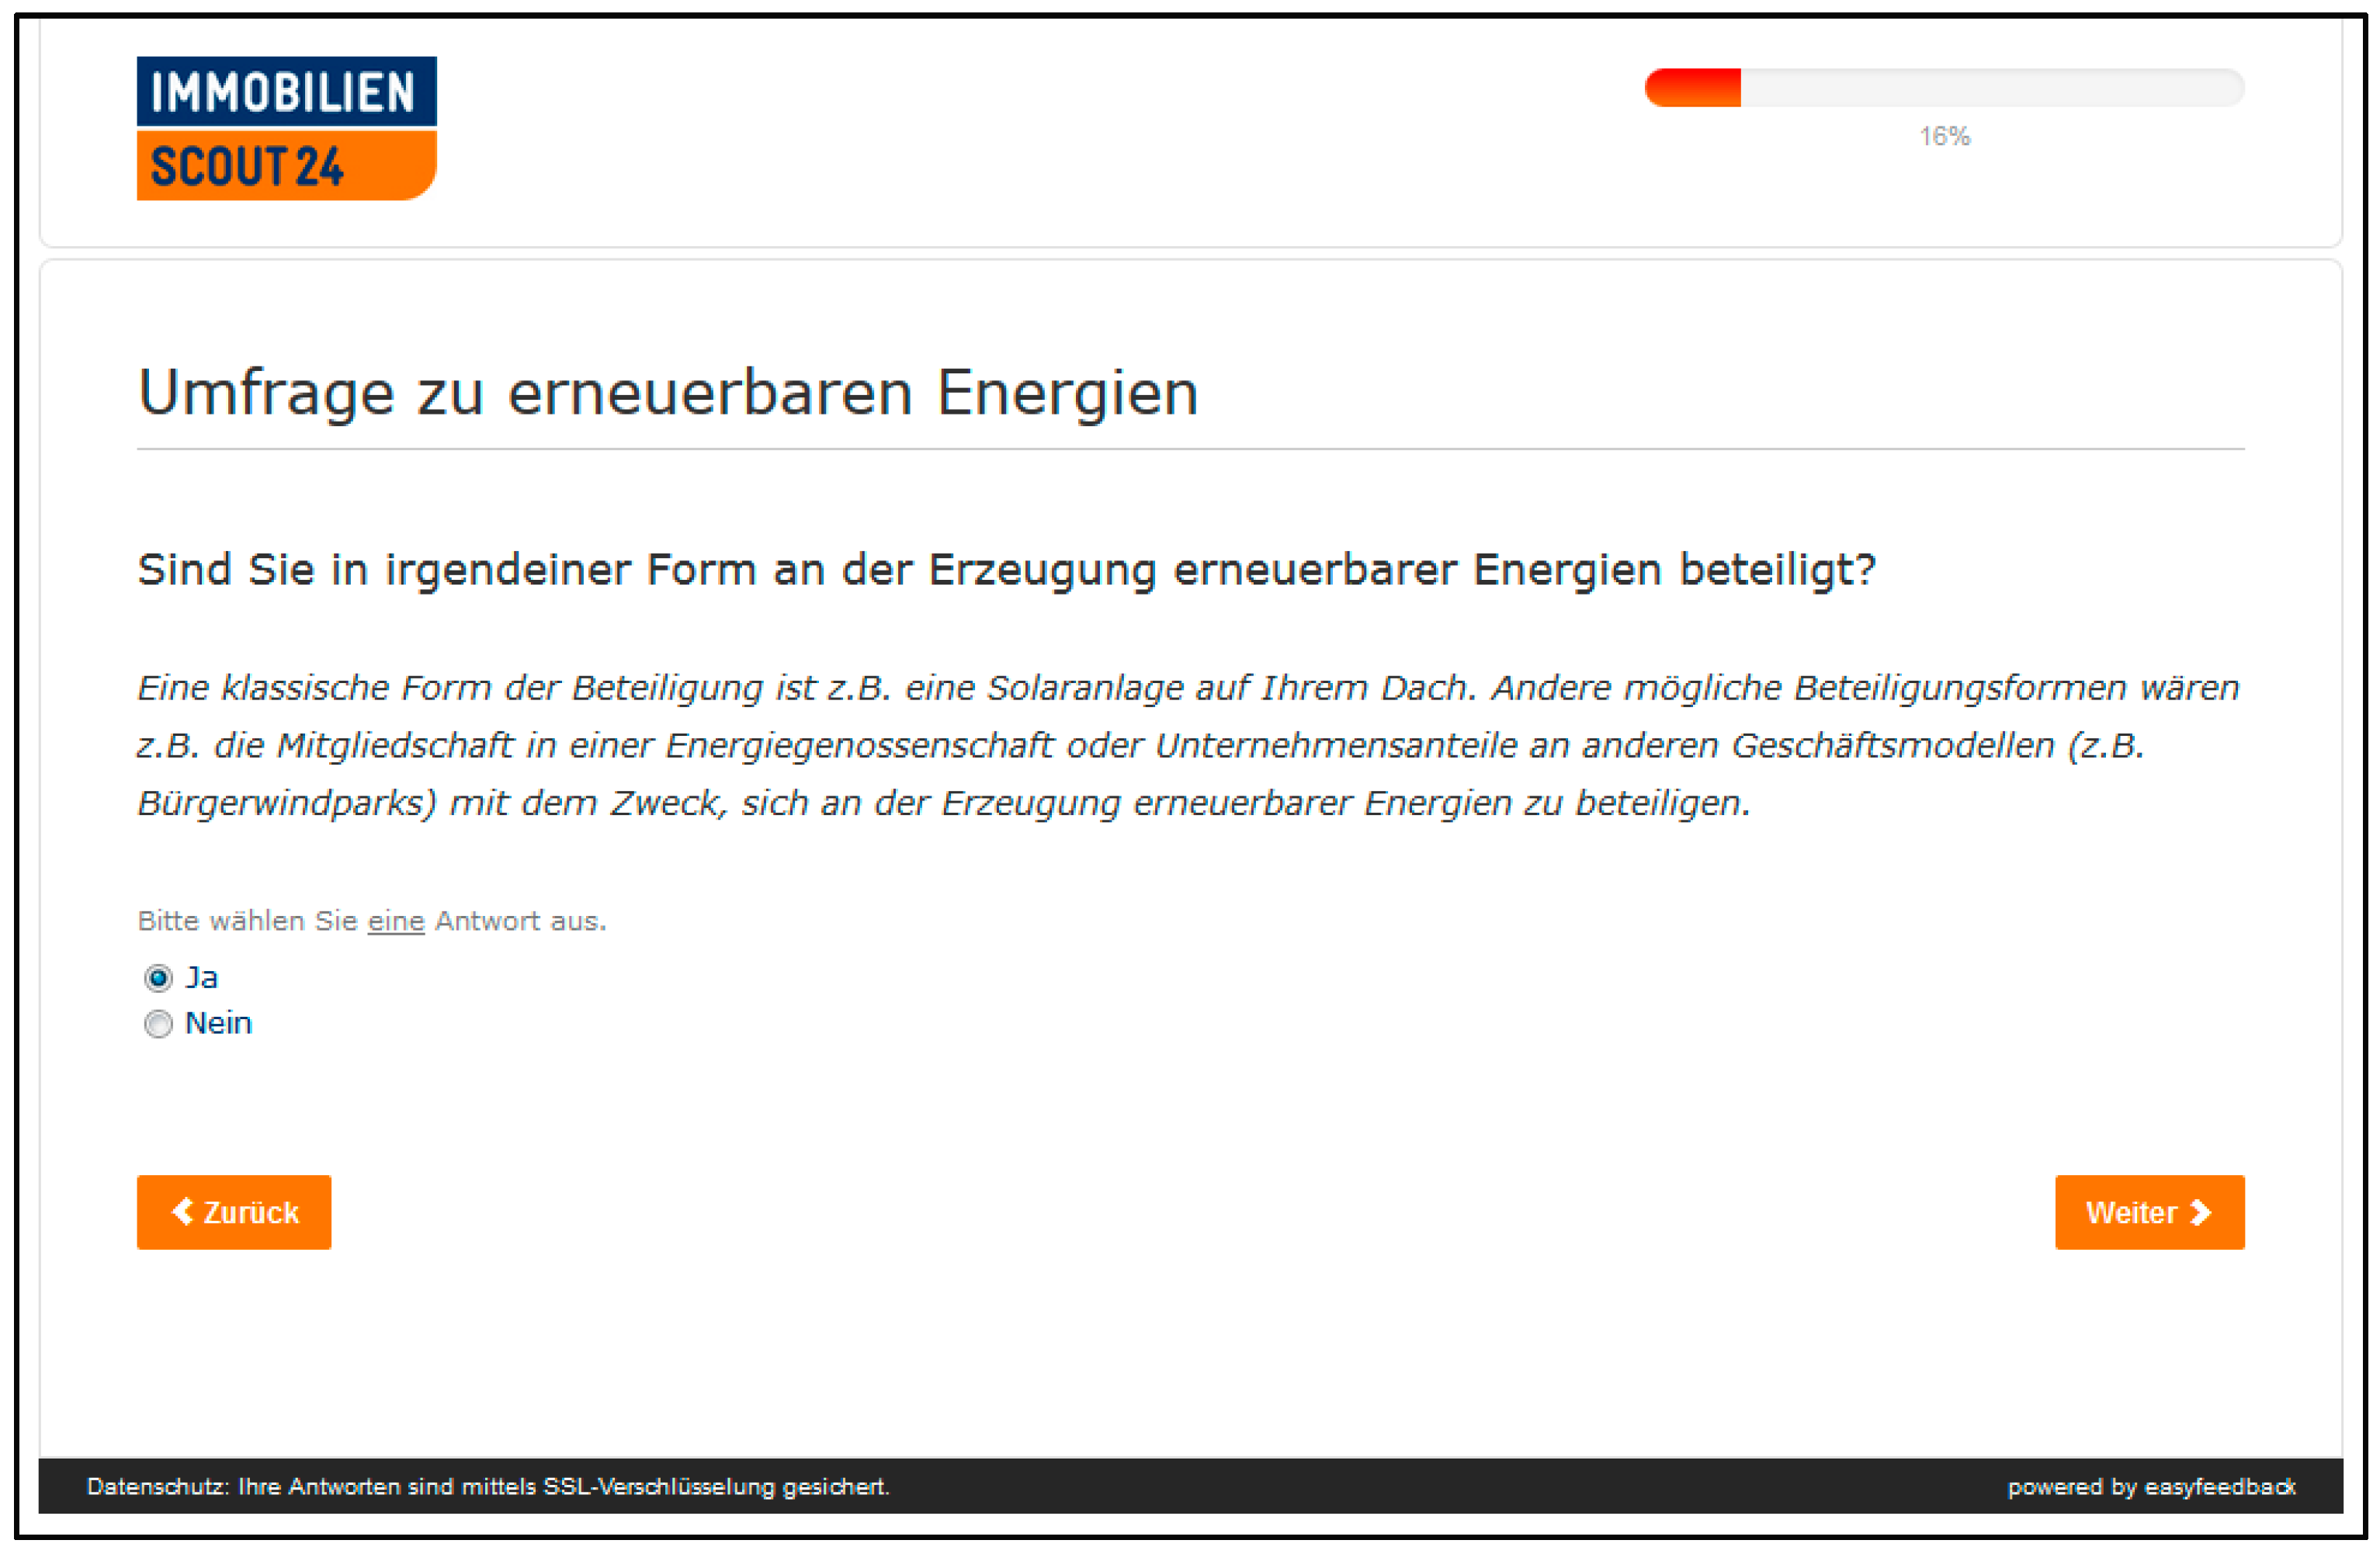
Do you participate in any way in the production of energy from renewable sources?
A classic form of participation is, for example, a solar installation on your roof. Other possible forms of participation would be, for example, membership in an energy cooperative or company shares in other business models (e.g., citizen wind farms) with the purpose of participating in the generation of renewable energies.
Please select one single answer.
  • Yes.
  • No.
Figure A6. Original questionnaire: screenshot 5.
Sustainability 13 09028 g0a6
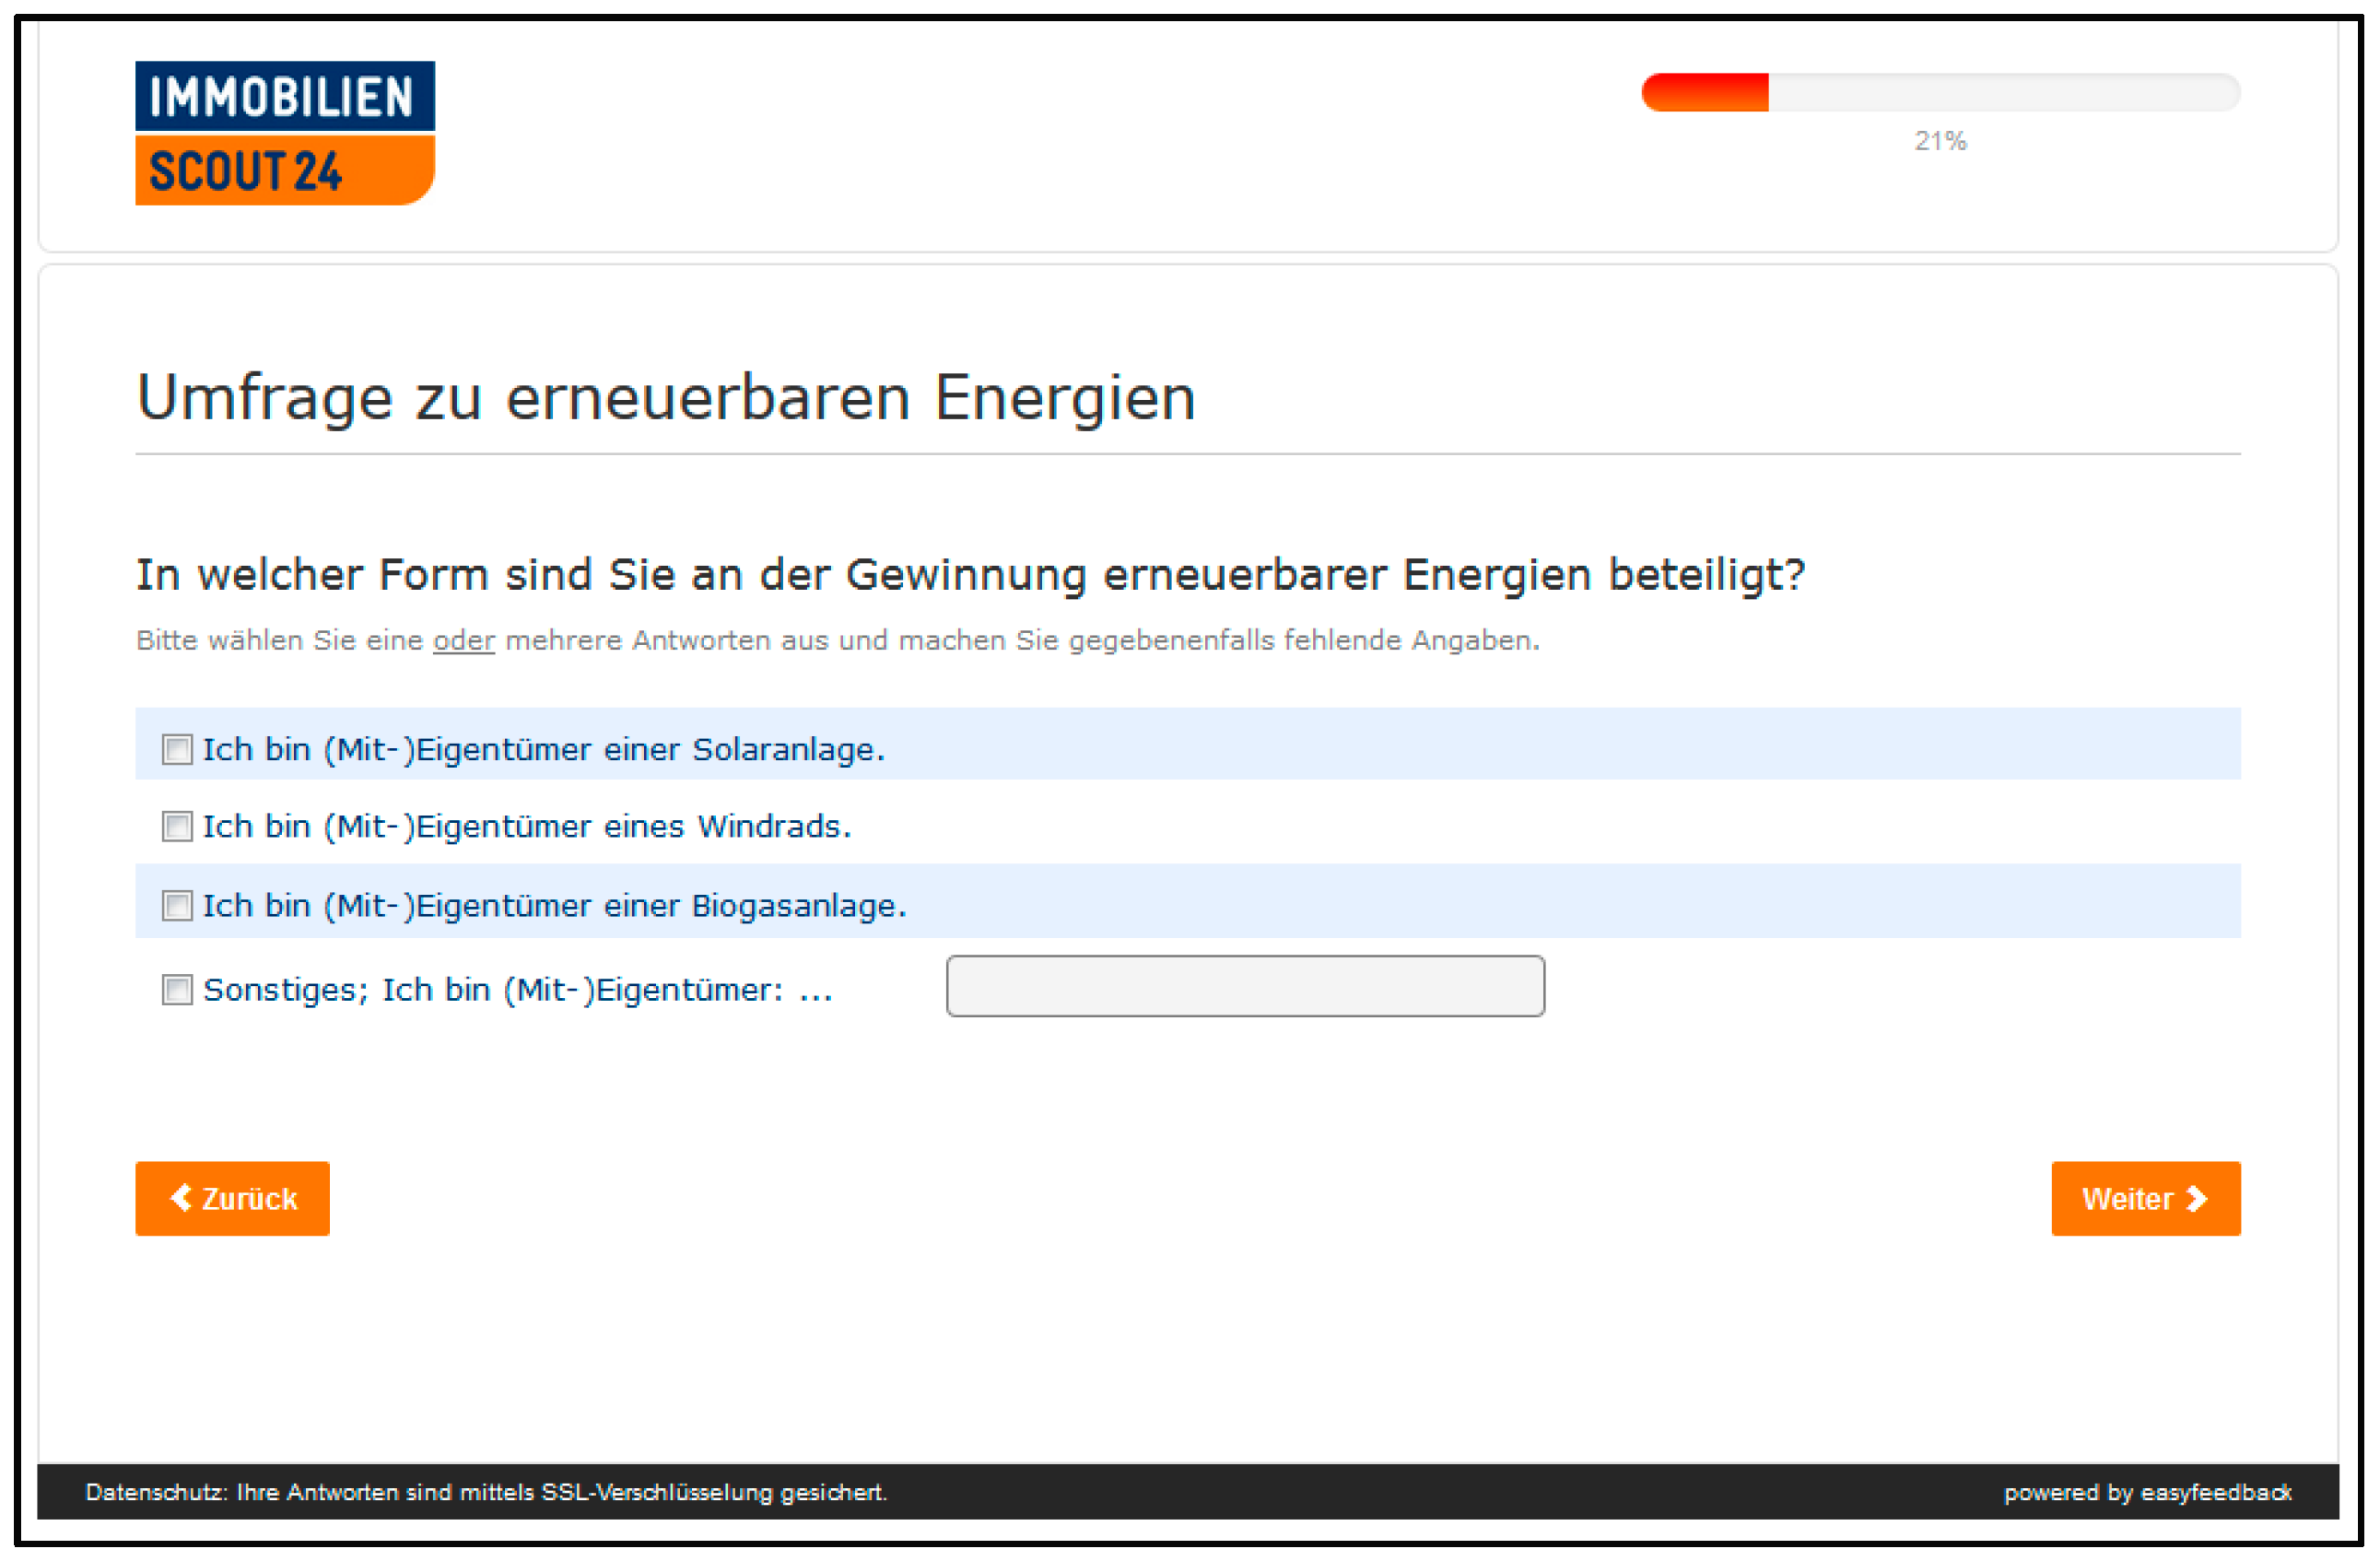
In which way do you participate in the production of energy from renewable sources?
  • Please select one or more answers and fill in any missing information.
  • I am (co-)owner of a solar power plant.
  • I am (co-)owner of a wind turbine.
  • I am (co-)owner of a biogas power plant.
  • I am (co-)owner of a: (user input).
Figure A7. Original questionnaire: screenshot 6.
Sustainability 13 09028 g0a7
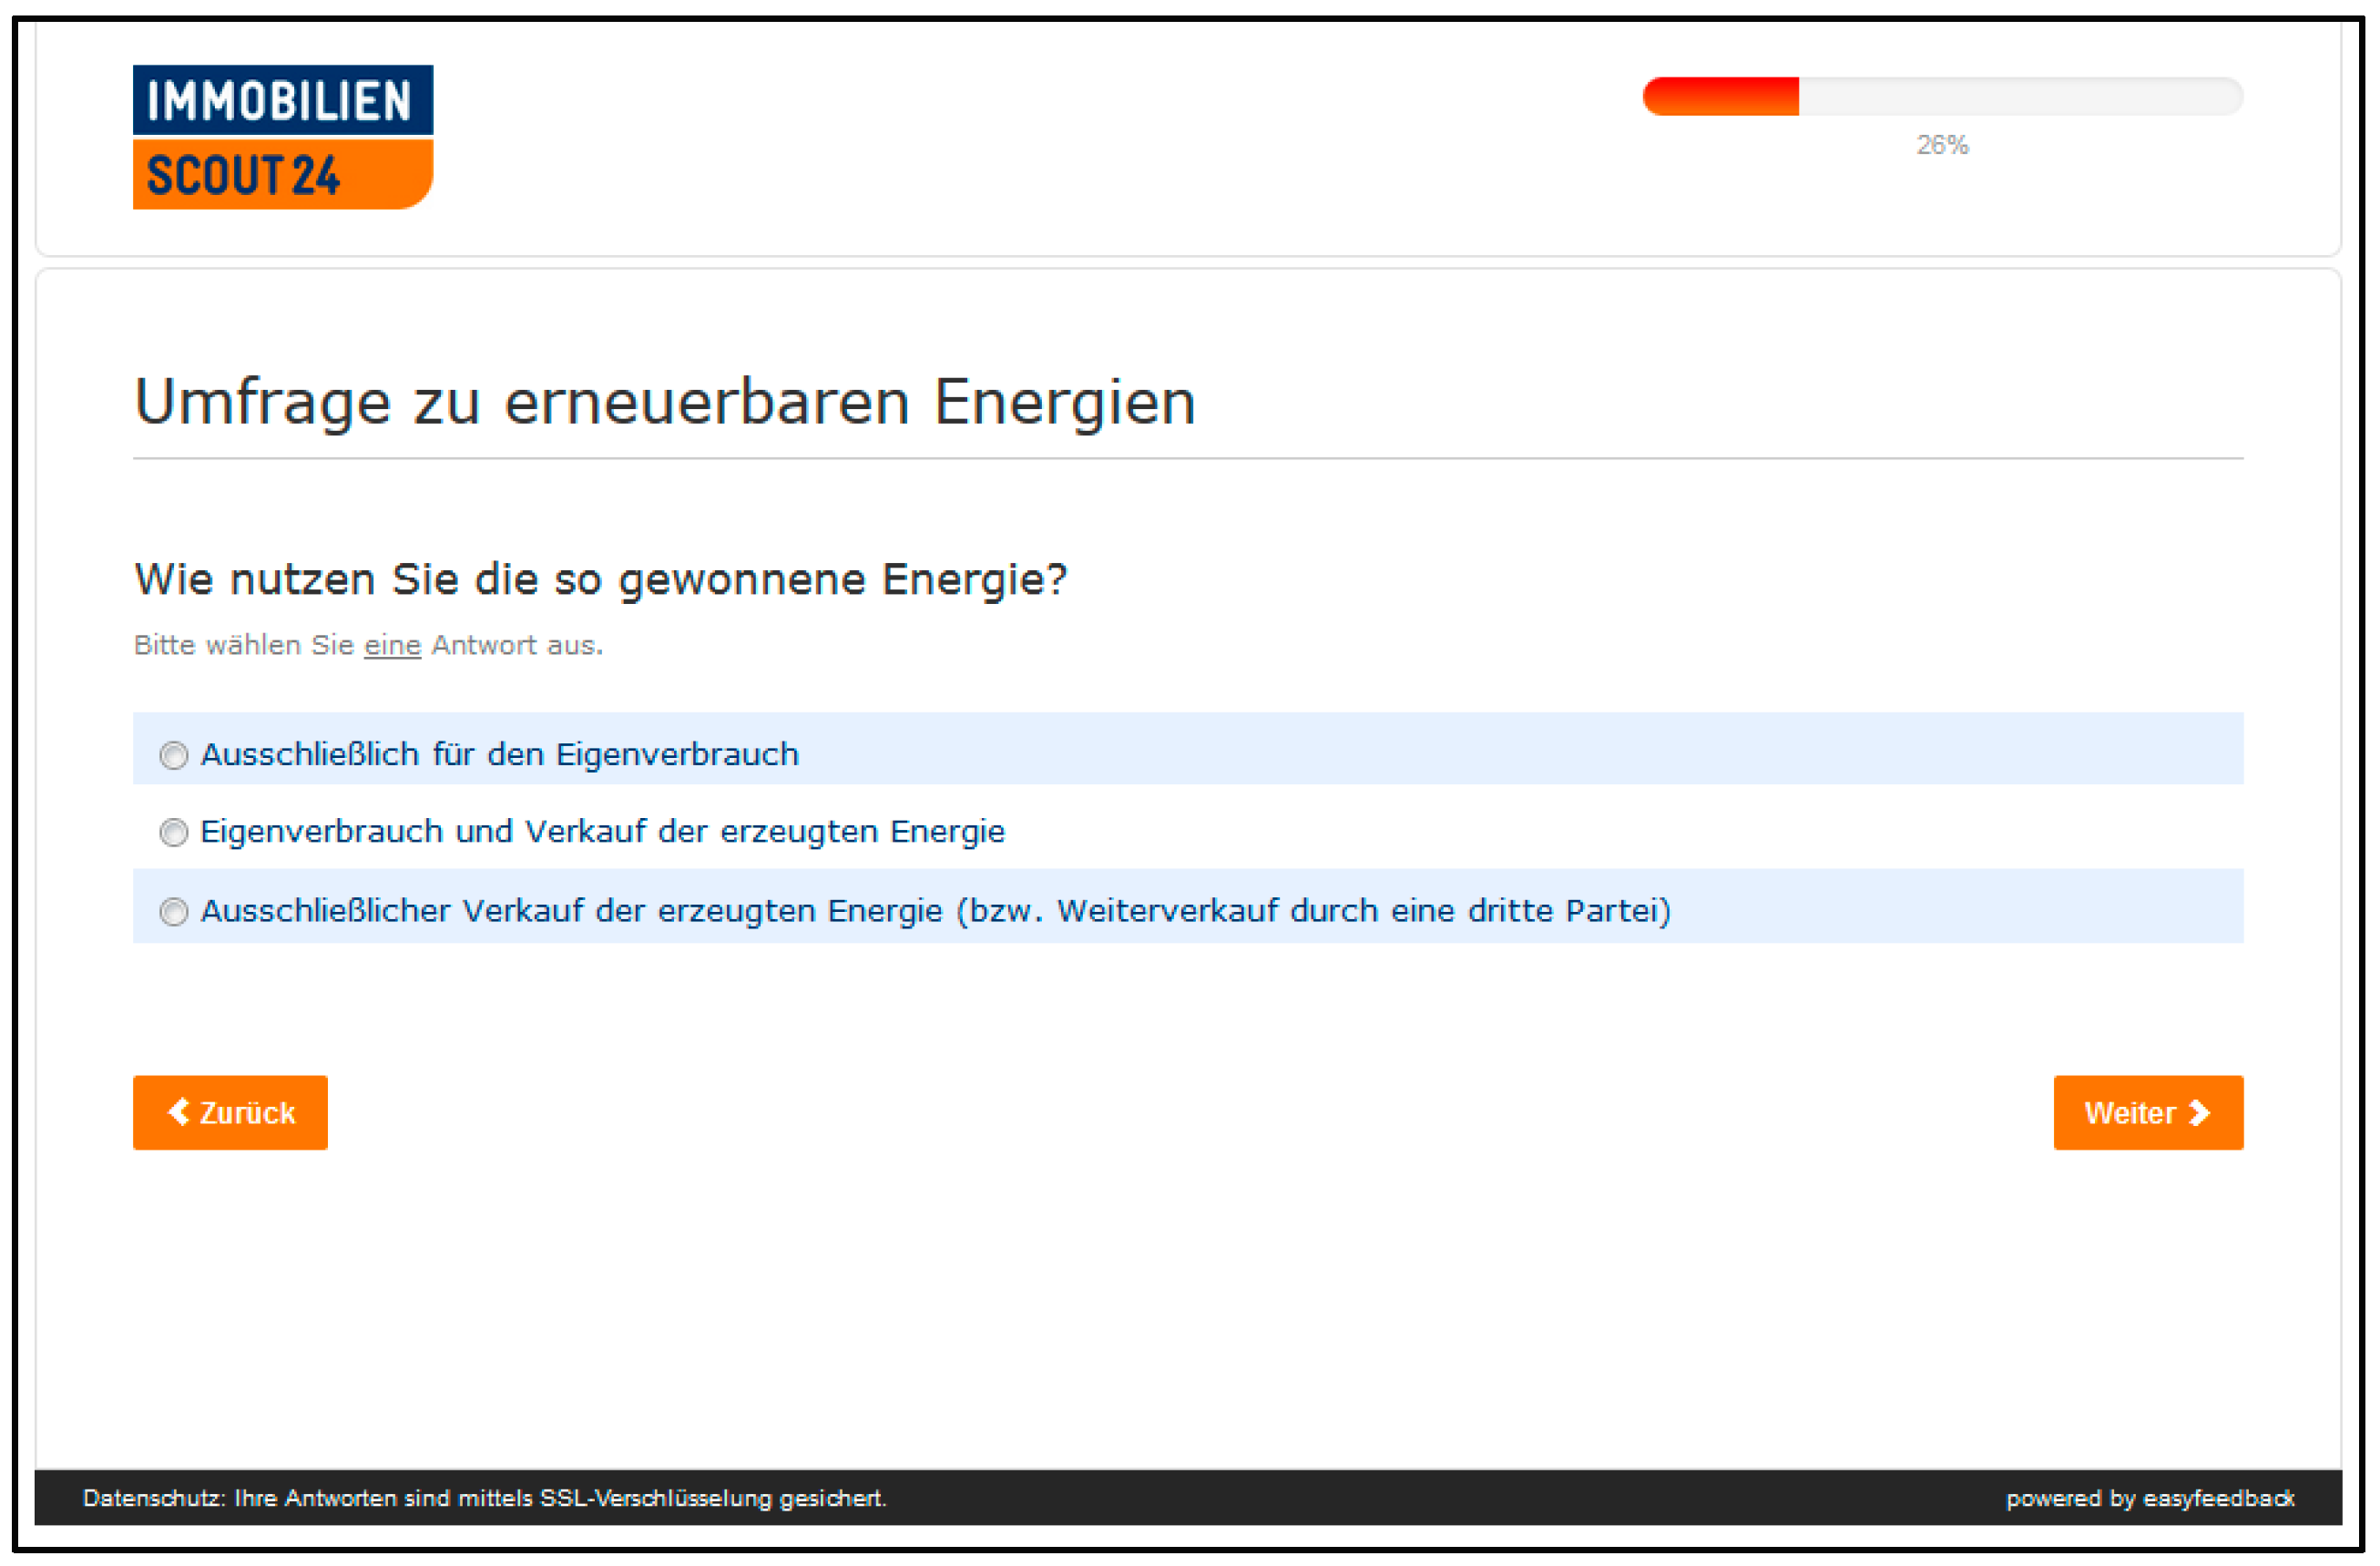
How do you use the energy generated by your installation(s)?
Please select one single answer.
  • Solely for own consumption
  • Own consumption and sale of the generated energy
  • Solely sale of the generated energy (e.g., through a third party)
Figure A8. Original questionnaire: screenshot 7.
Sustainability 13 09028 g0a8
What motivated you to participate in renewable energy generation?
Please select one or more answers and fill in any missing information.
  • Attractive alternative to classic investment opportunities
  • Low entry barriers (e.g., participation with small amounts of money possible or low formal effort)
  • Reduction of energy costs
  • (Partial) independence from electricity price developments
  • Contribution to regional value creation/strengthening of regional economy
  • Contribution to environmental protection
  • Limitation of the market power of large energy suppliers
  • Spatial proximity to a project in connection with renewable energies
  • Desire to participate in shaping (local) energy policy
  • Positive experiences of relatives/acquaintances with projects of this kind
  • Other:
Figure A9. Original questionnaire: screenshot 8.
Sustainability 13 09028 g0a9
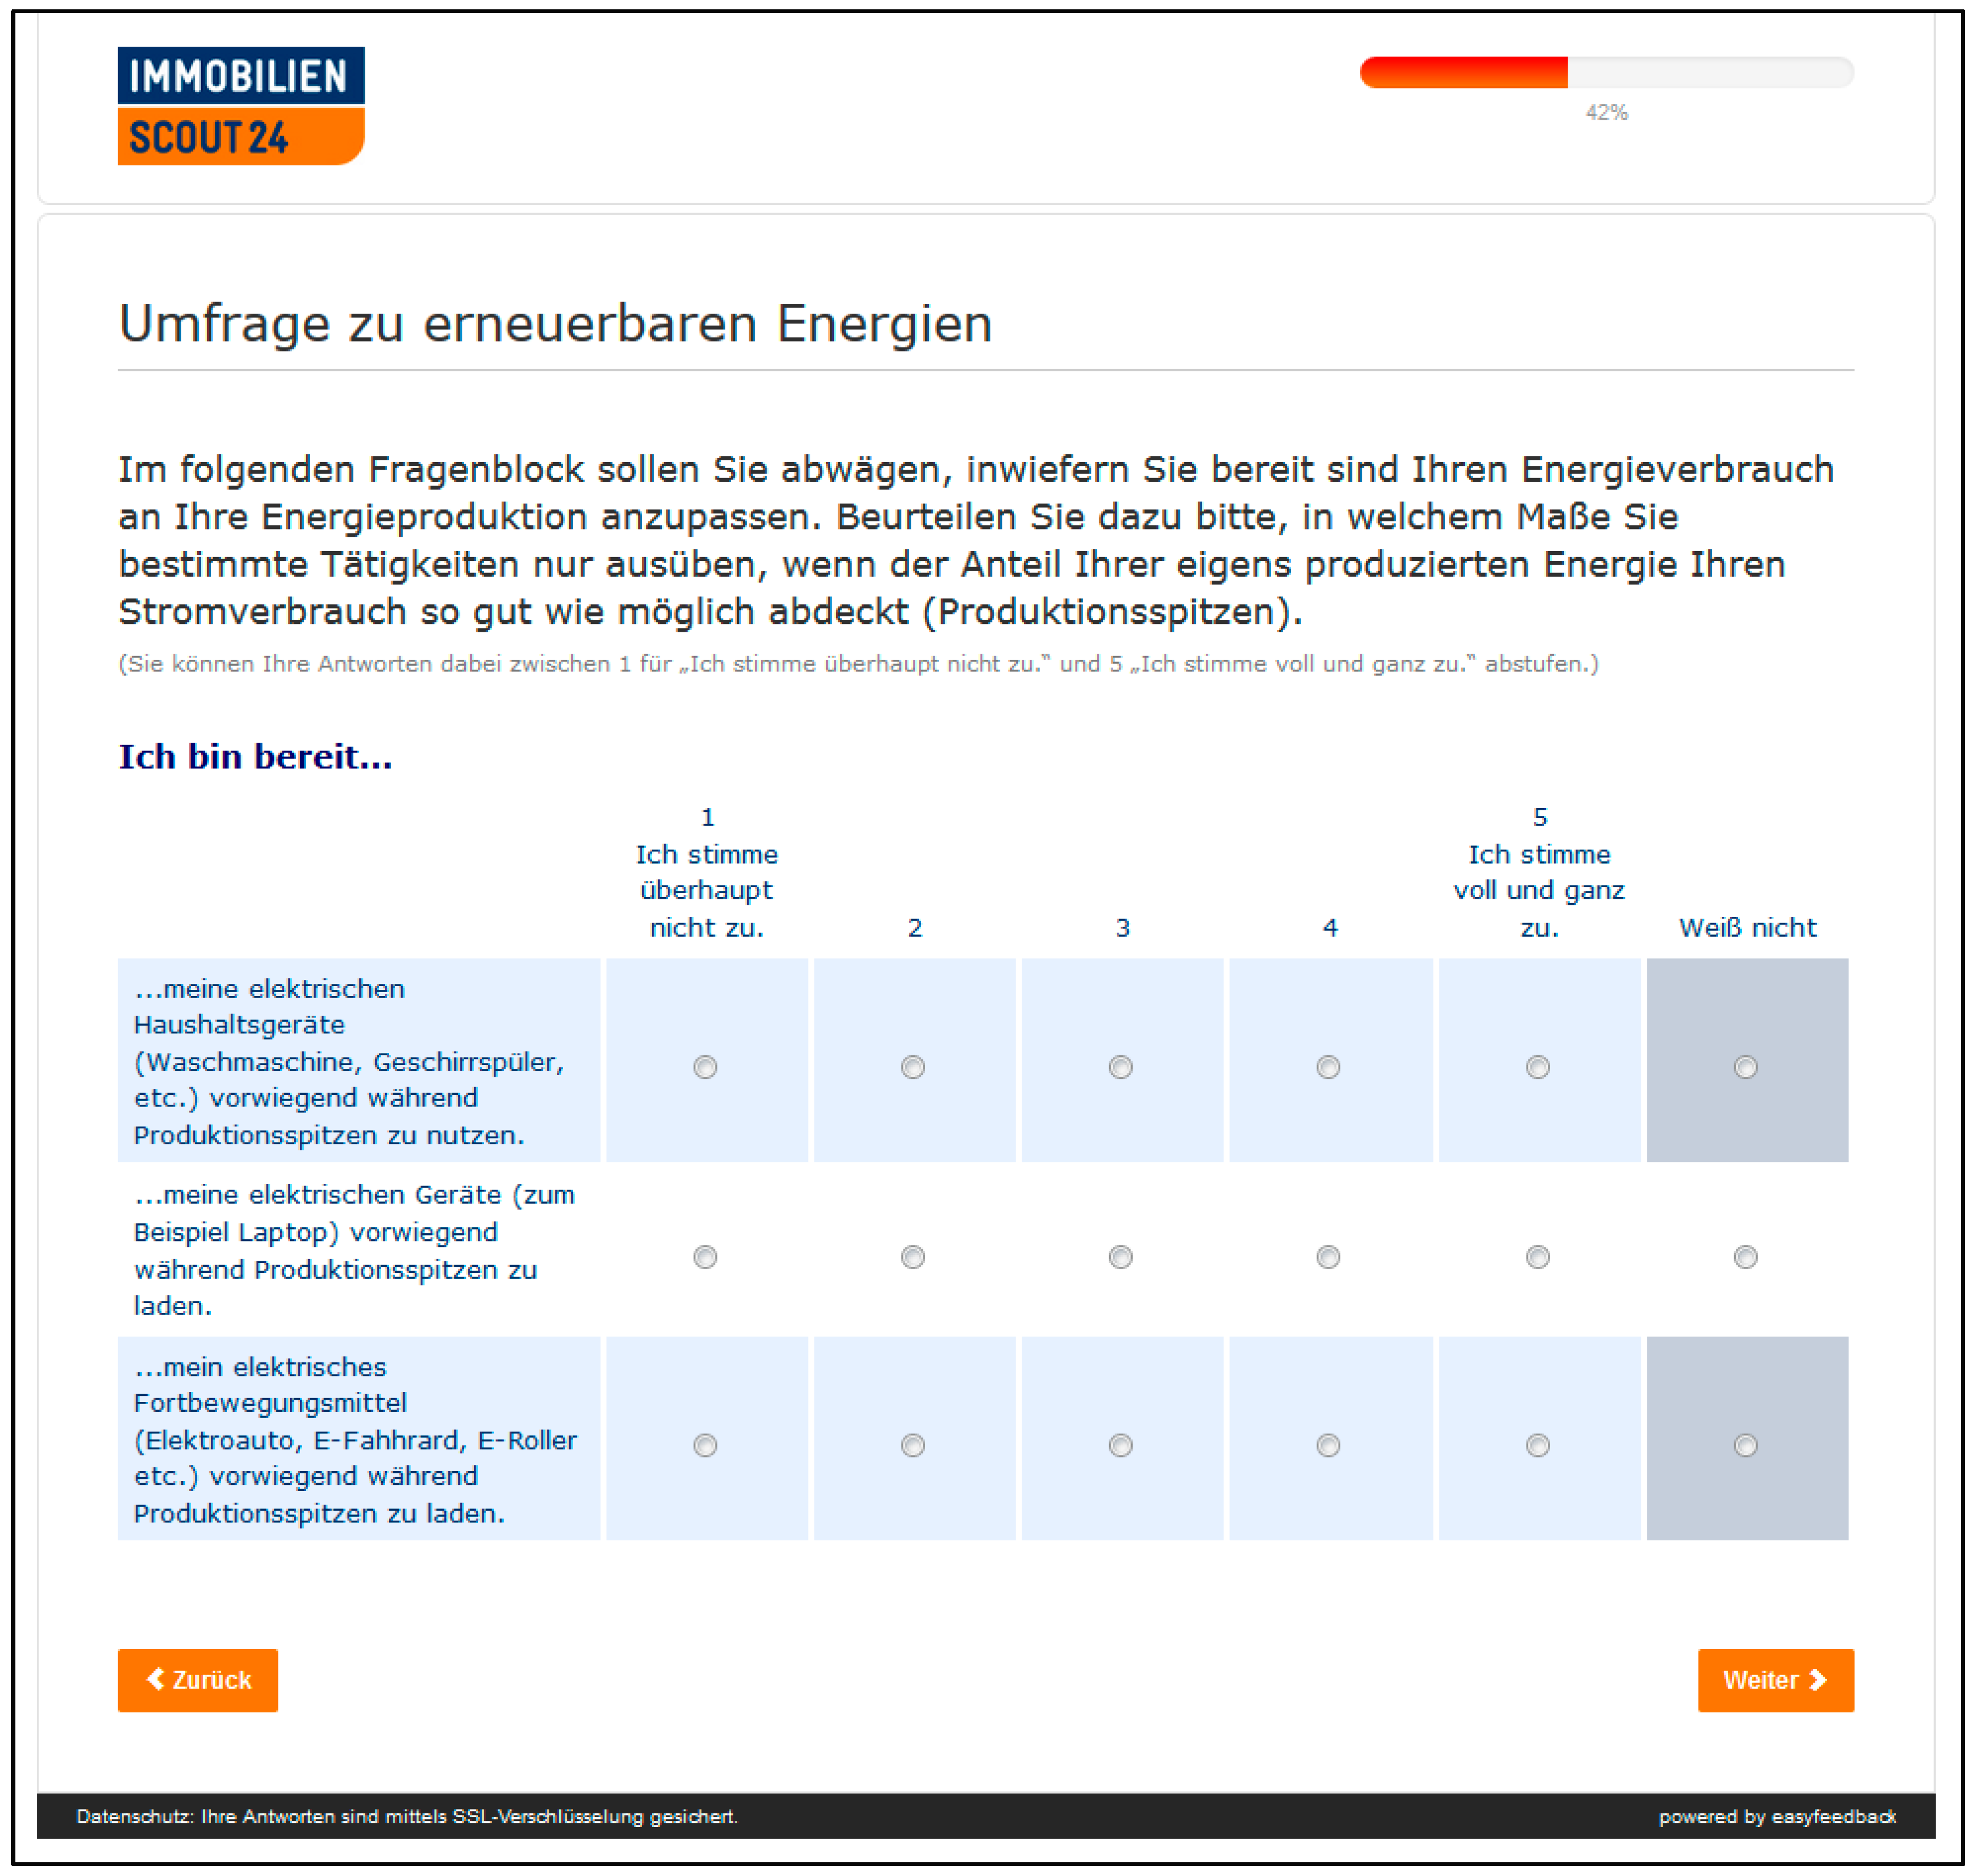
In the following block of questions, you are asked to consider to what extent you are willing to adapt your energy consumption to your energy production. For this purpose, please assess to what extent you would only perform certain activities when the share of your own produced energy covers your electricity consumption as much as possible (production peaks).
(You can grade your answers between 1 for “I do not agree at all” and 5 for “I agree completely”. You can also choose “Do not know”).
I am willing to…
  • … use household appliances (e.g., washing machine, dishwasher etc.) mainly when the share of electricity from renewable sources in the grid is very high.
  • … recharge electrical devices (e.g., laptop) mainly when the share of electricity from renewable sources in the grid is very high.
  • … recharge electrical means of transportation (e.g., electric car/scooter/bike) mainly when the share of electricity from renewable sources in the grid is very high.
Figure A10. Original questionnaire: screenshot 9.
Sustainability 13 09028 g0a10
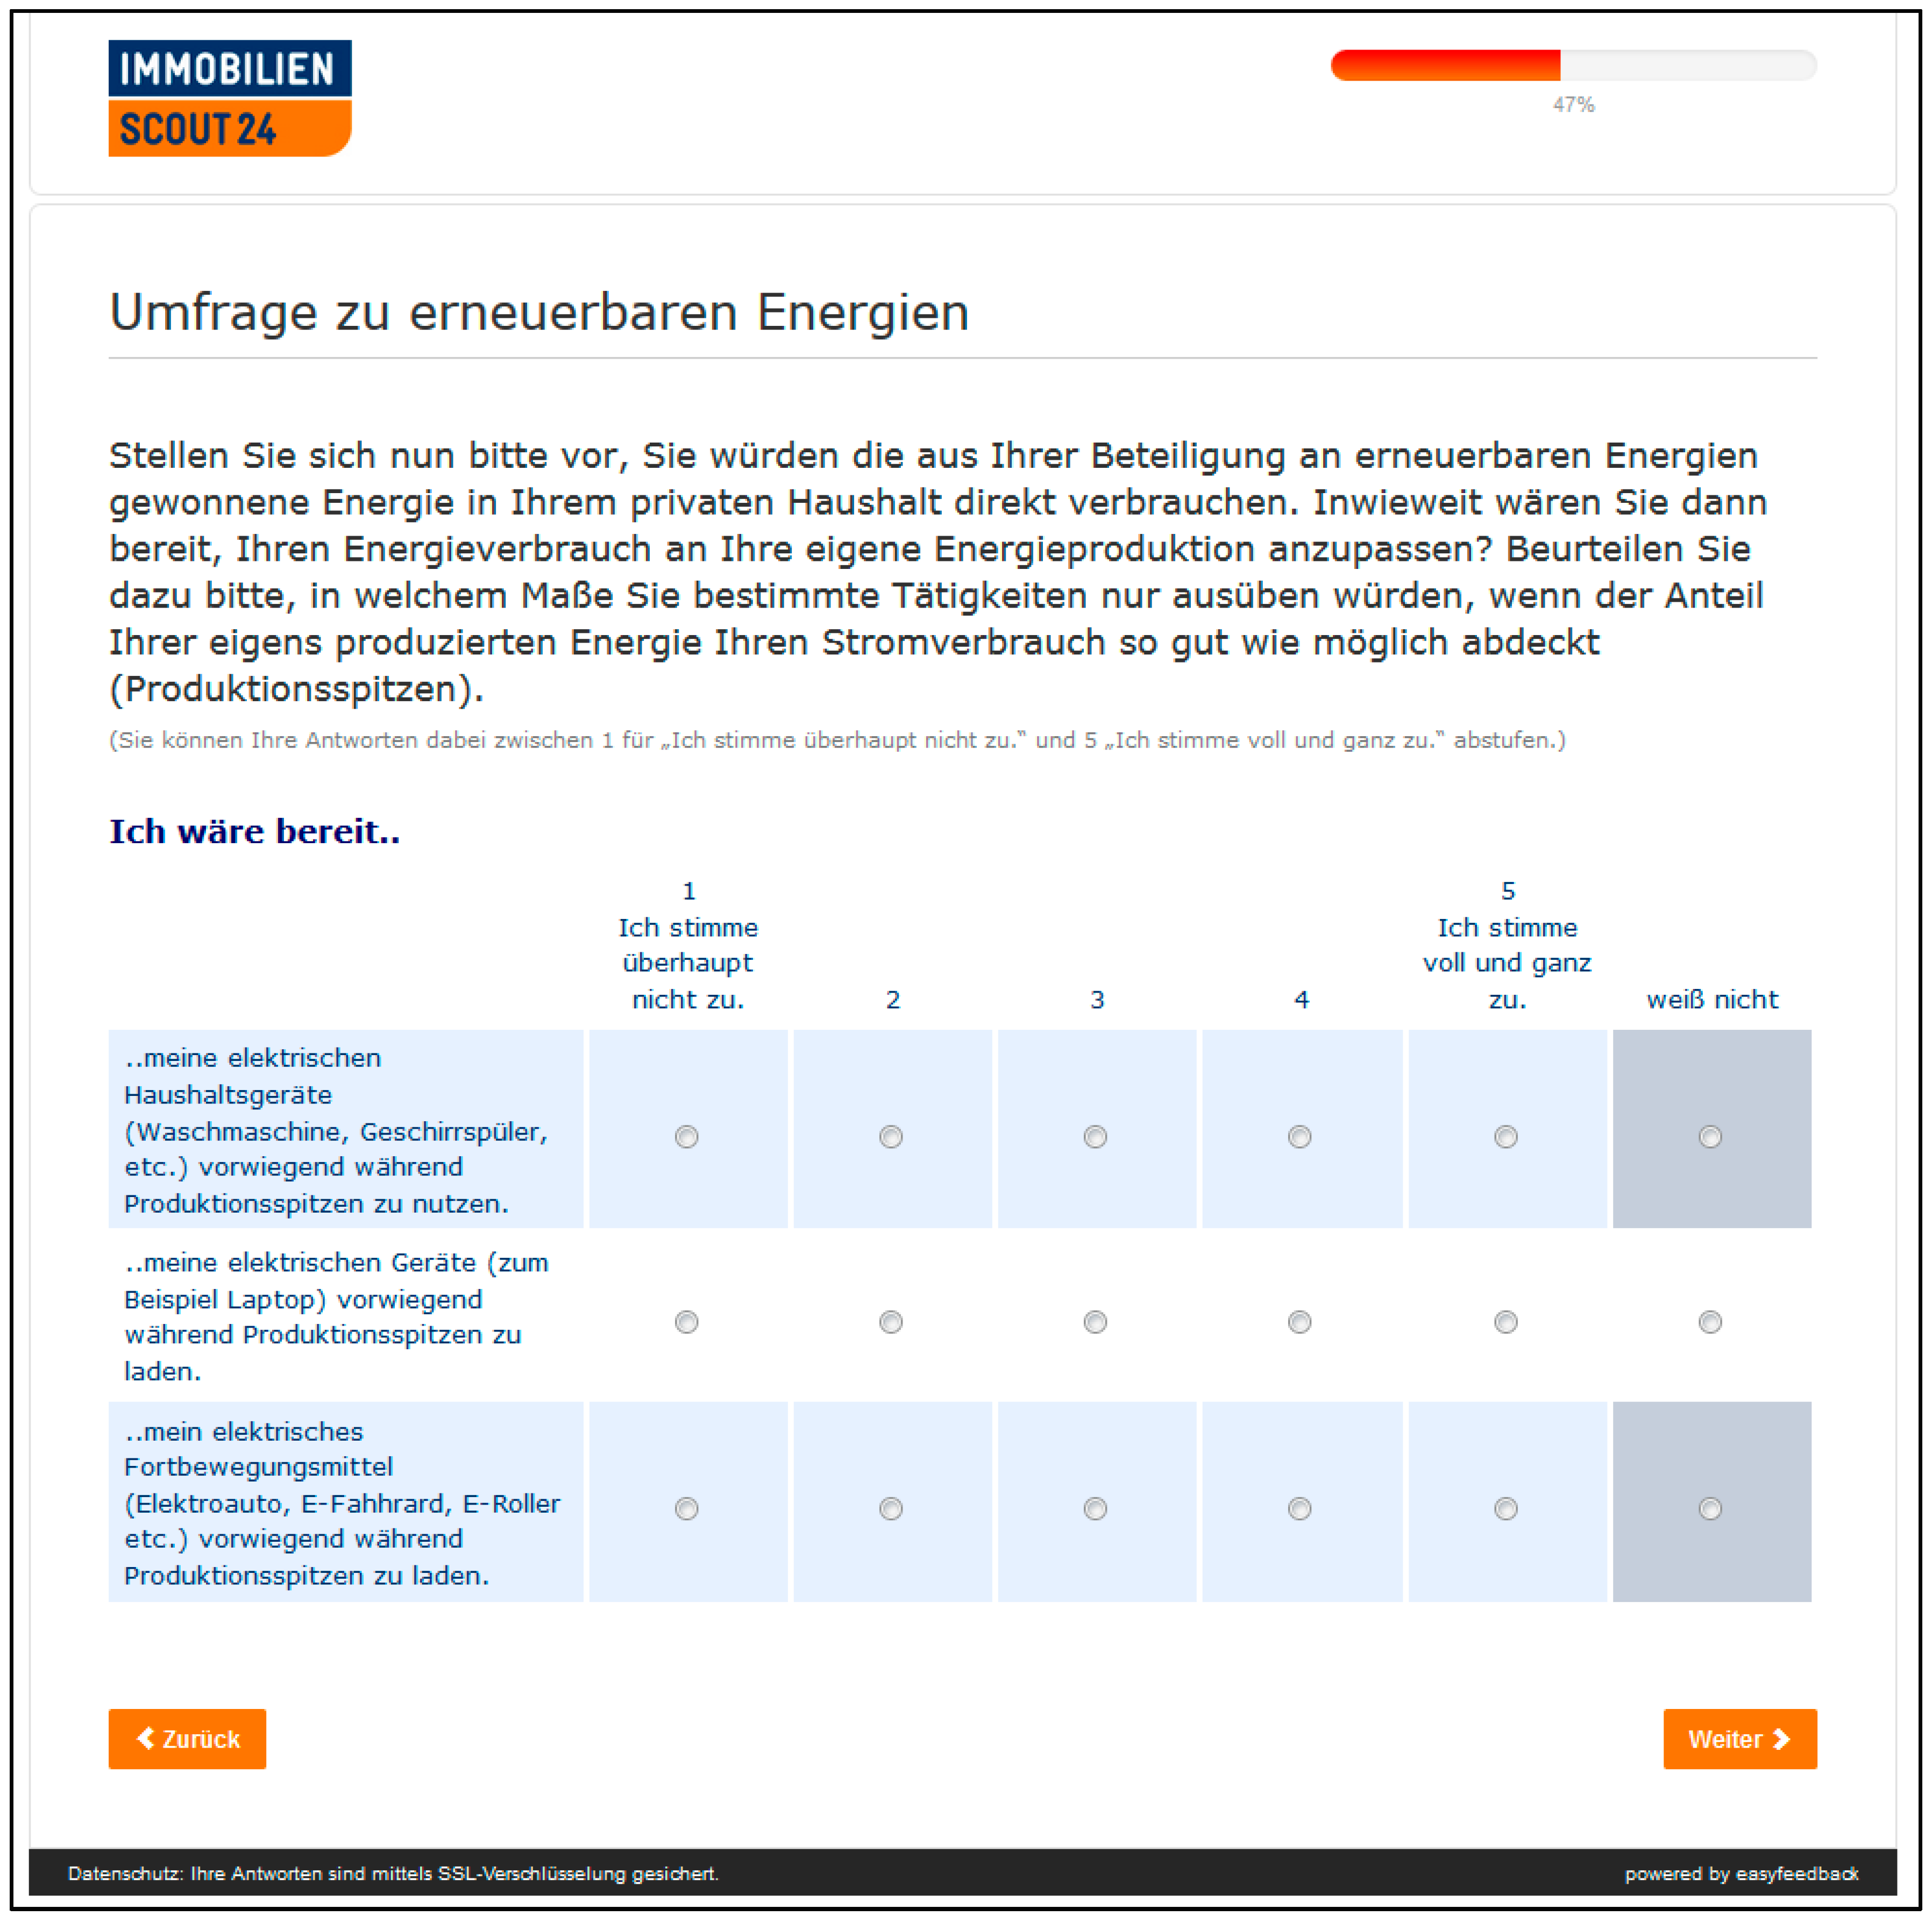
Now please imagine that you would directly consume the energy generated from your renewable energy participation in your private household.
To what extent would you then be willing to adapt your energy consumption to your own energy production?
Please assess to what extent you would only carry out certain activities if the share of your own produced energy covered your electricity consumption as much as possible (production peaks).
(You can grade your answers between 1 for “I do not agree at all” and 5 for “I agree completely”. You can also choose “Do not know”).
I am willing to…
  • … use household appliances (e.g., washing machine, dishwasher etc.) mainly when the share of electricity from renewable sources in the grid is very high.
  • … recharge electrical devices (e.g., laptop) mainly when the share of electricity from renewable sources in the grid is very high.
  • … recharge electrical means of transportation (e.g., electric car/scooter/bike) mainly when the share of electricity from renewable sources in the grid is very high.
Figure A11. Original questionnaire: screenshot 10.
Sustainability 13 09028 g0a11
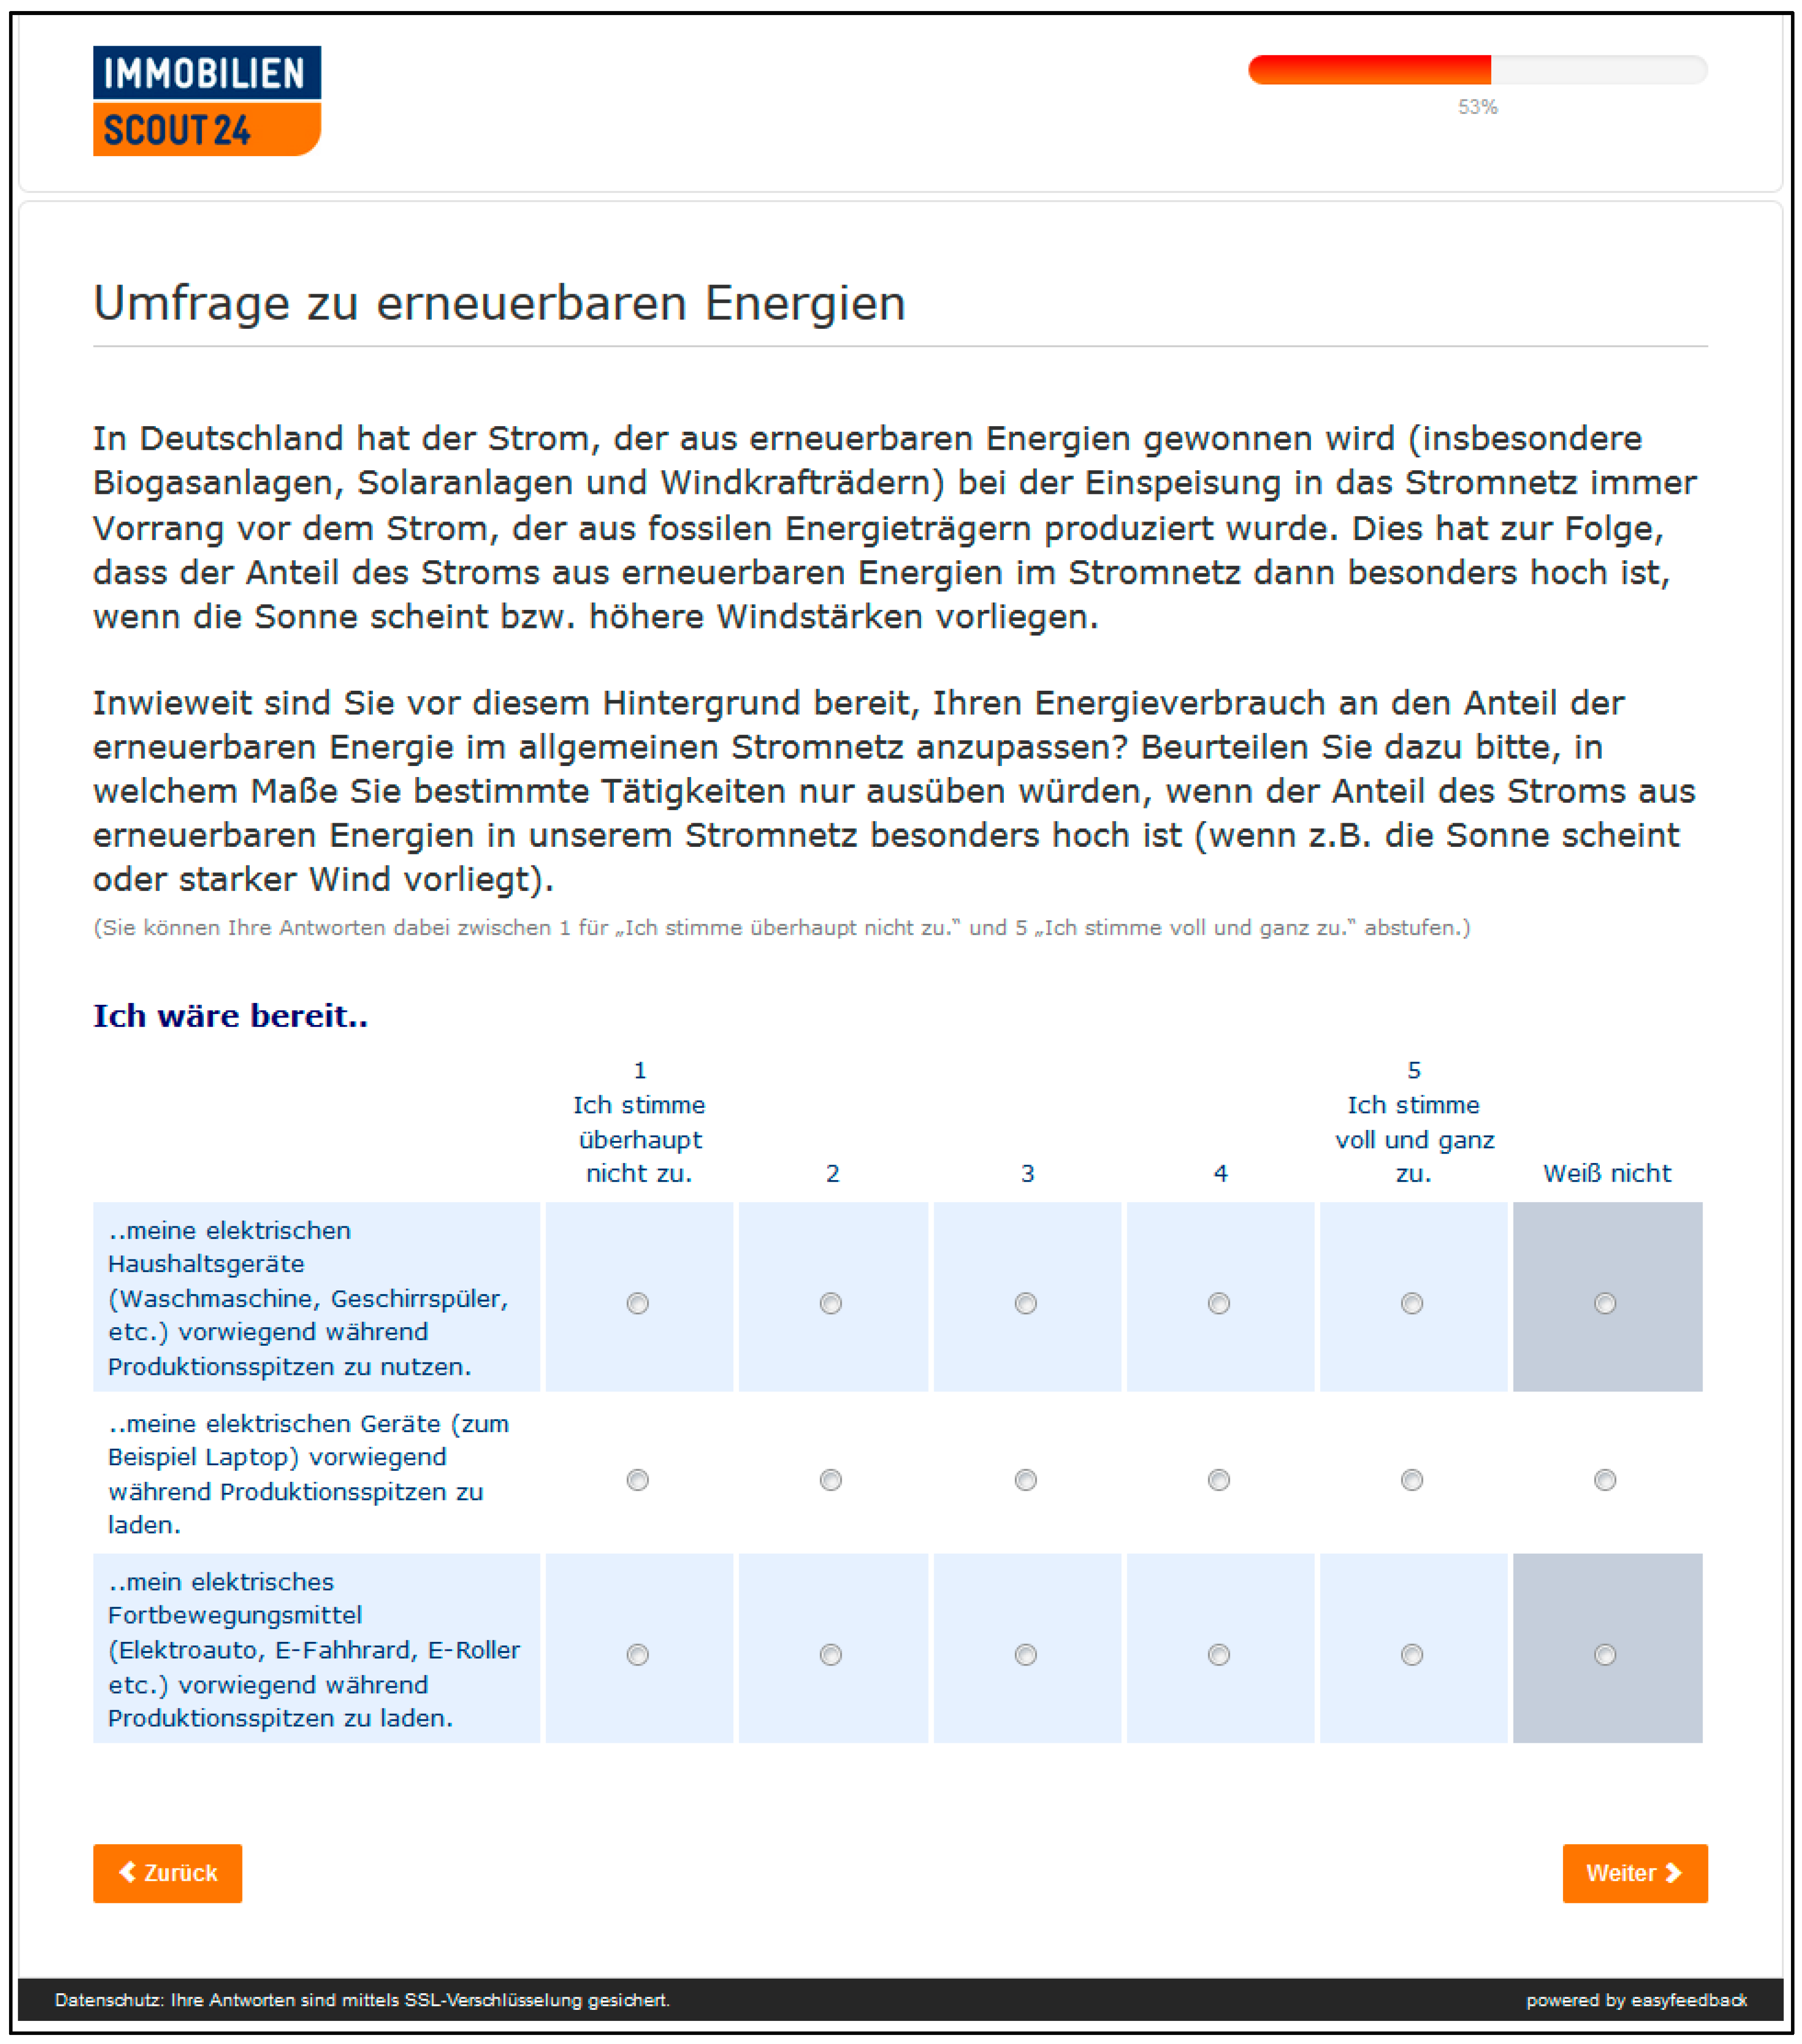
In Germany, electricity generated from renewable sources (especially biogas plants, solar panels, and wind turbines) always has priority over electricity produced from fossil fuels when it is fed into the grid. As a result, the share of electricity from renewable energies in the power grid is particularly high when the sun is shining or there are higher wind strengths.
Against this background, to what extent are you prepared to adjust your energy consumption to the share of renewable energy in the general power grid?
Please assess to what extent you would only carry out certain activities if the share of electricity from renewable energies in our power grid is particularly high (e.g., if the sun is shining or there is strong wind).
(You can grade your answers between 1 for “I do not agree at all” and 5 for “I agree completely”. You can also choose “Do not know”).
I am willing to…
  • … use household appliances (e.g., washing machine, dishwasher etc.) mainly when the share of electricity from renewable sources in the grid is very high.
  • … recharge electrical devices (e.g., laptop) mainly when the share of electricity from renewable sources in the grid is very high.
  • … recharge electrical means of transportation (e.g., electric car/scooter/bike) mainly when the share of electricity from renewable sources in the grid is very high.
Figure A12. Original questionnaire: screenshot 11.
Sustainability 13 09028 g0a12
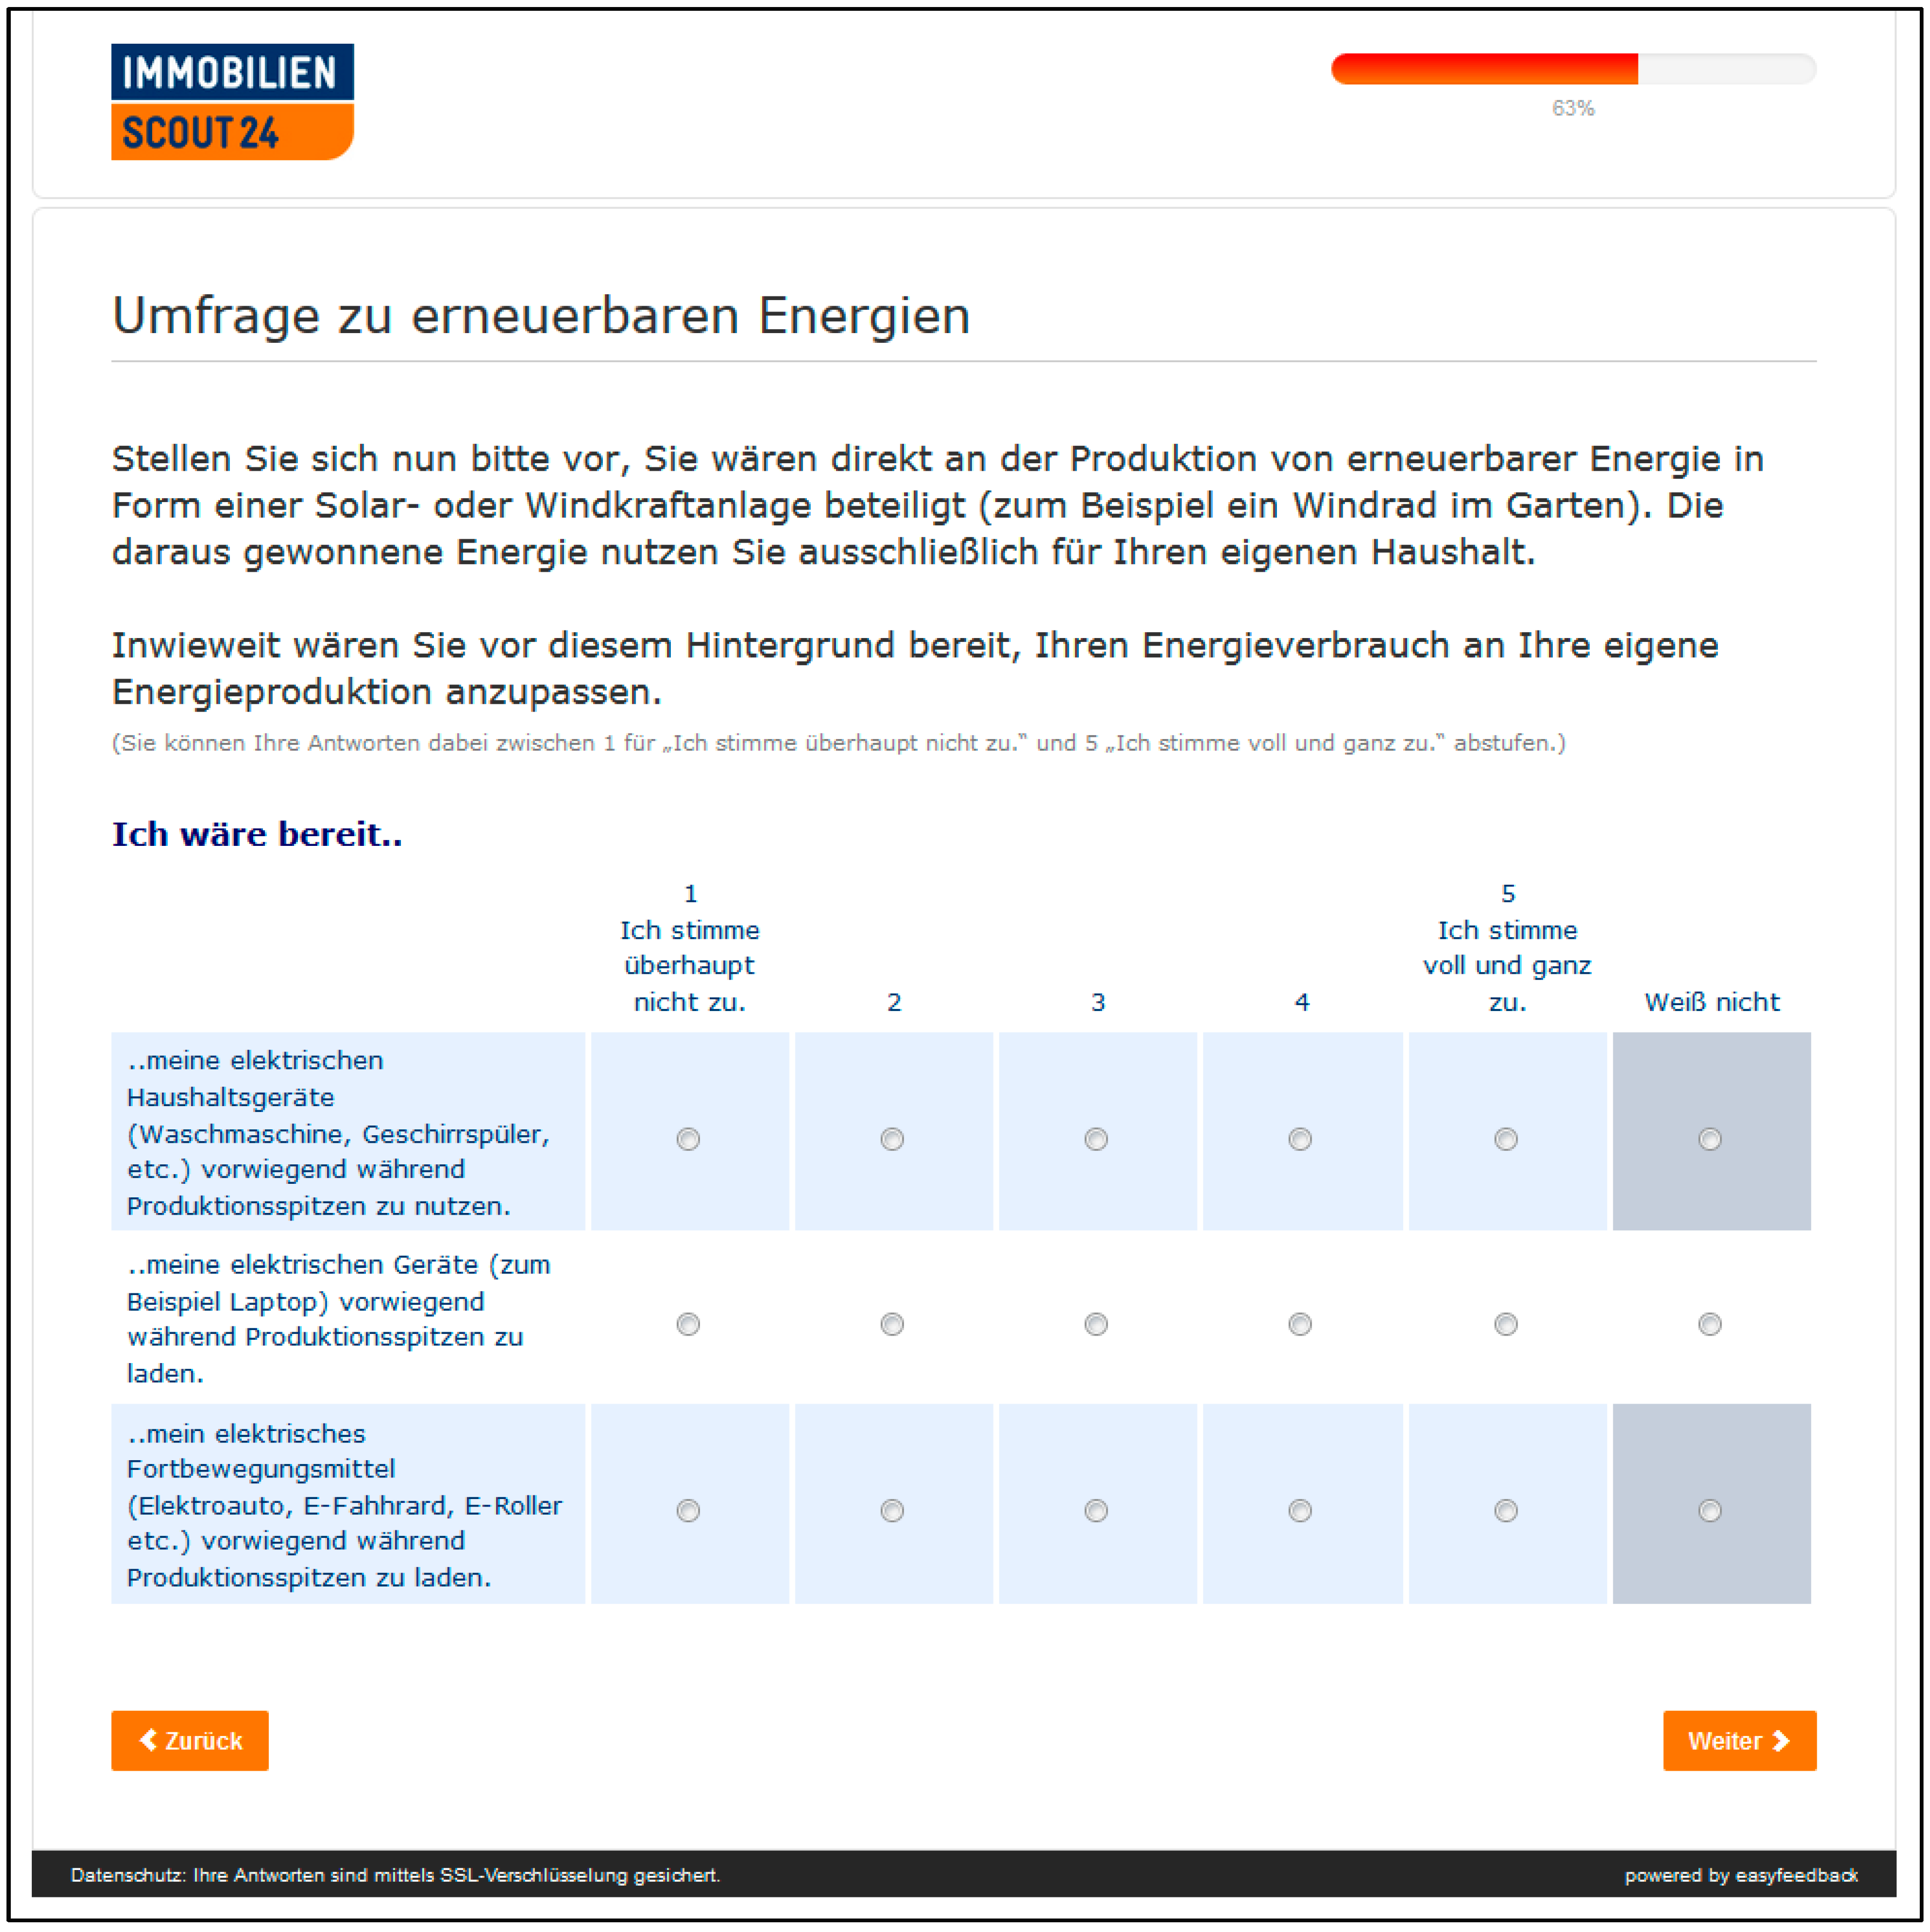
Now please imagine that you are directly involved in the production of renewable energy in the form of a solar or wind power plant (e.g., a wind turbine in your backyard). You use the energy generated from this exclusively for your own household.
Against this background, to what extent would you be willing to adapt your energy consumption to your own energy production?
(You can grade your answers between 1 for “I do not agree at all” and 5 for “I agree completely”. You can also choose “Do not know”).
I am willing...
  • ...to use my household electrical appliances (washing machine, dishwasher, etc.) mainly during production peaks.
  • ...to charge my electrical devices (e.g., laptop) mainly during production peaks.
  • ...to charge my electronic means of transportation (electric car, e-bike, e-scooter etc.) mainly during production peaks.
Figure A13. Original questionnaire: screenshot 12.
Sustainability 13 09028 g0a13
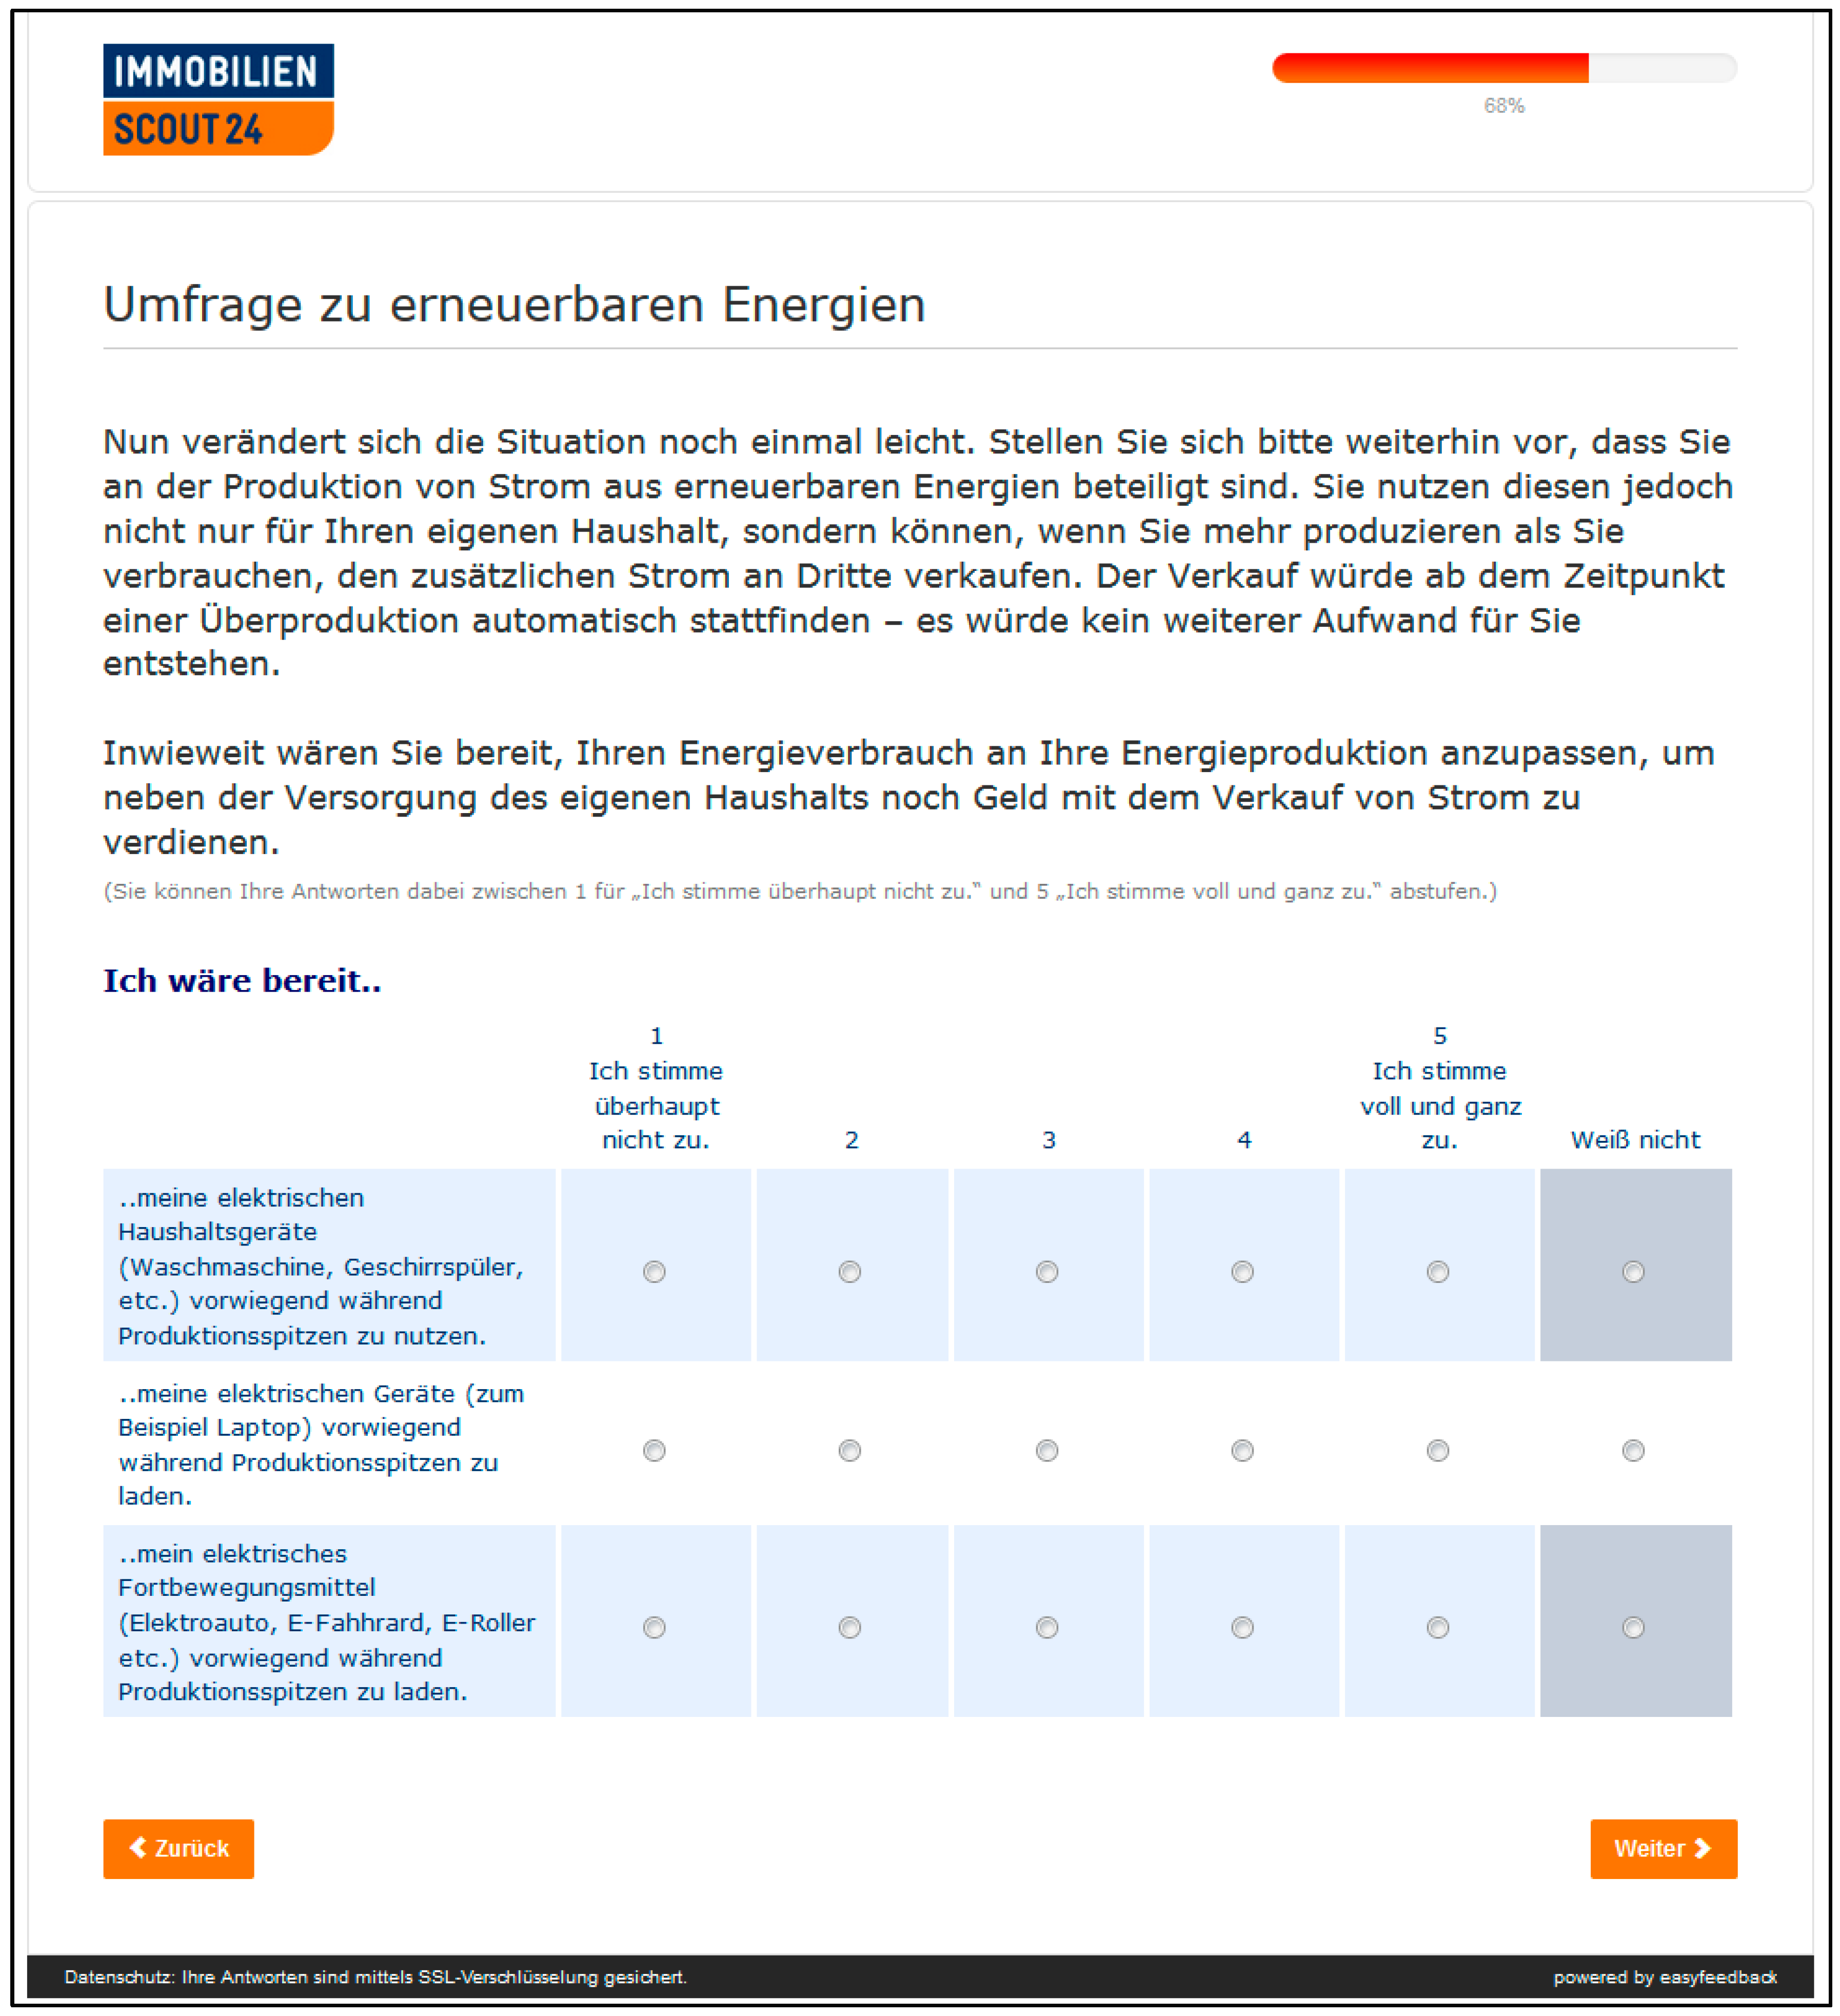
Now the situation changes slightly once again. Please continue to imagine that you are involved in the production of electricity from renewable sources. However, you not only use this for your own household, but if you produce more than you consume, you can sell the additional electricity to third parties. The sale would take place automatically from the moment of excess production. There would be no further effort on your part.
To what extent would you be willing to adjust your energy consumption to your energy production in order to earn money from selling electricity, in addition to supplying your own household?
(You can grade your answers between 1 for “I do not agree at all” and 5 for “I agree completely”. You can also choose “Do not know”).
I am willing to...
  • ...use my household electrical appliances (washing machine, dishwasher, etc.) mainly during production peaks.
  • ... charge my electrical devices (e.g., laptop) mainly during production peaks.
  • …charge my electronic means of transportation (electric car, e-bike, e-scooter etc.) mainly during production peaks.
Figure A14. Original questionnaire: screenshot 13.
Sustainability 13 09028 g0a14
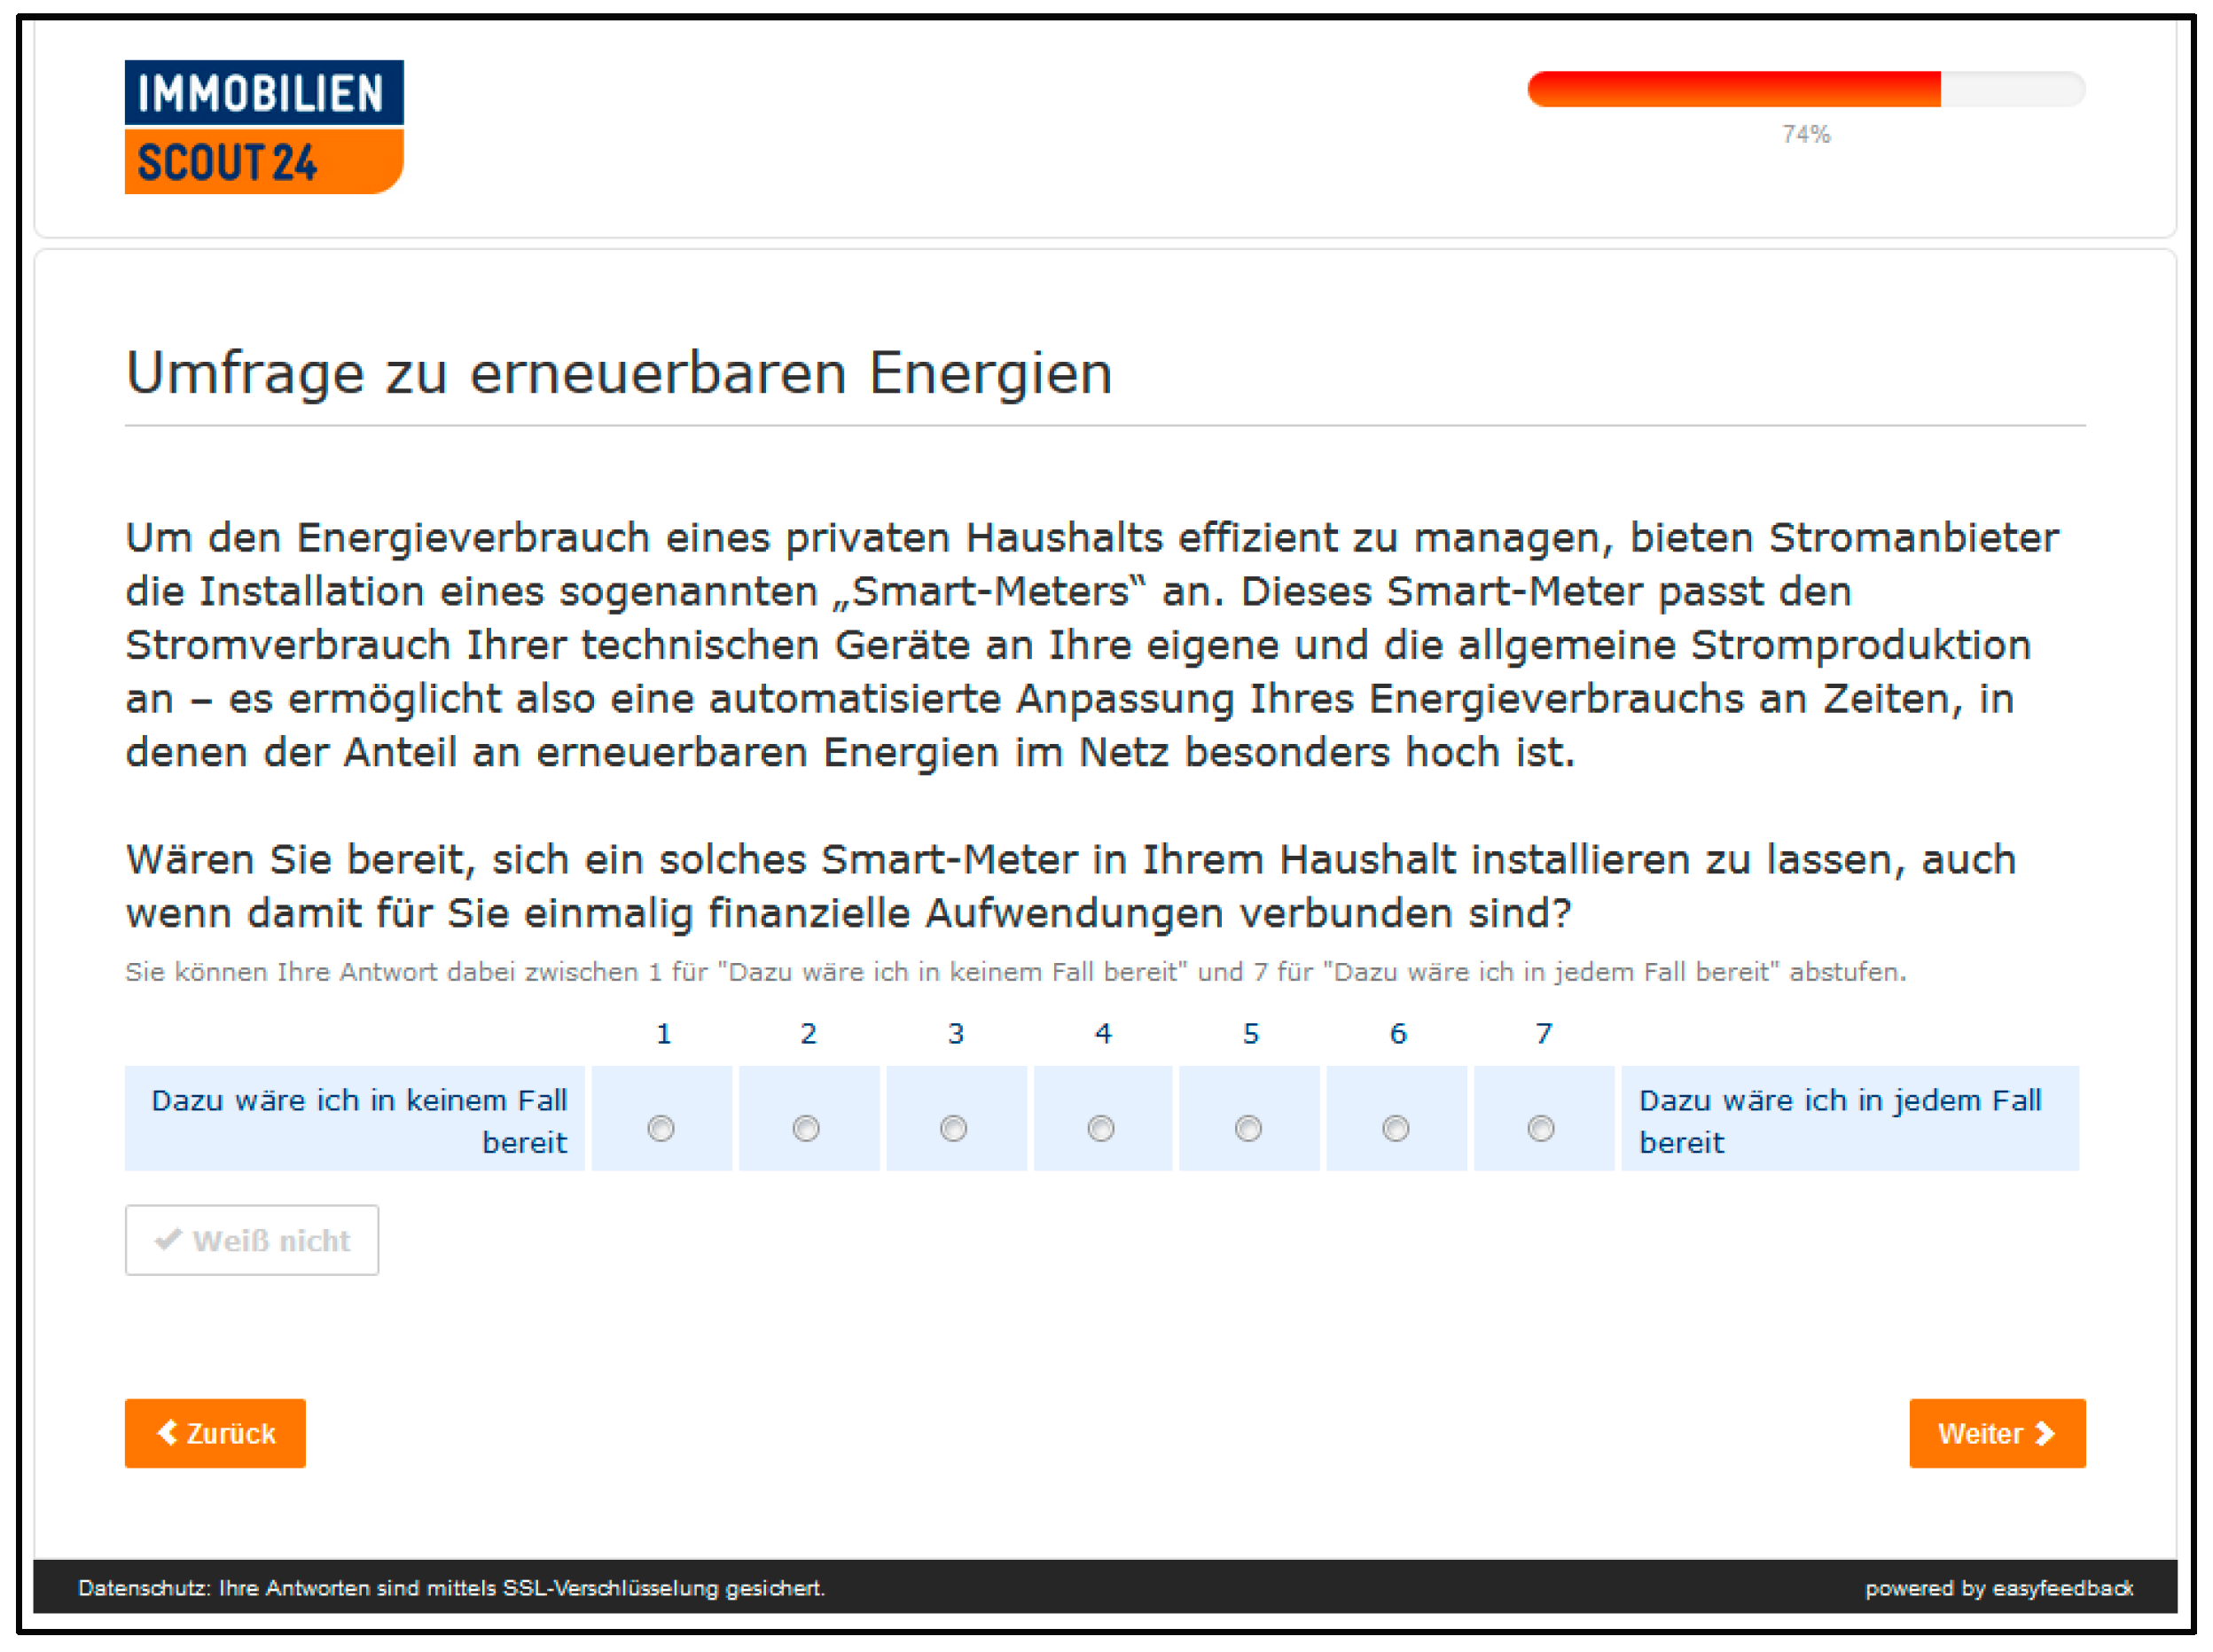
In order to efficiently manage the energy consumption of a private household, electricity providers offer the installation of a so-called “smart meter”. This smart meter monitors your electricity consumption and is able to automatically adjust it to your consumption. Thus, it allows for an automated adjustment of your energy consumption to times when the share of renewable energies in the grid is particularly high.
Would you be willing to have such a smart meter installed in your household, even if it meant one-time financial expenses for you?
You can grade your answer between 1 for “I would never be prepared to do this” and 7 for “I would be prepared to do this in any case”. You can also choose “Do not know”.
Figure A15. Original questionnaire: screenshot 14.
Sustainability 13 09028 g0a15
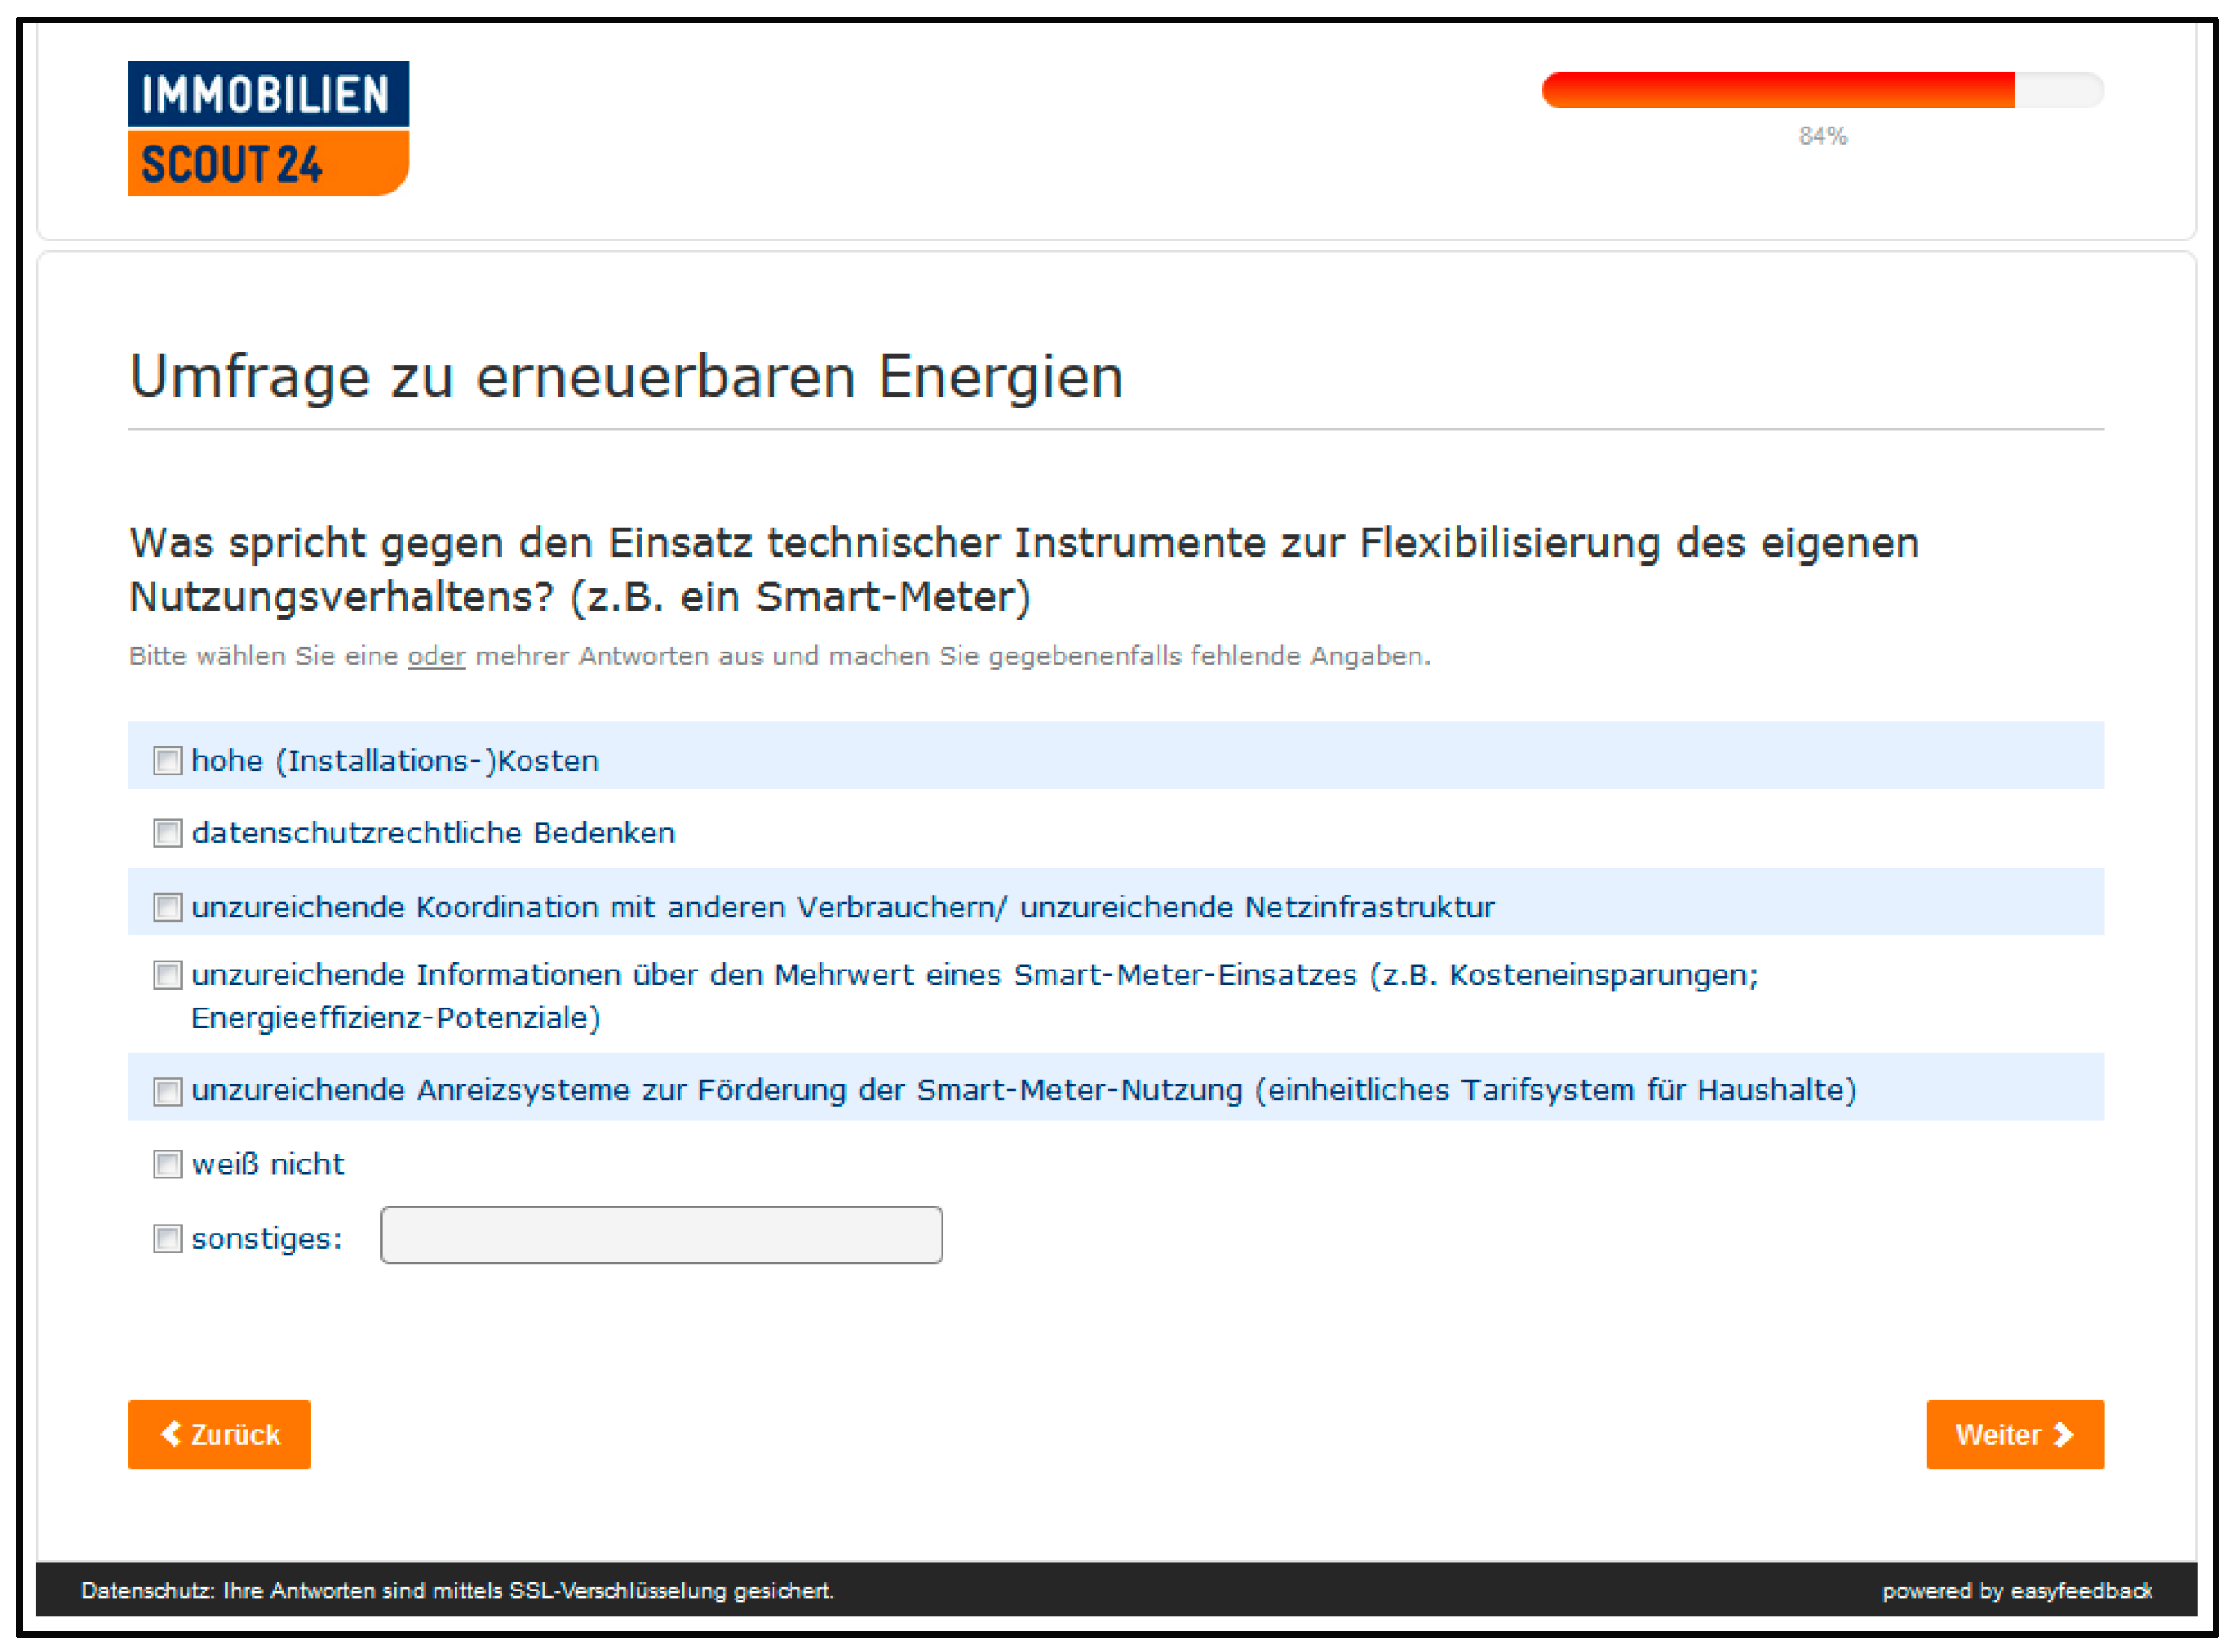
What are the arguments against the use of technical instruments to make one’s own usage behaviour more flexible (e.g., a smart meter)?
Please select one or more answers and fill in any missing information.
  • High (installation) costs
  • Data protection concerns
  • Insufficient coordination with other consumers/insufficient network infrastructure
  • Insufficient information about the added value of smart meter deployment (e.g., cost savings, energy efficiency potential)
  • I do not know
  • Other:
Figure A16. Original questionnaire: screenshot 15.
Sustainability 13 09028 g0a16
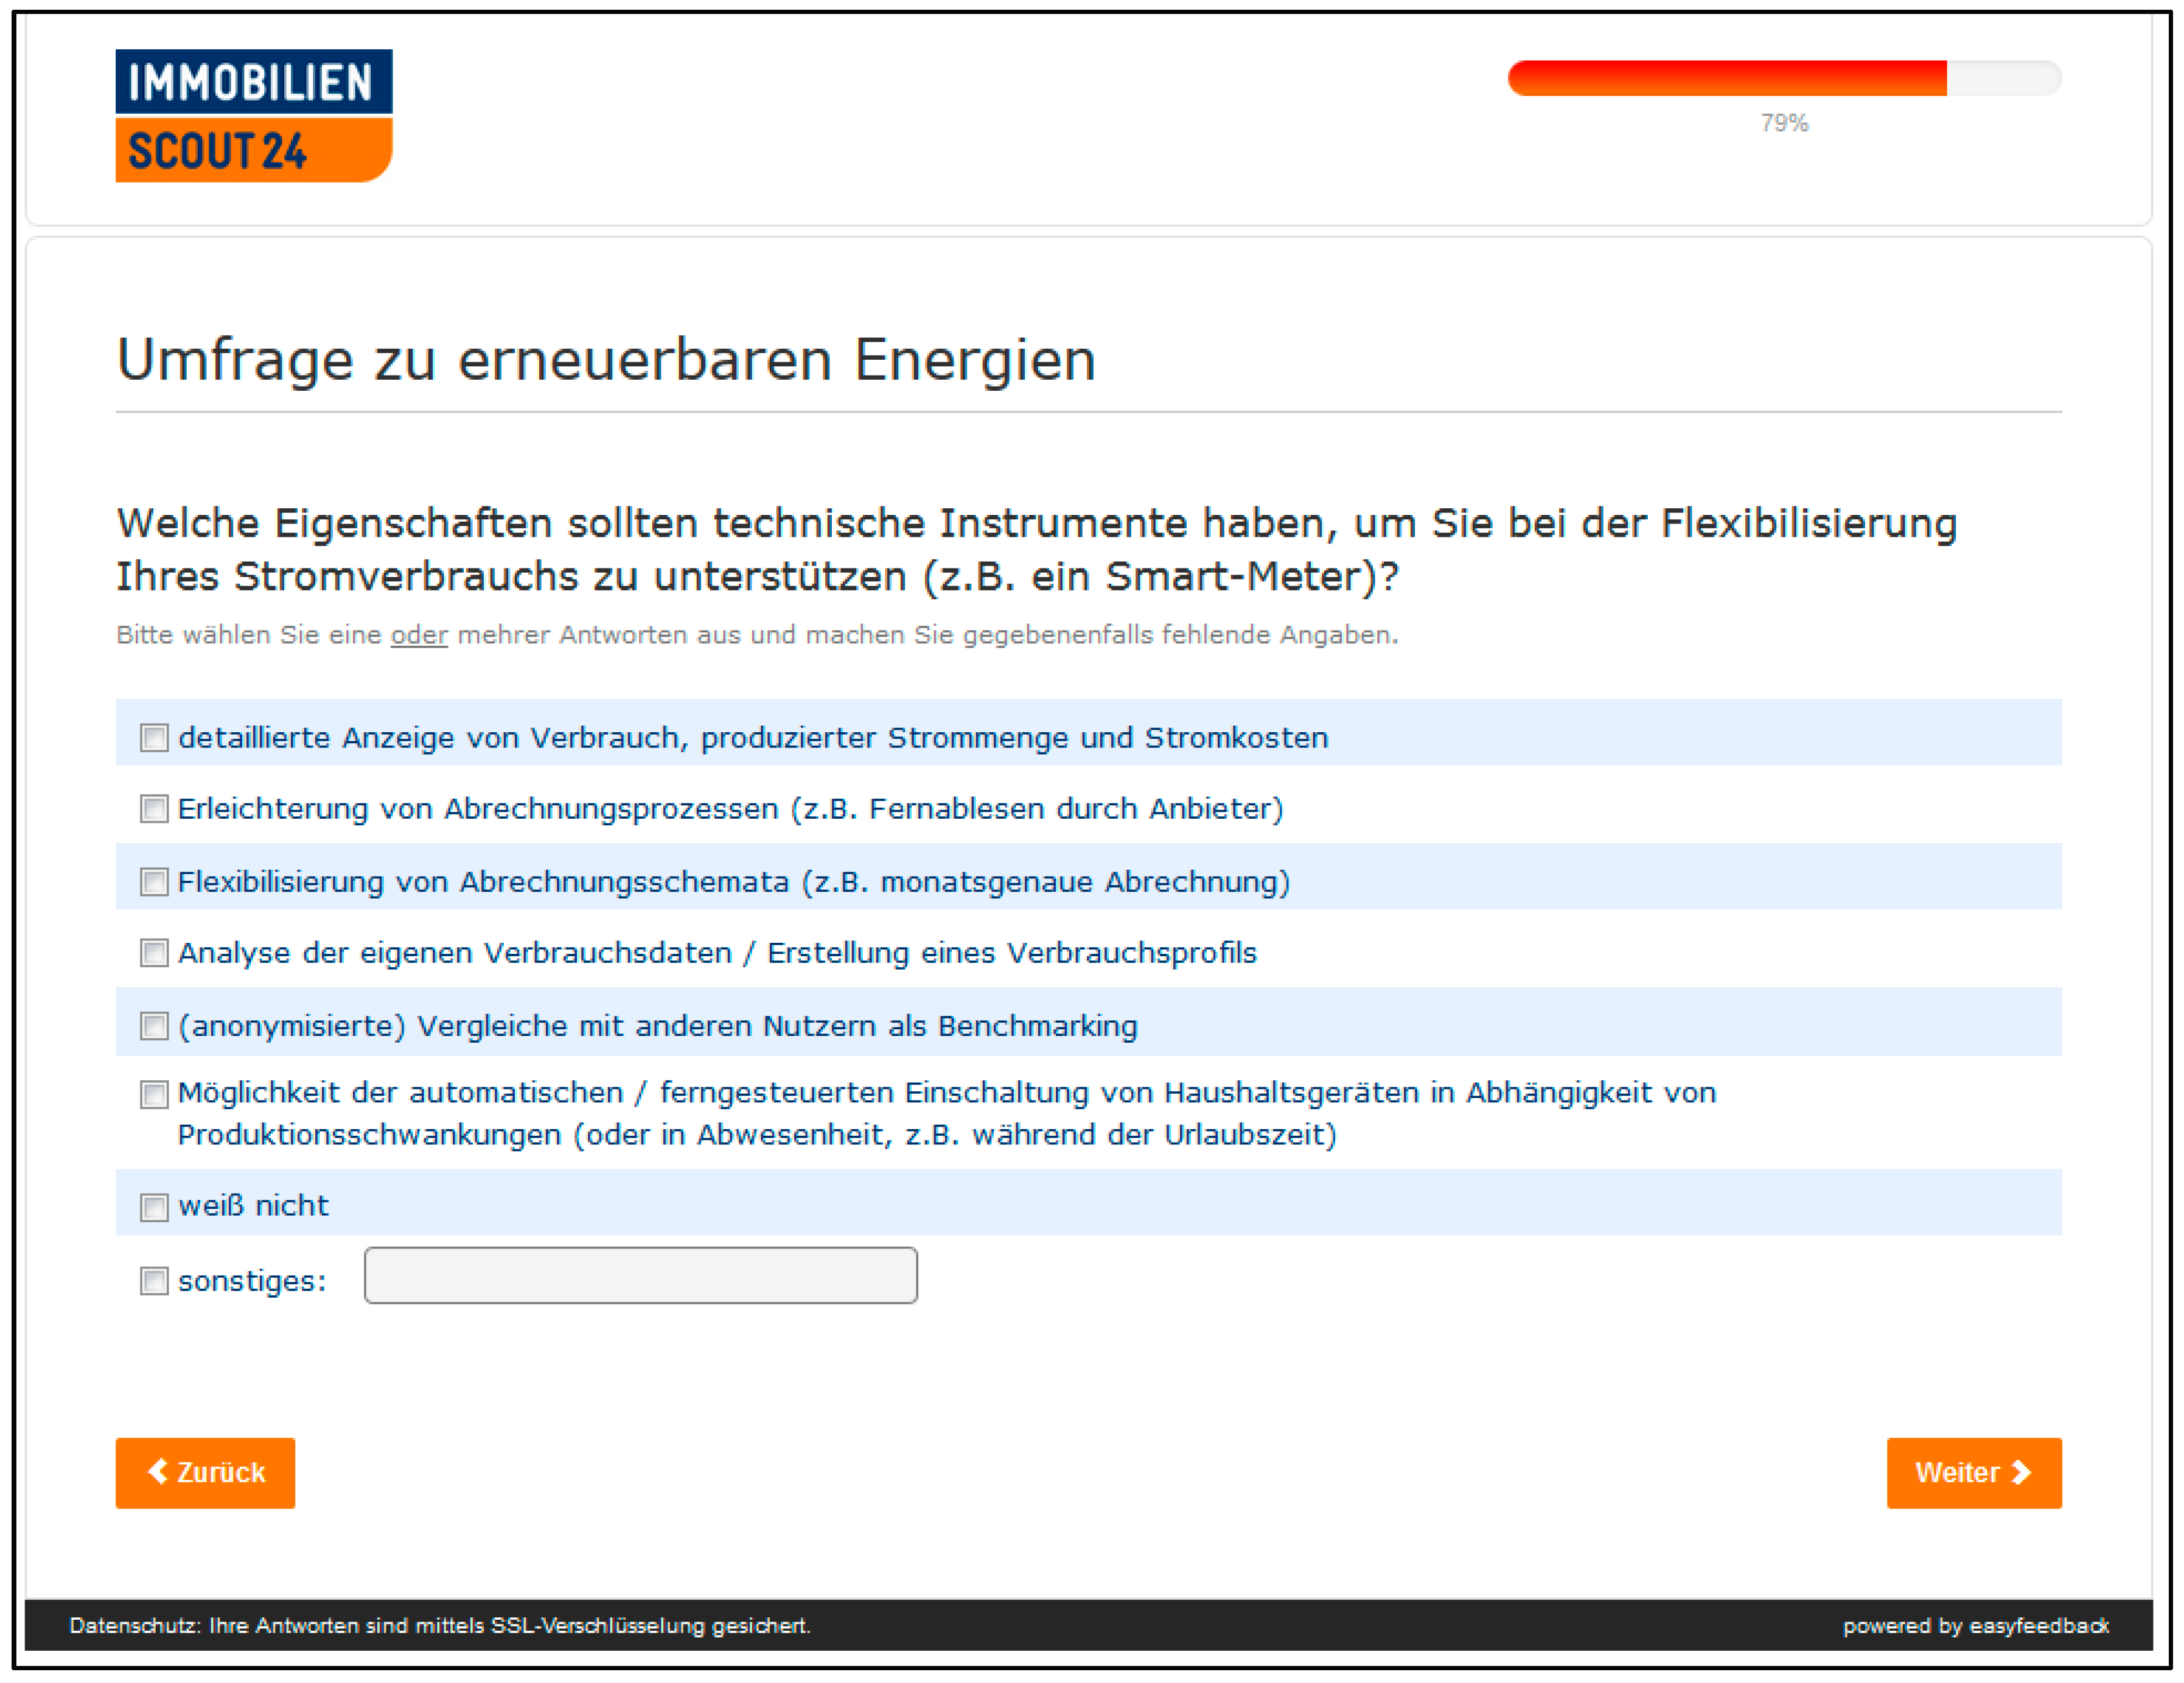
What characteristics should technical instruments have to support you in making your electricity consumption more flexible (e.g., a smart meter)?
Please select one or more answers and fill in any missing information.
  • Detailed display of consumption, amount of electricity produced and electricity costs
  • Facilitation of billing processes (e.g., remote reading by suppliers)
  • Flexibilization of billing schemes (e.g., monthly billing)
  • Analysis of own consumption data/creation of a consumption profile
  • (Anonymised comparisons with other users as benchmarking)
  • Possibility of automatic/remote controlled switching on of household appliances depending on production fluctuations (or in absence, e.g., during vacation time)
  • I do not know
  • Other:
Figure A17. Original questionnaire: screenshot 16.
Sustainability 13 09028 g0a17
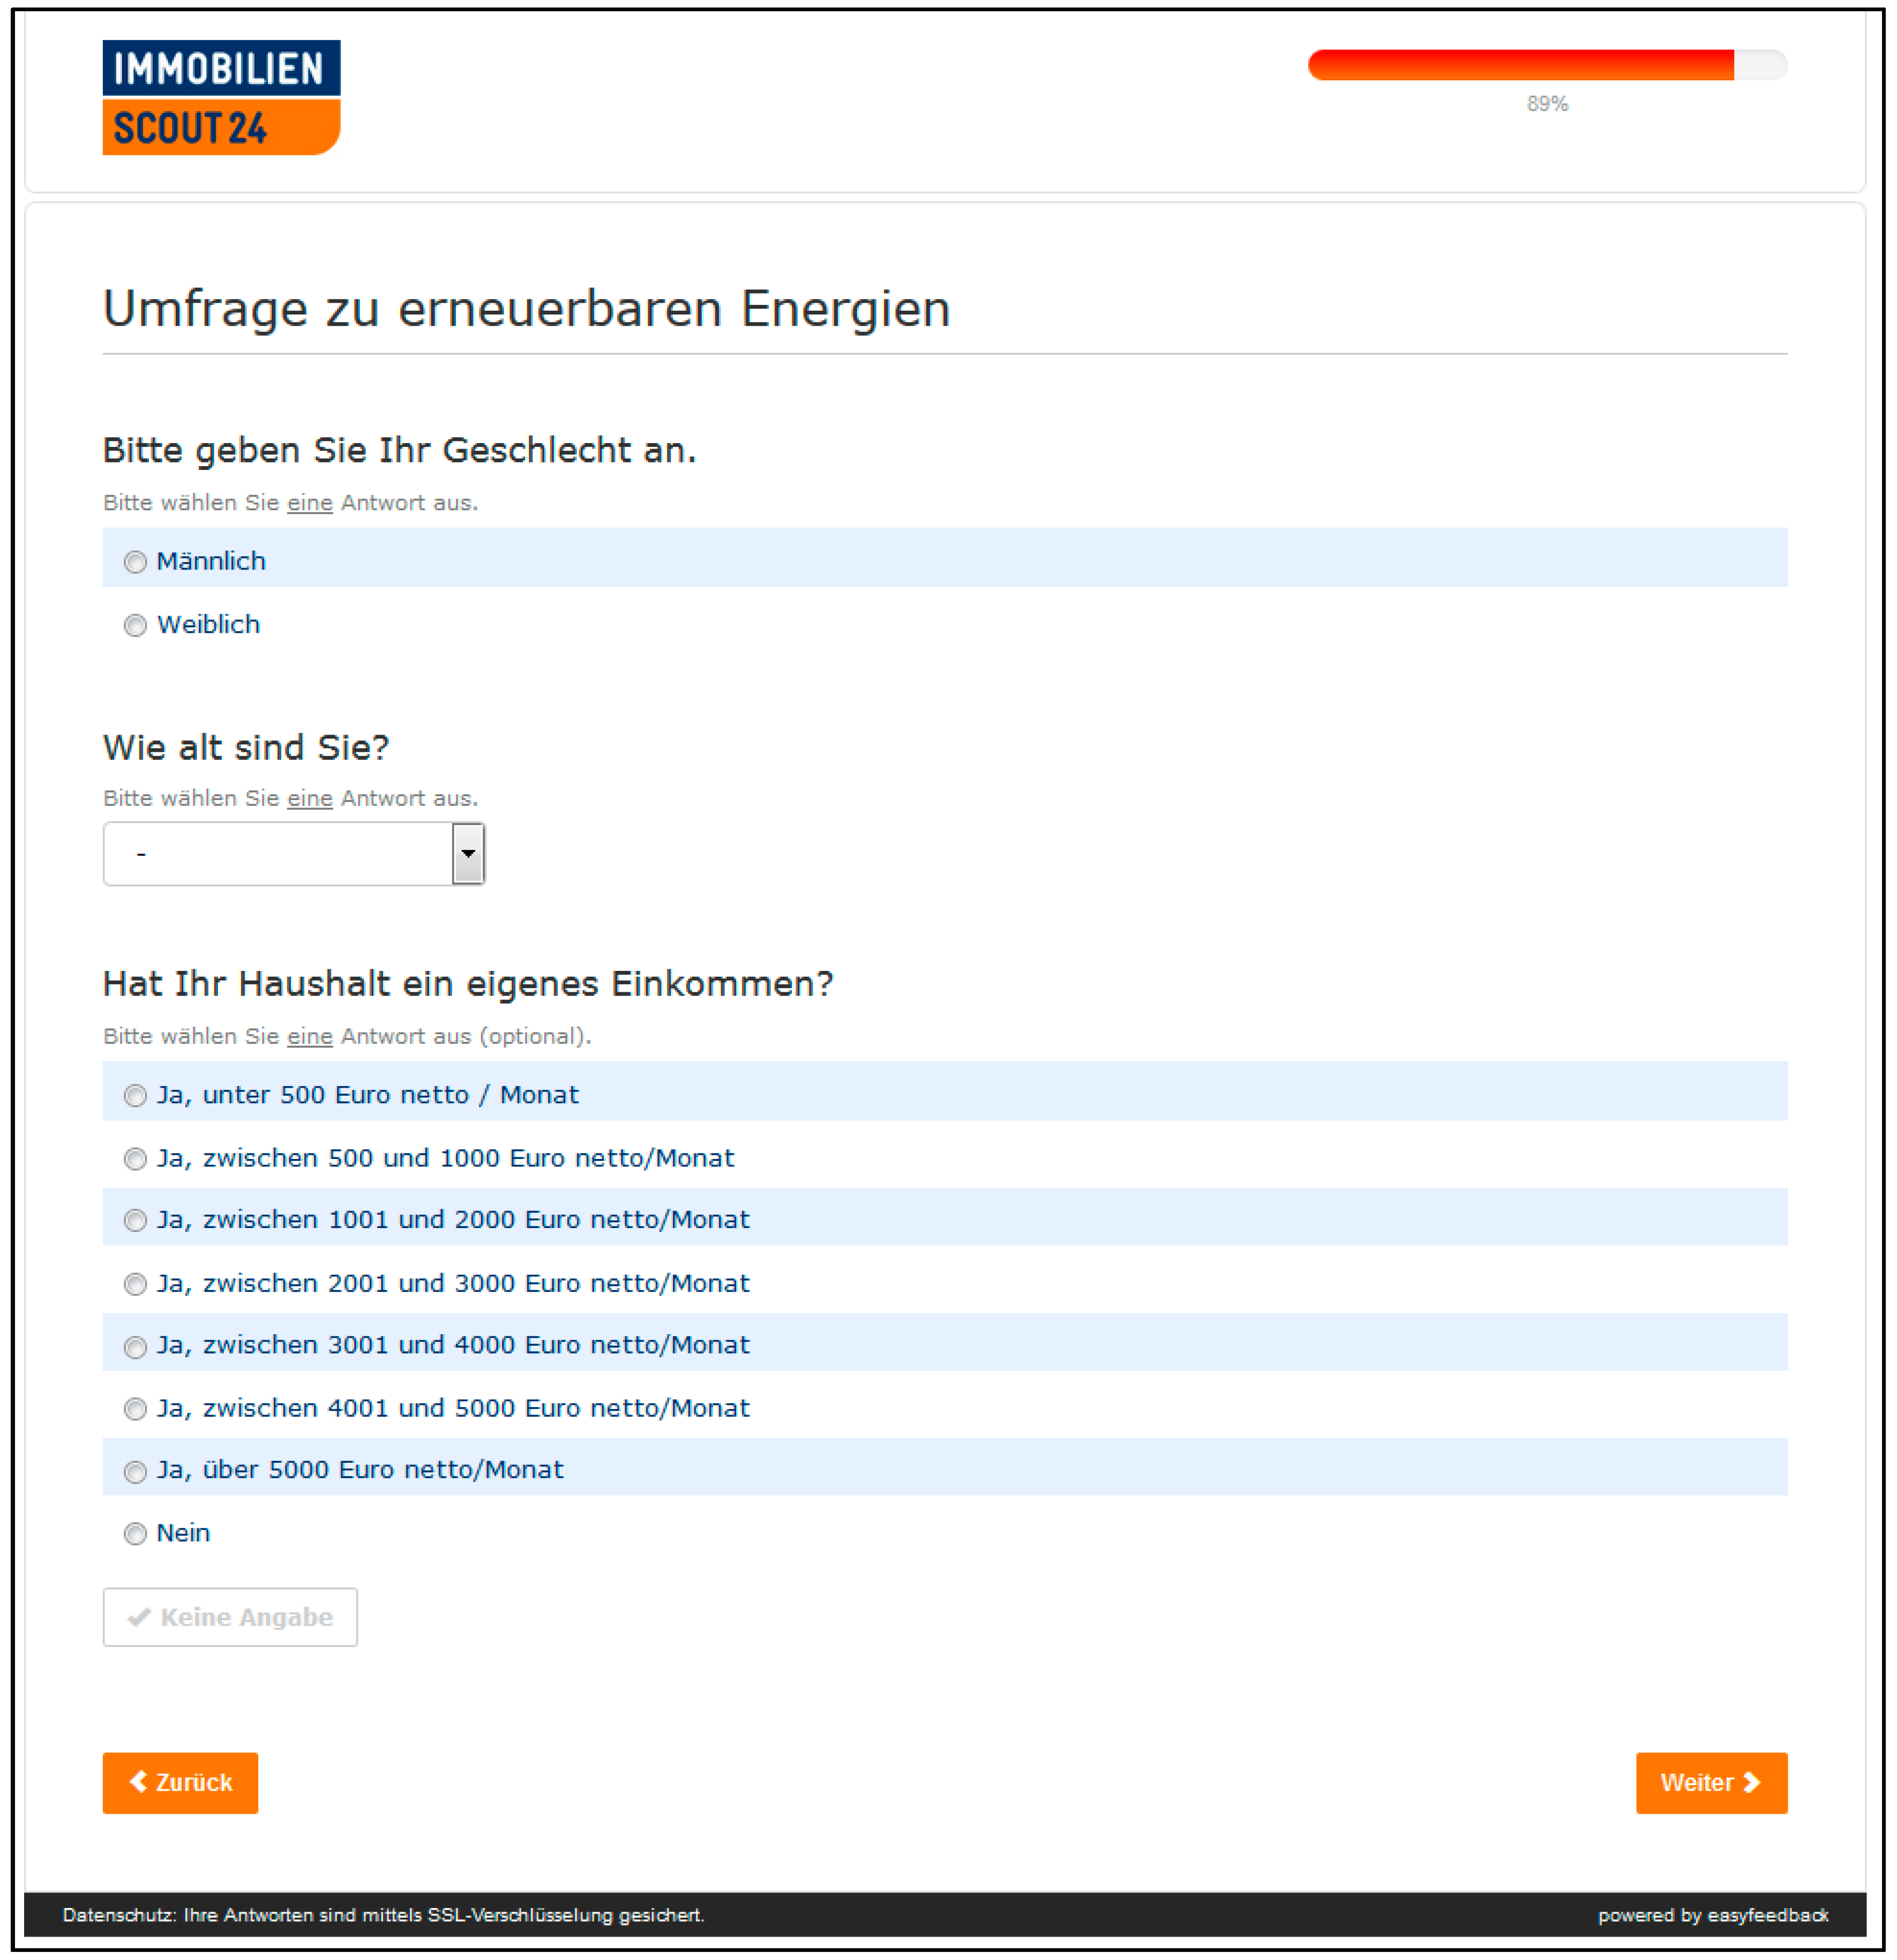
Please indicate your gender.
Please select a single answer choice.
  • Male
  • Female
How old are you?
Please select a single answer choice.
Does your household have its own income?
Please select a single answer choice (optional).
  • Yes under 500 euro/month
  • Yes between 500 and 1000 euro net/month
  • Yes between 1001 and 2000 euro net/month
  • Yes between 2001 and 3000 euro net/month
  • Yes between 3001 and 4000 euro net/month
  • Yes between 4001 and 5000 euro net/month
  • Yes over 5000 euro net/month
  • No
  • Prefer not to say
Figure A18. Original questionnaire: screenshot 17.
Sustainability 13 09028 g0a18
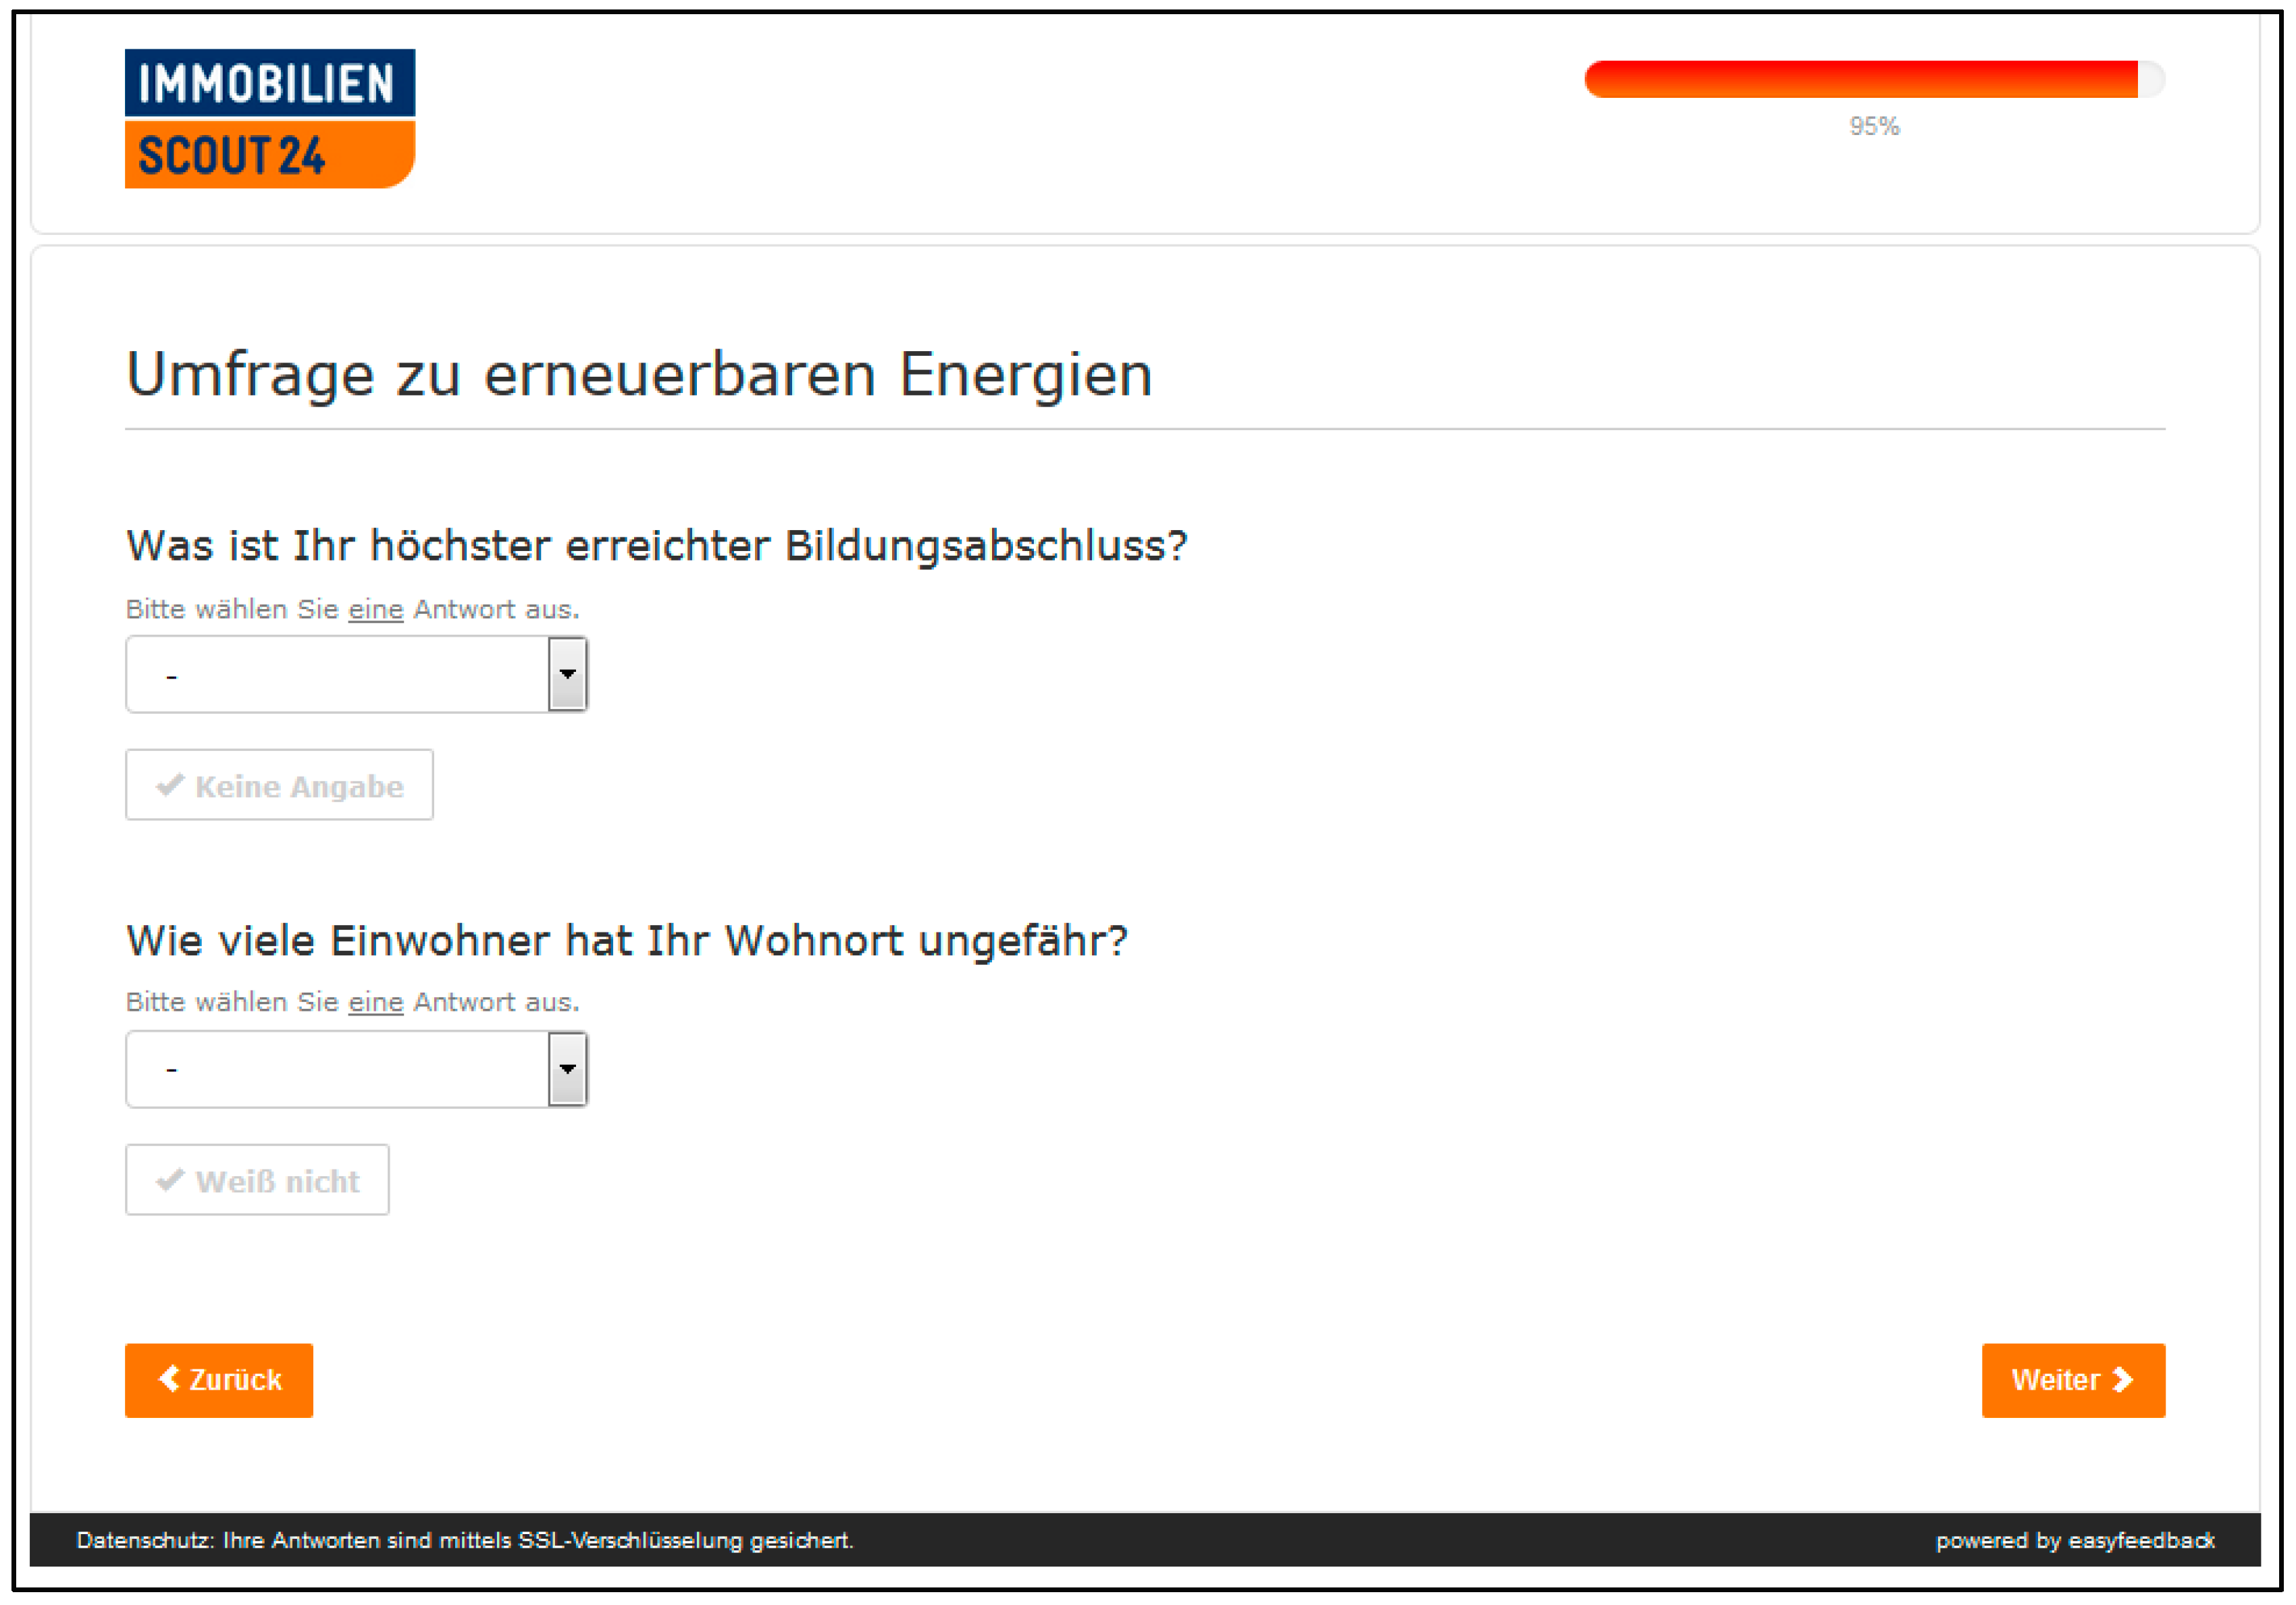
What is your highest educational attainment?
Please select a single answer choice.
Prefer not to say
Approximately how many inhabitants does your place of residence have?
Please select a single answer choice.
Do not know.
Figure A19. Original questionnaire: screenshot 18.
Sustainability 13 09028 g0a19
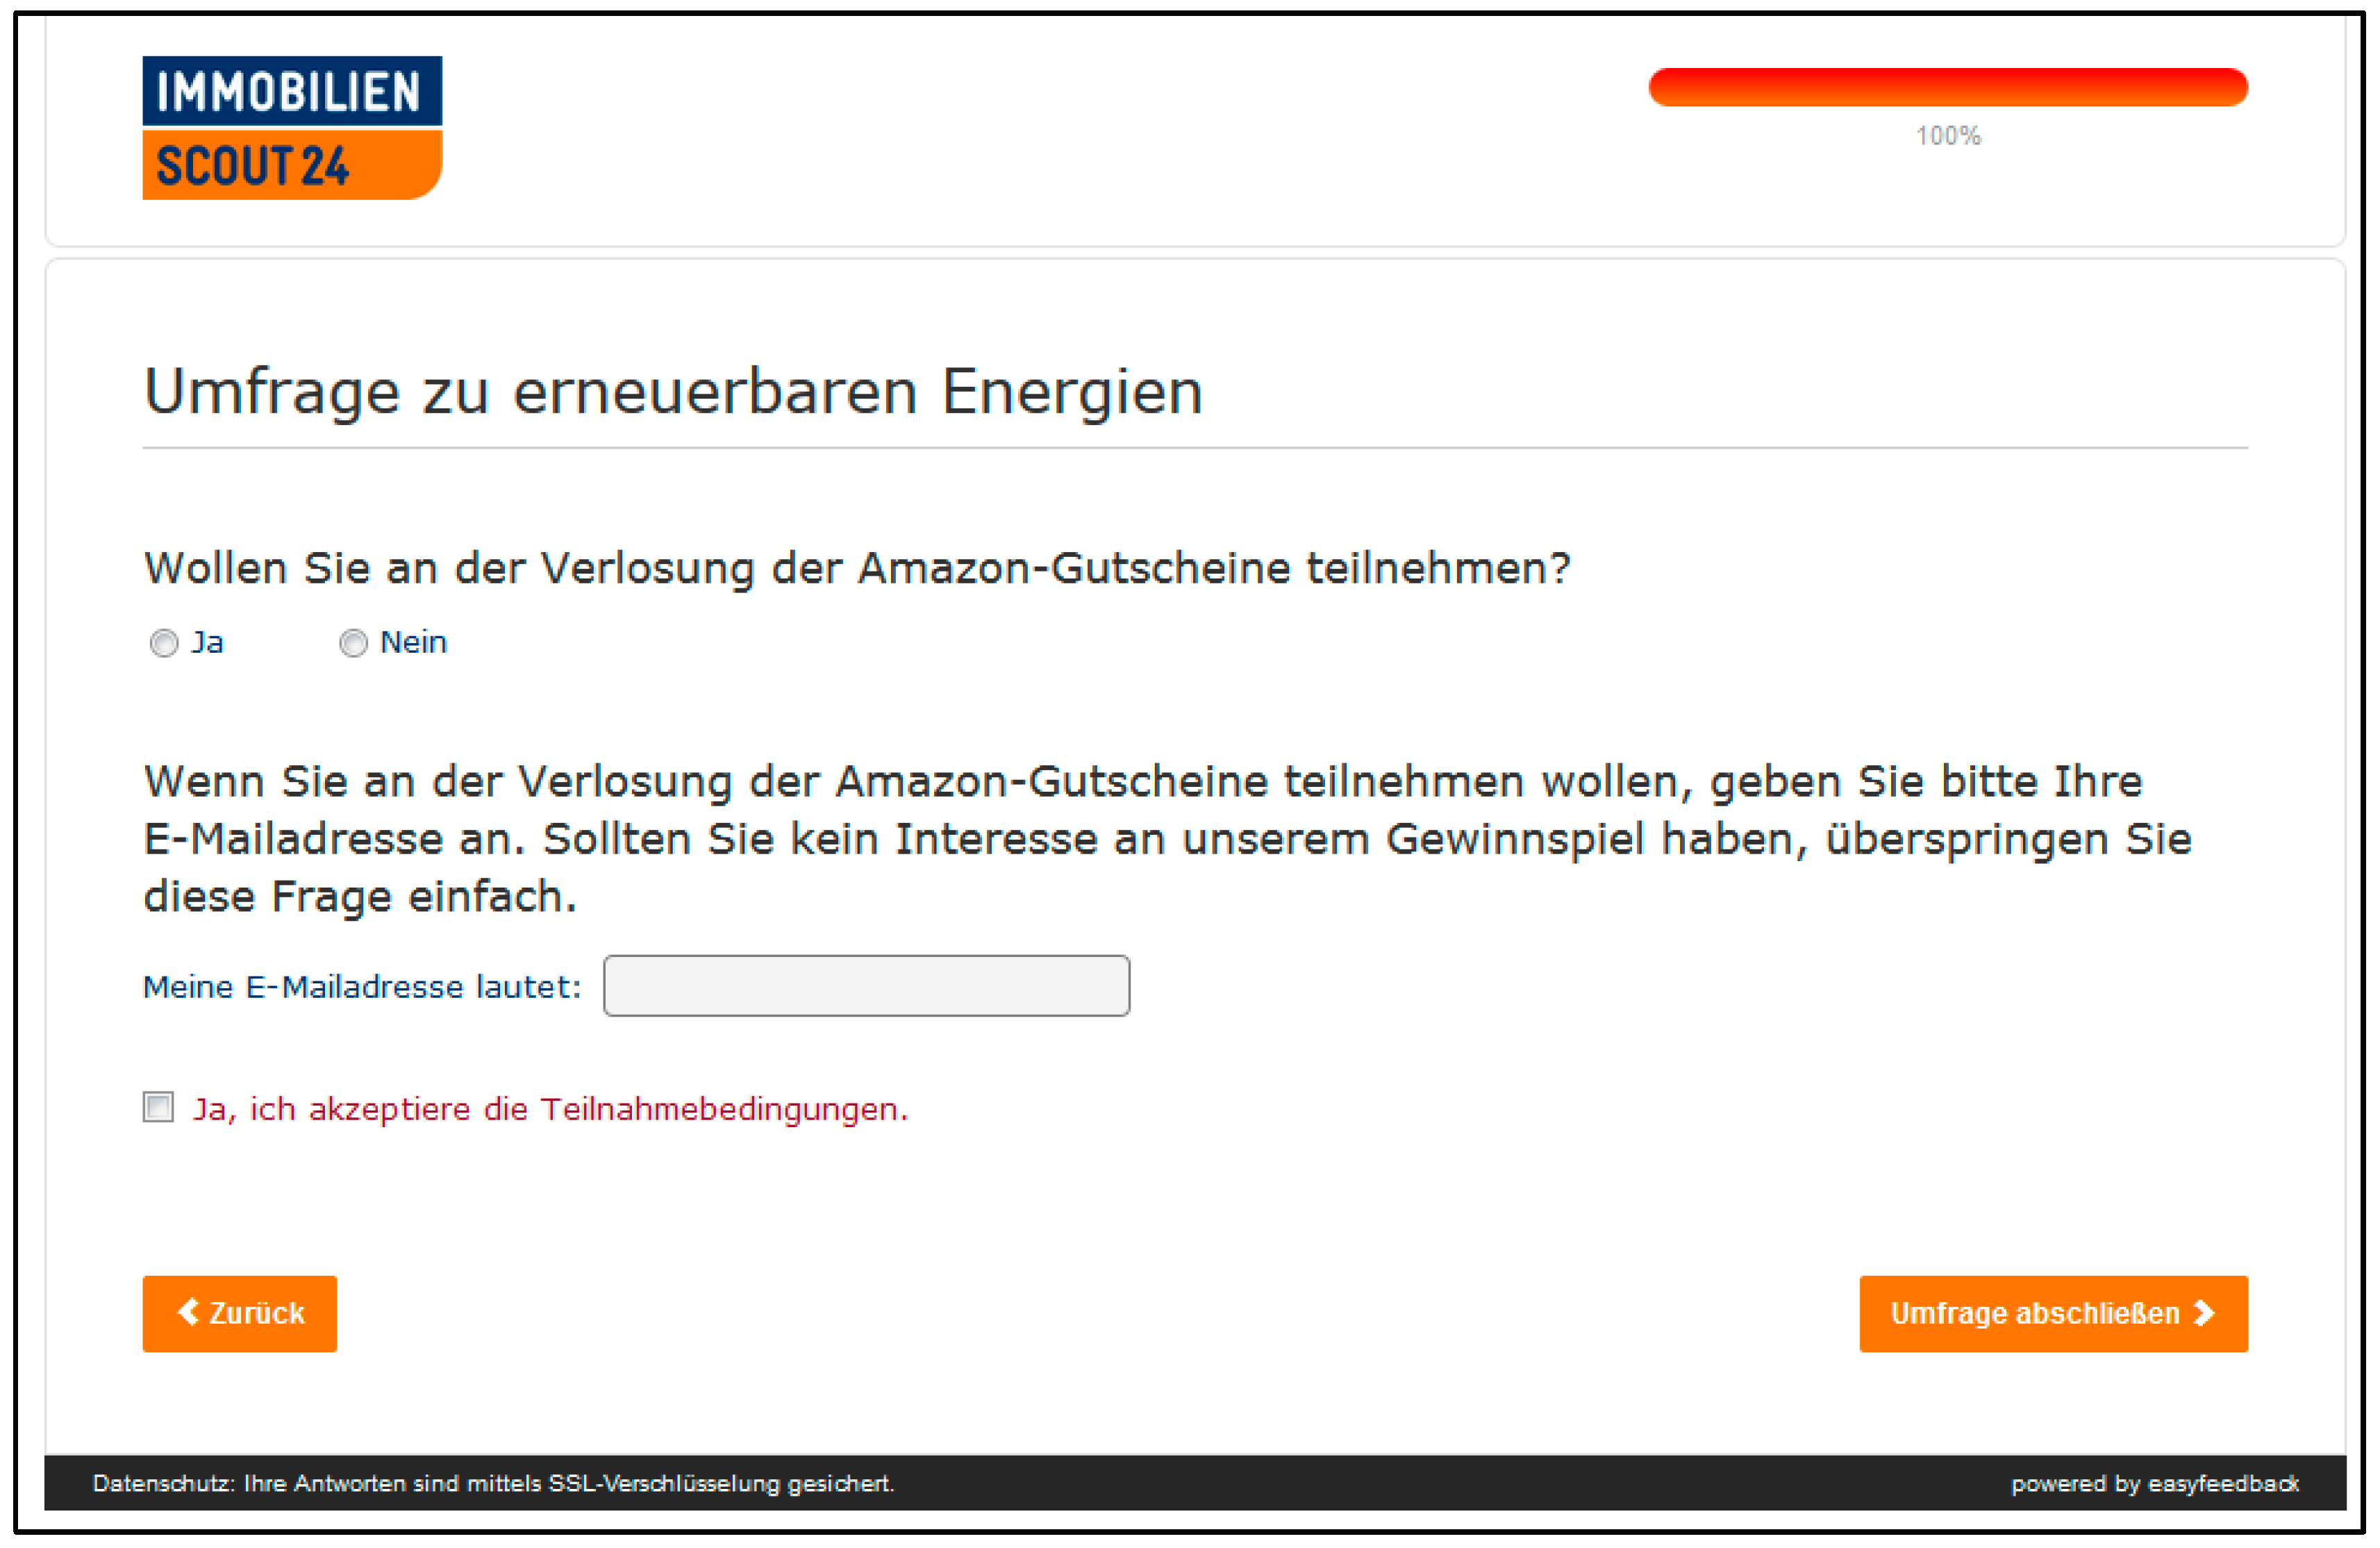
Do you want to participate in the raffle of Amazon vouchers?
  • Yes
  • No
If you want to participate in the raffle of the Amazon vouchers, please enter your e-mail address. If you are not interested in our raffle, simply skip this question.
My e-mail address is:
Yes, I accept the conditions of participation.
Figure A20. Original questionnaire: screenshot 19.
Sustainability 13 09028 g0a20
Thank you for your participation!
You have successfully completed the survey.
You can close the browser window now.

Appendix D. Data Summary

Table A2. Depiction of summarised data used to produce results (source: authors’ own calculations).
VariableObsMeanStd.Dev.MinMax
participation20741.8730.33312
usage2641.6930.82313
group20740.1430.403
age19784.6161.41617
income18554.6981.6118
education19343.561.47216
population19133.8321.62616
gender19540.4030.49101
df_household19943.4831.39115
df_electrical20063.0611.48115
df_transport17003.4391.48215

References

  1. Lavrijssen, S.; Carrillo Parra, A. Radical Prosumer Innovations in the Electricity Sector and the Impact on Prosumer Regulation. Sustainability 2017, 9, 1207. [Google Scholar] [CrossRef] [Green Version]
  2. Yildiz, Ö.; Gotchev, B.; Holstenkamp, L.; Müller, J.R.; Radtke, J.; Welle, L. Consumer (Co-)Ownership in Renewables in Germany. In Energy Transition; Lowitzsch, J., Ed.; Springer International Publishing: Cham, Switzerland, 2019; pp. 271–293. ISBN 978-3-319-93517-1. [Google Scholar]
  3. Rommel, J.; Radtke, J.; Jorck, G.; Mey, F.; Yildiz, Ö. Community renewable energy at a crossroads: A think piece on degrowth, technology, and the democratization of the German energy system. J. Clean. Prod. 2018, 197, 1746–1753. [Google Scholar] [CrossRef]
  4. Brummer, V. Community energy—Benefits and barriers: A comparative literature review of Community Energy in the UK, Germany and the USA, the benefits it provides for society and the barriers it faces. Renew. Sustain. Energy Rev. 2018, 94, 187–196. [Google Scholar] [CrossRef]
  5. Parra, D.; Norman, S.A.; Walker, G.S.; Gillott, M. Optimum community energy storage for renewable energy and demand load management. Appl. Energy 2017, 200, 358–369. [Google Scholar] [CrossRef]
  6. Yildiz, Ö.; Sagebiel, J. Consumer (Co-)Ownership and Behaviour: Economic Experiments as a Tool for Analysis. In Energy Transition; Lowitzsch, J., Ed.; Springer International Publishing: Cham, Switzerland, 2019; pp. 99–112. ISBN 978-3-319-93517-1. [Google Scholar]
  7. Berry, D. Delivering Energy Savings Through Community-Based Organizations. Electr. J. 2010, 23, 65–74. [Google Scholar] [CrossRef]
  8. Roth, L.; Lowitzsch, J.; Yildiz, Ö.; Hashani, A. Does (Co-)ownership in renewables matter for an electricity consumer’s demand flexibility? Empirical evidence from Germany. Energy Res. Soc. Sci. 2018, 46, 169–182. [Google Scholar] [CrossRef]
  9. Belmonte, S.; Escalante, K.N.; Franco, J. Shaping changes through participatory processes: Local development and renewable energy in rural habitats. Renew. Sustain. Energy Rev. 2015, 45, 278–289. [Google Scholar] [CrossRef]
  10. Molina, E.; Candelo-Becerra, J.E.; Ojeda-Camargo, E. Understanding Electricity Saving Behavior of Rural Indigenous Communities in La Guajira Department, Colombia. J. Eng. Sci. Technol. Rev. 2018, 11, 47–53. [Google Scholar] [CrossRef]
  11. Yildiz, Ö. Financing renewable energy infrastructures via financial citizen participation—The case of Germany. Renew. Energy 2014, 68, 677–685. [Google Scholar] [CrossRef]
  12. Saintier, S. Community Energy Companies in the UK: A Potential Model for Sustainable Development in “Local” Energy? Sustainability 2017, 9, 1325. [Google Scholar] [CrossRef] [Green Version]
  13. Yildiz, Ö.; Rommel, J.; Debor, S.; Holstenkamp, L.; Mey, F.; Müller, J.R.; Radtke, J.; Rognli, J. Renewable energy cooperatives as gatekeepers or facilitators? Recent developments in Germany and a multidisciplinary research agenda. Energy Res. Soc. Sci. 2015, 6, 59–73. [Google Scholar] [CrossRef]
  14. Han, X.; Wei, C. Household energy consumption: State of the art, research gaps, and future prospects. Env. Dev. Sustain. 2021, 23, 12479–12504. [Google Scholar] [CrossRef]
  15. Wittmann, N.; Yildiz, Ö. A microeconomic analysis of decentralized small scale biomass based CHP plants—The case of Germany. Energy Policy 2013, 63, 123–129. [Google Scholar] [CrossRef]
  16. Szarka, N.; Scholwin, F.; Trommler, M.; Fabian Jacobi, H.; Eichhorn, M.; Ortwein, A.; Thrän, D. A novel role for bioenergy: A flexible, demand-oriented power supply. Energy 2013, 61, 18–26. [Google Scholar] [CrossRef]
  17. Schreiber, M.; Wainstein, M.E.; Hochloff, P.; Dargaville, R. Flexible electricity tariffs: Power and energy price signals designed for a smarter grid. Energy 2015, 93, 2568–2581. [Google Scholar] [CrossRef]
  18. Stelmach, G.; Zanocco, C.; Flora, J.; Rajagopal, R.; Boudet, H.S. Exploring household energy rules and activities during peak demand to better determine potential responsiveness to time-of-use pricing. Energy Policy 2020, 144, 111608. [Google Scholar] [CrossRef]
  19. Öhrlund, I.; Linné, Å.; Bartusch, C. Convenience before coins: Household responses to dual dynamic price signals and energy feedback in Sweden. Energy Res. Soc. Sci. 2019, 52, 236–246. [Google Scholar] [CrossRef]
  20. Wang, F.; Liu, L.; Yu, Y.; Li, G.; Li, J.; Shafie-khah, M.; Catalão, J. Impact Analysis of Customized Feedback Interventions on Residential Electricity Load Consumption Behavior for Demand Response. Energies 2018, 11, 770. [Google Scholar] [CrossRef] [Green Version]
  21. Nilsson, A.; Lazarevic, D.; Brandt, N.; Kordas, O. Household responsiveness to residential demand response strategies: Results and policy implications from a Swedish field study. Energy Policy 2018, 122, 273–286. [Google Scholar] [CrossRef]
  22. Bauwens, T.; Eyre, N. Exploring the links between community-based governance and sustainable energy use: Quantitative evidence from Flanders. Ecol. Econ. 2017, 137, 163–172. [Google Scholar] [CrossRef]
  23. Kubli, M.; Loock, M.; Wüstenhagen, R. The flexible prosumer: Measuring the willingness to co-create distributed flexibility. Energy Policy 2018, 114, 540–548. [Google Scholar] [CrossRef]
  24. Goulden, M.; Bedwell, B.; Rennick-Egglestone, S.; Rodden, T.; Spence, A. Smart grids, smart users? The role of the user in demand side management. Energy Res. Soc. Sci. 2014, 2, 21–29. [Google Scholar] [CrossRef]
  25. Heiskanen, E.; Johnson, M.; Robinson, S.; Vadovics, E.; Saastamoinen, M. Low-carbon communities as a context for individual behavioural change. Energy Policy 2010, 38, 7586–7595. [Google Scholar] [CrossRef]
  26. Schuitema, G.; Ryan, L.; Aravena, C. The Consumer’s Role in Flexible Energy Systems: An Interdisciplinary Approach to Changing Consumers’ Behavior. IEEE Power Energy Mag. 2017, 15, 53–60. [Google Scholar] [CrossRef]
  27. Gregg, J.S.; Nyborg, S.; Hansen, M.; Schwanitz, V.J.; Wierling, A.; Zeiss, J.P.; Delvaux, S.; Saenz, V.; Polo-Alvarez, L.; Candelise, C.; et al. Collective Action and Social Innovation in the Energy Sector: A Mobilization Model Perspective. Energies 2020, 13, 651. [Google Scholar] [CrossRef] [Green Version]
  28. Middlemiss, L.; Parrish, B.D. Building capacity for low-carbon communities: The role of grassroots initiatives. Energy Policy 2010, 38, 7559–7566. [Google Scholar] [CrossRef]
  29. Zhou, S.; Brown, M.A. Smart meter deployment in Europe: A comparative case study on the impacts of national policy schemes. J. Clean. Prod. 2017, 144, 22–32. [Google Scholar] [CrossRef]
  30. Lucas, H.; Carbajo, R.; Machiba, T.; Zhukov, E.; Cabeza, L.F. Improving Public Attitude towards Renewable Energy. Energies 2021, 14, 4521. [Google Scholar] [CrossRef]
  31. Lowitzsch, J. The Consumer at the Heart of the Energy Markets? In Energy Transition; Lowitzsch, J., Ed.; Springer International Publishing: Cham, Switzerland, 2019; pp. 59–77. ISBN 978-3-319-93517-1. [Google Scholar]
  32. Guo, P.; Li, V.O.; Lam, J.C. Smart demand response in China: Challenges and drivers. Energy Policy 2017, 107, 1–10. [Google Scholar] [CrossRef]
  33. Mucha-Kuś, K.; Sołtysik, M.; Zamasz, K.; Szczepańska-Woszczyna, K. Coopetitive Nature of Energy Communities—The Energy Transition Context. Energies 2021, 14, 931. [Google Scholar] [CrossRef]
  34. Fischer, D.; Surmann, A.; Biener, W.; Selinger-Lutz, O. From residential electric load profiles to flexibility profiles—A stochastic bottom-up approach. Energy Build. 2020, 224, 110133. [Google Scholar] [CrossRef]
  35. Jacobsson, S.; Johnson, A. The diffusion of renewable energy technology: An analytical framework and key issues for research. Energy Policy 2000, 28, 625–640. [Google Scholar] [CrossRef] [Green Version]
  36. Roth, L.; Lowitzsch, J.; Yildiz, Ö. An Empirical Study of How Household Energy Consumption Is Affected by Co-Owning Different Technological Means to Produce Renewable Energy and the Production Purpose. Energies 2021, 14, 3996. [Google Scholar] [CrossRef]
  37. Johnson-Webb, K.D.; Baer, L.D.; Gesler, W.M. What is rural? Issues and considerations. J. Rural Health 1997, 13, 253–256. [Google Scholar] [CrossRef] [PubMed]
  38. Roca, J.; Arellano, B. Defining urban and rural areas: A new approach. In Remote Sensing Technologies and Applications in Urban Environments II; Heldens, W., Chrysoulakis, N., Erbertseder, T., Zhang, Y., Eds.; SPIE Press: Warsaw, Poland, 2017; p. 18. ISBN 9781510613263. [Google Scholar]
  39. Pateman, T. Rural and urban areas: Comparing lives using rural/urban classifications. Reg. Trends 2011, 43, 11–86. [Google Scholar] [CrossRef] [Green Version]
  40. Beynon, M.J.; Crawley, A.; Munday, M. Measuring and understanding the differences between urban and rural areas. Environ. Plan. B Plan. Des. 2016, 43, 1136–1154. [Google Scholar] [CrossRef]
  41. Öğdül, H.G. Urban and Rural Definitions in Regional Context: A Case Study on Turkey. Eur. Plan. Stud. 2010, 18, 1519–1541. [Google Scholar] [CrossRef]
  42. Hall, S.A.; Kaufman, J.S.; Ricketts, T.C. Defining urban and rural areas in U.S. epidemiologic studies. J. Urban Health 2006, 83, 162–175. [Google Scholar] [CrossRef] [PubMed] [Green Version]
  43. Lang, M. Redefining Urban and Rural for the U.S. Census of Population: Assessing the Need and Alternative Approaches. Urban Geogr. 1986, 7, 118–134. [Google Scholar] [CrossRef]
  44. Zasada, I.; Loibl, W.; Berges, R.; Steinnocher, K.; Köstl, M.; Piorr, A.; Werner, A. Rural–Urban Regions: A Spatial Approach to Define Urban–Rural Relationships in Europe. In Peri-Urban Futures: Scenarios and Models for Land Use Change in Europe; Nilsson, K., Pauleit, S., Bell, S., Aalbers, C., Sick Nielsen, T.A., Eds.; Springer: Berlin/Heidelberg, Germany, 2013; pp. 45–68. ISBN 978-3-642-30528-3. [Google Scholar]
  45. Fikfak, A.; Kosanović, S.; Konjar, M.; Anguillari, E. Sustainability and Resilience Socio-Ppatial Perspective; TU Delft Open: Delft, The Netherlands, 2018; ISBN 978-94-6366-030-3. [Google Scholar]
  46. Statistical Office of the European Union. Degree of Urbanisation (DEGURBA). Available online: https://ec.europa.eu/eurostat/en/web/degree-of-urbanisation/background (accessed on 10 June 2021).
  47. OECD. Applying the Degree of Urbanisation; OECD Publishing: Luxembourg, 2021; ISBN 978-92-76-20306-3. [Google Scholar]
  48. Poggi, F.; Firmino, A.; Amado, M. Planning renewable energy in rural areas: Impacts on occupation and land use. Energy 2018, 155, 630–640. [Google Scholar] [CrossRef]
  49. Fadly, D.; Fontes, F. Geographical proximity and renewable energy diffusion: An empirical approach. Energy Policy 2019, 129, 422–435. [Google Scholar] [CrossRef]
  50. Immobilien Scout GmbH. Unternehmen. Available online: http://www.immobilienscout24.de/unternehmen/immobilienscout24.html (accessed on 14 April 2020).
  51. Burns, A.C.; Bush, R.F.; Sinha, N. Marketing Research; International edition; Pearson: Boston, MA, USA, 2014; ISBN 9780273785125. [Google Scholar]
  52. Firth, S.; Lomas, K.; Wright, A.; Wall, R. Identifying trends in the use of domestic appliances from household electricity consumption measurements. Energy Build. 2008, 40, 926–936. [Google Scholar] [CrossRef] [Green Version]
  53. Naus, J.; van Vliet, B.J.; Hendriksen, A. Households as change agents in a Dutch smart energy transition: On power, privacy and participation. Energy Res. Soc. Sci. 2015, 9, 125–136. [Google Scholar] [CrossRef]
  54. Moser, C. The role of perceived control over appliances in the acceptance of electricity load-shifting programmes. Energy Effic. 2017, 10, 1115–1127. [Google Scholar] [CrossRef]
  55. Pallonetto, F.; Oxizidis, S.; Milano, F.; Finn, D. The effect of time-of-use tariffs on the demand response flexibility of an all-electric smart-grid-ready dwelling. Energy Build. 2016, 128, 56–67. [Google Scholar] [CrossRef]
  56. Dugoff, E.H.; Schuler, M.; Stuart, E.A. Generalizing observational study results: Applying propensity score methods to complex surveys. Health Serv. Res. 2014, 49, 284–303. [Google Scholar] [CrossRef] [PubMed]
  57. Valliant, R.; Dever, J.A. Estimating Propensity Adjustments for Volunteer Web Surveys. Sociol. Methods Res. 2011, 40, 105–137. [Google Scholar] [CrossRef]
  58. Schonlau, M.; Couper, M.P. Options for Conducting Web Surveys. Statist. Sci. 2017, 32, 279–292. [Google Scholar] [CrossRef]
  59. Frippiat, D.; Marquis, N.; Wiles-Portier, E. Web Surveys in the Social Sciences: An Overview. Population 2010, 65, 285. [Google Scholar] [CrossRef]
  60. Austin, P.C.; Jembere, N.; Chiu, M. Propensity score matching and complex surveys. Stat. Methods Med. Res. 2018, 27, 1240–1257. [Google Scholar] [CrossRef]
  61. Rosenbaum, P.R.; Rubin, D.B. Constructing a Control Group Using Multivariate Matched Sampling Methods That Incorporate the Propensity Score. Am. Stat. 1985, 39, 33–38. [Google Scholar]
  62. Dorofeev, S.; Grant, P. Statistics for Real-Life Sample Surveys; Cambridge University Press: Cambridge, MA, USA, 2006; ISBN 9780511543265. [Google Scholar]
  63. Sue, V.; Ritter, L. Conducting Online Surveys; SAGE Publications, Inc.: Thousand Oaks, CA, USA, 2012; ISBN 9781412992251. [Google Scholar]
  64. Blasius, J.; Brandt, M. Representativeness in Online Surveys through Stratified Samples. Bull. Sociol. Methodol. Bull. Méthodologie Sociol. 2010, 107, 5–21. [Google Scholar] [CrossRef]
  65. Neukrug, E.; Fawcett, R.C. Essentials of Testing and Assessment: A Practical Guide to Counselors, Social Workers, and Psychologists, 3rd ed.; Cengage Learning: Stanford, CT, USA, 2015; ISBN 1-285-45424-3. [Google Scholar]
  66. Desgagné, A.; Castilloux, A.-M.; Angers, J.-F.; Le Lorier, J. The Use of the Bootstrap Statistical Method for the Pharmacoeconomic Cost Analysis of Skewed Data. Pharmacoeconomics 1998, 13, 487–497. [Google Scholar] [CrossRef] [PubMed]
  67. Diebold, F.X.; Chen, C. Testing structural stability with endogenous breakpoint: A size comparison of analytic and bootstrap procedures. J. Econom. 1996, 70, 221–241. [Google Scholar] [CrossRef]
  68. Hall, P.; Horowitz, J.L. Bootstrap Critical Values for Tests Based on Generalized-Method-of-Moments Estimators. Econometrica 1996, 64, 891. [Google Scholar] [CrossRef]
  69. Bauwens, T. Explaining the diversity of motivations behind community renewable energy. Energy Policy 2016, 93, 278–290. [Google Scholar] [CrossRef]
  70. Torabi Moghadam, S.; Di Nicoli, M.V.; Manzo, S.; Lombardi, P. Mainstreaming Energy Communities in the Transition to a Low-Carbon Future: A Methodological Approach. Energies 2020, 13, 1597. [Google Scholar] [CrossRef] [Green Version]
  71. Sidqi, Y.; Ferrez, P.; Gabioud, D.; Roduit, P. Flexibility quantification in households: A swiss case study. Energy Inf. 2020, 3, 1–11. [Google Scholar] [CrossRef]
  72. Handgraaf, M.; Griffioen, A.; Bolderdijk, J.W.; Thøgersen, J. Economic Psychology and Pro-Environmental Behaviour. In Economic Psychology; Ranyard, R., Ed.; John Wiley & Sons, Ltd.: Chichester, UK, 2017; pp. 435–450. ISBN 9781118926352. [Google Scholar]
  73. Xu, L.; Zhang, X.; Ling, M. Pro-environmental spillover under environmental appeals and monetary incentives: Evidence from an intervention study on household waste separation. J. Environ. Psychol. 2018, 60, 27–33. [Google Scholar] [CrossRef]
  74. Zimmerman, D.W. Inflation of Type I Error Rates by Unequal Variances Associated with Parametric, Nonparametric, and Rank-Transformation Tests. Psicológica 2004, 25, 103–133. [Google Scholar]
  75. Hesterberg, T. Bootstrap Methods and Permutation Tests; W.H. Freeman and Company: New York, NY, USA, 2003. [Google Scholar]
  76. Manly, B.F.J. Randomization, Bootstrap and Monte Carlo Methods in Biology, 3rd ed.; Chapman & Hall/CRC: Boca Raton, FL, USA, 2007; ISBN 9781584885412. [Google Scholar]
Table 1. Demand flexibility comparisons of “rurals are more willing than urbans” (source: authors’ own calculations).
DimensionGroupOBSMeanATTt-Valuep-Value
Usage of household appliancesTreated8233.5740.0951.2630.103
Controls9023.479
Charging electrical appliancesTreated8233.1540.1151.4090.080
Controls9133.039
Charging electrical means of transportationTreated8233.5340.0981.1360.128
Controls7853.436
Table 2. Demand flexibility comparisons of “rural-owners are more willing than urban-owners” (source: authors’ own calculations).
DimensionGroupOBSMeanATTt-Valuep-Value
Usage of household appliancesTreated1403.8210.527 **1.8990.029
Controls793.293
Charging electrical appliancesTreated1403.2450.3941.4740.071
Controls802.851
Charging electrical means of transportationTreated1403.6070.0370.1340.447
Controls683.570
Note: *’s denote statistical significance levels (*** 1 percent; ** 5 percent).
Table 3. Demand flexibility comparisons of “rural-consumers are more willing than urban-consumers” (source: authors’ own calculations).
DimensionGroupOBSMeanATTt-Valuep-Value
Usage of household appliancesTreated663.7141.081 **2.2850.012
Controls262.633
Charging electrical appliancesTreated663.0280.782 **1.8320.035
Controls272.245
Charging electrical means of transportationTreated663.5380.7521.5150.067
Controls232.786
Note: *’s denote statistical significance levels (*** 1 percent; ** 5 percent).
Table 4. Demand flexibility comparisons of “rural-consumerSellers are more willing than urban-consumerSellers” (source: authors’ own calculations).
DimensionGroupOBSMeanATTt-Valuep-Value
Usage of household appliancesTreated374.0530.4740.5740.284
Controls113.579
Charging electrical appliancesTreated373.4120.7280.7290.235
Controls112.684
Charging electrical means of transportationTreated373.813−0.094−0.1280.449
Controls83.906
Table 5. Demand flexibility comparisons of “rural-sellers are more willing than urban-sellers” (source: authors’ own calculations).
DimensionGroupOBSMeanATTt-Valuep-Value
Usage of household appliancesTreated374.0670.0460.0690.473
Controls154.021
Charging electrical appliancesTreated373.200−0.071−0.1310.448
Controls153.271
Charging electrical means of transportationTreated374.1820.3030.4710.320
Controls123.879
Table 6. Demand flexibility comparisons of “rural-solars are more willing than urban-solars” (source: authors’ own calculations).
DimensionGroupOBSMeanATTt-Valuep-Value
Usage of household appliancesTreated1183.7760.736 **2.0930.019
Controls573.040
Charging electrical appliancesTreated1183.0930.5361.5260.064
Controls572.558
Charging electrical means of transportationTreated1183.5000.3621.0340.151
Controls513.138
Note: *’s denote statistical significance levels (*** 1 percent; ** 5 percent).
Publisher’s Note: MDPI stays neutral with regard to jurisdictional claims in published maps and institutional affiliations.

