1. Introduction
In 2019, the worldwide estimated production of waste electrical and electronic equipment (WEEE) for the year 2021 was 52.2 million tons [
1,
2,
3]. However, by the end of that year, this estimative had already been exceeded, as approximately 53.3 million tons of electronic scrap were generated in 2019 [
4]. This waste production rate represents 3–5% of the total amount of waste generated in the world [
5,
6,
7], and only 20% of this waste is properly managed [
3,
8].
When analyzing the chemical composition of this type of residue, some devices stand out in the concentration of metals with high aggregate value, among which are small electronic devices, such as mobile phones, computers, and tablets, among others. [
9]. The metallic fraction presented in this type of equipment is between 40 to 50 times greater than those occurring in natural mineral deposits [
10,
11]. Moreover, such values of concentration could provide a significant lowering in energy consumption during extraction processes, in comparison with the mining, ore dressing, and chemical processing of concentrate alternatives, reducing its levels by 10 to 15% [
5,
12]. Therefore, the recycling of WEEE is seen as an alternative with great potential for future metallic extraction methods, particularly those associated with precious metals and copper [
10,
13,
14,
15]. Moreover, the use of this secondary source of metals may also reduce the emissions of greenhouse gas produced in extraction processes [
12], particularly for aluminum and copper, in which the decline in values could be, respectively, as high as 95 and 85% [
16,
17].
Considering the progressive relevance of electronic devices in modern society and the constant update and renewal of personal gadgets, it can be observed that the stockpile of WEEE is increasing, forming an urban occurrence comparable to those in mines in terms of accumulated mass [
18]. Through the exploitation of these, the demand for primary sources of metals can be reduced, and therefore, some of the environmental impacts from mining could be lowered. This reduction would have several positive effects on the overall condition of the environment, since some mining operations could be associated with the unsustainable use of natural resources, increasing health and social risks, such as chemical contamination and the collapse of dams [
11,
12,
17,
19]. This is particularly special considering that mining is an activity majorly conducted in areas consisting of vulnerable populations, such as least developed and developing countries.
In this context, Brazil is the second largest producer of electronic waste in the Americas, having increased its generation by more than 100% in 2016, which was around 900 thousand tons [
20,
21] to more than 2 million tons in 2019 [
4], and is a location vulnerable to E-waste dumping [
11]. However, more than 90% of all WEEE is still not treated properly, mainly due to the lack of financial investments in the development of local industrial sites for chemical processing and also due to the need for environmental education for a population with diverse social and economic characteristics [
2,
20], even with the creation of the National Solid Waste Policy (Política Nacional de Resíduos Sólidos—PNRS) [
11,
22], which aims to reduce the generation of waste and increase the reuse and recycling of products, including electronic waste [
20,
21]. After 11 years of PNRS, some hard work must be developed in Brazil to upgrade its effectiveness in the different kinds of solid waste generations. There is still a need to build on the collection reverse logistics in the country, as well as a study to determine the locations with a high generation of WEEE and to create a broad and effective assortment of collection points that should be well-known in general. Some studies have already tried to establish possible locations for the implementation of such collection points, such as the work of Alves et al. [
23], which investigated, through a questionnaire, issues related to the basic knowledge and disposal of WEEE among the population from the city of São João Del Rei, and determined that 97% of the population was willing to learn how to properly dispose of WEEE. Ottoni et al. [
24] analyzed the generation of WEEE in the metropolitan region of Rio de Janeiro, as well as possible collection points. However, this study considers the total generation of WEEE, not differentiating the discarded equipment, just as it did not distinguish if the Brazilian social and economic inequality affects the generation of WEEE.
Based on this perspective, the investigation of possible groups that have a high potential to consume electronic equipment and thus generate a large percentage of WEEE can be considered as a valid premise [
25]. For instance, the work based on Chinese university students made by Ling Zhang et al. [
9], in which it was estimated that, in China, there are USD 1.6 billion in metals resting in hibernating equipment belonging to students in the higher education segment. Shevchenko et al. [
7] concluded that there is a worldwide trend towards storing old electronic devices at home. It has been found that, in certain countries, around 85% of these devices end up being stored with no prospect of being recycled. In this context, there is a need to determine the amount of equipment stored at homes in Brazil.
Within this context, the purposes of the present manuscript are associated with the appreciation of behavior related to a Brazilian social segment in terms of consumption, disposal, and hibernation behavior, and this is related to widely used devices. The research deals with the premise that Brazilian universities and their communities could be major suppliers of electronic computer equipment for extraction processes and, therefore, deserve attention for the creation of collection points for this type of waste and partnerships. The analysis was carried out through an electronic questionnaire, where the amount of equipment in hibernation was evaluated as the first step in the economic potential assessment of recycling as an alternative to the WEEE issue in Brazil. Following the interesting approach proposed by Zhang et al. [
9], the present research was carried out with higher education community members comprised of students, professors, and employees of the Pontifical Catholic University of Rio de Janeiro (PUC-Rio) and the Federal University of Rio de Janeiro (UFRJ), in addition to family members and the people close to them. Additionally, the research analyzed the general knowledge of the analyzed group about electronic waste recycling and the circular economy subjects as a tool to understand how the most educated population understands the subject. Finally, the quantitative results of the hibernating stockpile, economical value, and WEEE characteristics, as well as the qualitative group general understanding, were used to draw a general overview of the potential for establishing collection points in such areas, based on the comparison with the reported data for the Chinese university students.
2. Materials and Methods
2.1. Survey Design
The present work is based on the results and discussion associated with a survey using an electronic questionnaire. The latter was developed and taken into effect using an electronic form, divided into four parts, as follows:
User profile
The status of the devices in use and buying behavior
Condition of hibernation devices and the possible reasons to discard them or not
General knowledge about the stages of collection and recycling of WEEE
The first part sought to assess some of the major characteristics of the people filling the form, through questions aimed at the participant’s location, gender, age group, education level, and number of residents in the home. The second step was to determine the number of electronic devices in use, as well as the main reasons for purchasing new devices. The third part, comprising five questions, sought to determine: (1) the number of devices in hibernation, (2) time of hibernation, (3) reasons why the devices are no longer used, (4) reasons why the devices are stored, and (5) possible options for the disposal of hibernating devices. Finally, the last part studied the participants’ knowledge about the National Solid Waste Policy (PNRS), urban mining, circular economy, electronic waste dangers, collection points, and if the participants knew any company that specialized in the trash collection of electronic waste.
The research was distributed among university students and their family members at PUC-Rio and UFRJ after an electronic campaign on social media. The electronic devices studied by the research were: mobile phone (MP), old mobile phone (OMP), tablets (TPC), laptop (LPC), desktop personal computer (DPC), video game consoles (VG), and MP3 players or similar (MP3P). These devices were chosen as they are generally widely used, most of which were considered the most used devices by the Brazilian population by Meirelles 2020 [
26].
All questions that had reasons for the acquisition, hibernation, discontinuation of use, and disposal had the answer project according to the level of agreement of each participant within each assessed topic. The scores for each answer were distributed on a scale of one to five points, in which the lowest value was associated with a “totally disagree” answer, while the highest value was associated with a “totally agree” option, respectively, following the methodology detailed proposed by Zhang et al. [
9].
2.2. Questionnaire Sampling, Distribution, and Confidence
The group analyzed in this research was both the university population (mostly students, teachers, and employees), as well as family members and people close to the university community. Data discussion and comparison was based on the entire university population in the state of Rio de Janeiro according to the National Institute of Educational Studies and Research (Instituto Nacional de Estudos e Pesquisas Educacionais Anísio Teixeira—INEP). As already reported, the research was disseminated in two of the most preeminent universities in the state: PUC-Rio and UFRJ.
The data survey was carried out between September and November of 2020. The questionnaire was made available on the Google Forms platform, and its link was disseminated to research groups and students from both universities. Only the answers from residents of the metropolitan region of Rio de Janeiro were considered.
3. Results
3.1. Rio de Janeiro University Community Profile
Overall, 551 responses were received, of which only 429 were valid. Considering the entire university population size of 792,391 people [
27], the minimum sample to be obtained in this study to consider its estimative as appropriate was calculated at 384, assuming a 95% confidence interval with a standard deviation value of 0.5 and a margin of error of 5%. Thus, it can be said that the number of valid responses was sufficient for the size of the population in this study.
Regarding the stage of identifying the user profile, of the 429 valid participants, 52% were men and 48% women, which correlated relatively well with the 2019 data published by the INEP, in which 44% of students and employees of universities were men and 56% women [
27]. Furthermore, 42% of people who answered the survey were between 20 and 30 years old, while, according to data from INEP, the number of students in this age group is 60%. Statistical data from the INEP consider only the age range of students, excluding employees, so there is a small difference between the survey data and data available in the literature, which is quite possibly due to the lack of data on the age group of employees, teachers, and family members. The difference between the data may still be due to the assumptions made in the methodology. The percentage of postgraduate participants was 45%, while the results for graduate, high school, and technical levels were 25, 20, and 10%, respectively. In the question “How many people live in the same residence?”, 35% of the participants answered three people, 25% answered two, and 21% answered with four people. All data on the profile of the participants are shown in
Table 1.
3.2. Characterization of In-Use Devices
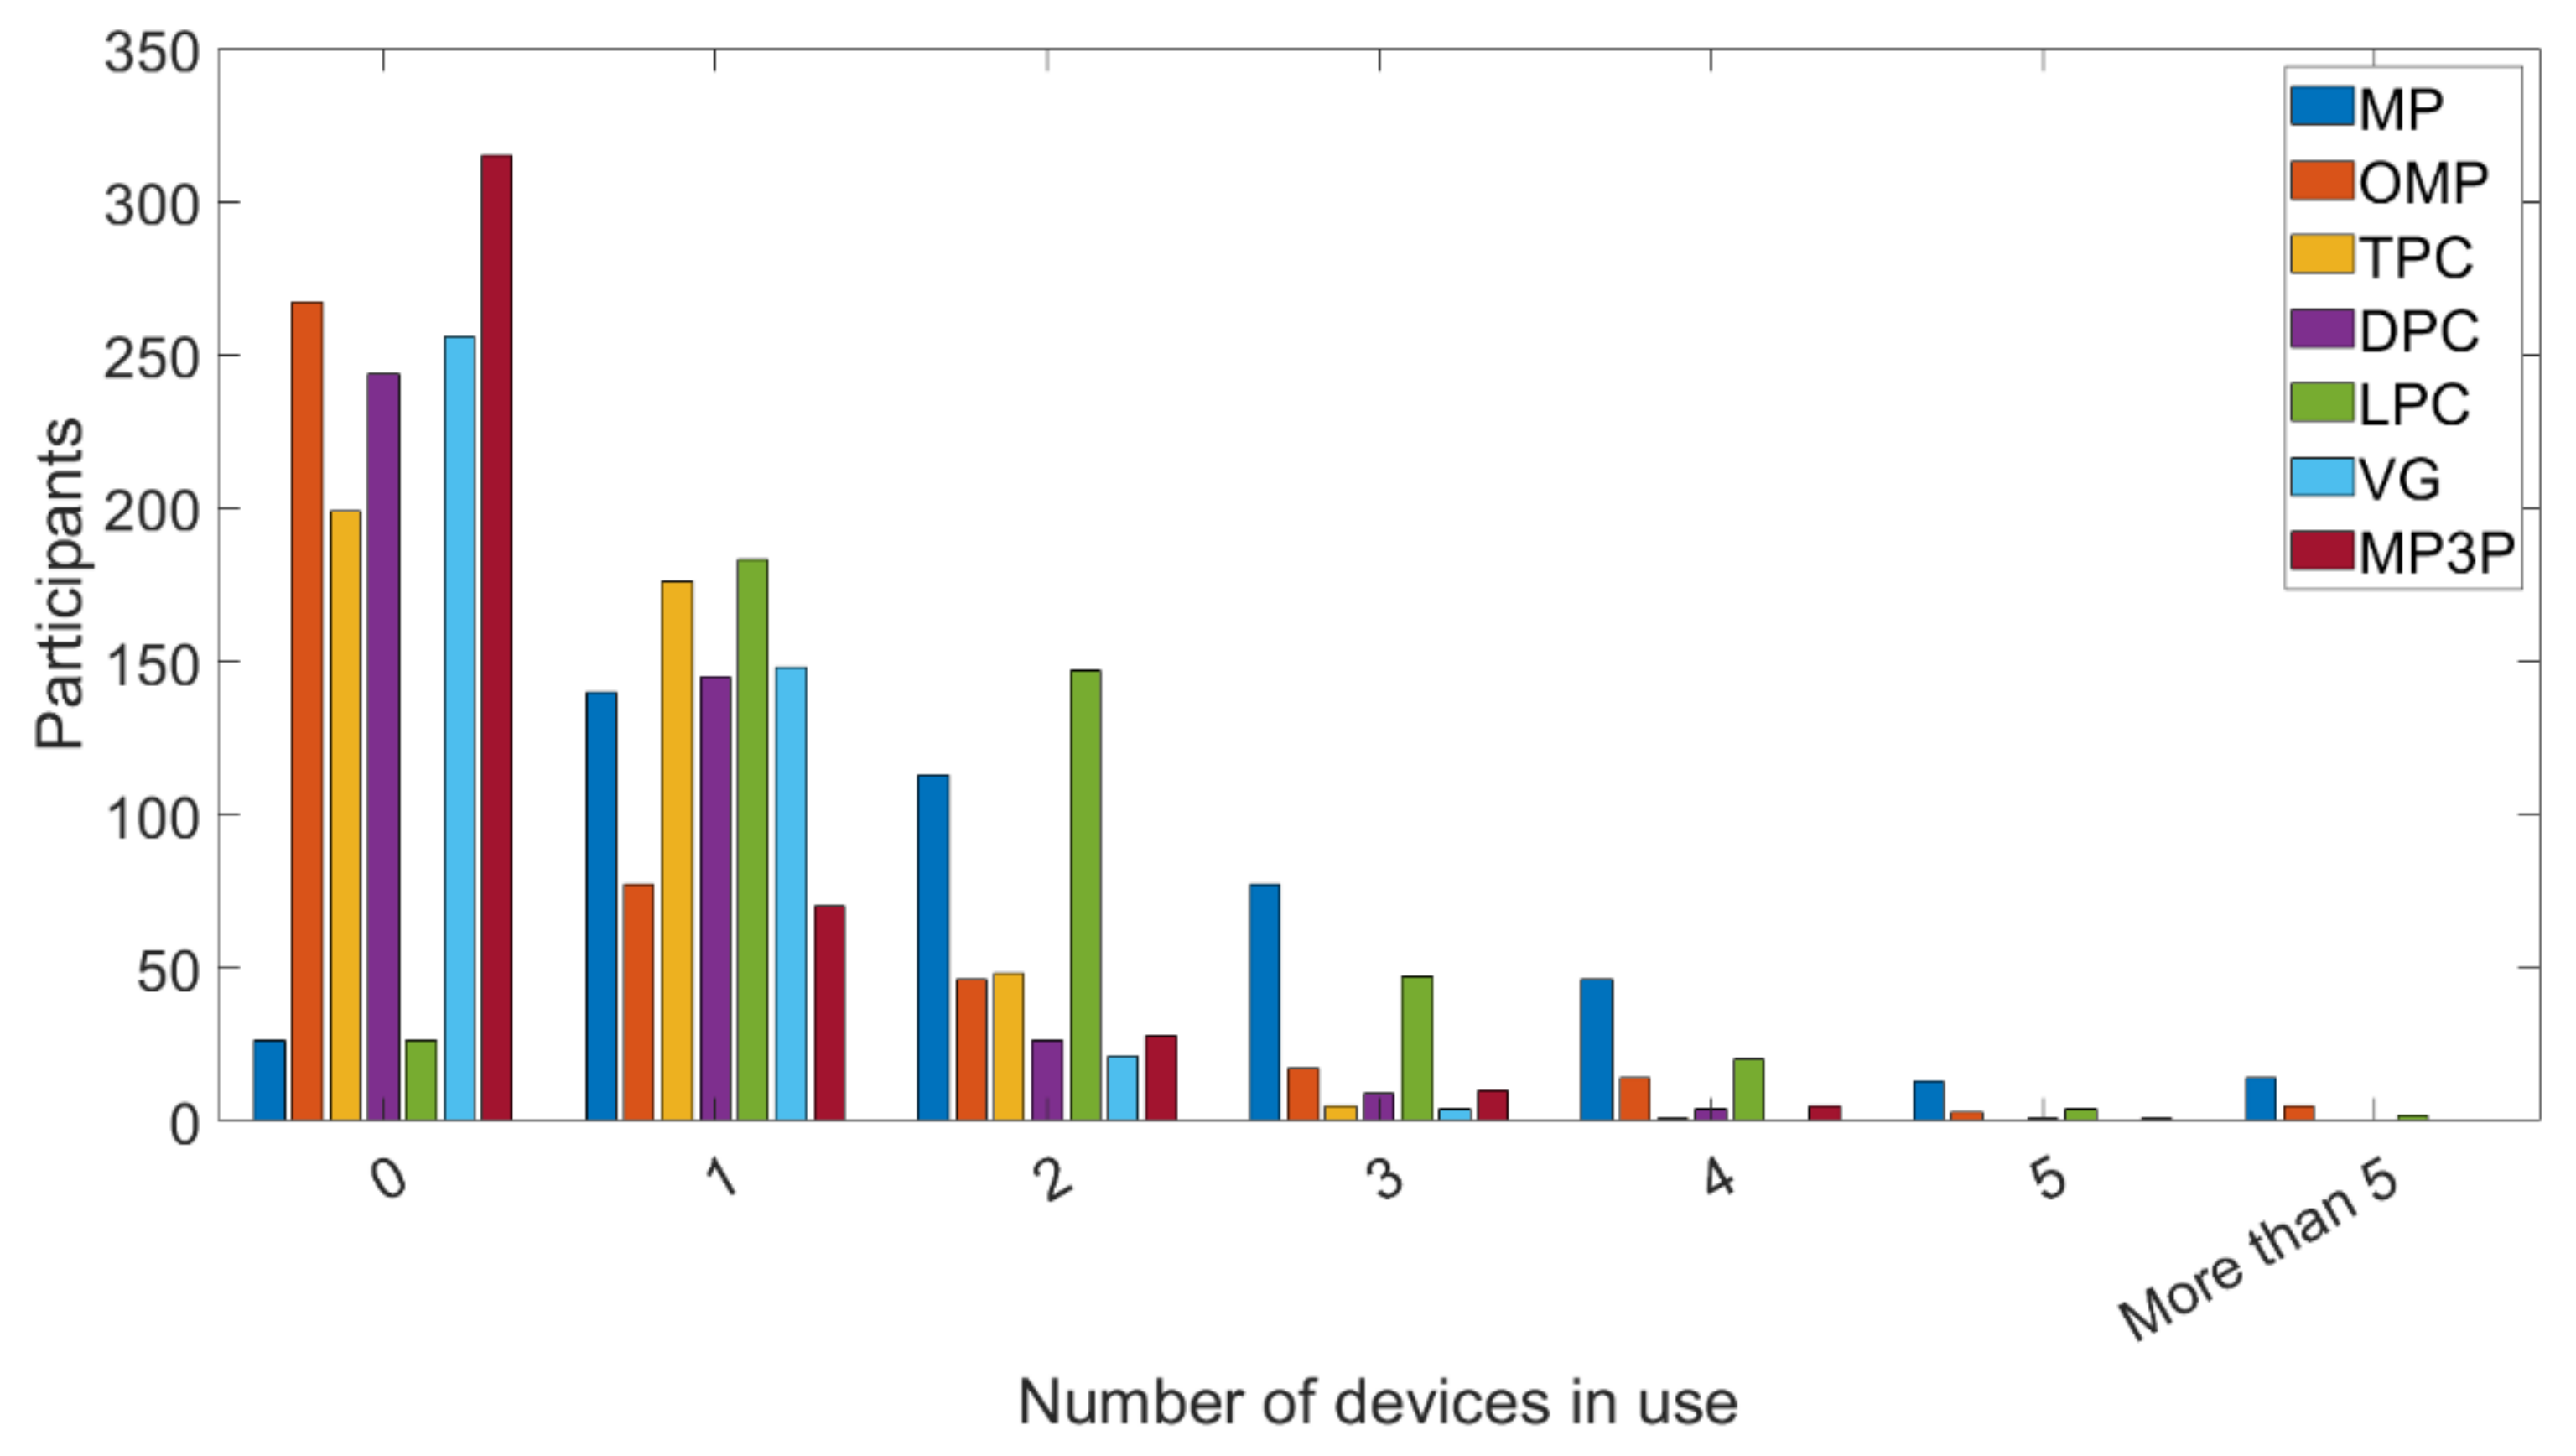
The results obtained regarding the number of devices in use are shown in
Table 2 and
Figure 1.
It can be seen that the most used electronic device was the MP, with 2.17 units per capita. This value was more than double the national average, which is 1.09 units per capita [
26], indicating that some kind of electronic device concentration is happening in the most educated and wealthy strata of society. The fact that smartphones are the most used devices is in accordance with world trends, since their use is increasingly necessary in different tasks of everyday life. Other research has already shown that these devices are in fact the most popular ones currently [
9,
29].
The LPC use within participants was also highly superior to the rest of the devices evaluated, with a use per capita of 1.70 units, much higher than the national average of 0.34 units per capita. This fact can be explained by the growing need for the use of digital tools in the daily life of university and higher education careers. Considering the remote learning conditions established with the SARS-CoV-2 pandemic and the incentives for equipment donation for the most vulnerable students and workers for digital inclusion, this result could be even higher soon. The use of TPC and DPC is also higher than the Brazilian averages, showing that there is a demand for this type of device among the evaluated group. The other devices evaluated by the survey do not have a national assessment, however, the use of OMP is still relatively popular, but well below the use of MP, and the use of VG and MP3P was lower when compared to the other devices.
Extrapolating the data obtained with this research, considering university students, teachers, and technicians from universities in the state of Rio de Janeiro, the amount of equipment in use today would be approximately 1.72 million MP, 0.59 million OMP, 0.54 million TPC, 0.42 million DPC, 1.35 million LPC, 0.37 million VG, and 0.33 million MP3P.
As was already shown, the possession of electronic devices in the evaluated group was higher than the national average, as noted in
Table 2. This fact can be understood by the need for access to information and technology, which universities and higher education jobs in companies’ demand. It can still be understood because of the socioeconomic inequality that is transparent among Brazilian society. It is recognized that higher education is a privilege most associated with a population with superior purchasing power.
Comparing the results with those of Zhang et al. [
9], who did similar research that inspired us for the present study, but aimed only at university students from the Jiangsu province, China, it is clear that the group studied by this work used more electronic equipment. This fact can be associated with three hypotheses: (1) the Chinese students consume less electronic equipment than Brazilian university students; (2) the technical and teaching staff of Brazilian universities have an exaggerated consumption of this equipment, making the number of units per capita of the research higher; or (3) the combination of some of the two previous propositions. Additionally, comparing the results of the research with the scenario presented for China, it is noticed that this is different from the Chinese trend, where the university population has less equipment than the national average, and the group analyzed in this study has more equipment than the national average, as already quoted. This fact may be in accordance with the fact, also already mentioned, that Brazilian higher education tends to attract the population from a wealthy segment of society and because of its higher purchasing power.
3.3. Hibernating Devices Quantification
Table 3 shows the number of devices in hibernation per capita. As can be seen, MP was the group with the largest number of units, following the same pattern as other surveys in other countries [
9]. OMP, LPC, and MP3P had relevant numbers, but were lower than MP. The other electronic devices had a low per capita quantity.
When comparing the research data with those of the work of Zhang et al. [
9], it is clear that the group evaluated by this research had a higher per capita amount of devices in hibernation, following the same trend observed for equipment in use. This fact can demonstrate that, like the Chinese population assessed, the Brazilian university community is also a possible source of electronic equipment for metals extraction and materials recovery.
Extrapolating the data obtained with this research, considering the number of the evaluated population (presented in
Section 2.2), and considering the per capita values presented in
Table 3, it is possible to estimate that the approximate number of hibernating electronic devices in Rio de Janeiro for the analyzed group is: 0.84 million MP, 0.60 million OMP, 0.26 million TPC, 0.16 million DPC, 0.46 million LPC, 0.23 million VG, and 0.39 million MP3P.
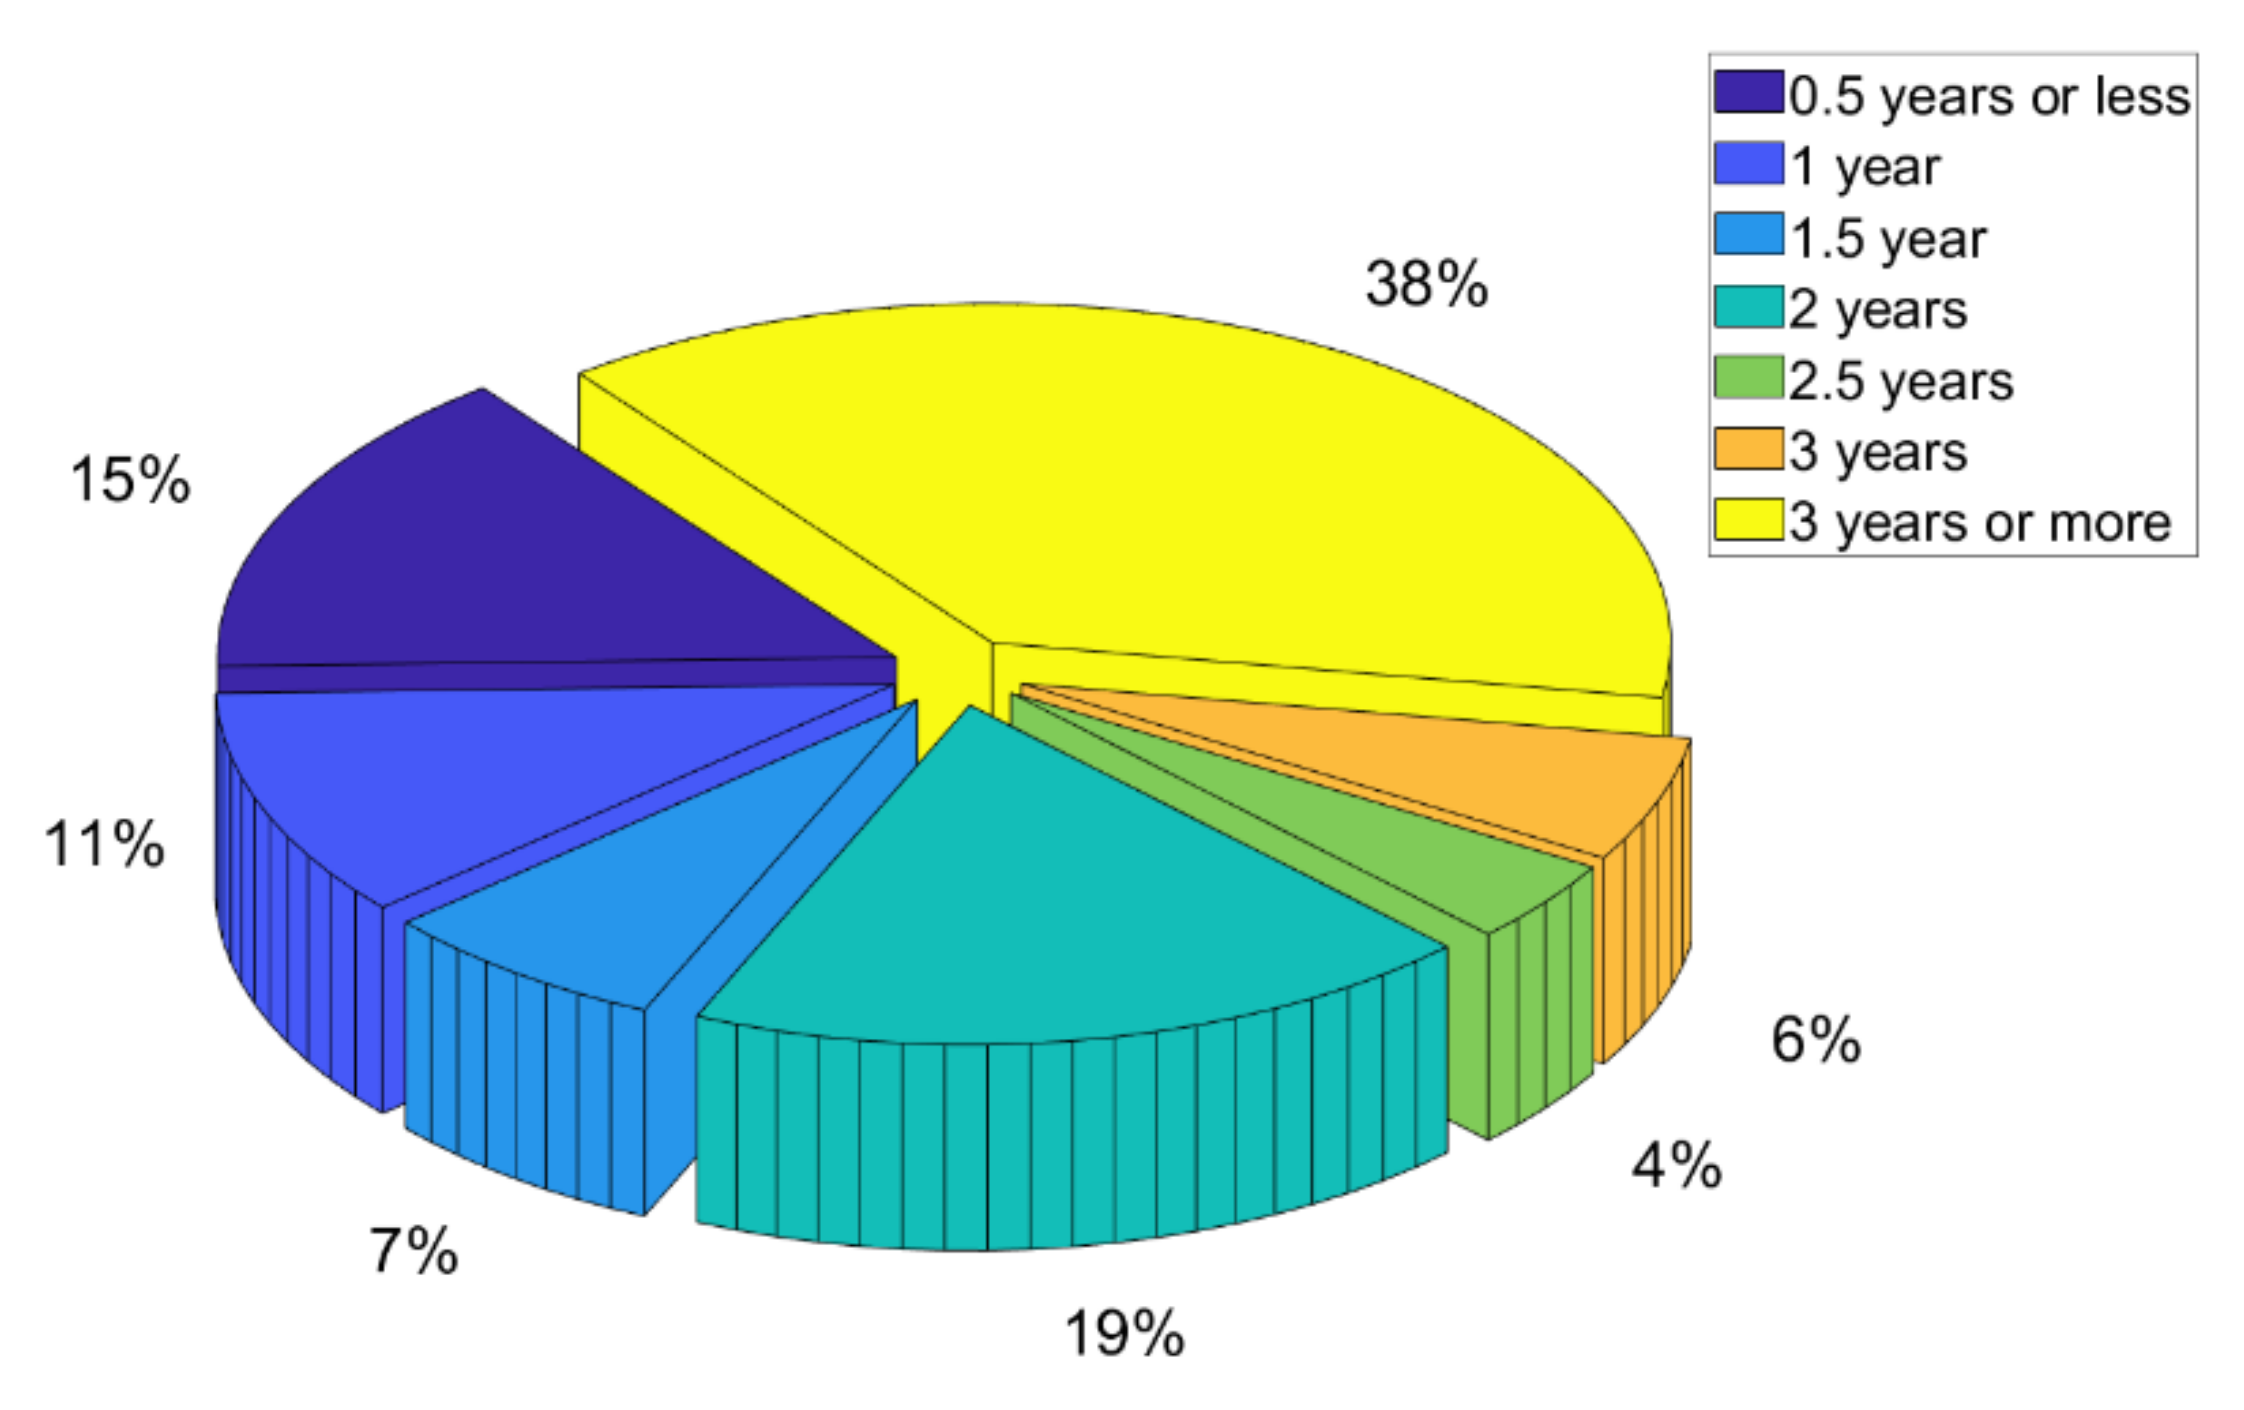
As can be seen in
Figure 2, most of the equipment was kept for three years or more, indicating that there was a lack of initiative for recycling this type of waste, making it important to understand what were the factors that led to the accumulation of this equipment in interviewees’ homes. Furthermore, this hibernation time of three years or more also occurs in other university populations, such as the Chinese [
9] or the UK [
30], demonstrating a possible worldwide trend.
3.4. Reasons for Obsolescence or Device Switching
The answers regarding the reasons for the exchange, obsolescence, and acquisition of new devices, as well as the reasons for which the devices were stored and not discarded, are presented next.
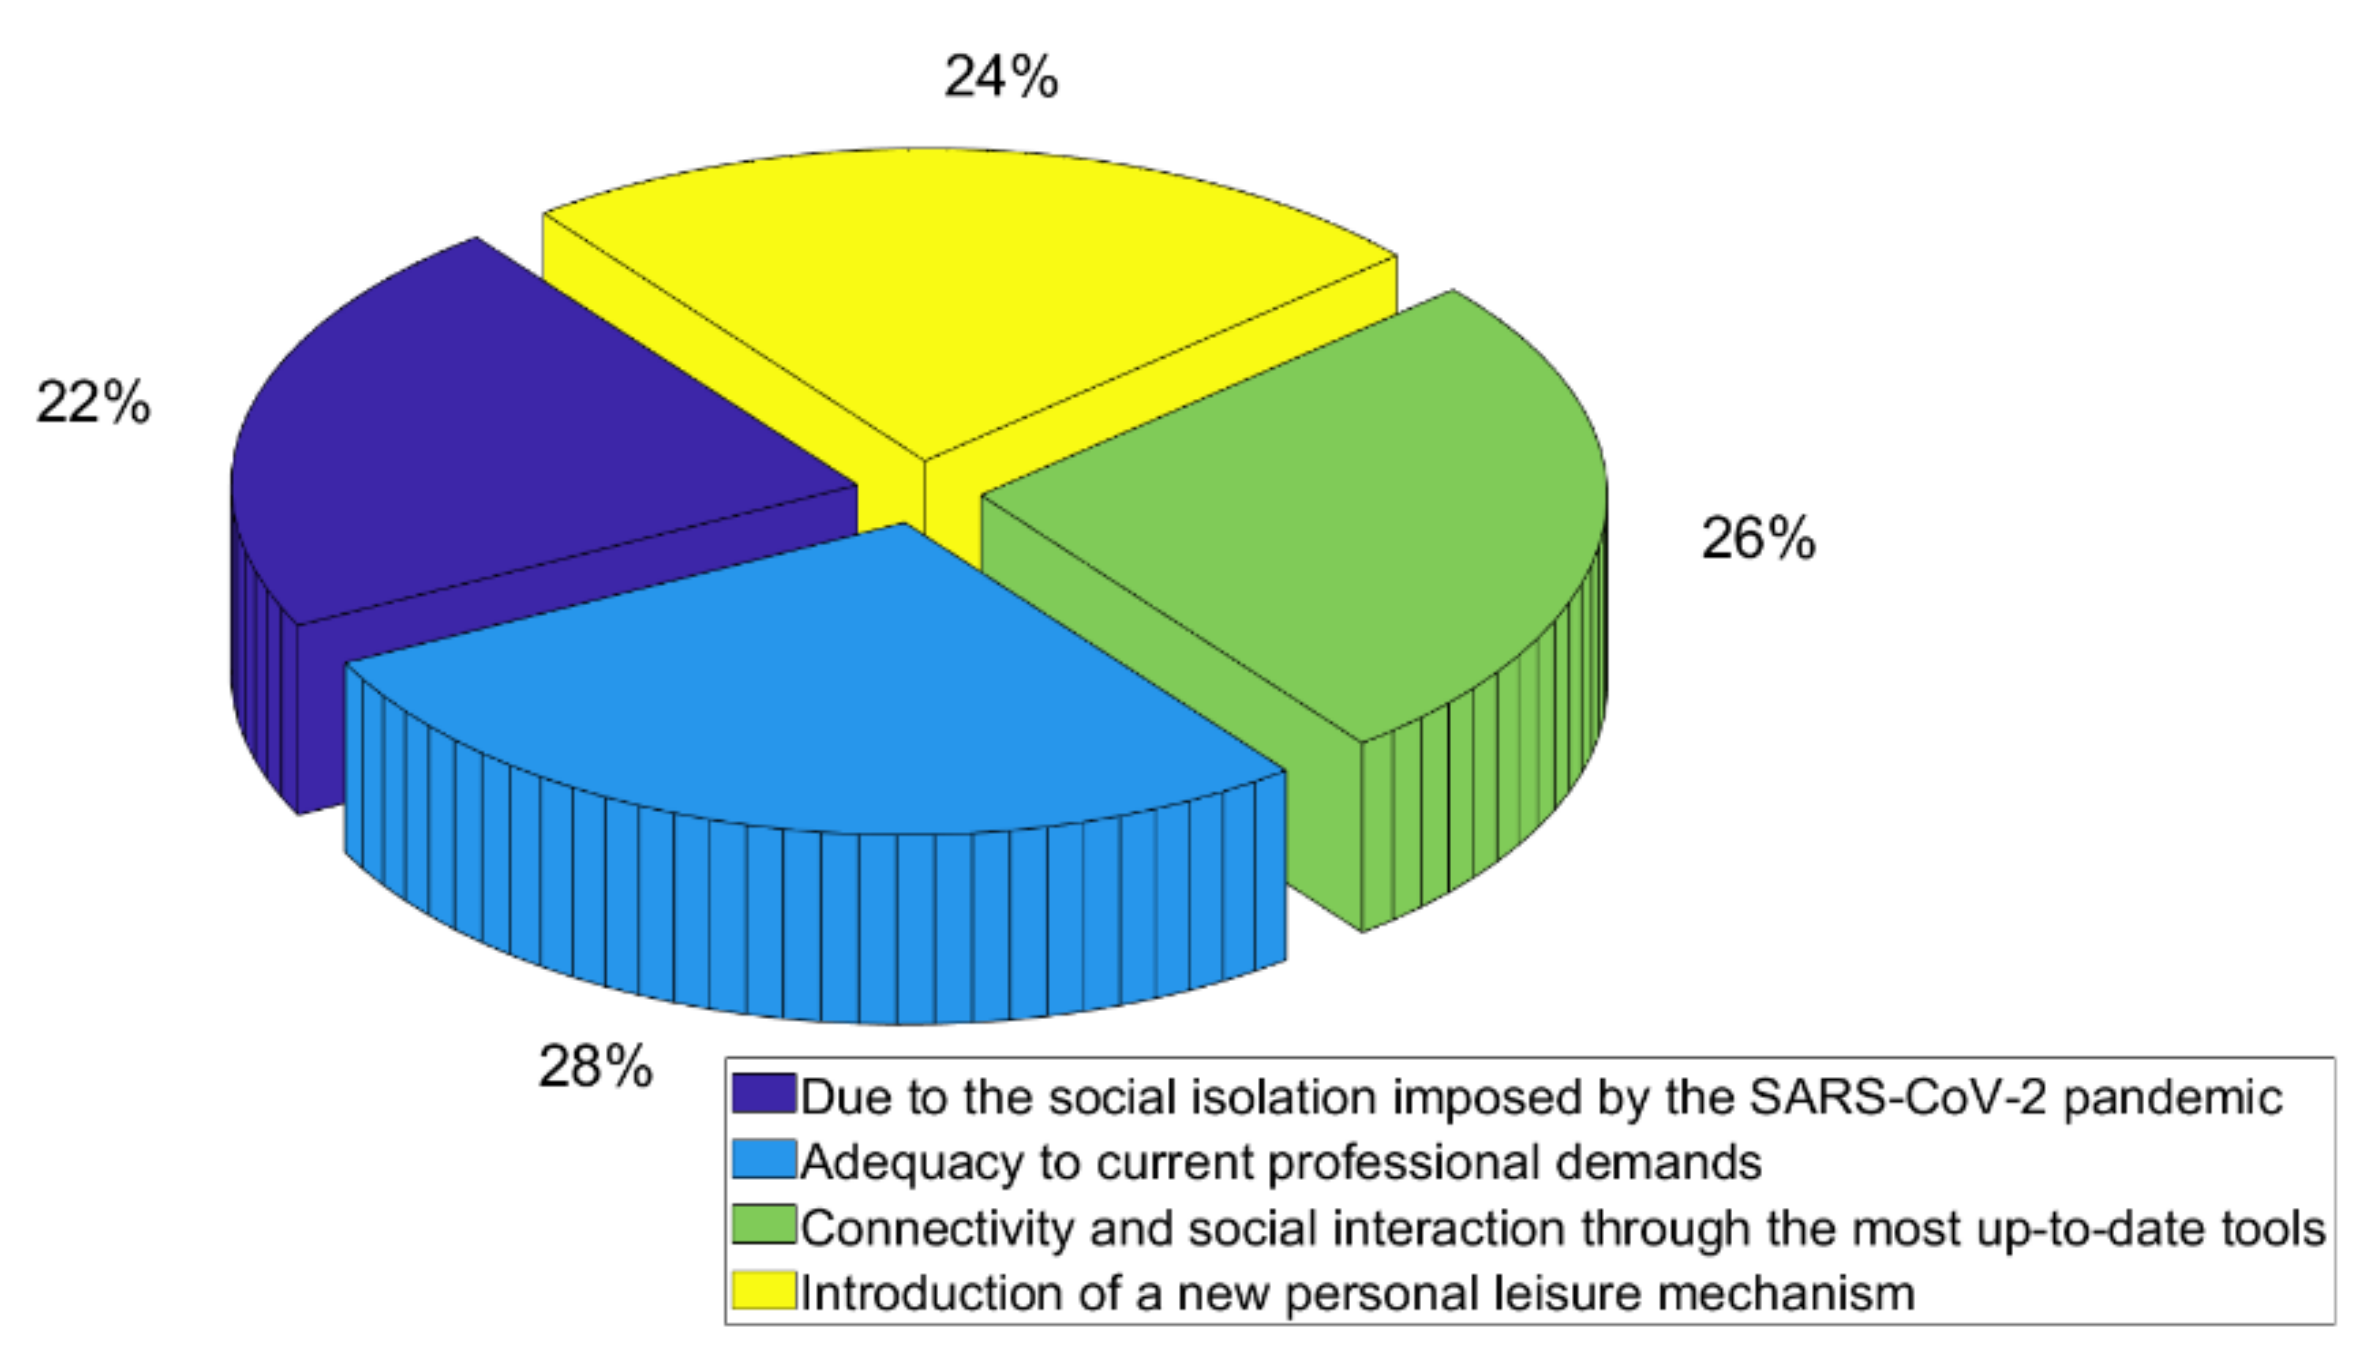
In this context, in
Figure 3, it can be understood that the reason with the greatest significance among the four evaluated for the acquisition of new devices was the one related to the adaptation to current professional demands, with 28% of the answers.
This fact indicates that the university population tends to be in a process of constant technological updates in order to keep up with the growing demand, such as new software requirements, in addition to the demand of using new hardware that requires more memory and processing capabilities [
2]. This reason was also the most important reason for acquiring new devices among Chinese students [
9]. The second and third reasons with greater significance were related to connectivity and interaction through more up-to-date tools and personal leisure, respectively. This fact shows the search for new technologies for personal use, and, just as in the case of the first reason, new devices tend to have new features and better specifications, leading to their acquisition. The reason that least influenced the research participants was the issue of social isolation imposed by the SARS-CoV-2 pandemic. Nevertheless, this reason had 22% of the votes, a representative one, showing that the responses were well-balanced and indicating that perhaps the pandemic may have increased the consumption habits of electronic equipment of the group in question. It is worth mentioning that the reasons “adequacy to current professional demands” and “connectivity and social interaction through updated tools”, which were somewhat related to equipment obsolescence, accounted for 54% of valid responses.
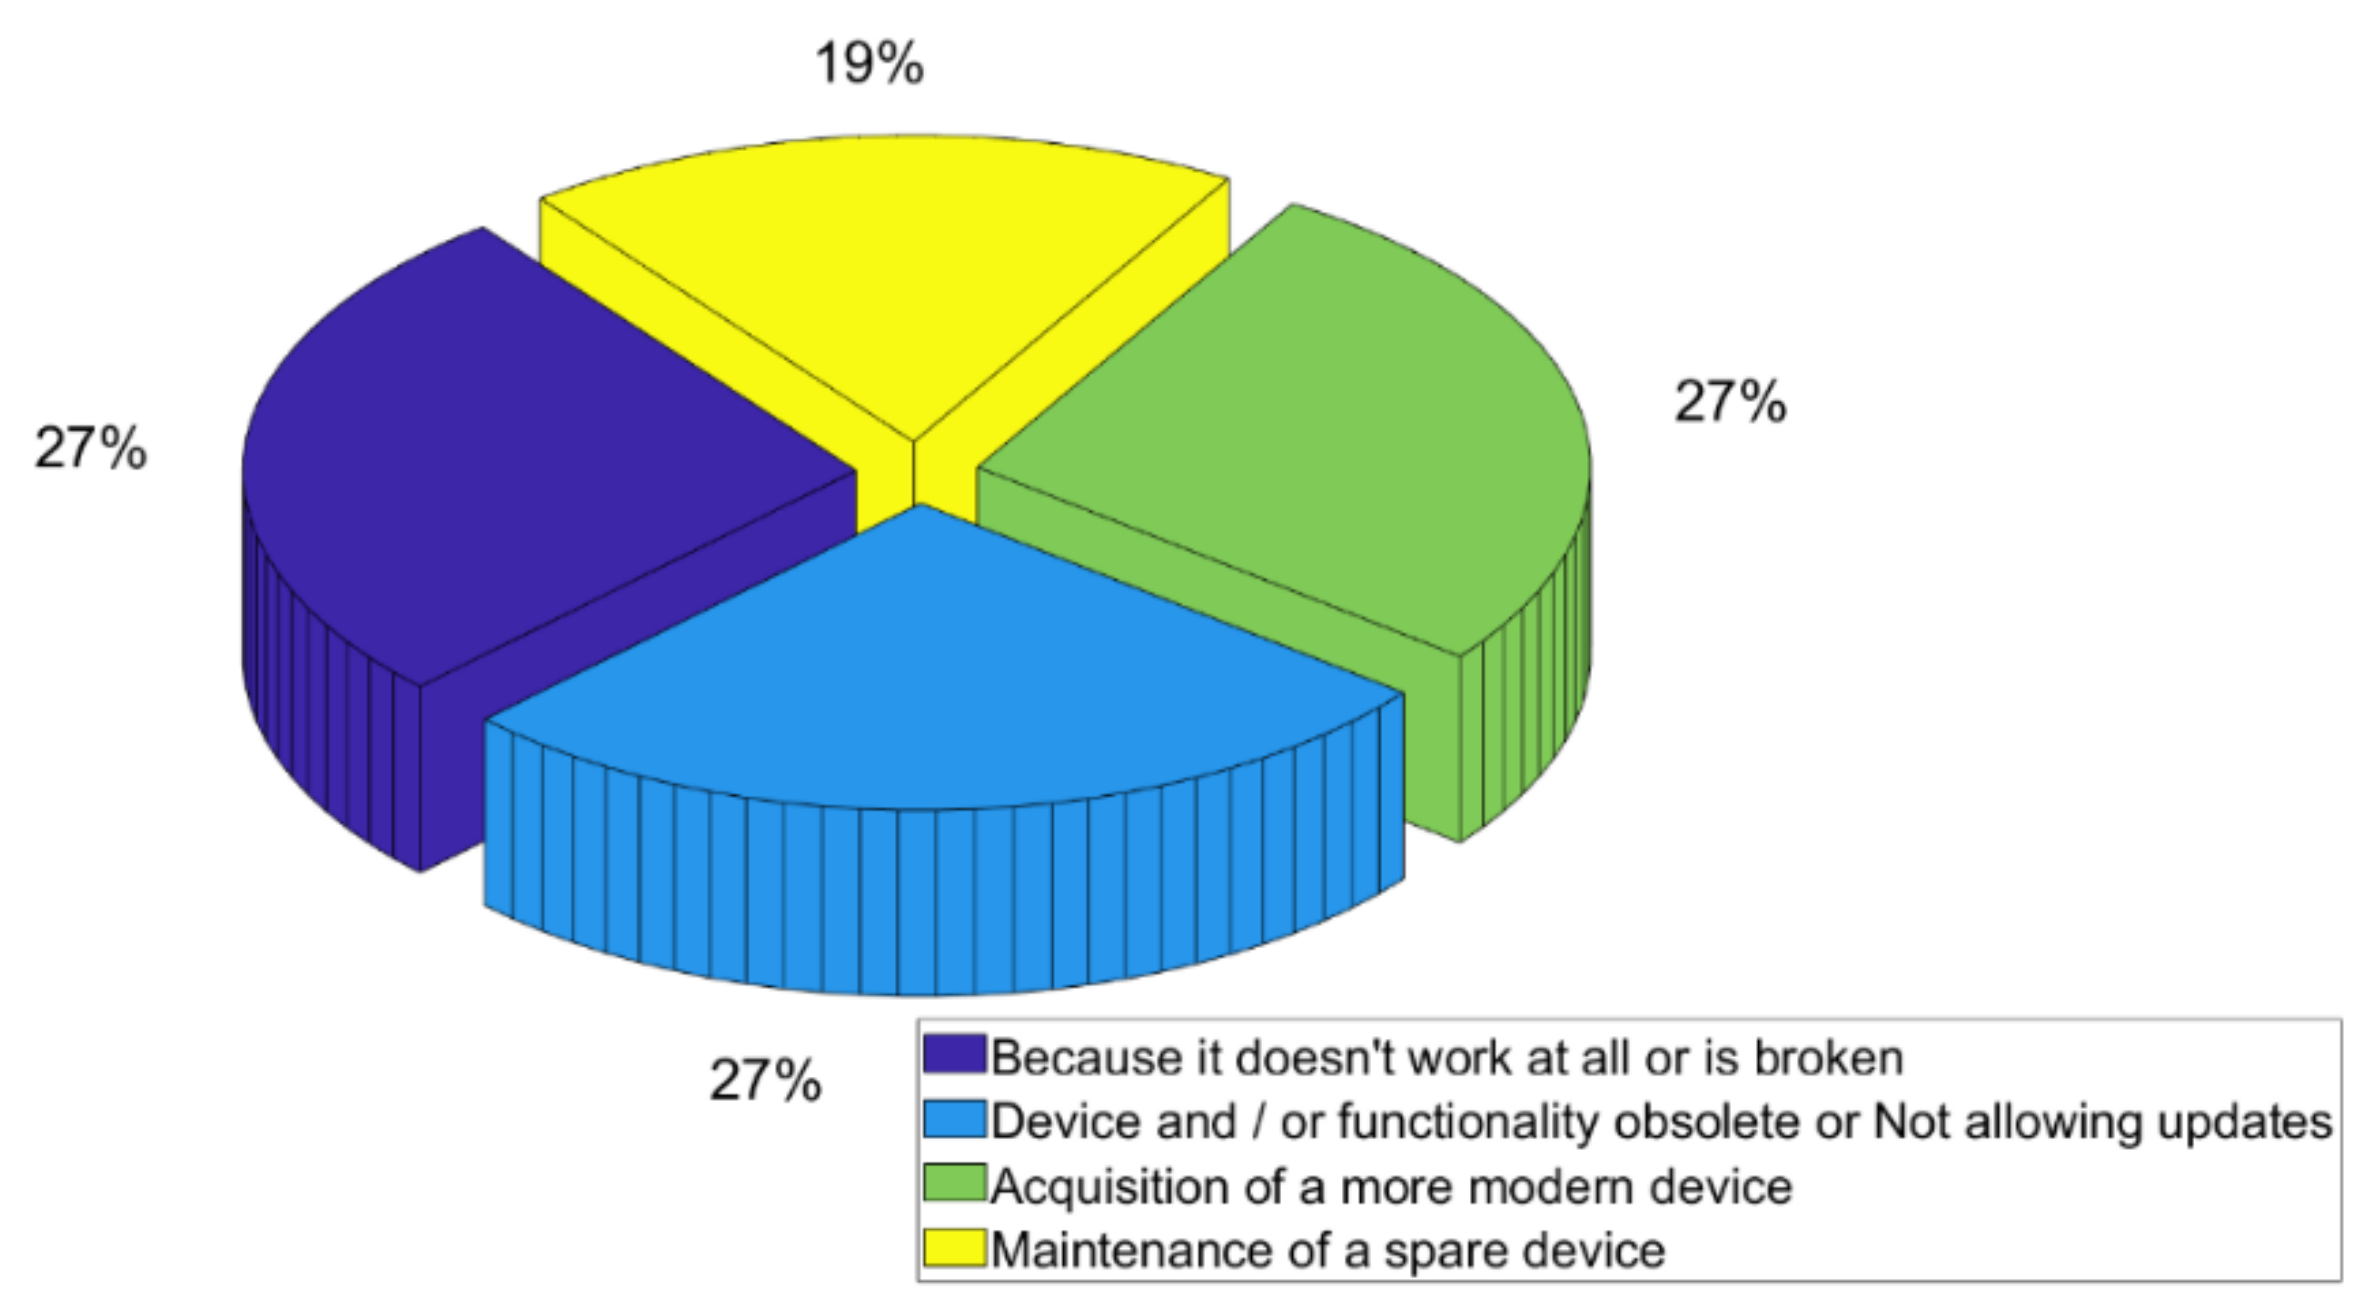
On the other hand,
Figure 4 shows the answers to the reasons why the devices were no longer used, and, as can be seen, three reasons accounted for 27% of the answers.
In addition to the fact that damaged devices are no longer used, obsolete devices that ceased to receive updates and the exchange for more modern devices were strong reasons for the hibernation of the devices. Moreover, the difficulty to access spare parts to repair damaged devices could also hinder their reuse and accelerate their replacement. The reason with the least significance, with only 17% of the answers, was because the device was used as a backup. These data can be explained by a large number of thefts and robberies associated with MP in Rio de Janeiro. For instance, 42,000 mobile phones were stolen in the Brazilian state of Rio de Janeiro in 2018 [
31]. This could lead perhaps to the consolidation of behavior of having a spare device. Given these results, the answers obtained in this question corroborated with the previous ones, where the university population of Rio de Janeiro tends to stop using devices due to obsolescence issues or because there are new models on the market.
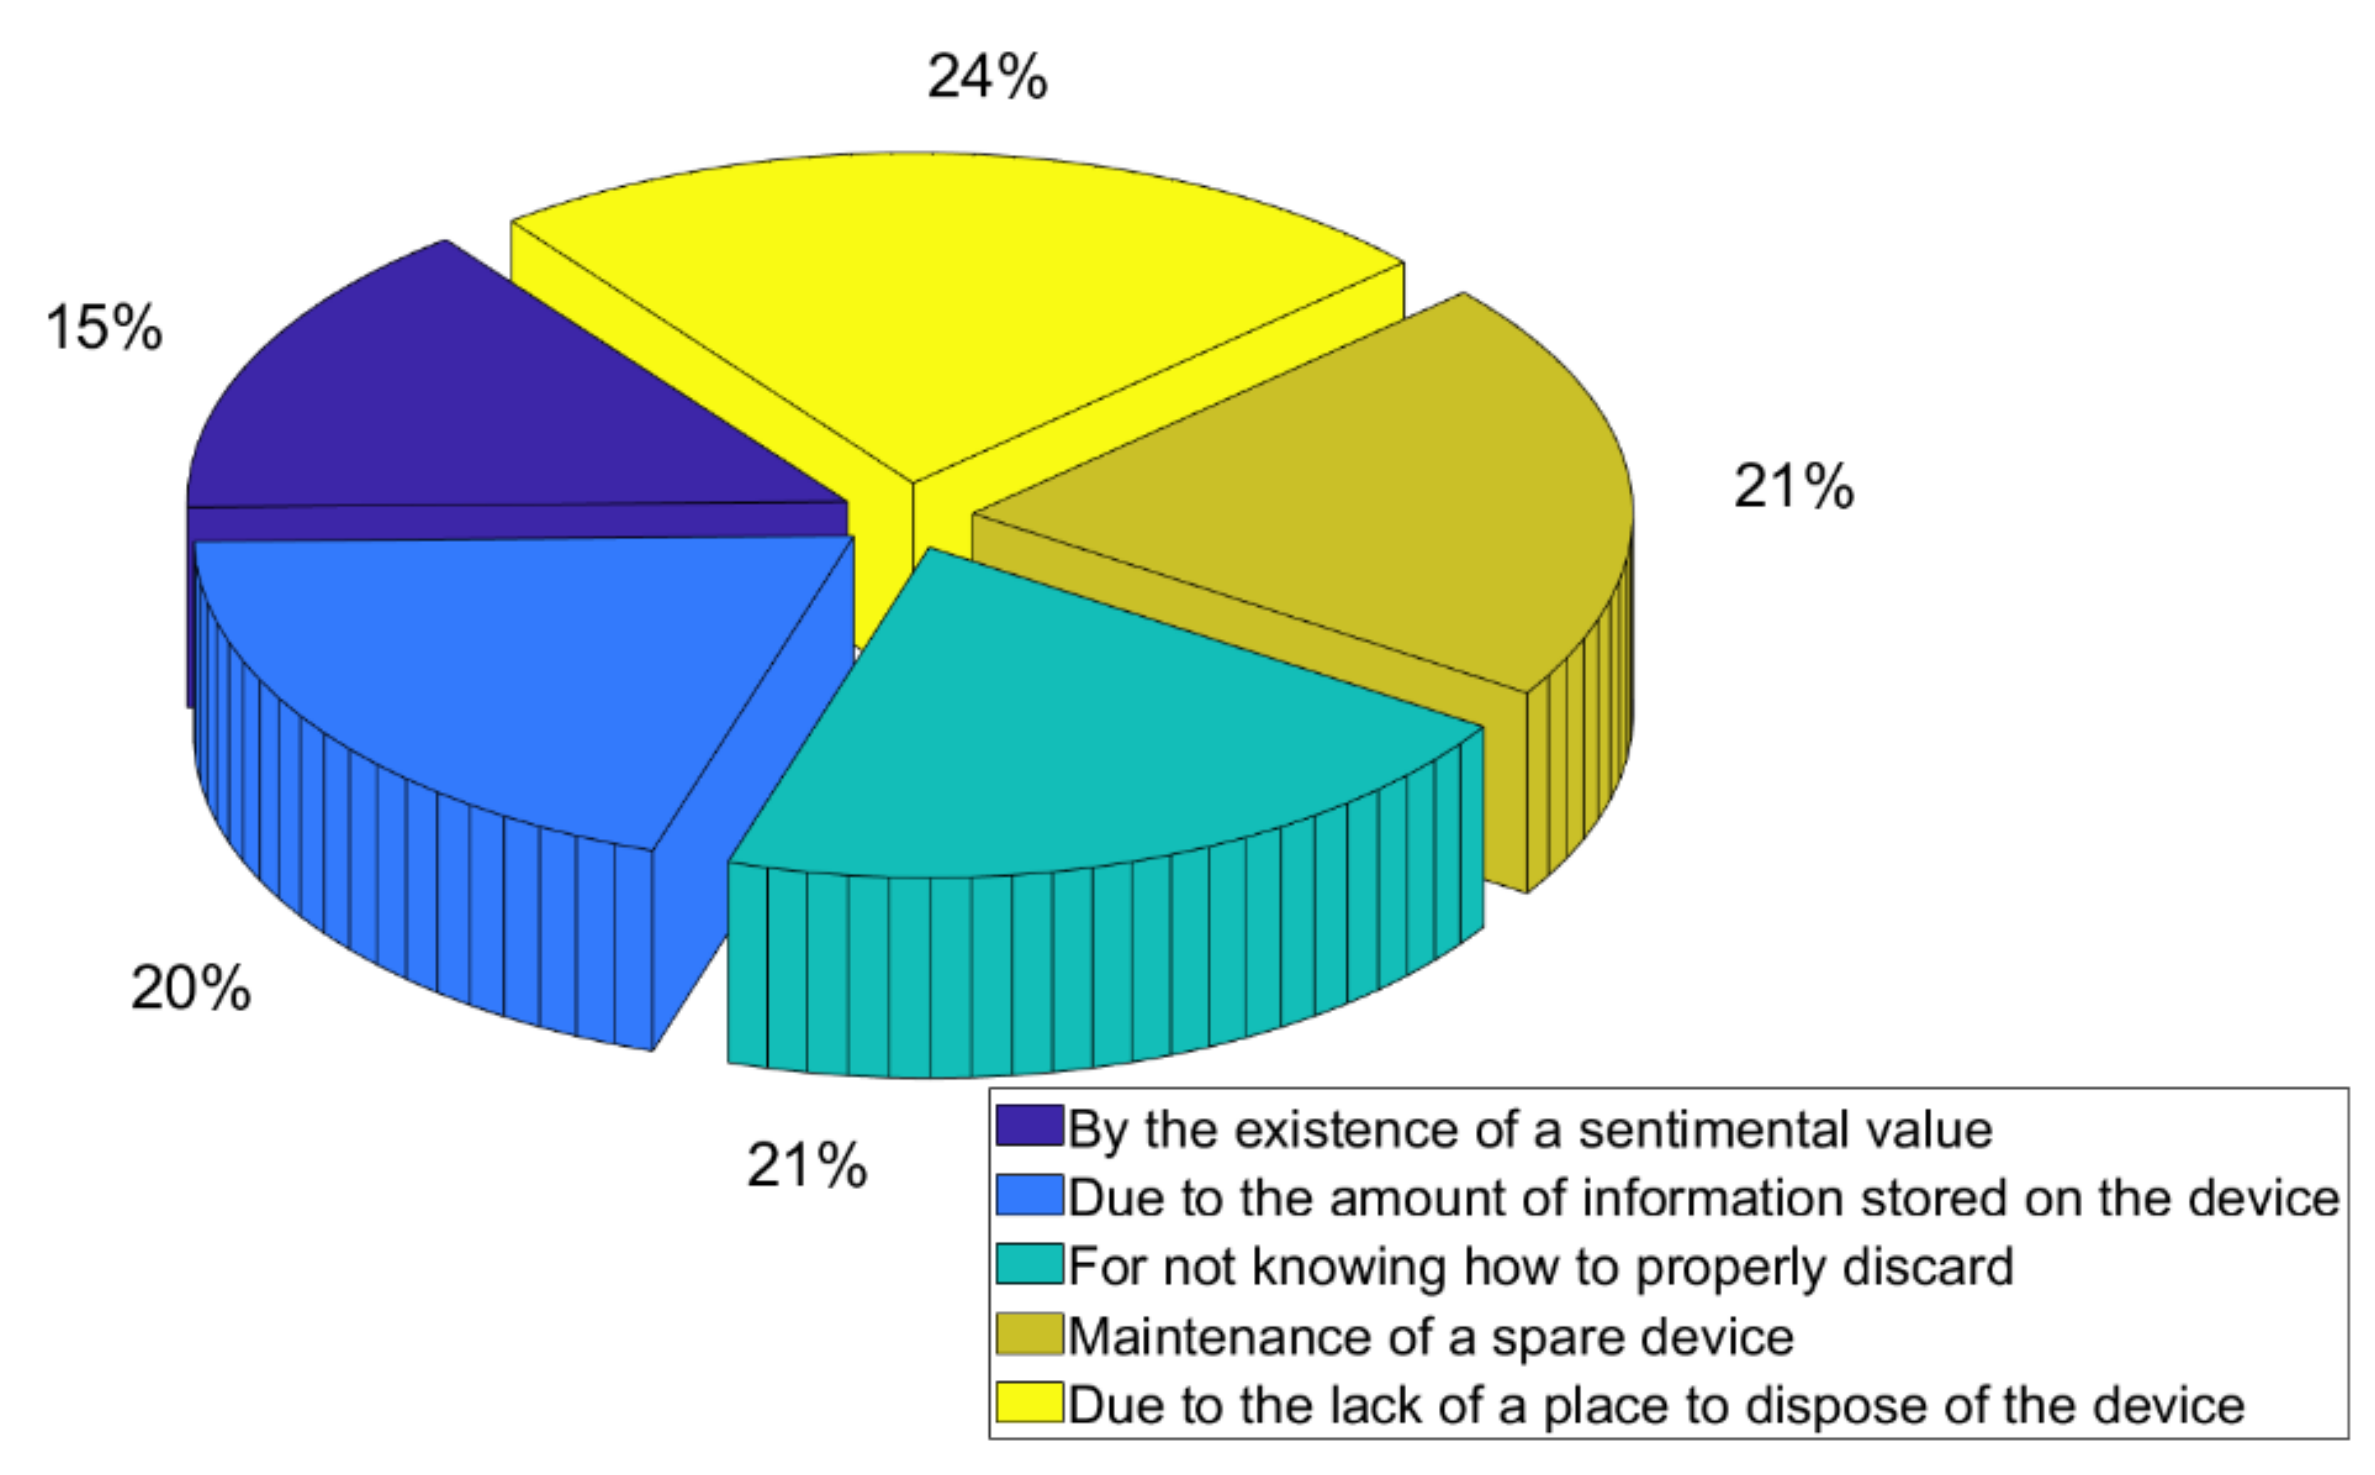
It can be seen in
Figure 5 that the main reason for keeping old equipment is due to the lack of an appropriate place for disposal (and a public policy to encourage disposal); in fact, the reason of “not knowing how to dispose of appropriately” came in second, tied with the “maintenance of a spare device”.
The survey then indicated that there was a lack of information regarding the disposal of electronic waste, whether caused by a lack of government policy or economic incentives. Since the group analyzed is, in theory, one of the most well-educated groups in the country, it can be considered that for Brazil as a whole, the lack of misinformation in the disposal of electronic waste is possibly much higher. When compared with the research by Zhang et al. [
9], some similarities in the responses between the two groups analyzed can be seen, since 22% of Chinese students did not discard their equipment due to the lack of an appropriate place, compared with 24% of the Brazilian group, indicating that the lack of a disposal structure is not a problem exclusive to Brazil, but maybe a worldwide trend. The concern with data and privacy can be observed, since 20% of participants did not discard their devices because they contain stored information, a motivation that also concerns 20.7% of Chinese students [
9]. A possible way to reduce this would be to teach how to remove personal information contained in the devices, as described by Zhang et al. [
9]. The reason with the least influence on the hibernation of the devices was “sentimental value”, possibly showing that the lack of incentives and information with disposal and other technical details are the factors that must be worked on for greater use of alternative electronic waste extraction routes.
Additionally, it is possible to notice other similarities between this study and that of Zhang et al. [
9], since the answer about “maintenance of a spare device” is easily understood as being a more convenient option. Thus, comparing it with the Chinese population, this answer within the Brazilian survey corresponds to 21% of responses, while the Chinese survey accounts for 22.1%.
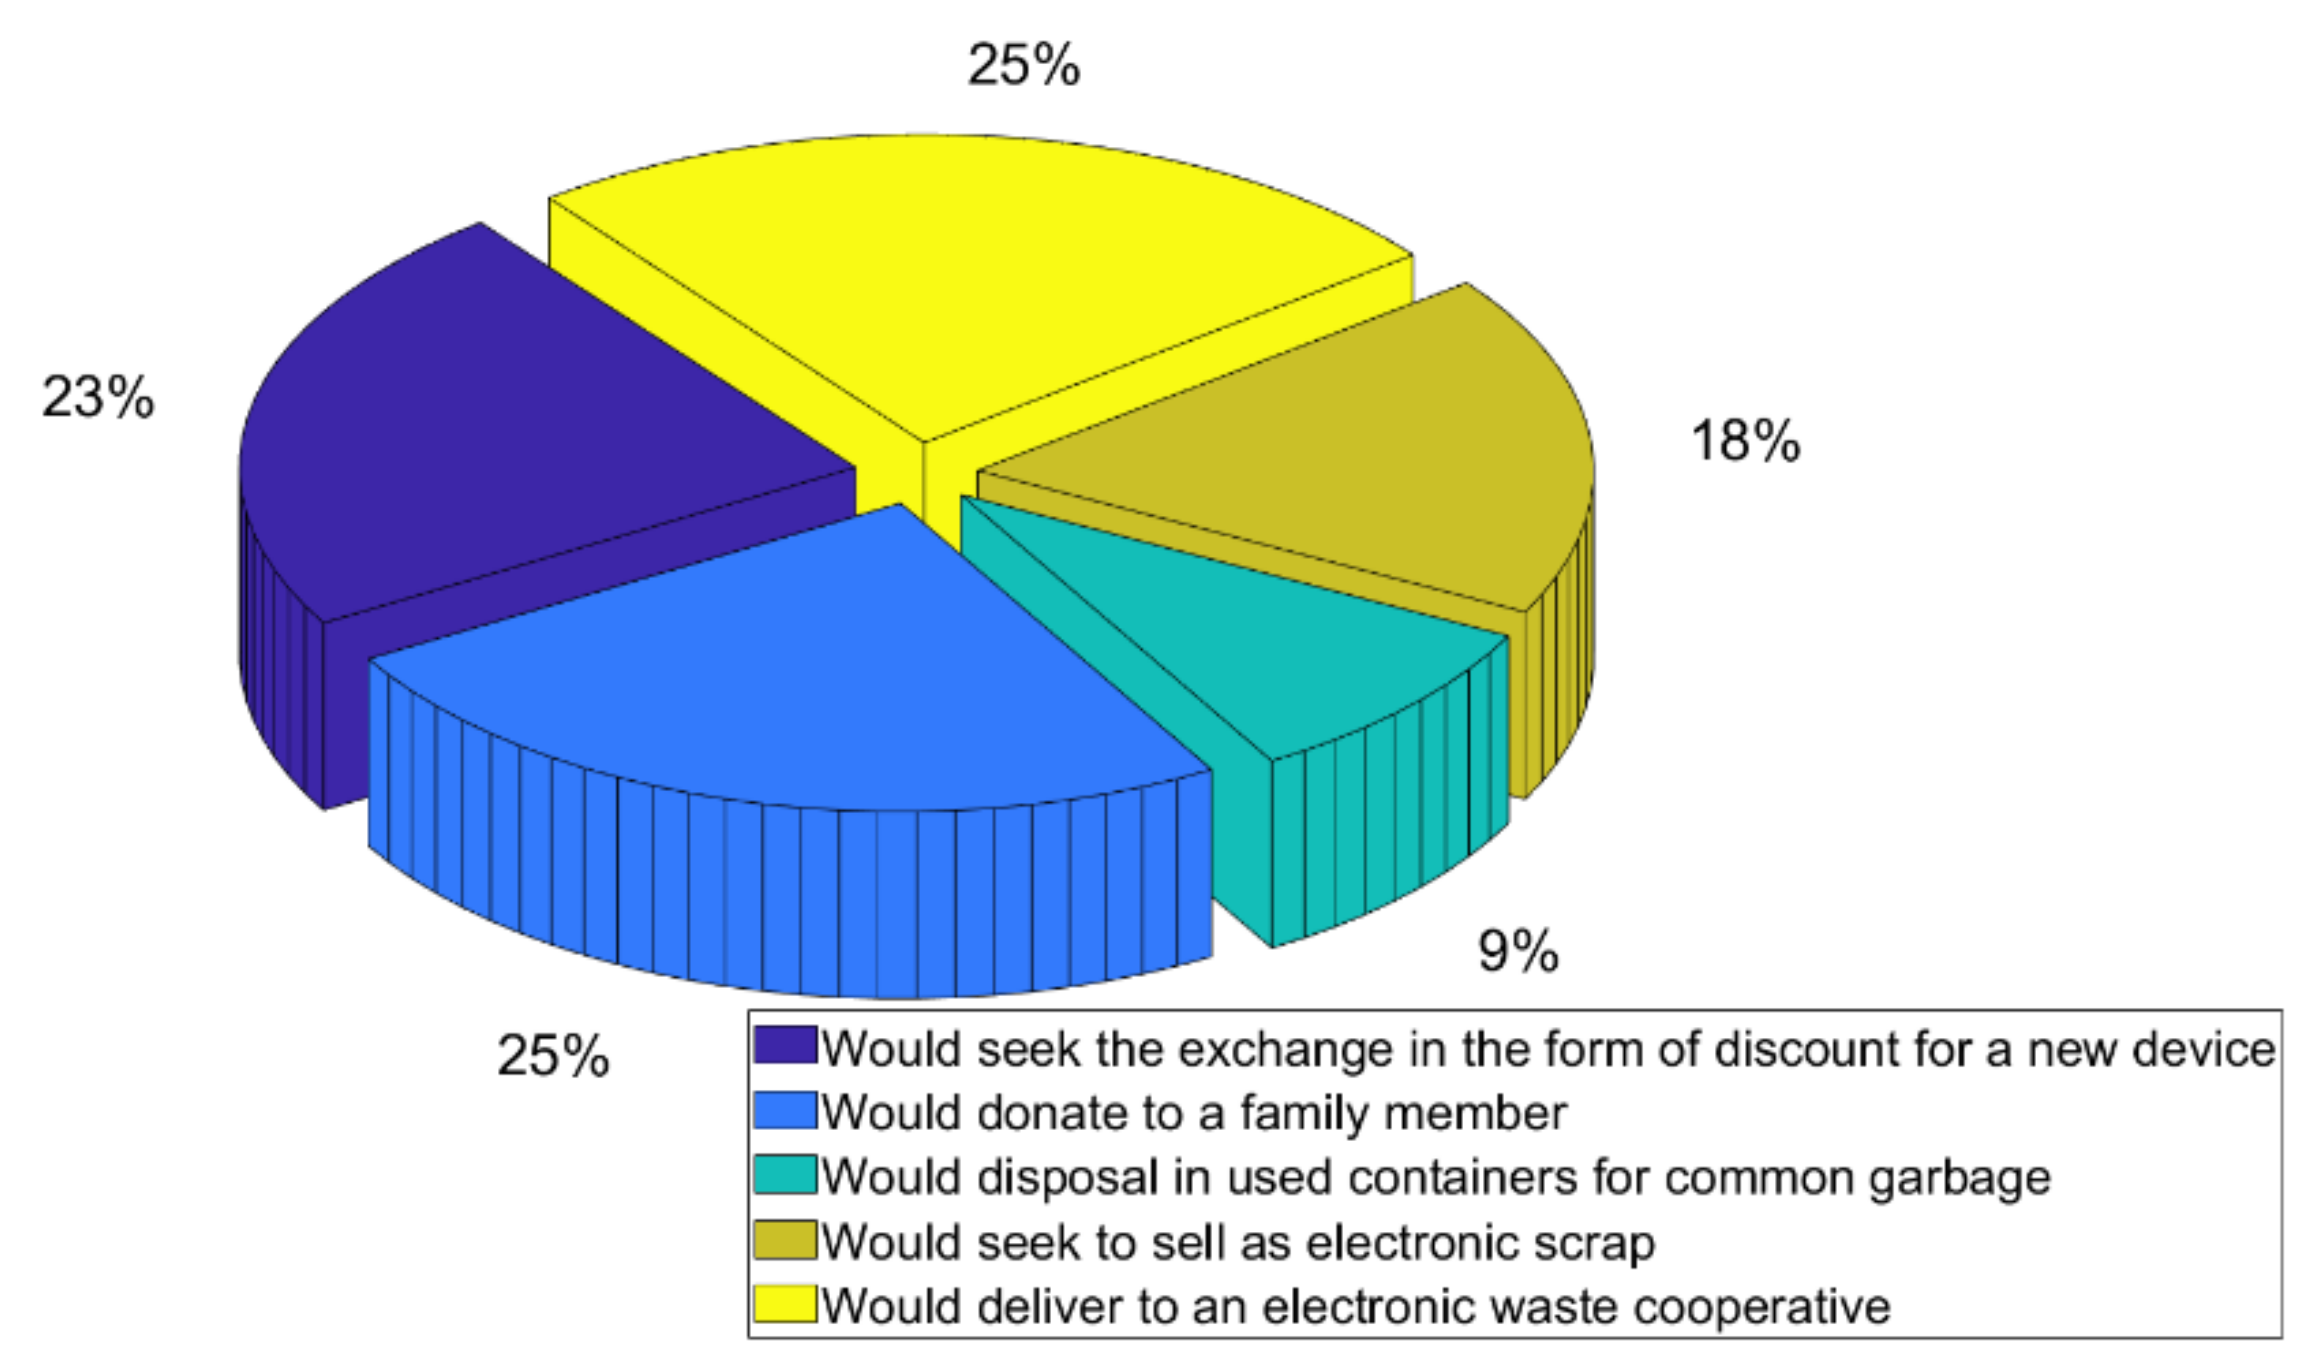
As one can see in
Figure 6, when asked how to dispose of devices, 25% of participants would be willing to deliver to a company specializing in the collection of electronic waste.
It was also observed that 25% of participants would donate the device to family members, demonstrating that some level of reuse of equipment happens among the university population in Rio de Janeiro. The third option of disposal would be through the exchange of the device for a discount on a new model, a recurring practice among manufacturers to encourage the renewal of equipment and device refurbishing. A portion of 18% was still willing to sell their old equipment, which was a small percentage when compared to countries like Finland [
7]. Additionally, a small portion of 9% would carry out the disposal in common garbage, indicating that even in the university environment, awareness of disposal at appropriate places is necessary. However, when compared to the research developed by Alves et al. [
23], in which 43.5% of the interviewees would discard at inappropriate garbage disposals, it is clear that the group analyzed by this research had greater discernment regarding the disposal of electronic equipment.
3.5. General Knowledge of the Participant Group
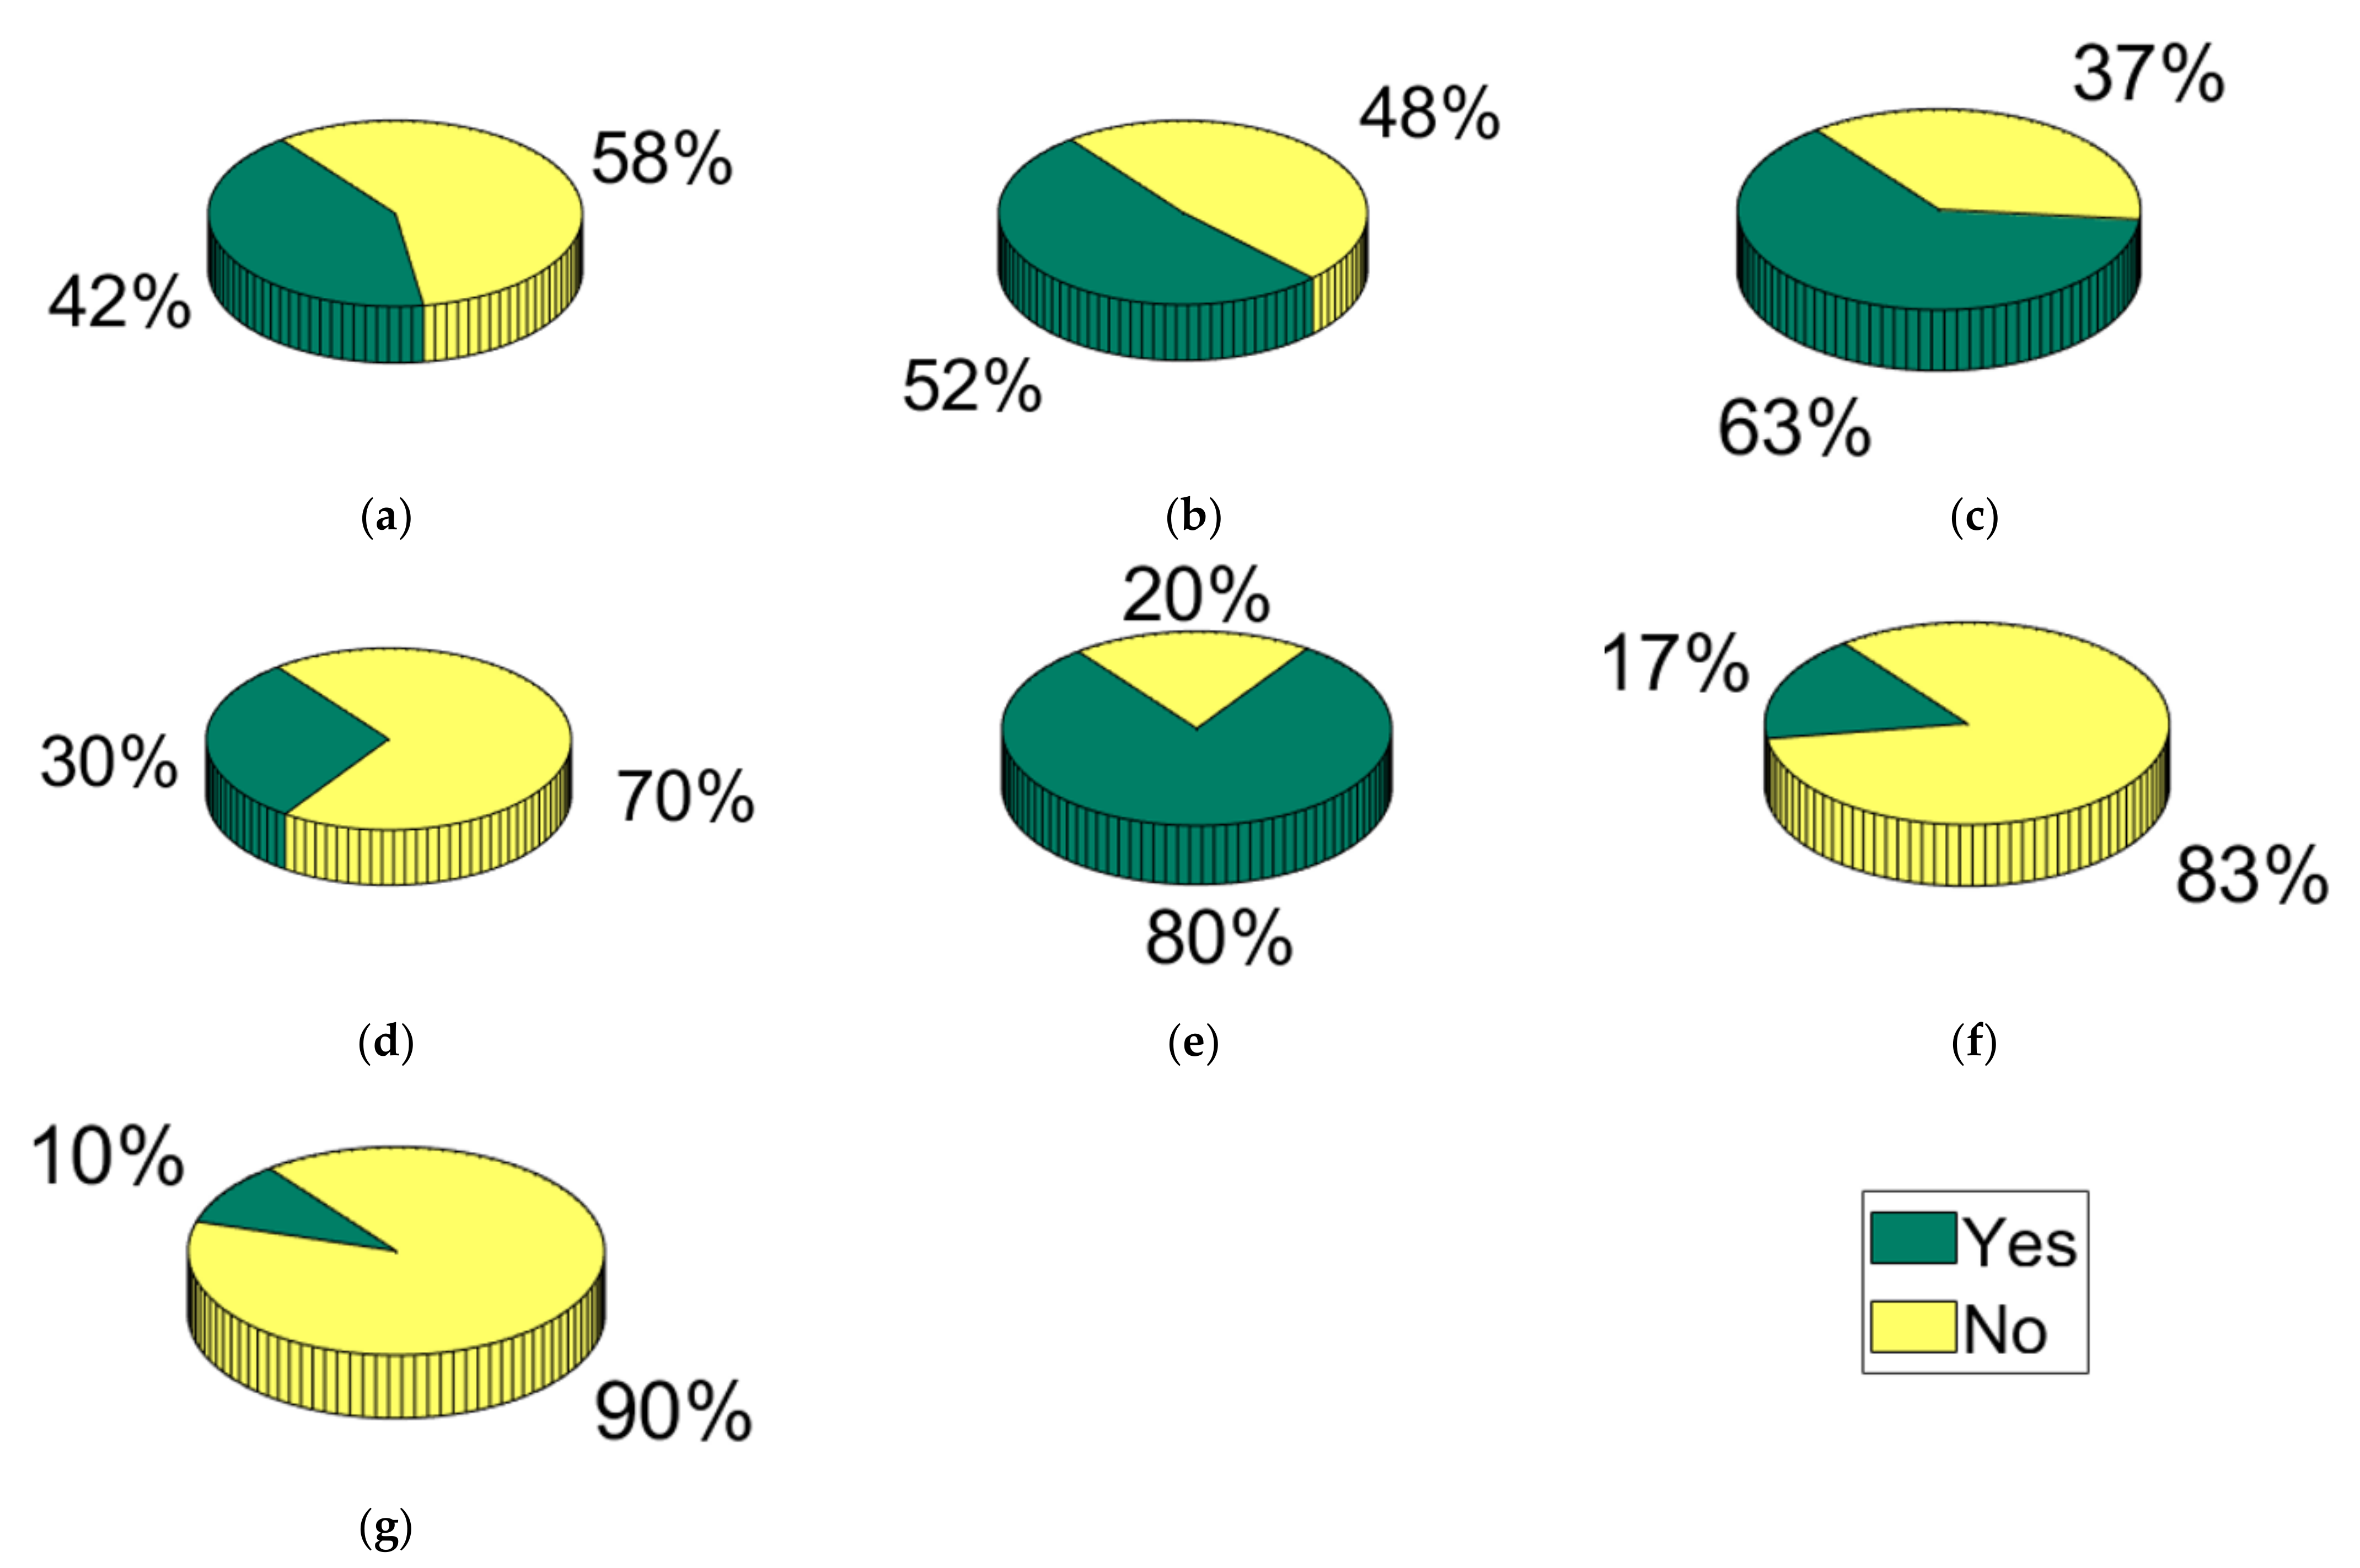
In the questions of general knowledge, the results are presented in
Figure 7, in which it was observed that 58% of the participants did not have knowledge about the PNRS, demonstrating that, due to factors such as the lack of awareness of policies in Brazil, even in the academic environment, the law that regulates the correct disposal of electronic waste is not properly disseminated among the population.
The lack of knowledge became even more concrete when the responses regarding reverse logistics of electronic waste were analyzed, in which 48% of the participants never heard about this subject, even though it is mandatory by companies, as provided for in the sectoral agreement, legislated by Decree 10.240 of 2020 [
32]. Another key point of recycling electronic waste was unknown to most of the academic community, since 70% of the answers were negative in response to the question “Have you heard of urban mining?” If the higher education community does not know this term, it is possible to affirm that the awareness about it in an ordinary Brazilian population should follow the same pattern. Despite the previous negative responses, 63% of participants had heard about circular economics, showing that, despite not having full knowledge of the subject, several participants have some notion, even if partial, of the topic of electronic waste treatment. When asked about knowledge of the hazardousness of electronic waste, 80% of interviewees answered that they had some knowledge. This high number is probably due to the knowledge about the harm and damage that can be caused by the incorrect disposal of batteries in the environment, which has been widely disseminated in the media for years. This can also be seen from the data obtained by Alves et al. [
23].
The final questions of the research were focused on collection points and specialized companies, in which 83% of the interviewees’ regions of residence did not have a disposal point for this type of waste. In addition, only 10% of the participants knew any company that specializes in the collection of electronic waste. It is still necessary to note that 33% of the companies mentioned by the participants were not specialized in the collection. The two main companies cited in this research were Tech Trash-Zyklus and E-trash, accounting for 78% of valid responses.
From the general knowledge of the participants, it can be suggested that, in Brazil, there is a lack of dissemination of knowledge about environmental practices and the application of public policies that encourage the correct disposal of electronic waste. It is still necessary to reaffirm that, in two of the most preeminent academic communities of Rio de Janeiro, which are within the most well-educated group in society, basic knowledge about the management and awareness of recycling electronic devices is deficient. Therefore, it can be deduced that the Brazilian average about this knowledge should follow the same trend or, most probably, be lower than that of the present research. Therefore, there is a need to create ways to disseminate knowledge about WEEE management, taking as a model countries that have been successful in this regard, such as Norway and Denmark [
15].
4. Discussion
It is known that the devices evaluated in the research have a high-mass fraction of metals [
33], and may have concentrations up to 50 times higher than that of specific metal ores. In this context, it is possible to estimate the number of resources with a high aggregate value that could be recovered from equipment in hibernation. Additionally, based on the research results, it can be estimated that the number of hibernating electronic devices by students and staff from all universities, if the state trend could be extrapolated to other segments of the country, would be: 9.91 million MP, 7.05 million OMP, 3.08 million TPC, 1.94 million DPC, 5.44 million LPC, 2.73 million VG, and 4.59 million MP3P. This follows an estimative based on the total number of students and employees of higher education in Brazil, also taken from INEP [
27].
To value the number of resources present in equipment in hibernation, the compositions presented in
Table 4 were considered. Due to technological similarities, the composition of the TPC was considered to be that of the MP. Additionally, Holgersson et al. [
34] analyzed the PCB composition of OMP and MP, and the results indicated that the composition of the two equipment was similar, where the OMP had a slightly lower concentration of rare elements.
In this context, in the present work, the composition of OMP was considered to be approximately that of MP (even though there is a certain difference in composition and, knowing that for some elements, such as Pb, this difference may be large [
34]).
Table 5, on the other hand, shows the weight in kg of the equipment that was considered in the present work.
As can be seen in
Table 6 and
Table 7, in which the data of
Table 4 and
Table 5 were applied in a mass balance of metals in some electronic devices, there is an immense reserve of resources present in the devices in hibernation, both in the state of Rio de Janeiro and Brazil as a whole.
Considering the price information obtained by Zeng et al. and Arshadi, Yaghmaei, and Mousavi [
37,
44], the total value contained in equipment in hibernation in the Rio de Janeiro metropolitan area, considering only the group studied, is USD 67.45 million. It is worth noting that the precious metals represent 90.7% of the total value, and, in this context, it is observed that the MP, OMP, TPC, and VG devices have the highest concentration of these elements, making it possible to trace collection and recycling processing routes specific to this type of equipment. Extrapolations could also be made nationwide for this specific group, with an estimated stockpile potential of USD 797.50 million in valuable metals, suggesting that the research hypothesis that universities and their communities could become sources of raw materials for such extraction processes has merit and, therefore, this group of people deserves attention for the creation of collection points and partnerships within the perspective of future projects of this type.
5. Conclusions
The present research assessed the behavior of the people within or related to the academic community in Rio de Janeiro towards electronic devices consumption, waste disposal, and knowledge of Brazilian environmental policies for solid residues; this study also estimated the metallic economical value of the hibernating stockpile in the metropolitan area of this city. Regarding the former initiative, it was observed that most of the respondents do not have formal knowledge on solid waste policies. Nevertheless, they had contact with circular economy concepts and electronic waste awareness information. Moreover, an important hibernating stockpile was also observed that could be used as a source of raw materials for the extraction processes if concrete initiatives develop an effective recycling culture and encourage a vast number of collection points for correct disposal. The mass balance and economic value calculations estimate for the current assessment of hibernating stockpile a value of USD 67.45 million for the Rio de Janeiro metropolitan area. This could also be extrapolated nationwide, and such unexplored potential could be as high as USD 797.50 million in metals. This information will be used in future projects to assess the economic potential of an industrial plant dedicated to metal recovery in Brazil, based only on electronic waste recycling. However, this economic potential could not be directly assessed, as most of it is hibernating in residences, waiting for corrected disposal.
Without clear information regarding collection points near the residence or work and information to deal with obsolete devices, one cannot expect that the rates of disposal in common garbage or hibernating devices in residences to decrease soon. This is a major hindrance in the development of any project dedicated to extracting valuable content from such waste. Still, considering the constant technological update and short renewal timeline, based on broken devices or obsolete functionality, it can be expected that the value associated with hibernation will continue to increase in the coming years. On the other hand, this is a promising façade of the problem, as the economic potential remains unexplored until a project with a strong collection logistics and marketing structure starts to motivate electronic waste recycling in Rio de Janeiro. Moreover, this challenge must permeate from all educated communities to other layers of society, reaching economically vulnerable populations, which are typically excluded from access to information and education facilities, to widen the economic potential of the recycling alternative. Alternatively, the ominous scenario relies on the fact that, with the increase in the hibernating stockpile, the risks associated with improper disposal upsurge dramatically, particularly for what touches urban garbage disposal. This situation puts at risk the poorest regions of the metropolitan area. It is important that specific governmental policies associated with information be taken into effect successfully to alter this outlook in the future and to provide susceptible conditions for metallic extraction projects associated with electronic waste recycling in Rio de Janeiro.


 ,
, 


